Rich Lederer • Baseball Beat
Patrick Sullivan • Change-Up
Jeremy Greenhouse • Touching Bases
Dave Allen • F/X Visualizations
Sky Andrecheck • Behind the Scoreboard
Marc Hulet • Around the Minors
Al Doyle • Past Times
Retired Uniforms:
Bryan Smith • WTNY
Joe Sheehan • Command Post
Jeff Albert • The Batter's Eye
RSS Feed
Home
*Examining the Past, Present, and Future*
Lineup Card
Recent Entries
» Putting Together a Reality Team
» Historical Hall of Fame Vote Comparisons: 2012
» An All-Christmas Team
» The New-Look Angels
» John Denny: The Forgotten Cy Young Award Winner
» Money Isn't Everything
» What Would It Take to Hit .400 in the 21st Century?
» Halos Heaven
» Brandon McCarthy's Breakout Season
» Link-o-Rama
» Historical Hall of Fame Vote Comparisons: 2012
» An All-Christmas Team
» The New-Look Angels
» John Denny: The Forgotten Cy Young Award Winner
» Money Isn't Everything
» What Would It Take to Hit .400 in the 21st Century?
» Halos Heaven
» Brandon McCarthy's Breakout Season
» Link-o-Rama
Best of Baseball Beat
Abstracts From the Abstracts
1977 Baseball Abstract
1978 Baseball Abstract
1979 Baseball Abstract
1980 Baseball Abstract
1981 Baseball Abstract
1982 Baseball Abstract
1983 Baseball Abstract
1984 Baseball Abstract
1985 Baseball Abstract
1986 Baseball Abstract
1987 Baseball Abstract
1988 Baseball Abstract
1978 Baseball Abstract
1979 Baseball Abstract
1980 Baseball Abstract
1981 Baseball Abstract
1982 Baseball Abstract
1983 Baseball Abstract
1984 Baseball Abstract
1985 Baseball Abstract
1986 Baseball Abstract
1987 Baseball Abstract
1988 Baseball Abstract
Bert Blyleven Series
Meeting Up and Hanging Out with Bert
The Results Are In And...
Aficionado Heavily Invested in Blyleven
Latest on Blyleven's Chances for the HOF
The Internet Zealot Responds
400 Down and 5 to Go...
Bert Be Home By Eleven?
Blyleven's Forgotten Season (1973)
HeyMan, Your Comments Don't Hold Water
The Waiting is the Hardest Part
Another Addition to the Blyleven Series
Search for the Truth
As Dominant as His HOF Contemporaries
Listen, Buster
A Larger Step for Blyleven
Answering the Naysayers (Part Two)
Another Small Step for Blyleven
Q&A: Blyleven on the Twins
The Majority Rules, Right?
It's All Dutch to Some
The Hall of Fame Case for Bert Blyleven
Q&A: Blyleven on Felix Hernandez
Clemens Rocketing Up Charts
Poz: An Interview With a KC Star
A HOF Chat with Tracy Ringolsby
Up Close and Personal
A Peek Into the Mind of a HOF Voter
Answering the Naysayers
It's That Time of the Year (Again)
"If Cooperstown is Calling..."
The Bert Alert
One Small Step for Blyleven...
Only the Lonely
Exclusive Interviews
Lee Sinins
Alex Belth
David Pinto
Will Carroll
Mike Carminati
Aaron Gleeman
Joe Sheehan
Jay Jaffe
Jeff Peek
Tracy Ringolsby
Joe Posnanski
Bill James Part I, II, III
Jon Lalonde
Chuck Tiffany
Dayn Perry
Fay Vincent
Nate Silver
Alex Belth
David Pinto
Will Carroll
Mike Carminati
Aaron Gleeman
Joe Sheehan
Jay Jaffe
Jeff Peek
Tracy Ringolsby
Joe Posnanski
Bill James Part I, II, III
Jon Lalonde
Chuck Tiffany
Dayn Perry
Fay Vincent
Nate Silver
Bullpen
Rich Lederer
The Odd Couple (with Alex Belth)
The MostUnder Over Underrated Player in Baseball (with Brian Gunn)
Three Wise Men (roundtable by Alex Belth)
Infrequently Asked Questions (interview with Matt Welch)
Interview (Orioles Think Tank)
Bernie and the Yanks (Bronx Banter)
Hope and Faith: How the LAA Win the World Series (Baseball Prospectus)
NL West (The Soul of Baseball)
Greatest Living Hitter? (Sports Illustrated)
Roundtable: 2008 HOF Ballot (Armchair GM)
The Most
Three Wise Men (roundtable by Alex Belth)
Infrequently Asked Questions (interview with Matt Welch)
Interview (Orioles Think Tank)
Bernie and the Yanks (Bronx Banter)
Hope and Faith: How the LAA Win the World Series (Baseball Prospectus)
NL West (The Soul of Baseball)
Greatest Living Hitter? (Sports Illustrated)
Roundtable: 2008 HOF Ballot (Armchair GM)
Patrick Sullivan
Designated Hitters
David Bromberg (Q&A: John Denny)
Mark Armour (H. Killebrew and Versatility)
Joe Lederer (Soundtrack of a Prospect)
David Bromberg (Clemente's Autograph)
David Bromberg (Woody Fryman)
D. Baumstein (WAR Against Age: Pitchers)
Doug Baumstein (The WAR Against Age)
Doug Baumstein (A Lifetime on the Road)
John Fraser (Pick Six)
Mark Armour (How to Score More Runs?)
Bill Parker (What Opening Day Tells Us)
Stan Opdyke (Pat Rispole)
Chris Jaffe (Evaluating Baseball's Mgrs)
Stan Opdyke (Baseball Radio in NYC, 1953)
A. Nathan (Performance of Baseball Bats)
Michael Weddell (Edgar Martinez/HOF)
Jon Weisman (100 Things Dodgers Fans...)
Stan Opdyke (Connie Mack and Vin Scully)
Eric Walker (Evaluating Run Production)
Brent Mayne (The Intangibles of Catching)
Chris Moore (Best Fastballs in Baseball)
Dave Baldwin (The Batter’s Brain)
Shawn Haviland (Ivy League to MLB)
Larry Granillo (Walking Off)
Rob Iracane (Solo HR Won't Break You)
Tommy Bennett (Charm of AM Radio)
Harry Pavlidis (Johan Santana's Fast Start)
John Walsh (WAR and Remembrance)
Eric Walker (Precisely Inaccurate)
Bob Timmermann (As They See 'Em)
Geoff Young (Unicycles and Delusions)
Baseball Analysis at Tufts (Groundballers)
Baseball Analysis at Tufts (GB Out Rates)
G. Rybarczyk ('09 Hit Tracker Projections)
Joe Lederer (Curt Schilling/HoF)
Conor Gallagher (Hall of Fallacies)
Chris Green (Jim Rice, HoF, the Numbers)
Shawn Hoffman (Baseball's Bear Mkt?)
Paul Anthony (Manny Syndrome)
Ross Roley (World Series Odds)
B. Timmermann (Catcher's Interference)
R.J. Anderson (Waiting the Hardest Part)
Maury Brown (Cubs, MLB, and Cuban...)
Myron Logan (Dee-Fense, Dee-Fense)
Craig Calcaterra (Frivolity, Part I, Part II)
Chad Finn (Ode to Baseball Cards)
David Cameron (Mariners Foibles)
Chris Dial (Chipper Jones)
Pat Lederer (Memory Lane)
David Appelman (Clutch Pitching)
Bob Rittner (DH)
Jonathan Mayo (Roger Clemens)
Lisa Winston (My Son-in-Law...)
Russ McQueen (The Yellow Hammer)
Bob Rittner (I'm OK, You're OK)
Mark Armour (In Defense of the HOF)
Pat Jordan (Friends)
Dan Levitt (Analysis of Terry Ryan)
Doug Baumstein (Trading Econ 101)
Ross Roley (Runner's Reluctance II)
Ross Roley (Runner's Reluctance I)
Mark Armour (No-Longer Lovable Sox)
Bruce Regal (Stealthy and Wise)
Brian Gunn (Roid Monster)
Current/McEvoy (Value of the SB)
John Rickert (Sinister Thefts)
Nate Silver (Sabermetrics)
David Vincent (Home Run Production)
Joe P. Sheehan (Enhanced Gameday II)
Mark Armour (An Ode to Sport)
David Gassko (All-Time Worm Burners)
Joe P. Sheehan (Enhanced Gameday)
John Walsh (When Titans Clash)
Fox/Williams (Quantifying Coaches II)
Fox/Williams (Quantifying Coaches I)
Jacob Luft (Bull Durham Rant)
Chad Finn (Strat-O-Matic)
Lisa Winston (Rotisserie Baseball)
Dave Studeman (Baseball Stats)
Steve Treder (Roger Craig)
Marc Normandin (Jeff Bagwell)
D. Appelman (Expanding Strike Zone)
Jeff Sackmann (Worst MiL Defenders)
Jeff Sackmann (Best MiL Defenders)
Maxwell Kates (Van Lingle Mungo)
David Appelman (Pitch Location)
Kent Bonham (Danny Ray Herrera)
Glenn Stout (Two Baseball Poems)
Bruce Regal (The Challenge Round)
Mark Lamster (Barry & Ty)
Geoff Young (NL West)
Tom Lederer (The Ryan Express)
Brian Erts (Great Leap Forward)
David Pinto (Parity and the N.L.)
Jacob Luft (Fathers and Daughters)
Jamey Newberg (Pete's Sake)
Jeff Albert (A. Jones Swing Analysis)
Jeff Albert (A-Rod Swing Analysis)
Keith Law (Death, Taxes, and Waivers)
Peter Abraham (Tales of Torre Tales)
Larry Borowsky (Let 'er Rip II)
Dan Levitt (Empirical Analysis of Bunting)
Jonah Keri (If I Met Warren Cromartie...)
Bob Klapisch (War Stories)
Bob Timmermann (John F. Kennedy HS)
Kent Bonham (Aluminum Adjustments)
Al Doyle (More Than Superstars)
Ross Roley (Instant Replay)
David Vincent (Barry Bonds Homers)
Chad Finn (Our Favorite Obscurities)
Bill Deane (1979 NL MVP)
Mark Armour (Rise/Fall of Artificial Turf)
Jeff Angus (Wally Moon Camp)
David Berri (Money and Baseball)
Larry Borowsky (Baseball w/o the #s)
Derek Zumsteg (The Irrational Market)
David Regan (Free Agent Contracts)
Peter Schmuck (Steroids and the HOF)
David Appelman (Pitchers, Pitch by Pitch)
Dan Fox (Swinging, Taking, Fouling, Etc)
Patrick Sullivan (Study of NYY CF/BOS LF)
Will Leitch (Baseball Journalism)
Jeff Sullivan (Pitcher Release Points)
Steve Treder ('69-'70 Giants)
Maury Brown (Charlie Finley)
John Brattain (Bob Johnson)
Bob Klapisch (The Case for Bert Blyleven)
Jeff Peek (Pride and Prejudice)
Dayn Perry (Bert and Warren)
Rob Neyer (If Don Sutton Was Great...)
Lisa Winston (Minor League Memories)
Alex Belth (Otis Redding Was Right)
David Cameron (Long Live the King)
Jeff Angus (Baserunning Study)
Bert Blyleven (Baseball Playoffs)
Boyd Nation (Not a Prospect List)
James Click (Batters-Baserunners Study)
Jeff Shaw (Why I Love Baseball)
David Gassko (BIP/BFP Fielding Study)
Jay Jaffe (Milwaukee Sausage Race)
Jamey Newberg (Remember When)
Bob Klapisch (Press Box to the Mound)
Dan Levitt (Predictive Value of BB)
David Vincent (Official Scorer)
Jon Weisman (Rick Monday)
Larry Borowsky (Let 'er Rip)
Will Carroll (Fictional Short Story)
Bob Timmermann (Japanese Baseball)
Cyril Morong (Best Pitching Seasons)
Sean Forman (Monte Carlo Win-Loss)
Brian Gunn (My Little Blue Book)
Joe Lederer (My Dad and Baseball)
Bill Deane (Bob Gibson, 1968)
Mark Armour (1977 Yankees)
Darren Viola (Retrosheet)
David Pinto (RFK)
Dayn Perry (Brave Heart)
Matt Welch (Dave Hansen)
Kevin Kernan (Jack McKeon)
Tom Lederer (Dodgers Road Trip)
Steve Lombardi (Slider)
Studes (Picturing Baseball)
Mike Carminati (Luck of the Drawl)
Eric Neel (Vin Scully)
J.C. Bradbury (Leo Mazzone)
John Sickels (Bill James)
Search Baseball Analysts
Archives
By Category:
Around the Majors Content Only
Around the Minors Content Only
Baseball Beat Content Only
Baseball Beat/Change-Up Content Only
Baseball Beat/WTNY Content Only
Behind the Scoreboard Content Only
Change-Up Content Only
Change-Up/Around the Majors Content Only
Command Post Content Only
Crunching the Numbers Content Only
Designated Hitter Content Only
F/X Visualizations Content Only
Past Times Content Only
Saber Talk Content Only
The Batter's Eye Content Only
Touching Bases Content Only
Weekend Blog Content Only
WTNY Content Only
By Month:
February 2012
January 2012
December 2011
October 2011
September 2011
August 2011
July 2011
June 2011
May 2011
April 2011
March 2011
February 2011
January 2011
December 2010
November 2010
October 2010
September 2010
August 2010
July 2010
June 2010
May 2010
April 2010
March 2010
February 2010
January 2010
December 2009
November 2009
October 2009
September 2009
August 2009
July 2009
June 2009
May 2009
April 2009
March 2009
February 2009
January 2009
December 2008
November 2008
October 2008
September 2008
August 2008
July 2008
June 2008
May 2008
April 2008
March 2008
February 2008
January 2008
December 2007
November 2007
October 2007
September 2007
August 2007
July 2007
June 2007
May 2007
April 2007
March 2007
February 2007
January 2007
December 2006
November 2006
October 2006
September 2006
August 2006
July 2006
June 2006
May 2006
April 2006
March 2006
February 2006
January 2006
December 2005
November 2005
October 2005
September 2005
August 2005
July 2005
June 2005
May 2005
April 2005
March 2005
February 2005
January 2005
December 2004
November 2004
October 2004
September 2004
August 2004
July 2004
June 2004
May 2004
April 2004
March 2004
February 2004
January 2004
December 2003
November 2003
October 2003
September 2003
August 2003
July 2003
June 2003
Reference
Organizational Stats
Arizona Diamondbacks Bat / Pitch
Atlanta Braves Bat / Pitch
Baltimore Orioles Bat / Pitch
Boston Red Sox Bat / Pitch
Chicago Cubs Bat / Pitch
Chicago White Sox Bat / Pitch
Cincinnati Reds Bat / Pitch
Cleveland Indians Bat / Pitch
Colorado Rockies Bat / Pitch
Detroit Tigers Bat / Pitch
Florida Marlins Bat / Pitch
Houston Astros Bat / Pitch
Kansas City Royals Bat / Pitch
Los Angeles Angels Bat / Pitch
Los Angeles Dodgers Bat / Pitch
Milwaukee Brewers Bat / Pitch
Minnesota Twins Bat / Pitch
New York Mets Bat / Pitch
New York Yankees Bat / Pitch
Oakland Athletics Bat / Pitch
Philadelphia Phillies Bat / Pitch
Pittsburgh Pirates Bat / Pitch
St. Louis Cardinals Bat / Pitch
San Diego Padres Bat / Pitch
San Francisco Giants Bat / Pitch
Seattle Mariners Bat / Pitch
Tampa Bay Devil Rays Bat / Pitch
Texas Rangers Bat / Pitch
Toronto Blue Jays Bat / Pitch
Washington Nationals Bat / Pitch
All-Star Links
Official Websites
News and Notes
Baseball News Blog
Baseball Newstand
ESPN Baseball
Fox Sports Baseball
Pro Sports Daily
Roto World
The Roto Times
USA Today Baseball
Baseball Newstand
ESPN Baseball
Fox Sports Baseball
Pro Sports Daily
Roto World
The Roto Times
USA Today Baseball
Reference and Analysis
Baseball Almanac
Baseball America
Baseball Archive
Baseball Contracts
Baseball Cube
Baseball Graphs
Baseball Library
Baseball Musings Player Database
Baseball Page
Baseball Primer
Baseball Prospectus
Baseball Reference
Baseball Statistics
Baseball Truth
Boxscore Central
Diamond Mind Baseball
Doug's Stats
FanGraphs
Fast Balls (pitchfx catalog)
Hardball Dollars
Hardball Times
Hit Tracker
Retrosheet
Rotobase/Rotoblog
Stat Corner
STATS
Tango on Baseball
Yahoo Sports MLB
Web Gems
Bill James Primer
Sabermetric Manifesto (Grabiner)
Pitching and Defense (McCracken)
Pitching and Defense (Tippett)
Transactions Primer (Neyer)
Baseball Stats (Batter's Box)
Prospect Report (Cameron)
Pitcher Workloads (Sheehan)
Goodbye to Old Baseball Ideas (Rickey)
Sabermetric Manifesto (Grabiner)
Pitching and Defense (McCracken)
Pitching and Defense (Tippett)
Transactions Primer (Neyer)
Baseball Stats (Batter's Box)
Prospect Report (Cameron)
Pitcher Workloads (Sheehan)
Goodbye to Old Baseball Ideas (Rickey)
Columnists
Baseball Blogs
Around the Majors
Athletics Nation
Baseball Crank
Baseball Musings
Baseball-Reference Blog
Batter's Box
Big League Stew
Bronx Banter
Catfish Stew
Cub Town
Dan Agonistes
Dodger Thoughts
DRays Bay
Ducksnorts
Futility Infielder
Halos Heaven
Inside the Rockies
It Might Be Dangerous
Knuckle Curve
LoHud Yankees Blog
Lookout Landing
Management by Baseball
Metaforian
Metsgeek
Mike's Baseball Rants
Only Baseball Matters
Redbird Nation
Red Reporter
Sabernomics (Braves)
Seth Speaks
ShysterBall
6-4-2 (Angels/Dodgers)
The Book
TheCubdom
The Cutting Edge
The House That Dewey Built
The View From The Bleachers
Tiger Blog
U.S.S. Mariner
Viva El Birdos
Where's Kernan
Minor Leagues
Arizona Fall League
BA Player Finder
Cal Leaguers
Jamey Newberg
JDM's Scoresheet Baseball
Minor League Baseball
Minor League Park Factors
Minor League Splits
No Pepper
Sickels' Minor League Ball
Warm October Nights
BA Player Finder
Cal Leaguers
Jamey Newberg
JDM's Scoresheet Baseball
Minor League Baseball
Minor League Park Factors
Minor League Splits
No Pepper
Sickels' Minor League Ball
Warm October Nights
Amateur
Boyd's World (College)
Cape Cod Baseball League
College Baseball Blog
College Baseball Insider
Collegiate Baseball Newspaper
College Splits
College Splits Blog
Dirtbags Baseball (Long Beach State)
NCAA Baseball
NCBWA
Team One Baseball (High School)
Texas A&M & Baseball
Cape Cod Baseball League
College Baseball Blog
College Baseball Insider
Collegiate Baseball Newspaper
College Splits
College Splits Blog
Dirtbags Baseball (Long Beach State)
NCAA Baseball
NCBWA
Team One Baseball (High School)
Texas A&M & Baseball
Historical
Cuban Baseball
House of David
Jim "Mudcat" Grant's Web Page
Negro League Baseball Players Assoc
Negro Leagues Baseball Museum
1919 Black Sox
Pacific Coast League
Philadelphia Athletics Historical Society
Shoeless Joe Jackson Society
SABR-L Archives
Walter O'Malley
House of David
Jim "Mudcat" Grant's Web Page
Negro League Baseball Players Assoc
Negro Leagues Baseball Museum
1919 Black Sox
Pacific Coast League
Philadelphia Athletics Historical Society
Shoeless Joe Jackson Society
SABR-L Archives
Walter O'Malley
Miscellaneous
Forums
Credits
Ticket Center
Tickets to Baseball -
Premium Red Sox Tickets - Tickets to Marlins Games - Cardinals Game Tickets - NY Yankee Tickets - Tickets Oakland Athletics - Dallas Cowboys Tickets - Arizona Cardinals Tickets - Tickets Seattle Seahawks - Buffalo Bills Tickets Online - Tickets to Dolphins Football
Buy Boston Red Sox tickets,
Philadelphia Phillies tix,
NY Yankees tickets,
NY Mets tickets, and
MLB All Star game tickets at ABC tickets
Not sure where to find the best online sportsbooks? Start your search with PlayersJet.
Get deals at SportsMemorabilia.com on baseball apparel, including Phillies jerseys and more for adults and children.
Shop the largest selection baseball equipment on sale at Sports Unlimited. Check out tons of baseball gloves, youth baseball gloves and catchers gear from Rawlings, Wilson, Nike & Under Armour.
2011 Draft Order
Courtesy of Baseball America
First-Round:
 1. Pirates (57-105)
 2. Mariners (61-101)
 3. Diamondbacks (65-97)
 4. Orioles (66-96)
 5. Royals (67-95)
 6. Nationals (69-93)
 7. Diamondbacks (for B. Loux)
 8. Indians (69-93)
 9. Cubs (75-87)
10. Padres (for Karsten Whitson)
11. Astros (76-86)
12. Brewers (77-85)
13. Mets (79-83)
14. Marlins (80-82)
15. Brewers (for Dylan Covey)
16. Dodgers (80-82)
17. Angels (80-82)
18. Athletics (81-81)
19. Red Sox (from DET for Martinez)
20. Rockies (83-79)
21. Blue Jays (85-77)
22. Cardinals (86-76)
23. Nationals (from CWS for Dunn)
24. Rays (from BOS for Crawford)
25. Padres (90-72)
26. Red Sox (from TEX for Beltre)
27. Reds (91-71)
28. Braves (91-71)
29. Giants (92-70)
30. Twins (94-68)
31. Rays (from NYY for Soriano)
32. Rays (96-66)
33. Rangers (from PHI for Lee)
Supplemental First Round:
34. Nationals (Dunn)
35. Blue Jays (Downs)
36. Red Sox (Martinez)
37. Rangers (Lee)
38. Rays (Crawford)
39. Phillies (Werth)
40. Red Sox (Beltre)
41. Rays (Soriano)
42. Rays (Balfour)
43. Diamondbacks (LaRoche)
44. Mets (Feliciano)
45. Rockies (Dotel)
46. Blue Jays (Buck)
47. White Sox (Putz)
48. Padres (Garland)
49. Giants (Uribe)
50. Twins (Hudson)
51. Yankees (Vazquez)
52. Rays (Benoit)
53. Blue Jays (Olivo)
54. Padres (Torrealba)
55. Twins (Crain)
56. Rays (Choate)
57. Blue Jays (Gregg)
58. Padres (Correia)
59. Rays (Hawpe)
| Designated Hitter | November 02, 2006 |
Generalities in Pitch Location
How often have you heard a player attribute his success to "throwing more pitches inside," or heard a manager say a pitcher was "hitting his spots?" Pretty much everyone talks about pitch location, but how often is it actually quantified? Thankfully, our pals over at Baseball Info Solutions tracked the x-y coordinates of nearly all 1.5 million pitches thrown the past two seasons. Let's start by looking at the average major league pitch locations broken down by batter/pitcher handedness.
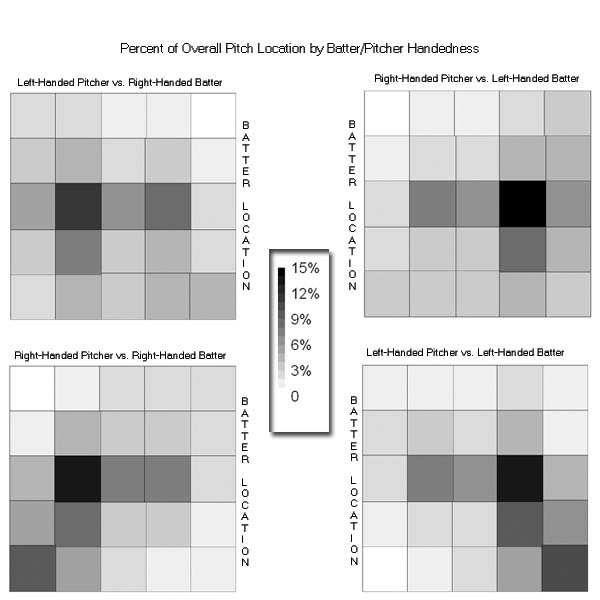
Excluding pitches outside the strike zone, about 14% of the pitches are thrown to the inside third of the plate, while about 25% of the pitches are thrown to the outside third of the plate. If you include the pitches outside the strike zone, 30% are thrown "inside" while over 50% are thrown "outside."
Then of course you can break down the strike zone by upper and lower thirds. Once again, excluding pitches from outside the strike zone, 10% are thrown to the upper-third, while 15% are thrown to the lower-third. Including the pitches outside the strike zone, 24% are thrown to the "high" and 40% are thrown "low."
While the league averages are good to know, each player will have his own pitching style. Let's see if we can learn anything about how a pitcher performs by where he throws the ball. Let's take a look at three things for each pair of pitch locations.
- Do pitchers tend to throw the ball to the same location year after year?
- Which pitchers throw the ball to a particular location the most?
- What does throwing to that location generally mean for pitchers?
For the purpose of this study, the strike zone coordinates has been mirrored for left-handed batters in order to lump inner or outer pitches into a single metric.
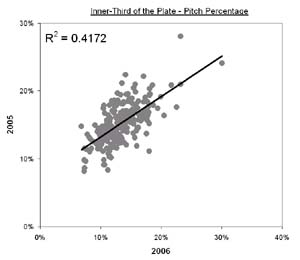
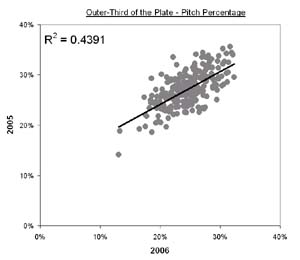
The Inner and Outer Pitch
First of all, the ability or choice to throw strikes on the inner or outer third of the plate is something that an individual pitcher will tend to repeat from year to year.
So who are the starting pitchers that use the inside-third or outside-third of the plate the most?
Starter            Inside-%      Starter         Outside-%
Randy Johnson        21.69%      Greg Maddux        32.11%
Jon Lester           20.59%      Mike Mussina       31.18%
Matt Clement         20.49%      Rodrigo Lopez      31.05%
Johan Santana        19.46%      Eric Milton        30.61%
Francisco Liriano    18.77%      Kyle Lohse         30.43%
Andy Pettitte        18.73%      Brad Radke         30.43%
Cliff Lee            18.60%      Kevin Millwood     30.24%
Tim Wakefield        18.17%      Roger Clemens      29.79%
Mark Buehrle         18.12%      Livan Hernandez    29.71%
C.C. Sabathia        18.02%      Brett Myers        29.55%
It's a pretty interesting group of starters who have the highest percentage of pitches over inner-third of the plate. Most of them are left-handers with Clement and Wakefield being the exceptions. Obviously Johan Santana and Francisco Liriano are considered two of the best pitchers in baseball and interestingly Chris Carpenter, a right-hander, was one shy of making the top ten.
The starters with the highest outside pitch percentage are all right-handers with Eric Milton being the lone exception. Jeff Francis and David Wells are also a few of the left-handers who really utilize the outer-third of the plate.
Let's move on to the relievers:
Reliever           Inside-%      Reliever        Outside-%
Mariano Rivera       30.07%      Scott Cassidy      34.43%
Chad Bradford        24.34%      Brian Sweeney      33.00%
Billy Wagner         23.20%      Bob Howry          32.32%
Todd Jones           23.20%      Justin Speier      31.89%
Matt Thornton        22.58%      Brandon Lyon       31.64%
Darren Oliver        22.00%      Joe Beimel         31.64%
Brad Thompson        19.95%      Brian Meadows      31.63%
Mike Gonzalez        19.83%      Chris Britton      31.58%
Hong Chih Kuo        19.21%      Rafael Betancourt  31.40%
Matt Capps           18.44%      Takashi Saito      31.33%
There's definitely more of a mix of right-handed and left-handed pitchers from the inner-third list of relievers, most notably Mariano Rivera who uses that portion of the plate more than any other pitcher in baseball. Jonathan Papelbon was also a few spots shy of making the list.
The top 10 relievers who utilize the outer-third of the plate are all right-handed pitchers with the exception of Joe Beimel. Most of these pitchers had solid years, with Cassidy and Saito being the real bright spots.
Unfortunately, how a pitcher utilizes the inside or outside third of the plate doesn't really correlate well with anything. This was somewhat of a surprise to me, especially since the horizontal location of pitches is frequently addressed by many pitchers and scouts.
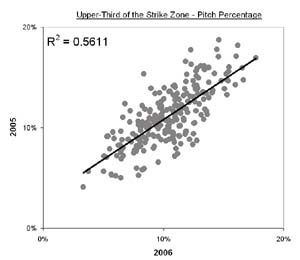
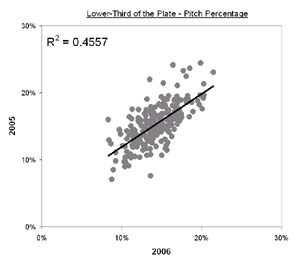
The Upper and Lower Pitch
Just like the inner and outer pitch locations, the percentage of pitches thrown to the upper/lower third of the strike zone also correlate well from year to year.
Let's see which starting pitchers utilize these sections of the strike zone the most:
Starter             Upper-%      Starter           Lower-%
Scott Baker          18.42%      Brandon Webb       21.47%
Matt Cain            16.03%      Jake Westbrook     20.34%
Chris Young          15.47%      Mark Mulder        20.26%
Brad Penny           15.44%      Mike Maroth        20.22%
Rich Hill            15.41%      John Thomson       19.84%
Johan Santana        15.39%      Josh Fogg          19.72%
Jarrod Washburn      15.29%      Zach Duke          19.55%
Ben Sheets           15.22%      Jamie Moyer        18.76%
Kevin Millwood       14.59%      Roy Halladay       18.53%
Boof Bonser          14.18%      James Shields      18.50%
The starters who throw to the upper-third of the strike zone are mostly fly-ball pitchers, with a few exceptions like Millwood and Penny. While the players who throw to the lower-third of the strike zone are mostly groundball pitchers. In fact, Webb, Halladay and Mulder are three of the most extreme groundball pitchers around, not to mention Derek Lowe, another extreme groundball pitcher, just missed the cut.
Here are the relievers:
Reliever              Top-%      Reliever          Lower-%
Jonathan Papelbon    20.29%      Chad Bradford      20.20%
Rafael Soriano       18.42%      Todd Williams      19.87%
Rafael Betancourt    17.68%      Rick Bauer         19.35%
Alan Embree          16.65%      Joe Beimel         19.11%
Todd Jones           16.55%      Jorge Julio        18.94%
Joaquin Benoit       16.19%      Salomon Torres     18.48%
J.J. Putz            16.07%      B.J. Ryan          18.33%
Mike Timlin          15.98%      Scott Downs        17.74%
Mike Gonzalez        15.78%      Josh Hancock       17.67%
Julio Mateo          15.29%      Chad Paronto       17.43%
The relievers who throw to the upper third of the strike zone the most make up a fairly impressive list of pitchers; most notably Papelbon, Putz, and Soriano with the others being not too shabby. The relievers who utilize the lower-third of the strike zone are for the most part, groundball pitchers except for the best of them, B.J. Ryan.
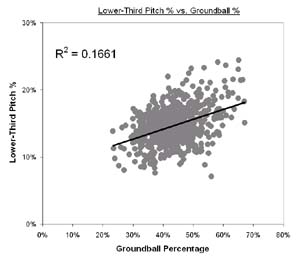
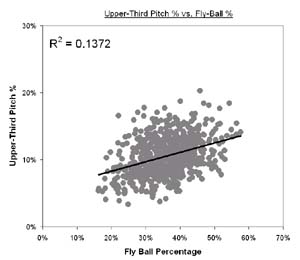
Unlike the lack of correlation the inside/outside third of the plate showed with any mainstream stats, the upper/lower third of the strike zone showed some correlation with groundball and fly-ball percentages.
The Center of the Plate
Last but not least is the middle of the plate, a spot where pitchers should not be throwing the ball all that often. Batters easily do the most damage with pitches right over the heart of the plate.
Unlike the inside/outside/upper/lower thirds of strike zone, pitchers do not throw the ball to this location with the same consistency from year to year. Instead of listing which player threw it over the center of the plate most often and least often; I'll cut right to the chase.
Since throwing the ball in the center of the strike zone, on an aggregate level, is where batters do the most damage, I thought there might be a decent correlation with either batting average on balls in play (BABIP) or perhaps home runs. This is not the case.
There are plenty of players who throw the ball over the center of the plate more frequently than others and quite simply get away with it for reasons that can't be put under a general rule of thumb.
Conclusions
Besides the correlation that the upper/lower thirds of the plate had with groundball and fly-ball percentage, there's really not a lot of assumptions you can make about a player by where he pitches the ball on aggregate.
It's interesting to know that Mariano Rivera throws the most pitches over the inside-third of the plate, or that Brandon Webb throws the most balls in the lower-third of the strike zone, but that by itself is really just trivia.
There's a lot to be learned from pitch location and it's going to take some complex modeling to fully interpret it along with pitch-type and velocity. But as far as generalities go with pitch location? There pretty much aren't any.
David Appelman is the creator of FanGraphs.com. You can contact him via e-mail.
Comments
Really interesting stuff. I haven't seen anything on this before.
Posted by: leno40 at November 2, 2006 1:14 AM
Batters easily do the most damage with pitches right over the heart of the plate.
You state this is true and intuitively we believe it, but is this supported by a study of this data somewhere else? How does the heart of the plate compare to the other locations? It seems to me there is a lot of information to be mined from the results for different locations and different pitchers. Especially if a pitchers locations changed from one year to the next.
Posted by: TT at November 2, 2006 5:42 AM
This is great stuff and it opens the door to some even more in-depth and insightful analysis. I'd love to see the breakdown of pitch location by the count (i.e. 2-0 pitch vs. 0-2).
Posted by: Redders at November 2, 2006 6:21 AM
You state this is true and intuitively we believe it, but is this supported by a study of this data somewhere else?
I charted where batters do the most damage in this study before the 2005 season: Palatable PitchZones It's probably worth charting these again with 2006 data included.
I didn't list the pitchers who threw down the center of the plate the most/least, but some names of note who threw it down the center the most are: Paul Byrd, Roy Oswalt, C.C. Sabathia, Kip Wells, Ben Sheets, Anibel Sanchez.
There's a pretty good mix of pitchers here and I can guess at why some are successful throwing the ball down the center and others not.
On the throwing the ball down the center the least you have, Matt Clement, Horacio Ramirez, David Wells, Tom Glavine, Barry Zito, Schilling, Moyer, Clemens, Josh Beckett.
I'm not too surprised too see a few of these names, but considering how many home runs Beckett gave up, seeing him here is surprising, along with Clement and Ramirez. I guess Clement and Ramirez didn't pitch a whole lot this season though.
I also looked at fastball velocity to see if that had any sort of correlation with how often a pitcher throws the ball down the center, and it didn't.
Either way... it really depends on who's throwing the ball down the center of the plate and not just if they are.
I used to look at this type of data doing the Daily Graphing series like with Tom Glavine or Curt Schilling to try an explain statistically, why players perform like they do. After doing this particular pitch location study, even if I find something that I think sounds like it should be the reason for a pitcher's success or failure (like throwing the ball down the center of the plate less, or pitching inside), it's tough to really validate that is the actual cause because there's really no rule of thumb. It'd be more of an educated guess.
Posted by: dkappelman at November 2, 2006 6:55 AM
Excellent work, David. I'm surprised that more lefties didn't show up on the "outer half" list -- probably because when I think of lefties, I think of Tom Glavine, who used to live on the outside part of the plate.
Also, regarding lack of correlation between "inside/outside" and anything else: Could it be that the key isn't so much throwing a large percentage of pitches in one spot or another as it is being able to pitch to both areas effectively? When I hear people talk about horizontal location, it seems to me it's usually in that context, i.e., "this guy can work both sides of the plate."
Just my 2 cents. Good stuff...
Posted by: Geoff Young at November 2, 2006 7:09 AM
I would have to guess that pitch type plays a big role as well. Curve balls down would be more effective than curve balls that hang up in the zone. Sliders down and away are more effective than sliders inside.
Going with the aggregate numbers is, as the author puts it, good trivia, but if it were broken down into 5-6 categories by pitch, I suspect the data would be much more revealing.
Posted by: Aaron at November 2, 2006 7:26 AM
Very interesting analysis. Two thoughts:
1) it would be interesting to know if pitchers get hit more/less when they pitch in their preferred zone, and when they don't. So, for pitchers who predominantly go outside, what's the hit percentage on their outside pitches? And do they get hurt when they come inside? Or maybe they achieve the right balance so the hit % is about the same either way.
2) If pithing in middle of plate matters, you'd want to distinguish between cases when a pitcher wanted to do it and when he did it inadvertently. So, you could look at good hitters vs. bad at plate, and at hitter's counts vs. pitcher's counts. Still, the percentage of balls in that zone may be too small to show anything.
Posted by: Guy at November 2, 2006 7:38 AM
While pitch location is important, I think it is only part of a pitcher's equation. Pitchers do not get hitters out by throwing to spots alone. Control and change of speed have to factor in, otherwise correlations will be hard to come by.
So, in that respect, I think your examination was a success since generalities were non-existant.
Posted by: Megary at November 2, 2006 11:05 AM
very interesting. i applaud you.
Something you might want to consider is the speed of the pitch. Not all pitchers can afford to throw on the outside part of the plate because it allows the hitter more time to react to a pitch. It's not surprising that a strong arm like johnson appears at the top of the list for outside presence. If a fastball isn't your forte then the inside is where you have to live. it takes a lot longer for the bat to come around on a ball that's jamming them...
Another consideration is the type of pitches. Since the majority of batters are right-handed, it also makes sense why johnson lives outside most of the time. It's a setup for his juicy slider (also his outpitch) which crashes in on righties...
just something to consider....your thoughts?
br
Posted by: Brian at November 2, 2006 11:06 AM
At some point, I would like to include pitch velocity and pitch type in the equation since they're obviously both very important. They're probably worth a look at independently too.
Ideally, I think you'd want to look at pitch sequences (including location, velocity, and type) which is where you'd possibly be able to quantify things like setup pitches and out pitches.
There are really countless things to explore using data like this and they're all fairly time consuming. As Tangotiger said, "All we need is more researchers."
Posted by: dkappelman at November 2, 2006 11:28 AM
i'm a stat-head well versed in spss. grad student at indiana university. if you ever need some data analysis help, just let me know..
br
Posted by: brian at November 2, 2006 11:47 AM
One thing I thought was interesting was that there seemed to be a lot of Red Sox that were on the list of pitchers who threw inside (Lester, Clement, Wakefield, and I'm pretty sure Bradford used to be a Red Sock). Is that just coincidence, or is it something on which they concentrate?
Posted by: Zac at November 3, 2006 12:09 PM
I'm surprised Zach Duke wasn't in the top ten for outside.
Posted by: Pirate at November 3, 2006 10:19 PM
Jamie Moyer is listed as someone who stays in the lower half of the zone, yet he is a flyball pitcher. Very interesting stuff here.
Posted by: Tom G at November 4, 2006 7:18 AM
isn't Johnson tops on the list for inside pitching, not outside? Or am I misunderstanding? Anyway either pitching style seems to me like it could be about equally easily rationalized: he throws hard, so he takes advantage of his fastball by pitching inside. Or alternatively he throws hard enough that he doesn't "have to" pitch inside often the way soft-tossers do.
Posted by: John C at November 4, 2006 1:27 PM