Rich Lederer • Baseball Beat
Patrick Sullivan • Change-Up
Jeremy Greenhouse • Touching Bases
Dave Allen • F/X Visualizations
Sky Andrecheck • Behind the Scoreboard
Marc Hulet • Around the Minors
Al Doyle • Past Times
Retired Uniforms:
Bryan Smith • WTNY
Joe Sheehan • Command Post
Jeff Albert • The Batter's Eye
RSS Feed
Home
*Examining the Past, Present, and Future*
Lineup Card
Recent Entries
» Putting Together a Reality Team
» Historical Hall of Fame Vote Comparisons: 2012
» An All-Christmas Team
» The New-Look Angels
» John Denny: The Forgotten Cy Young Award Winner
» Money Isn't Everything
» What Would It Take to Hit .400 in the 21st Century?
» Halos Heaven
» Brandon McCarthy's Breakout Season
» Link-o-Rama
» Historical Hall of Fame Vote Comparisons: 2012
» An All-Christmas Team
» The New-Look Angels
» John Denny: The Forgotten Cy Young Award Winner
» Money Isn't Everything
» What Would It Take to Hit .400 in the 21st Century?
» Halos Heaven
» Brandon McCarthy's Breakout Season
» Link-o-Rama
Best of Baseball Beat
Abstracts From the Abstracts
1977 Baseball Abstract
1978 Baseball Abstract
1979 Baseball Abstract
1980 Baseball Abstract
1981 Baseball Abstract
1982 Baseball Abstract
1983 Baseball Abstract
1984 Baseball Abstract
1985 Baseball Abstract
1986 Baseball Abstract
1987 Baseball Abstract
1988 Baseball Abstract
1978 Baseball Abstract
1979 Baseball Abstract
1980 Baseball Abstract
1981 Baseball Abstract
1982 Baseball Abstract
1983 Baseball Abstract
1984 Baseball Abstract
1985 Baseball Abstract
1986 Baseball Abstract
1987 Baseball Abstract
1988 Baseball Abstract
Bert Blyleven Series
Meeting Up and Hanging Out with Bert
The Results Are In And...
Aficionado Heavily Invested in Blyleven
Latest on Blyleven's Chances for the HOF
The Internet Zealot Responds
400 Down and 5 to Go...
Bert Be Home By Eleven?
Blyleven's Forgotten Season (1973)
HeyMan, Your Comments Don't Hold Water
The Waiting is the Hardest Part
Another Addition to the Blyleven Series
Search for the Truth
As Dominant as His HOF Contemporaries
Listen, Buster
A Larger Step for Blyleven
Answering the Naysayers (Part Two)
Another Small Step for Blyleven
Q&A: Blyleven on the Twins
The Majority Rules, Right?
It's All Dutch to Some
The Hall of Fame Case for Bert Blyleven
Q&A: Blyleven on Felix Hernandez
Clemens Rocketing Up Charts
Poz: An Interview With a KC Star
A HOF Chat with Tracy Ringolsby
Up Close and Personal
A Peek Into the Mind of a HOF Voter
Answering the Naysayers
It's That Time of the Year (Again)
"If Cooperstown is Calling..."
The Bert Alert
One Small Step for Blyleven...
Only the Lonely
Exclusive Interviews
Lee Sinins
Alex Belth
David Pinto
Will Carroll
Mike Carminati
Aaron Gleeman
Joe Sheehan
Jay Jaffe
Jeff Peek
Tracy Ringolsby
Joe Posnanski
Bill James Part I, II, III
Jon Lalonde
Chuck Tiffany
Dayn Perry
Fay Vincent
Nate Silver
Alex Belth
David Pinto
Will Carroll
Mike Carminati
Aaron Gleeman
Joe Sheehan
Jay Jaffe
Jeff Peek
Tracy Ringolsby
Joe Posnanski
Bill James Part I, II, III
Jon Lalonde
Chuck Tiffany
Dayn Perry
Fay Vincent
Nate Silver
Bullpen
Rich Lederer
The Odd Couple (with Alex Belth)
The MostUnder Over Underrated Player in Baseball (with Brian Gunn)
Three Wise Men (roundtable by Alex Belth)
Infrequently Asked Questions (interview with Matt Welch)
Interview (Orioles Think Tank)
Bernie and the Yanks (Bronx Banter)
Hope and Faith: How the LAA Win the World Series (Baseball Prospectus)
NL West (The Soul of Baseball)
Greatest Living Hitter? (Sports Illustrated)
Roundtable: 2008 HOF Ballot (Armchair GM)
The Most
Three Wise Men (roundtable by Alex Belth)
Infrequently Asked Questions (interview with Matt Welch)
Interview (Orioles Think Tank)
Bernie and the Yanks (Bronx Banter)
Hope and Faith: How the LAA Win the World Series (Baseball Prospectus)
NL West (The Soul of Baseball)
Greatest Living Hitter? (Sports Illustrated)
Roundtable: 2008 HOF Ballot (Armchair GM)
Patrick Sullivan
Designated Hitters
David Bromberg (Q&A: John Denny)
Mark Armour (H. Killebrew and Versatility)
Joe Lederer (Soundtrack of a Prospect)
David Bromberg (Clemente's Autograph)
David Bromberg (Woody Fryman)
D. Baumstein (WAR Against Age: Pitchers)
Doug Baumstein (The WAR Against Age)
Doug Baumstein (A Lifetime on the Road)
John Fraser (Pick Six)
Mark Armour (How to Score More Runs?)
Bill Parker (What Opening Day Tells Us)
Stan Opdyke (Pat Rispole)
Chris Jaffe (Evaluating Baseball's Mgrs)
Stan Opdyke (Baseball Radio in NYC, 1953)
A. Nathan (Performance of Baseball Bats)
Michael Weddell (Edgar Martinez/HOF)
Jon Weisman (100 Things Dodgers Fans...)
Stan Opdyke (Connie Mack and Vin Scully)
Eric Walker (Evaluating Run Production)
Brent Mayne (The Intangibles of Catching)
Chris Moore (Best Fastballs in Baseball)
Dave Baldwin (The Batter’s Brain)
Shawn Haviland (Ivy League to MLB)
Larry Granillo (Walking Off)
Rob Iracane (Solo HR Won't Break You)
Tommy Bennett (Charm of AM Radio)
Harry Pavlidis (Johan Santana's Fast Start)
John Walsh (WAR and Remembrance)
Eric Walker (Precisely Inaccurate)
Bob Timmermann (As They See 'Em)
Geoff Young (Unicycles and Delusions)
Baseball Analysis at Tufts (Groundballers)
Baseball Analysis at Tufts (GB Out Rates)
G. Rybarczyk ('09 Hit Tracker Projections)
Joe Lederer (Curt Schilling/HoF)
Conor Gallagher (Hall of Fallacies)
Chris Green (Jim Rice, HoF, the Numbers)
Shawn Hoffman (Baseball's Bear Mkt?)
Paul Anthony (Manny Syndrome)
Ross Roley (World Series Odds)
B. Timmermann (Catcher's Interference)
R.J. Anderson (Waiting the Hardest Part)
Maury Brown (Cubs, MLB, and Cuban...)
Myron Logan (Dee-Fense, Dee-Fense)
Craig Calcaterra (Frivolity, Part I, Part II)
Chad Finn (Ode to Baseball Cards)
David Cameron (Mariners Foibles)
Chris Dial (Chipper Jones)
Pat Lederer (Memory Lane)
David Appelman (Clutch Pitching)
Bob Rittner (DH)
Jonathan Mayo (Roger Clemens)
Lisa Winston (My Son-in-Law...)
Russ McQueen (The Yellow Hammer)
Bob Rittner (I'm OK, You're OK)
Mark Armour (In Defense of the HOF)
Pat Jordan (Friends)
Dan Levitt (Analysis of Terry Ryan)
Doug Baumstein (Trading Econ 101)
Ross Roley (Runner's Reluctance II)
Ross Roley (Runner's Reluctance I)
Mark Armour (No-Longer Lovable Sox)
Bruce Regal (Stealthy and Wise)
Brian Gunn (Roid Monster)
Current/McEvoy (Value of the SB)
John Rickert (Sinister Thefts)
Nate Silver (Sabermetrics)
David Vincent (Home Run Production)
Joe P. Sheehan (Enhanced Gameday II)
Mark Armour (An Ode to Sport)
David Gassko (All-Time Worm Burners)
Joe P. Sheehan (Enhanced Gameday)
John Walsh (When Titans Clash)
Fox/Williams (Quantifying Coaches II)
Fox/Williams (Quantifying Coaches I)
Jacob Luft (Bull Durham Rant)
Chad Finn (Strat-O-Matic)
Lisa Winston (Rotisserie Baseball)
Dave Studeman (Baseball Stats)
Steve Treder (Roger Craig)
Marc Normandin (Jeff Bagwell)
D. Appelman (Expanding Strike Zone)
Jeff Sackmann (Worst MiL Defenders)
Jeff Sackmann (Best MiL Defenders)
Maxwell Kates (Van Lingle Mungo)
David Appelman (Pitch Location)
Kent Bonham (Danny Ray Herrera)
Glenn Stout (Two Baseball Poems)
Bruce Regal (The Challenge Round)
Mark Lamster (Barry & Ty)
Geoff Young (NL West)
Tom Lederer (The Ryan Express)
Brian Erts (Great Leap Forward)
David Pinto (Parity and the N.L.)
Jacob Luft (Fathers and Daughters)
Jamey Newberg (Pete's Sake)
Jeff Albert (A. Jones Swing Analysis)
Jeff Albert (A-Rod Swing Analysis)
Keith Law (Death, Taxes, and Waivers)
Peter Abraham (Tales of Torre Tales)
Larry Borowsky (Let 'er Rip II)
Dan Levitt (Empirical Analysis of Bunting)
Jonah Keri (If I Met Warren Cromartie...)
Bob Klapisch (War Stories)
Bob Timmermann (John F. Kennedy HS)
Kent Bonham (Aluminum Adjustments)
Al Doyle (More Than Superstars)
Ross Roley (Instant Replay)
David Vincent (Barry Bonds Homers)
Chad Finn (Our Favorite Obscurities)
Bill Deane (1979 NL MVP)
Mark Armour (Rise/Fall of Artificial Turf)
Jeff Angus (Wally Moon Camp)
David Berri (Money and Baseball)
Larry Borowsky (Baseball w/o the #s)
Derek Zumsteg (The Irrational Market)
David Regan (Free Agent Contracts)
Peter Schmuck (Steroids and the HOF)
David Appelman (Pitchers, Pitch by Pitch)
Dan Fox (Swinging, Taking, Fouling, Etc)
Patrick Sullivan (Study of NYY CF/BOS LF)
Will Leitch (Baseball Journalism)
Jeff Sullivan (Pitcher Release Points)
Steve Treder ('69-'70 Giants)
Maury Brown (Charlie Finley)
John Brattain (Bob Johnson)
Bob Klapisch (The Case for Bert Blyleven)
Jeff Peek (Pride and Prejudice)
Dayn Perry (Bert and Warren)
Rob Neyer (If Don Sutton Was Great...)
Lisa Winston (Minor League Memories)
Alex Belth (Otis Redding Was Right)
David Cameron (Long Live the King)
Jeff Angus (Baserunning Study)
Bert Blyleven (Baseball Playoffs)
Boyd Nation (Not a Prospect List)
James Click (Batters-Baserunners Study)
Jeff Shaw (Why I Love Baseball)
David Gassko (BIP/BFP Fielding Study)
Jay Jaffe (Milwaukee Sausage Race)
Jamey Newberg (Remember When)
Bob Klapisch (Press Box to the Mound)
Dan Levitt (Predictive Value of BB)
David Vincent (Official Scorer)
Jon Weisman (Rick Monday)
Larry Borowsky (Let 'er Rip)
Will Carroll (Fictional Short Story)
Bob Timmermann (Japanese Baseball)
Cyril Morong (Best Pitching Seasons)
Sean Forman (Monte Carlo Win-Loss)
Brian Gunn (My Little Blue Book)
Joe Lederer (My Dad and Baseball)
Bill Deane (Bob Gibson, 1968)
Mark Armour (1977 Yankees)
Darren Viola (Retrosheet)
David Pinto (RFK)
Dayn Perry (Brave Heart)
Matt Welch (Dave Hansen)
Kevin Kernan (Jack McKeon)
Tom Lederer (Dodgers Road Trip)
Steve Lombardi (Slider)
Studes (Picturing Baseball)
Mike Carminati (Luck of the Drawl)
Eric Neel (Vin Scully)
J.C. Bradbury (Leo Mazzone)
John Sickels (Bill James)
Search Baseball Analysts
Archives
By Category:
Around the Majors Content Only
Around the Minors Content Only
Baseball Beat Content Only
Baseball Beat/Change-Up Content Only
Baseball Beat/WTNY Content Only
Behind the Scoreboard Content Only
Change-Up Content Only
Change-Up/Around the Majors Content Only
Command Post Content Only
Crunching the Numbers Content Only
Designated Hitter Content Only
F/X Visualizations Content Only
Past Times Content Only
Saber Talk Content Only
The Batter's Eye Content Only
Touching Bases Content Only
Weekend Blog Content Only
WTNY Content Only
By Month:
February 2012
January 2012
December 2011
October 2011
September 2011
August 2011
July 2011
June 2011
May 2011
April 2011
March 2011
February 2011
January 2011
December 2010
November 2010
October 2010
September 2010
August 2010
July 2010
June 2010
May 2010
April 2010
March 2010
February 2010
January 2010
December 2009
November 2009
October 2009
September 2009
August 2009
July 2009
June 2009
May 2009
April 2009
March 2009
February 2009
January 2009
December 2008
November 2008
October 2008
September 2008
August 2008
July 2008
June 2008
May 2008
April 2008
March 2008
February 2008
January 2008
December 2007
November 2007
October 2007
September 2007
August 2007
July 2007
June 2007
May 2007
April 2007
March 2007
February 2007
January 2007
December 2006
November 2006
October 2006
September 2006
August 2006
July 2006
June 2006
May 2006
April 2006
March 2006
February 2006
January 2006
December 2005
November 2005
October 2005
September 2005
August 2005
July 2005
June 2005
May 2005
April 2005
March 2005
February 2005
January 2005
December 2004
November 2004
October 2004
September 2004
August 2004
July 2004
June 2004
May 2004
April 2004
March 2004
February 2004
January 2004
December 2003
November 2003
October 2003
September 2003
August 2003
July 2003
June 2003
Reference
Organizational Stats
Arizona Diamondbacks Bat / Pitch
Atlanta Braves Bat / Pitch
Baltimore Orioles Bat / Pitch
Boston Red Sox Bat / Pitch
Chicago Cubs Bat / Pitch
Chicago White Sox Bat / Pitch
Cincinnati Reds Bat / Pitch
Cleveland Indians Bat / Pitch
Colorado Rockies Bat / Pitch
Detroit Tigers Bat / Pitch
Florida Marlins Bat / Pitch
Houston Astros Bat / Pitch
Kansas City Royals Bat / Pitch
Los Angeles Angels Bat / Pitch
Los Angeles Dodgers Bat / Pitch
Milwaukee Brewers Bat / Pitch
Minnesota Twins Bat / Pitch
New York Mets Bat / Pitch
New York Yankees Bat / Pitch
Oakland Athletics Bat / Pitch
Philadelphia Phillies Bat / Pitch
Pittsburgh Pirates Bat / Pitch
St. Louis Cardinals Bat / Pitch
San Diego Padres Bat / Pitch
San Francisco Giants Bat / Pitch
Seattle Mariners Bat / Pitch
Tampa Bay Devil Rays Bat / Pitch
Texas Rangers Bat / Pitch
Toronto Blue Jays Bat / Pitch
Washington Nationals Bat / Pitch
All-Star Links
Official Websites
News and Notes
Baseball News Blog
Baseball Newstand
ESPN Baseball
Fox Sports Baseball
Pro Sports Daily
Roto World
The Roto Times
USA Today Baseball
Baseball Newstand
ESPN Baseball
Fox Sports Baseball
Pro Sports Daily
Roto World
The Roto Times
USA Today Baseball
Reference and Analysis
Baseball Almanac
Baseball America
Baseball Archive
Baseball Contracts
Baseball Cube
Baseball Graphs
Baseball Library
Baseball Musings Player Database
Baseball Page
Baseball Primer
Baseball Prospectus
Baseball Reference
Baseball Statistics
Baseball Truth
Boxscore Central
Diamond Mind Baseball
Doug's Stats
FanGraphs
Fast Balls (pitchfx catalog)
Hardball Dollars
Hardball Times
Hit Tracker
Retrosheet
Rotobase/Rotoblog
Stat Corner
STATS
Tango on Baseball
Yahoo Sports MLB
Web Gems
Bill James Primer
Sabermetric Manifesto (Grabiner)
Pitching and Defense (McCracken)
Pitching and Defense (Tippett)
Transactions Primer (Neyer)
Baseball Stats (Batter's Box)
Prospect Report (Cameron)
Pitcher Workloads (Sheehan)
Goodbye to Old Baseball Ideas (Rickey)
Sabermetric Manifesto (Grabiner)
Pitching and Defense (McCracken)
Pitching and Defense (Tippett)
Transactions Primer (Neyer)
Baseball Stats (Batter's Box)
Prospect Report (Cameron)
Pitcher Workloads (Sheehan)
Goodbye to Old Baseball Ideas (Rickey)
Columnists
Baseball Blogs
Around the Majors
Athletics Nation
Baseball Crank
Baseball Musings
Baseball-Reference Blog
Batter's Box
Big League Stew
Bronx Banter
Catfish Stew
Cub Town
Dan Agonistes
Dodger Thoughts
DRays Bay
Ducksnorts
Futility Infielder
Halos Heaven
Inside the Rockies
It Might Be Dangerous
Knuckle Curve
LoHud Yankees Blog
Lookout Landing
Management by Baseball
Metaforian
Metsgeek
Mike's Baseball Rants
Only Baseball Matters
Redbird Nation
Red Reporter
Sabernomics (Braves)
Seth Speaks
ShysterBall
6-4-2 (Angels/Dodgers)
The Book
TheCubdom
The Cutting Edge
The House That Dewey Built
The View From The Bleachers
Tiger Blog
U.S.S. Mariner
Viva El Birdos
Where's Kernan
Minor Leagues
Arizona Fall League
BA Player Finder
Cal Leaguers
Jamey Newberg
JDM's Scoresheet Baseball
Minor League Baseball
Minor League Park Factors
Minor League Splits
No Pepper
Sickels' Minor League Ball
Warm October Nights
BA Player Finder
Cal Leaguers
Jamey Newberg
JDM's Scoresheet Baseball
Minor League Baseball
Minor League Park Factors
Minor League Splits
No Pepper
Sickels' Minor League Ball
Warm October Nights
Amateur
Boyd's World (College)
Cape Cod Baseball League
College Baseball Blog
College Baseball Insider
Collegiate Baseball Newspaper
College Splits
College Splits Blog
Dirtbags Baseball (Long Beach State)
NCAA Baseball
NCBWA
Team One Baseball (High School)
Texas A&M & Baseball
Cape Cod Baseball League
College Baseball Blog
College Baseball Insider
Collegiate Baseball Newspaper
College Splits
College Splits Blog
Dirtbags Baseball (Long Beach State)
NCAA Baseball
NCBWA
Team One Baseball (High School)
Texas A&M & Baseball
Historical
Cuban Baseball
House of David
Jim "Mudcat" Grant's Web Page
Negro League Baseball Players Assoc
Negro Leagues Baseball Museum
1919 Black Sox
Pacific Coast League
Philadelphia Athletics Historical Society
Shoeless Joe Jackson Society
SABR-L Archives
Walter O'Malley
House of David
Jim "Mudcat" Grant's Web Page
Negro League Baseball Players Assoc
Negro Leagues Baseball Museum
1919 Black Sox
Pacific Coast League
Philadelphia Athletics Historical Society
Shoeless Joe Jackson Society
SABR-L Archives
Walter O'Malley
Miscellaneous
Forums
Credits
Ticket Center
Tickets to Baseball -
Premium Red Sox Tickets - Tickets to Marlins Games - Cardinals Game Tickets - NY Yankee Tickets - Tickets Oakland Athletics - Dallas Cowboys Tickets - Arizona Cardinals Tickets - Tickets Seattle Seahawks - Buffalo Bills Tickets Online - Tickets to Dolphins Football
Buy Boston Red Sox tickets,
Philadelphia Phillies tix,
NY Yankees tickets,
NY Mets tickets, and
MLB All Star game tickets at ABC tickets
Not sure where to find the best online sportsbooks? Start your search with PlayersJet.
Get deals at SportsMemorabilia.com on baseball apparel, including Phillies jerseys and more for adults and children.
Shop the largest selection baseball equipment on sale at Sports Unlimited. Check out tons of baseball gloves, youth baseball gloves and catchers gear from Rawlings, Wilson, Nike & Under Armour.
2011 Draft Order
Courtesy of Baseball America
First-Round:
 1. Pirates (57-105)
 2. Mariners (61-101)
 3. Diamondbacks (65-97)
 4. Orioles (66-96)
 5. Royals (67-95)
 6. Nationals (69-93)
 7. Diamondbacks (for B. Loux)
 8. Indians (69-93)
 9. Cubs (75-87)
10. Padres (for Karsten Whitson)
11. Astros (76-86)
12. Brewers (77-85)
13. Mets (79-83)
14. Marlins (80-82)
15. Brewers (for Dylan Covey)
16. Dodgers (80-82)
17. Angels (80-82)
18. Athletics (81-81)
19. Red Sox (from DET for Martinez)
20. Rockies (83-79)
21. Blue Jays (85-77)
22. Cardinals (86-76)
23. Nationals (from CWS for Dunn)
24. Rays (from BOS for Crawford)
25. Padres (90-72)
26. Red Sox (from TEX for Beltre)
27. Reds (91-71)
28. Braves (91-71)
29. Giants (92-70)
30. Twins (94-68)
31. Rays (from NYY for Soriano)
32. Rays (96-66)
33. Rangers (from PHI for Lee)
Supplemental First Round:
34. Nationals (Dunn)
35. Blue Jays (Downs)
36. Red Sox (Martinez)
37. Rangers (Lee)
38. Rays (Crawford)
39. Phillies (Werth)
40. Red Sox (Beltre)
41. Rays (Soriano)
42. Rays (Balfour)
43. Diamondbacks (LaRoche)
44. Mets (Feliciano)
45. Rockies (Dotel)
46. Blue Jays (Buck)
47. White Sox (Putz)
48. Padres (Garland)
49. Giants (Uribe)
50. Twins (Hudson)
51. Yankees (Vazquez)
52. Rays (Benoit)
53. Blue Jays (Olivo)
54. Padres (Torrealba)
55. Twins (Crain)
56. Rays (Choate)
57. Blue Jays (Gregg)
58. Padres (Correia)
59. Rays (Hawpe)
| Baseball Beat | January 08, 2007 |
Categorizing Pitchers by Batted Ball Types and Strikeout Rates
We all know that strikeouts are the best outcome for a pitcher. When a batter fails to put the ball in play, there is little or no chance for him to reach base or to advance runners on base. Among batted ball types, infield flies are the least harmful, followed by ground balls, outfield flies, and line drives. Although groundballs result in a higher batting average than fly balls, their run impact is lower because the hits are usually limited to singles and an occasional double down the first or third base line, whereas balls in the air that turn into hits are almost always doubles, triples, or home runs.
According to Dave Studenmund's Batted Balls Redux article in The Hardball Times Baseball Annual 2007, strikeouts had a run impact of -0.113, infield flies -0.088, groundballs 0.045, outfield flies 0.192, and line drives 0.391 per incident last year.
Based on the above information, it follows that just as pitchers with high strikeout rates would generally fare better than those with low rates, pitchers with high groundball rates would normally fare better than those with low rates (all else being equal). Furthermore, it also suggests that pitchers who combine higher strikeout and groundball rates will outperform those with lower rates.
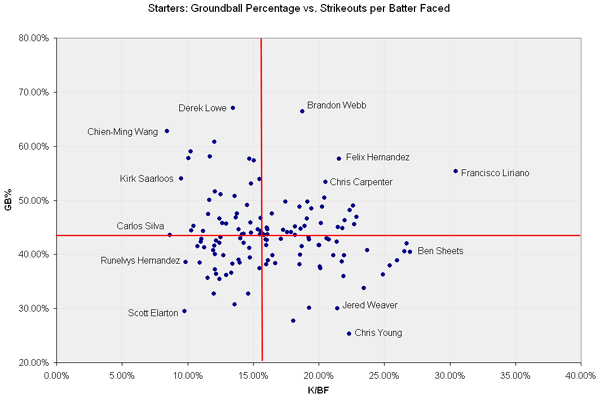
To provide a visual aid to categorize such pitchers, I created a graph (with the help of David Appelman of FanGraphs), plotting the strikeout and groundball rates for everyone in the major leagues who completed 100 or more innings and started in at least 33% of their appearances. The y-axis is groundball percentage (GB%) and the x-axis is strikeouts per batter faced (K/BF). The graph is divided into four quadrants with the mid-point equal to the average GB% of 43.80% and average K/BF of 15.88%.
The northeast quadrant is comprised of pitchers with above-average groundball and strikeout rates; the southeast quadrant encompasses pitchers with above-average strikeout and below-average groundball rates; the northwest quadrant is made up of pitchers with above-average groundball and below-average strikeout rates; and the southwest quadrant is the home for pitchers with below-average groundball and strikeout rates.
The average ERA among all qualifiers was 4.44. The average ERA for starters with above-average K rates was 4.12. The average ERA for those with below-average K rates was 4.78. Similarly, the average ERA for starters with above-average GB rates was 4.24, while the average ERA for those with below-average GB rates was 4.62.
The average ERA by quadrants:
       W        E
N     4.53     3.94
S     5.01     4.27
Not surprisingly, pitchers with the highest strikeout and groundball rates had the lowest average ERA (3.94), while those with the lowest K and GB rates had the highest average ERA (5.01). In the hybrid categories, pitchers with above-average strikeout and below-average groundball rates (4.27) beat those with below-average K and above-average GB rates (4.53).
Looking at the outliers in the graph would help us reach the same conclusion. There isn't a one of us who wouldn't take Brandon Webb, Felix Hernandez, Chris Carpenter, or Francisco Liriano over Scott Elarton or Runelvys Hernandez. Liriano, in fact, arguably had the best combination of K and GB rates, while Elarton had the worst combo. Lo and behold, Liriano had the lowest ERA (2.16) among starters with at least 100 IP and Elarton had one of the worst (5.34).
Let's take a closer look at the results, starting with the northeast quadrant and going clockwise. The pitchers are sorted by K/BF rates in the first three tables and by GB% in the last table.
NORTHEAST QUADRANT (ABOVE-AVG GB AND K RATES)
Name                    GB%     K/BF
Francisco Liriano       55.33%  30.44%
Carlos Zambrano         46.88%  22.90%
Brett Myers             45.55%  22.69%
Roger Clemens           49.02%  22.62%
Jeremy Bonderman        48.17%  22.37%
John Smoltz             46.29%  21.98%
Scott Olsen             44.80%  21.81%
Felix Hernandez         57.72%  21.57%
C.C. Sabathia           45.05%  21.45%
Chris Carpenter         53.34%  20.54%
A.J. Burnett            50.49%  20.45%
Erik Bedard             48.81%  20.26%
Josh Johnson            45.77%  20.18%
Adam Loewen             48.48%  19.44%
Andy Pettitte           49.77%  19.16%
Dave Bush               46.65%  19.10%
Danny Haren             45.24%  18.92%
Brandon Webb            66.48%  18.74%
Kelvim Escobar          44.70%  18.63%
Roy Oswalt              48.80%  18.53%
Josh Beckett            45.10%  18.18%
Vicente Padilla         44.10%  17.89%
Doug Davis              44.08%  17.59%
Cory Lidle              49.72%  17.45%
Kevin Millwood          44.57%  17.31%
Dontrelle Willis        47.54%  16.41%
Jose Contreras          44.62%  16.09%
Wandy Rodriguez         44.95%  16.04%
That's an elite group of pitchers. The best of the bunch are those with strikeout rates above 20% and/or groundball rates over 50%. I had already signaled out Hernandez, Carpenter, and Liriano, but check out A.J. Burnett. The latter is one of the premier pitchers in baseball when healthy.
While Jose Contreras and Wandy Rodriguez fall into the NE quadrant, both pitchers have K and GB rates that are close to the league average. As such, I would be reluctant to label either one as a special pitcher.
On the other hand, I would be shocked if Hernandez (4.52), Adam Loewen (5.37), and Josh Beckett (5.01) don't lower their ERA by at least 0.50 and perhaps by more than 1.00 in 2007. With Liriano injured, I would rank Felix directly behind Johan Santana as the pitcher most likely to lead the AL in ERA this year.
SOUTHEAST QUADRANT (BELOW-AVG GB AND ABOVE-AVG K RATES)
Name                    GB%     K/BF
Ben Sheets              40.41%  26.98%
Scott Kazmir            41.97%  26.72%
Johan Santana           40.59%  26.54%
Cole Hamels             38.86%  25.99%
Jake Peavy              38.00%  25.41%
Pedro Martinez          36.29%  24.91%
Daniel Cabrera          40.72%  23.72%
Orlando Hernandez       33.78%  23.46%
Chris Young             25.37%  22.31%
Curt Schilling          39.83%  21.94%
Matt Cain               35.98%  21.88%
Aaron Harang            38.69%  21.75%
Jered Weaver            30.03%  21.43%
Mike Mussina            42.37%  21.39%
Javier Vazquez          39.84%  21.10%
Ian Snell               42.78%  20.79%
John Lackey             42.99%  20.61%
Jason Schmidt           37.40%  20.13%
Ted Lilly               37.73%  20.08%
Boof Bonser             41.69%  20.05%
Randy Johnson           41.71%  20.00%
Oliver Perez            30.12%  19.28%
James Shields           42.75%  19.26%
Gil Meche               43.12%  19.24%
Byung-Hyun Kim          41.51%  18.72%
Chris Capuano           39.88%  18.59%
Bronson Arroyo          38.15%  18.55%
Brad Penny              43.54%  18.20%
Chuck James             27.67%  18.06%
Kyle Lohse              42.89%  17.11%
Ervin Santana           38.41%  16.67%
Claudio Vargas          39.86%  16.47%
Ricky Nolasco           38.84%  16.15%
Taylor Buchholz         43.73%  16.08%
Rodrigo Lopez           42.61%  16.06%
Justin Verlander        41.72%  15.98%
Barry Zito              38.20%  15.98%
Ryan Madson             42.79%  15.97%
There are a couple of dozen outstanding pitchers in this group, most notably those listed in the top half (or with K rates over 20%). Ben Sheets, Scott Kazmir, and Santana had almost identical K and GB rates. Cole Hamels and Jake Peavy rank just below this threesome with metrics not too dissimilar from one another or those immediately above them.
Oliver Perez (6.55) has the most room to shave a couple of runs off his ERA. Having gone to bat for Daniel Cabrera (4.74) last year, I hesitate to bring up his name again but he and Ian Snell (4.74) are good bets to show improvement in 2007.
SOUTHWEST QUADRANT (BELOW-AVG GB AND K RATES)
Name                    GB%     K/BF
Chan Ho Park            43.60%  15.84%
Jason Jennings          43.77%  15.74%
Victor Santos           43.64%  15.52%
Brett Tomko             37.47%  15.48%
Tim Wakefield           39.39%  14.75%
Freddy Garcia           41.19%  14.72%
Cliff Lee               32.70%  14.63%
Esteban Loaiza          42.10%  14.29%
Odalis Perez            43.72%  14.14%
Jon Lieber              42.96%  14.01%
Tony Armas Jr.          38.52%  14.00%
Jeff Weaver             38.99%  13.90%
Eric Milton             30.80%  13.60%
Jaret Wright            38.30%  13.44%
Livan Hernandez         36.58%  13.35%
Michael O'Connor        36.17%  12.97%
Jarrod Washburn         39.87%  12.73%
Joe Blanton             43.13%  12.50%
Jae Seo                 35.40%  12.45%
Jon Garland             42.11%  12.44%
Noah Lowry              36.38%  12.19%
Josh Fogg               42.55%  12.16%
Jamie Moyer             40.03%  12.08%
Seth McClung            37.25%  12.07%
Brad Radke              41.64%  12.05%
Shawn Chacon            32.70%  12.02%
Ramon Ortiz             40.81%  11.94%
Woody Williams          35.69%  11.54%
Kris Benson             41.32%  11.27%
Jason Marquis           42.88%  11.03%
John Koronka            42.30%  11.01%
Paul Byrd               38.52%  10.93%
Steve Trachsel          41.52%  10.73%
Runelvys Hernandez      38.58%   9.84%
Scott Elarton           29.49%   9.78%
Carlos Silva            43.62%   8.63%
This is the quadrant that you want to avoid. It is inhabited by some of the worst starters in the game. If you fail to miss bats and don't keep the ball on the ground when it is put into play, you are going to run into trouble. There is basically only one way to survive in this quadrant: throwing strikes and maintaining a low walk rate. Freddy Garcia, Jon Lieber, Jon Garland, Brad Radke, Paul Byrd, and Carlos Silva fit this description. But these types of pitchers live on the edge with very little margin for error.
Chan Ho Park, Jason Jennings, and Victor Santos were near league average in K and GB rates and should be classified more like Jose Contreras and Wandy Rodriguez (both of whom fell in the NE quadrant) than the rest of their SW brethren.
NORTHWEST QUADRANT (ABOVE-AVG GB AND BELOW-AVG K RATES)
Name                    GB%     K/BF
Derek Lowe              67.04%  13.47%
Chien-Ming Wang         62.80%   8.44%
Jake Westbrook          60.80%  12.06%
Jason Johnson           59.02%  10.25%
Jamey Wright            58.06%  11.69%
Aaron Cook              57.77%  10.05%
Tim Hudson              57.66%  14.70%
Roy Halladay            57.33%  15.07%
Kirk Saarloos           54.00%   9.49%
Clay Hensley            53.87%  15.50%
Paul Maholm             53.05%  14.85%
Miguel Batista          51.66%  12.09%
Zach Duke               51.12%  12.51%
Greg Maddux             50.80%  13.57%
Kenny Rogers            50.07%  11.66%
Luke Hudson             49.10%  14.55%
Mark Hendrickson        47.59%  13.77%
Joel Pineiro            47.46%  11.55%
Sean Marshall           46.81%  13.68%
Nate Robertson          46.75%  15.55%
Jeff Suppan             46.65%  12.43%
Casey Fossum            45.88%  14.81%
Aaron Sele              45.76%  12.64%
Matt Morris             45.66%  12.96%
Brian Moehler           45.25%  10.43%
Jeff Francis            44.67%  13.88%
Anibal Sanchez          44.61%  15.35%
Mark Redman             44.41%  10.27%
Mark Buehrle            44.35%  11.19%
Tom Glavine             44.28%  15.56%
Elizardo Ramirez        44.00%  14.84%
Enrique Gonzalez        43.84%  14.29%
This is an interesting group of pitchers. As a whole, they rank well behind those in the NE quadrant and well ahead of those in the SW quadrant. Although they are the opposite of the pitchers in the SE quadrant, their results (in terms of ERA) are the most similar. The two groups just get there in drastically different ways. The NW pitchers succeed by inducing grounders and keeping the ball in the park, whereas the SE hurlers thrive on strikeouts.
Derek Lowe, Chien-Ming Wang, and Jake Westbrook are the biggest outliers - three pitchers who turned more than 60% of batted balls into grounders. As such, Lowe (0.58), Wang (0.50), and Westbrook (0.64) had extraordinarily low HR/9 rates. They also have one other common thread: low walk rates. Lowe (2.27), Wang (2.15), and Westbrook (2.34) offset their high hit rates by limiting the number of bases on balls.
Roy Halladay, Clay Hensley, Nate Robertson, Anibal Sanchez, and Tom Glavine - all with K/BF rates exceeding 15% - are within a few whiskers of being in the NE group. However, Sanchez and Glavine are close to league average with K rates just to the west and GB% slightly to the north of the means.
I would rather know a pitcher's strikeout and groundball rates than his ERA. Throw in a third dimension - walk rates - and you have almost everything you need to know about a pitcher. Focusing on the components gives one a much more comprehensive understanding of a pitcher's upside and downside than looking at a single metric such as ERA.
(Notes: I could have chosen run average (RA) rather than earned run average (ERA), but the results would have been essentially the same in both direction and magnitude. As previously demonstrated, groundball pitchers generally give up a greater percentage of unearned runs because more errors (of the fielding and throwing type) are committed on grounders than balls hit in the air. Ballpark factors, team defense, and the level of competition may affect the components and/or ERA to varying degrees.)
Tomorrow: Categorizing Relievers by Batted Ball Types and Strikeout Rates.
Comments
It's really tricky, Rich. ERA measures some qualities of a pitcher, not covered by the components, controlling the running game (which impacts DP rates)and ability to pitch from the stretch being the two major ones.
If one is looking only at one year's worth of statistics, I'd rather know the component data. Over the longer haul, I'd rather know the ERA but the component data is still very useful in understanding seasonal changes which may be indicative of longer term growth or decline.
Posted by: Mike Green at January 8, 2007 9:05 AM
I agree that "ERA measures some qualities of a pitcher not covered by the components" but it is also affected by areas outside the control of the pitcher (such as team defense and bullpen support).
It basically comes down to one's preference for FIP or DIPS vs. ERA. However, rather than using HR rate as in FIP/DIPS, I like GB% because it has a strong correlation with HR rate and GIDP rate.
ERA may do a better job explaining a pitcher's past performance, but I believe the components do a better job at predicting future performance.
I also like categorizing pitchers in this manner because you can get a better feel for the "how" and "why" they differ from others. In addition, the quadrants are visually useful to me.
Posted by: Rich Lederer at January 8, 2007 9:27 AM
I love looking at graphs....great way to really look at data and see information.
I wonder is you could take the 10-15 pitcher that fell most closely around the center of the quadrants and averaged their ERA's what that would get you and who they would be.
If I have a second, I'll give it a try. Looking forward to seeing the relievers version of this.
Tim
Red Sox Times
Posted by: Tim at January 8, 2007 1:48 PM
~~~According to Dave Studenmund's Batted Balls Redux article in The Hardball Times Baseball Annual 2007, strikeouts had a run impact of -0.113, infield flies -0.088, groundballs 0.045, outfield flies 0.192, and line drives 0.391 per incident last year.~~~
Rich, Dave, or anyone -
Don't Run Expectancy tables say that a whiff (K) by a batter is no worse than any other form of out? If so, why does it favor the pitcher, in terms of preventing runs, by getting the whiff?
I know that K's are fielding independent, etc. And, that's why, etc.
So, then why does every sabermetric expert say that K's by a batter are no big deal?
This has always bothered me. Anything you can share would be appreciated. Thanks.
Posted by: Steve Lombardi at January 8, 2007 1:56 PM
I would also be interested to know what the variance looked like in each of these quadrants in ERA.
Was any group more clustered around a mean than another. Meaning, Quandrant A is high risk, high reward... with upside higher than Quadrant B where everyone is clustered together and there is consistency/predictability in that type of pitcher?
Tim
Red Sox Times
Posted by: Tim at January 8, 2007 2:13 PM
Thanks, Tim.
Steve - The batted ball info encompasses hits and outs. Not all infield/outfield flies and groundballs turn into outs, whereas 99.9% (or thereabouts) of all strikeouts result in an out.
It should also be pointed out that some batted balls, even when they result in the batter being put out, advance runners on base. Therefore, these so-called "productive outs" are more valuable than striking out. Hope that helps.
Posted by: Rich Lederer at January 8, 2007 2:21 PM
Steve, the reason is that the Run Expectancy tables are measuring different things for batters versus pitchers.
For pitchers, they're measuring a virtually certain out (K), versus balls in play which *might* be turned into outs (and generally are, at a rate of ~70% or so overall). That still gives a strikeout a bonus in those outcomes, because it is converted to an out 99+% of the time, and the others aren't.
For batters, you're measuring what kind of out, not whether or not it was an out. The batter's first job is not to make an out; if he makes an out, it usually doesn't matter what kind. (The less-supported extension is that high strikeout totals aren't bad, they're good; that turns out to be true if the hitter also has high walk rates, high fly-ball percentages, and high fly-ball/HR ratios. In other words, it's true when the hitter is taking an approach that maximizes both not-making-outs and hitting-the-ball-hard. This is confusing cause and effect; not-making-outs and hitting-ball-hard are good, high strikeout totals can be an effect of that, but don't cause it.)
If you break the RunExpectancy tables down for kind of out, there is very little difference i.e. going from 1st-2nd-one-out to 1st-3rd-two-outs is the big difference, not 1st-2nd-one-out to 1st-3rd-two-outs-where-second-out-was-grounder.
Finally, if you break down batted-ball data for hitters, you will find the same sorts of correlations i.e. that hitters as a group do better when they put the ball in play or hit a HR than when they strike out, because a strikeout converts to an out effectively all the time, and the others don't.
Posted by: Subrata Sircar at January 8, 2007 2:37 PM
I took the fourty players clustered around the median in both categories and marked them. I pulled the list of players that were marked in both categories and grouped them. This should be the twenty players closest to the center
Name GB% K/BF ERA
Anibal Sanchez 44.61% 15.35% 2.83
Justin Verlander 41.72% 15.98% 3.63
Jason Jennings 43.77% 15.74% 3.78
Tom Glavine 44.28% 15.56% 3.82
Jose Contreras 44.62% 16.09% 4.27
Brad Penny 43.54% 18.20% 4.33
Vicente Padilla 44.10% 17.89% 4.50
Kevin Millwood 44.57% 17.31% 4.52
Chan Ho Park 43.60% 15.84% 4.81
Esteban Loaiza 42.10% 14.29% 4.89
Doug Davis 44.08% 17.59% 4.91
Jon Lieber 42.96% 14.01% 4.93
Elizardo Ramirez 44.00% 14.84% 5.37
Enrique Gonzalez 43.84% 14.29% 5.67
Ryan Madson 42.79% 15.97% 5.69
Victor Santos 43.64% 15.52% 5.70
Kyle Lohse 42.89% 17.11% 5.83
Taylor Buchholz 43.73% 16.08% 5.89
Rodrigo Lopez 42.61% 16.06% 5.90
Odalis Perez 43.72% 14.14% 6.20
This group's average ERA is 4.87. Certainly nothing to write home about. I wonder what that says about Sanchez and Verlander?
Posted by: Tim at January 8, 2007 3:11 PM
on the other hand, the "strikeout is worse" theory is somewhat mitigated by the fact that putting the ball into play (with a runner on base) puts you at risk of hitting into a double-play, which is worse than a strikeout.
Posted by: Vishal at January 8, 2007 4:44 PM
This group's average ERA is 4.87. Certainly nothing to write home about. I wonder what that says about Sanchez and Verlander?
Sanchez had an unsustainably low BABIP of .244 last year. I would look for his ERA to jump a full run, if not more. Pitching half of his games in Florida may prevent his ERA from regressing all the way back to the league average for all qualifiers of 4.44 or the NW quadrant average of 4.53 or the 20 pitchers "closest to center" (as you called them) of 4.87. (BTW, my guess is that the weighted-average ERA of the latter group is better than 4.87 as the pitchers with the best ERA also were those with the most IP.)
Verlander, on the other hand, is perhaps the most difficult pitcher in the majors to steal bases against. He only allowed one SB vs. five CS. The rookie was also 21st in the bigs with 21 GIDP. I would hesitate to bet against Verlander given his raw talent but would be surprised if he lowered his ERA without a corresponding level of improvement in his component stats.
Posted by: Rich Lederer at January 8, 2007 5:16 PM
The one thing this study, and most others, don't have a way to evaulate is pithcers that only go for a strikeout when they need to. Verlander and Carpenter both seem to fit into that mold. Verlander seems to have a lot of "stuff" in reserve for when he needs it. Carpenter like to paint the corners with sinkers trying to get an easy out unless there are RISP.
Could we add a 3rd dimension based on pitches per PA? The idea being that the ability to combine a high strikeout rate with a low number of pitches per PA is more valuable than the same K rate with a high pitch count.
Posted by: Jason at January 8, 2007 5:32 PM
Don't Run Expectancy tables say that a whiff (K) by a batter is no worse than any other form of out? If so, why does it favor the pitcher, in terms of preventing runs, by getting the whiff?
Steve -- no, the run expectancy tables I use say that a strikeout is worse than a generic out. The best primary source I can think of is Tom Ruane's excellent Retrosheet article at...
http://www.retrosheet.org/Research/RuaneT/valueadd_art.htm
As you can see, a strikeout results in -.238 runs, while a batted ball out (other than double plays) results in -.200 runs.
Posted by: studes at January 8, 2007 6:02 PM
great point Rich...weighted average ERA for the group closest to the center is 4.77 (as long as my quick math is right).
Posted by: Tim at January 8, 2007 7:13 PM
Very cool, Rich. Thanks. A picture says a...well, you know.
Anywho. Here's an idea for even more work for someone other than me to do. Take last year's data. Overlay it on this year's data. Use those cool arrow things studes used in his recent "But I Regress" column to show the changes in a (select group of) pitcher's plots/tendencies. See if you can find the same data for 2004. Rinse, wash, repeat.
You know, that kind of thing.
Thanks again.
Yours in Cyle Hankerd,
Kent
Posted by: Kent Bonham at January 9, 2007 7:04 AM
I agree that RA, not ERA, should be used.
***
RE can be found here:
http://www.tangotiger.net/RE9902event.html
The run value of the K is around .01 runs worse than a regular out (see last line). This link also gives you the run value of the K and other outs by base/out state. K with man on 3b and less than 2 outs is great for a pitcher.
Posted by: tangotiger at January 9, 2007 7:25 AM
Thanks, Tango.
K with man on 3b and less than 2 outs is great for a pitcher.
Agree. That is one of the biggest differentiating characteristics of pitchers. Conversely, as it relates to hitters, putting the ball in play in such situations (as opposed to striking out) is important, too.
Posted by: Rich Lederer at January 9, 2007 7:51 AM
I was wondering if you did something similar to this with batting. I did something kind of like this on the batting standpoint, and found out that the two statistics with the closest relevance to runs were SLG, and POS. Of course I only used the basic statistics, and nothing as in-depth. I used 7 years along baseball's history to get these results. It was actually interesting.
Posted by: Michael at January 9, 2007 4:45 PM
Wondering what people think of Chris Young. Can he remain a top starter for the Padres with a GB% around 25%? Crazy outliers like Wang and Young kinda freak me out.
Posted by: Jurgen at January 9, 2007 5:09 PM
You should think about normalizing the results based on the fielding percentage for the team they pitch. KC pitchers might not be as bad as their ERA shows.
Posted by: Unitsmoke at January 11, 2007 11:53 AM
The purpose of the study was to categorize pitchers by GB and K rates, not ERA. One of the beauties of looking at these two metrics only is that neither is dependent on team defense. Elarton and (Runelvys) Hernandez were just plain awful on their own.
Posted by: Rich Lederer at January 11, 2007 12:38 PM