Rich Lederer • Baseball Beat
Patrick Sullivan • Change-Up
Jeremy Greenhouse • Touching Bases
Dave Allen • F/X Visualizations
Sky Andrecheck • Behind the Scoreboard
Marc Hulet • Around the Minors
Al Doyle • Past Times
Retired Uniforms:
Bryan Smith • WTNY
Joe Sheehan • Command Post
Jeff Albert • The Batter's Eye
RSS Feed
Home
*Examining the Past, Present, and Future*
Lineup Card
Recent Entries
» Putting Together a Reality Team
» Historical Hall of Fame Vote Comparisons: 2012
» An All-Christmas Team
» The New-Look Angels
» John Denny: The Forgotten Cy Young Award Winner
» Money Isn't Everything
» What Would It Take to Hit .400 in the 21st Century?
» Halos Heaven
» Brandon McCarthy's Breakout Season
» Link-o-Rama
» Historical Hall of Fame Vote Comparisons: 2012
» An All-Christmas Team
» The New-Look Angels
» John Denny: The Forgotten Cy Young Award Winner
» Money Isn't Everything
» What Would It Take to Hit .400 in the 21st Century?
» Halos Heaven
» Brandon McCarthy's Breakout Season
» Link-o-Rama
Best of Baseball Beat
Abstracts From the Abstracts
1977 Baseball Abstract
1978 Baseball Abstract
1979 Baseball Abstract
1980 Baseball Abstract
1981 Baseball Abstract
1982 Baseball Abstract
1983 Baseball Abstract
1984 Baseball Abstract
1985 Baseball Abstract
1986 Baseball Abstract
1987 Baseball Abstract
1988 Baseball Abstract
1978 Baseball Abstract
1979 Baseball Abstract
1980 Baseball Abstract
1981 Baseball Abstract
1982 Baseball Abstract
1983 Baseball Abstract
1984 Baseball Abstract
1985 Baseball Abstract
1986 Baseball Abstract
1987 Baseball Abstract
1988 Baseball Abstract
Bert Blyleven Series
Meeting Up and Hanging Out with Bert
The Results Are In And...
Aficionado Heavily Invested in Blyleven
Latest on Blyleven's Chances for the HOF
The Internet Zealot Responds
400 Down and 5 to Go...
Bert Be Home By Eleven?
Blyleven's Forgotten Season (1973)
HeyMan, Your Comments Don't Hold Water
The Waiting is the Hardest Part
Another Addition to the Blyleven Series
Search for the Truth
As Dominant as His HOF Contemporaries
Listen, Buster
A Larger Step for Blyleven
Answering the Naysayers (Part Two)
Another Small Step for Blyleven
Q&A: Blyleven on the Twins
The Majority Rules, Right?
It's All Dutch to Some
The Hall of Fame Case for Bert Blyleven
Q&A: Blyleven on Felix Hernandez
Clemens Rocketing Up Charts
Poz: An Interview With a KC Star
A HOF Chat with Tracy Ringolsby
Up Close and Personal
A Peek Into the Mind of a HOF Voter
Answering the Naysayers
It's That Time of the Year (Again)
"If Cooperstown is Calling..."
The Bert Alert
One Small Step for Blyleven...
Only the Lonely
Exclusive Interviews
Lee Sinins
Alex Belth
David Pinto
Will Carroll
Mike Carminati
Aaron Gleeman
Joe Sheehan
Jay Jaffe
Jeff Peek
Tracy Ringolsby
Joe Posnanski
Bill James Part I, II, III
Jon Lalonde
Chuck Tiffany
Dayn Perry
Fay Vincent
Nate Silver
Alex Belth
David Pinto
Will Carroll
Mike Carminati
Aaron Gleeman
Joe Sheehan
Jay Jaffe
Jeff Peek
Tracy Ringolsby
Joe Posnanski
Bill James Part I, II, III
Jon Lalonde
Chuck Tiffany
Dayn Perry
Fay Vincent
Nate Silver
Bullpen
Rich Lederer
The Odd Couple (with Alex Belth)
The MostUnder Over Underrated Player in Baseball (with Brian Gunn)
Three Wise Men (roundtable by Alex Belth)
Infrequently Asked Questions (interview with Matt Welch)
Interview (Orioles Think Tank)
Bernie and the Yanks (Bronx Banter)
Hope and Faith: How the LAA Win the World Series (Baseball Prospectus)
NL West (The Soul of Baseball)
Greatest Living Hitter? (Sports Illustrated)
Roundtable: 2008 HOF Ballot (Armchair GM)
The Most
Three Wise Men (roundtable by Alex Belth)
Infrequently Asked Questions (interview with Matt Welch)
Interview (Orioles Think Tank)
Bernie and the Yanks (Bronx Banter)
Hope and Faith: How the LAA Win the World Series (Baseball Prospectus)
NL West (The Soul of Baseball)
Greatest Living Hitter? (Sports Illustrated)
Roundtable: 2008 HOF Ballot (Armchair GM)
Patrick Sullivan
Designated Hitters
David Bromberg (Q&A: John Denny)
Mark Armour (H. Killebrew and Versatility)
Joe Lederer (Soundtrack of a Prospect)
David Bromberg (Clemente's Autograph)
David Bromberg (Woody Fryman)
D. Baumstein (WAR Against Age: Pitchers)
Doug Baumstein (The WAR Against Age)
Doug Baumstein (A Lifetime on the Road)
John Fraser (Pick Six)
Mark Armour (How to Score More Runs?)
Bill Parker (What Opening Day Tells Us)
Stan Opdyke (Pat Rispole)
Chris Jaffe (Evaluating Baseball's Mgrs)
Stan Opdyke (Baseball Radio in NYC, 1953)
A. Nathan (Performance of Baseball Bats)
Michael Weddell (Edgar Martinez/HOF)
Jon Weisman (100 Things Dodgers Fans...)
Stan Opdyke (Connie Mack and Vin Scully)
Eric Walker (Evaluating Run Production)
Brent Mayne (The Intangibles of Catching)
Chris Moore (Best Fastballs in Baseball)
Dave Baldwin (The Batter’s Brain)
Shawn Haviland (Ivy League to MLB)
Larry Granillo (Walking Off)
Rob Iracane (Solo HR Won't Break You)
Tommy Bennett (Charm of AM Radio)
Harry Pavlidis (Johan Santana's Fast Start)
John Walsh (WAR and Remembrance)
Eric Walker (Precisely Inaccurate)
Bob Timmermann (As They See 'Em)
Geoff Young (Unicycles and Delusions)
Baseball Analysis at Tufts (Groundballers)
Baseball Analysis at Tufts (GB Out Rates)
G. Rybarczyk ('09 Hit Tracker Projections)
Joe Lederer (Curt Schilling/HoF)
Conor Gallagher (Hall of Fallacies)
Chris Green (Jim Rice, HoF, the Numbers)
Shawn Hoffman (Baseball's Bear Mkt?)
Paul Anthony (Manny Syndrome)
Ross Roley (World Series Odds)
B. Timmermann (Catcher's Interference)
R.J. Anderson (Waiting the Hardest Part)
Maury Brown (Cubs, MLB, and Cuban...)
Myron Logan (Dee-Fense, Dee-Fense)
Craig Calcaterra (Frivolity, Part I, Part II)
Chad Finn (Ode to Baseball Cards)
David Cameron (Mariners Foibles)
Chris Dial (Chipper Jones)
Pat Lederer (Memory Lane)
David Appelman (Clutch Pitching)
Bob Rittner (DH)
Jonathan Mayo (Roger Clemens)
Lisa Winston (My Son-in-Law...)
Russ McQueen (The Yellow Hammer)
Bob Rittner (I'm OK, You're OK)
Mark Armour (In Defense of the HOF)
Pat Jordan (Friends)
Dan Levitt (Analysis of Terry Ryan)
Doug Baumstein (Trading Econ 101)
Ross Roley (Runner's Reluctance II)
Ross Roley (Runner's Reluctance I)
Mark Armour (No-Longer Lovable Sox)
Bruce Regal (Stealthy and Wise)
Brian Gunn (Roid Monster)
Current/McEvoy (Value of the SB)
John Rickert (Sinister Thefts)
Nate Silver (Sabermetrics)
David Vincent (Home Run Production)
Joe P. Sheehan (Enhanced Gameday II)
Mark Armour (An Ode to Sport)
David Gassko (All-Time Worm Burners)
Joe P. Sheehan (Enhanced Gameday)
John Walsh (When Titans Clash)
Fox/Williams (Quantifying Coaches II)
Fox/Williams (Quantifying Coaches I)
Jacob Luft (Bull Durham Rant)
Chad Finn (Strat-O-Matic)
Lisa Winston (Rotisserie Baseball)
Dave Studeman (Baseball Stats)
Steve Treder (Roger Craig)
Marc Normandin (Jeff Bagwell)
D. Appelman (Expanding Strike Zone)
Jeff Sackmann (Worst MiL Defenders)
Jeff Sackmann (Best MiL Defenders)
Maxwell Kates (Van Lingle Mungo)
David Appelman (Pitch Location)
Kent Bonham (Danny Ray Herrera)
Glenn Stout (Two Baseball Poems)
Bruce Regal (The Challenge Round)
Mark Lamster (Barry & Ty)
Geoff Young (NL West)
Tom Lederer (The Ryan Express)
Brian Erts (Great Leap Forward)
David Pinto (Parity and the N.L.)
Jacob Luft (Fathers and Daughters)
Jamey Newberg (Pete's Sake)
Jeff Albert (A. Jones Swing Analysis)
Jeff Albert (A-Rod Swing Analysis)
Keith Law (Death, Taxes, and Waivers)
Peter Abraham (Tales of Torre Tales)
Larry Borowsky (Let 'er Rip II)
Dan Levitt (Empirical Analysis of Bunting)
Jonah Keri (If I Met Warren Cromartie...)
Bob Klapisch (War Stories)
Bob Timmermann (John F. Kennedy HS)
Kent Bonham (Aluminum Adjustments)
Al Doyle (More Than Superstars)
Ross Roley (Instant Replay)
David Vincent (Barry Bonds Homers)
Chad Finn (Our Favorite Obscurities)
Bill Deane (1979 NL MVP)
Mark Armour (Rise/Fall of Artificial Turf)
Jeff Angus (Wally Moon Camp)
David Berri (Money and Baseball)
Larry Borowsky (Baseball w/o the #s)
Derek Zumsteg (The Irrational Market)
David Regan (Free Agent Contracts)
Peter Schmuck (Steroids and the HOF)
David Appelman (Pitchers, Pitch by Pitch)
Dan Fox (Swinging, Taking, Fouling, Etc)
Patrick Sullivan (Study of NYY CF/BOS LF)
Will Leitch (Baseball Journalism)
Jeff Sullivan (Pitcher Release Points)
Steve Treder ('69-'70 Giants)
Maury Brown (Charlie Finley)
John Brattain (Bob Johnson)
Bob Klapisch (The Case for Bert Blyleven)
Jeff Peek (Pride and Prejudice)
Dayn Perry (Bert and Warren)
Rob Neyer (If Don Sutton Was Great...)
Lisa Winston (Minor League Memories)
Alex Belth (Otis Redding Was Right)
David Cameron (Long Live the King)
Jeff Angus (Baserunning Study)
Bert Blyleven (Baseball Playoffs)
Boyd Nation (Not a Prospect List)
James Click (Batters-Baserunners Study)
Jeff Shaw (Why I Love Baseball)
David Gassko (BIP/BFP Fielding Study)
Jay Jaffe (Milwaukee Sausage Race)
Jamey Newberg (Remember When)
Bob Klapisch (Press Box to the Mound)
Dan Levitt (Predictive Value of BB)
David Vincent (Official Scorer)
Jon Weisman (Rick Monday)
Larry Borowsky (Let 'er Rip)
Will Carroll (Fictional Short Story)
Bob Timmermann (Japanese Baseball)
Cyril Morong (Best Pitching Seasons)
Sean Forman (Monte Carlo Win-Loss)
Brian Gunn (My Little Blue Book)
Joe Lederer (My Dad and Baseball)
Bill Deane (Bob Gibson, 1968)
Mark Armour (1977 Yankees)
Darren Viola (Retrosheet)
David Pinto (RFK)
Dayn Perry (Brave Heart)
Matt Welch (Dave Hansen)
Kevin Kernan (Jack McKeon)
Tom Lederer (Dodgers Road Trip)
Steve Lombardi (Slider)
Studes (Picturing Baseball)
Mike Carminati (Luck of the Drawl)
Eric Neel (Vin Scully)
J.C. Bradbury (Leo Mazzone)
John Sickels (Bill James)
Search Baseball Analysts
Archives
By Category:
Around the Majors Content Only
Around the Minors Content Only
Baseball Beat Content Only
Baseball Beat/Change-Up Content Only
Baseball Beat/WTNY Content Only
Behind the Scoreboard Content Only
Change-Up Content Only
Change-Up/Around the Majors Content Only
Command Post Content Only
Crunching the Numbers Content Only
Designated Hitter Content Only
F/X Visualizations Content Only
Past Times Content Only
Saber Talk Content Only
The Batter's Eye Content Only
Touching Bases Content Only
Weekend Blog Content Only
WTNY Content Only
By Month:
February 2012
January 2012
December 2011
October 2011
September 2011
August 2011
July 2011
June 2011
May 2011
April 2011
March 2011
February 2011
January 2011
December 2010
November 2010
October 2010
September 2010
August 2010
July 2010
June 2010
May 2010
April 2010
March 2010
February 2010
January 2010
December 2009
November 2009
October 2009
September 2009
August 2009
July 2009
June 2009
May 2009
April 2009
March 2009
February 2009
January 2009
December 2008
November 2008
October 2008
September 2008
August 2008
July 2008
June 2008
May 2008
April 2008
March 2008
February 2008
January 2008
December 2007
November 2007
October 2007
September 2007
August 2007
July 2007
June 2007
May 2007
April 2007
March 2007
February 2007
January 2007
December 2006
November 2006
October 2006
September 2006
August 2006
July 2006
June 2006
May 2006
April 2006
March 2006
February 2006
January 2006
December 2005
November 2005
October 2005
September 2005
August 2005
July 2005
June 2005
May 2005
April 2005
March 2005
February 2005
January 2005
December 2004
November 2004
October 2004
September 2004
August 2004
July 2004
June 2004
May 2004
April 2004
March 2004
February 2004
January 2004
December 2003
November 2003
October 2003
September 2003
August 2003
July 2003
June 2003
Reference
Organizational Stats
Arizona Diamondbacks Bat / Pitch
Atlanta Braves Bat / Pitch
Baltimore Orioles Bat / Pitch
Boston Red Sox Bat / Pitch
Chicago Cubs Bat / Pitch
Chicago White Sox Bat / Pitch
Cincinnati Reds Bat / Pitch
Cleveland Indians Bat / Pitch
Colorado Rockies Bat / Pitch
Detroit Tigers Bat / Pitch
Florida Marlins Bat / Pitch
Houston Astros Bat / Pitch
Kansas City Royals Bat / Pitch
Los Angeles Angels Bat / Pitch
Los Angeles Dodgers Bat / Pitch
Milwaukee Brewers Bat / Pitch
Minnesota Twins Bat / Pitch
New York Mets Bat / Pitch
New York Yankees Bat / Pitch
Oakland Athletics Bat / Pitch
Philadelphia Phillies Bat / Pitch
Pittsburgh Pirates Bat / Pitch
St. Louis Cardinals Bat / Pitch
San Diego Padres Bat / Pitch
San Francisco Giants Bat / Pitch
Seattle Mariners Bat / Pitch
Tampa Bay Devil Rays Bat / Pitch
Texas Rangers Bat / Pitch
Toronto Blue Jays Bat / Pitch
Washington Nationals Bat / Pitch
All-Star Links
Official Websites
News and Notes
Baseball News Blog
Baseball Newstand
ESPN Baseball
Fox Sports Baseball
Pro Sports Daily
Roto World
The Roto Times
USA Today Baseball
Baseball Newstand
ESPN Baseball
Fox Sports Baseball
Pro Sports Daily
Roto World
The Roto Times
USA Today Baseball
Reference and Analysis
Baseball Almanac
Baseball America
Baseball Archive
Baseball Contracts
Baseball Cube
Baseball Graphs
Baseball Library
Baseball Musings Player Database
Baseball Page
Baseball Primer
Baseball Prospectus
Baseball Reference
Baseball Statistics
Baseball Truth
Boxscore Central
Diamond Mind Baseball
Doug's Stats
FanGraphs
Fast Balls (pitchfx catalog)
Hardball Dollars
Hardball Times
Hit Tracker
Retrosheet
Rotobase/Rotoblog
Stat Corner
STATS
Tango on Baseball
Yahoo Sports MLB
Web Gems
Bill James Primer
Sabermetric Manifesto (Grabiner)
Pitching and Defense (McCracken)
Pitching and Defense (Tippett)
Transactions Primer (Neyer)
Baseball Stats (Batter's Box)
Prospect Report (Cameron)
Pitcher Workloads (Sheehan)
Goodbye to Old Baseball Ideas (Rickey)
Sabermetric Manifesto (Grabiner)
Pitching and Defense (McCracken)
Pitching and Defense (Tippett)
Transactions Primer (Neyer)
Baseball Stats (Batter's Box)
Prospect Report (Cameron)
Pitcher Workloads (Sheehan)
Goodbye to Old Baseball Ideas (Rickey)
Columnists
Baseball Blogs
Around the Majors
Athletics Nation
Baseball Crank
Baseball Musings
Baseball-Reference Blog
Batter's Box
Big League Stew
Bronx Banter
Catfish Stew
Cub Town
Dan Agonistes
Dodger Thoughts
DRays Bay
Ducksnorts
Futility Infielder
Halos Heaven
Inside the Rockies
It Might Be Dangerous
Knuckle Curve
LoHud Yankees Blog
Lookout Landing
Management by Baseball
Metaforian
Metsgeek
Mike's Baseball Rants
Only Baseball Matters
Redbird Nation
Red Reporter
Sabernomics (Braves)
Seth Speaks
ShysterBall
6-4-2 (Angels/Dodgers)
The Book
TheCubdom
The Cutting Edge
The House That Dewey Built
The View From The Bleachers
Tiger Blog
U.S.S. Mariner
Viva El Birdos
Where's Kernan
Minor Leagues
Arizona Fall League
BA Player Finder
Cal Leaguers
Jamey Newberg
JDM's Scoresheet Baseball
Minor League Baseball
Minor League Park Factors
Minor League Splits
No Pepper
Sickels' Minor League Ball
Warm October Nights
BA Player Finder
Cal Leaguers
Jamey Newberg
JDM's Scoresheet Baseball
Minor League Baseball
Minor League Park Factors
Minor League Splits
No Pepper
Sickels' Minor League Ball
Warm October Nights
Amateur
Boyd's World (College)
Cape Cod Baseball League
College Baseball Blog
College Baseball Insider
Collegiate Baseball Newspaper
College Splits
College Splits Blog
Dirtbags Baseball (Long Beach State)
NCAA Baseball
NCBWA
Team One Baseball (High School)
Texas A&M & Baseball
Cape Cod Baseball League
College Baseball Blog
College Baseball Insider
Collegiate Baseball Newspaper
College Splits
College Splits Blog
Dirtbags Baseball (Long Beach State)
NCAA Baseball
NCBWA
Team One Baseball (High School)
Texas A&M & Baseball
Historical
Cuban Baseball
House of David
Jim "Mudcat" Grant's Web Page
Negro League Baseball Players Assoc
Negro Leagues Baseball Museum
1919 Black Sox
Pacific Coast League
Philadelphia Athletics Historical Society
Shoeless Joe Jackson Society
SABR-L Archives
Walter O'Malley
House of David
Jim "Mudcat" Grant's Web Page
Negro League Baseball Players Assoc
Negro Leagues Baseball Museum
1919 Black Sox
Pacific Coast League
Philadelphia Athletics Historical Society
Shoeless Joe Jackson Society
SABR-L Archives
Walter O'Malley
Miscellaneous
Forums
Credits
Ticket Center
Tickets to Baseball -
Premium Red Sox Tickets - Tickets to Marlins Games - Cardinals Game Tickets - NY Yankee Tickets - Tickets Oakland Athletics - Dallas Cowboys Tickets - Arizona Cardinals Tickets - Tickets Seattle Seahawks - Buffalo Bills Tickets Online - Tickets to Dolphins Football
Buy Boston Red Sox tickets,
Philadelphia Phillies tix,
NY Yankees tickets,
NY Mets tickets, and
MLB All Star game tickets at ABC tickets
Not sure where to find the best online sportsbooks? Start your search with PlayersJet.
Get deals at SportsMemorabilia.com on baseball apparel, including Phillies jerseys and more for adults and children.
Shop the largest selection baseball equipment on sale at Sports Unlimited. Check out tons of baseball gloves, youth baseball gloves and catchers gear from Rawlings, Wilson, Nike & Under Armour.
2011 Draft Order
Courtesy of Baseball America
First-Round:
 1. Pirates (57-105)
 2. Mariners (61-101)
 3. Diamondbacks (65-97)
 4. Orioles (66-96)
 5. Royals (67-95)
 6. Nationals (69-93)
 7. Diamondbacks (for B. Loux)
 8. Indians (69-93)
 9. Cubs (75-87)
10. Padres (for Karsten Whitson)
11. Astros (76-86)
12. Brewers (77-85)
13. Mets (79-83)
14. Marlins (80-82)
15. Brewers (for Dylan Covey)
16. Dodgers (80-82)
17. Angels (80-82)
18. Athletics (81-81)
19. Red Sox (from DET for Martinez)
20. Rockies (83-79)
21. Blue Jays (85-77)
22. Cardinals (86-76)
23. Nationals (from CWS for Dunn)
24. Rays (from BOS for Crawford)
25. Padres (90-72)
26. Red Sox (from TEX for Beltre)
27. Reds (91-71)
28. Braves (91-71)
29. Giants (92-70)
30. Twins (94-68)
31. Rays (from NYY for Soriano)
32. Rays (96-66)
33. Rangers (from PHI for Lee)
Supplemental First Round:
34. Nationals (Dunn)
35. Blue Jays (Downs)
36. Red Sox (Martinez)
37. Rangers (Lee)
38. Rays (Crawford)
39. Phillies (Werth)
40. Red Sox (Beltre)
41. Rays (Soriano)
42. Rays (Balfour)
43. Diamondbacks (LaRoche)
44. Mets (Feliciano)
45. Rockies (Dotel)
46. Blue Jays (Buck)
47. White Sox (Putz)
48. Padres (Garland)
49. Giants (Uribe)
50. Twins (Hudson)
51. Yankees (Vazquez)
52. Rays (Benoit)
53. Blue Jays (Olivo)
54. Padres (Torrealba)
55. Twins (Crain)
56. Rays (Choate)
57. Blue Jays (Gregg)
58. Padres (Correia)
59. Rays (Hawpe)
| Baseball Beat | January 09, 2007 |
Categorizing Pitchers (Part Two): Relievers
As a follow-up to yesterday's Categorizing Pitchers by Batted Ball Types and Strikeout Rates (which focused on starters), today's article is devoted exclusively to relievers.
The graph below includes strikeout and groundball data for every reliever in the majors (defined for this exercise as those with 30 or more innings who started less than one-third of the time). The y-axis is groundball percentage (GB%) and the x-axis is strikeouts per batter faced (K/BF). There are four quadrants with the mid-point equal to the average GB% of 43.30% and average K/BF of 18.63% for relievers. By comparison, starters had a mean GB% and K/BF rates of 43.8% and 15.88%, respectively. Interestingly, while the groundball rates were virtually the same, the average strikeout rate among relievers was 2.75 percentage points higher or 17.3%.
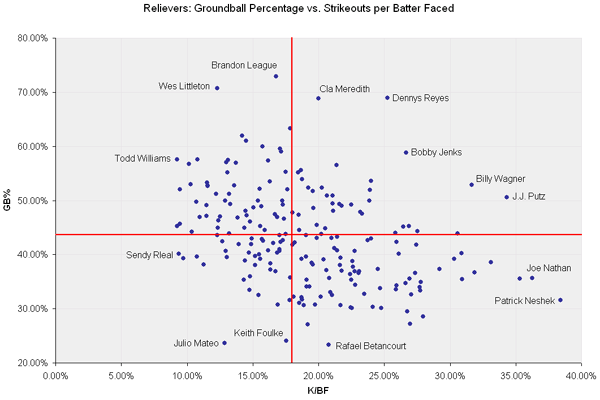
Graph courtesy of David Appelman, FanGraphs.
The average ERA among all qualifiers was 3.90. The average ERA for relievers with above-average K rates was 3.67. The average ERA for those with below-average K rates was 4.13. Similarly, the average ERA for relievers with above-average GB rates was 3.93, while the average ERA for those with below-average GB rates was 3.88.
The average ERA by quadrants:
       W        E
N     4.12     3.55
S     4.14     3.73
As shown, it appears as if groundball rates do not positively impact ERA for relievers - at least not in 2006. Instead, it's all about strikeouts. This is potentially a very interesting and enlightening conclusion.
The various results are also much tighter. As one would expect, the average ERA for each type was lower across the board for relievers than starters. But the disparity in average ERA between relievers with above-average and below-average K and GB rates is not as significant as it was for starters.
ERA is far from foolproof as a measurement of a relief pitcher's effectiveness. Win Probability Added (WPA) is arguably a better metric to use when evaluating relievers. That said, reliever ERA isn't worthless and is a decent indicator of performance.
Let's take a closer look at the results, beginning with the northeast quadrant and going clockwise. The pitchers are sorted by K/BF rates in the first three tables and by GB% in the last table.
NORTHEAST QUADRANT (ABOVE-AVG GB AND K RATES)
Name                    GB%     K/BF
J.J. Putz               50.55%  34.32%
Billy Wagner            52.84%  31.65%
Brad Lidge              43.85%  30.59%
Hong-Chih Kuo           44.30%  27.52%
Tom Gordon              45.28%  26.88%
Bobby Jenks             58.79%  26.67%
Luis Vizcaino           45.12%  26.47%
Taylor Tankersley       44.00%  25.84%
Dennys Reyes            68.99%  25.26%
Mike Wuertz             53.64%  24.00%
Scot Shields            51.93%  23.93%
Scott Williamson        50.00%  23.86%
Adam Wainwright         47.55%  23.30%
Greg Aquino             47.86%  23.18%
C.J. Wilson             49.18%  22.51%
John Grabow             48.97%  21.78%
Matt Thornton           49.33%  21.59%
Ambiorix Burgos         43.32%  21.43%
Fernando Rodney         56.54%  21.38%
Tim Hamulack            48.04%  21.12%
Pedro Feliciano         49.43%  21.09%
Heath Bell              50.85%  21.08%
Juan Rincon             50.92%  20.63%
Aaron Heilman           44.86%  20.51%
Akinori Otsuka          52.33%  20.26%
Jason Isringhausen      43.83%  20.23%
Cla Meredith            68.84%  20.00%
Manuel Corpas           45.45%  19.85%
Joe Kennedy             48.57%  19.59%
Ryan Dempster           51.74%  19.59%
Duaner Sanchez          52.32%  19.21%
Brendan Donnelly        43.62%  19.06%
Mariano Rivera          53.92%  18.77%
Scott Downs             55.60%  18.65%
As shown in the graph, J.J. Putz, Billy Wagner, Bobby Jenks, Dennys Reyes, and Cla Meredith stand out as outliers with significantly higher strikeout and/or groundball rates than the others. Brad Lidge's K rate (30.59%) is worth pointing out. I wouldn't give up on him. He pitched much better on the road (.202/.311/.271) than at home (.267/.350/.509). Anyone who dominated hitters the way he did away from Minute Maid Park can pitch on my team.
SOUTHEAST QUADRANT (BELOW-AVG GB AND ABOVE-AVG K RATES)
Name                    GB%     K/BF
Patrick Neshek          31.58%  38.41%
Joe Nathan              35.62%  36.26%
Takashi Saito           35.50%  35.31%
Francisco Rodriguez     38.55%  33.11%
B.J. Ryan               36.65%  31.85%
Jose Valverde           35.43%  30.94%
Jorge Julio             40.25%  30.88%
Jonathan Broxton        39.25%  30.31%
Jonathan Papelbon       37.35%  29.18%
Logan Kensing           28.57%  27.95%
Kiko Calero             34.90%  27.80%
Fernando Cabrera        33.33%  27.73%
Joel Zumaya             33.98%  27.71%
Scott Eyre              41.77%  27.44%
Mike Gonzalez           36.64%  27.35%
Trever Miller           32.58%  27.05%
Rafael Soriano          27.15%  26.97%
Scott Cassidy           35.51%  26.92%
Brian Sikorski          29.47%  26.76%
Brian Fuentes           34.73%  26.64%
Francisco Cordero       40.10%  26.09%
Kyle Farnsworth         34.25%  25.95%
Derrick Turnbow         42.38%  25.94%
Will Ohman              33.53%  25.87%
Justin Speier           30.07%  24.77%
Damaso Marte            33.80%  24.71%
Joaquin Benoit          37.27%  24.50%
George Sherrill         30.30%  24.14%
Alan Embree             42.95%  23.98%
Jason Frasor            42.66%  23.72%
Eddie Guardado          32.73%  23.49%
Huston Street           36.95%  23.10%
Dan Wheeler             36.55%  23.05%
Joe Nelson              34.45%  22.80%
Justin Duchscherer      36.88%  22.77%
Ron Mahay               40.63%  22.76%
Bob Howry               37.79%  22.61%
Tyler Johnson           38.78%  22.56%
Rick Helling            30.11%  22.54%
Chad Cordero            35.32%  22.48%
Jon Rauch               30.20%  22.45%
Arthur Rhodes           36.43%  22.43%
David Aardsma           36.99%  21.78%
Rudy Seanez             30.63%  21.69%
Scott Linebrink         39.37%  21.66%
Jimmy Gobble            38.04%  21.62%
Ramon Ramirez           40.72%  21.40%
Tyler Yates             41.18%  21.20%
Joe Borowski            32.50%  21.05%
Vinnie Chulk            43.07%  20.98%
Scott Proctor           33.00%  20.89%
Kevin Gregg             35.66%  20.82%
Rafael Betancourt       23.35%  20.78%
Emiliano Fruto          37.14%  20.61%
Randy Flores            39.06%  20.41%
Trevor Hoffman          32.24%  20.16%
Kurt Birkins            43.02%  19.85%
Ron Villone             30.74%  19.73%
Aaron Fultz             38.18%  19.56%
Brandon McCarthy        38.46%  19.49%
Kevin Correia           34.12%  19.32%
Russ Springer           27.06%  19.17%
Chris Ray               35.33%  19.10%
Guillermo Mota          34.12%  19.09%
Scott Dohmann           39.58%  19.05%
Jamie Walker            30.61%  18.88%
Joel Peralta            31.72%  18.75%
Jose Capellan           32.06%  18.71%
Andy Sisco              39.23%  18.71%
The outliers depict why Minnesota's bullpen was so effective last year. Just as Reyes was one of the standouts in the NE quadrant, Patrick Neshek and Joe Nathan head the group of relievers with above-average strikeout and below-average groundball rates. Add Juan Rincon (50.92% GB and 20.63% K/BF) and Jesse Crain (55.19%/18.46%) to the mix and the Twins received 307 relief innings at an ERA of 2.35.
SOUTHWEST QUADRANT (BELOW-AVG GB AND K RATES)
Name                    GB%     K/BF
Christopher Britton     31.06%  18.55%
Jeremy Accardo          42.27%  18.18%
Armando Benitez         32.20%  18.13%
Bob Wickman             41.76%  18.03%
Jonathan Sanchez        35.77%  17.84%
Jason Bergmann          31.55%  17.82%
Keith Foulke            24.05%  17.56%
Chad Paronto            42.60%  17.30%
Neal Cotts              42.29%  17.13%
Fernando Nieve          40.97%  17.03%
Matt Capps              40.65%  17.02%
Jeremi Gonzalez         30.77%  16.92%
Bryan Corey             40.34%  16.87%
Ken Ray                 36.89%  16.72%
Mike Stanton            42.11%  16.55%
Randy Messenger         38.38%  16.36%
Travis Harper           37.24%  16.33%
Brian Tallet            40.76%  16.16%
Roberto Novoa           42.56%  15.77%
Brandon Lyon            42.86%  15.70%
Tony Pena               39.22%  15.56%
Josh Hancock            40.08%  15.48%
Bruce Chen              32.56%  15.45%
Danys Baez              39.68%  15.18%
Ryan Vogelsong          38.02%  15.17%
Esteban Yan             42.98%  14.91%
Brandon Medders         41.88%  14.87%
David Riske             35.97%  14.81%
Wil Ledezma             33.51%  14.77%
Roman Colon             40.31%  14.71%
Fabio Castro            38.89%  14.40%
Jorge Sosa              35.34%  14.31%
Jake Woods              41.95%  13.95%
Chad Gaudin             39.49%  13.04%
Jon Adkins              40.70%  12.93%
Julio Mateo             23.63%  12.86%
Danny Miceli            42.42%  12.68%
Brian Meadows           38.13%  11.25%
Mike Timlin             39.65%  10.75%
Brian Sweeney           39.27%   9.70%
Sendy Rleal             40.13%   9.36%
Except for a few closers who have fallen from grace, this is a pretty non-descript group of pitchers. I don't think I would want to bank on any of these relievers. Sendy Rleal should give thanks for having had the opportunity to pitch in the big leagues last year. It would be one thing if he was a left-hander but a RHP with a K/BF rate of less than 10% has almost no chance to survive at this level.
NORTHWEST QUADRANT (ABOVE-AVG GB AND BELOW-AVG K RATES)
Name                    GB%     K/BF
Brandon League          72.87%  16.76%
Wes Littleton           70.75%  12.32%
Chad Bradford           63.30%  17.86%
Ryan Wagner             62.00%  14.18%
Rick White              60.98%  14.49%
Chad Qualls             60.00%  15.73%
Fausto Carmona          59.58%  17.06%
Scott Feldman           59.06%  17.14%
Todd Williams           57.56%   9.23%
Sean Green              57.55%  10.79%
Scott Schoeneweis       57.50%  13.12%
Shawn Camp              57.32%  16.16%
Julian Tavarez          57.01%  12.99%
J.C. Romero             56.97%  13.72%
Joe Beimel              56.78%  10.17%
Salomon Torres          55.24%  17.52%
Jesse Crain             55.19%  18.46%
Brad Thompson           55.14%  13.06%
Chad Harville           53.49%  16.30%
Christopher Sampson     53.27%  11.54%
Todd Jones              52.94%  10.29%
Gary Majewski           52.77%  13.61%
Rick Bauer              52.77%  11.59%
Ray King                52.67%  11.56%
Edwin Jackson           52.10%  15.52%
Mike Wood               52.05%   9.45%
Todd Coffey             52.03%  17.65%
Danny Kolb              51.22%  12.21%
Brian Shouse            51.20%  13.22%
Hector Carrasco         50.00%  17.27%
Geoff Geary             50.00%  15.38%
Lance Cormier           50.00%  12.91%
Jeremy Affeldt          49.70%  10.71%
Braden Looper           49.36%  13.31%
Tom Martin              49.20%  17.29%
Jon Switzer             49.14%  11.46%
Todd Wellemeyer         48.92%  15.65%
Jason Davis             48.66%  15.04%
Matt Belisle            48.06%  14.44%
Darren Oliver           47.76%  18.02%
Mike Myers              47.42%  16.67%
Macay McBride           47.31%  18.47%
Steve Kline             47.20%  14.54%
Jason Grilli            47.09%  11.48%
Ryan Franklin           47.06%  12.54%
Roberto Hernandez       46.97%  16.84%
Matt Herges             46.88%  10.98%
Oscar Villarreal        46.86%  13.85%
Dave Borkowski          46.58%  17.39%
Jose Mesa               46.32%  12.38%
Saul Rivera             46.11%  14.80%
William Eyre            45.62%   9.45%
Elmer Dessens           45.28%  15.57%
Rheal Cormier           45.28%   9.27%
Matt Guerrier           44.96%  12.33%
Matt Wise               44.93%  14.36%
Manny Delcarmen         44.57%  18.52%
David Weathers          44.55%  15.92%
LaTroy Hawkins          44.24%  10.34%
Ruddy Lugo              43.91%  13.22%
Bill Bray               43.83%  17.49%
Brad Halsey             43.61%  12.30%
Craig Hansen            43.55%  17.05%
Brandon League is intriguing. The groundball specialist could become a highly effective set-up man or perhaps even a closer if he can improve his K rate from 16.76% toward 20%. He made huge strides in 2006 and won't turn 24 until March. League was death on RHB (.178/.239/.238) and handled LHB (.276/.323/.362) admirably as well.
In addition to the notes I made at the end of yesterday's article, be aware of the small sample size caveat when it comes to relief pitchers. However, the aggregate results are statistically relevant with more than 10,000 innings measured.
Comments
Brandon League will be replacing Speier as BJ Ryan's setup man in Toronto. Some see the second coming of Duane Ward.
Posted by: Garth Iorg at January 9, 2007 9:13 AM
Rich,
Great stuff, once again.
I would also like to see how GB% affects inherited runners scored %. It would seem to be a given that K% has an inverse correlation with inherited runners scored %, but I'm not sure how GB% would relate (in lieu of the above data). I would certainly think that GIDP would play a factor, but bringing the infield in and other late-and-close game strategies might have unpredictable effects, as well.
Posted by: Redders at January 9, 2007 9:27 AM
Wow. Dennys Reyes. Honestly, I had no idea.
Posted by: Kent Bonham at January 9, 2007 1:02 PM
"Some see the second coming of Duane Ward."
And they all live in Toronto?
For the most part the hype about relief prospects is disappointing. Jose Cappellan. Joey Devine. Craig Hansen. Santiago Casilla/Jairo Garcia/Dr. Van Nostrum.
Posted by: APing at January 11, 2007 1:13 AM