Rich Lederer • Baseball Beat
Patrick Sullivan • Change-Up
Jeremy Greenhouse • Touching Bases
Dave Allen • F/X Visualizations
Sky Andrecheck • Behind the Scoreboard
Marc Hulet • Around the Minors
Al Doyle • Past Times
Retired Uniforms:
Bryan Smith • WTNY
Joe Sheehan • Command Post
Jeff Albert • The Batter's Eye
RSS Feed
Home
*Examining the Past, Present, and Future*
Lineup Card
Recent Entries
» Putting Together a Reality Team
» Historical Hall of Fame Vote Comparisons: 2012
» An All-Christmas Team
» The New-Look Angels
» John Denny: The Forgotten Cy Young Award Winner
» Money Isn't Everything
» What Would It Take to Hit .400 in the 21st Century?
» Halos Heaven
» Brandon McCarthy's Breakout Season
» Link-o-Rama
» Historical Hall of Fame Vote Comparisons: 2012
» An All-Christmas Team
» The New-Look Angels
» John Denny: The Forgotten Cy Young Award Winner
» Money Isn't Everything
» What Would It Take to Hit .400 in the 21st Century?
» Halos Heaven
» Brandon McCarthy's Breakout Season
» Link-o-Rama
Best of Baseball Beat
Abstracts From the Abstracts
1977 Baseball Abstract
1978 Baseball Abstract
1979 Baseball Abstract
1980 Baseball Abstract
1981 Baseball Abstract
1982 Baseball Abstract
1983 Baseball Abstract
1984 Baseball Abstract
1985 Baseball Abstract
1986 Baseball Abstract
1987 Baseball Abstract
1988 Baseball Abstract
1978 Baseball Abstract
1979 Baseball Abstract
1980 Baseball Abstract
1981 Baseball Abstract
1982 Baseball Abstract
1983 Baseball Abstract
1984 Baseball Abstract
1985 Baseball Abstract
1986 Baseball Abstract
1987 Baseball Abstract
1988 Baseball Abstract
Bert Blyleven Series
Meeting Up and Hanging Out with Bert
The Results Are In And...
Aficionado Heavily Invested in Blyleven
Latest on Blyleven's Chances for the HOF
The Internet Zealot Responds
400 Down and 5 to Go...
Bert Be Home By Eleven?
Blyleven's Forgotten Season (1973)
HeyMan, Your Comments Don't Hold Water
The Waiting is the Hardest Part
Another Addition to the Blyleven Series
Search for the Truth
As Dominant as His HOF Contemporaries
Listen, Buster
A Larger Step for Blyleven
Answering the Naysayers (Part Two)
Another Small Step for Blyleven
Q&A: Blyleven on the Twins
The Majority Rules, Right?
It's All Dutch to Some
The Hall of Fame Case for Bert Blyleven
Q&A: Blyleven on Felix Hernandez
Clemens Rocketing Up Charts
Poz: An Interview With a KC Star
A HOF Chat with Tracy Ringolsby
Up Close and Personal
A Peek Into the Mind of a HOF Voter
Answering the Naysayers
It's That Time of the Year (Again)
"If Cooperstown is Calling..."
The Bert Alert
One Small Step for Blyleven...
Only the Lonely
Exclusive Interviews
Lee Sinins
Alex Belth
David Pinto
Will Carroll
Mike Carminati
Aaron Gleeman
Joe Sheehan
Jay Jaffe
Jeff Peek
Tracy Ringolsby
Joe Posnanski
Bill James Part I, II, III
Jon Lalonde
Chuck Tiffany
Dayn Perry
Fay Vincent
Nate Silver
Alex Belth
David Pinto
Will Carroll
Mike Carminati
Aaron Gleeman
Joe Sheehan
Jay Jaffe
Jeff Peek
Tracy Ringolsby
Joe Posnanski
Bill James Part I, II, III
Jon Lalonde
Chuck Tiffany
Dayn Perry
Fay Vincent
Nate Silver
Bullpen
Rich Lederer
The Odd Couple (with Alex Belth)
The MostUnder Over Underrated Player in Baseball (with Brian Gunn)
Three Wise Men (roundtable by Alex Belth)
Infrequently Asked Questions (interview with Matt Welch)
Interview (Orioles Think Tank)
Bernie and the Yanks (Bronx Banter)
Hope and Faith: How the LAA Win the World Series (Baseball Prospectus)
NL West (The Soul of Baseball)
Greatest Living Hitter? (Sports Illustrated)
Roundtable: 2008 HOF Ballot (Armchair GM)
The Most
Three Wise Men (roundtable by Alex Belth)
Infrequently Asked Questions (interview with Matt Welch)
Interview (Orioles Think Tank)
Bernie and the Yanks (Bronx Banter)
Hope and Faith: How the LAA Win the World Series (Baseball Prospectus)
NL West (The Soul of Baseball)
Greatest Living Hitter? (Sports Illustrated)
Roundtable: 2008 HOF Ballot (Armchair GM)
Patrick Sullivan
Designated Hitters
David Bromberg (Q&A: John Denny)
Mark Armour (H. Killebrew and Versatility)
Joe Lederer (Soundtrack of a Prospect)
David Bromberg (Clemente's Autograph)
David Bromberg (Woody Fryman)
D. Baumstein (WAR Against Age: Pitchers)
Doug Baumstein (The WAR Against Age)
Doug Baumstein (A Lifetime on the Road)
John Fraser (Pick Six)
Mark Armour (How to Score More Runs?)
Bill Parker (What Opening Day Tells Us)
Stan Opdyke (Pat Rispole)
Chris Jaffe (Evaluating Baseball's Mgrs)
Stan Opdyke (Baseball Radio in NYC, 1953)
A. Nathan (Performance of Baseball Bats)
Michael Weddell (Edgar Martinez/HOF)
Jon Weisman (100 Things Dodgers Fans...)
Stan Opdyke (Connie Mack and Vin Scully)
Eric Walker (Evaluating Run Production)
Brent Mayne (The Intangibles of Catching)
Chris Moore (Best Fastballs in Baseball)
Dave Baldwin (The Batter’s Brain)
Shawn Haviland (Ivy League to MLB)
Larry Granillo (Walking Off)
Rob Iracane (Solo HR Won't Break You)
Tommy Bennett (Charm of AM Radio)
Harry Pavlidis (Johan Santana's Fast Start)
John Walsh (WAR and Remembrance)
Eric Walker (Precisely Inaccurate)
Bob Timmermann (As They See 'Em)
Geoff Young (Unicycles and Delusions)
Baseball Analysis at Tufts (Groundballers)
Baseball Analysis at Tufts (GB Out Rates)
G. Rybarczyk ('09 Hit Tracker Projections)
Joe Lederer (Curt Schilling/HoF)
Conor Gallagher (Hall of Fallacies)
Chris Green (Jim Rice, HoF, the Numbers)
Shawn Hoffman (Baseball's Bear Mkt?)
Paul Anthony (Manny Syndrome)
Ross Roley (World Series Odds)
B. Timmermann (Catcher's Interference)
R.J. Anderson (Waiting the Hardest Part)
Maury Brown (Cubs, MLB, and Cuban...)
Myron Logan (Dee-Fense, Dee-Fense)
Craig Calcaterra (Frivolity, Part I, Part II)
Chad Finn (Ode to Baseball Cards)
David Cameron (Mariners Foibles)
Chris Dial (Chipper Jones)
Pat Lederer (Memory Lane)
David Appelman (Clutch Pitching)
Bob Rittner (DH)
Jonathan Mayo (Roger Clemens)
Lisa Winston (My Son-in-Law...)
Russ McQueen (The Yellow Hammer)
Bob Rittner (I'm OK, You're OK)
Mark Armour (In Defense of the HOF)
Pat Jordan (Friends)
Dan Levitt (Analysis of Terry Ryan)
Doug Baumstein (Trading Econ 101)
Ross Roley (Runner's Reluctance II)
Ross Roley (Runner's Reluctance I)
Mark Armour (No-Longer Lovable Sox)
Bruce Regal (Stealthy and Wise)
Brian Gunn (Roid Monster)
Current/McEvoy (Value of the SB)
John Rickert (Sinister Thefts)
Nate Silver (Sabermetrics)
David Vincent (Home Run Production)
Joe P. Sheehan (Enhanced Gameday II)
Mark Armour (An Ode to Sport)
David Gassko (All-Time Worm Burners)
Joe P. Sheehan (Enhanced Gameday)
John Walsh (When Titans Clash)
Fox/Williams (Quantifying Coaches II)
Fox/Williams (Quantifying Coaches I)
Jacob Luft (Bull Durham Rant)
Chad Finn (Strat-O-Matic)
Lisa Winston (Rotisserie Baseball)
Dave Studeman (Baseball Stats)
Steve Treder (Roger Craig)
Marc Normandin (Jeff Bagwell)
D. Appelman (Expanding Strike Zone)
Jeff Sackmann (Worst MiL Defenders)
Jeff Sackmann (Best MiL Defenders)
Maxwell Kates (Van Lingle Mungo)
David Appelman (Pitch Location)
Kent Bonham (Danny Ray Herrera)
Glenn Stout (Two Baseball Poems)
Bruce Regal (The Challenge Round)
Mark Lamster (Barry & Ty)
Geoff Young (NL West)
Tom Lederer (The Ryan Express)
Brian Erts (Great Leap Forward)
David Pinto (Parity and the N.L.)
Jacob Luft (Fathers and Daughters)
Jamey Newberg (Pete's Sake)
Jeff Albert (A. Jones Swing Analysis)
Jeff Albert (A-Rod Swing Analysis)
Keith Law (Death, Taxes, and Waivers)
Peter Abraham (Tales of Torre Tales)
Larry Borowsky (Let 'er Rip II)
Dan Levitt (Empirical Analysis of Bunting)
Jonah Keri (If I Met Warren Cromartie...)
Bob Klapisch (War Stories)
Bob Timmermann (John F. Kennedy HS)
Kent Bonham (Aluminum Adjustments)
Al Doyle (More Than Superstars)
Ross Roley (Instant Replay)
David Vincent (Barry Bonds Homers)
Chad Finn (Our Favorite Obscurities)
Bill Deane (1979 NL MVP)
Mark Armour (Rise/Fall of Artificial Turf)
Jeff Angus (Wally Moon Camp)
David Berri (Money and Baseball)
Larry Borowsky (Baseball w/o the #s)
Derek Zumsteg (The Irrational Market)
David Regan (Free Agent Contracts)
Peter Schmuck (Steroids and the HOF)
David Appelman (Pitchers, Pitch by Pitch)
Dan Fox (Swinging, Taking, Fouling, Etc)
Patrick Sullivan (Study of NYY CF/BOS LF)
Will Leitch (Baseball Journalism)
Jeff Sullivan (Pitcher Release Points)
Steve Treder ('69-'70 Giants)
Maury Brown (Charlie Finley)
John Brattain (Bob Johnson)
Bob Klapisch (The Case for Bert Blyleven)
Jeff Peek (Pride and Prejudice)
Dayn Perry (Bert and Warren)
Rob Neyer (If Don Sutton Was Great...)
Lisa Winston (Minor League Memories)
Alex Belth (Otis Redding Was Right)
David Cameron (Long Live the King)
Jeff Angus (Baserunning Study)
Bert Blyleven (Baseball Playoffs)
Boyd Nation (Not a Prospect List)
James Click (Batters-Baserunners Study)
Jeff Shaw (Why I Love Baseball)
David Gassko (BIP/BFP Fielding Study)
Jay Jaffe (Milwaukee Sausage Race)
Jamey Newberg (Remember When)
Bob Klapisch (Press Box to the Mound)
Dan Levitt (Predictive Value of BB)
David Vincent (Official Scorer)
Jon Weisman (Rick Monday)
Larry Borowsky (Let 'er Rip)
Will Carroll (Fictional Short Story)
Bob Timmermann (Japanese Baseball)
Cyril Morong (Best Pitching Seasons)
Sean Forman (Monte Carlo Win-Loss)
Brian Gunn (My Little Blue Book)
Joe Lederer (My Dad and Baseball)
Bill Deane (Bob Gibson, 1968)
Mark Armour (1977 Yankees)
Darren Viola (Retrosheet)
David Pinto (RFK)
Dayn Perry (Brave Heart)
Matt Welch (Dave Hansen)
Kevin Kernan (Jack McKeon)
Tom Lederer (Dodgers Road Trip)
Steve Lombardi (Slider)
Studes (Picturing Baseball)
Mike Carminati (Luck of the Drawl)
Eric Neel (Vin Scully)
J.C. Bradbury (Leo Mazzone)
John Sickels (Bill James)
Search Baseball Analysts
Archives
By Category:
Around the Majors Content Only
Around the Minors Content Only
Baseball Beat Content Only
Baseball Beat/Change-Up Content Only
Baseball Beat/WTNY Content Only
Behind the Scoreboard Content Only
Change-Up Content Only
Change-Up/Around the Majors Content Only
Command Post Content Only
Crunching the Numbers Content Only
Designated Hitter Content Only
F/X Visualizations Content Only
Past Times Content Only
Saber Talk Content Only
The Batter's Eye Content Only
Touching Bases Content Only
Weekend Blog Content Only
WTNY Content Only
By Month:
February 2012
January 2012
December 2011
October 2011
September 2011
August 2011
July 2011
June 2011
May 2011
April 2011
March 2011
February 2011
January 2011
December 2010
November 2010
October 2010
September 2010
August 2010
July 2010
June 2010
May 2010
April 2010
March 2010
February 2010
January 2010
December 2009
November 2009
October 2009
September 2009
August 2009
July 2009
June 2009
May 2009
April 2009
March 2009
February 2009
January 2009
December 2008
November 2008
October 2008
September 2008
August 2008
July 2008
June 2008
May 2008
April 2008
March 2008
February 2008
January 2008
December 2007
November 2007
October 2007
September 2007
August 2007
July 2007
June 2007
May 2007
April 2007
March 2007
February 2007
January 2007
December 2006
November 2006
October 2006
September 2006
August 2006
July 2006
June 2006
May 2006
April 2006
March 2006
February 2006
January 2006
December 2005
November 2005
October 2005
September 2005
August 2005
July 2005
June 2005
May 2005
April 2005
March 2005
February 2005
January 2005
December 2004
November 2004
October 2004
September 2004
August 2004
July 2004
June 2004
May 2004
April 2004
March 2004
February 2004
January 2004
December 2003
November 2003
October 2003
September 2003
August 2003
July 2003
June 2003
Reference
Organizational Stats
Arizona Diamondbacks Bat / Pitch
Atlanta Braves Bat / Pitch
Baltimore Orioles Bat / Pitch
Boston Red Sox Bat / Pitch
Chicago Cubs Bat / Pitch
Chicago White Sox Bat / Pitch
Cincinnati Reds Bat / Pitch
Cleveland Indians Bat / Pitch
Colorado Rockies Bat / Pitch
Detroit Tigers Bat / Pitch
Florida Marlins Bat / Pitch
Houston Astros Bat / Pitch
Kansas City Royals Bat / Pitch
Los Angeles Angels Bat / Pitch
Los Angeles Dodgers Bat / Pitch
Milwaukee Brewers Bat / Pitch
Minnesota Twins Bat / Pitch
New York Mets Bat / Pitch
New York Yankees Bat / Pitch
Oakland Athletics Bat / Pitch
Philadelphia Phillies Bat / Pitch
Pittsburgh Pirates Bat / Pitch
St. Louis Cardinals Bat / Pitch
San Diego Padres Bat / Pitch
San Francisco Giants Bat / Pitch
Seattle Mariners Bat / Pitch
Tampa Bay Devil Rays Bat / Pitch
Texas Rangers Bat / Pitch
Toronto Blue Jays Bat / Pitch
Washington Nationals Bat / Pitch
All-Star Links
Official Websites
News and Notes
Baseball News Blog
Baseball Newstand
ESPN Baseball
Fox Sports Baseball
Pro Sports Daily
Roto World
The Roto Times
USA Today Baseball
Baseball Newstand
ESPN Baseball
Fox Sports Baseball
Pro Sports Daily
Roto World
The Roto Times
USA Today Baseball
Reference and Analysis
Baseball Almanac
Baseball America
Baseball Archive
Baseball Contracts
Baseball Cube
Baseball Graphs
Baseball Library
Baseball Musings Player Database
Baseball Page
Baseball Primer
Baseball Prospectus
Baseball Reference
Baseball Statistics
Baseball Truth
Boxscore Central
Diamond Mind Baseball
Doug's Stats
FanGraphs
Fast Balls (pitchfx catalog)
Hardball Dollars
Hardball Times
Hit Tracker
Retrosheet
Rotobase/Rotoblog
Stat Corner
STATS
Tango on Baseball
Yahoo Sports MLB
Web Gems
Bill James Primer
Sabermetric Manifesto (Grabiner)
Pitching and Defense (McCracken)
Pitching and Defense (Tippett)
Transactions Primer (Neyer)
Baseball Stats (Batter's Box)
Prospect Report (Cameron)
Pitcher Workloads (Sheehan)
Goodbye to Old Baseball Ideas (Rickey)
Sabermetric Manifesto (Grabiner)
Pitching and Defense (McCracken)
Pitching and Defense (Tippett)
Transactions Primer (Neyer)
Baseball Stats (Batter's Box)
Prospect Report (Cameron)
Pitcher Workloads (Sheehan)
Goodbye to Old Baseball Ideas (Rickey)
Columnists
Baseball Blogs
Around the Majors
Athletics Nation
Baseball Crank
Baseball Musings
Baseball-Reference Blog
Batter's Box
Big League Stew
Bronx Banter
Catfish Stew
Cub Town
Dan Agonistes
Dodger Thoughts
DRays Bay
Ducksnorts
Futility Infielder
Halos Heaven
Inside the Rockies
It Might Be Dangerous
Knuckle Curve
LoHud Yankees Blog
Lookout Landing
Management by Baseball
Metaforian
Metsgeek
Mike's Baseball Rants
Only Baseball Matters
Redbird Nation
Red Reporter
Sabernomics (Braves)
Seth Speaks
ShysterBall
6-4-2 (Angels/Dodgers)
The Book
TheCubdom
The Cutting Edge
The House That Dewey Built
The View From The Bleachers
Tiger Blog
U.S.S. Mariner
Viva El Birdos
Where's Kernan
Minor Leagues
Arizona Fall League
BA Player Finder
Cal Leaguers
Jamey Newberg
JDM's Scoresheet Baseball
Minor League Baseball
Minor League Park Factors
Minor League Splits
No Pepper
Sickels' Minor League Ball
Warm October Nights
BA Player Finder
Cal Leaguers
Jamey Newberg
JDM's Scoresheet Baseball
Minor League Baseball
Minor League Park Factors
Minor League Splits
No Pepper
Sickels' Minor League Ball
Warm October Nights
Amateur
Boyd's World (College)
Cape Cod Baseball League
College Baseball Blog
College Baseball Insider
Collegiate Baseball Newspaper
College Splits
College Splits Blog
Dirtbags Baseball (Long Beach State)
NCAA Baseball
NCBWA
Team One Baseball (High School)
Texas A&M & Baseball
Cape Cod Baseball League
College Baseball Blog
College Baseball Insider
Collegiate Baseball Newspaper
College Splits
College Splits Blog
Dirtbags Baseball (Long Beach State)
NCAA Baseball
NCBWA
Team One Baseball (High School)
Texas A&M & Baseball
Historical
Cuban Baseball
House of David
Jim "Mudcat" Grant's Web Page
Negro League Baseball Players Assoc
Negro Leagues Baseball Museum
1919 Black Sox
Pacific Coast League
Philadelphia Athletics Historical Society
Shoeless Joe Jackson Society
SABR-L Archives
Walter O'Malley
House of David
Jim "Mudcat" Grant's Web Page
Negro League Baseball Players Assoc
Negro Leagues Baseball Museum
1919 Black Sox
Pacific Coast League
Philadelphia Athletics Historical Society
Shoeless Joe Jackson Society
SABR-L Archives
Walter O'Malley
Miscellaneous
Forums
Credits
Ticket Center
Tickets to Baseball -
Premium Red Sox Tickets - Tickets to Marlins Games - Cardinals Game Tickets - NY Yankee Tickets - Tickets Oakland Athletics - Dallas Cowboys Tickets - Arizona Cardinals Tickets - Tickets Seattle Seahawks - Buffalo Bills Tickets Online - Tickets to Dolphins Football
Buy Boston Red Sox tickets,
Philadelphia Phillies tix,
NY Yankees tickets,
NY Mets tickets, and
MLB All Star game tickets at ABC tickets
Not sure where to find the best online sportsbooks? Start your search with PlayersJet.
Get deals at SportsMemorabilia.com on baseball apparel, including Phillies jerseys and more for adults and children.
Shop the largest selection baseball equipment on sale at Sports Unlimited. Check out tons of baseball gloves, youth baseball gloves and catchers gear from Rawlings, Wilson, Nike & Under Armour.
2011 Draft Order
Courtesy of Baseball America
First-Round:
 1. Pirates (57-105)
 2. Mariners (61-101)
 3. Diamondbacks (65-97)
 4. Orioles (66-96)
 5. Royals (67-95)
 6. Nationals (69-93)
 7. Diamondbacks (for B. Loux)
 8. Indians (69-93)
 9. Cubs (75-87)
10. Padres (for Karsten Whitson)
11. Astros (76-86)
12. Brewers (77-85)
13. Mets (79-83)
14. Marlins (80-82)
15. Brewers (for Dylan Covey)
16. Dodgers (80-82)
17. Angels (80-82)
18. Athletics (81-81)
19. Red Sox (from DET for Martinez)
20. Rockies (83-79)
21. Blue Jays (85-77)
22. Cardinals (86-76)
23. Nationals (from CWS for Dunn)
24. Rays (from BOS for Crawford)
25. Padres (90-72)
26. Red Sox (from TEX for Beltre)
27. Reds (91-71)
28. Braves (91-71)
29. Giants (92-70)
30. Twins (94-68)
31. Rays (from NYY for Soriano)
32. Rays (96-66)
33. Rangers (from PHI for Lee)
Supplemental First Round:
34. Nationals (Dunn)
35. Blue Jays (Downs)
36. Red Sox (Martinez)
37. Rangers (Lee)
38. Rays (Crawford)
39. Phillies (Werth)
40. Red Sox (Beltre)
41. Rays (Soriano)
42. Rays (Balfour)
43. Diamondbacks (LaRoche)
44. Mets (Feliciano)
45. Rockies (Dotel)
46. Blue Jays (Buck)
47. White Sox (Putz)
48. Padres (Garland)
49. Giants (Uribe)
50. Twins (Hudson)
51. Yankees (Vazquez)
52. Rays (Benoit)
53. Blue Jays (Olivo)
54. Padres (Torrealba)
55. Twins (Crain)
56. Rays (Choate)
57. Blue Jays (Gregg)
58. Padres (Correia)
59. Rays (Hawpe)
| Baseball Beat | February 02, 2007 |
Categorizing Minor League Pitchers: Part Five - Triple-A
Part One: The Starters
Part Two: Low-A
Part Three: High-A
Part Four: Double-A
Today marks the final installment of our five-part series on categorizing minor league pitchers by strikeout and groundball rates. We end on a high note - or at least at the highest level in the minors - Triple-A (also known as AAA). The Triple-A classification comprises just two leagues: International (IL) and Pacific Coast (PCL).
Although there is a meaningful difference in league ERAs, the other "defense independent" numbers are more in-line with one another. Studying K/BF and GB% focuses on strikeout and home run rates rather than ERAs, allowing for a better "apples to apples" comparison among pitchers performing at the same level but in different leagues. The PCL is clearly the more friendly circuit for hitters but the impact on K, BB, and HR rates is minimal.
                  STARTERS                       RELIEVERS
         ERA    K/9    BB/9    HR/9  |   ERA    K/9    BB/9    HR/9
IL      4.03   6.46    3.03    0.82     3.53   7.71    3.40    0.67
PCL     4.46   6.62    3.25    0.95     4.27   7.72    3.81    0.87
Triple-A is somewhat unique in that most pitchers are working their way up to the big leagues while many others are either on their way down or are nothing more than what are known as AAAA caliber players (i.e., better than AAA but not quite good enough to cut it in MLB). Rule of thumb: pitchers under the age of 25 have a chance to make it big in the majors; hurlers in the 26-28 camp may have success but are even better candidates for AAAA; and those who are approaching their 30th birthdays are normally on their way back down or are minor league lifers.
The graph below includes strikeout and groundball data for every pitcher in Triple-A with 50 or more innings. The x-axis is strikeouts per batter faced (K/BF) and the y-axis is groundball percentage (GB%). The graph is divided into four quadrants with the mid-point equal to the average K/BF of 17.91% and the average GB% of 44.61%.
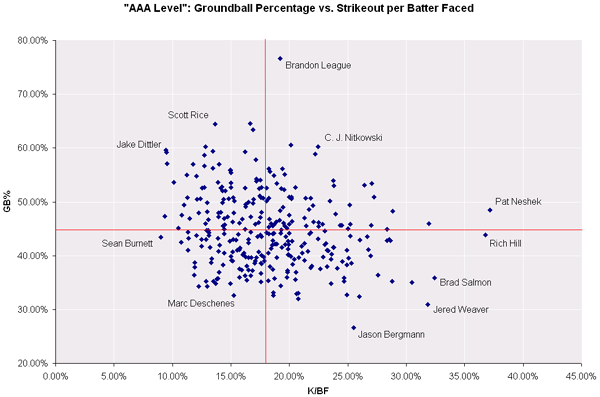
Sixty-two pitchers out of a total of 308 (or 20%) placed in the northeast quadrant. The following list includes the top half, ranked by K/BF.
NORTHEAST QUADRANT (ABOVE-AVG K AND GB RATES)
PITCHER            TEAM   LG    K/BF     GB%
Pat Neshek         MIN    IL    37.18%   48.48%
Colter Bean        NYY    IL    31.96%   46.00%
Shaun Marcum       TOR    IL    28.85%   48.23%
Hong-Chih Kuo      LAD    PCL   28.38%   44.93%
Jamie Shields      TB     IL    27.23%   50.89%
Josh Kinney        STL    PCL   27.05%   53.41%
Chad Billingsley   LAD    PCL   26.99%   45.65%
Dana Eveland       MIL    PCL   26.42%   53.05%
Tom Gorzelanny     PIT    IL    25.20%   45.88%
Scott Dunn         TB     IL    25.18%   49.45%
Brian Falkenborg   STL    PCL   25.00%   45.03%
Jason Windsor      OAK    PCL   24.50%   45.61%
Hayden Penn        BAL    IL    24.36%   45.61%
Renyel Pinto       FLA    PCL   23.94%   47.71%
Kevin Cameron      MIN    IL    23.81%   52.97%
Dustin McGowan     TOR    IL    23.76%   53.94%
Brian Slocum       CLE    IL    23.48%   50.20%
Erick Burke        SD     PCL   22.83%   45.85%
Ryan Houston       TOR    IL    22.52%   45.45%
J. P. Howell       TB     IL    22.48%   46.20%
C. J. Nitkowski    PIT    IL    22.44%   60.23%
Kason Gabbard      BOS    IL    22.22%   58.90%
Jason Hammel       TB     IL    22.08%   46.25%
Jake Robbins       CIN    IL    22.03%   49.36%
Nick Masset        TEX    PCL   21.81%   50.71%
Brad Clontz        FLA    PCL   21.69%   48.55%
Dustin Nippert     ARI    PCL   21.42%   45.52%
Jonathan Johnson   ATL    IL    21.40%   50.65%
Dennis Sarfate     MIL    PCL   21.31%   46.98%
Jose Rodriguez     TB     IL    20.53%   52.73%
Pat Neshek, who had the highest strikeout rate (37.18%) among all Triple-A pitchers, was called up to the majors by the Twins last summer and put up the highest K/BF (38.41%) among big-league hurlers as well. Increasing one's K rate after jumping any level, much less from AAA to the majors, is an impressive feat. The reliever with the funky sidearm delivery saw his groundball rate plummet from 48.48% to 31.58% once he reached Minnesota. His ability to get LHB out and keep the ball in the park will determine whether he can sustain his success at the highest level.
There were a number of other pitchers in the NE quadrant who made a positive impact for their parent clubs in the majors last year, including (among starters) Shaun Marcum (TOR), Hong-Chih Kuo and Chad Billingsley (LAD), Jamie Shields and J.P. Howell (TB), and Tom Gorzelanny (PIT). Several others got pounded upon their promotion, most notably Hayden Penn, who went 0-4 with a 15.10 ERA, lowlighted by 38 hits and 8 HR, 13 BB, and 8 SO in 19.2 IP.
Although not shown in the table above, another relief pitcher - Brandon League - was an outlier in terms of K/GB at AAA and MLB. Like Neshek, League was featured last month when I covered major-league starters and relievers. An extreme groundball pitcher, the 24-year-old set-up man for the Blue Jays saw his K (19.20% AAA/16.76% MLB) and GB (76.65%/72.87%) rates hold up rather well in Toronto.
Eighty-nine pitchers (or 29%) placed in the southeast quadrant. The top third are listed below.
SOUTHEAST QUADRANT (ABOVE-AVG K AND BELOW-AVG GB RATES)
PITCHER            TEAM   LG    K/BF     GB%
Rich Hill          CHC    PCL   36.78%   43.84%
Brad Salmon        CIN    IL    32.43%   35.88%
Jered Weaver       LAA    PCL   31.85%   30.89%
Julio Manon        BAL    IL    30.50%   35.00%
Winston Abreu      BAL    IL    28.78%   35.26%
Craig Breslow      BOS    IL    28.62%   42.77%
Travis Hughes      WAS    PCL   28.52%   43.02%
Jose Veras         NYY    IL    28.33%   42.77%
Jonah Bayliss      PIT    IL    27.59%   36.43%
Francisco Cruceta  SEA    PCL   26.97%   39.95%
Matt Roney         OAK    PCL   26.75%   41.10%
Marty McLeary      PIT    IL    26.68%   43.51%
Edinson Volquez    TEX    PCL   26.05%   42.90%
Aquilino Lopez     SD     PCL   25.99%   32.40%
Jason Bergmann     WAS    PCL   25.51%   26.67%
Mike Meyers        MIL    PCL   25.29%   38.55%
Eric Hull          LAD    PCL   25.23%   43.63%
Anthony Reyes      STL    PCL   25.08%   39.50%
Angel Guzman       CHC    PCL   24.92%   38.25%
Scott Strickland   PIT    IL    24.91%   32.68%
John Wasdin        TEX    PCL   24.90%   41.04%
Carlos Villanueva  MIL    PCL   24.68%   35.26%
Andy Cavazos       STL    PCL   24.66%   35.85%
Wayne Franklin     ATL    IL    24.53%   38.89%
John Danks         CWS    PCL   24.11%   37.63%
Robinson Tejeda    TEX    PCL   23.80%   41.51%
Mike Burns         CIN    IL    23.74%   41.51%
Kazuhito Tadano    OAK    PCL   23.62%   40.23%
Wilfredo Ledezma   DET    IL    23.57%   34.85%
Hyang-Nam Choi     CLE    IL    23.57%   39.33%
Rich Hill and Jered Weaver stand out not only for their performance in Triple-A, but both pitchers showed they could get big-league hitters out as well. Hill was featured on Monday when I looked at all starting pitchers in the minors with 90 or more innings. Weaver fell short of qualifying by 13 frames but thoroughly dominated AAA hitters in a tough league and ballpark for pitchers when he posted a 6-1 record with a 2.10 ERA and a 9.3 K/BB ratio. The 6-foot-7 righthander, who also placed in the southeast quadrant in the majors, went 11-2 with a 2.56 ERA in 19 GS covering 123 IP for the Angels.
Anthony Reyes was called up to the Cardinals and struggled during the regular season (5-8, 5.06) but redeemed himself by winning Game One of the World Series when he held the Tigers to only two runs in eight-plus innings.
Eighty-two pitchers (27%) landed in the northwest quadrant. The following table includes the top quartile.
NORTHWEST QUADRANT (ABOVE-AVG GB AND BELOW-AVG K RATES)
PITCHER            TEAM   LG    K/BF     GB%
Andy Mitchell      BAL    IL    16.67%   64.55%
Scott Rice         BAL    IL    13.67%   64.49%
Zach McClellan     COL    PCL   16.90%   63.38%
Jack Cassel        SD     PCL   12.83%   60.29%
Jake Dittler       CLE    IL     9.44%   59.58%
Jamie Vermilyea    TOR    IL    13.47%   59.39%
Kevin Gryboski     WAS    PCL   16.23%   59.30%
Shane Loux         KC     PCL    9.47%   59.22%
Danny Graves       CLE    IL    12.74%   58.72%
Terry Adams        PIT    IL    17.14%   57.82%
Beau Kemp          MIN    IL     9.51%   57.10%
Lance Cormier      ATL    IL    11.74%   56.99%
Chris Sampson      HOU    PCL   13.99%   56.97%
Clint Nageotte     SEA    PCL   12.72%   56.62%
Sun-Woo Kim        COL    PCL   13.45%   56.22%
Tim LaVigne        NYM    IL    14.94%   55.98%
Jason Scobie       TOR    IL    14.94%   55.79%
Joe Mays           CIN    IL    14.98%   55.45%
Franquelis Osoria  LAD    PCL   11.24%   55.00%
Brian O'Connor     ATL    IL    12.07%   54.80%
None of the starters in the above table strike my fancy as pitchers to watch. A number of them are older or perhaps back-of-the-bullpen types. However, there is one pitcher - Jeremy Sowers (14.29%/49.83%) - who fell into the northwest quadrant, although not shown, who has had success at every stop along the way, including his foray in the bigs last season. The crafty lefthander, who was the #1 pitching prospect in the International League (9-1, 1.39), went 7-4 with a 3.57 ERA for Cleveland. His K/9 rate has declined from 9.46 in A+ to 7.65 in AA to 4.99 in AAA to 3.57 in MLB. The good news is that it can't go down much more from that level.
Seventy-five pitchers (24%) found themselves in the southwest quadrant. The bottom six are listed below.
SOUTHWEST QUADRANT (BELOW-AVG GB AND K RATES)
PITCHER            TEAM   LG    K/BF     GB%
Sean Burnett       PIT    IL     9.00%   43.48%
Jerome Williams    WAS    PCL   10.77%   42.44%
Chris Michalak     CIN    IL    11.34%   40.97%
R. A. Dickey       TEX    PCL   11.34%   44.34%
Matt Wilhite       LAA    PCL   11.36%   43.17%
Randy Leek         STL    PCL   11.86%   36.36%
I'm not going to pan Sean Burnett and Jerome Williams again. They both received my wrath on Monday. In the spirit of double jeopardy, I will withhold any additional comments.