Rich Lederer • Baseball Beat
Patrick Sullivan • Change-Up
Jeremy Greenhouse • Touching Bases
Dave Allen • F/X Visualizations
Sky Andrecheck • Behind the Scoreboard
Marc Hulet • Around the Minors
Al Doyle • Past Times
Retired Uniforms:
Bryan Smith • WTNY
Joe Sheehan • Command Post
Jeff Albert • The Batter's Eye
RSS Feed
Home
*Examining the Past, Present, and Future*
Lineup Card
Recent Entries
» Putting Together a Reality Team
» Historical Hall of Fame Vote Comparisons: 2012
» An All-Christmas Team
» The New-Look Angels
» John Denny: The Forgotten Cy Young Award Winner
» Money Isn't Everything
» What Would It Take to Hit .400 in the 21st Century?
» Halos Heaven
» Brandon McCarthy's Breakout Season
» Link-o-Rama
» Historical Hall of Fame Vote Comparisons: 2012
» An All-Christmas Team
» The New-Look Angels
» John Denny: The Forgotten Cy Young Award Winner
» Money Isn't Everything
» What Would It Take to Hit .400 in the 21st Century?
» Halos Heaven
» Brandon McCarthy's Breakout Season
» Link-o-Rama
Best of Baseball Beat
Abstracts From the Abstracts
1977 Baseball Abstract
1978 Baseball Abstract
1979 Baseball Abstract
1980 Baseball Abstract
1981 Baseball Abstract
1982 Baseball Abstract
1983 Baseball Abstract
1984 Baseball Abstract
1985 Baseball Abstract
1986 Baseball Abstract
1987 Baseball Abstract
1988 Baseball Abstract
1978 Baseball Abstract
1979 Baseball Abstract
1980 Baseball Abstract
1981 Baseball Abstract
1982 Baseball Abstract
1983 Baseball Abstract
1984 Baseball Abstract
1985 Baseball Abstract
1986 Baseball Abstract
1987 Baseball Abstract
1988 Baseball Abstract
Bert Blyleven Series
Meeting Up and Hanging Out with Bert
The Results Are In And...
Aficionado Heavily Invested in Blyleven
Latest on Blyleven's Chances for the HOF
The Internet Zealot Responds
400 Down and 5 to Go...
Bert Be Home By Eleven?
Blyleven's Forgotten Season (1973)
HeyMan, Your Comments Don't Hold Water
The Waiting is the Hardest Part
Another Addition to the Blyleven Series
Search for the Truth
As Dominant as His HOF Contemporaries
Listen, Buster
A Larger Step for Blyleven
Answering the Naysayers (Part Two)
Another Small Step for Blyleven
Q&A: Blyleven on the Twins
The Majority Rules, Right?
It's All Dutch to Some
The Hall of Fame Case for Bert Blyleven
Q&A: Blyleven on Felix Hernandez
Clemens Rocketing Up Charts
Poz: An Interview With a KC Star
A HOF Chat with Tracy Ringolsby
Up Close and Personal
A Peek Into the Mind of a HOF Voter
Answering the Naysayers
It's That Time of the Year (Again)
"If Cooperstown is Calling..."
The Bert Alert
One Small Step for Blyleven...
Only the Lonely
Exclusive Interviews
Lee Sinins
Alex Belth
David Pinto
Will Carroll
Mike Carminati
Aaron Gleeman
Joe Sheehan
Jay Jaffe
Jeff Peek
Tracy Ringolsby
Joe Posnanski
Bill James Part I, II, III
Jon Lalonde
Chuck Tiffany
Dayn Perry
Fay Vincent
Nate Silver
Alex Belth
David Pinto
Will Carroll
Mike Carminati
Aaron Gleeman
Joe Sheehan
Jay Jaffe
Jeff Peek
Tracy Ringolsby
Joe Posnanski
Bill James Part I, II, III
Jon Lalonde
Chuck Tiffany
Dayn Perry
Fay Vincent
Nate Silver
Bullpen
Rich Lederer
The Odd Couple (with Alex Belth)
The MostUnder Over Underrated Player in Baseball (with Brian Gunn)
Three Wise Men (roundtable by Alex Belth)
Infrequently Asked Questions (interview with Matt Welch)
Interview (Orioles Think Tank)
Bernie and the Yanks (Bronx Banter)
Hope and Faith: How the LAA Win the World Series (Baseball Prospectus)
NL West (The Soul of Baseball)
Greatest Living Hitter? (Sports Illustrated)
Roundtable: 2008 HOF Ballot (Armchair GM)
The Most
Three Wise Men (roundtable by Alex Belth)
Infrequently Asked Questions (interview with Matt Welch)
Interview (Orioles Think Tank)
Bernie and the Yanks (Bronx Banter)
Hope and Faith: How the LAA Win the World Series (Baseball Prospectus)
NL West (The Soul of Baseball)
Greatest Living Hitter? (Sports Illustrated)
Roundtable: 2008 HOF Ballot (Armchair GM)
Patrick Sullivan
Designated Hitters
David Bromberg (Q&A: John Denny)
Mark Armour (H. Killebrew and Versatility)
Joe Lederer (Soundtrack of a Prospect)
David Bromberg (Clemente's Autograph)
David Bromberg (Woody Fryman)
D. Baumstein (WAR Against Age: Pitchers)
Doug Baumstein (The WAR Against Age)
Doug Baumstein (A Lifetime on the Road)
John Fraser (Pick Six)
Mark Armour (How to Score More Runs?)
Bill Parker (What Opening Day Tells Us)
Stan Opdyke (Pat Rispole)
Chris Jaffe (Evaluating Baseball's Mgrs)
Stan Opdyke (Baseball Radio in NYC, 1953)
A. Nathan (Performance of Baseball Bats)
Michael Weddell (Edgar Martinez/HOF)
Jon Weisman (100 Things Dodgers Fans...)
Stan Opdyke (Connie Mack and Vin Scully)
Eric Walker (Evaluating Run Production)
Brent Mayne (The Intangibles of Catching)
Chris Moore (Best Fastballs in Baseball)
Dave Baldwin (The Batter’s Brain)
Shawn Haviland (Ivy League to MLB)
Larry Granillo (Walking Off)
Rob Iracane (Solo HR Won't Break You)
Tommy Bennett (Charm of AM Radio)
Harry Pavlidis (Johan Santana's Fast Start)
John Walsh (WAR and Remembrance)
Eric Walker (Precisely Inaccurate)
Bob Timmermann (As They See 'Em)
Geoff Young (Unicycles and Delusions)
Baseball Analysis at Tufts (Groundballers)
Baseball Analysis at Tufts (GB Out Rates)
G. Rybarczyk ('09 Hit Tracker Projections)
Joe Lederer (Curt Schilling/HoF)
Conor Gallagher (Hall of Fallacies)
Chris Green (Jim Rice, HoF, the Numbers)
Shawn Hoffman (Baseball's Bear Mkt?)
Paul Anthony (Manny Syndrome)
Ross Roley (World Series Odds)
B. Timmermann (Catcher's Interference)
R.J. Anderson (Waiting the Hardest Part)
Maury Brown (Cubs, MLB, and Cuban...)
Myron Logan (Dee-Fense, Dee-Fense)
Craig Calcaterra (Frivolity, Part I, Part II)
Chad Finn (Ode to Baseball Cards)
David Cameron (Mariners Foibles)
Chris Dial (Chipper Jones)
Pat Lederer (Memory Lane)
David Appelman (Clutch Pitching)
Bob Rittner (DH)
Jonathan Mayo (Roger Clemens)
Lisa Winston (My Son-in-Law...)
Russ McQueen (The Yellow Hammer)
Bob Rittner (I'm OK, You're OK)
Mark Armour (In Defense of the HOF)
Pat Jordan (Friends)
Dan Levitt (Analysis of Terry Ryan)
Doug Baumstein (Trading Econ 101)
Ross Roley (Runner's Reluctance II)
Ross Roley (Runner's Reluctance I)
Mark Armour (No-Longer Lovable Sox)
Bruce Regal (Stealthy and Wise)
Brian Gunn (Roid Monster)
Current/McEvoy (Value of the SB)
John Rickert (Sinister Thefts)
Nate Silver (Sabermetrics)
David Vincent (Home Run Production)
Joe P. Sheehan (Enhanced Gameday II)
Mark Armour (An Ode to Sport)
David Gassko (All-Time Worm Burners)
Joe P. Sheehan (Enhanced Gameday)
John Walsh (When Titans Clash)
Fox/Williams (Quantifying Coaches II)
Fox/Williams (Quantifying Coaches I)
Jacob Luft (Bull Durham Rant)
Chad Finn (Strat-O-Matic)
Lisa Winston (Rotisserie Baseball)
Dave Studeman (Baseball Stats)
Steve Treder (Roger Craig)
Marc Normandin (Jeff Bagwell)
D. Appelman (Expanding Strike Zone)
Jeff Sackmann (Worst MiL Defenders)
Jeff Sackmann (Best MiL Defenders)
Maxwell Kates (Van Lingle Mungo)
David Appelman (Pitch Location)
Kent Bonham (Danny Ray Herrera)
Glenn Stout (Two Baseball Poems)
Bruce Regal (The Challenge Round)
Mark Lamster (Barry & Ty)
Geoff Young (NL West)
Tom Lederer (The Ryan Express)
Brian Erts (Great Leap Forward)
David Pinto (Parity and the N.L.)
Jacob Luft (Fathers and Daughters)
Jamey Newberg (Pete's Sake)
Jeff Albert (A. Jones Swing Analysis)
Jeff Albert (A-Rod Swing Analysis)
Keith Law (Death, Taxes, and Waivers)
Peter Abraham (Tales of Torre Tales)
Larry Borowsky (Let 'er Rip II)
Dan Levitt (Empirical Analysis of Bunting)
Jonah Keri (If I Met Warren Cromartie...)
Bob Klapisch (War Stories)
Bob Timmermann (John F. Kennedy HS)
Kent Bonham (Aluminum Adjustments)
Al Doyle (More Than Superstars)
Ross Roley (Instant Replay)
David Vincent (Barry Bonds Homers)
Chad Finn (Our Favorite Obscurities)
Bill Deane (1979 NL MVP)
Mark Armour (Rise/Fall of Artificial Turf)
Jeff Angus (Wally Moon Camp)
David Berri (Money and Baseball)
Larry Borowsky (Baseball w/o the #s)
Derek Zumsteg (The Irrational Market)
David Regan (Free Agent Contracts)
Peter Schmuck (Steroids and the HOF)
David Appelman (Pitchers, Pitch by Pitch)
Dan Fox (Swinging, Taking, Fouling, Etc)
Patrick Sullivan (Study of NYY CF/BOS LF)
Will Leitch (Baseball Journalism)
Jeff Sullivan (Pitcher Release Points)
Steve Treder ('69-'70 Giants)
Maury Brown (Charlie Finley)
John Brattain (Bob Johnson)
Bob Klapisch (The Case for Bert Blyleven)
Jeff Peek (Pride and Prejudice)
Dayn Perry (Bert and Warren)
Rob Neyer (If Don Sutton Was Great...)
Lisa Winston (Minor League Memories)
Alex Belth (Otis Redding Was Right)
David Cameron (Long Live the King)
Jeff Angus (Baserunning Study)
Bert Blyleven (Baseball Playoffs)
Boyd Nation (Not a Prospect List)
James Click (Batters-Baserunners Study)
Jeff Shaw (Why I Love Baseball)
David Gassko (BIP/BFP Fielding Study)
Jay Jaffe (Milwaukee Sausage Race)
Jamey Newberg (Remember When)
Bob Klapisch (Press Box to the Mound)
Dan Levitt (Predictive Value of BB)
David Vincent (Official Scorer)
Jon Weisman (Rick Monday)
Larry Borowsky (Let 'er Rip)
Will Carroll (Fictional Short Story)
Bob Timmermann (Japanese Baseball)
Cyril Morong (Best Pitching Seasons)
Sean Forman (Monte Carlo Win-Loss)
Brian Gunn (My Little Blue Book)
Joe Lederer (My Dad and Baseball)
Bill Deane (Bob Gibson, 1968)
Mark Armour (1977 Yankees)
Darren Viola (Retrosheet)
David Pinto (RFK)
Dayn Perry (Brave Heart)
Matt Welch (Dave Hansen)
Kevin Kernan (Jack McKeon)
Tom Lederer (Dodgers Road Trip)
Steve Lombardi (Slider)
Studes (Picturing Baseball)
Mike Carminati (Luck of the Drawl)
Eric Neel (Vin Scully)
J.C. Bradbury (Leo Mazzone)
John Sickels (Bill James)
Search Baseball Analysts
Archives
By Category:
Around the Majors Content Only
Around the Minors Content Only
Baseball Beat Content Only
Baseball Beat/Change-Up Content Only
Baseball Beat/WTNY Content Only
Behind the Scoreboard Content Only
Change-Up Content Only
Change-Up/Around the Majors Content Only
Command Post Content Only
Crunching the Numbers Content Only
Designated Hitter Content Only
F/X Visualizations Content Only
Past Times Content Only
Saber Talk Content Only
The Batter's Eye Content Only
Touching Bases Content Only
Weekend Blog Content Only
WTNY Content Only
By Month:
February 2012
January 2012
December 2011
October 2011
September 2011
August 2011
July 2011
June 2011
May 2011
April 2011
March 2011
February 2011
January 2011
December 2010
November 2010
October 2010
September 2010
August 2010
July 2010
June 2010
May 2010
April 2010
March 2010
February 2010
January 2010
December 2009
November 2009
October 2009
September 2009
August 2009
July 2009
June 2009
May 2009
April 2009
March 2009
February 2009
January 2009
December 2008
November 2008
October 2008
September 2008
August 2008
July 2008
June 2008
May 2008
April 2008
March 2008
February 2008
January 2008
December 2007
November 2007
October 2007
September 2007
August 2007
July 2007
June 2007
May 2007
April 2007
March 2007
February 2007
January 2007
December 2006
November 2006
October 2006
September 2006
August 2006
July 2006
June 2006
May 2006
April 2006
March 2006
February 2006
January 2006
December 2005
November 2005
October 2005
September 2005
August 2005
July 2005
June 2005
May 2005
April 2005
March 2005
February 2005
January 2005
December 2004
November 2004
October 2004
September 2004
August 2004
July 2004
June 2004
May 2004
April 2004
March 2004
February 2004
January 2004
December 2003
November 2003
October 2003
September 2003
August 2003
July 2003
June 2003
Reference
Organizational Stats
Arizona Diamondbacks Bat / Pitch
Atlanta Braves Bat / Pitch
Baltimore Orioles Bat / Pitch
Boston Red Sox Bat / Pitch
Chicago Cubs Bat / Pitch
Chicago White Sox Bat / Pitch
Cincinnati Reds Bat / Pitch
Cleveland Indians Bat / Pitch
Colorado Rockies Bat / Pitch
Detroit Tigers Bat / Pitch
Florida Marlins Bat / Pitch
Houston Astros Bat / Pitch
Kansas City Royals Bat / Pitch
Los Angeles Angels Bat / Pitch
Los Angeles Dodgers Bat / Pitch
Milwaukee Brewers Bat / Pitch
Minnesota Twins Bat / Pitch
New York Mets Bat / Pitch
New York Yankees Bat / Pitch
Oakland Athletics Bat / Pitch
Philadelphia Phillies Bat / Pitch
Pittsburgh Pirates Bat / Pitch
St. Louis Cardinals Bat / Pitch
San Diego Padres Bat / Pitch
San Francisco Giants Bat / Pitch
Seattle Mariners Bat / Pitch
Tampa Bay Devil Rays Bat / Pitch
Texas Rangers Bat / Pitch
Toronto Blue Jays Bat / Pitch
Washington Nationals Bat / Pitch
All-Star Links
Official Websites
News and Notes
Baseball News Blog
Baseball Newstand
ESPN Baseball
Fox Sports Baseball
Pro Sports Daily
Roto World
The Roto Times
USA Today Baseball
Baseball Newstand
ESPN Baseball
Fox Sports Baseball
Pro Sports Daily
Roto World
The Roto Times
USA Today Baseball
Reference and Analysis
Baseball Almanac
Baseball America
Baseball Archive
Baseball Contracts
Baseball Cube
Baseball Graphs
Baseball Library
Baseball Musings Player Database
Baseball Page
Baseball Primer
Baseball Prospectus
Baseball Reference
Baseball Statistics
Baseball Truth
Boxscore Central
Diamond Mind Baseball
Doug's Stats
FanGraphs
Fast Balls (pitchfx catalog)
Hardball Dollars
Hardball Times
Hit Tracker
Retrosheet
Rotobase/Rotoblog
Stat Corner
STATS
Tango on Baseball
Yahoo Sports MLB
Web Gems
Bill James Primer
Sabermetric Manifesto (Grabiner)
Pitching and Defense (McCracken)
Pitching and Defense (Tippett)
Transactions Primer (Neyer)
Baseball Stats (Batter's Box)
Prospect Report (Cameron)
Pitcher Workloads (Sheehan)
Goodbye to Old Baseball Ideas (Rickey)
Sabermetric Manifesto (Grabiner)
Pitching and Defense (McCracken)
Pitching and Defense (Tippett)
Transactions Primer (Neyer)
Baseball Stats (Batter's Box)
Prospect Report (Cameron)
Pitcher Workloads (Sheehan)
Goodbye to Old Baseball Ideas (Rickey)
Columnists
Baseball Blogs
Around the Majors
Athletics Nation
Baseball Crank
Baseball Musings
Baseball-Reference Blog
Batter's Box
Big League Stew
Bronx Banter
Catfish Stew
Cub Town
Dan Agonistes
Dodger Thoughts
DRays Bay
Ducksnorts
Futility Infielder
Halos Heaven
Inside the Rockies
It Might Be Dangerous
Knuckle Curve
LoHud Yankees Blog
Lookout Landing
Management by Baseball
Metaforian
Metsgeek
Mike's Baseball Rants
Only Baseball Matters
Redbird Nation
Red Reporter
Sabernomics (Braves)
Seth Speaks
ShysterBall
6-4-2 (Angels/Dodgers)
The Book
TheCubdom
The Cutting Edge
The House That Dewey Built
The View From The Bleachers
Tiger Blog
U.S.S. Mariner
Viva El Birdos
Where's Kernan
Minor Leagues
Arizona Fall League
BA Player Finder
Cal Leaguers
Jamey Newberg
JDM's Scoresheet Baseball
Minor League Baseball
Minor League Park Factors
Minor League Splits
No Pepper
Sickels' Minor League Ball
Warm October Nights
BA Player Finder
Cal Leaguers
Jamey Newberg
JDM's Scoresheet Baseball
Minor League Baseball
Minor League Park Factors
Minor League Splits
No Pepper
Sickels' Minor League Ball
Warm October Nights
Amateur
Boyd's World (College)
Cape Cod Baseball League
College Baseball Blog
College Baseball Insider
Collegiate Baseball Newspaper
College Splits
College Splits Blog
Dirtbags Baseball (Long Beach State)
NCAA Baseball
NCBWA
Team One Baseball (High School)
Texas A&M & Baseball
Cape Cod Baseball League
College Baseball Blog
College Baseball Insider
Collegiate Baseball Newspaper
College Splits
College Splits Blog
Dirtbags Baseball (Long Beach State)
NCAA Baseball
NCBWA
Team One Baseball (High School)
Texas A&M & Baseball
Historical
Cuban Baseball
House of David
Jim "Mudcat" Grant's Web Page
Negro League Baseball Players Assoc
Negro Leagues Baseball Museum
1919 Black Sox
Pacific Coast League
Philadelphia Athletics Historical Society
Shoeless Joe Jackson Society
SABR-L Archives
Walter O'Malley
House of David
Jim "Mudcat" Grant's Web Page
Negro League Baseball Players Assoc
Negro Leagues Baseball Museum
1919 Black Sox
Pacific Coast League
Philadelphia Athletics Historical Society
Shoeless Joe Jackson Society
SABR-L Archives
Walter O'Malley
Miscellaneous
Forums
Credits
Ticket Center
Tickets to Baseball -
Premium Red Sox Tickets - Tickets to Marlins Games - Cardinals Game Tickets - NY Yankee Tickets - Tickets Oakland Athletics - Dallas Cowboys Tickets - Arizona Cardinals Tickets - Tickets Seattle Seahawks - Buffalo Bills Tickets Online - Tickets to Dolphins Football
Buy Boston Red Sox tickets,
Philadelphia Phillies tix,
NY Yankees tickets,
NY Mets tickets, and
MLB All Star game tickets at ABC tickets
Not sure where to find the best online sportsbooks? Start your search with PlayersJet.
Get deals at SportsMemorabilia.com on baseball apparel, including Phillies jerseys and more for adults and children.
Shop the largest selection baseball equipment on sale at Sports Unlimited. Check out tons of baseball gloves, youth baseball gloves and catchers gear from Rawlings, Wilson, Nike & Under Armour.
2011 Draft Order
Courtesy of Baseball America
First-Round:
 1. Pirates (57-105)
 2. Mariners (61-101)
 3. Diamondbacks (65-97)
 4. Orioles (66-96)
 5. Royals (67-95)
 6. Nationals (69-93)
 7. Diamondbacks (for B. Loux)
 8. Indians (69-93)
 9. Cubs (75-87)
10. Padres (for Karsten Whitson)
11. Astros (76-86)
12. Brewers (77-85)
13. Mets (79-83)
14. Marlins (80-82)
15. Brewers (for Dylan Covey)
16. Dodgers (80-82)
17. Angels (80-82)
18. Athletics (81-81)
19. Red Sox (from DET for Martinez)
20. Rockies (83-79)
21. Blue Jays (85-77)
22. Cardinals (86-76)
23. Nationals (from CWS for Dunn)
24. Rays (from BOS for Crawford)
25. Padres (90-72)
26. Red Sox (from TEX for Beltre)
27. Reds (91-71)
28. Braves (91-71)
29. Giants (92-70)
30. Twins (94-68)
31. Rays (from NYY for Soriano)
32. Rays (96-66)
33. Rangers (from PHI for Lee)
Supplemental First Round:
34. Nationals (Dunn)
35. Blue Jays (Downs)
36. Red Sox (Martinez)
37. Rangers (Lee)
38. Rays (Crawford)
39. Phillies (Werth)
40. Red Sox (Beltre)
41. Rays (Soriano)
42. Rays (Balfour)
43. Diamondbacks (LaRoche)
44. Mets (Feliciano)
45. Rockies (Dotel)
46. Blue Jays (Buck)
47. White Sox (Putz)
48. Padres (Garland)
49. Giants (Uribe)
50. Twins (Hudson)
51. Yankees (Vazquez)
52. Rays (Benoit)
53. Blue Jays (Olivo)
54. Padres (Torrealba)
55. Twins (Crain)
56. Rays (Choate)
57. Blue Jays (Gregg)
58. Padres (Correia)
59. Rays (Hawpe)
| Command Post | August 24, 2007 |
Park Differences and Reaction Distances
If you have been following the PITCHf/x data this season, you've probably realized that the system has been implemented in more stadiums since the All-Star break, and is in 23 stadiums now. You've also probably noticed that the data provided from each stadium is slightly different. The velocity isn't very consistent between starts by the same pitcher in different stadiums, the movement of pitches seems to change and the release point has been shown to jump around as well.
The release point differences are the most important because as I learned last week, there are only nine parameters captured for each pitch. The three dimensional location of the ball, as well as acceleration and initial velocity, are all captured by the camera system, with the rest of the values that are shown, either in Gameday or the xml itself, being calculated from those nine values. Any discussion about how parks affect the speed or movement of pitches has to begin with a look at the data captured at release point. Below is a table that has the average release point height (in feet) for a team's staff, both at home and in all road stadiums. The way to read the table is that the average release height for all pitchers on the Red Sox while at Fenway was 5.30 feet, and was 6.08 feet for Red Sox pitchers on the road. One problem with using this method is that it doesn't use exactly the same group of pitchers for home and road, which is due to a lack of data, but it gives a rough idea of the release point height at each stadium.
Team    Home    Road     Home-Road
BOS     5.30    6.08    -0.78
SDN     5.61    5.83    -0.22
MIL     5.75    5.97    -0.21
CHA     5.61    5.81    -0.19
SLN     5.96    6.08    -0.12
CHN     6.20    6.31    -0.11
LAN     5.95    6.04    -0.09
SEA     5.81    5.89    -0.08
ARI     5.99    5.98     0.01
CLE     6.00    5.98     0.02
KCA     5.93    5.87     0.06
ATL     5.97    5.91     0.06
OAK     6.06    5.97     0.09
ANA     6.20    6.11     0.09
HOU     5.86    5.76     0.10
DET     6.03    5.91     0.12
TOR     5.79    5.65     0.14
TEX     6.43    6.29     0.14
CIN     6.32    6.17     0.16
PHI     6.33    6.11     0.23
MIN     6.18    5.95     0.23
COL     6.29    5.85     0.44
SFN     6.59    6.11     0.49
Most of the home heights are within .2 feet of their road data, with the exception of Boston, Colorado and San Francisco. However, even among these three stadiums, Fenway stands out, with the release point being .78 feet lower than the road. Every Red Sox pitcher had at least a .40 foot higher release point on road and looking at the average starting velocity of a pitch at each stadium, Red Sox pitchers throw 6.5 MPH faster on the road than at home. Clearly something is going on with the PITCHf/x system at Fenway and to a lesser extent at Coors and AT&T, and could be going on at other stadiums as well. Until we have confidence in the release points being tracked at every park, comparing data gathered at different stadiums without adjusting it will give misleading results.
Park	Name                Pit    pfx_x(")   pfx_z(")    x0(')     z0(')    vy0(ft/s)
Home    Josh Beckett        338   -4.19       3.47       -1.69      4.85     127.59
Road    Josh Beckett        106   -4.51       8.36       -1.95      5.37     134.55
Home    Manny Delcarmen     103   -5.93       7.28       -0.95      5.55     127.83
Road    Manny Delcarmen     35    -4.07       10.07      -1.34      6.12     136.95
Home    Eric Gagne          32    -2.14       3.01       -0.84      5.23     116.06
Road    Eric Gagne          48    -3.54       9.03       -0.78      5.82     131.21
Home    Jon Lester          97     0.96       4.27        2.98      5.66     117.52
Road    Jon Lester          192    1.76       6.15        2.57      6.29     128.25
Home    Daisuke Matsuzaka   314   -2.31       5.47       -2.08      5.14     123.67
Road    Daisuke Matsuzaka   111   -3.56       9.06       -2.31      5.54     134.94
Home    Hideki Okajima      71     2.60       8.02       -0.01      5.82     118.96
Road    Hideki Okajima      27     3.34       6.38       -0.37      6.59     120.71
Home    Jonathan Papelbon   64    -7.68       6.35       -2.28      4.98     132.33
Road    Jonathan Papelbon   31    -6.57       9.84       -2.65      5.48     138.27
Home    Kyle Snyder         87    -1.81       1.58       -1.51      6.22     112.67
Road    Kyle Snyder         39    -1.69       6.28       -1.73      6.73     123.94
Home    Julian Tavarez      248   -7.04       2.80       -1.70      5.16     122.88
Road    Julian Tavarez      41    -6.90       5.31       -2.03      6.12     127.34
Home    Mike Timlin         96    -3.50       6.91       -2.14      6.06     124.26
Road    Mike Timlin         63    -2.86       8.44       -2.56      6.71     130.85
Home    Tim Wakefield       316    0.88       1.98       -0.65      5.80      94.85
Road    Tim Wakefield       71     3.03       3.65       -0.84      6.67     103.41
Looking at individual pitchers for the Red Sox, you can see how Fenway's camera system impacts the different pitchers. X0 and z0 are the coordinates for the release point, measured as a distance from the pitcher's body and from the ground respectively, and the release point is lower at home for all the pitchers. Almost all of the pitchers also get a smaller pfx_z value at home, which would seem to indicate that their pitches have more sink at Fenway, but is actually a result of the lower release height combined with the fact that, overall, the average height when a pitch crosses the plate at Fenway is similar to the height at other parks. The initial velocity is vy0, measured in feet/second, and is slower in every case. I didn't break this chart up by pitch, which is fine for examining the release points, but when looking at the velocity it gives an average that doesn't really mean anything.
Getting back to making an adjustment, the z coordinates of the release points are all roughly 10% too small at Fenway. If the Fenway x values were increased by 10% they would be a closer match for the release points on the road. However, once you make that adjustment, you need to adjust each of the other 8 parameters so that they are "measuring" at the new, adjusted release point, rather than the low release point. If you say that Fenway lowers the release point for every pitcher by 10%, and apply these adjustments to every pitch thrown at Fenway, here's what happens for Josh Beckett.
Park    Name       Pit     x0      z0      vy0
Road    Beckett    106    -1.95    5.37    134.55
Fenway  Beckett    338    -1.69    4.85    127.59
Adj.    Beckett    338    -1.99    5.39    136.53
Even through the adjusted numbers match the road numbers, I'm not very confident in using this method to make large-scale adjustments. For one thing, the road numbers could be off too. For Beckett I'm looking at one road start, made in Safeco, so I could be making too big of an adjustment. The lack of a large sample of road starts for pitchers is a major weakness of the type of separation I used in the home/road charts, but once there are more starts made in stadiums with the pitch f/x system, that hopefully can change. I think any true park factors are going to need to wait until there is more data captured at all stadiums.
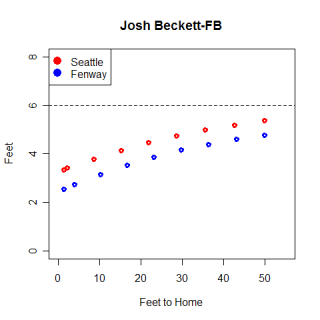
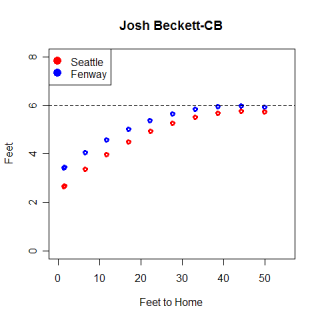
Here are two graphs of a randomly selected Beckett fastball and curveball at Fenway and Safeco, as viewed from the first base line. You can really see the difference that the release height makes from this view. There appear to be some differences in how the curveball moves at the different stadiums, but the fastball follows virtually the same path, just at different heights, in both cases. Each dot represents the ball's position in .05 second intervals, which segues nicely into my last section.
I received a comment yesterday on my article from last week that suggested a better way to quantify the speed of a pitch was to determine how far away the pitch is when the batter has to decide whether to swing. It probably is even more intuitive to think of it like this compared to how many seconds the ball takes to arrive, so I went ahead and calculated some distances.
You can test your reaction time here, and after some extensive research (emailing the link to five friends) I think a rough proxy for an MLB reaction time is around .2 seconds. If a pitch takes .513 seconds to reach the plate, as a Wakefield knuckleball does, then the hitter can let the pitch travel for .313 seconds out of Wakefield's hand before making a decision. The pitch is 19.75 feet from home plate at .313 seconds, so the hitter can wait until Wakefield's knuckleball is about 20 feet from him before making a decision. A hitter has to make a decision on a fastball on a Beckett fastball 27 feet from home, while on a Rich Hill curveball the hitter has to decide when the pitch is 21 feet from home.
The hard part of finding these numbers is determining the reaction time. The test above only involves clicking a mouse button, which is nearly instantaneous, but swinging a bat takes much longer. Even if the hitter had a reaction time of .2 seconds, once he recognized the pitch and reacted, actually swinging the bat would take some time as well. If you add on another .1 second to account for the swing, the distances are pushed back to 29 feet for Wakefield's knuckleball, 41 feet for Beckett's fastball, and 31 feet for Hill's curve.
I have no idea if the .1 second swing time is accurate, but at 41 feet from the plate most pitches look very similar. Hill's curveball hasn't began to break yet and it looks very similar to Beckett's fastball. If you had a reaction time of .2 seconds and a swing that lasts .2 seconds after the reaction time, you would need to artificially speed up your reaction time and decide whether to swing at Beckett's fastball before he even released his pitch. If he were throwing his curveball or changeup instead...well, Beckett does have 148 strikeouts this year. I believe there is some overlap on reaction time and when the swing begins, which lowers the overall time used, and I think there is also some element of "Blink" involved here, where good hitters "know" to swing at a pitch before they realize why they are swinging at it. Either way, hitting is hard.
Comments
Quick question
Im kinda in the processing of learning "R" and i was wondering how to import the xml gameday files into R
John
Posted by: john at August 26, 2007 9:23 AM
John, I am a fellow R beginner. I import my gameday data into R from a MySQL database, so I'm not exactly sure how to bring the XML straight in, but I'm guessing you'd need to install an XML parser plug-in for R, like the one here:
http://www.omegahat.org/RSXML/Overview.html
I couldn't find anything in the R documentation itself about XML.
Posted by: Mike Fast at August 27, 2007 9:00 PM
I installed some packages for XML in R but I still couldnt figure it out.
I suppose I could do it your way but im relatively new to MySQL as well lol.
Posted by: john at August 28, 2007 5:16 AM