Rich Lederer • Baseball Beat
Patrick Sullivan • Change-Up
Jeremy Greenhouse • Touching Bases
Dave Allen • F/X Visualizations
Sky Andrecheck • Behind the Scoreboard
Marc Hulet • Around the Minors
Al Doyle • Past Times
Retired Uniforms:
Bryan Smith • WTNY
Joe Sheehan • Command Post
Jeff Albert • The Batter's Eye
RSS Feed
Home
*Examining the Past, Present, and Future*
Lineup Card
Recent Entries
» Putting Together a Reality Team
» Historical Hall of Fame Vote Comparisons: 2012
» An All-Christmas Team
» The New-Look Angels
» John Denny: The Forgotten Cy Young Award Winner
» Money Isn't Everything
» What Would It Take to Hit .400 in the 21st Century?
» Halos Heaven
» Brandon McCarthy's Breakout Season
» Link-o-Rama
» Historical Hall of Fame Vote Comparisons: 2012
» An All-Christmas Team
» The New-Look Angels
» John Denny: The Forgotten Cy Young Award Winner
» Money Isn't Everything
» What Would It Take to Hit .400 in the 21st Century?
» Halos Heaven
» Brandon McCarthy's Breakout Season
» Link-o-Rama
Best of Baseball Beat
Abstracts From the Abstracts
1977 Baseball Abstract
1978 Baseball Abstract
1979 Baseball Abstract
1980 Baseball Abstract
1981 Baseball Abstract
1982 Baseball Abstract
1983 Baseball Abstract
1984 Baseball Abstract
1985 Baseball Abstract
1986 Baseball Abstract
1987 Baseball Abstract
1988 Baseball Abstract
1978 Baseball Abstract
1979 Baseball Abstract
1980 Baseball Abstract
1981 Baseball Abstract
1982 Baseball Abstract
1983 Baseball Abstract
1984 Baseball Abstract
1985 Baseball Abstract
1986 Baseball Abstract
1987 Baseball Abstract
1988 Baseball Abstract
Bert Blyleven Series
Meeting Up and Hanging Out with Bert
The Results Are In And...
Aficionado Heavily Invested in Blyleven
Latest on Blyleven's Chances for the HOF
The Internet Zealot Responds
400 Down and 5 to Go...
Bert Be Home By Eleven?
Blyleven's Forgotten Season (1973)
HeyMan, Your Comments Don't Hold Water
The Waiting is the Hardest Part
Another Addition to the Blyleven Series
Search for the Truth
As Dominant as His HOF Contemporaries
Listen, Buster
A Larger Step for Blyleven
Answering the Naysayers (Part Two)
Another Small Step for Blyleven
Q&A: Blyleven on the Twins
The Majority Rules, Right?
It's All Dutch to Some
The Hall of Fame Case for Bert Blyleven
Q&A: Blyleven on Felix Hernandez
Clemens Rocketing Up Charts
Poz: An Interview With a KC Star
A HOF Chat with Tracy Ringolsby
Up Close and Personal
A Peek Into the Mind of a HOF Voter
Answering the Naysayers
It's That Time of the Year (Again)
"If Cooperstown is Calling..."
The Bert Alert
One Small Step for Blyleven...
Only the Lonely
Exclusive Interviews
Lee Sinins
Alex Belth
David Pinto
Will Carroll
Mike Carminati
Aaron Gleeman
Joe Sheehan
Jay Jaffe
Jeff Peek
Tracy Ringolsby
Joe Posnanski
Bill James Part I, II, III
Jon Lalonde
Chuck Tiffany
Dayn Perry
Fay Vincent
Nate Silver
Alex Belth
David Pinto
Will Carroll
Mike Carminati
Aaron Gleeman
Joe Sheehan
Jay Jaffe
Jeff Peek
Tracy Ringolsby
Joe Posnanski
Bill James Part I, II, III
Jon Lalonde
Chuck Tiffany
Dayn Perry
Fay Vincent
Nate Silver
Bullpen
Rich Lederer
The Odd Couple (with Alex Belth)
The MostUnder Over Underrated Player in Baseball (with Brian Gunn)
Three Wise Men (roundtable by Alex Belth)
Infrequently Asked Questions (interview with Matt Welch)
Interview (Orioles Think Tank)
Bernie and the Yanks (Bronx Banter)
Hope and Faith: How the LAA Win the World Series (Baseball Prospectus)
NL West (The Soul of Baseball)
Greatest Living Hitter? (Sports Illustrated)
Roundtable: 2008 HOF Ballot (Armchair GM)
The Most
Three Wise Men (roundtable by Alex Belth)
Infrequently Asked Questions (interview with Matt Welch)
Interview (Orioles Think Tank)
Bernie and the Yanks (Bronx Banter)
Hope and Faith: How the LAA Win the World Series (Baseball Prospectus)
NL West (The Soul of Baseball)
Greatest Living Hitter? (Sports Illustrated)
Roundtable: 2008 HOF Ballot (Armchair GM)
Patrick Sullivan
Designated Hitters
David Bromberg (Q&A: John Denny)
Mark Armour (H. Killebrew and Versatility)
Joe Lederer (Soundtrack of a Prospect)
David Bromberg (Clemente's Autograph)
David Bromberg (Woody Fryman)
D. Baumstein (WAR Against Age: Pitchers)
Doug Baumstein (The WAR Against Age)
Doug Baumstein (A Lifetime on the Road)
John Fraser (Pick Six)
Mark Armour (How to Score More Runs?)
Bill Parker (What Opening Day Tells Us)
Stan Opdyke (Pat Rispole)
Chris Jaffe (Evaluating Baseball's Mgrs)
Stan Opdyke (Baseball Radio in NYC, 1953)
A. Nathan (Performance of Baseball Bats)
Michael Weddell (Edgar Martinez/HOF)
Jon Weisman (100 Things Dodgers Fans...)
Stan Opdyke (Connie Mack and Vin Scully)
Eric Walker (Evaluating Run Production)
Brent Mayne (The Intangibles of Catching)
Chris Moore (Best Fastballs in Baseball)
Dave Baldwin (The Batter’s Brain)
Shawn Haviland (Ivy League to MLB)
Larry Granillo (Walking Off)
Rob Iracane (Solo HR Won't Break You)
Tommy Bennett (Charm of AM Radio)
Harry Pavlidis (Johan Santana's Fast Start)
John Walsh (WAR and Remembrance)
Eric Walker (Precisely Inaccurate)
Bob Timmermann (As They See 'Em)
Geoff Young (Unicycles and Delusions)
Baseball Analysis at Tufts (Groundballers)
Baseball Analysis at Tufts (GB Out Rates)
G. Rybarczyk ('09 Hit Tracker Projections)
Joe Lederer (Curt Schilling/HoF)
Conor Gallagher (Hall of Fallacies)
Chris Green (Jim Rice, HoF, the Numbers)
Shawn Hoffman (Baseball's Bear Mkt?)
Paul Anthony (Manny Syndrome)
Ross Roley (World Series Odds)
B. Timmermann (Catcher's Interference)
R.J. Anderson (Waiting the Hardest Part)
Maury Brown (Cubs, MLB, and Cuban...)
Myron Logan (Dee-Fense, Dee-Fense)
Craig Calcaterra (Frivolity, Part I, Part II)
Chad Finn (Ode to Baseball Cards)
David Cameron (Mariners Foibles)
Chris Dial (Chipper Jones)
Pat Lederer (Memory Lane)
David Appelman (Clutch Pitching)
Bob Rittner (DH)
Jonathan Mayo (Roger Clemens)
Lisa Winston (My Son-in-Law...)
Russ McQueen (The Yellow Hammer)
Bob Rittner (I'm OK, You're OK)
Mark Armour (In Defense of the HOF)
Pat Jordan (Friends)
Dan Levitt (Analysis of Terry Ryan)
Doug Baumstein (Trading Econ 101)
Ross Roley (Runner's Reluctance II)
Ross Roley (Runner's Reluctance I)
Mark Armour (No-Longer Lovable Sox)
Bruce Regal (Stealthy and Wise)
Brian Gunn (Roid Monster)
Current/McEvoy (Value of the SB)
John Rickert (Sinister Thefts)
Nate Silver (Sabermetrics)
David Vincent (Home Run Production)
Joe P. Sheehan (Enhanced Gameday II)
Mark Armour (An Ode to Sport)
David Gassko (All-Time Worm Burners)
Joe P. Sheehan (Enhanced Gameday)
John Walsh (When Titans Clash)
Fox/Williams (Quantifying Coaches II)
Fox/Williams (Quantifying Coaches I)
Jacob Luft (Bull Durham Rant)
Chad Finn (Strat-O-Matic)
Lisa Winston (Rotisserie Baseball)
Dave Studeman (Baseball Stats)
Steve Treder (Roger Craig)
Marc Normandin (Jeff Bagwell)
D. Appelman (Expanding Strike Zone)
Jeff Sackmann (Worst MiL Defenders)
Jeff Sackmann (Best MiL Defenders)
Maxwell Kates (Van Lingle Mungo)
David Appelman (Pitch Location)
Kent Bonham (Danny Ray Herrera)
Glenn Stout (Two Baseball Poems)
Bruce Regal (The Challenge Round)
Mark Lamster (Barry & Ty)
Geoff Young (NL West)
Tom Lederer (The Ryan Express)
Brian Erts (Great Leap Forward)
David Pinto (Parity and the N.L.)
Jacob Luft (Fathers and Daughters)
Jamey Newberg (Pete's Sake)
Jeff Albert (A. Jones Swing Analysis)
Jeff Albert (A-Rod Swing Analysis)
Keith Law (Death, Taxes, and Waivers)
Peter Abraham (Tales of Torre Tales)
Larry Borowsky (Let 'er Rip II)
Dan Levitt (Empirical Analysis of Bunting)
Jonah Keri (If I Met Warren Cromartie...)
Bob Klapisch (War Stories)
Bob Timmermann (John F. Kennedy HS)
Kent Bonham (Aluminum Adjustments)
Al Doyle (More Than Superstars)
Ross Roley (Instant Replay)
David Vincent (Barry Bonds Homers)
Chad Finn (Our Favorite Obscurities)
Bill Deane (1979 NL MVP)
Mark Armour (Rise/Fall of Artificial Turf)
Jeff Angus (Wally Moon Camp)
David Berri (Money and Baseball)
Larry Borowsky (Baseball w/o the #s)
Derek Zumsteg (The Irrational Market)
David Regan (Free Agent Contracts)
Peter Schmuck (Steroids and the HOF)
David Appelman (Pitchers, Pitch by Pitch)
Dan Fox (Swinging, Taking, Fouling, Etc)
Patrick Sullivan (Study of NYY CF/BOS LF)
Will Leitch (Baseball Journalism)
Jeff Sullivan (Pitcher Release Points)
Steve Treder ('69-'70 Giants)
Maury Brown (Charlie Finley)
John Brattain (Bob Johnson)
Bob Klapisch (The Case for Bert Blyleven)
Jeff Peek (Pride and Prejudice)
Dayn Perry (Bert and Warren)
Rob Neyer (If Don Sutton Was Great...)
Lisa Winston (Minor League Memories)
Alex Belth (Otis Redding Was Right)
David Cameron (Long Live the King)
Jeff Angus (Baserunning Study)
Bert Blyleven (Baseball Playoffs)
Boyd Nation (Not a Prospect List)
James Click (Batters-Baserunners Study)
Jeff Shaw (Why I Love Baseball)
David Gassko (BIP/BFP Fielding Study)
Jay Jaffe (Milwaukee Sausage Race)
Jamey Newberg (Remember When)
Bob Klapisch (Press Box to the Mound)
Dan Levitt (Predictive Value of BB)
David Vincent (Official Scorer)
Jon Weisman (Rick Monday)
Larry Borowsky (Let 'er Rip)
Will Carroll (Fictional Short Story)
Bob Timmermann (Japanese Baseball)
Cyril Morong (Best Pitching Seasons)
Sean Forman (Monte Carlo Win-Loss)
Brian Gunn (My Little Blue Book)
Joe Lederer (My Dad and Baseball)
Bill Deane (Bob Gibson, 1968)
Mark Armour (1977 Yankees)
Darren Viola (Retrosheet)
David Pinto (RFK)
Dayn Perry (Brave Heart)
Matt Welch (Dave Hansen)
Kevin Kernan (Jack McKeon)
Tom Lederer (Dodgers Road Trip)
Steve Lombardi (Slider)
Studes (Picturing Baseball)
Mike Carminati (Luck of the Drawl)
Eric Neel (Vin Scully)
J.C. Bradbury (Leo Mazzone)
John Sickels (Bill James)
Search Baseball Analysts
Archives
By Category:
Around the Majors Content Only
Around the Minors Content Only
Baseball Beat Content Only
Baseball Beat/Change-Up Content Only
Baseball Beat/WTNY Content Only
Behind the Scoreboard Content Only
Change-Up Content Only
Change-Up/Around the Majors Content Only
Command Post Content Only
Crunching the Numbers Content Only
Designated Hitter Content Only
F/X Visualizations Content Only
Past Times Content Only
Saber Talk Content Only
The Batter's Eye Content Only
Touching Bases Content Only
Weekend Blog Content Only
WTNY Content Only
By Month:
February 2012
January 2012
December 2011
October 2011
September 2011
August 2011
July 2011
June 2011
May 2011
April 2011
March 2011
February 2011
January 2011
December 2010
November 2010
October 2010
September 2010
August 2010
July 2010
June 2010
May 2010
April 2010
March 2010
February 2010
January 2010
December 2009
November 2009
October 2009
September 2009
August 2009
July 2009
June 2009
May 2009
April 2009
March 2009
February 2009
January 2009
December 2008
November 2008
October 2008
September 2008
August 2008
July 2008
June 2008
May 2008
April 2008
March 2008
February 2008
January 2008
December 2007
November 2007
October 2007
September 2007
August 2007
July 2007
June 2007
May 2007
April 2007
March 2007
February 2007
January 2007
December 2006
November 2006
October 2006
September 2006
August 2006
July 2006
June 2006
May 2006
April 2006
March 2006
February 2006
January 2006
December 2005
November 2005
October 2005
September 2005
August 2005
July 2005
June 2005
May 2005
April 2005
March 2005
February 2005
January 2005
December 2004
November 2004
October 2004
September 2004
August 2004
July 2004
June 2004
May 2004
April 2004
March 2004
February 2004
January 2004
December 2003
November 2003
October 2003
September 2003
August 2003
July 2003
June 2003
Reference
Organizational Stats
Arizona Diamondbacks Bat / Pitch
Atlanta Braves Bat / Pitch
Baltimore Orioles Bat / Pitch
Boston Red Sox Bat / Pitch
Chicago Cubs Bat / Pitch
Chicago White Sox Bat / Pitch
Cincinnati Reds Bat / Pitch
Cleveland Indians Bat / Pitch
Colorado Rockies Bat / Pitch
Detroit Tigers Bat / Pitch
Florida Marlins Bat / Pitch
Houston Astros Bat / Pitch
Kansas City Royals Bat / Pitch
Los Angeles Angels Bat / Pitch
Los Angeles Dodgers Bat / Pitch
Milwaukee Brewers Bat / Pitch
Minnesota Twins Bat / Pitch
New York Mets Bat / Pitch
New York Yankees Bat / Pitch
Oakland Athletics Bat / Pitch
Philadelphia Phillies Bat / Pitch
Pittsburgh Pirates Bat / Pitch
St. Louis Cardinals Bat / Pitch
San Diego Padres Bat / Pitch
San Francisco Giants Bat / Pitch
Seattle Mariners Bat / Pitch
Tampa Bay Devil Rays Bat / Pitch
Texas Rangers Bat / Pitch
Toronto Blue Jays Bat / Pitch
Washington Nationals Bat / Pitch
All-Star Links
Official Websites
News and Notes
Baseball News Blog
Baseball Newstand
ESPN Baseball
Fox Sports Baseball
Pro Sports Daily
Roto World
The Roto Times
USA Today Baseball
Baseball Newstand
ESPN Baseball
Fox Sports Baseball
Pro Sports Daily
Roto World
The Roto Times
USA Today Baseball
Reference and Analysis
Baseball Almanac
Baseball America
Baseball Archive
Baseball Contracts
Baseball Cube
Baseball Graphs
Baseball Library
Baseball Musings Player Database
Baseball Page
Baseball Primer
Baseball Prospectus
Baseball Reference
Baseball Statistics
Baseball Truth
Boxscore Central
Diamond Mind Baseball
Doug's Stats
FanGraphs
Fast Balls (pitchfx catalog)
Hardball Dollars
Hardball Times
Hit Tracker
Retrosheet
Rotobase/Rotoblog
Stat Corner
STATS
Tango on Baseball
Yahoo Sports MLB
Web Gems
Bill James Primer
Sabermetric Manifesto (Grabiner)
Pitching and Defense (McCracken)
Pitching and Defense (Tippett)
Transactions Primer (Neyer)
Baseball Stats (Batter's Box)
Prospect Report (Cameron)
Pitcher Workloads (Sheehan)
Goodbye to Old Baseball Ideas (Rickey)
Sabermetric Manifesto (Grabiner)
Pitching and Defense (McCracken)
Pitching and Defense (Tippett)
Transactions Primer (Neyer)
Baseball Stats (Batter's Box)
Prospect Report (Cameron)
Pitcher Workloads (Sheehan)
Goodbye to Old Baseball Ideas (Rickey)
Columnists
Baseball Blogs
Around the Majors
Athletics Nation
Baseball Crank
Baseball Musings
Baseball-Reference Blog
Batter's Box
Big League Stew
Bronx Banter
Catfish Stew
Cub Town
Dan Agonistes
Dodger Thoughts
DRays Bay
Ducksnorts
Futility Infielder
Halos Heaven
Inside the Rockies
It Might Be Dangerous
Knuckle Curve
LoHud Yankees Blog
Lookout Landing
Management by Baseball
Metaforian
Metsgeek
Mike's Baseball Rants
Only Baseball Matters
Redbird Nation
Red Reporter
Sabernomics (Braves)
Seth Speaks
ShysterBall
6-4-2 (Angels/Dodgers)
The Book
TheCubdom
The Cutting Edge
The House That Dewey Built
The View From The Bleachers
Tiger Blog
U.S.S. Mariner
Viva El Birdos
Where's Kernan
Minor Leagues
Arizona Fall League
BA Player Finder
Cal Leaguers
Jamey Newberg
JDM's Scoresheet Baseball
Minor League Baseball
Minor League Park Factors
Minor League Splits
No Pepper
Sickels' Minor League Ball
Warm October Nights
BA Player Finder
Cal Leaguers
Jamey Newberg
JDM's Scoresheet Baseball
Minor League Baseball
Minor League Park Factors
Minor League Splits
No Pepper
Sickels' Minor League Ball
Warm October Nights
Amateur
Boyd's World (College)
Cape Cod Baseball League
College Baseball Blog
College Baseball Insider
Collegiate Baseball Newspaper
College Splits
College Splits Blog
Dirtbags Baseball (Long Beach State)
NCAA Baseball
NCBWA
Team One Baseball (High School)
Texas A&M & Baseball
Cape Cod Baseball League
College Baseball Blog
College Baseball Insider
Collegiate Baseball Newspaper
College Splits
College Splits Blog
Dirtbags Baseball (Long Beach State)
NCAA Baseball
NCBWA
Team One Baseball (High School)
Texas A&M & Baseball
Historical
Cuban Baseball
House of David
Jim "Mudcat" Grant's Web Page
Negro League Baseball Players Assoc
Negro Leagues Baseball Museum
1919 Black Sox
Pacific Coast League
Philadelphia Athletics Historical Society
Shoeless Joe Jackson Society
SABR-L Archives
Walter O'Malley
House of David
Jim "Mudcat" Grant's Web Page
Negro League Baseball Players Assoc
Negro Leagues Baseball Museum
1919 Black Sox
Pacific Coast League
Philadelphia Athletics Historical Society
Shoeless Joe Jackson Society
SABR-L Archives
Walter O'Malley
Miscellaneous
Forums
Credits
Ticket Center
Tickets to Baseball -
Premium Red Sox Tickets - Tickets to Marlins Games - Cardinals Game Tickets - NY Yankee Tickets - Tickets Oakland Athletics - Dallas Cowboys Tickets - Arizona Cardinals Tickets - Tickets Seattle Seahawks - Buffalo Bills Tickets Online - Tickets to Dolphins Football
Buy Boston Red Sox tickets,
Philadelphia Phillies tix,
NY Yankees tickets,
NY Mets tickets, and
MLB All Star game tickets at ABC tickets
Not sure where to find the best online sportsbooks? Start your search with PlayersJet.
Get deals at SportsMemorabilia.com on baseball apparel, including Phillies jerseys and more for adults and children.
Shop the largest selection baseball equipment on sale at Sports Unlimited. Check out tons of baseball gloves, youth baseball gloves and catchers gear from Rawlings, Wilson, Nike & Under Armour.
2011 Draft Order
Courtesy of Baseball America
First-Round:
 1. Pirates (57-105)
 2. Mariners (61-101)
 3. Diamondbacks (65-97)
 4. Orioles (66-96)
 5. Royals (67-95)
 6. Nationals (69-93)
 7. Diamondbacks (for B. Loux)
 8. Indians (69-93)
 9. Cubs (75-87)
10. Padres (for Karsten Whitson)
11. Astros (76-86)
12. Brewers (77-85)
13. Mets (79-83)
14. Marlins (80-82)
15. Brewers (for Dylan Covey)
16. Dodgers (80-82)
17. Angels (80-82)
18. Athletics (81-81)
19. Red Sox (from DET for Martinez)
20. Rockies (83-79)
21. Blue Jays (85-77)
22. Cardinals (86-76)
23. Nationals (from CWS for Dunn)
24. Rays (from BOS for Crawford)
25. Padres (90-72)
26. Red Sox (from TEX for Beltre)
27. Reds (91-71)
28. Braves (91-71)
29. Giants (92-70)
30. Twins (94-68)
31. Rays (from NYY for Soriano)
32. Rays (96-66)
33. Rangers (from PHI for Lee)
Supplemental First Round:
34. Nationals (Dunn)
35. Blue Jays (Downs)
36. Red Sox (Martinez)
37. Rangers (Lee)
38. Rays (Crawford)
39. Phillies (Werth)
40. Red Sox (Beltre)
41. Rays (Soriano)
42. Rays (Balfour)
43. Diamondbacks (LaRoche)
44. Mets (Feliciano)
45. Rockies (Dotel)
46. Blue Jays (Buck)
47. White Sox (Putz)
48. Padres (Garland)
49. Giants (Uribe)
50. Twins (Hudson)
51. Yankees (Vazquez)
52. Rays (Benoit)
53. Blue Jays (Olivo)
54. Padres (Torrealba)
55. Twins (Crain)
56. Rays (Choate)
57. Blue Jays (Gregg)
58. Padres (Correia)
59. Rays (Hawpe)
| Baseball Beat | March 17, 2008 |
Categorizing Pitchers by Strikeout and Groundball Rates: Starters - 2007 Edition
It is no secret that the best outcome for a pitcher is a strikeout. There are no ifs, ands, or buts about that statement of fact. That's the way it has always been and that's the way it will always be. Except for the rare missed third strike, a strikeout always produces an out and no chance for runners to advance bases (other than a stolen base).
Among batted ball types, we know that infield flies are the least harmful, followed by groundballs, outfield flies, and line drives. In fact, thanks to researchers like Dave Studeman of The Hardball Times, we can even place a value on the run impact of each event. For example, according to Dave's Batted Balls Redux article in The Hardball Times Baseball Annual 2007, strikeouts had a run impact of -0.113, infield flies -0.088, groundballs 0.045, outfield flies 0.192, and line drives 0.391 per incident in 2006.
Although groundballs generate more hits and errors than flyballs, their run impact is lower because the hits are usually limited to singles and an occasional double down the first or third base line, whereas balls in the air that turn into hits more often become doubles, triples, or home runs. Not only is the run impact from a groundball lower than an outfield fly or line drive but groundball pitchers give up fewer line drives and flyballs. Conversely, pitchers who don't induce as many groundballs allow more line drives and flyballs. One of the basic truths of maintaining a low home run rate is to keep batted balls on the ground. It is also important to note that home run rates tend to fluctuate more than groundball rates because park effects and randomness play a huge role when it comes to the outcome of long flyballs, especially among pitchers.
Based on the above information, it follows that just as pitchers with high strikeout rates would generally fare better than those with low rates, pitchers with high groundball rates would normally fare better than those with low rates (all else being equal). Furthermore, it also suggests that pitchers who combine higher strikeout and groundball rates will outperform those with lower rates.
With the foregoing in mind, in January 2007, I introduced the idea of categorizing starters and relievers by strikeout and groundball rates. Due to the popularity of this series, I have decided to categorize pitchers based on the 2007 data. Like last year, I have greatly benefited from the help of David Appelman of FanGraphs in creating graphs that plot strikeout and groundball rates separately for starters and relievers (featured in part two on Tuesday).
The x-axis is strikeouts per batter faced (K/BF) and the y-axis is groundball percentage (GB%). The graph for the starting pitchers (defined as major leaguers who completed 100 or more innings and started in at least 33% of their appearances) is divided into quadrants with the mid-point equal to the average K/BF of 16.33% and the average GB% of 43.88%. By placing pitchers in quadrants, one can easily ascertain those with above-average strikeout and groundball rates (referred herein as the northeast quadrant), above-average strikeout and below-average groundball rates (southeast quadrant), above-average groundball and below-average strikeout rates (northwest quadrant), and below-average groundball and strikeout rates (southwest quadrant).
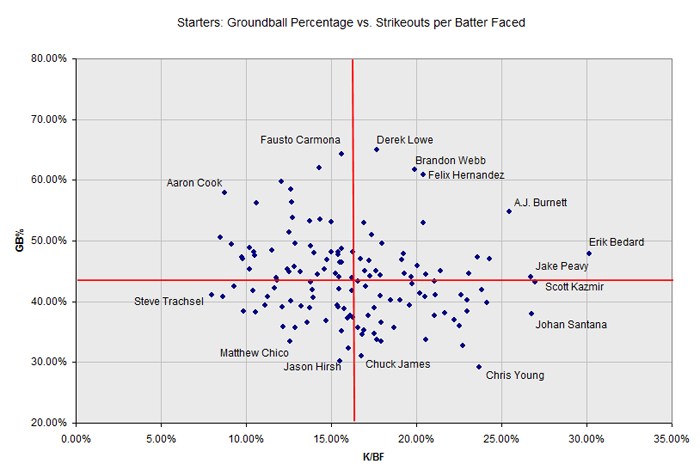
Looking at the outliers in the graph is one of the most interesting aspects of this study. Starting with the northeast quadrant and going clockwise, Derek Lowe, Brandon Webb, Felix Hernandez, A.J. Burnett, Erik Bedard, Jake Peavy, Scott Kazmir, Johan Santana, Chris Young, Chuck James, Jason Hirsh, Matthew Chico, Steve Trachsel, Aaron Cook, and Fausto Carmona all stand out for their extreme (good or bad) strikeout and/or groundball rates. Is there anybody who wouldn't take the outliers in the northeast quadrant over the outliers in the southwest quadrant? Lowe (3.88), Webb (3.01), Hernandez (3.92), Burnett (3.75), Bedard (3.16), and Peavy (2.54) all had much lower ERAs than Hirsh (4.81), Chico (4.63), and Trachsel (4.90).
Let's take a closer look at the results. Pitchers in the northeast, southeast, and southwest quadrants are sorted by K/BF rates. Pitchers in the northwest quadrant are listed in the order of GB rates.
NORTHEAST QUADRANT (ABOVE-AVG K AND GB RATES)
Pitcher               K/BF      GB%
Erik Bedard          30.15%    47.87%
Jake Peavy           26.73%    44.00%
A.J. Burnett         25.47%    54.82%
Tim Lincecum         24.27%    47.04%
Josh Beckett         23.60%    47.31%
John Smoltz          23.09%    44.69%
C.C. Sabathia        21.44%    45.00%
Dan Haren            20.53%    44.44%
Dustin McGowan       20.43%    53.04%
Felix Hernandez      20.42%    60.83%
Ian Snell            20.07%    45.93%
Brandon Webb         19.90%    61.76%
Kelvim Escobar       19.70%    44.00%
John Lackey          19.27%    44.69%
Jeremy Bonderman     19.26%    47.91%
Carlos Zambrano      19.14%    46.85%
Daniel Cabrera       18.00%    49.51%
Jeff Francis         17.90%    44.39%
Derek Lowe           17.69%    64.97%
Boof Bonser          17.62%    45.05%
Chad Gaudin          17.38%    50.97%
Mark Hendrickson     17.29%    44.13%
Gil Meche            17.22%    46.81%
Edwin Jackson        16.95%    45.06%
Roy Oswalt           16.92%    52.97%
Doug Davis           16.71%    47.02%
There are a number of outstanding arms in the group above. The best of the lot are those with strikeout rates north of 20 and/or groundball rates in the low-50s and above (both of which would be about 20% over the averages). Interestingly, Bedard, Burnett, Josh Beckett, John Smoltz, C.C. Sabathia, Dan Haren, Hernandez, Webb, Kelvim Escobar, Jeremy Bonderman, Carlos Zambrano, Roy Oswalt, and Doug Davis are all northeast quadrant returnees from last season.
Lowe graduated from the northwest quadrant (13.47% K/BF and 67.04% GB in 2006) to the northeast quadrant (17.69% and 64.97%) by improving his strikeout rate 4.22 percentage points or more than 30% while excelling at inducing grounders. The righthanded sinkerballer had the best groundball and line drive (15.8%) rates in the NL last season. Amazingly, he also had the highest home run rate as a percentage of flyballs (17.1%). According to THT, "research has shown that about 11% to 12% of outfield flies are hit for home runs. For pitchers, significant variations from 11% are probably the result of 'luck'." Here's betting that Lowe's GB will remain fairly steady while his HR/FB rate regresses toward the league mean.
The biggest surprises in the northeast quadrant for me were Mark Hendrickson and Edwin Jackson. However, both had K and GB rates that were close to the league average. As such, I wouldn't classify either as a special pitcher. If anything, I would think of Jackson more along the lines of Daniel Cabrera, another power arm, than not. Both are blessed – or cursed as it may be – with that "p" word, as in potential.
SOUTHEAST QUADRANT (ABOVE-AVG K AND BELOW-AVG GB RATES)
Pitcher               K/BF      GB%
Scott Kazmir         26.94%    43.15%
Johan Santana        26.77%    38.02%
Javier Vazquez       24.15%    39.77%
Cole Hamels          23.82%    41.87%
Chris Young          23.69%    29.15%
Daisuke Matsuzaka    23.00%    38.39%
Aaron Harang         23.00%    40.27%
Oliver Perez         22.75%    32.79%
Chad Billingsley     22.63%    41.04%
Rich Hill            22.54%    36.01%
John Maine           22.22%    36.96%
Yovani Gallardo      21.67%    38.17%
Justin Verlander     21.13%    41.12%
James Shields        21.05%    43.38%
Orlando Hernandez    21.05%    37.75%
Ted Lilly            20.54%    33.67%
Randy Wolf           20.52%    40.78%
Wandy Rodriguez      20.20%    41.44%
Chris Capuano        19.73%    42.95%
Matt Cain            19.59%    39.44%
Byung-Hyun Kim       19.04%    40.17%
Ervin Santana        18.67%    35.64%
Shaun Marcum         18.48%    40.17%
Jason Bergmann       17.92%    33.43%
Ben Sheets           17.91%    36.53%
Brett Tomko          17.86%    41.01%
Claudio Vargas       17.69%    33.79%
John Danks           17.52%    34.76%
Andrew Sonnanstine   17.51%    38.94%
Brian Burres         17.17%    37.73%
Jeremy Guthrie       17.01%    42.49%
Bronson Arroyo       16.94%    35.28%
Scott Baker          16.83%    34.64%
Chuck James          16.79%    30.99%
Jered Weaver         16.55%    35.65%
David Bush           16.54%    43.36%
There are at least a dozen outstanding pitchers in this group, most notably those listed in the top half (or with K rates over 20%). Kazmir just missed the northeast quadrant although he had K and GB rates that were almost identical to Peavy, who just so happened to win the Triple Crown of pitching by leading the NL in ERA, wins, and strikeouts.
Young had the ninth-highest K/BF rate of all starting pitchers and was the only one with a GB% below 30. Despite being an extreme flyball pitcher, Young has benefited by pitching his home games at Petco Park, which tied with Busch Stadium for the second-lowest HR rate in the majors in 2007 (behind only RFK Stadium).
NORTHWEST QUADRANT (ABOVE-AVG GB AND BELOW-AVG K RATES)
Pitcher               GB%       K/BF
Fausto Carmona       64.31%    15.59%
Tim Hudson           61.96%    14.27%
Sergio Mitre         59.73%    12.08%
Chien-Ming Wang      58.45%    12.64%
Aaron Cook           57.89%     8.74%
Kameron Loe          56.33%    12.68%
Lenny DiNardo        56.28%    10.63%
Julian Tavarez       53.78%    12.75%
Jake Westbrook       53.54%    14.35%
Paul Maholm          53.25%    13.73%
Roy Halladay         53.10%    14.99%
Greg Maddux          51.48%    12.53%
Zach Duke            50.62%     8.51%
Jason Marquis        49.52%    12.88%
Brad Thompson        49.46%     9.14%
Justin Germano       49.19%    13.78%
Joe Kennedy          48.93%    10.18%
Brad Penny           48.72%    15.61%
Matt Morris          48.48%    11.54%
Kip Wells            48.21%    16.27%
Sean Marshall        48.18%    15.02%
Adam Wainwright      48.15%    15.42%
Jesse Litsch         48.14%    10.46%
Matt Albers          47.99%    13.98%
Andy Pettitte        47.69%    15.39%
Carlos Silva         47.54%    10.50%
Chris Sampson        47.31%     9.77%
Kyle Kendrick        47.06%     9.82%
Joe Blanton          46.95%    14.74%
Dontrelle Willis     46.44%    15.50%
Kevin Millwood       46.42%    15.61%
Vicente Padilla      45.69%    12.84%
Joe Saunders         45.38%    14.59%
Jeff Suppan          45.38%    12.40%
Odalis Perez         45.36%    10.22%
Noah Lowry           44.92%    12.54%
Jose Contreras       44.89%    13.17%
Nate Robertson       44.63%    15.24%
Edgar Gonzalez       44.54%    14.19%
Miguel Batista       44.07%    15.47%
Chad Durbin          43.95%    11.76%
This is an interesting group of pitchers, ranging from the highly successful (Carmona, Tim Hudson, Chien-Ming Wang, Roy Halladay, and Brad Penny) to those fighting for a spot in a starting rotation or even the majors (Kameron Loe, Julian Tavarez, Jason Marquis, Brad Thompson, Justin Germano, Kip Wells, Sean Marshall, Matt Albers, Chris Sampson, Odalis Perez, Edgar Gonzalez, and Chad Durbin). There are also several hurlers who are still serviceable but have seen better days, such as Greg Maddux, Matt Morris, Andy Pettitte, and Kevin Millwood, as well as enigmas like Dontrelle Willis.
As a whole, they rank behind those in the NE quadrant and ahead of those in the SW quadrant. Opposite of the pitchers in the SE quadrant, the NW inhabitants succeed by inducing grounders and keeping the ball in the park, whereas their counterparts thrive on strikeouts.
SOUTHWEST QUADRANT (BELOW-AVG K AND GB RATES)
Pitcher               K/BF      GB%
Micah B Owings       16.28%    37.45%
Matt Belisle         16.21%    41.75%
Josh Towers          16.20%    43.85%
Scott Olsen          16.10%    37.65%
Buddy Carlyle        16.02%    32.35%
Curt Schilling       15.96%    37.27%
Kyle Davies          15.76%    38.83%
Anthony Reyes        15.61%    35.17%
Jason Hirsh          15.53%    30.17%
Tom Gorzelanny       15.45%    42.09%
Barry Zito           15.41%    39.12%
Jamie Moyer          15.34%    39.41%
Kyle Lohse           14.72%    36.89%
Jorge de la Rosa     13.92%    40.63%
Mike Mussina         13.87%    41.91%
Mark Buehrle         13.77%    43.23%
Tim Wakefield        13.75%    38.90%
Jarrod Washburn      13.59%    36.54%
Adam Eaton           13.22%    39.29%
Brandon McCarthy     12.85%    35.76%
Josh Fogg            12.62%    40.04%
Matthew Chico        12.58%    33.39%
Jeff Weaver          12.18%    35.80%
Woody Williams       12.12%    39.16%
David Wells          11.82%    43.53%
Braden Looper        11.66%    42.16%
Brian Bannister      11.27%    40.83%
Jon Garland          11.10%    39.44%
Paul Byrd            10.54%    38.26%
Tom Glavine          10.41%    41.75%
Livan Hernandez       9.86%    38.45%
Mike Maroth           9.29%    42.53%
Mike Bacsik           8.65%    40.84%
Steve Trachsel        7.98%    41.16%
Repeating what I said last year, "this is the quadrant that you want to avoid. It is inhabited by some of the worst starters in the game. If you fail to miss bats and don't keep the ball on the ground when it is put into play, you are going to run into trouble." There are two ways to survive (or perhaps semi-survive) in this quadrant: (1) being close to league average in both K and GB rates and (2) throwing strikes and maintaining a low walk rate. Matt Belisle, Josh Towers, and Tom Gorzelanny fit the first bill, while Belisle, Towers, Curt Schilling, Kyle Lohse, Mike Mussina, Mark Buehrle, Jeff Weaver, and David Wells would qualify under the second scenario. However, all of these types of pitchers live on the edge with very little margin for error.
When it comes to evaluating pitchers, I would rather know their strikeout and groundball rates than their ERA. Throw in walk rates and you have almost everything you need to know about a pitcher. Focusing on these components gives one a much more comprehensive understanding of a pitcher's upside and downside than looking at a single metric such as ERA.
Tomorrow: Categorizing Relievers by Strikeout and Groundball Rates.
Comments
Haven't you put Shields in the wrong quadrant? In the list, you have his K/BF ratio as 21.05 which puts him well above the mid-point of 16.33, and his GB% at 43.38, just slightly above the mid-point of 43.34. Doesn't that mean he just creeps into the Northeast quadrant rather than the Southeast one where you list him?
In fact, I think the same thing holds true for David Bush, although he seems even closer to the dividing line.
By the way, I am glad you are repeating this chart you began last year. It was one of my favorite posts.
Posted by: Bob R. at March 17, 2008 9:49 AM
I think this is my favorite feature every year! thanks!
Posted by: Ben at March 17, 2008 10:47 AM
Rich, if it was as simple as increase your K's and GB%, wouldn't everyone learn how to throw a sinker? I realize it's not that simple, and some people are more gifted at it than others, but it seems to me that organizational philosophies seldom teach sinkers in the minors. The Braves and Royals for example teach FB,CH,CB in the minors.
I guess the ultimate question I come to is, do you think it's important to have variety in a pitching staff? Is Chien-Ming Wang a more effective pitcher for the Yankees because he is the only one on the staff who throws a sinker?
Clearly the only places pitching staffs are created out of thin air is fantasy and video games, but as an objective, is it important to have variety in your rotation or would you rather take 5 guys who were all NE or NW pitchers? NE, SE?
Posted by: Evan at March 17, 2008 12:08 PM
Are you going to do this for the minor leagues again? That was an even cooler study last year.
Posted by: willkoky at March 17, 2008 12:44 PM
Interesting stats, but there are other numbers quite important, like walks that are equally important for the measureness of a pitcher's quality. For example, Dustin McGowan would seem to be a tremendous pitcher in 2007 (20.43% & 53.04%) but he allowed 61 BB in 169.7 innings. As a result he had a 4.08 ERA in a pitchers park.
IMO, 2 interesting cases are Chris Young (23.69% & 29.15%) and Brad Penny (15.61% & 48.72). Average percentages but Young had 3.12 ERA and Penny had 3.03%. That seems to indicate both are not so great pitchers as some people think.
3 young pitchers who have amazing % are Tim Lincecum, Fausto Carmona and Felix Hernández, under 25, and with great future.
Posted by: Mark (Seattle) at March 17, 2008 1:49 PM
Bob: Shields and Bush are actually categorized correctly in the southeast quadrant. I made a mistake when I listed the average GB rate for starters in the sixth paragraph and have since fixed my error. I originally typed 43.34% (which is the average rate for relievers) when, in fact, it should have been 43.88%.
Evan: A sinker isn't particularly effective at striking out batters. It induces a lot of groundballs but generally isn't the type of pitch that frequently misses bats. The FB, CB, CH combo is pretty standard fare among most pitchers. The sinker or two-seam fastball makes sense for those who either don't have an overpowering four seamer and/or a hammer curve. The most effective sinkers are those that are "heavy" and thrown down in the zone with late-breaking action.
As for my preference in pitchers, give me five guys who can whiff batters. The higher the strikeout rate, the less important whether the remaining outs are groundballs or flyballs but, all else equal, I will always favor those who can keep the ball on the ground and in the yard. Having a lefthander or two in the mix and/or righthanders that can handle LHB would be a secondary consideration as well.
Mark: Walks are obviously an important component and, in fact, I said as much in the concluding paragraph: "When it comes to evaluating pitchers, I would rather know their strikeout and groundball rates than their ERA. Throw in walk rates and you have almost everything you need to know about a pitcher. Focusing on these components gives one a much more comprehensive understanding of a pitcher's upside and downside than looking at a single metric such as ERA."
Young did not have "average percentages" by any means. As I mentioned, "Young had the ninth-highest K/BF rate of all starting pitchers and was the only one with a GB% below 30." As such, he was in the top ten in K/BF and was dead last in GB%, making him far from average in both.
Penny had an above-average groundball rate and his success was largely attributable to the fact that he had the lowest percentage of flyballs that turned into home runs. He is a good, solid pitcher, but I would look for his ERA to increase due to the likelihood that this HR rate is bound to go up this year.
Posted by: Rich Lederer at March 17, 2008 9:28 PM
Mark,
In the case McGowan.... Be careful quoting era as a description of how a pitcher performed. Walk rates are just one of the issues at hand. Along the same lines I'm not so sure the Rogers Center would be considered a pitchers park. 3.69 FIP
Posted by: harvey at March 17, 2008 9:32 PM
FYI, while the Rodgers Center in Toronto played as a pitcher's park last year, that was an outlier. The 3 previous years, it ranked in the top 10 hitter's parks (as high as fourth). In fact, the splits in Toronto last year were bizarre as it increased 2Bs, 3Bs, and HRs as it always does, but significantly reduced hits. K rates weren't up, but their infield defense was astounding. Does anyone know if they put a new type of turf down?
Posted by: Paul F. at March 17, 2008 10:22 PM
Why is Santana in the SE corner? Is it a ballpark thing? Will he benefit from Shea?
Posted by: Lurker at March 17, 2008 11:21 PM
Excellent work, Rich!
Posted by: Anthony W. at March 18, 2008 12:09 AM
Why is Santana in the SE corner? Is it a ballpark thing? Will he benefit from Shea?
In order:
Because he's a flyball pitcher.
No.
Yes.
Posted by: C. Joseph at March 18, 2008 1:57 AM
Didn't see Penny pitch last season, but in addition to giving up only 9 HRs, he walked 19 more batters than the previous season in an equal number of starts. 9 HRs is pretty fluky for him, but maybe he was being more selective in who he pitches to and around?
Posted by: Beals at March 18, 2008 2:27 AM
Santana's in the southeast because he's not a groundball pitcher.
Posted by: dan at March 18, 2008 7:59 AM
Mark: Funny thing is McGowan IS a tremendous pitcher!
Check out the old article on this site that was down on him a few months ago. I think by Rich Lederer but I could be mistaken.
He truly does fly under the radar. Not for too much longer though, I bet.
Posted by: zeppelin at March 18, 2008 11:29 AM
Wow, poor place for a typo.
The article certainly was not DOWN on McGowan. It was simply DONE a few months ago.
Posted by: zeppelin at March 18, 2008 11:31 AM