Rich Lederer • Baseball Beat
Patrick Sullivan • Change-Up
Jeremy Greenhouse • Touching Bases
Dave Allen • F/X Visualizations
Sky Andrecheck • Behind the Scoreboard
Marc Hulet • Around the Minors
Al Doyle • Past Times
Retired Uniforms:
Bryan Smith • WTNY
Joe Sheehan • Command Post
Jeff Albert • The Batter's Eye
RSS Feed
Home
*Examining the Past, Present, and Future*
Lineup Card
Recent Entries
» Putting Together a Reality Team
» Historical Hall of Fame Vote Comparisons: 2012
» An All-Christmas Team
» The New-Look Angels
» John Denny: The Forgotten Cy Young Award Winner
» Money Isn't Everything
» What Would It Take to Hit .400 in the 21st Century?
» Halos Heaven
» Brandon McCarthy's Breakout Season
» Link-o-Rama
» Historical Hall of Fame Vote Comparisons: 2012
» An All-Christmas Team
» The New-Look Angels
» John Denny: The Forgotten Cy Young Award Winner
» Money Isn't Everything
» What Would It Take to Hit .400 in the 21st Century?
» Halos Heaven
» Brandon McCarthy's Breakout Season
» Link-o-Rama
Best of Baseball Beat
Abstracts From the Abstracts
1977 Baseball Abstract
1978 Baseball Abstract
1979 Baseball Abstract
1980 Baseball Abstract
1981 Baseball Abstract
1982 Baseball Abstract
1983 Baseball Abstract
1984 Baseball Abstract
1985 Baseball Abstract
1986 Baseball Abstract
1987 Baseball Abstract
1988 Baseball Abstract
1978 Baseball Abstract
1979 Baseball Abstract
1980 Baseball Abstract
1981 Baseball Abstract
1982 Baseball Abstract
1983 Baseball Abstract
1984 Baseball Abstract
1985 Baseball Abstract
1986 Baseball Abstract
1987 Baseball Abstract
1988 Baseball Abstract
Bert Blyleven Series
Meeting Up and Hanging Out with Bert
The Results Are In And...
Aficionado Heavily Invested in Blyleven
Latest on Blyleven's Chances for the HOF
The Internet Zealot Responds
400 Down and 5 to Go...
Bert Be Home By Eleven?
Blyleven's Forgotten Season (1973)
HeyMan, Your Comments Don't Hold Water
The Waiting is the Hardest Part
Another Addition to the Blyleven Series
Search for the Truth
As Dominant as His HOF Contemporaries
Listen, Buster
A Larger Step for Blyleven
Answering the Naysayers (Part Two)
Another Small Step for Blyleven
Q&A: Blyleven on the Twins
The Majority Rules, Right?
It's All Dutch to Some
The Hall of Fame Case for Bert Blyleven
Q&A: Blyleven on Felix Hernandez
Clemens Rocketing Up Charts
Poz: An Interview With a KC Star
A HOF Chat with Tracy Ringolsby
Up Close and Personal
A Peek Into the Mind of a HOF Voter
Answering the Naysayers
It's That Time of the Year (Again)
"If Cooperstown is Calling..."
The Bert Alert
One Small Step for Blyleven...
Only the Lonely
Exclusive Interviews
Lee Sinins
Alex Belth
David Pinto
Will Carroll
Mike Carminati
Aaron Gleeman
Joe Sheehan
Jay Jaffe
Jeff Peek
Tracy Ringolsby
Joe Posnanski
Bill James Part I, II, III
Jon Lalonde
Chuck Tiffany
Dayn Perry
Fay Vincent
Nate Silver
Alex Belth
David Pinto
Will Carroll
Mike Carminati
Aaron Gleeman
Joe Sheehan
Jay Jaffe
Jeff Peek
Tracy Ringolsby
Joe Posnanski
Bill James Part I, II, III
Jon Lalonde
Chuck Tiffany
Dayn Perry
Fay Vincent
Nate Silver
Bullpen
Rich Lederer
The Odd Couple (with Alex Belth)
The MostUnder Over Underrated Player in Baseball (with Brian Gunn)
Three Wise Men (roundtable by Alex Belth)
Infrequently Asked Questions (interview with Matt Welch)
Interview (Orioles Think Tank)
Bernie and the Yanks (Bronx Banter)
Hope and Faith: How the LAA Win the World Series (Baseball Prospectus)
NL West (The Soul of Baseball)
Greatest Living Hitter? (Sports Illustrated)
Roundtable: 2008 HOF Ballot (Armchair GM)
The Most
Three Wise Men (roundtable by Alex Belth)
Infrequently Asked Questions (interview with Matt Welch)
Interview (Orioles Think Tank)
Bernie and the Yanks (Bronx Banter)
Hope and Faith: How the LAA Win the World Series (Baseball Prospectus)
NL West (The Soul of Baseball)
Greatest Living Hitter? (Sports Illustrated)
Roundtable: 2008 HOF Ballot (Armchair GM)
Patrick Sullivan
Designated Hitters
David Bromberg (Q&A: John Denny)
Mark Armour (H. Killebrew and Versatility)
Joe Lederer (Soundtrack of a Prospect)
David Bromberg (Clemente's Autograph)
David Bromberg (Woody Fryman)
D. Baumstein (WAR Against Age: Pitchers)
Doug Baumstein (The WAR Against Age)
Doug Baumstein (A Lifetime on the Road)
John Fraser (Pick Six)
Mark Armour (How to Score More Runs?)
Bill Parker (What Opening Day Tells Us)
Stan Opdyke (Pat Rispole)
Chris Jaffe (Evaluating Baseball's Mgrs)
Stan Opdyke (Baseball Radio in NYC, 1953)
A. Nathan (Performance of Baseball Bats)
Michael Weddell (Edgar Martinez/HOF)
Jon Weisman (100 Things Dodgers Fans...)
Stan Opdyke (Connie Mack and Vin Scully)
Eric Walker (Evaluating Run Production)
Brent Mayne (The Intangibles of Catching)
Chris Moore (Best Fastballs in Baseball)
Dave Baldwin (The Batter’s Brain)
Shawn Haviland (Ivy League to MLB)
Larry Granillo (Walking Off)
Rob Iracane (Solo HR Won't Break You)
Tommy Bennett (Charm of AM Radio)
Harry Pavlidis (Johan Santana's Fast Start)
John Walsh (WAR and Remembrance)
Eric Walker (Precisely Inaccurate)
Bob Timmermann (As They See 'Em)
Geoff Young (Unicycles and Delusions)
Baseball Analysis at Tufts (Groundballers)
Baseball Analysis at Tufts (GB Out Rates)
G. Rybarczyk ('09 Hit Tracker Projections)
Joe Lederer (Curt Schilling/HoF)
Conor Gallagher (Hall of Fallacies)
Chris Green (Jim Rice, HoF, the Numbers)
Shawn Hoffman (Baseball's Bear Mkt?)
Paul Anthony (Manny Syndrome)
Ross Roley (World Series Odds)
B. Timmermann (Catcher's Interference)
R.J. Anderson (Waiting the Hardest Part)
Maury Brown (Cubs, MLB, and Cuban...)
Myron Logan (Dee-Fense, Dee-Fense)
Craig Calcaterra (Frivolity, Part I, Part II)
Chad Finn (Ode to Baseball Cards)
David Cameron (Mariners Foibles)
Chris Dial (Chipper Jones)
Pat Lederer (Memory Lane)
David Appelman (Clutch Pitching)
Bob Rittner (DH)
Jonathan Mayo (Roger Clemens)
Lisa Winston (My Son-in-Law...)
Russ McQueen (The Yellow Hammer)
Bob Rittner (I'm OK, You're OK)
Mark Armour (In Defense of the HOF)
Pat Jordan (Friends)
Dan Levitt (Analysis of Terry Ryan)
Doug Baumstein (Trading Econ 101)
Ross Roley (Runner's Reluctance II)
Ross Roley (Runner's Reluctance I)
Mark Armour (No-Longer Lovable Sox)
Bruce Regal (Stealthy and Wise)
Brian Gunn (Roid Monster)
Current/McEvoy (Value of the SB)
John Rickert (Sinister Thefts)
Nate Silver (Sabermetrics)
David Vincent (Home Run Production)
Joe P. Sheehan (Enhanced Gameday II)
Mark Armour (An Ode to Sport)
David Gassko (All-Time Worm Burners)
Joe P. Sheehan (Enhanced Gameday)
John Walsh (When Titans Clash)
Fox/Williams (Quantifying Coaches II)
Fox/Williams (Quantifying Coaches I)
Jacob Luft (Bull Durham Rant)
Chad Finn (Strat-O-Matic)
Lisa Winston (Rotisserie Baseball)
Dave Studeman (Baseball Stats)
Steve Treder (Roger Craig)
Marc Normandin (Jeff Bagwell)
D. Appelman (Expanding Strike Zone)
Jeff Sackmann (Worst MiL Defenders)
Jeff Sackmann (Best MiL Defenders)
Maxwell Kates (Van Lingle Mungo)
David Appelman (Pitch Location)
Kent Bonham (Danny Ray Herrera)
Glenn Stout (Two Baseball Poems)
Bruce Regal (The Challenge Round)
Mark Lamster (Barry & Ty)
Geoff Young (NL West)
Tom Lederer (The Ryan Express)
Brian Erts (Great Leap Forward)
David Pinto (Parity and the N.L.)
Jacob Luft (Fathers and Daughters)
Jamey Newberg (Pete's Sake)
Jeff Albert (A. Jones Swing Analysis)
Jeff Albert (A-Rod Swing Analysis)
Keith Law (Death, Taxes, and Waivers)
Peter Abraham (Tales of Torre Tales)
Larry Borowsky (Let 'er Rip II)
Dan Levitt (Empirical Analysis of Bunting)
Jonah Keri (If I Met Warren Cromartie...)
Bob Klapisch (War Stories)
Bob Timmermann (John F. Kennedy HS)
Kent Bonham (Aluminum Adjustments)
Al Doyle (More Than Superstars)
Ross Roley (Instant Replay)
David Vincent (Barry Bonds Homers)
Chad Finn (Our Favorite Obscurities)
Bill Deane (1979 NL MVP)
Mark Armour (Rise/Fall of Artificial Turf)
Jeff Angus (Wally Moon Camp)
David Berri (Money and Baseball)
Larry Borowsky (Baseball w/o the #s)
Derek Zumsteg (The Irrational Market)
David Regan (Free Agent Contracts)
Peter Schmuck (Steroids and the HOF)
David Appelman (Pitchers, Pitch by Pitch)
Dan Fox (Swinging, Taking, Fouling, Etc)
Patrick Sullivan (Study of NYY CF/BOS LF)
Will Leitch (Baseball Journalism)
Jeff Sullivan (Pitcher Release Points)
Steve Treder ('69-'70 Giants)
Maury Brown (Charlie Finley)
John Brattain (Bob Johnson)
Bob Klapisch (The Case for Bert Blyleven)
Jeff Peek (Pride and Prejudice)
Dayn Perry (Bert and Warren)
Rob Neyer (If Don Sutton Was Great...)
Lisa Winston (Minor League Memories)
Alex Belth (Otis Redding Was Right)
David Cameron (Long Live the King)
Jeff Angus (Baserunning Study)
Bert Blyleven (Baseball Playoffs)
Boyd Nation (Not a Prospect List)
James Click (Batters-Baserunners Study)
Jeff Shaw (Why I Love Baseball)
David Gassko (BIP/BFP Fielding Study)
Jay Jaffe (Milwaukee Sausage Race)
Jamey Newberg (Remember When)
Bob Klapisch (Press Box to the Mound)
Dan Levitt (Predictive Value of BB)
David Vincent (Official Scorer)
Jon Weisman (Rick Monday)
Larry Borowsky (Let 'er Rip)
Will Carroll (Fictional Short Story)
Bob Timmermann (Japanese Baseball)
Cyril Morong (Best Pitching Seasons)
Sean Forman (Monte Carlo Win-Loss)
Brian Gunn (My Little Blue Book)
Joe Lederer (My Dad and Baseball)
Bill Deane (Bob Gibson, 1968)
Mark Armour (1977 Yankees)
Darren Viola (Retrosheet)
David Pinto (RFK)
Dayn Perry (Brave Heart)
Matt Welch (Dave Hansen)
Kevin Kernan (Jack McKeon)
Tom Lederer (Dodgers Road Trip)
Steve Lombardi (Slider)
Studes (Picturing Baseball)
Mike Carminati (Luck of the Drawl)
Eric Neel (Vin Scully)
J.C. Bradbury (Leo Mazzone)
John Sickels (Bill James)
Search Baseball Analysts
Archives
By Category:
Around the Majors Content Only
Around the Minors Content Only
Baseball Beat Content Only
Baseball Beat/Change-Up Content Only
Baseball Beat/WTNY Content Only
Behind the Scoreboard Content Only
Change-Up Content Only
Change-Up/Around the Majors Content Only
Command Post Content Only
Crunching the Numbers Content Only
Designated Hitter Content Only
F/X Visualizations Content Only
Past Times Content Only
Saber Talk Content Only
The Batter's Eye Content Only
Touching Bases Content Only
Weekend Blog Content Only
WTNY Content Only
By Month:
February 2012
January 2012
December 2011
October 2011
September 2011
August 2011
July 2011
June 2011
May 2011
April 2011
March 2011
February 2011
January 2011
December 2010
November 2010
October 2010
September 2010
August 2010
July 2010
June 2010
May 2010
April 2010
March 2010
February 2010
January 2010
December 2009
November 2009
October 2009
September 2009
August 2009
July 2009
June 2009
May 2009
April 2009
March 2009
February 2009
January 2009
December 2008
November 2008
October 2008
September 2008
August 2008
July 2008
June 2008
May 2008
April 2008
March 2008
February 2008
January 2008
December 2007
November 2007
October 2007
September 2007
August 2007
July 2007
June 2007
May 2007
April 2007
March 2007
February 2007
January 2007
December 2006
November 2006
October 2006
September 2006
August 2006
July 2006
June 2006
May 2006
April 2006
March 2006
February 2006
January 2006
December 2005
November 2005
October 2005
September 2005
August 2005
July 2005
June 2005
May 2005
April 2005
March 2005
February 2005
January 2005
December 2004
November 2004
October 2004
September 2004
August 2004
July 2004
June 2004
May 2004
April 2004
March 2004
February 2004
January 2004
December 2003
November 2003
October 2003
September 2003
August 2003
July 2003
June 2003
Reference
Organizational Stats
Arizona Diamondbacks Bat / Pitch
Atlanta Braves Bat / Pitch
Baltimore Orioles Bat / Pitch
Boston Red Sox Bat / Pitch
Chicago Cubs Bat / Pitch
Chicago White Sox Bat / Pitch
Cincinnati Reds Bat / Pitch
Cleveland Indians Bat / Pitch
Colorado Rockies Bat / Pitch
Detroit Tigers Bat / Pitch
Florida Marlins Bat / Pitch
Houston Astros Bat / Pitch
Kansas City Royals Bat / Pitch
Los Angeles Angels Bat / Pitch
Los Angeles Dodgers Bat / Pitch
Milwaukee Brewers Bat / Pitch
Minnesota Twins Bat / Pitch
New York Mets Bat / Pitch
New York Yankees Bat / Pitch
Oakland Athletics Bat / Pitch
Philadelphia Phillies Bat / Pitch
Pittsburgh Pirates Bat / Pitch
St. Louis Cardinals Bat / Pitch
San Diego Padres Bat / Pitch
San Francisco Giants Bat / Pitch
Seattle Mariners Bat / Pitch
Tampa Bay Devil Rays Bat / Pitch
Texas Rangers Bat / Pitch
Toronto Blue Jays Bat / Pitch
Washington Nationals Bat / Pitch
All-Star Links
Official Websites
News and Notes
Baseball News Blog
Baseball Newstand
ESPN Baseball
Fox Sports Baseball
Pro Sports Daily
Roto World
The Roto Times
USA Today Baseball
Baseball Newstand
ESPN Baseball
Fox Sports Baseball
Pro Sports Daily
Roto World
The Roto Times
USA Today Baseball
Reference and Analysis
Baseball Almanac
Baseball America
Baseball Archive
Baseball Contracts
Baseball Cube
Baseball Graphs
Baseball Library
Baseball Musings Player Database
Baseball Page
Baseball Primer
Baseball Prospectus
Baseball Reference
Baseball Statistics
Baseball Truth
Boxscore Central
Diamond Mind Baseball
Doug's Stats
FanGraphs
Fast Balls (pitchfx catalog)
Hardball Dollars
Hardball Times
Hit Tracker
Retrosheet
Rotobase/Rotoblog
Stat Corner
STATS
Tango on Baseball
Yahoo Sports MLB
Web Gems
Bill James Primer
Sabermetric Manifesto (Grabiner)
Pitching and Defense (McCracken)
Pitching and Defense (Tippett)
Transactions Primer (Neyer)
Baseball Stats (Batter's Box)
Prospect Report (Cameron)
Pitcher Workloads (Sheehan)
Goodbye to Old Baseball Ideas (Rickey)
Sabermetric Manifesto (Grabiner)
Pitching and Defense (McCracken)
Pitching and Defense (Tippett)
Transactions Primer (Neyer)
Baseball Stats (Batter's Box)
Prospect Report (Cameron)
Pitcher Workloads (Sheehan)
Goodbye to Old Baseball Ideas (Rickey)
Columnists
Baseball Blogs
Around the Majors
Athletics Nation
Baseball Crank
Baseball Musings
Baseball-Reference Blog
Batter's Box
Big League Stew
Bronx Banter
Catfish Stew
Cub Town
Dan Agonistes
Dodger Thoughts
DRays Bay
Ducksnorts
Futility Infielder
Halos Heaven
Inside the Rockies
It Might Be Dangerous
Knuckle Curve
LoHud Yankees Blog
Lookout Landing
Management by Baseball
Metaforian
Metsgeek
Mike's Baseball Rants
Only Baseball Matters
Redbird Nation
Red Reporter
Sabernomics (Braves)
Seth Speaks
ShysterBall
6-4-2 (Angels/Dodgers)
The Book
TheCubdom
The Cutting Edge
The House That Dewey Built
The View From The Bleachers
Tiger Blog
U.S.S. Mariner
Viva El Birdos
Where's Kernan
Minor Leagues
Arizona Fall League
BA Player Finder
Cal Leaguers
Jamey Newberg
JDM's Scoresheet Baseball
Minor League Baseball
Minor League Park Factors
Minor League Splits
No Pepper
Sickels' Minor League Ball
Warm October Nights
BA Player Finder
Cal Leaguers
Jamey Newberg
JDM's Scoresheet Baseball
Minor League Baseball
Minor League Park Factors
Minor League Splits
No Pepper
Sickels' Minor League Ball
Warm October Nights
Amateur
Boyd's World (College)
Cape Cod Baseball League
College Baseball Blog
College Baseball Insider
Collegiate Baseball Newspaper
College Splits
College Splits Blog
Dirtbags Baseball (Long Beach State)
NCAA Baseball
NCBWA
Team One Baseball (High School)
Texas A&M & Baseball
Cape Cod Baseball League
College Baseball Blog
College Baseball Insider
Collegiate Baseball Newspaper
College Splits
College Splits Blog
Dirtbags Baseball (Long Beach State)
NCAA Baseball
NCBWA
Team One Baseball (High School)
Texas A&M & Baseball
Historical
Cuban Baseball
House of David
Jim "Mudcat" Grant's Web Page
Negro League Baseball Players Assoc
Negro Leagues Baseball Museum
1919 Black Sox
Pacific Coast League
Philadelphia Athletics Historical Society
Shoeless Joe Jackson Society
SABR-L Archives
Walter O'Malley
House of David
Jim "Mudcat" Grant's Web Page
Negro League Baseball Players Assoc
Negro Leagues Baseball Museum
1919 Black Sox
Pacific Coast League
Philadelphia Athletics Historical Society
Shoeless Joe Jackson Society
SABR-L Archives
Walter O'Malley
Miscellaneous
Forums
Credits
Ticket Center
Tickets to Baseball -
Premium Red Sox Tickets - Tickets to Marlins Games - Cardinals Game Tickets - NY Yankee Tickets - Tickets Oakland Athletics - Dallas Cowboys Tickets - Arizona Cardinals Tickets - Tickets Seattle Seahawks - Buffalo Bills Tickets Online - Tickets to Dolphins Football
Buy Boston Red Sox tickets,
Philadelphia Phillies tix,
NY Yankees tickets,
NY Mets tickets, and
MLB All Star game tickets at ABC tickets
Not sure where to find the best online sportsbooks? Start your search with PlayersJet.
Get deals at SportsMemorabilia.com on baseball apparel, including Phillies jerseys and more for adults and children.
Shop the largest selection baseball equipment on sale at Sports Unlimited. Check out tons of baseball gloves, youth baseball gloves and catchers gear from Rawlings, Wilson, Nike & Under Armour.
2011 Draft Order
Courtesy of Baseball America
First-Round:
 1. Pirates (57-105)
 2. Mariners (61-101)
 3. Diamondbacks (65-97)
 4. Orioles (66-96)
 5. Royals (67-95)
 6. Nationals (69-93)
 7. Diamondbacks (for B. Loux)
 8. Indians (69-93)
 9. Cubs (75-87)
10. Padres (for Karsten Whitson)
11. Astros (76-86)
12. Brewers (77-85)
13. Mets (79-83)
14. Marlins (80-82)
15. Brewers (for Dylan Covey)
16. Dodgers (80-82)
17. Angels (80-82)
18. Athletics (81-81)
19. Red Sox (from DET for Martinez)
20. Rockies (83-79)
21. Blue Jays (85-77)
22. Cardinals (86-76)
23. Nationals (from CWS for Dunn)
24. Rays (from BOS for Crawford)
25. Padres (90-72)
26. Red Sox (from TEX for Beltre)
27. Reds (91-71)
28. Braves (91-71)
29. Giants (92-70)
30. Twins (94-68)
31. Rays (from NYY for Soriano)
32. Rays (96-66)
33. Rangers (from PHI for Lee)
Supplemental First Round:
34. Nationals (Dunn)
35. Blue Jays (Downs)
36. Red Sox (Martinez)
37. Rangers (Lee)
38. Rays (Crawford)
39. Phillies (Werth)
40. Red Sox (Beltre)
41. Rays (Soriano)
42. Rays (Balfour)
43. Diamondbacks (LaRoche)
44. Mets (Feliciano)
45. Rockies (Dotel)
46. Blue Jays (Buck)
47. White Sox (Putz)
48. Padres (Garland)
49. Giants (Uribe)
50. Twins (Hudson)
51. Yankees (Vazquez)
52. Rays (Benoit)
53. Blue Jays (Olivo)
54. Padres (Torrealba)
55. Twins (Crain)
56. Rays (Choate)
57. Blue Jays (Gregg)
58. Padres (Correia)
59. Rays (Hawpe)
| F/X Visualizations | April 24, 2009 |
The Breaking and the Knuckling: Run Value by Pitch Movement
Over at Beyond the Box Score Sky Kalkman posted an introduction to understanding pitchf/x graphics. It is a great post for people who are having a hard time understanding these graphics. I also liked the comments section where there is some discussion of the state of pitchf/x analysis. In particular some commenters noted areas of the current analysis they found lacking.
Trey Hilman's Chin commented:
I do have one question to go along with all this. For any particular pitch, is there a range of movement that is generally recognized as “good” for that pitch classification? I am terrible at judging “stuff” simply by watching a pitch, but it would be nice to look at some of these charts and intuitively see that a particular pitch had a “nasty slider” tonight, etc.
Similarly, azruavatar wrote:
5 inches of break is absolutely meaningless to me in the context of a slider. I also question whether all 5 inches are created the same. Rivera’s cutter is notorious for late movement. If a pitch moves 5 inches over 20 feet compared to 5 inches over 60 feet that’s an incredible difference.
It seems that people are having the hardest time intuitively understanding pitch movement and putting an individual pitch's movement in perspective. Another commenter suggested Josh Kalk's two-part Anatomy of a League Average Pitcher series. The first broke down the league average fastball, sinker and cutter by presenting the frequency distribution of speed and movement for these pitches, and the second did so for off-speed and breaking pitches. These allow one to see if, say, a pitcher's curveball breaks more than the average curveball. But we are still left wondering if that additional movement makes the pitch any more successful. I will begin to address this question here for the breaking (and knuckling) pitches, and look at fastballs and changeups in a future post.
The pitchf/x system measures pitch movement in a number of ways but the two easiest to understand are the horizontal movement (pfx_x) and the vertical movement (pfx_z) of a pitch. Alan Nathan has a helpful description of the meaning behind these two values:
pfx_x,pfx_z: The deviation (in inches) of the pitch trajectory from a straight-line in the x (horizontal) and z (vertical) directions...[T]he effect of gravity has been removed from pfx_z, so that both parameters are the "break" of the pitch due to the Magnus force on a spinning baseball...[A positive value of pfx_x corresponds to] a deviation to the catcher's right and a negative value to the catcher's left. Similarly, a positive value of pfx_z is a pitch the drops less than it would from gravity alone (most pitches fall in this category), whereas a negative value is a pitch that drops more than from gravity alone (e.g., a "12-6" curveball).
So the movement of a pitch is the difference between where you would expect the pitch to end up as it crosses the plate based solely on its velocity, trajectory and gravity and where it actually ends up as it crosses the plate. This difference is broken up into its horizontal and vertical components. Then you can plot the horizontal and vertical movements of a number of pitches together in a scatter plot to see the movement of a particular pitch type or from a particular pitcher.
Curveballs
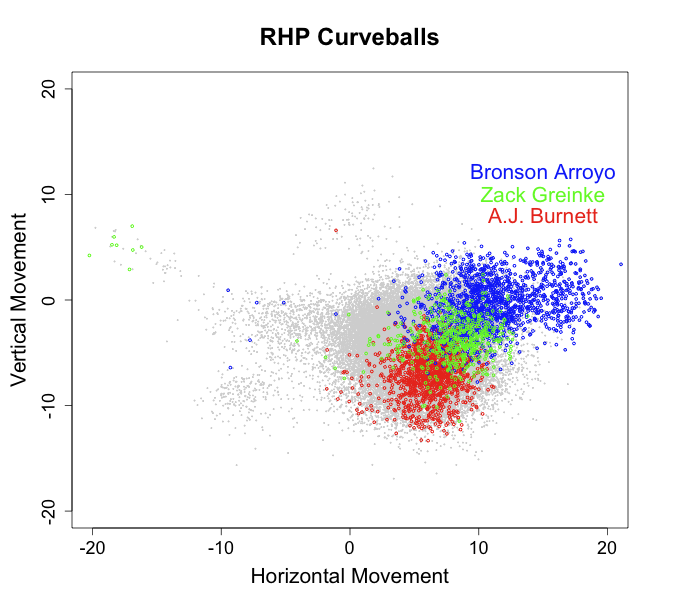
In gray, are all curveballs thrown by RHPs. You can see that most tail to the catcher's right by about 5 inches (meaning they tail away from RHBs) and break down by about 5 inches. On top I plotted the curveballs of three pitchers with distinctive and successful curves. Bronson Arroyo's curve has almost no vertical movement, but far and away the most horizontal movement of any curveball in the game. A.J. Burnett's curve, on the other hand, has some of the most downward movement of any pitcher's curve, but average horizontal movement. (Arroyo's curve's dependence on its heavy horizontal movement compared to Burnett's on its heavy vertical movement may partially explain Arroyo's more extreme platoon split compared to Brunett's). Zack Greinke combines intermediate levels of horizontal and vertical movement in his very successful curveball.
I am using the pitchf/x given pitch classifications and you can see three strange 'blobs' off of the central cluster of pitches. These are not curveballs. I think they are misclassified changeups. One cluster comes from sidearm pitchers and another from pitchers who throw sinking fastballs and changeups.
Now that we have seen the range of movement for all and a select group of individual pitchers's curves we can look at how curveball success varies by movement. In the images below I show the run value of a curve based on its movement. I decided to take a slightly different approach from my run value by location heat maps. I wanted to show not only the run value by movement, but also roughly the number of pitches with that movement. So I plotted the heat map colors on top of the scatter plot of pitches. Note that I change the color scale in each image, while this makes it harder to compare across images, it makes it easier to highlight differences within a particular image.
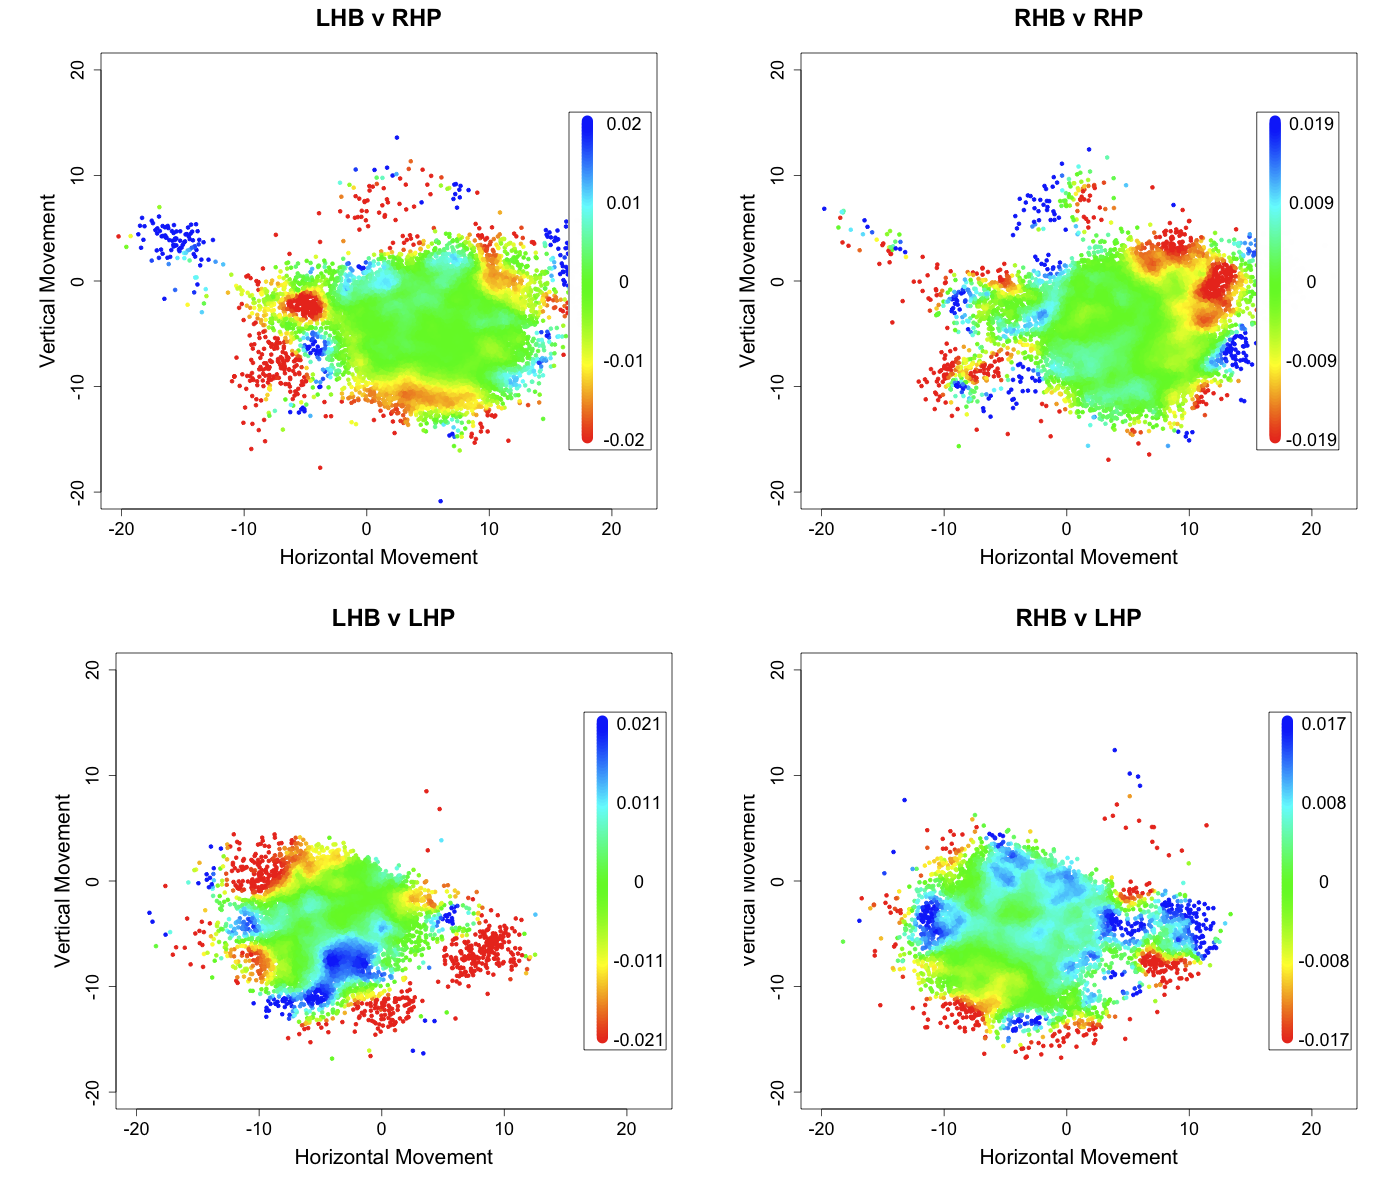
These are pretty messy complicated images. Studes suggests that at times these heat maps are too messy to be very informative. I think that is the case here (although I cannot agree too much or I lose my raison d'être). So I took a more traditional route below and plotted run value versus first the vertical movement (averaging over the horizontal) and then against the horizontal movement (averaging over the vertical).
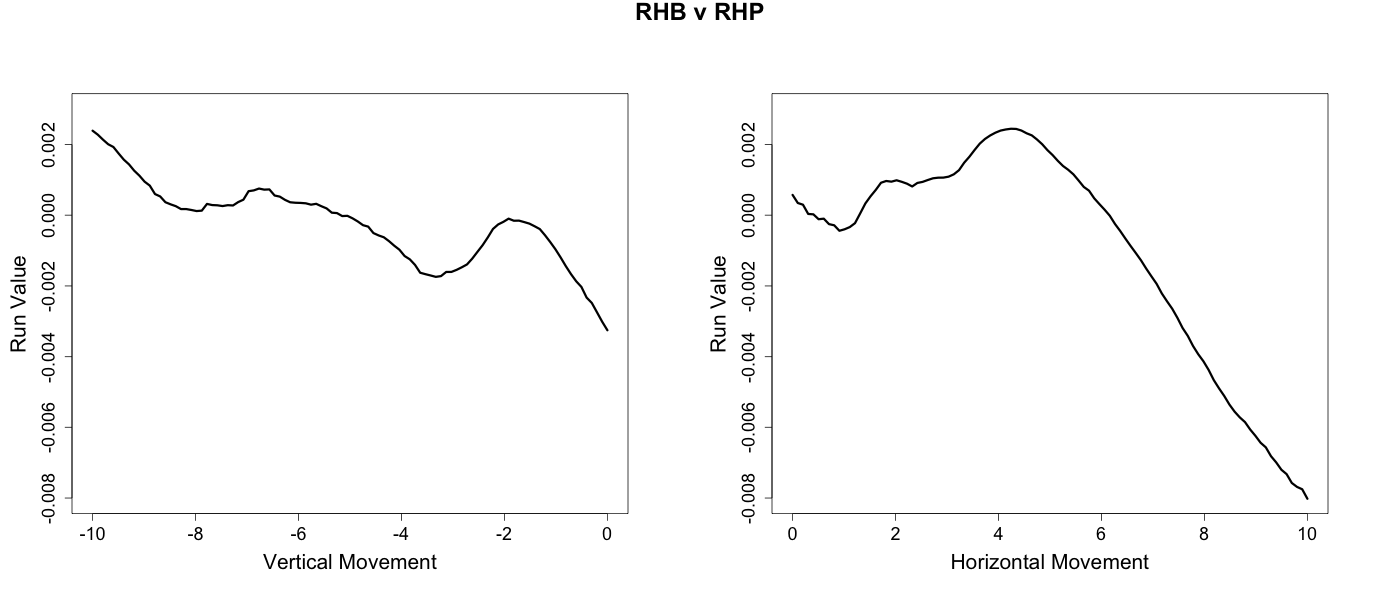
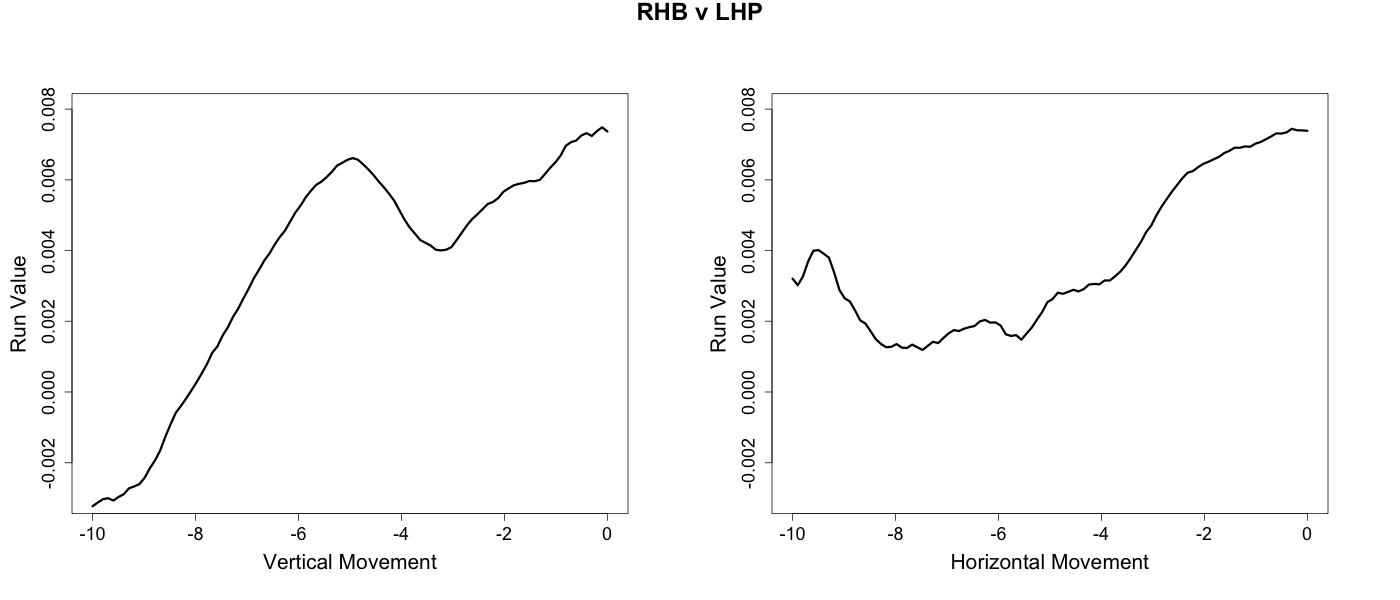
These figures reveal an interesting dichotomy between same handed versus opposite handed at-bats. In opposite handed at-bats the success of the curveball is mostly determined by its vertical break. The greater the downward break the more successful the curve. Conversely, in same handed at-bats the horizontal movement of the pitch largely drives the pattern. The more a curveball tails away from a batter the more successful it is.
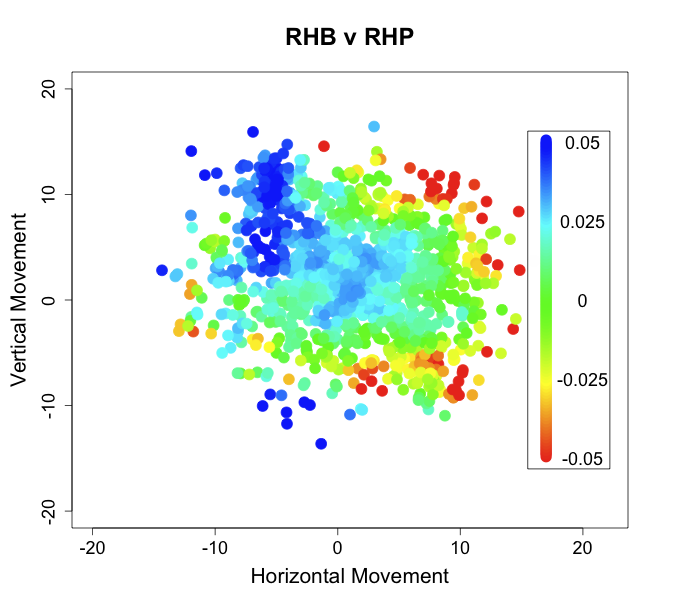
Sliders

RHP's sliders, on average, have slight tailing away movement from RHBs and slight rising movement, although there is considerable variation. Greg Maddux's slider, for example, tailed in to RHBs. Justin Duchscherer's slider has little horizontal movement but above average rising movement. Carlos Marmol's slider is in the top five among sliders for both horizontal and downward movement, which makes it the slider with the most overall movement in the game.
I use the same technique described above for curveballs to produce the run value by movement images for sliders below. Since sliders are thrown overwhelmingly in same handed at-bats I only present those.
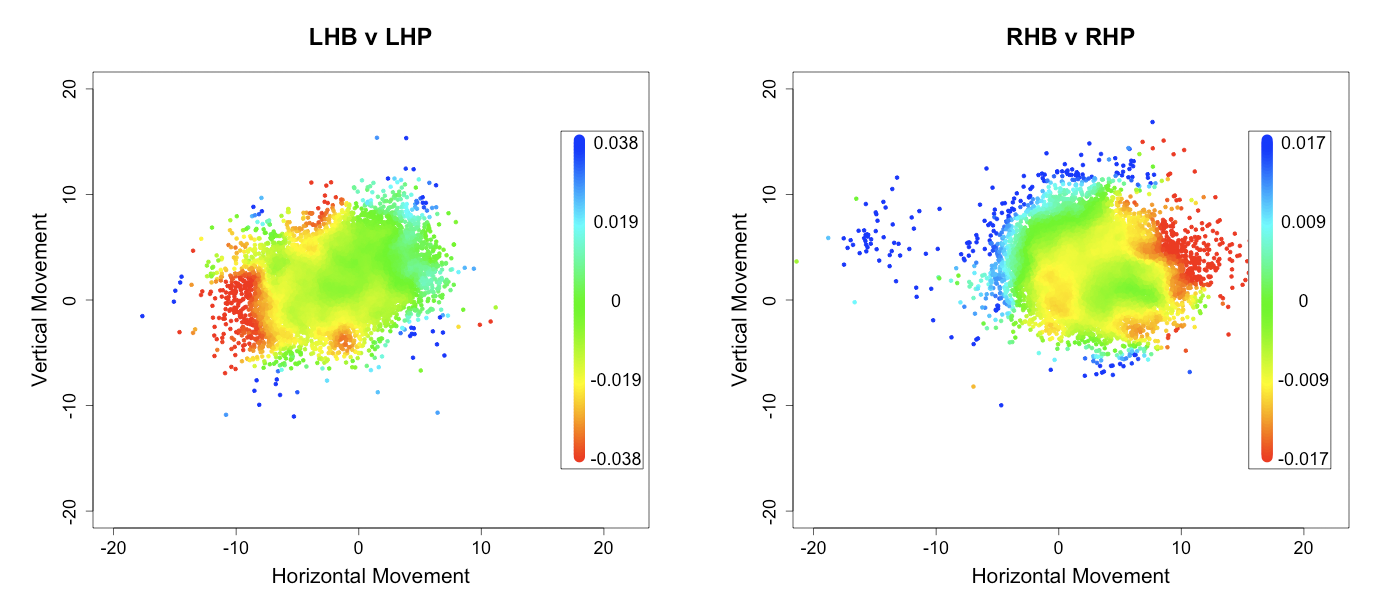
Here, I think, the heat maps show a relatively clear gradient, with sliders that tail away from the hitter the most being the most successful.
Knuckleballs
There are fewer knuckleballs thrown than sliders or curves, but I really wanted to include them. John Walsh wrote the seminal pitchf/x article on the knuckleball. He found that, unlike other pitches, knuckleballs do not have a consistent pattern of movement, but a random horizontal and vertical movement each anywhere from -15 to 15 inches (for Wakefield, at least). The success of an individual knuckleball varies directly with its, seemingly random, amount of movement; batters make less and poorer contact the more movement a knuckleball has. Using the method described above I am able to make one slight addition to Walsh's conclusion.
Outside of the north-west quadrant we get a confirmation of Walsh's results; there is a lower run value as the break increases. But knuckeballs with positive vertical movement and negative horizontal movement have even higher run values than those with no movement. Thus knuckleballs that break up and in to batters, even if they have a lot of movement, are very unsuccessful. This makes knuckleballs even more random; even if a pitcher can get lots of movement on his knuckleball if it happens to break up and in he could be in trouble.
In a future post I will look at fastball and changeup movement.
Comments
Great article, Dave.
I like your additional insight on the knuckler. That northwest quadrant is exactly where a typical RHP fastball moves, so a knuckler that breaks that way looks exactly like a BP fastball. No wonder they cream it.
BTW, I would like to take the credit, but that two-part Anatomy series was by Josh Kalk.
I'm looking forward to results on fastballs and changeups.
Posted by: John Walsh at April 24, 2009 7:01 AM
John,
Opps. I had it thoroughly in my head that you wrote those. I changed it. Thanks for bringing it to my attention.
Posted by: Dave Allen at April 24, 2009 7:35 AM
RJ's cool, too, but I, er Sky Kalkman, wrote that BtB Understand Pitch F/X Graphs article.
I agree heat maps can sometimes have too much going on, but that's also a good thing. For example, if you just look at horizontal movement or vertical movement alone, you're missing any dependence issues -- curve balls that don't move in one direction likely move more in another direction. I'm guessing that's what causes the humps in the one-dimensional graphs. That, and how similar/different the curve looks to other pitches in the repertoire.
Also, curve ball speed could play a large part in this analysis. Movement from spin is only part of why curve balls move. The other is that they're also a change up. And of course some pitchers throw a power curve which won't actually move as much in real terms as a slower curve with the same amount of spin.
Posted by: Sky's Biggest Fan at April 24, 2009 8:45 AM
Dave,
I really like this post. The dual use of heat maps and the more traditional plots is great. And don't worry, I think it would be very difficult for you to lose your 'raison d'être'!
Posted by: snowball2 at April 24, 2009 8:52 AM
Sky, er Sky's Biggest Fan,
Gosh, I am misattributing left and right here. Thanks for bringing that one to my attention. I changed it too.
I think that you are very right that pitch speed plays a big role too. Looking at just movement and averaging over speed and location is definitely very limited. If fast pitches, or pitches in the certain parts of the zone, are more likely to have a certain type of movement then those pitches will have lower run values. Here I will attribute that to movement while it is probably just a result of speed. So ultimately it will be important to look at speed and movement together.
Posted by: Dave Allen at April 24, 2009 5:11 PM
Great stuff. I like that you can see that average pitch movements often have positive run values, presumably because the batter is adjusted to them. In other words, below average movement is often better than average movement.
There is a distinctive green island in the RHB vs. RHP sliders heat chart for where slider movement is around average. And as you said for curveballs, same-handed at bats are driven by horizontal movement, where average is not average at all but actually in the hitter's favor, and same with opposite-handed matchups and vertical movement. I'm most interested in seeing how this relates to sinking/rising fastballs. I suspect that fastballs with average movement, which are called flat, get hammered.
Posted by: Jeremy Greenhouse at April 25, 2009 2:09 AM
Jeremy,
that is a good insight about pitches with average movement, which I didn't fully realize as I was writing the article. Thanks for bringing it up.
Posted by: Dave Allen at April 26, 2009 4:53 AM
Bert Blylevn should be in the hall of fame for his contributions to baseball. He was a great pitcher, and he is the best announcer I.ve ever heard, he is humerous, nand above all he is very intelligent of the game. Listening to Berts commentary has always been knowledgable and informative to me. He has always allowed me to capture my interest in the game. He was always a spectacular pitcher with his curve ball, and his domination of the hitter.
Posted by: Steve Taylor at April 29, 2009 7:05 PM
This is a fantastic article that basically proves what pitchers have known instinctively for 50 years.
In practice, when you swing at a ball breaking away from you, all of that horizontal break is lost power from your swing. Imagine getting punched in the shoulder by your big brother after you've made a snarky comment about his favorite baseball player: if you're moving away from the punch, even just a little, you end up absorbing most of the blow. If you tense up, you'll end up with a bruise.
So the more a slider or curve breaks away from the bat, even on good contact, it loses power and is more likely to be popped up to an outfielder or grounded.
The small movement thing was particularly interesting. I think the effect you're seeing is that on small movement, a hitter doesn't realize there was break on the ball until too late. Even the wiliest veteran's eyes will turn into a saucers as a fat, immobile curve, but when that sucker all of a sudden breaks with life, all of your power hits the top of the ball and you end up with a grounder.
A mid-level break, however, that ends up over the plate can get recognized. Hitters are taught to put a little wristed loop in their swings when they see it's a curve rather than a fastball coming. The loop won't help you on a big break, but if it breaks over the sweet spot you end up popping that little sphere of cork, twine and leather into a power alley, or, for the big guys, over the fence.
Posted by: Misopogon at April 30, 2009 2:07 PM