Rich Lederer • Baseball Beat
Patrick Sullivan • Change-Up
Jeremy Greenhouse • Touching Bases
Dave Allen • F/X Visualizations
Sky Andrecheck • Behind the Scoreboard
Marc Hulet • Around the Minors
Al Doyle • Past Times
Retired Uniforms:
Bryan Smith • WTNY
Joe Sheehan • Command Post
Jeff Albert • The Batter's Eye
RSS Feed
Home
*Examining the Past, Present, and Future*
Lineup Card
Recent Entries
» Putting Together a Reality Team
» Historical Hall of Fame Vote Comparisons: 2012
» An All-Christmas Team
» The New-Look Angels
» John Denny: The Forgotten Cy Young Award Winner
» Money Isn't Everything
» What Would It Take to Hit .400 in the 21st Century?
» Halos Heaven
» Brandon McCarthy's Breakout Season
» Link-o-Rama
» Historical Hall of Fame Vote Comparisons: 2012
» An All-Christmas Team
» The New-Look Angels
» John Denny: The Forgotten Cy Young Award Winner
» Money Isn't Everything
» What Would It Take to Hit .400 in the 21st Century?
» Halos Heaven
» Brandon McCarthy's Breakout Season
» Link-o-Rama
Best of Baseball Beat
Abstracts From the Abstracts
1977 Baseball Abstract
1978 Baseball Abstract
1979 Baseball Abstract
1980 Baseball Abstract
1981 Baseball Abstract
1982 Baseball Abstract
1983 Baseball Abstract
1984 Baseball Abstract
1985 Baseball Abstract
1986 Baseball Abstract
1987 Baseball Abstract
1988 Baseball Abstract
1978 Baseball Abstract
1979 Baseball Abstract
1980 Baseball Abstract
1981 Baseball Abstract
1982 Baseball Abstract
1983 Baseball Abstract
1984 Baseball Abstract
1985 Baseball Abstract
1986 Baseball Abstract
1987 Baseball Abstract
1988 Baseball Abstract
Bert Blyleven Series
Meeting Up and Hanging Out with Bert
The Results Are In And...
Aficionado Heavily Invested in Blyleven
Latest on Blyleven's Chances for the HOF
The Internet Zealot Responds
400 Down and 5 to Go...
Bert Be Home By Eleven?
Blyleven's Forgotten Season (1973)
HeyMan, Your Comments Don't Hold Water
The Waiting is the Hardest Part
Another Addition to the Blyleven Series
Search for the Truth
As Dominant as His HOF Contemporaries
Listen, Buster
A Larger Step for Blyleven
Answering the Naysayers (Part Two)
Another Small Step for Blyleven
Q&A: Blyleven on the Twins
The Majority Rules, Right?
It's All Dutch to Some
The Hall of Fame Case for Bert Blyleven
Q&A: Blyleven on Felix Hernandez
Clemens Rocketing Up Charts
Poz: An Interview With a KC Star
A HOF Chat with Tracy Ringolsby
Up Close and Personal
A Peek Into the Mind of a HOF Voter
Answering the Naysayers
It's That Time of the Year (Again)
"If Cooperstown is Calling..."
The Bert Alert
One Small Step for Blyleven...
Only the Lonely
Exclusive Interviews
Lee Sinins
Alex Belth
David Pinto
Will Carroll
Mike Carminati
Aaron Gleeman
Joe Sheehan
Jay Jaffe
Jeff Peek
Tracy Ringolsby
Joe Posnanski
Bill James Part I, II, III
Jon Lalonde
Chuck Tiffany
Dayn Perry
Fay Vincent
Nate Silver
Alex Belth
David Pinto
Will Carroll
Mike Carminati
Aaron Gleeman
Joe Sheehan
Jay Jaffe
Jeff Peek
Tracy Ringolsby
Joe Posnanski
Bill James Part I, II, III
Jon Lalonde
Chuck Tiffany
Dayn Perry
Fay Vincent
Nate Silver
Bullpen
Rich Lederer
The Odd Couple (with Alex Belth)
The MostUnder Over Underrated Player in Baseball (with Brian Gunn)
Three Wise Men (roundtable by Alex Belth)
Infrequently Asked Questions (interview with Matt Welch)
Interview (Orioles Think Tank)
Bernie and the Yanks (Bronx Banter)
Hope and Faith: How the LAA Win the World Series (Baseball Prospectus)
NL West (The Soul of Baseball)
Greatest Living Hitter? (Sports Illustrated)
Roundtable: 2008 HOF Ballot (Armchair GM)
The Most
Three Wise Men (roundtable by Alex Belth)
Infrequently Asked Questions (interview with Matt Welch)
Interview (Orioles Think Tank)
Bernie and the Yanks (Bronx Banter)
Hope and Faith: How the LAA Win the World Series (Baseball Prospectus)
NL West (The Soul of Baseball)
Greatest Living Hitter? (Sports Illustrated)
Roundtable: 2008 HOF Ballot (Armchair GM)
Patrick Sullivan
Designated Hitters
David Bromberg (Q&A: John Denny)
Mark Armour (H. Killebrew and Versatility)
Joe Lederer (Soundtrack of a Prospect)
David Bromberg (Clemente's Autograph)
David Bromberg (Woody Fryman)
D. Baumstein (WAR Against Age: Pitchers)
Doug Baumstein (The WAR Against Age)
Doug Baumstein (A Lifetime on the Road)
John Fraser (Pick Six)
Mark Armour (How to Score More Runs?)
Bill Parker (What Opening Day Tells Us)
Stan Opdyke (Pat Rispole)
Chris Jaffe (Evaluating Baseball's Mgrs)
Stan Opdyke (Baseball Radio in NYC, 1953)
A. Nathan (Performance of Baseball Bats)
Michael Weddell (Edgar Martinez/HOF)
Jon Weisman (100 Things Dodgers Fans...)
Stan Opdyke (Connie Mack and Vin Scully)
Eric Walker (Evaluating Run Production)
Brent Mayne (The Intangibles of Catching)
Chris Moore (Best Fastballs in Baseball)
Dave Baldwin (The Batter’s Brain)
Shawn Haviland (Ivy League to MLB)
Larry Granillo (Walking Off)
Rob Iracane (Solo HR Won't Break You)
Tommy Bennett (Charm of AM Radio)
Harry Pavlidis (Johan Santana's Fast Start)
John Walsh (WAR and Remembrance)
Eric Walker (Precisely Inaccurate)
Bob Timmermann (As They See 'Em)
Geoff Young (Unicycles and Delusions)
Baseball Analysis at Tufts (Groundballers)
Baseball Analysis at Tufts (GB Out Rates)
G. Rybarczyk ('09 Hit Tracker Projections)
Joe Lederer (Curt Schilling/HoF)
Conor Gallagher (Hall of Fallacies)
Chris Green (Jim Rice, HoF, the Numbers)
Shawn Hoffman (Baseball's Bear Mkt?)
Paul Anthony (Manny Syndrome)
Ross Roley (World Series Odds)
B. Timmermann (Catcher's Interference)
R.J. Anderson (Waiting the Hardest Part)
Maury Brown (Cubs, MLB, and Cuban...)
Myron Logan (Dee-Fense, Dee-Fense)
Craig Calcaterra (Frivolity, Part I, Part II)
Chad Finn (Ode to Baseball Cards)
David Cameron (Mariners Foibles)
Chris Dial (Chipper Jones)
Pat Lederer (Memory Lane)
David Appelman (Clutch Pitching)
Bob Rittner (DH)
Jonathan Mayo (Roger Clemens)
Lisa Winston (My Son-in-Law...)
Russ McQueen (The Yellow Hammer)
Bob Rittner (I'm OK, You're OK)
Mark Armour (In Defense of the HOF)
Pat Jordan (Friends)
Dan Levitt (Analysis of Terry Ryan)
Doug Baumstein (Trading Econ 101)
Ross Roley (Runner's Reluctance II)
Ross Roley (Runner's Reluctance I)
Mark Armour (No-Longer Lovable Sox)
Bruce Regal (Stealthy and Wise)
Brian Gunn (Roid Monster)
Current/McEvoy (Value of the SB)
John Rickert (Sinister Thefts)
Nate Silver (Sabermetrics)
David Vincent (Home Run Production)
Joe P. Sheehan (Enhanced Gameday II)
Mark Armour (An Ode to Sport)
David Gassko (All-Time Worm Burners)
Joe P. Sheehan (Enhanced Gameday)
John Walsh (When Titans Clash)
Fox/Williams (Quantifying Coaches II)
Fox/Williams (Quantifying Coaches I)
Jacob Luft (Bull Durham Rant)
Chad Finn (Strat-O-Matic)
Lisa Winston (Rotisserie Baseball)
Dave Studeman (Baseball Stats)
Steve Treder (Roger Craig)
Marc Normandin (Jeff Bagwell)
D. Appelman (Expanding Strike Zone)
Jeff Sackmann (Worst MiL Defenders)
Jeff Sackmann (Best MiL Defenders)
Maxwell Kates (Van Lingle Mungo)
David Appelman (Pitch Location)
Kent Bonham (Danny Ray Herrera)
Glenn Stout (Two Baseball Poems)
Bruce Regal (The Challenge Round)
Mark Lamster (Barry & Ty)
Geoff Young (NL West)
Tom Lederer (The Ryan Express)
Brian Erts (Great Leap Forward)
David Pinto (Parity and the N.L.)
Jacob Luft (Fathers and Daughters)
Jamey Newberg (Pete's Sake)
Jeff Albert (A. Jones Swing Analysis)
Jeff Albert (A-Rod Swing Analysis)
Keith Law (Death, Taxes, and Waivers)
Peter Abraham (Tales of Torre Tales)
Larry Borowsky (Let 'er Rip II)
Dan Levitt (Empirical Analysis of Bunting)
Jonah Keri (If I Met Warren Cromartie...)
Bob Klapisch (War Stories)
Bob Timmermann (John F. Kennedy HS)
Kent Bonham (Aluminum Adjustments)
Al Doyle (More Than Superstars)
Ross Roley (Instant Replay)
David Vincent (Barry Bonds Homers)
Chad Finn (Our Favorite Obscurities)
Bill Deane (1979 NL MVP)
Mark Armour (Rise/Fall of Artificial Turf)
Jeff Angus (Wally Moon Camp)
David Berri (Money and Baseball)
Larry Borowsky (Baseball w/o the #s)
Derek Zumsteg (The Irrational Market)
David Regan (Free Agent Contracts)
Peter Schmuck (Steroids and the HOF)
David Appelman (Pitchers, Pitch by Pitch)
Dan Fox (Swinging, Taking, Fouling, Etc)
Patrick Sullivan (Study of NYY CF/BOS LF)
Will Leitch (Baseball Journalism)
Jeff Sullivan (Pitcher Release Points)
Steve Treder ('69-'70 Giants)
Maury Brown (Charlie Finley)
John Brattain (Bob Johnson)
Bob Klapisch (The Case for Bert Blyleven)
Jeff Peek (Pride and Prejudice)
Dayn Perry (Bert and Warren)
Rob Neyer (If Don Sutton Was Great...)
Lisa Winston (Minor League Memories)
Alex Belth (Otis Redding Was Right)
David Cameron (Long Live the King)
Jeff Angus (Baserunning Study)
Bert Blyleven (Baseball Playoffs)
Boyd Nation (Not a Prospect List)
James Click (Batters-Baserunners Study)
Jeff Shaw (Why I Love Baseball)
David Gassko (BIP/BFP Fielding Study)
Jay Jaffe (Milwaukee Sausage Race)
Jamey Newberg (Remember When)
Bob Klapisch (Press Box to the Mound)
Dan Levitt (Predictive Value of BB)
David Vincent (Official Scorer)
Jon Weisman (Rick Monday)
Larry Borowsky (Let 'er Rip)
Will Carroll (Fictional Short Story)
Bob Timmermann (Japanese Baseball)
Cyril Morong (Best Pitching Seasons)
Sean Forman (Monte Carlo Win-Loss)
Brian Gunn (My Little Blue Book)
Joe Lederer (My Dad and Baseball)
Bill Deane (Bob Gibson, 1968)
Mark Armour (1977 Yankees)
Darren Viola (Retrosheet)
David Pinto (RFK)
Dayn Perry (Brave Heart)
Matt Welch (Dave Hansen)
Kevin Kernan (Jack McKeon)
Tom Lederer (Dodgers Road Trip)
Steve Lombardi (Slider)
Studes (Picturing Baseball)
Mike Carminati (Luck of the Drawl)
Eric Neel (Vin Scully)
J.C. Bradbury (Leo Mazzone)
John Sickels (Bill James)
Search Baseball Analysts
Archives
By Category:
Around the Majors Content Only
Around the Minors Content Only
Baseball Beat Content Only
Baseball Beat/Change-Up Content Only
Baseball Beat/WTNY Content Only
Behind the Scoreboard Content Only
Change-Up Content Only
Change-Up/Around the Majors Content Only
Command Post Content Only
Crunching the Numbers Content Only
Designated Hitter Content Only
F/X Visualizations Content Only
Past Times Content Only
Saber Talk Content Only
The Batter's Eye Content Only
Touching Bases Content Only
Weekend Blog Content Only
WTNY Content Only
By Month:
February 2012
January 2012
December 2011
October 2011
September 2011
August 2011
July 2011
June 2011
May 2011
April 2011
March 2011
February 2011
January 2011
December 2010
November 2010
October 2010
September 2010
August 2010
July 2010
June 2010
May 2010
April 2010
March 2010
February 2010
January 2010
December 2009
November 2009
October 2009
September 2009
August 2009
July 2009
June 2009
May 2009
April 2009
March 2009
February 2009
January 2009
December 2008
November 2008
October 2008
September 2008
August 2008
July 2008
June 2008
May 2008
April 2008
March 2008
February 2008
January 2008
December 2007
November 2007
October 2007
September 2007
August 2007
July 2007
June 2007
May 2007
April 2007
March 2007
February 2007
January 2007
December 2006
November 2006
October 2006
September 2006
August 2006
July 2006
June 2006
May 2006
April 2006
March 2006
February 2006
January 2006
December 2005
November 2005
October 2005
September 2005
August 2005
July 2005
June 2005
May 2005
April 2005
March 2005
February 2005
January 2005
December 2004
November 2004
October 2004
September 2004
August 2004
July 2004
June 2004
May 2004
April 2004
March 2004
February 2004
January 2004
December 2003
November 2003
October 2003
September 2003
August 2003
July 2003
June 2003
Reference
Organizational Stats
Arizona Diamondbacks Bat / Pitch
Atlanta Braves Bat / Pitch
Baltimore Orioles Bat / Pitch
Boston Red Sox Bat / Pitch
Chicago Cubs Bat / Pitch
Chicago White Sox Bat / Pitch
Cincinnati Reds Bat / Pitch
Cleveland Indians Bat / Pitch
Colorado Rockies Bat / Pitch
Detroit Tigers Bat / Pitch
Florida Marlins Bat / Pitch
Houston Astros Bat / Pitch
Kansas City Royals Bat / Pitch
Los Angeles Angels Bat / Pitch
Los Angeles Dodgers Bat / Pitch
Milwaukee Brewers Bat / Pitch
Minnesota Twins Bat / Pitch
New York Mets Bat / Pitch
New York Yankees Bat / Pitch
Oakland Athletics Bat / Pitch
Philadelphia Phillies Bat / Pitch
Pittsburgh Pirates Bat / Pitch
St. Louis Cardinals Bat / Pitch
San Diego Padres Bat / Pitch
San Francisco Giants Bat / Pitch
Seattle Mariners Bat / Pitch
Tampa Bay Devil Rays Bat / Pitch
Texas Rangers Bat / Pitch
Toronto Blue Jays Bat / Pitch
Washington Nationals Bat / Pitch
All-Star Links
Official Websites
News and Notes
Baseball News Blog
Baseball Newstand
ESPN Baseball
Fox Sports Baseball
Pro Sports Daily
Roto World
The Roto Times
USA Today Baseball
Baseball Newstand
ESPN Baseball
Fox Sports Baseball
Pro Sports Daily
Roto World
The Roto Times
USA Today Baseball
Reference and Analysis
Baseball Almanac
Baseball America
Baseball Archive
Baseball Contracts
Baseball Cube
Baseball Graphs
Baseball Library
Baseball Musings Player Database
Baseball Page
Baseball Primer
Baseball Prospectus
Baseball Reference
Baseball Statistics
Baseball Truth
Boxscore Central
Diamond Mind Baseball
Doug's Stats
FanGraphs
Fast Balls (pitchfx catalog)
Hardball Dollars
Hardball Times
Hit Tracker
Retrosheet
Rotobase/Rotoblog
Stat Corner
STATS
Tango on Baseball
Yahoo Sports MLB
Web Gems
Bill James Primer
Sabermetric Manifesto (Grabiner)
Pitching and Defense (McCracken)
Pitching and Defense (Tippett)
Transactions Primer (Neyer)
Baseball Stats (Batter's Box)
Prospect Report (Cameron)
Pitcher Workloads (Sheehan)
Goodbye to Old Baseball Ideas (Rickey)
Sabermetric Manifesto (Grabiner)
Pitching and Defense (McCracken)
Pitching and Defense (Tippett)
Transactions Primer (Neyer)
Baseball Stats (Batter's Box)
Prospect Report (Cameron)
Pitcher Workloads (Sheehan)
Goodbye to Old Baseball Ideas (Rickey)
Columnists
Baseball Blogs
Around the Majors
Athletics Nation
Baseball Crank
Baseball Musings
Baseball-Reference Blog
Batter's Box
Big League Stew
Bronx Banter
Catfish Stew
Cub Town
Dan Agonistes
Dodger Thoughts
DRays Bay
Ducksnorts
Futility Infielder
Halos Heaven
Inside the Rockies
It Might Be Dangerous
Knuckle Curve
LoHud Yankees Blog
Lookout Landing
Management by Baseball
Metaforian
Metsgeek
Mike's Baseball Rants
Only Baseball Matters
Redbird Nation
Red Reporter
Sabernomics (Braves)
Seth Speaks
ShysterBall
6-4-2 (Angels/Dodgers)
The Book
TheCubdom
The Cutting Edge
The House That Dewey Built
The View From The Bleachers
Tiger Blog
U.S.S. Mariner
Viva El Birdos
Where's Kernan
Minor Leagues
Arizona Fall League
BA Player Finder
Cal Leaguers
Jamey Newberg
JDM's Scoresheet Baseball
Minor League Baseball
Minor League Park Factors
Minor League Splits
No Pepper
Sickels' Minor League Ball
Warm October Nights
BA Player Finder
Cal Leaguers
Jamey Newberg
JDM's Scoresheet Baseball
Minor League Baseball
Minor League Park Factors
Minor League Splits
No Pepper
Sickels' Minor League Ball
Warm October Nights
Amateur
Boyd's World (College)
Cape Cod Baseball League
College Baseball Blog
College Baseball Insider
Collegiate Baseball Newspaper
College Splits
College Splits Blog
Dirtbags Baseball (Long Beach State)
NCAA Baseball
NCBWA
Team One Baseball (High School)
Texas A&M & Baseball
Cape Cod Baseball League
College Baseball Blog
College Baseball Insider
Collegiate Baseball Newspaper
College Splits
College Splits Blog
Dirtbags Baseball (Long Beach State)
NCAA Baseball
NCBWA
Team One Baseball (High School)
Texas A&M & Baseball
Historical
Cuban Baseball
House of David
Jim "Mudcat" Grant's Web Page
Negro League Baseball Players Assoc
Negro Leagues Baseball Museum
1919 Black Sox
Pacific Coast League
Philadelphia Athletics Historical Society
Shoeless Joe Jackson Society
SABR-L Archives
Walter O'Malley
House of David
Jim "Mudcat" Grant's Web Page
Negro League Baseball Players Assoc
Negro Leagues Baseball Museum
1919 Black Sox
Pacific Coast League
Philadelphia Athletics Historical Society
Shoeless Joe Jackson Society
SABR-L Archives
Walter O'Malley
Miscellaneous
Forums
Credits
Ticket Center
Tickets to Baseball -
Premium Red Sox Tickets - Tickets to Marlins Games - Cardinals Game Tickets - NY Yankee Tickets - Tickets Oakland Athletics - Dallas Cowboys Tickets - Arizona Cardinals Tickets - Tickets Seattle Seahawks - Buffalo Bills Tickets Online - Tickets to Dolphins Football
Buy Boston Red Sox tickets,
Philadelphia Phillies tix,
NY Yankees tickets,
NY Mets tickets, and
MLB All Star game tickets at ABC tickets
Not sure where to find the best online sportsbooks? Start your search with PlayersJet.
Get deals at SportsMemorabilia.com on baseball apparel, including Phillies jerseys and more for adults and children.
Shop the largest selection baseball equipment on sale at Sports Unlimited. Check out tons of baseball gloves, youth baseball gloves and catchers gear from Rawlings, Wilson, Nike & Under Armour.
2011 Draft Order
Courtesy of Baseball America
First-Round:
 1. Pirates (57-105)
 2. Mariners (61-101)
 3. Diamondbacks (65-97)
 4. Orioles (66-96)
 5. Royals (67-95)
 6. Nationals (69-93)
 7. Diamondbacks (for B. Loux)
 8. Indians (69-93)
 9. Cubs (75-87)
10. Padres (for Karsten Whitson)
11. Astros (76-86)
12. Brewers (77-85)
13. Mets (79-83)
14. Marlins (80-82)
15. Brewers (for Dylan Covey)
16. Dodgers (80-82)
17. Angels (80-82)
18. Athletics (81-81)
19. Red Sox (from DET for Martinez)
20. Rockies (83-79)
21. Blue Jays (85-77)
22. Cardinals (86-76)
23. Nationals (from CWS for Dunn)
24. Rays (from BOS for Crawford)
25. Padres (90-72)
26. Red Sox (from TEX for Beltre)
27. Reds (91-71)
28. Braves (91-71)
29. Giants (92-70)
30. Twins (94-68)
31. Rays (from NYY for Soriano)
32. Rays (96-66)
33. Rangers (from PHI for Lee)
Supplemental First Round:
34. Nationals (Dunn)
35. Blue Jays (Downs)
36. Red Sox (Martinez)
37. Rangers (Lee)
38. Rays (Crawford)
39. Phillies (Werth)
40. Red Sox (Beltre)
41. Rays (Soriano)
42. Rays (Balfour)
43. Diamondbacks (LaRoche)
44. Mets (Feliciano)
45. Rockies (Dotel)
46. Blue Jays (Buck)
47. White Sox (Putz)
48. Padres (Garland)
49. Giants (Uribe)
50. Twins (Hudson)
51. Yankees (Vazquez)
52. Rays (Benoit)
53. Blue Jays (Olivo)
54. Padres (Torrealba)
55. Twins (Crain)
56. Rays (Choate)
57. Blue Jays (Gregg)
58. Padres (Correia)
59. Rays (Hawpe)
| F/X Visualizations | April 17, 2009 |
What Did We Know This Time Last Year?
This early in the season the leader and laggard boards often have some interesting names, and it is fun to theorize which of these are legitimate breakouts (or breakdowns) and which are small sample size flukes. The pitchf/x data adds a powerful tool in helping with this classification. It allows us to look deeper into why a pitcher may have struggled or succeeded in a start. We have already seen some great analysis along these lines. RJ Anderson has a series of posts looking at Lincecum's, Sabathia's and Wheeler's performances thus far based on pitch speed and movement and release point. River Avenue Blues broke down Wang's first two games to see what might be up.
These are good examples of using all the data pitchf/x offers to assess recent performance. Of course what often happens is people just look at fastball speed and ignore movement, location, and release point data. For example after Cole Hamels first poor start everyone focused on his 86 mph fasball, but, as Hamels said himself, he started off with a fastball in the mid-80s early last year too. The image below shows Hamels's average fastball speed by start. The x-axis is not scaled by date, but by start (so no matter how far apart in time two consecutive starts are they are always the same distance apart along the x-axis). The division between seasons in marked with a red line.
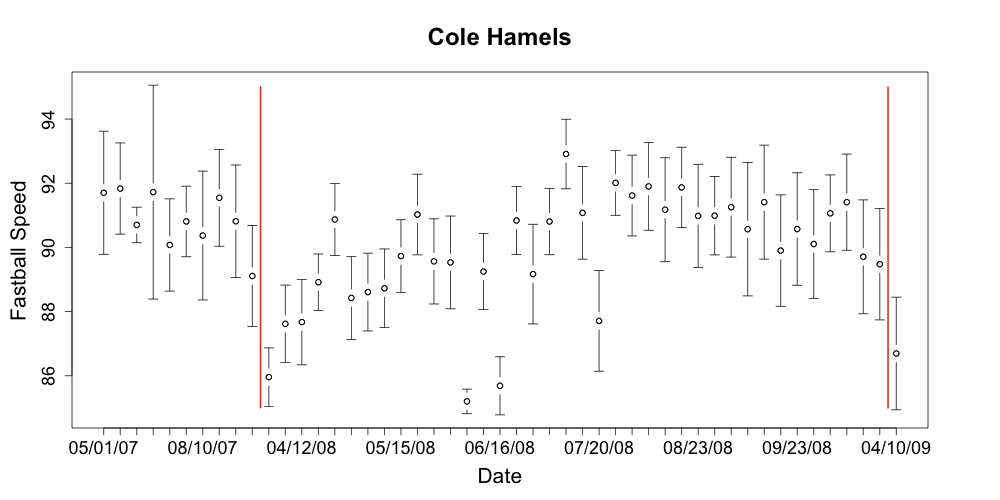
Hamels's fastball speed is right where it was last year (not to say that we should be worry free about Hamels; last year he pitched 261 innings after just 189 in 2007). This provides a useful way to see if a pitcher's speed is within his normal variation. Consider Wang:
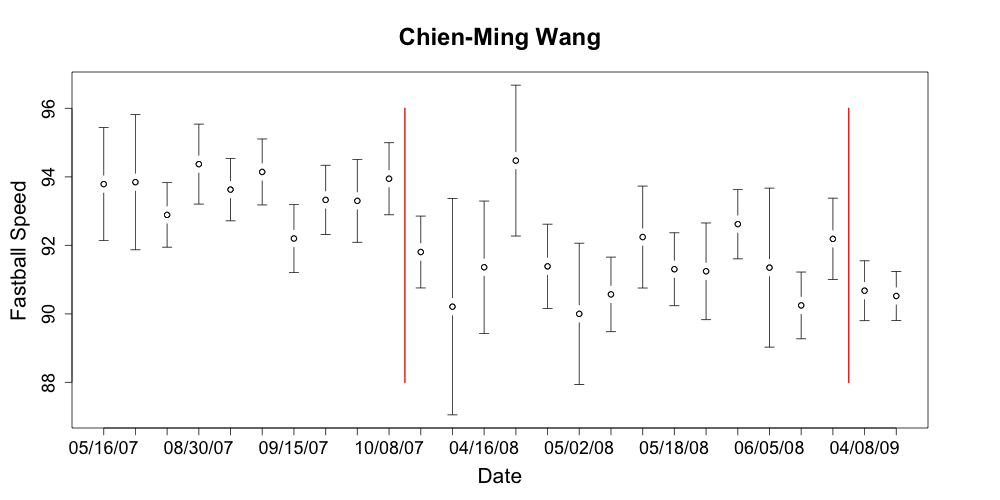
His fastball in his injury shortened 2008 was 2 mph slower than his fastball in 2007. For his first two starts of 2009 it is in the low range of his already low 2008 numbers. That could mean trouble.
As I noted earlier the best pitchf/x analysis will take into account all the data, but most people will be lazy. Like I just did, they will look at just fastball speed. So I wanted to know how much we could learn only looking at that. More specifically what can we say about performance for the rest of the season looking just at fastball speed thus far into the season. I looked back at last year to find out. Most starters have started two games with about 100 pitches per start, about half of them fastballs. So what can we know with 100 fastballs worth of data?
I started off with the average speed of every pitcher's first 100 fastballs in 2008 and then compared that with his average fastball speed for all of 2007. I wanted to see how well that pitcher performed from that point forward, so I found their FIP from the game after they reached their 100th fastball on in the 2008 season. (FIP stands for fielding independent pitching. Developed by Tangotiger, it roughly gives the expected ERA of a pitcher if he pitched in front of an average defense). From that I subtracted that player's preseason CHONE projected FIP (CHONE is one of the best projection systems. It was created by Sean Smith). The result is how the pitcher performed over the rest of the season relative to his projection. Here are the players with the biggest increase and decrease in fastball speed.
The second column is how much faster (or slower) the player's first 100 2008 fastballs were compared to his 2007 fastballs. A positive number is a faster fastball in 2008. The third is FIP minus projected FIP. Like ERA a low FIP is good, so a negative difference is outperforming the projection.
+---------------------+--------------+----------------+
| Name                | FB speed dif | FIP - proj FIP |
+---------------------+--------------+----------------+
| Ervin Santana	      |         2.28 |          -1.16 |
| Tim Lincecum        |         1.65 |          -0.83 |
| Josh Beckett        |         1.36 |          -0.45 |
| John Maine          |         1.07 |           0.10 |
| Santiago Casilla    |         1.06 |           0.92 |
| Wandy Roriguez      |         0.96 |          -0.84 |
| Manny Delcarmen     |         0.89 |          -0.86 |
| Wilfredo Ledezma    |         0.82 |          -0.05 |
| Shaun Marcum        |         0.79 |          -0.26 |
| Leo Nunez           |         0.77 |           0.05 |
+---------------------+--------------+----------------+
| Francisco Rodriguez |        -2.34 |           0.05 |
| Mike Mussina        |        -2.34 |          -1.37 |
| Daniel Cabrera      |        -2.49 |           0.82 |
| Brad Lidge          |        -2.51 |          -1.10 |
| Jeff Suppan         |        -2.61 |           0.80 |
| Oliver Perez        |        -2.81 |           0.21 |
| Chris Young         |        -3.42 |           0.41 |
| Bob Howry           |        -3.89 |           0.84 |
| Cole Hamels         |        -3.90 |           0.15 |
| Heath Bell          |        -4.01 |           0.30 |
+---------------------+--------------+----------------+
Although there is considerable variation seven of the ten pitchers with the largest increases in fastball speed outperformed their projection and eight of the ten with the largest decrease underperformed their projection. In addition the top two were two of the biggest breakout pitching performances of last year and you could have seen it just 100 fastballs into the season. Of course the trend is not perfect, 100 fastballs into the season Brad Lidge, Mike Mussina, Hamels and Francisco Rodriguez were way below their 2007 averages and they all had great seasons (although Hamels's and Rodriguez's performances were slightly worse than projected). Here are the results for all players.
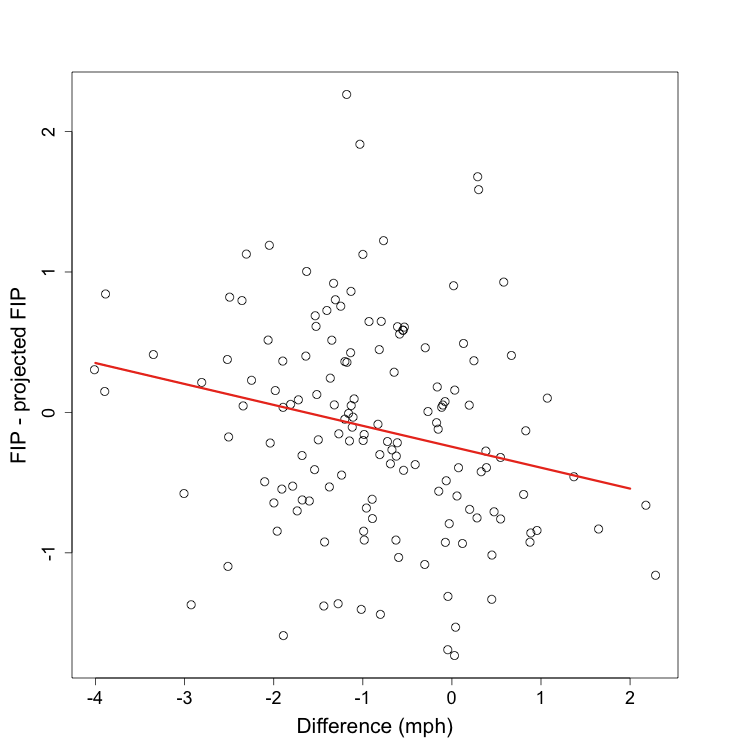
The relationship is very significant ( p < .01), but explains little of the variation (r2= 0.05). The equation for the best fit line is y = -0.24 - 0.15x. Where x is the difference in fastballs speeds (first 100 '08 fastballs minus '07 fastballs) and y is remaining 08 FIP minus projected FIP. So an increase of one mph is worth a 0.15 decrease in FIP (or each decrease of a mph is worth an increase of 0.15 FIP). Also if a pitcher is throwing just as fast in his first 100 fastballs of the season as he was all of last season (x = 0) you expect him to outperform his projection by almost 0.25 runs. If you thought going into the season he was a 4.00 FIP (or ERA) pitcher and his first 100 fastballs are just as fast as his fastballs the year before you would expect him to be a 3.75 FIP (or ERA) pitcher. But there is so much unexplained variation (95% in fact) this pitcher could end up performing very well or very poorly.
So, although the trend is significant, there is so much unexplained variation I would say with just the speed of the first 100 fastballs we don't know that much more than before. But that will not stop me from posting this season's leaders and laggards in fastball speed difference. Some of the pitchers have not reached the 100 fastball cutoff used in the above analysis. Remember someone at the top of the list could end up with very poor performance relative to projection, like Santiago Casilla last year. A pitcher at the bottom could end up like Mussina.
 Greatest difference between 09 fastball speed thus far and 08 fastball speed

+-------------------+--------+--------+
| Name              | Number |    Dif |
+-------------------+--------+--------+
| Todd Coffey       |     61 |   1.93 |
| Justin Verlander  |    119 |   1.81 |
| Kevin Correia     |    109 |   1.23 |
| Jonathan Sanchez  |     74 |   1.14 |
| Josh Johnson      |    163 |   1.14 |
| Matt Albers       |     55 |   1.13 |
| Chirs Volstad     |    117 |   1.09 |
| Adam Eaton        |     55 |   1.09 |
| Armando Galarraga |     97 |   0.98 |
| Jason Marquis     |    105 |   0.94 |
+-------------------+--------+--------+
| Geoff Geary       |     63 |  -2.04 |
| Matt Harrison     |     59 |  -2.05 |
| Daniel Cabrera    |    131 |  -2.25 |
| Manny Delcarman   |     68 |  -2.26 |
| Oliver Perez      |    126 |  -2.39 |
| Joe Saunders      |    128 |  -2.44 |
| Daisuke Matsuzaka |     62 |  -2.44 |
| Hideki Okajima    |     55 |  -2.66 |
| Dana Eveland      |     91 |  -2.88 |
| Dennis Sarfate    |     67 |  -3.12 |
+-------------------+--------+--------+
With all the caveats I will still venture that the pitchers at the top of the list, as a whole, out-perform their projections and the pitchers at the bottom under-perform. It will be interesting to see if any of the names on the top of this list turn out to be this season's Tim Lincecum or Ervin Santana.
Sorry this post was a little light on visualizations. I promise my next post will make up for it.
Comments
Excellent read Dave - especially love the visualization of the last graph
Posted by: Jason Collette at April 17, 2009 8:16 AM
Cool stuff. Did re-classify any pitches? Do you get similar results with end speeds?
The Wang article @ RAB was shaky, IMO - lots of talk about release points and movement without even addressing the alignment issues in Yankee Stadium in 2008.
Posted by: Harry Pavlidis at April 17, 2009 9:37 AM
Man Dave, your stuff is always interesting well presented. Cant wait till the next post!
Posted by: snowball2 at April 17, 2009 12:48 PM
Shouldn't players who spent a significant amount of time on the DL be omitted from the study to correct for a selection bias.
I can see pitchers who spent time on the DL last season coming back into 09 throwing harder only because their injury has been corrected. This could work in the opposite way as well, a pitcher like Matsuzaka lands on the DL after a couple starts where he struggles to hit 90.
I think this would have more value with injuries removed, as then going forward you could point to a drop in FB velocity and have somewhat of an either or proposition (hurt or going to do poorly).
This could be very interesting stuff, seen as when a pitcher drops their arm angle they get more movement at the sacrifice of sheer speed.
Interesting stuff. I'd say I can't wait to see the end results, but that would mean the season is over.
Posted by: Steve C at April 17, 2009 1:22 PM
Jason and Snowball2 (nice to see a fellow simpsons fan) thanks for the kind words.
Harry, I am using the provided pitchf/x pitch classifications. I am still looking into and thinking about pitch reclassification. But that is a very good point, especially since the classification algorithm changed this year. So fastball speed changes could be a result of fastballs being classified differently this year compared to last year.
Steve, that is a good suggestion. I did try and take out all guys switching between the bullpen and rotation (and vice veras), but I didn’t think of omitting players coming off of DL stints. Do you, or anyone else for that matter, know of a DL-database?
Posted by: Dave at April 17, 2009 2:45 PM
What effect do you think the WBC and longer spring training might have?
Posted by: Anonymous at April 17, 2009 10:17 PM
Good work, Dave.
Posted by: Al Doyle at April 18, 2009 7:46 AM
DL database linked in my name.
Posted by: Vegas Watch at April 18, 2009 9:39 AM
Anonymous,
I am not sure about longer spring training, but I looked at all pitchers who participated in the WBC this year. The WBC pitcher's fastballs so far this year have been 0.76 mph slower on average than their 2008 fastballs. The non-WBC pitcher's fastballs so far this year have been 0.88 mph slower. The difference, however, is not statistically significant (p=0.43).
Vegas Watch,
thanks for the link.
Posted by: Dave at April 18, 2009 4:33 PM