Rich Lederer • Baseball Beat
Patrick Sullivan • Change-Up
Jeremy Greenhouse • Touching Bases
Dave Allen • F/X Visualizations
Sky Andrecheck • Behind the Scoreboard
Marc Hulet • Around the Minors
Al Doyle • Past Times
Retired Uniforms:
Bryan Smith • WTNY
Joe Sheehan • Command Post
Jeff Albert • The Batter's Eye
RSS Feed
Home
*Examining the Past, Present, and Future*
Lineup Card
Recent Entries
» Putting Together a Reality Team
» Historical Hall of Fame Vote Comparisons: 2012
» An All-Christmas Team
» The New-Look Angels
» John Denny: The Forgotten Cy Young Award Winner
» Money Isn't Everything
» What Would It Take to Hit .400 in the 21st Century?
» Halos Heaven
» Brandon McCarthy's Breakout Season
» Link-o-Rama
» Historical Hall of Fame Vote Comparisons: 2012
» An All-Christmas Team
» The New-Look Angels
» John Denny: The Forgotten Cy Young Award Winner
» Money Isn't Everything
» What Would It Take to Hit .400 in the 21st Century?
» Halos Heaven
» Brandon McCarthy's Breakout Season
» Link-o-Rama
Best of Baseball Beat
Abstracts From the Abstracts
1977 Baseball Abstract
1978 Baseball Abstract
1979 Baseball Abstract
1980 Baseball Abstract
1981 Baseball Abstract
1982 Baseball Abstract
1983 Baseball Abstract
1984 Baseball Abstract
1985 Baseball Abstract
1986 Baseball Abstract
1987 Baseball Abstract
1988 Baseball Abstract
1978 Baseball Abstract
1979 Baseball Abstract
1980 Baseball Abstract
1981 Baseball Abstract
1982 Baseball Abstract
1983 Baseball Abstract
1984 Baseball Abstract
1985 Baseball Abstract
1986 Baseball Abstract
1987 Baseball Abstract
1988 Baseball Abstract
Bert Blyleven Series
Meeting Up and Hanging Out with Bert
The Results Are In And...
Aficionado Heavily Invested in Blyleven
Latest on Blyleven's Chances for the HOF
The Internet Zealot Responds
400 Down and 5 to Go...
Bert Be Home By Eleven?
Blyleven's Forgotten Season (1973)
HeyMan, Your Comments Don't Hold Water
The Waiting is the Hardest Part
Another Addition to the Blyleven Series
Search for the Truth
As Dominant as His HOF Contemporaries
Listen, Buster
A Larger Step for Blyleven
Answering the Naysayers (Part Two)
Another Small Step for Blyleven
Q&A: Blyleven on the Twins
The Majority Rules, Right?
It's All Dutch to Some
The Hall of Fame Case for Bert Blyleven
Q&A: Blyleven on Felix Hernandez
Clemens Rocketing Up Charts
Poz: An Interview With a KC Star
A HOF Chat with Tracy Ringolsby
Up Close and Personal
A Peek Into the Mind of a HOF Voter
Answering the Naysayers
It's That Time of the Year (Again)
"If Cooperstown is Calling..."
The Bert Alert
One Small Step for Blyleven...
Only the Lonely
Exclusive Interviews
Lee Sinins
Alex Belth
David Pinto
Will Carroll
Mike Carminati
Aaron Gleeman
Joe Sheehan
Jay Jaffe
Jeff Peek
Tracy Ringolsby
Joe Posnanski
Bill James Part I, II, III
Jon Lalonde
Chuck Tiffany
Dayn Perry
Fay Vincent
Nate Silver
Alex Belth
David Pinto
Will Carroll
Mike Carminati
Aaron Gleeman
Joe Sheehan
Jay Jaffe
Jeff Peek
Tracy Ringolsby
Joe Posnanski
Bill James Part I, II, III
Jon Lalonde
Chuck Tiffany
Dayn Perry
Fay Vincent
Nate Silver
Bullpen
Rich Lederer
The Odd Couple (with Alex Belth)
The MostUnder Over Underrated Player in Baseball (with Brian Gunn)
Three Wise Men (roundtable by Alex Belth)
Infrequently Asked Questions (interview with Matt Welch)
Interview (Orioles Think Tank)
Bernie and the Yanks (Bronx Banter)
Hope and Faith: How the LAA Win the World Series (Baseball Prospectus)
NL West (The Soul of Baseball)
Greatest Living Hitter? (Sports Illustrated)
Roundtable: 2008 HOF Ballot (Armchair GM)
The Most
Three Wise Men (roundtable by Alex Belth)
Infrequently Asked Questions (interview with Matt Welch)
Interview (Orioles Think Tank)
Bernie and the Yanks (Bronx Banter)
Hope and Faith: How the LAA Win the World Series (Baseball Prospectus)
NL West (The Soul of Baseball)
Greatest Living Hitter? (Sports Illustrated)
Roundtable: 2008 HOF Ballot (Armchair GM)
Patrick Sullivan
Designated Hitters
David Bromberg (Q&A: John Denny)
Mark Armour (H. Killebrew and Versatility)
Joe Lederer (Soundtrack of a Prospect)
David Bromberg (Clemente's Autograph)
David Bromberg (Woody Fryman)
D. Baumstein (WAR Against Age: Pitchers)
Doug Baumstein (The WAR Against Age)
Doug Baumstein (A Lifetime on the Road)
John Fraser (Pick Six)
Mark Armour (How to Score More Runs?)
Bill Parker (What Opening Day Tells Us)
Stan Opdyke (Pat Rispole)
Chris Jaffe (Evaluating Baseball's Mgrs)
Stan Opdyke (Baseball Radio in NYC, 1953)
A. Nathan (Performance of Baseball Bats)
Michael Weddell (Edgar Martinez/HOF)
Jon Weisman (100 Things Dodgers Fans...)
Stan Opdyke (Connie Mack and Vin Scully)
Eric Walker (Evaluating Run Production)
Brent Mayne (The Intangibles of Catching)
Chris Moore (Best Fastballs in Baseball)
Dave Baldwin (The Batter’s Brain)
Shawn Haviland (Ivy League to MLB)
Larry Granillo (Walking Off)
Rob Iracane (Solo HR Won't Break You)
Tommy Bennett (Charm of AM Radio)
Harry Pavlidis (Johan Santana's Fast Start)
John Walsh (WAR and Remembrance)
Eric Walker (Precisely Inaccurate)
Bob Timmermann (As They See 'Em)
Geoff Young (Unicycles and Delusions)
Baseball Analysis at Tufts (Groundballers)
Baseball Analysis at Tufts (GB Out Rates)
G. Rybarczyk ('09 Hit Tracker Projections)
Joe Lederer (Curt Schilling/HoF)
Conor Gallagher (Hall of Fallacies)
Chris Green (Jim Rice, HoF, the Numbers)
Shawn Hoffman (Baseball's Bear Mkt?)
Paul Anthony (Manny Syndrome)
Ross Roley (World Series Odds)
B. Timmermann (Catcher's Interference)
R.J. Anderson (Waiting the Hardest Part)
Maury Brown (Cubs, MLB, and Cuban...)
Myron Logan (Dee-Fense, Dee-Fense)
Craig Calcaterra (Frivolity, Part I, Part II)
Chad Finn (Ode to Baseball Cards)
David Cameron (Mariners Foibles)
Chris Dial (Chipper Jones)
Pat Lederer (Memory Lane)
David Appelman (Clutch Pitching)
Bob Rittner (DH)
Jonathan Mayo (Roger Clemens)
Lisa Winston (My Son-in-Law...)
Russ McQueen (The Yellow Hammer)
Bob Rittner (I'm OK, You're OK)
Mark Armour (In Defense of the HOF)
Pat Jordan (Friends)
Dan Levitt (Analysis of Terry Ryan)
Doug Baumstein (Trading Econ 101)
Ross Roley (Runner's Reluctance II)
Ross Roley (Runner's Reluctance I)
Mark Armour (No-Longer Lovable Sox)
Bruce Regal (Stealthy and Wise)
Brian Gunn (Roid Monster)
Current/McEvoy (Value of the SB)
John Rickert (Sinister Thefts)
Nate Silver (Sabermetrics)
David Vincent (Home Run Production)
Joe P. Sheehan (Enhanced Gameday II)
Mark Armour (An Ode to Sport)
David Gassko (All-Time Worm Burners)
Joe P. Sheehan (Enhanced Gameday)
John Walsh (When Titans Clash)
Fox/Williams (Quantifying Coaches II)
Fox/Williams (Quantifying Coaches I)
Jacob Luft (Bull Durham Rant)
Chad Finn (Strat-O-Matic)
Lisa Winston (Rotisserie Baseball)
Dave Studeman (Baseball Stats)
Steve Treder (Roger Craig)
Marc Normandin (Jeff Bagwell)
D. Appelman (Expanding Strike Zone)
Jeff Sackmann (Worst MiL Defenders)
Jeff Sackmann (Best MiL Defenders)
Maxwell Kates (Van Lingle Mungo)
David Appelman (Pitch Location)
Kent Bonham (Danny Ray Herrera)
Glenn Stout (Two Baseball Poems)
Bruce Regal (The Challenge Round)
Mark Lamster (Barry & Ty)
Geoff Young (NL West)
Tom Lederer (The Ryan Express)
Brian Erts (Great Leap Forward)
David Pinto (Parity and the N.L.)
Jacob Luft (Fathers and Daughters)
Jamey Newberg (Pete's Sake)
Jeff Albert (A. Jones Swing Analysis)
Jeff Albert (A-Rod Swing Analysis)
Keith Law (Death, Taxes, and Waivers)
Peter Abraham (Tales of Torre Tales)
Larry Borowsky (Let 'er Rip II)
Dan Levitt (Empirical Analysis of Bunting)
Jonah Keri (If I Met Warren Cromartie...)
Bob Klapisch (War Stories)
Bob Timmermann (John F. Kennedy HS)
Kent Bonham (Aluminum Adjustments)
Al Doyle (More Than Superstars)
Ross Roley (Instant Replay)
David Vincent (Barry Bonds Homers)
Chad Finn (Our Favorite Obscurities)
Bill Deane (1979 NL MVP)
Mark Armour (Rise/Fall of Artificial Turf)
Jeff Angus (Wally Moon Camp)
David Berri (Money and Baseball)
Larry Borowsky (Baseball w/o the #s)
Derek Zumsteg (The Irrational Market)
David Regan (Free Agent Contracts)
Peter Schmuck (Steroids and the HOF)
David Appelman (Pitchers, Pitch by Pitch)
Dan Fox (Swinging, Taking, Fouling, Etc)
Patrick Sullivan (Study of NYY CF/BOS LF)
Will Leitch (Baseball Journalism)
Jeff Sullivan (Pitcher Release Points)
Steve Treder ('69-'70 Giants)
Maury Brown (Charlie Finley)
John Brattain (Bob Johnson)
Bob Klapisch (The Case for Bert Blyleven)
Jeff Peek (Pride and Prejudice)
Dayn Perry (Bert and Warren)
Rob Neyer (If Don Sutton Was Great...)
Lisa Winston (Minor League Memories)
Alex Belth (Otis Redding Was Right)
David Cameron (Long Live the King)
Jeff Angus (Baserunning Study)
Bert Blyleven (Baseball Playoffs)
Boyd Nation (Not a Prospect List)
James Click (Batters-Baserunners Study)
Jeff Shaw (Why I Love Baseball)
David Gassko (BIP/BFP Fielding Study)
Jay Jaffe (Milwaukee Sausage Race)
Jamey Newberg (Remember When)
Bob Klapisch (Press Box to the Mound)
Dan Levitt (Predictive Value of BB)
David Vincent (Official Scorer)
Jon Weisman (Rick Monday)
Larry Borowsky (Let 'er Rip)
Will Carroll (Fictional Short Story)
Bob Timmermann (Japanese Baseball)
Cyril Morong (Best Pitching Seasons)
Sean Forman (Monte Carlo Win-Loss)
Brian Gunn (My Little Blue Book)
Joe Lederer (My Dad and Baseball)
Bill Deane (Bob Gibson, 1968)
Mark Armour (1977 Yankees)
Darren Viola (Retrosheet)
David Pinto (RFK)
Dayn Perry (Brave Heart)
Matt Welch (Dave Hansen)
Kevin Kernan (Jack McKeon)
Tom Lederer (Dodgers Road Trip)
Steve Lombardi (Slider)
Studes (Picturing Baseball)
Mike Carminati (Luck of the Drawl)
Eric Neel (Vin Scully)
J.C. Bradbury (Leo Mazzone)
John Sickels (Bill James)
Search Baseball Analysts
Archives
By Category:
Around the Majors Content Only
Around the Minors Content Only
Baseball Beat Content Only
Baseball Beat/Change-Up Content Only
Baseball Beat/WTNY Content Only
Behind the Scoreboard Content Only
Change-Up Content Only
Change-Up/Around the Majors Content Only
Command Post Content Only
Crunching the Numbers Content Only
Designated Hitter Content Only
F/X Visualizations Content Only
Past Times Content Only
Saber Talk Content Only
The Batter's Eye Content Only
Touching Bases Content Only
Weekend Blog Content Only
WTNY Content Only
By Month:
February 2012
January 2012
December 2011
October 2011
September 2011
August 2011
July 2011
June 2011
May 2011
April 2011
March 2011
February 2011
January 2011
December 2010
November 2010
October 2010
September 2010
August 2010
July 2010
June 2010
May 2010
April 2010
March 2010
February 2010
January 2010
December 2009
November 2009
October 2009
September 2009
August 2009
July 2009
June 2009
May 2009
April 2009
March 2009
February 2009
January 2009
December 2008
November 2008
October 2008
September 2008
August 2008
July 2008
June 2008
May 2008
April 2008
March 2008
February 2008
January 2008
December 2007
November 2007
October 2007
September 2007
August 2007
July 2007
June 2007
May 2007
April 2007
March 2007
February 2007
January 2007
December 2006
November 2006
October 2006
September 2006
August 2006
July 2006
June 2006
May 2006
April 2006
March 2006
February 2006
January 2006
December 2005
November 2005
October 2005
September 2005
August 2005
July 2005
June 2005
May 2005
April 2005
March 2005
February 2005
January 2005
December 2004
November 2004
October 2004
September 2004
August 2004
July 2004
June 2004
May 2004
April 2004
March 2004
February 2004
January 2004
December 2003
November 2003
October 2003
September 2003
August 2003
July 2003
June 2003
Reference
Organizational Stats
Arizona Diamondbacks Bat / Pitch
Atlanta Braves Bat / Pitch
Baltimore Orioles Bat / Pitch
Boston Red Sox Bat / Pitch
Chicago Cubs Bat / Pitch
Chicago White Sox Bat / Pitch
Cincinnati Reds Bat / Pitch
Cleveland Indians Bat / Pitch
Colorado Rockies Bat / Pitch
Detroit Tigers Bat / Pitch
Florida Marlins Bat / Pitch
Houston Astros Bat / Pitch
Kansas City Royals Bat / Pitch
Los Angeles Angels Bat / Pitch
Los Angeles Dodgers Bat / Pitch
Milwaukee Brewers Bat / Pitch
Minnesota Twins Bat / Pitch
New York Mets Bat / Pitch
New York Yankees Bat / Pitch
Oakland Athletics Bat / Pitch
Philadelphia Phillies Bat / Pitch
Pittsburgh Pirates Bat / Pitch
St. Louis Cardinals Bat / Pitch
San Diego Padres Bat / Pitch
San Francisco Giants Bat / Pitch
Seattle Mariners Bat / Pitch
Tampa Bay Devil Rays Bat / Pitch
Texas Rangers Bat / Pitch
Toronto Blue Jays Bat / Pitch
Washington Nationals Bat / Pitch
All-Star Links
Official Websites
News and Notes
Baseball News Blog
Baseball Newstand
ESPN Baseball
Fox Sports Baseball
Pro Sports Daily
Roto World
The Roto Times
USA Today Baseball
Baseball Newstand
ESPN Baseball
Fox Sports Baseball
Pro Sports Daily
Roto World
The Roto Times
USA Today Baseball
Reference and Analysis
Baseball Almanac
Baseball America
Baseball Archive
Baseball Contracts
Baseball Cube
Baseball Graphs
Baseball Library
Baseball Musings Player Database
Baseball Page
Baseball Primer
Baseball Prospectus
Baseball Reference
Baseball Statistics
Baseball Truth
Boxscore Central
Diamond Mind Baseball
Doug's Stats
FanGraphs
Fast Balls (pitchfx catalog)
Hardball Dollars
Hardball Times
Hit Tracker
Retrosheet
Rotobase/Rotoblog
Stat Corner
STATS
Tango on Baseball
Yahoo Sports MLB
Web Gems
Bill James Primer
Sabermetric Manifesto (Grabiner)
Pitching and Defense (McCracken)
Pitching and Defense (Tippett)
Transactions Primer (Neyer)
Baseball Stats (Batter's Box)
Prospect Report (Cameron)
Pitcher Workloads (Sheehan)
Goodbye to Old Baseball Ideas (Rickey)
Sabermetric Manifesto (Grabiner)
Pitching and Defense (McCracken)
Pitching and Defense (Tippett)
Transactions Primer (Neyer)
Baseball Stats (Batter's Box)
Prospect Report (Cameron)
Pitcher Workloads (Sheehan)
Goodbye to Old Baseball Ideas (Rickey)
Columnists
Baseball Blogs
Around the Majors
Athletics Nation
Baseball Crank
Baseball Musings
Baseball-Reference Blog
Batter's Box
Big League Stew
Bronx Banter
Catfish Stew
Cub Town
Dan Agonistes
Dodger Thoughts
DRays Bay
Ducksnorts
Futility Infielder
Halos Heaven
Inside the Rockies
It Might Be Dangerous
Knuckle Curve
LoHud Yankees Blog
Lookout Landing
Management by Baseball
Metaforian
Metsgeek
Mike's Baseball Rants
Only Baseball Matters
Redbird Nation
Red Reporter
Sabernomics (Braves)
Seth Speaks
ShysterBall
6-4-2 (Angels/Dodgers)
The Book
TheCubdom
The Cutting Edge
The House That Dewey Built
The View From The Bleachers
Tiger Blog
U.S.S. Mariner
Viva El Birdos
Where's Kernan
Minor Leagues
Arizona Fall League
BA Player Finder
Cal Leaguers
Jamey Newberg
JDM's Scoresheet Baseball
Minor League Baseball
Minor League Park Factors
Minor League Splits
No Pepper
Sickels' Minor League Ball
Warm October Nights
BA Player Finder
Cal Leaguers
Jamey Newberg
JDM's Scoresheet Baseball
Minor League Baseball
Minor League Park Factors
Minor League Splits
No Pepper
Sickels' Minor League Ball
Warm October Nights
Amateur
Boyd's World (College)
Cape Cod Baseball League
College Baseball Blog
College Baseball Insider
Collegiate Baseball Newspaper
College Splits
College Splits Blog
Dirtbags Baseball (Long Beach State)
NCAA Baseball
NCBWA
Team One Baseball (High School)
Texas A&M & Baseball
Cape Cod Baseball League
College Baseball Blog
College Baseball Insider
Collegiate Baseball Newspaper
College Splits
College Splits Blog
Dirtbags Baseball (Long Beach State)
NCAA Baseball
NCBWA
Team One Baseball (High School)
Texas A&M & Baseball
Historical
Cuban Baseball
House of David
Jim "Mudcat" Grant's Web Page
Negro League Baseball Players Assoc
Negro Leagues Baseball Museum
1919 Black Sox
Pacific Coast League
Philadelphia Athletics Historical Society
Shoeless Joe Jackson Society
SABR-L Archives
Walter O'Malley
House of David
Jim "Mudcat" Grant's Web Page
Negro League Baseball Players Assoc
Negro Leagues Baseball Museum
1919 Black Sox
Pacific Coast League
Philadelphia Athletics Historical Society
Shoeless Joe Jackson Society
SABR-L Archives
Walter O'Malley
Miscellaneous
Forums
Credits
Ticket Center
Tickets to Baseball -
Premium Red Sox Tickets - Tickets to Marlins Games - Cardinals Game Tickets - NY Yankee Tickets - Tickets Oakland Athletics - Dallas Cowboys Tickets - Arizona Cardinals Tickets - Tickets Seattle Seahawks - Buffalo Bills Tickets Online - Tickets to Dolphins Football
Buy Boston Red Sox tickets,
Philadelphia Phillies tix,
NY Yankees tickets,
NY Mets tickets, and
MLB All Star game tickets at ABC tickets
Not sure where to find the best online sportsbooks? Start your search with PlayersJet.
Get deals at SportsMemorabilia.com on baseball apparel, including Phillies jerseys and more for adults and children.
Shop the largest selection baseball equipment on sale at Sports Unlimited. Check out tons of baseball gloves, youth baseball gloves and catchers gear from Rawlings, Wilson, Nike & Under Armour.
2011 Draft Order
Courtesy of Baseball America
First-Round:
 1. Pirates (57-105)
 2. Mariners (61-101)
 3. Diamondbacks (65-97)
 4. Orioles (66-96)
 5. Royals (67-95)
 6. Nationals (69-93)
 7. Diamondbacks (for B. Loux)
 8. Indians (69-93)
 9. Cubs (75-87)
10. Padres (for Karsten Whitson)
11. Astros (76-86)
12. Brewers (77-85)
13. Mets (79-83)
14. Marlins (80-82)
15. Brewers (for Dylan Covey)
16. Dodgers (80-82)
17. Angels (80-82)
18. Athletics (81-81)
19. Red Sox (from DET for Martinez)
20. Rockies (83-79)
21. Blue Jays (85-77)
22. Cardinals (86-76)
23. Nationals (from CWS for Dunn)
24. Rays (from BOS for Crawford)
25. Padres (90-72)
26. Red Sox (from TEX for Beltre)
27. Reds (91-71)
28. Braves (91-71)
29. Giants (92-70)
30. Twins (94-68)
31. Rays (from NYY for Soriano)
32. Rays (96-66)
33. Rangers (from PHI for Lee)
Supplemental First Round:
34. Nationals (Dunn)
35. Blue Jays (Downs)
36. Red Sox (Martinez)
37. Rangers (Lee)
38. Rays (Crawford)
39. Phillies (Werth)
40. Red Sox (Beltre)
41. Rays (Soriano)
42. Rays (Balfour)
43. Diamondbacks (LaRoche)
44. Mets (Feliciano)
45. Rockies (Dotel)
46. Blue Jays (Buck)
47. White Sox (Putz)
48. Padres (Garland)
49. Giants (Uribe)
50. Twins (Hudson)
51. Yankees (Vazquez)
52. Rays (Benoit)
53. Blue Jays (Olivo)
54. Padres (Torrealba)
55. Twins (Crain)
56. Rays (Choate)
57. Blue Jays (Gregg)
58. Padres (Correia)
59. Rays (Hawpe)
| Baseball Beat | March 22, 2010 |
Categorizing Starting Pitchers By K, BB, and GB Rates: 2007-2009
More than a decade ago, Defense Independent Pitching Stats (DIPS) introduced the idea that pitchers are mostly responsible for their strikeout, walk, and home run rates but have little or no control over batted balls in play. By focusing on K, BB, and HR rates only, Fielding Independent Pitching (FIP) has become increasingly accepted as a better tool than more traditional methods such as ERA to evaluate the effectiveness (and predictability of future results) of pitchers.
Playing off DIPS and FIP, I began to categorize and graph pitchers by strikeout and groundball rates in 2007 (based on 2006 stats). I broke pitchers into quadrants with the Northeast Quadrant home for those with above-average K and GB rates and the Southwest Quadrant the opposite. I have continued to publish this series annually, adding walks and even Z-scores last year.
By substituting groundballs for home runs, my methodology is more analogous to xFIP than FIP. The bottom line is that the best pitchers miss bats (K), throw strikes (BB), and keep batted balls in the park (GB).
As I demonstrated last year, strikeouts have the greatest impact on ERA and RA, followed by walks, and groundballs. As a result, K+ BB+ GB+ > K+ BB+ GB- > K+ BB- GB+ > K+ BB- GB- > K- BB+ GB+ > K- BB+ GB- > K- BB- GB+ > K- BB- GB-.
I have combined the strikeout and walk components this year by using (K-BB)/BF. In the past, I had graphed K/BF on the x-axis and GB% on the y-axis. This year, I am using (K-BB)/BF on the x-axis and GB% on the y-axis. While not three dimensional, the graph below includes the three most important variables whereas it had only focused on K and GB rates previously.
In addition, I've added a new wrinkle by using the past three years combined stats rather than the prior year only. This change has increased the number of pitchers as well as the size of the data points. I could have weighted the numbers in a 3-2-1 format to place additional emphasis on the more recent results but chose not to for simplicity. I could have added HBP to BB given the fact that the former is generally as much in the control of the pitcher as the latter. That said, I don't believe excluding HBP had much of an effect on the outcomes.
There were 173 active starting pitchers who met my requirements of 120 or more innings during the 2007-2009 period. Among these qualifiers, the average (K-BB)/BF rate was 9.87% and the average GB rate was 43.56%. The mean K-BB and GB rates are highlighted in red in the graph below. These averages separate the starting pitchers into four quadrants.
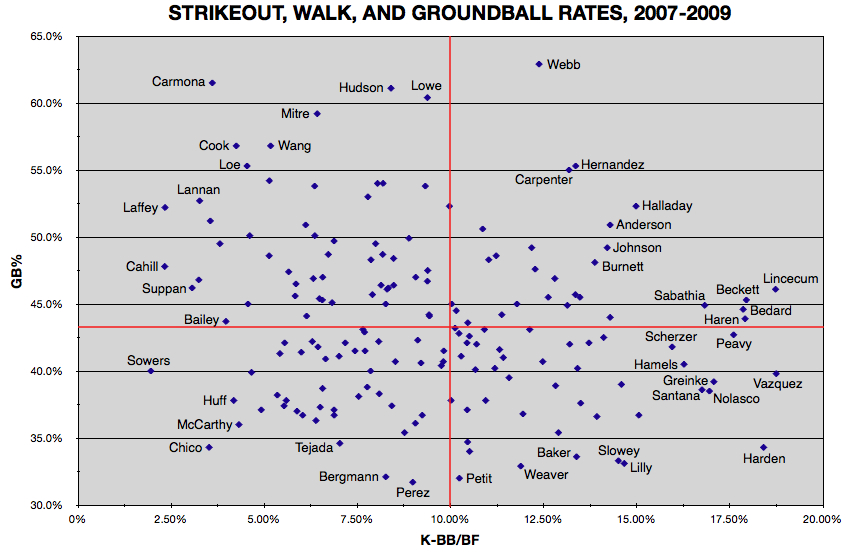
I always highlight the outliers and have identified 43 this time or more than twice the number in the previous graphs. The diamond just to the right of the average K-BB rate and ever so slightly below the average GB rate is Boof Bonser, who wins our award for being Mr. Average. He was signed by the Boston Red Sox to a one-year, $650,000 contract after being designated for assignment by the Minnesota Twins in December. A first round draft choice of the San Francisco Giants in 2000, Bonser missed the 2009 season after undergoing arthroscopic surgery to repair partial tears to the labrum and rotator cuff in his right shoulder. With Boston's starters in place and Tim Wakefield around to serve as the backup, Boof is likely to break camp as a long reliever but could be moved in a trade to a team looking to bolster its starting rotation.
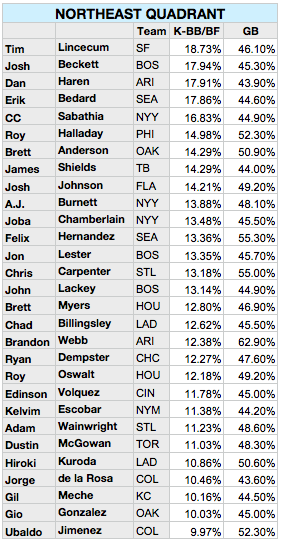
Tim Lincecum, coming off two consecutive Cy Young Award seasons, has compiled the highest K-BB rate in the majors over the past three years among those pitchers who induce more groundballs than the league average. After signing a two-year, $23 million contract in February, Lincecum has struggled this spring but threw 5 2/3 shutout innings against San Francisco's minor leaguers on Sunday. According to Fangraphs, his fastball velocity dropped 1.7 mph last year, and it has reportedly been sitting mostly at 89-91 in March. If his heater continues to recede, he may rely increasingly on his breaking balls and outstanding changeup for his "out" pitches.
The Northeast Quadrant also features former Cy Young winners CC Sabathia, Roy Halladay, Chris Carpenter, and Brandon Webb. The latter, working his way back from shoulder surgery after pitching just one game in 2009, is aiming to return to the rotation in late April. Meanwhile, Halladay will be pitching for a National League club for the first time in his 11-year career.
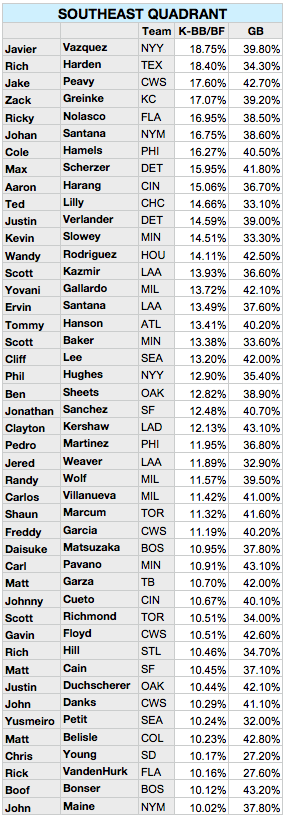
Javier Vazquez, not Lincecum, has produced the No. 1 K-BB rate in the majors over the past three seasons. He missed out on the Northeast Quadrant due to a lower-than-average groundball rate. The 33-year-old righthander will once again be pitching for the New York Yankees. Vazquez was 14-10 with a 4.91 ERA in his lone season with the Bronx Bombers in 2004. His career ERA is half a run higher in the AL (4.52) than the NL (4.02).
The Southeast Quadrant has its share of former Cy Young Award winners as well. Jake Peavy, Zack Greinke, Johan Santana (2x), Cliff Lee, and Pedro Martinez (3x) have won a combined eight CYA. Greinke (16-8 with a MLB-leading 2.16 ERA and 242 Ks and 51 BB in 229.1 IP) is coming off his best season ever. Among active pitchers, only Martinez (1997, 1999, 2000, and 2003), has bested his ERA+ of 205. Pedro, who signed with the Phillies last summer and went 5-1 with a 3.63 ERA and started three times during the postseason, is currently a free agent.
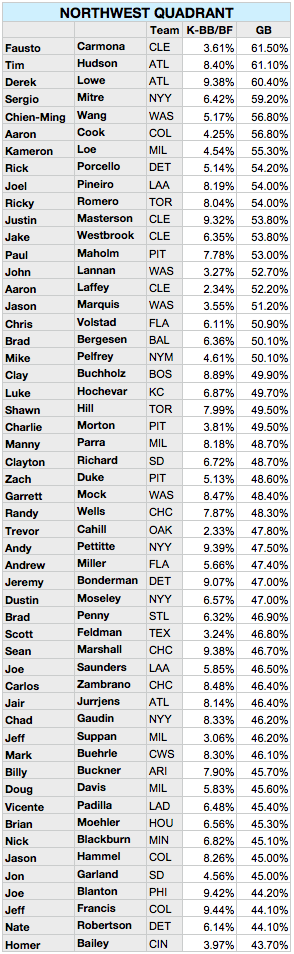
While the Northwest Quadrant doesn't sport any former CYA winners, it finds Tim Hudson, Derek Lowe, Andy Pettitte, Carlos Zambrano, and Mark Buehrle among its worm-burning residents. Lowe's (K-BB)/BF missed the Northeast Quadrant by less than 0.50%. As shown, he is one of only four starters with a groundball rate over 60 percent. The other three are Northwest inhabitants Hudson and Fausto Carmona plus Webb.
Hudson sat out the first five months in 2009 after undergoing Tommy John surgery in 2008. He started seven games and compiled a 2-1 record with a 3.61 ERA, then signed a three-year, $28 million contract with the Atlanta Braves last November. Carmona had a 19-8 record with an ERA of 3.06 in 2007 but has gone 13-19 with a 5.89 ERA while allowing more BB (140) than SO (137) over the past two campaigns. The 26-year-old righthander is owed $11 million for 2010 and 2011 so he is likely to get another shot with the Indians this season.
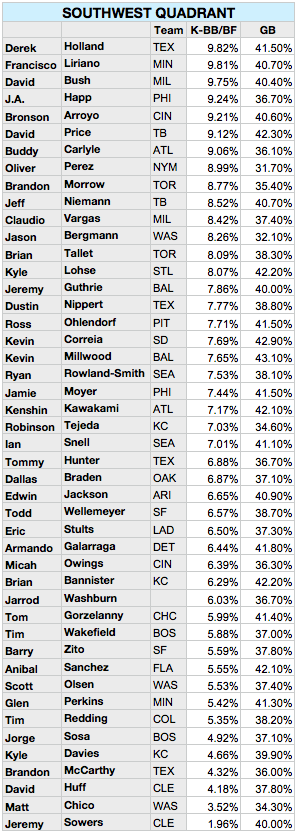
Although the Southwest Quadrant consists of several young arms that have potential, it has an even greater number of veterans and journeymen who have settled into nothing more than mediocrity. I wouldn't expect much success from those in the bottom half with groundball rates below 40 percent.
Jeremy Sowers (1.96%) had the lowest K-BB rate in the majors over the past three years. He and fellow soft-tossing lefty teammates David Huff (4.18%) and Aaron Laffey (2.34%) own three of the twelve-worst K-BB rates among the 173 qualified starting pitchers. I don't like Cleveland's chances this year if these three southpaws wind up starting half of the team's games, especially if Carmona pitches more like he did in 2008 and 2009 than 2007.
Comments
Rich, consider using (K-1.5*BB) / BF for the horizontal dimension. While it's still a rough formula, it better reflects the xFIP relative weighting between strikeouts and walks.
I enjoy this annual article.
Posted by: Detroit Michael at March 22, 2010 6:50 AM
What is BF?
Posted by: the pad father at March 22, 2010 6:34 PM
BF = Batters Faced. It is sometimes expressed as TBF (or Total Batters Faced) and is the equivalent of plate appearances.
Posted by: Rich Lederer at March 22, 2010 6:41 PM
The NW quadrant is sorted differently than the other 3 in your tables.
Posted by: Steve E. at March 22, 2010 7:04 PM
I intentionally sorted the NWQ by GB% because it is the defining characteristic of that group of pitchers.
Posted by: Rich Lederer at March 22, 2010 7:12 PM
Until you mentioned that, I did not realize a very interesting trend in the data ...
From observing the scatter plot, the 2 variables are negatively correlated. But even more interesting is that there is a wider variation in GB% among pitchers with a below average K-BB rate. This is particularly apparent only among those pitchers with below average K-BB and among the top 7% or so of K-BB.
This could just be an artifact of small sample size, but I think there is enough data to pique some curiosity here and suggest a broader study.
The interesting question here is 'does a very good K-BB rate reduce the chance of a very good GB%?'
It does make sense to me that a pitcher with a good K-BB rate would tend to have a below average GB% simply because most pitchers that have a good K-BB throw a lot of first pitch strikes, typically fastballs, and smart hitters swing at first pitch fastballs in the zone from good pitchers, and get a higher flyball% from doing so.
Posted by: Steve E. at March 22, 2010 7:47 PM
Using your data, I plotted GB% vs. contact rate, i.e., (K+BB)/BF.
I find that these two are more strongly (negatively) correlated than GB% vs. (K-BB)/BF.
This would seem to say that pitchers who "pitch to contact" more are inducing more ground balls on contact, and pitchers who "pitch to contact" less are yielding more fly balls on whatever contact they get. Does this make sense to you?
Posted by: Bob at March 22, 2010 9:02 PM
@Steve E. and Bob: Yes. Pitchers who don't strike out many batters need to keep batted balls on the ground or else they won't last long in the majors. Strikeout pitchers will pitch up in the zone more often than those who pitch to contact. As a result, high strikeout pitchers will tend to produce more fly balls and low strikeout pitchers will tend to induce more ground balls.
Posted by: Rich Lederer at March 22, 2010 9:09 PM
K minus BB is the correct form.
GB minus FB would be better, as per the post on my blog.
Posted by: tangotiger at March 22, 2010 9:37 PM
TangoTiger, I read the post on your blog and it dealt almost exclusively with GB% - FB%. If you or Rich or anyone else can explain why (K-BB)/BF is a better measure of pitcher skill than (K-1.5*BB)/BF, I would appreciate it.
Posted by: Detroit Michael at March 23, 2010 6:30 AM
How about Barry Zito?
Posted by: Andrew Mendillo at March 23, 2010 10:29 AM
This annual column is one of the surest signs of Spring. Thanks, Rich!
Posted by: Frank from Boston at March 23, 2010 7:19 PM
I believe these are averaged numbers. What is the year to year correlation for pitchers? Do they pitchers in one quadrant tend to stay in that quadrant or do they move around?
Posted by: jay stokes at March 27, 2010 12:26 AM
@Andrew: Zito has had a below-average K-BB and GB rates over the past three years and, therefore, is part of the Southwest Quadrant.
Thanks, Frank.
@Jay: Pitchers tend to stay in the same quadrant from year to year. The best pitchers tend to strike out a lot of batters. As a result, they are generally found in the Northeast Quadrant or the Southeast Quadrant. The worst pitchers generally fail to miss bats and, as such, are normally in the Northwest Quadrant or the Southwest Quadrant.
Posted by: Rich Lederer at March 28, 2010 3:08 PM