Rich Lederer • Baseball Beat
Patrick Sullivan • Change-Up
Jeremy Greenhouse • Touching Bases
Dave Allen • F/X Visualizations
Sky Andrecheck • Behind the Scoreboard
Marc Hulet • Around the Minors
Al Doyle • Past Times
Retired Uniforms:
Bryan Smith • WTNY
Joe Sheehan • Command Post
Jeff Albert • The Batter's Eye
RSS Feed
Home
*Examining the Past, Present, and Future*
Lineup Card
Recent Entries
» Putting Together a Reality Team
» Historical Hall of Fame Vote Comparisons: 2012
» An All-Christmas Team
» The New-Look Angels
» John Denny: The Forgotten Cy Young Award Winner
» Money Isn't Everything
» What Would It Take to Hit .400 in the 21st Century?
» Halos Heaven
» Brandon McCarthy's Breakout Season
» Link-o-Rama
» Historical Hall of Fame Vote Comparisons: 2012
» An All-Christmas Team
» The New-Look Angels
» John Denny: The Forgotten Cy Young Award Winner
» Money Isn't Everything
» What Would It Take to Hit .400 in the 21st Century?
» Halos Heaven
» Brandon McCarthy's Breakout Season
» Link-o-Rama
Best of Baseball Beat
Abstracts From the Abstracts
1977 Baseball Abstract
1978 Baseball Abstract
1979 Baseball Abstract
1980 Baseball Abstract
1981 Baseball Abstract
1982 Baseball Abstract
1983 Baseball Abstract
1984 Baseball Abstract
1985 Baseball Abstract
1986 Baseball Abstract
1987 Baseball Abstract
1988 Baseball Abstract
1978 Baseball Abstract
1979 Baseball Abstract
1980 Baseball Abstract
1981 Baseball Abstract
1982 Baseball Abstract
1983 Baseball Abstract
1984 Baseball Abstract
1985 Baseball Abstract
1986 Baseball Abstract
1987 Baseball Abstract
1988 Baseball Abstract
Bert Blyleven Series
Meeting Up and Hanging Out with Bert
The Results Are In And...
Aficionado Heavily Invested in Blyleven
Latest on Blyleven's Chances for the HOF
The Internet Zealot Responds
400 Down and 5 to Go...
Bert Be Home By Eleven?
Blyleven's Forgotten Season (1973)
HeyMan, Your Comments Don't Hold Water
The Waiting is the Hardest Part
Another Addition to the Blyleven Series
Search for the Truth
As Dominant as His HOF Contemporaries
Listen, Buster
A Larger Step for Blyleven
Answering the Naysayers (Part Two)
Another Small Step for Blyleven
Q&A: Blyleven on the Twins
The Majority Rules, Right?
It's All Dutch to Some
The Hall of Fame Case for Bert Blyleven
Q&A: Blyleven on Felix Hernandez
Clemens Rocketing Up Charts
Poz: An Interview With a KC Star
A HOF Chat with Tracy Ringolsby
Up Close and Personal
A Peek Into the Mind of a HOF Voter
Answering the Naysayers
It's That Time of the Year (Again)
"If Cooperstown is Calling..."
The Bert Alert
One Small Step for Blyleven...
Only the Lonely
Exclusive Interviews
Lee Sinins
Alex Belth
David Pinto
Will Carroll
Mike Carminati
Aaron Gleeman
Joe Sheehan
Jay Jaffe
Jeff Peek
Tracy Ringolsby
Joe Posnanski
Bill James Part I, II, III
Jon Lalonde
Chuck Tiffany
Dayn Perry
Fay Vincent
Nate Silver
Alex Belth
David Pinto
Will Carroll
Mike Carminati
Aaron Gleeman
Joe Sheehan
Jay Jaffe
Jeff Peek
Tracy Ringolsby
Joe Posnanski
Bill James Part I, II, III
Jon Lalonde
Chuck Tiffany
Dayn Perry
Fay Vincent
Nate Silver
Bullpen
Rich Lederer
The Odd Couple (with Alex Belth)
The MostUnder Over Underrated Player in Baseball (with Brian Gunn)
Three Wise Men (roundtable by Alex Belth)
Infrequently Asked Questions (interview with Matt Welch)
Interview (Orioles Think Tank)
Bernie and the Yanks (Bronx Banter)
Hope and Faith: How the LAA Win the World Series (Baseball Prospectus)
NL West (The Soul of Baseball)
Greatest Living Hitter? (Sports Illustrated)
Roundtable: 2008 HOF Ballot (Armchair GM)
The Most
Three Wise Men (roundtable by Alex Belth)
Infrequently Asked Questions (interview with Matt Welch)
Interview (Orioles Think Tank)
Bernie and the Yanks (Bronx Banter)
Hope and Faith: How the LAA Win the World Series (Baseball Prospectus)
NL West (The Soul of Baseball)
Greatest Living Hitter? (Sports Illustrated)
Roundtable: 2008 HOF Ballot (Armchair GM)
Patrick Sullivan
Designated Hitters
David Bromberg (Q&A: John Denny)
Mark Armour (H. Killebrew and Versatility)
Joe Lederer (Soundtrack of a Prospect)
David Bromberg (Clemente's Autograph)
David Bromberg (Woody Fryman)
D. Baumstein (WAR Against Age: Pitchers)
Doug Baumstein (The WAR Against Age)
Doug Baumstein (A Lifetime on the Road)
John Fraser (Pick Six)
Mark Armour (How to Score More Runs?)
Bill Parker (What Opening Day Tells Us)
Stan Opdyke (Pat Rispole)
Chris Jaffe (Evaluating Baseball's Mgrs)
Stan Opdyke (Baseball Radio in NYC, 1953)
A. Nathan (Performance of Baseball Bats)
Michael Weddell (Edgar Martinez/HOF)
Jon Weisman (100 Things Dodgers Fans...)
Stan Opdyke (Connie Mack and Vin Scully)
Eric Walker (Evaluating Run Production)
Brent Mayne (The Intangibles of Catching)
Chris Moore (Best Fastballs in Baseball)
Dave Baldwin (The Batter’s Brain)
Shawn Haviland (Ivy League to MLB)
Larry Granillo (Walking Off)
Rob Iracane (Solo HR Won't Break You)
Tommy Bennett (Charm of AM Radio)
Harry Pavlidis (Johan Santana's Fast Start)
John Walsh (WAR and Remembrance)
Eric Walker (Precisely Inaccurate)
Bob Timmermann (As They See 'Em)
Geoff Young (Unicycles and Delusions)
Baseball Analysis at Tufts (Groundballers)
Baseball Analysis at Tufts (GB Out Rates)
G. Rybarczyk ('09 Hit Tracker Projections)
Joe Lederer (Curt Schilling/HoF)
Conor Gallagher (Hall of Fallacies)
Chris Green (Jim Rice, HoF, the Numbers)
Shawn Hoffman (Baseball's Bear Mkt?)
Paul Anthony (Manny Syndrome)
Ross Roley (World Series Odds)
B. Timmermann (Catcher's Interference)
R.J. Anderson (Waiting the Hardest Part)
Maury Brown (Cubs, MLB, and Cuban...)
Myron Logan (Dee-Fense, Dee-Fense)
Craig Calcaterra (Frivolity, Part I, Part II)
Chad Finn (Ode to Baseball Cards)
David Cameron (Mariners Foibles)
Chris Dial (Chipper Jones)
Pat Lederer (Memory Lane)
David Appelman (Clutch Pitching)
Bob Rittner (DH)
Jonathan Mayo (Roger Clemens)
Lisa Winston (My Son-in-Law...)
Russ McQueen (The Yellow Hammer)
Bob Rittner (I'm OK, You're OK)
Mark Armour (In Defense of the HOF)
Pat Jordan (Friends)
Dan Levitt (Analysis of Terry Ryan)
Doug Baumstein (Trading Econ 101)
Ross Roley (Runner's Reluctance II)
Ross Roley (Runner's Reluctance I)
Mark Armour (No-Longer Lovable Sox)
Bruce Regal (Stealthy and Wise)
Brian Gunn (Roid Monster)
Current/McEvoy (Value of the SB)
John Rickert (Sinister Thefts)
Nate Silver (Sabermetrics)
David Vincent (Home Run Production)
Joe P. Sheehan (Enhanced Gameday II)
Mark Armour (An Ode to Sport)
David Gassko (All-Time Worm Burners)
Joe P. Sheehan (Enhanced Gameday)
John Walsh (When Titans Clash)
Fox/Williams (Quantifying Coaches II)
Fox/Williams (Quantifying Coaches I)
Jacob Luft (Bull Durham Rant)
Chad Finn (Strat-O-Matic)
Lisa Winston (Rotisserie Baseball)
Dave Studeman (Baseball Stats)
Steve Treder (Roger Craig)
Marc Normandin (Jeff Bagwell)
D. Appelman (Expanding Strike Zone)
Jeff Sackmann (Worst MiL Defenders)
Jeff Sackmann (Best MiL Defenders)
Maxwell Kates (Van Lingle Mungo)
David Appelman (Pitch Location)
Kent Bonham (Danny Ray Herrera)
Glenn Stout (Two Baseball Poems)
Bruce Regal (The Challenge Round)
Mark Lamster (Barry & Ty)
Geoff Young (NL West)
Tom Lederer (The Ryan Express)
Brian Erts (Great Leap Forward)
David Pinto (Parity and the N.L.)
Jacob Luft (Fathers and Daughters)
Jamey Newberg (Pete's Sake)
Jeff Albert (A. Jones Swing Analysis)
Jeff Albert (A-Rod Swing Analysis)
Keith Law (Death, Taxes, and Waivers)
Peter Abraham (Tales of Torre Tales)
Larry Borowsky (Let 'er Rip II)
Dan Levitt (Empirical Analysis of Bunting)
Jonah Keri (If I Met Warren Cromartie...)
Bob Klapisch (War Stories)
Bob Timmermann (John F. Kennedy HS)
Kent Bonham (Aluminum Adjustments)
Al Doyle (More Than Superstars)
Ross Roley (Instant Replay)
David Vincent (Barry Bonds Homers)
Chad Finn (Our Favorite Obscurities)
Bill Deane (1979 NL MVP)
Mark Armour (Rise/Fall of Artificial Turf)
Jeff Angus (Wally Moon Camp)
David Berri (Money and Baseball)
Larry Borowsky (Baseball w/o the #s)
Derek Zumsteg (The Irrational Market)
David Regan (Free Agent Contracts)
Peter Schmuck (Steroids and the HOF)
David Appelman (Pitchers, Pitch by Pitch)
Dan Fox (Swinging, Taking, Fouling, Etc)
Patrick Sullivan (Study of NYY CF/BOS LF)
Will Leitch (Baseball Journalism)
Jeff Sullivan (Pitcher Release Points)
Steve Treder ('69-'70 Giants)
Maury Brown (Charlie Finley)
John Brattain (Bob Johnson)
Bob Klapisch (The Case for Bert Blyleven)
Jeff Peek (Pride and Prejudice)
Dayn Perry (Bert and Warren)
Rob Neyer (If Don Sutton Was Great...)
Lisa Winston (Minor League Memories)
Alex Belth (Otis Redding Was Right)
David Cameron (Long Live the King)
Jeff Angus (Baserunning Study)
Bert Blyleven (Baseball Playoffs)
Boyd Nation (Not a Prospect List)
James Click (Batters-Baserunners Study)
Jeff Shaw (Why I Love Baseball)
David Gassko (BIP/BFP Fielding Study)
Jay Jaffe (Milwaukee Sausage Race)
Jamey Newberg (Remember When)
Bob Klapisch (Press Box to the Mound)
Dan Levitt (Predictive Value of BB)
David Vincent (Official Scorer)
Jon Weisman (Rick Monday)
Larry Borowsky (Let 'er Rip)
Will Carroll (Fictional Short Story)
Bob Timmermann (Japanese Baseball)
Cyril Morong (Best Pitching Seasons)
Sean Forman (Monte Carlo Win-Loss)
Brian Gunn (My Little Blue Book)
Joe Lederer (My Dad and Baseball)
Bill Deane (Bob Gibson, 1968)
Mark Armour (1977 Yankees)
Darren Viola (Retrosheet)
David Pinto (RFK)
Dayn Perry (Brave Heart)
Matt Welch (Dave Hansen)
Kevin Kernan (Jack McKeon)
Tom Lederer (Dodgers Road Trip)
Steve Lombardi (Slider)
Studes (Picturing Baseball)
Mike Carminati (Luck of the Drawl)
Eric Neel (Vin Scully)
J.C. Bradbury (Leo Mazzone)
John Sickels (Bill James)
Search Baseball Analysts
Archives
By Category:
Around the Majors Content Only
Around the Minors Content Only
Baseball Beat Content Only
Baseball Beat/Change-Up Content Only
Baseball Beat/WTNY Content Only
Behind the Scoreboard Content Only
Change-Up Content Only
Change-Up/Around the Majors Content Only
Command Post Content Only
Crunching the Numbers Content Only
Designated Hitter Content Only
F/X Visualizations Content Only
Past Times Content Only
Saber Talk Content Only
The Batter's Eye Content Only
Touching Bases Content Only
Weekend Blog Content Only
WTNY Content Only
By Month:
February 2012
January 2012
December 2011
October 2011
September 2011
August 2011
July 2011
June 2011
May 2011
April 2011
March 2011
February 2011
January 2011
December 2010
November 2010
October 2010
September 2010
August 2010
July 2010
June 2010
May 2010
April 2010
March 2010
February 2010
January 2010
December 2009
November 2009
October 2009
September 2009
August 2009
July 2009
June 2009
May 2009
April 2009
March 2009
February 2009
January 2009
December 2008
November 2008
October 2008
September 2008
August 2008
July 2008
June 2008
May 2008
April 2008
March 2008
February 2008
January 2008
December 2007
November 2007
October 2007
September 2007
August 2007
July 2007
June 2007
May 2007
April 2007
March 2007
February 2007
January 2007
December 2006
November 2006
October 2006
September 2006
August 2006
July 2006
June 2006
May 2006
April 2006
March 2006
February 2006
January 2006
December 2005
November 2005
October 2005
September 2005
August 2005
July 2005
June 2005
May 2005
April 2005
March 2005
February 2005
January 2005
December 2004
November 2004
October 2004
September 2004
August 2004
July 2004
June 2004
May 2004
April 2004
March 2004
February 2004
January 2004
December 2003
November 2003
October 2003
September 2003
August 2003
July 2003
June 2003
Reference
Organizational Stats
Arizona Diamondbacks Bat / Pitch
Atlanta Braves Bat / Pitch
Baltimore Orioles Bat / Pitch
Boston Red Sox Bat / Pitch
Chicago Cubs Bat / Pitch
Chicago White Sox Bat / Pitch
Cincinnati Reds Bat / Pitch
Cleveland Indians Bat / Pitch
Colorado Rockies Bat / Pitch
Detroit Tigers Bat / Pitch
Florida Marlins Bat / Pitch
Houston Astros Bat / Pitch
Kansas City Royals Bat / Pitch
Los Angeles Angels Bat / Pitch
Los Angeles Dodgers Bat / Pitch
Milwaukee Brewers Bat / Pitch
Minnesota Twins Bat / Pitch
New York Mets Bat / Pitch
New York Yankees Bat / Pitch
Oakland Athletics Bat / Pitch
Philadelphia Phillies Bat / Pitch
Pittsburgh Pirates Bat / Pitch
St. Louis Cardinals Bat / Pitch
San Diego Padres Bat / Pitch
San Francisco Giants Bat / Pitch
Seattle Mariners Bat / Pitch
Tampa Bay Devil Rays Bat / Pitch
Texas Rangers Bat / Pitch
Toronto Blue Jays Bat / Pitch
Washington Nationals Bat / Pitch
All-Star Links
Official Websites
News and Notes
Baseball News Blog
Baseball Newstand
ESPN Baseball
Fox Sports Baseball
Pro Sports Daily
Roto World
The Roto Times
USA Today Baseball
Baseball Newstand
ESPN Baseball
Fox Sports Baseball
Pro Sports Daily
Roto World
The Roto Times
USA Today Baseball
Reference and Analysis
Baseball Almanac
Baseball America
Baseball Archive
Baseball Contracts
Baseball Cube
Baseball Graphs
Baseball Library
Baseball Musings Player Database
Baseball Page
Baseball Primer
Baseball Prospectus
Baseball Reference
Baseball Statistics
Baseball Truth
Boxscore Central
Diamond Mind Baseball
Doug's Stats
FanGraphs
Fast Balls (pitchfx catalog)
Hardball Dollars
Hardball Times
Hit Tracker
Retrosheet
Rotobase/Rotoblog
Stat Corner
STATS
Tango on Baseball
Yahoo Sports MLB
Web Gems
Bill James Primer
Sabermetric Manifesto (Grabiner)
Pitching and Defense (McCracken)
Pitching and Defense (Tippett)
Transactions Primer (Neyer)
Baseball Stats (Batter's Box)
Prospect Report (Cameron)
Pitcher Workloads (Sheehan)
Goodbye to Old Baseball Ideas (Rickey)
Sabermetric Manifesto (Grabiner)
Pitching and Defense (McCracken)
Pitching and Defense (Tippett)
Transactions Primer (Neyer)
Baseball Stats (Batter's Box)
Prospect Report (Cameron)
Pitcher Workloads (Sheehan)
Goodbye to Old Baseball Ideas (Rickey)
Columnists
Baseball Blogs
Around the Majors
Athletics Nation
Baseball Crank
Baseball Musings
Baseball-Reference Blog
Batter's Box
Big League Stew
Bronx Banter
Catfish Stew
Cub Town
Dan Agonistes
Dodger Thoughts
DRays Bay
Ducksnorts
Futility Infielder
Halos Heaven
Inside the Rockies
It Might Be Dangerous
Knuckle Curve
LoHud Yankees Blog
Lookout Landing
Management by Baseball
Metaforian
Metsgeek
Mike's Baseball Rants
Only Baseball Matters
Redbird Nation
Red Reporter
Sabernomics (Braves)
Seth Speaks
ShysterBall
6-4-2 (Angels/Dodgers)
The Book
TheCubdom
The Cutting Edge
The House That Dewey Built
The View From The Bleachers
Tiger Blog
U.S.S. Mariner
Viva El Birdos
Where's Kernan
Minor Leagues
Arizona Fall League
BA Player Finder
Cal Leaguers
Jamey Newberg
JDM's Scoresheet Baseball
Minor League Baseball
Minor League Park Factors
Minor League Splits
No Pepper
Sickels' Minor League Ball
Warm October Nights
BA Player Finder
Cal Leaguers
Jamey Newberg
JDM's Scoresheet Baseball
Minor League Baseball
Minor League Park Factors
Minor League Splits
No Pepper
Sickels' Minor League Ball
Warm October Nights
Amateur
Boyd's World (College)
Cape Cod Baseball League
College Baseball Blog
College Baseball Insider
Collegiate Baseball Newspaper
College Splits
College Splits Blog
Dirtbags Baseball (Long Beach State)
NCAA Baseball
NCBWA
Team One Baseball (High School)
Texas A&M & Baseball
Cape Cod Baseball League
College Baseball Blog
College Baseball Insider
Collegiate Baseball Newspaper
College Splits
College Splits Blog
Dirtbags Baseball (Long Beach State)
NCAA Baseball
NCBWA
Team One Baseball (High School)
Texas A&M & Baseball
Historical
Cuban Baseball
House of David
Jim "Mudcat" Grant's Web Page
Negro League Baseball Players Assoc
Negro Leagues Baseball Museum
1919 Black Sox
Pacific Coast League
Philadelphia Athletics Historical Society
Shoeless Joe Jackson Society
SABR-L Archives
Walter O'Malley
House of David
Jim "Mudcat" Grant's Web Page
Negro League Baseball Players Assoc
Negro Leagues Baseball Museum
1919 Black Sox
Pacific Coast League
Philadelphia Athletics Historical Society
Shoeless Joe Jackson Society
SABR-L Archives
Walter O'Malley
Miscellaneous
Forums
Credits
Ticket Center
Tickets to Baseball -
Premium Red Sox Tickets - Tickets to Marlins Games - Cardinals Game Tickets - NY Yankee Tickets - Tickets Oakland Athletics - Dallas Cowboys Tickets - Arizona Cardinals Tickets - Tickets Seattle Seahawks - Buffalo Bills Tickets Online - Tickets to Dolphins Football
Buy Boston Red Sox tickets,
Philadelphia Phillies tix,
NY Yankees tickets,
NY Mets tickets, and
MLB All Star game tickets at ABC tickets
Not sure where to find the best online sportsbooks? Start your search with PlayersJet.
Get deals at SportsMemorabilia.com on baseball apparel, including Phillies jerseys and more for adults and children.
Shop the largest selection baseball equipment on sale at Sports Unlimited. Check out tons of baseball gloves, youth baseball gloves and catchers gear from Rawlings, Wilson, Nike & Under Armour.
2011 Draft Order
Courtesy of Baseball America
First-Round:
 1. Pirates (57-105)
 2. Mariners (61-101)
 3. Diamondbacks (65-97)
 4. Orioles (66-96)
 5. Royals (67-95)
 6. Nationals (69-93)
 7. Diamondbacks (for B. Loux)
 8. Indians (69-93)
 9. Cubs (75-87)
10. Padres (for Karsten Whitson)
11. Astros (76-86)
12. Brewers (77-85)
13. Mets (79-83)
14. Marlins (80-82)
15. Brewers (for Dylan Covey)
16. Dodgers (80-82)
17. Angels (80-82)
18. Athletics (81-81)
19. Red Sox (from DET for Martinez)
20. Rockies (83-79)
21. Blue Jays (85-77)
22. Cardinals (86-76)
23. Nationals (from CWS for Dunn)
24. Rays (from BOS for Crawford)
25. Padres (90-72)
26. Red Sox (from TEX for Beltre)
27. Reds (91-71)
28. Braves (91-71)
29. Giants (92-70)
30. Twins (94-68)
31. Rays (from NYY for Soriano)
32. Rays (96-66)
33. Rangers (from PHI for Lee)
Supplemental First Round:
34. Nationals (Dunn)
35. Blue Jays (Downs)
36. Red Sox (Martinez)
37. Rangers (Lee)
38. Rays (Crawford)
39. Phillies (Werth)
40. Red Sox (Beltre)
41. Rays (Soriano)
42. Rays (Balfour)
43. Diamondbacks (LaRoche)
44. Mets (Feliciano)
45. Rockies (Dotel)
46. Blue Jays (Buck)
47. White Sox (Putz)
48. Padres (Garland)
49. Giants (Uribe)
50. Twins (Hudson)
51. Yankees (Vazquez)
52. Rays (Benoit)
53. Blue Jays (Olivo)
54. Padres (Torrealba)
55. Twins (Crain)
56. Rays (Choate)
57. Blue Jays (Gregg)
58. Padres (Correia)
59. Rays (Hawpe)
| Touching Bases | December 24, 2010 |
The Year in PITCHf/x Calibration
This week, I handed in potentially the final paper of my academic career. It was titled, "The History of PITCHf/x." That is to say that I greatly enjoy thinking about, reading about, and writing about PITCHf/x data. So I don't mean to cast PITCHf/x in a negative light by bringing up its calibration issues, but data is kind of worthless without knowing the error involved. And while PITCHf/x is precise within a fraction of an inch, the accuracy is not always there, as some ballparks can report errors more along the lines of fractions of a foot.
The list of public analysts who have completed data correction systems is only a few names long. I believe Mike Fast, Josh Kalk, Harry Pavlidis, and Ike Hall have done some quality work in the area. My first pass is likely not as rigorous as their methods, but I feel I stumbled upon enough points of interest to warrant writing something up. My sample consisted of the fastest 25% of pitches thrown by each pitcher in each game. I compared the actual properties of those pitches to a set of expected values. These expected values were generated by finding the average properties of pitches thrown in other ballparks by the same pitchers. There were five values that I tested: the initial horizontal and vertical position (release point), the resultant horizontal and vertical position (plate location), and the pitch velocity.
One mid-august homestand in Houston jumped out at me. The graphs I present below contain the actual and expected values as detailed above, as well as the difference between the two, which loosely represents the magnitude of correction needed.
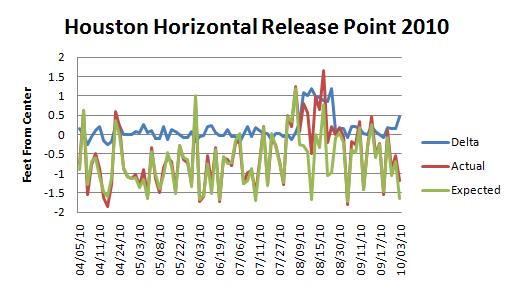
You can see that the actual release points and the expected release points follow each other quite well over the first half of the season. For instance, when two left-handed pitchers start, the average release point jumps to the opposite side of the graph. But then in August, the blue delta line spikes by a foot. I created a gif comparing all of Brett Myers' release points leading up to his August 13 game and his recorded release points in that game. Without context, it would be easy to draw the conclusion that Myers had altered his approach.
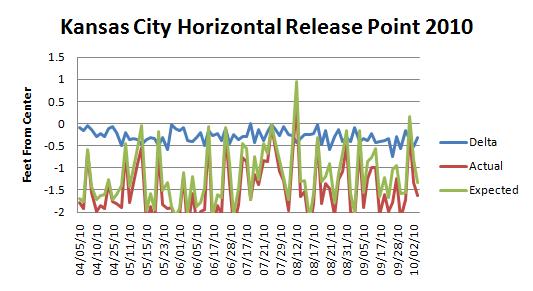
Some parks were consistently miscalibrated the entire year. Or perhaps the rubber on the pitching mound was off-center. Kansas City had on average a three-inch difference between the actual and expected horizontal release points. This was certainly the fault of Dayton Moore.
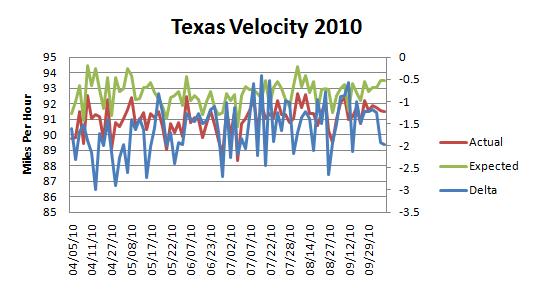
More importantly, Kansas City overstated velocity, a trend fortunately spotted by Jeff Zimmerman early on in the season. Here, the delta line is plotted on a different axis.
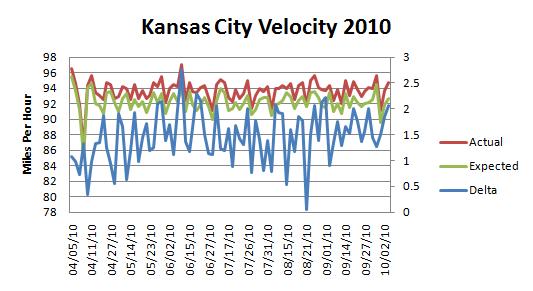
On average, the delta was 1.1 miles per hour, the exact same number reported by Mike Fast.
Mike published his own 2010 velocity corrections on THT, and I found the correlation coefficient between his and mine to be 0.8.
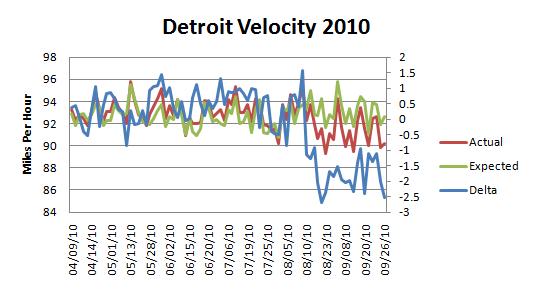
Texas was at the other end of the spectrum.
And Detroit was fine until the final months of the season.
Like Kauffman, Dodger Stadium was on average three inches off with its horizontal release points. Several parks deviated a couple inches from what we'd expect with their vertical release points. Again, rubber position and mound heights are not standardized across MLB, so it could be that pitchers do throw from different release points depending on the stadium. Citizens Bank and Yankee Stadium reported high release points, while Safeco and Petco came in lower.
Plate location adjustments are much harder to nail down. For one, the values reported by PITCHf/x around the plate are generally accurate, as they are more directly observed by cameras, as opposed to the release points which are extrapolated. Furthermore, pitchers vary their intended pitch locations much more than they do their release points. The park with the greatest pitch location abnormality is Yankee Stadium, and the reason is clear. The Yankees possess such a disproportionate number of left-handed batters that pitchers throw to the third-base side of the plate more than they would against any other team.
Correcting PITCHf/x data seems hard. Differences in a ballpark's configurations and a pitcher's intentions are difficult to separate from an oddity in PITCHf/x calibration. Including batter handedness appears vital, given that pitchers shift their position on the rubber or throw to a different side of the plate depending on batter handedness. I do not think that an automated correction system is the answer to correcting PITCHf/x data. I envision how hard it would be to pick up on sudden shifts in the data that stem from recalibrations without picking up on the random game-to-game noise. It would possibly be easiest to simply eyeball a span of time during which one fixed level of adjustment is needed.
Per commenter request:
Comments
Any chance your paper will be available for viewing online any time in the future?
Also, good work as always. I knew about the Houston inaccuracies (I spotted it due to it affecting a few Met pitchers as the Mets were in Houston during hte abnormal results), but good to see it posted.
Posted by: garik16 at December 24, 2010 7:40 PM
Thanks for posting this, Jeremy. It's great to see the calibration errors presented graphically. How consistent was the Yankee Stadium velocity last year?
Posted by: Lucas Apostoleris at December 24, 2010 8:34 PM
Ha, no. Not that kind of paper. You wouldn't want to read it.
Let me know if you're aware of any other inaccuracies.
Posted by: Jeremy Greenhouse at December 24, 2010 8:45 PM
Nice article Jeremy. One minor correction. The home plate pitch locations are extrapolated about the same amount as the release point values. Because the Pitch Fx ball identification algorithm would be confused by batter and bat movement, the processing of ball locations ends about 8 to 10 feet in front of home plate. However, the accuracy of the home plate locations should be better because there are more calibration points close to home plate.
At the 2009 Summit we asked Marv White to publicly post when major corrections had occurred at the different parks and what the correction factors should be, so that we could all be using identical correction factors and have uniform databases for analysis. He agreed to this, but with his departure from Sportvision that request seems to have lost in the shuffle. At this year's Summit I reminded Ryan Zander about that promise and he said that he would try to put it on the agenda of things to accomplish during the off season.
Posted by: Peter Jensen at December 24, 2010 8:58 PM
Thanks, Peter. I remember having read that the plate locations were more accurate than the release points, and I appreciate your clarification as to the reason why.
That would be nice if Sportvision published corrections, although I guess it would mean that I wasted several hours over the last few days trying to come up with something.
Posted by: Jeremy Greenhouse at December 24, 2010 9:06 PM
Good work, Jeremy.
I believe the Houston excursion in August 2010 is the worst in the history of PITCHf/x.
Given how often these things shift, and that the fact that frequently you can see them progressively getting worse/better over time, I don't believe that the shifts are due to physical changes in the mound or pitching rubber. There may be a few such physical changes showing up in the data, but they don't make up the majority by any means.
Posted by: Mike Fast at December 24, 2010 9:12 PM
Jeremy, what we would like from Sportvision is a record of when they recalibrated cameras and the resultant calibration parameters.
That's different than correcting the final data. The cameras can go out of calibration without Sportvision realizing it or doing anything about it, and in fact I believe they often do.
Posted by: Mike Fast at December 24, 2010 9:16 PM
One other thought, regarding velocity corrections, the difficulty I have run into with them is that the correction varies based on velocity. For instance, an 85-mph pitch may need to be corrected by a different amount than a 95-mph pitch.
Position corrections are fairly straightforward (though nontrivial), but velocity corrections are a hairy mess by comparison.
Posted by: Mike Fast at December 24, 2010 9:21 PM
What Marv impressed upon me was that when a miscalibration occurs it is going to affect all the Pitch Fx parameters in a non linear way. Corrections made on individual parameters although close, are only going to be approximate. That's why we really need to have resultant calibration parameters from Sportvision.
Posted by: Peter Jensen at December 24, 2010 10:06 PM
Peter, any corrections, whether made with knowledge of the camera calibration parameters or not, are going to be approximate. Knowing the camera calibration parameters would help us help Sportvision improve the initial accuracy of their data. So it would be helpful in that sense.
However, I don't believe that knowledge of the camera calibration parameters is necessary to provide optimally corrected data at a practical level.
Posted by: Mike Fast at December 24, 2010 10:21 PM
Lucas, I added Yankee Stadium velocity to the end of the article.
Mike, good to know these are likely shifts in the PITCHf/x data and not the ballparks.
I had a line in the article that I took out about not knowing squat about drag forces, which led me to calculate velocity adjustments the same way. Can you explain in some way I might be able to understand why you can't just take off a fixed percentage from the initial velocity?
Posted by: Jeremy Greenhouse at December 25, 2010 7:09 AM
"Citizens Bank and Yankee Stadium reported high release points, while Safeco and Petco came in lower."
Any chance the clubs are purposefully raising/lowering the mound to combat the respective offensive effects these parks have? Probably nonsense but just a passing thought as I read the article.
Posted by: Andrew at December 25, 2010 2:36 PM
Andrew, unless the Phillies are moving the mound up and down all the time, I doubt the changes in release point are a real thing. There have been at least six noticeable shifts up and down over the last two years at Citizens Bank Park, some of them as much as 3-4 inches.
Similarly, at Safeco, you'd have to believe that they gradually built up the mound by and inch or two over the first three homestands in 2009, then lowered it somewhat for the next two homestands, then gradually built it up again for the next two homestands, then maintained it through the first homestand in 2010, then radically dropped the mound by 3 inches, then raised it back an inch and let it gradually inch up until the last couple homestands of 2010.
Yankee Stadium and Petco haven't seen the same whipsaw back and forth in 2010, but they have in previous seasons.
It's not impossible that teams are changing the mounds, but it seems a bit outlandish of an explanation for most of the changes we observe in the data. Now it is possible that a real change in the mound could happen here or there and we wouldn't be able to tell it apart from all the changes that are happening due to camera calibration drift and changes.
Posted by: Mike Fast at December 25, 2010 3:17 PM
Jeremy, I think the way you are calculating the velocity adjustments is fine for a first pass. I do something similar when I want a quick and dirty estimate, and I think it works fine for most purposes. But to actually produce a fully corrected data set, one has to account for the fact that the position adjustments also affect the velocity adjustments.
Posted by: Mike Fast at December 25, 2010 4:05 PM
Mike, right, and the position adjustments also probably affect the position adjustments. I imagine a correction system is an iterative process. Thanks for hanging around here to answer questions.
Posted by: Jeremy at December 25, 2010 4:13 PM
Mike,
Thanks for the reply - that all makes sense. I guess I assumed the mound height was relatively uniform throughout the year(s) and not changing constantly as you described in your reply.
And I forgot to say in my first comment: very interesting article!
Posted by: Andrew at December 25, 2010 7:37 PM
Man am I a fool. Sorry for the double post but I am must correct my prior comment:
Thanks to JEREMY for the article and to MIKE for the reply.
Posted by: Andrew at December 25, 2010 7:38 PM
Andrew,
I'm thinking I'm misreading your post, but in case I'm not:
Mike is NOT saying the mound height varies. He is taking as given your statement that it IS relatively uniform throughout the year, and using that to suggest that idea that the explanation for the pitch f/x height variations is mound height changes is highly improbable.
Posted by: Patrick at December 25, 2010 9:21 PM