Perhaps the widest and deepest pitfall lying in wait for any who deal in numerical analyses is forgetting the distinction between precision and accuracy. If I state that Team X's opening-day first pitch was delivered at 1:07:32 pm, I am being quite precise; but if in fact it was a night game, then the statement that the pitch was made sometime between 7:35 and 7:40 pm, though far less precise, is far more accurate.
It is all too easy to be hypnotized by the ability to calculate some metric to a large number of decimal places into believing that such precision equates to accuracy. As a case in point, let us look over the concept of "park factors". It is undoubtable that ballparks influence the results that players achieve playing in them, and in many cases--"many" both as to particular parks and as to particular statistics--those influences are substantial. Park factors are intended as correctives, numbers that ideally allow inflating or deflating actual player or team results in a way that neutralizes park effects and give us a more nearly unbiased look at those players' and teams' abilities and achievements. So much virtually everyone knows.
The idea behind the construction of park factors, stated broadly, is to compare performance in a given park with performance elsewhere. As an example, a widely used method for educing park factors for a simple but basic metric, run scoring, is the one used by (but not original to) ESPN. The elements that go into it are team runs scored (R) and opponents' runs scored (OR) at home and away, and total games played at home and away.
           (Rh + ORh) ÷ Gh
  factor = ───────────────
           (Ra + ORa) ÷ Ga
That comes down to average combined (team plus opponents) runs scored per game at home divided by the corresponding figure for away games. Let us see what some of the things wrong with that basic approach are, and if we can improve on it.
A "park factor" is supposed to tell us how the park affects some datum--here, run scoring. Perhaps the most obvious failing of the ESPN method is made manifest by the simple question compared to what? In the calculation above, run scoring at Park X is being compared to run scoring at all parks except X. Thus, each park for which we calculate such a factor is being compared to some different basis: the pool of "away" parks for Park X is obviously different from the pool of "away" parks for Park Y (in that X's pool includes Y but excludes X itself, while Y's includes X but excludes Y itself). Now that rather basic folly can be fairly easily corrected for; let's call the average combined runs per game at home and away RPGh and RPGa, respectively. Then, if there are T teams in the league,
                        RPGh
  factor = ───────────────────────────────
           {[RPGa x (T - 1)]   [RPGh]} ÷ T
But there remain considerable problems, the most obvious being that the pools are still not identical, in that schedules are not perfectly balanced: Teams X and Y can, and probably do, play significantly different numbers of games in each of the other parks. Even if we throw out inter-league data, which is especially corrupt owing to the variable use of the DH Rule, we still have differing pools for differing teams, at least by division (and possibly even within divisions, owing to rainouts never made up). Well, one thinks, we can see how to deal with that: we would normalize away data park by park, then combine the results, so the "away" pool would, finally, represent the imaginary "league-average park" against which we would ideally like to compare any particular park's effects.
Let us remain aware, however, before we move on, that there are yet other difficulties. We have been using the simple--or rather, simplistic--idea of "games" as the basis for comparing parks' effects on run scoring. But even at that level, there are inequalities needing adjustment, in that the numbers of innings are not going to be equally apportioned among home batters, away batters, home pitchers, and away pitchers, in that a winning team at home does not bat in the bottom of the last inning. There is also the further question of whether innings are the proper basis for comparison. For most stats, the wanted basis for comparison is batter-pitcher confrontations, whether styled PA or BFP. But there are complexities there, too. A batter's ability to get walked, or a pitcher's tendency to give up walks, might seem best based on PAs or BFPs; but higher numbers of walks mean a higher on-base percentage, which means that more batters will get a chance to come to the plate (it is that "compound-interest effect" of OBA that is often not properly factored into metrics of run-generation, individual or team: not only is the chance of a batter becoming a run raised, but the chance of getting that chance is also raised). That will increase run scoring in a manner that a metric measured against PAs will not fully capture. And there are yet other questions, such as whether strikeouts should be normalized to plate appearances or to at-bats.
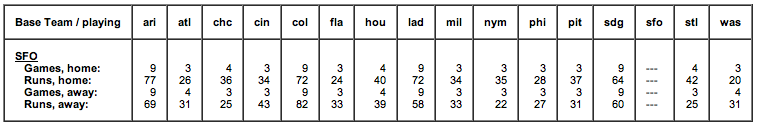
But for our purposes here--getting a grand overview of the plausibility of "park factors"--such niceties, while of interest, can be set aside. Let's look at the larger picture. Let's say we want to get a Runs park factor for Park X. We have seen that we need to use normalized runs per game on a park-by-park basis if we are to avoid gross distortions from schedule imbalances and related factors. How might that look for a real-world example? Let's take, arbitrarily, San Francisco in 2008. Here are the raw data:
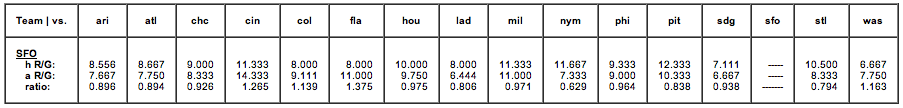
And here are the consequent paired raw factors:
But, because we have used a particular park for these figurings, all those numbers are relative to that park. What we want are numbers relative to that imaginary "league-average" park. For example, if we had chosen the stingiest park in the league, all the factors would be greater than 1; had we chosen the most generous, all the factors would be under 1. But all we have to do is average the various factors--in which process we assign the park itself, here San Francisco (I refuse to use the corporate-name-of-the-day for that or any park), a value of 1, since it is necessarily identical to itself--and then normalize the factors relative to that average. When we do that, we get what ought to be the runs "park factor" for each National-League park relative to an imaginary all-NL average park:

The average is not exactly 1.000 owing to rounding errors, but it's close enough for government work. If we sort that assemblage, it looks like this:
But before we jump to any conclusions whatever about those results, let's ponder this: they were derived from data for one park, one team. Yet, if the methodology is sound, we ought to get at least roughly the same results no matter which park we initially use. Imagine a Twilight-Zone universe in which the 2008 season was played out in some timeless place where each team played ten thousand games with each other team, yet still at their natural and normal performance levels as they were in 2008. Surely it is clear that we then could indeed use any one park as a basis for deriving "park factors" since, in the end, we normalize away that park to reach an all-league basis. In that Twilight Zone world, any variations from using this or that particular park can only be relatively minor random statistical noise. San Francisco is to Los Angeles thus, and San Francisco is to San Diego so, hence Los Angeles is to San Diego thus-and-so (in a manner of speaking). So what do we see if we try real calculations with real one-season data? Let's continue with the National League in 2008. Shown are the "park runs factors" for each park as calculated from each of the other parks as a basis. If the concept is sound, the numbers in each row across ought to be roughly the same. Ha.
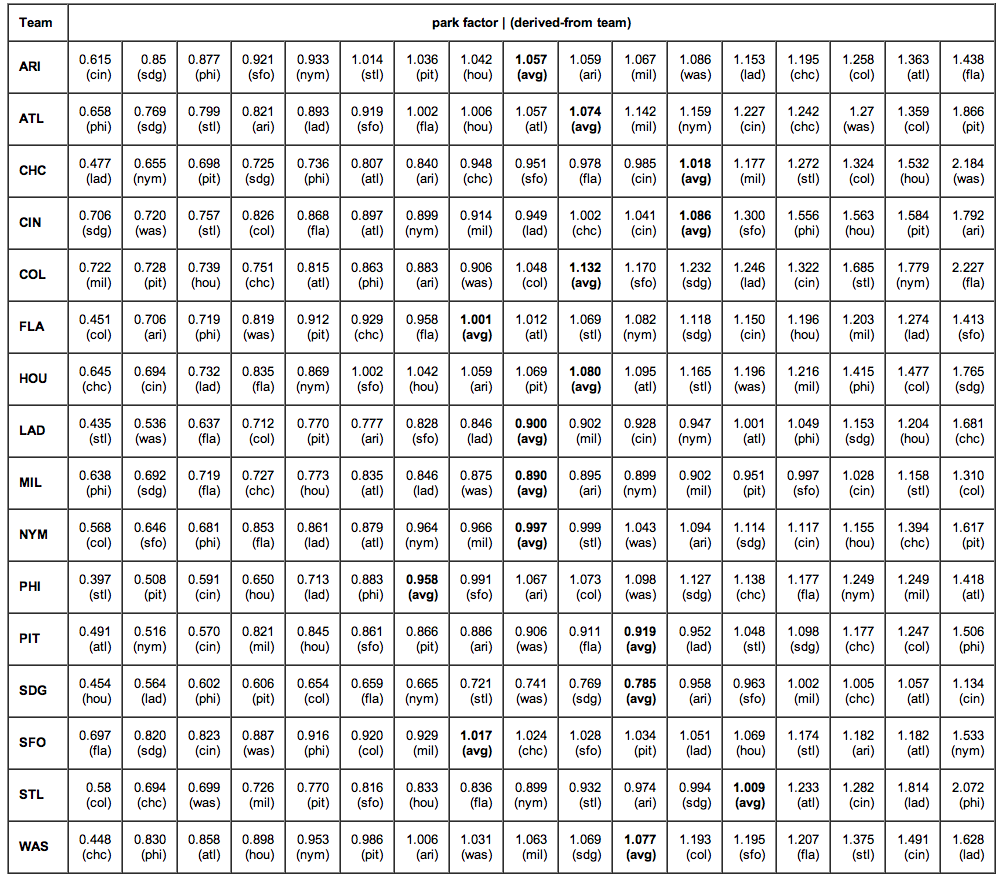
Well, now we know something, don't we? This just doesn't work. But it's not the methodology. Nor is it the various minor factors we saw earlier: those don't produce 3:1 and greater spreads in estimation. No, what we are dealing here, plain and simple, is the traditional statistical bugaboo--an inadequate sample size. Here is a possibly instructive presentation: the averaged run-factor values from that table above compared to what the simplistic ESPN formula yields:
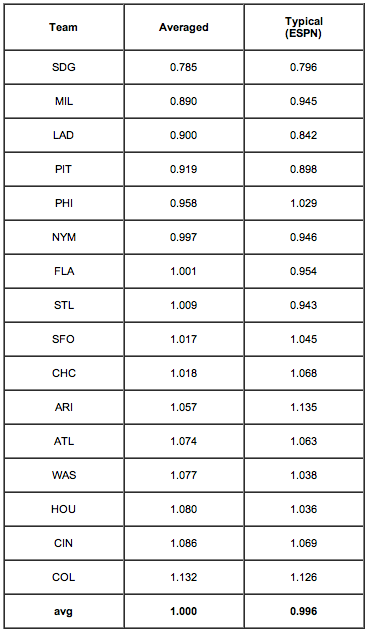
Instructive, indeed. The agreement is not perfect, as we would not expect it to be. The "average" column is a little better than the ESPN column because it allows better for the differing numbers of games on the schedule, but by using the average for each park of the values derived from all the other parks we are approximating the ESPN method.
The entire point of this lengthy demonstration has been to lift the lid off those nice, clean-looking, precise park-effect numbers to show the seething boil in the pot. The end results are not totally meaningless: we can say with fair credibility that San Diego's is a considerably more pitcher-friendly park than Colorado's, and that the Mets and the Marlins were playing in parks without gross distorting effects. But to try to numerically correct any team's results--much less any particular player's results--by means of "park factors" is very, very wrong.
But wait, there's more! (As they say on TV.) If the problem is a shortage of data, why not simply expand the sample size? Use multi-year data? That would be nice, and useful, were no park changed structurally over a period of some years. But consider: not even counting structural changes, in the last ten seasons (counting 2009), a full dozen totally new ballparks have come on line. When one considers that pace, plus the changes (some even to a few of those new parks), it becomes painfully obvious that trying multi-year data is as bad or worse. Even for a particular park that might itself not have been at all changed for many years, there remains the issue that the standard of comparison--that imaginary league-average park--will have changed, probably quite a lot, over that time, owing to changes in the other real parks. So we can't use multi-season values, and single-season values are comically insufficient for anything beyond broad-brush estimations, estimations more qualitative than quantitative.
I should point out that none of this is today's news. In 2007, Greg Rybarczyk at The Hardball Times noted that the home-run "factor" for the park in Arizona was 48 in one season and 116 in the next. Back in 2001, Rich Rifkin at Baseball Prospectus remarked that "Unfortunately, it is problematic to average out a park factor over more than a few years because the conditions of one or more of the ballparks in a league change. New stadiums are built, existing stadiums change their dimensions, and abnormal weather patterns have an impact." (Regrettably, the next sentence was "Nonetheless, a 10-year sample is likely to be more accurate than a one-year accounting.") Probably the defining essay on the subject is the 2007 paper titled "Improving Major League Baseball Park Factor Estimates", by Acharya, Ahmed, D'Amour, Lu, Morris, Oglevee, Peterson, and Swift, published in the Harvard Sports Analysis Collective. But, justifiably proud as they are of their improved methodology, even they concluded that "Unfortunately, the lack of longer-term data in Major League Baseball . . . makes it extraordinarily difficult to assess the true contribution of a ballpark to a team's offense or defensive strength."
Precisely accurate.
Eric Walker has been a professional baseball analyst for over a quarter-century. His paper "Winning Baseball", commissioned by the Oakland A's for the purpose, first instructed Billy Beane in the concepts later called "Moneyball"; Walker has also authored a book of essays, The Sinister First Baseman and Other Observations. Walker is now retired, but maintains the HBH Baseball-Analysis Web Site.