Ninety percent of the game is half mental, and that Yogiism is most apparent when it comes to the pitcher vs. batter matchup. Every at-bat has a story. Every pitcher has a repertoire of pitches from which to choose and he will use context and game theory when making his decisions. But perhaps the most important factor in determining pitch selection is the type of batter at the plate. So do batters control the type of pitches they see?
Dave Cameron recently got the ball rolling when he noted that that the percentage of fastballs a batter sees is inversely tied to his isolated power. The relationship makes intuitive sense, and the correlation coefficient of -.59 suggests that power is one of the most important determinants in how often a pitcher will challenge someone with a fastball. I decided to test out a whole lot more correlations to see what effects what. To better understand correlations and regressions in baseball, I’d suggest reading this article by John Beamer. The main points: the correlation coefficient is “a statistic representing how closely two variables co-vary; it can vary from -1 (perfect negative correlation) through 0 (no correlation) to 1.” Also, correlation does not imply causation. There will be a significant amount of interaction between the variables. For example, a batter who swings quite often will receive plenty of breaking balls, as those pitches are harder to make contact with. The flip side is that a batter may only swing so much because he sees a lot of curves and can't lay off them.
First, let's take a look at who saw the most fastballs, breaking balls, and off-speed pitches in any season over the last four years.
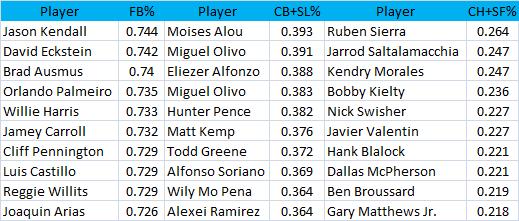
It looks like hitters with no power saw the most fastballs, free swinging power hitters saw the most breaking balls, and I don't see any rhyme or reason to the list of batters who saw a lot of change ups and split fingers.
My first test was to run a correlation four years with ISO and fastball percentage using my sample of about 1700 batters. The correlation coefficient was -.45. My initial guess was that as my sample had a lower minimum plate appearance, those batters with little reputation were being pitched differently than those whom the pitcher knew the book on. Limiting the plate appearance minimum from 100 to 300, and then to 500, I was proven wrong, as limiting the plate appearance minimum to 100, 300, or 500 resulted in correlation coefficients of -.45 as well. The low coefficient of correlation in my data was consistent with most of my results, as running the same statistical tests using plate discipline stats that Dave Appelman ran resulted in smaller coefficients.
Correlating fastball percentage with other traditional statistics confirms a lot of conventional baseball wisdom. The more a batter strikes out, the fewer fastballs and the more breaking balls he receives. There is also a positive relationship between strikeout percentage and fastball velocity. Unfortunately, no pitch type information correlates with batting average on balls in play. I had hoped that pitch type might be a factor in improving BABIP prediction models, but I guess not.
However, certain batted ball statistics do co-vary with pitch type. The stronger a batter’s pull tendency or fly ball tendency, the fewer fastballs he will likely receive over a year. Conversely, groundball hitters face a much higher percentage of fastballs. These types of hit trajectories and vectors are closely intertwined with power output, so this just further shows that pitchers tend to throw more fastballs to hitters who can’t do significant damage to them. This fear factor again comes through in testing how a pitcher will approach the zone against power hitters. There is a positive correlation between the number of wild pitches and passed balls and a batter's power based on stats like homerun per fly ball or ISO.
Plate discipline stats align quite well with pitch type stats. Showing a willingness to swing at pitches results in fewer fastballs, but making contact results in, or is the cause of, many fastballs. Moreover, free swingers face a higher fastball velocity than patient hitters, and contact hitters face a lower fastball velocity than power hitters. So when pitchers do challenge a scary hitter with a fastball, it appears that they dial it up. Or perhaps, only pitchers who can bring the heat will go after power hitters, while those with subpar fastballs simply avoid throwing fastballs altogether in those situations. And is there anything more frustrating than watching a batter swing at a slider in the dirt? There is a correlation between a batter's slider percentage and his swing percentage on pitches outside the strike zone, but the relationship only holds strong for batters who have established reputations in the league as hackers.
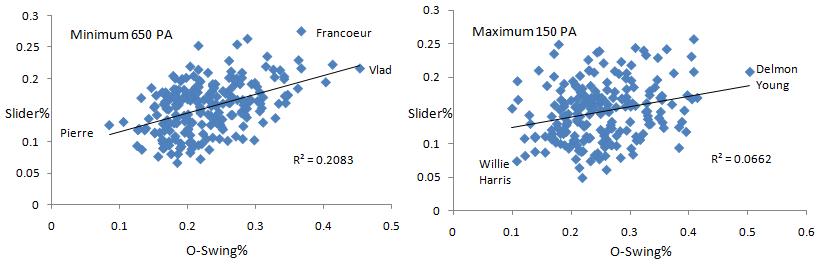
Notice the much lower coefficient of determination for players with between 100 and 150 plate appearances. There is a wider range of talent in this pool of players, but the spread in fastball percentage is also greater, suggesting a pitcher's choices are more random when they have less information on a batter.
Without expecting to find much, I tested the relationships between win probability statistics and pitch types. Though the results were rendered statistically insignificant, they all made sense. Batters who have higher leverage indexes over the course of a year tend to see fewer fastballs and curveballs, but more changeups and sliders. Furthermore, batters who come up with more on the line face increased velocity from each type of pitch. Then I looked at one of my favorite statistics, the clutch score—a measurement of how much better or worse a player does in high leverage situations than he would have done in a context neutral environment. Nothing significant or interesting came up with regards to pitch type, but I like the idea of clutchiness so much that I correlated it with other variables. As reported in Tango's clutch project, fans prefer batters who can put the bat on the ball. Batters who hit for power and strike out a lot do indeed perform slightly worse in the clutch, while those more adept at making contact perform slightly better.
Unfortunately, I didn’t account for any type of platoon situation, which is of course one of the more important things in determining pitch type. Same-handed batters vs. pitchers matchups see more breaking pitches while different-handed batters vs. pitcher matchups see more off-speed pitches in the variety of changeups and splitters. Running a basic test to see how well this theory holds up, I coded lefties as 0 and righties as 1 and correlated the handedness with pitch type. The percentage of sliders seen returned a correlation coefficient of .65, which confirms our suspicions. As righties see many more same-handed pitchers, they get a higher percentage of breaking pitches moving away from them. So even though lefties don't show up when searching for the leaders in slider percentage, that's just because they face a disproportionate number of different-handed pitchers.
Ryan Howard has never been able to hit left-handed pitchers (300 point difference in OPS in his career), and as such, he has received the highest percentage of sliders of any lefty each of the last two years with 200 plate appearances, but it still doesn’t place him in the top 25 either year. On the other side of the spectrum, the correlation between changeups and handedness was -.54. Lefties face different-handed pitchers much more often than same-handed, and therefore receive the changeup much more often than righties. Going a step further, we see that righties receive faster sliders and lefties get faster changeups because right-handed pitchers throw harder than lefties in general. Righties are also more likely to see pitches in the strikezone than lefties.
Lastly, park factors were not accounted for, though they play a large role in determining why pitchers throw certain pitches. As Josh Kalk showed, pitchers are much more likely to throw their fastball/sinker (which are classified as the same pitch by fangraphs) in Coors than in other parks. Matt Holliday, who is much more of a power hitter than a contact hitter would normally receive few fastballs, but playing in Coors, a pitcher’s best option is to bring the heat, as any kind of breaking ball in the thin air might get crushed. Therefore, Holliday has received a well above average amount of fastballs in his career, and it'll be interesting if his hitting approach changes as his pitch type profile changes.
Plugging a bunch of these variables into a multiple regression for fastball percentage yields an r-squared of .5 , meaning that half the variance in how often a batter is thrown a fastball can be explained by the hitter's contact skills, power, and plate discipline. So what I'm interested in is what the rest of the variance can be attributed to. Game state and randomness will certainly affect a pitcher's decision on what he will throw. And pitchers will often simply disregard the batter’s reputation, pitching their own game based on their own strengths. The last possibility is that pitchers are actually using more advanced data in their decisions. You can observe a lot by watching, and if pitchers study batter film or actually learn batter tendencies with the advent of pitch f/x data, it could change the art of the batter vs. pitcher matchup from what it was in Yogi's days.