"The STRIKE ZONE is that area over home plate the upper limit of which is a horizontal line at the midpoint between the top of the shoulders and the top of the uniform pants, and the lower level is a line at the hollow beneath the knee cap. The Strike Zone shall be determined from the batter's stance as the batter is prepared to swing at a pitched ball."
Eddie Gaedel knows not a called strike. The 3-foot-7 dwarf took four balls in his lone Major League plate appearance. (If you want to see a discussion on the practicality of short pinch-hitters taken well beyond its logical extreme, follow this link.
Gaedel physically shrunk the strike zone. I’m interested to see what batters can control the strike zone without any such advantage. Who manages to earn a ball on a pitch on the black or a strike on a pitch at the letters? That’s where pitchf/x comes into play.
John Walsh and Dave Allen have found the true dimensions of the strike zone using pitchf/x data. Jonathan Hale has studied individual umpire strike zones and found that Cy Young winners and control pitchers get better calls, and Hale dispelled the myth that rookies get big leagued by umps.
I assigned every pitch since 2008 an expected called strike probability based on the horizontal location of the pitch and a scaled vertical location*, while also accounting for batter handedness, pitch movement/velocity, and the umpire. After that, I added up the expected balls and called strikes of players, and the actual ball/strike numbers for all players. Here are the batters who have the largest disparity between their expected ball probability and the actual rate at which balls are called on them.
| Player | Balls:Called Strikes | Extra Balls | Ball Probability |
|---|---|---|---|
| Nelson Cruz | 2.9 | 49 | 115% |
| Chris Iannetta | 3.1 | 64 | 115% |
| Rick Ankiel | 3.6 | 47 | 115% |
| Michael Young | 2.5 | 98 | 114% |
| Ryan Raburn | 2.7 | 37 | 114% |
| John Buck | 2.9 | 38 | 113% |
| Josh Hamilton | 4.3 | 40 | 112% |
| Brad Wilkerson | 2.2 | 28 | 112% |
| Justin Morneau | 2.6 | 82 | 112% |
| Ken Griffey Jr. | 2.6 | 79 | 112% |
| Hunter Pence | 2.5 | -69 | 90% |
| Carlos Beltran | 2.5 | -75 | 89% |
| Alfonso Soriano | 2.8 | -56 | 88% |
| Travis Hafner | 2.2 | -52 | 88% |
| Brandon Phillips | 2.7 | -73 | 87% |
Michael Young and Carlos Beltran (who I suppose is synonymous with the called strike to Met fans) have the highest and lowest number of extra balls among all players, respectively. The average difference between a called strike and a ball is between a tenth and an eighth of a run. So Young has gotten nearly 20 runs of value out of controlling the strike zone better than Beltran has. To look deeper into this, I plotted their respective strike zones (Beltran's a switch hitter, so two for him) against the league average strike zones. Inside these contour lines, a pitch is more likely than not to be called a strike, while outside the contour lines, pitches are called for balls greater than 50% of the time.
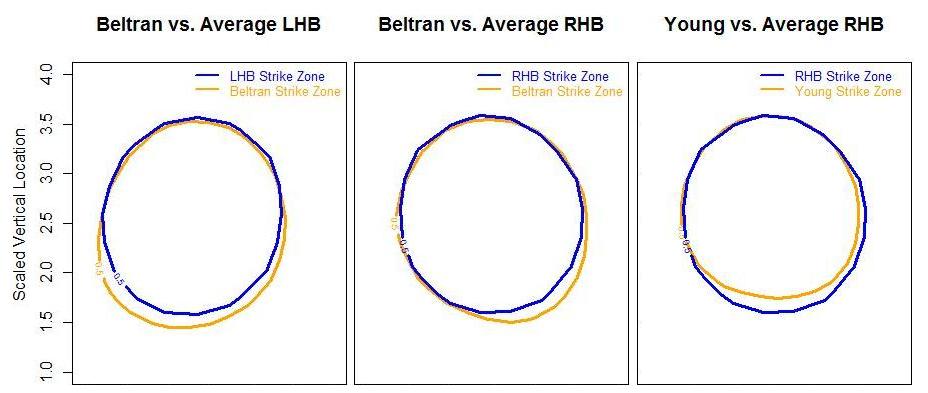
The difference between Beltran and Young can be seen at the knees. I should note the caveat that this entire effect could be caused by a few stringers listing Beltran’s bottom of the strikezone too high and Young's too low.
I don't want to make any rash conclusions on what type of players get the benefit of the doubt from umpires, but with three Rangers in the top ten, and another five Rangers in the next dozen on my list, I feel that I can say with confidence that Rudy Jaramillo is paying off umpires. Just throwing it out there. But I'm pretty sure it's true.
Seriously, though, one of the first things I noticed was that 10 of the top 30 players on the leaderboard were catchers. It turns out catchers are 2-3% more likely to have a pitch called a ball than average. It's fully possible that that's just noise, of course.
I was especially interested in batters' luck in full count situations. The leverage of a full count is double that of any other count, with the disparity in value between a walk and out coming in at around 0.6 runs. It turns out that Jack Cust, who has taken more full count pitches in the last two years than anyone but Adam Dunn, has had easily the best luck on full counts, with ten more balls called than expected. (Dunn's had one fewer than expected.)
Here I've plotted Cust's called strikes in green, balls in red, and the average LHB strike zone contour in blue.

I count two strikes easily outside the zone, and nine balls that were easily inside the zone. Most batters experience a smaller strike zone on full count than on average, but Cust has been particularly lucky. Serves him right for not swinging too often in a full count.
How about on the pitcher's side?
| Player | Balls:Called Strikes | Extra Strikes | Strike Probability |
|---|---|---|---|
| Tom Glavine | 2.1 | 88 | 178% |
| Peter Moylan | 2.3 | 45 | 130% |
| Derek Lowe | 1.9 | 288 | 129% |
| Gary Majewski | 1.9 | 28 | 126% |
| Francisco Cordero | 2.2 | 73 | 123% |
| Jorge Campillo | 1.8 | 87 | 122% |
| B.J. Ryan | 2.2 | 40 | 118% |
| Jamie Moyer | 2.0 | 171 | 118% |
| Matt Maloney | 1.9 | 18 | 117% |
| Tim Hudson | 2.2 | 61 | 117% |
| Dontrelle Willis | 2.7 | -30 | 86% |
| Luke French | 2.4 | -29 | 86% |
| T.J. Beam | 2.5 | -16 | 86% |
| Brandon League | 2.9 | -35 | 85% |
| Denny Bautista | 2.4 | -42 | 83% |
| Ryan Tucker | 3.6 | -22 | 78% |
It seems like control pitchers have better luck with umpires, which Hale has already shown. (The correlation between balls to called strikes ratio, which I'd consider a decent measure for control, is -.32.) Mariano Rivera, the best control pitcher in baseball, is 13% more likely to have his pitches called for strikes than you would expect. While watching Mo, you can sometimes actually see him intentionally try to expand the zone. When Hale did his study in 2007, he found that Derek Lowe had the highest rate of extra strikes per game. Demonstrating this ability for three straight years might be worth looking into further. Jamie Moyer and Lowe have also gotten five more strikeouts than expected on full counts, the most in the majors.
About the reliability of these ball and strike probabilities: For batters, the split-half correlation for "ball probability," (which I'm defining as the probability of a called pitch being called a ball above what is expected) reaches .5 when I limit my sample to batters with minimum of 125 called pitches. It takes batters with at least 600 called pitches to reach a .7 correlation. The league average pitches per plate appearances is 3.8, and an average of 2.1 of those pitches are called for a ball or strike by the umpire. So I’d say that it takes about 300 plate appearances for this metric to stabilize. You can compare that to more common metrics by reading the series by Pizza Cutter. or a sample of players with at least 50 plate appearances to know to regress halfway to the mean. For pitchers. r = .5 when pitchers the sample of pitchers has thrown at least 60 called pitches, and 300 called pitches to reach an r of .7.
*And Glove Slap to Tango on how to scale vertical location. I unfortunately decided to use the mean values of every batter's top and bottom strike zone values as inputted by MLBAM stringers. I probably should have scaled to the median, or better yet the median by month. Maybe next time.