Thanks to the work of Voros McCracken and later Tom Tango, Defense Independent Pitching and Fielding Independent Pitching have become widely accepted in the baseball community as better measurements of pitching effectiveness (and predictability of future results) than earned run average (ERA). DIPS and FIP focus on strikeouts, walks, and home runs — the three primary outcomes that a pitcher controls. Except for perhaps catchers, fielders have no impact on these events.
While SO, BB, and HR play a large part in determining ERA, the latter is also a function of defensive and bullpen support, as well as performance with bases empty vs. runners in scoring position. As a result, the difference between ERA and FIP is almost entirely accounted by strand rate (LOB%*) and batting average on balls in play (BABIP). Each variable has a coefficient correlation of nearly 80 percent with the delta between ERA and FIP.
* Based on the formula, the strand rate is an estimator of LOB% rather than an actual tally.
When you put the two together (LOB% divided by BABIP), the coefficient correlation jumps to 90 percent. Accordingly, the coefficient of determination or R² is 81 percent. In other words, more than four-fifths of the difference between ERA and FIP is due to LOB% and BABIP. As such, in addition to SO, BB, and HR rates, it makes sense to study LOB% and BABIP to understand why a pitcher's ERA may be better or worse than his FIP.
The MLB averages for LOB% and BABIP have been running at almost exactly 72 percent and .300, respectively, for several years. These percentages held true once again in 2010.
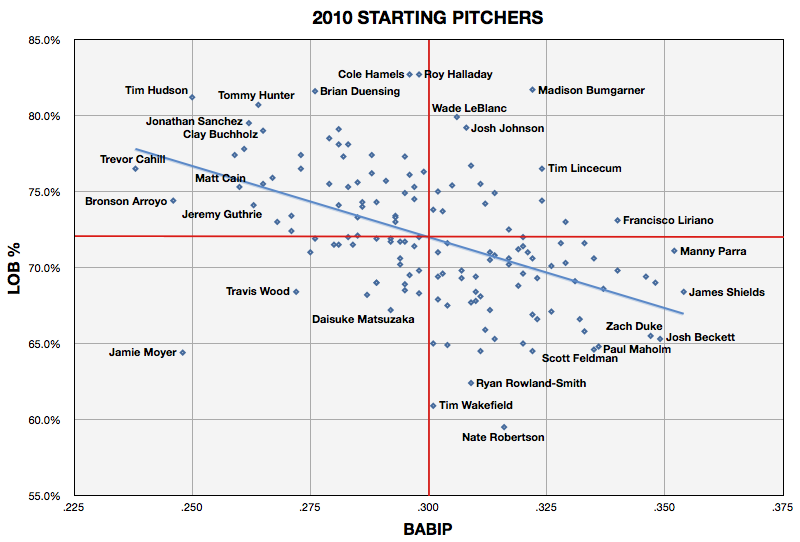
Plotting LOB% on the y-axis and BABIP on the x-axis for all 147 pitchers who threw at least 100 innings in 2010, I created the following graph. As has become customary around these parts, I broke the graph into quadrants via the intersection of the LOB% and BABIP means. The pitchers in the northwest quadrant had high LOB% and low BABIP. Moving clockwise, the pitchers in the northeast quadrant had high LOB% and high BABIP, the hurlers in the southeast quadrant had low LOB% and high BABIP, and those in the southwest quadrant had low LOB% and low BABIP.
The numbers were lifted from FanGraphs in January. The BABIP data was subsequently recalculated, perhaps due to FanGraphs using an incorrect formula initially. While directionally correct, the BABIP used for this graph are generally about .005-.010 higher than those listed on the site now. The LOB% data matches exactly. You can download the spreadsheet with the applicable data here.
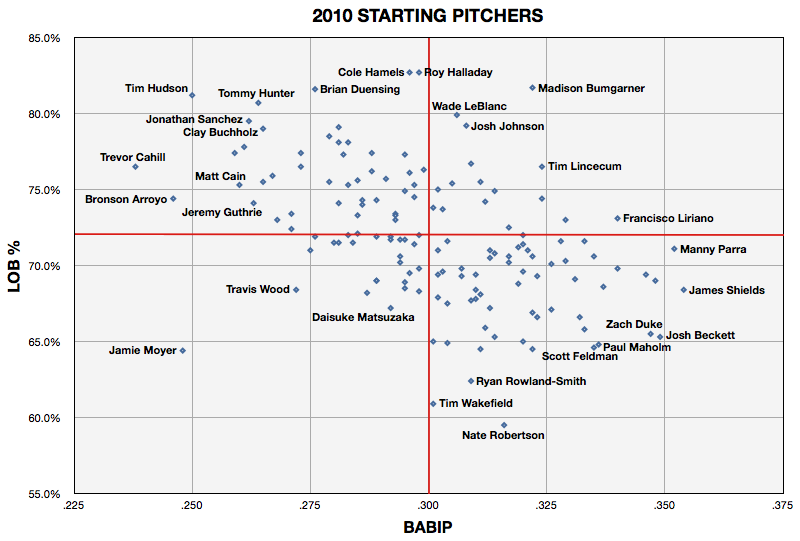
As usual, I have identified the outliers in all four quadrants in the graph above. In addition, as shown below, I have created lists of leaders and laggards for both LOB% and BABIP. For perspective, the ranges on LOB% and BABIP were 59.5-82.7 percent and .238-.354, respectively.
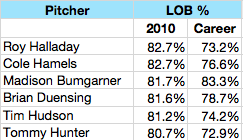
Starting with LOB%, I highlighted the six pitchers with strand rates over 80 percent and compared 2010 with their career marks. All but Madison Bumgarner (who pitched just 10 innings prior to last season) have career LOB% that are well below their results in 2010. That said, I found it interesting that the career rates were all above the MLB norm of 72 percent.
Roy Halladay, Cole Hamels, Brian Duensing, Tim Hudson, and Tommy Hunter all posted career high LOB%. Halladay had only exceeded 75 percent twice before last year.
In addition to sharing high LOB%, the common thread among these pitchers is that they fared better with RISP than with the bases empty.
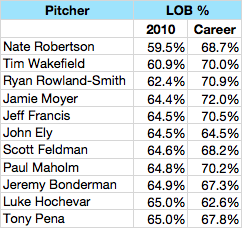
There were 11 pitchers with strand rates of 65 percent or lower. Excluding John Ely (who was a rookie), all but Luke Hochevar have career LOB% that are well above their results in 2010. Nonetheless, I found it as equally interesting as the observation from the leader board that the career rates were all at or below the MLB norm of 72 percent.
Nate Robertson, Tim Wakefield, Ryan Rowland-Smith, Jeff Francis, and Paul Maholm all posted career low LOB%. Scott Feldman, Jeremy Bonderman, and Tony Pena produced the second-lowest LOB% while Jamie Moyer had the third-lowest since he broke into the majors in 1986.
In addition to sharing low LOB%, the common thread among these pitchers is that they fared worse with RISP than with the bases empty.
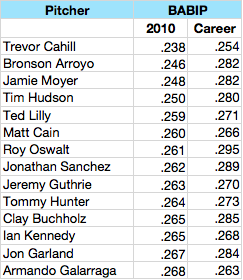
Turning to BABIP, I spotlighted the 14 pitchers with averages under .270 and, like LOB%, compared 2010 with their career marks. All of these starters (including Armando Galarraga who actually posted a .261 BABIP based on FanGraphs' revised calculations) have career BABIP that are above their results in 2010. Of note, the career rates were all below the MLB norm of .300.
Matt Cain has never had a league-average BABIP and, in fact, has not exceeded the .278 he allowed in 2007.
Hudson and Hunter appear on the most favorable LOB% and BABIP lists. Moyer, on the other hand, was the only pitcher to appear on a leader and laggard board.
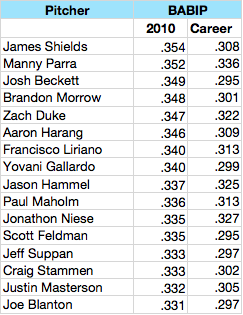
There were 16 pitchers with BABIP higher than .330. All of these pitchers have career BABIP that are below their results in 2010. In five cases, the career marks are slightly below the MLB norm of .300. The balance are all higher.
Maholm and Feldman appear on the least favorable LOB% and BABIP lists.
Here is the same graph presented with a best-fit trendline. As shown, it slopes from the northwest quadrant down and to the right through the intersection to the southeast quadrant. Generally speaking, the lower the BABIP, the higher the LOB%, and the higher BABIP, the lower the LOB%.
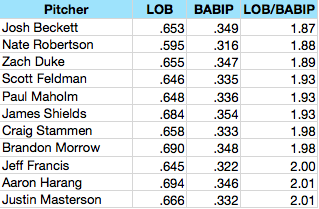
The outliers in the NWQ were the pitchers who benefited the most from high LOB% and low BABIP. Here are the pitchers with the highest ratios of LOB% divided by BABIP:
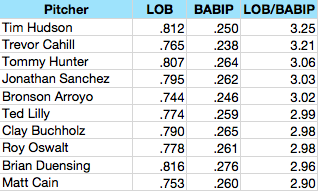
Six of the above pitchers ranked in the top seven in ascending order in ERA minus FIP (E-F), meaning they had better ERAs than FIPs. The other four placed 11th, 17th, 27th, and 28th (out of 147 pitchers who threw at least 100 innings in 2010).
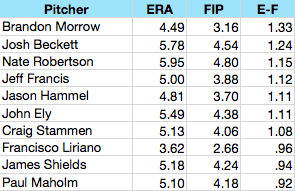
Conversely, the outliers in the SEQ were victimized the most by low LOB% and high BABIP. Here are the pitchers with the lowest ratios:
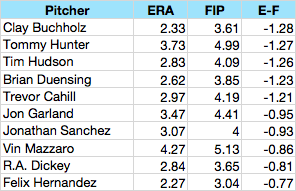
Seven of the above pitchers ranked in the top ten in descending order in E-F, meaning they had worse ERAs than FIPs. The other four placed 17th, 19th, 21st, and 22nd.
Interestingly, the outliers in the NEQ and SWQ neither benefited nor were victimized in the aggregate as the abnormal percentages in each category basically offset one another. As an example, Moyer, a SWQ outlier, had an ERA (4.84) minus FIP (4.98) of -0.14.
There are several takeaways embedded in this study, some of which are more obvious than others:
There are also a few questions: Is the discrepancy in performance between RISP and bases empty due to a pitcher's ability to work from the windup as opposed to the stretch? Do certain pitchers have an extra gear that they can employ when the going gets tough? Is there a self-fulfilling prophecy at play here, a Yogi-ism where pitchers perform well until they don't perform well? The answers to these questions could go a long way toward understanding how much skill or luck is involved in the year-to-year fluctuations in LOB%.
Courtesy of Dave Studeman of The Hardball Times, you can read more about LOB% here and here.