In this article, I'll attempt to finish the title's sentence by doing a principal component analysis on player statistics. Going into this I had no idea what I would find or whether the principal component analysis would find anything interesting at all.
For those unfamiliar with the type analysis, the point of it is to reduce a large number of potentially correlated variables down to a few key underlying factors that explain the variables. The researcher feeds the computer a bunch of records (in the this case, players) and several key variables (in this case, their statistics), The computer, blind to what those variables actually mean, spits out a set of underlying factors which explain the "true" underlying causes for the variables in question. It does this by maximizing the variability between the players. It's then up to the researcher to interpret what each factor represents. In this case, I'm looking for the one underlying factor that best describes a player.
In the baseball world, I wondered what one underlying factor best determined a player's statistics. Normally, this type of analysis would be done on many more variables, but I wanted to see what it would pick out from players' basic, non-team influenced statistics: 1B, 2B, 3B, HR, BB, K.
The principal component analysis spits out a bunch of factors, each with decreasing importance in determining a player's statistics. Only the first one really had much meaning to it, and with only six variables to analyze, this wasn't much of a surprise. The analysis attempts to differentiate players as much as possible, but the big question was how did it divide the players? It could have pitted good players vs. bad players, power hitters vs. contact hitters, patient players vs. free swingers, etc. But what happened?
In fact the factor loadings for the first principal component were as follows:
1B -.556
2B .132
3B -.259
HR .502
BB .382
SO .456
As it turns out, the analysis shows that if you want to put the players into two distinct camps, one camp (whose overall scores will be positive) is made up guys who hit with power, walk a lot, and strikeout a lot, while another camp (whose scores will be negative) is made up of guys who hit a lot of singles and triples and make contact.
I actually think this makes a lot of sense in describing a player's hitting style in just one number. While of course there are plenty of metrics out there to determine a player's skill and value to a team, there isn't a single metric that describes a player's playing style on a sliding scale. A Batting Style score using these values as weights does just that.
On one end of the spectrum are contact hitters, small-ball, Mike Scioscia/Ozzie Guillen type players who make their living with singles, triples, and not striking out much. The other end are Earl Weaver/Billy Beane type players who hit homers and draw walks. Which type of player a man is best determines his statistics. It's Moneyball vs. small-ball. This one number represents the spectrum of playing styles.
To get a Batting Style score for each player, we can simply multiply their normalized statistics by the weights above. Doing so gives a normally distributed set of players with a range going from about -4 to 4. To make the results a little more intuitive, I converted this to a scale where the average was 100 with a standard deviation of 15. Players with high scores are "three true outcome" type players while those with low scores play with the opposite style.
How does the Batting Style number look according to 2009 data? The top ten most extreme players of each batting style are shown below:
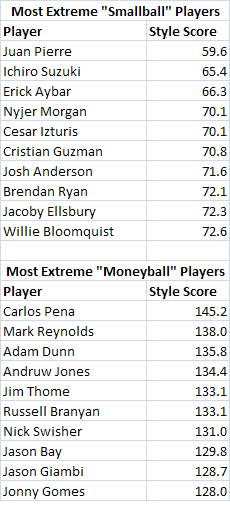
Now, it's hard to imagine a two more different sets of players. Everything that the first group of players does well, the second group does poorly, and vice-versa. Both sets have some good players and some bad players, and whether a player is good or bad doesn't much affect his Style score. Adam Dunn and Jason Bay provided good hitting value to their clubs, as did Jacoby Ellsbury and Ichiro, they just did it in different ways. A stat like wOBA tells you the value of a particular player. For instance, in 2009 Russell Branyan had a wOBA of .368 and Ichiro had a wOBA of .369. So they seem like pretty much the same player, right? Of course not. Ichrio and Branyan have two completely opposite styles of play. Ichiro has speed, gets a ton of singles and rarely homers, walks, or strikes out. Meanwhile Branyan's entire value is based on the long ball and the base on balls. The Batting Style score shows the immense difference between the two players. Branyan has the fifth highest Batting Style score, while Ichiro has the second lowest score.
Of course, not every player falls into one of these two types. Players who have a "medium" style can have moderate scores on each metric. For example, Ronnie Belliard does everything about average, hence his Batting Style score is about average. It also includes unusual players who don't fall into the usual patterns. Aaron Hill doesn't walk much or strikeout much, but he hits homeruns. Hence, his overall style falls in the middle. Meanwhile Bobby Abreu walks a lot, but also gets a lot of singles. Hence, he doesn't fall into either extreme either. The Batting Style doesn't discriminate based on the skill of the player, although as you might expect, guys who have the power/walk Batting Style are as a whole slightly more valuable simply because guys who hit a lot of homeruns and take a lot of walks, are generally more valuable than singles hitters, though the difference is not major. Guys on the contact end of the spectrum have a wOBA of about 10 points lower than guys on the power end of the spectrum. You can check out the full list of player Batting Style scores here:
It's also interesting to look at this same list through history. Which players had the most extreme styles of during each decade? The list below (including all players with at least 1000 career PA's) shows the top three extreme players in each decade.
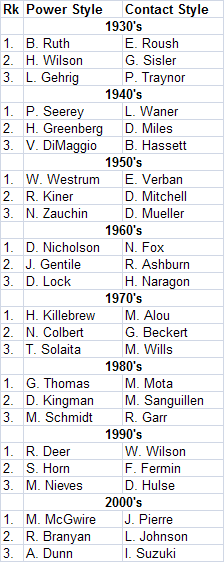
As you might expect, Babe Ruth is the original power/walk/strikeout player. As someone who revolutionized the game in that regard, it comes as no surprise. Harmon Killebrew, Mark McGwire, Dave Kingman, are others that famously fall into that same mold and are identified here. Meanwhile, Willie Wilson, Nellie Fox, and Matty Alou are on the other end of the spectrum - precisely the guys that you would expect. The analysis was run on the dataset as a whole (though to really be correct, it really should be run on each individual year). Over time, the styles have definitely shifted away from the contact approach and towards the power/walk style. Overall, there's not really a surprise in the bunch except for the fact that I've never heard of some of the older, more obscure players. Personally, I find both styles of player fun to watch as their extreme styles seem to make them more colorful, though I think that the power guys have historically caught more grief from fans and have been underrated up until the recent sabermetric revolution.
Whether a statistic like Batting Style has any real value to it or not, I think it's fun. Obviously, a line of six statistics isn't too hard to digest, but I like the idea of a single number describing a player's hitting style. In any case, it was interesting that the principal component analysis picked up on the two distinct styles and drew the scale the way it did. I think if you asked fans to name two completely opposite hitters, you would get a lot of Juan Pierre/Adam Dunn responses, which shows that the principal component analysis picked out an intuitive result.