Sometimes I think most baseball strategy has been figured out thanks to sabermetricians like you and me. Then I discover that a major facet of the game is being mismanaged at a shocking rate.
Let me explain. I recently undertook a study to analyze the importance of outfield arms, starting with centerfielders. I used Andruw Jones as a case study to determine how many baserunners he’s able to prevent from advancing compared to the average centerfielder. What I learned was that Jones, generally regarded as having one of the best outfield arms in baseball, only prevented 9 runners from advancing in 247 chances last year compared to the average centerfielder. Why so low? Is it because Jones doesn’t have such a feared arm after all? Certainly not. Instead it appears baserunners are incredibly reluctant to advance on anybody; basically only taking the risk when it’s a sure thing. Here’s how I came to that conclusion.
Using Retrosheet data from 2006, the success rate of runners attempting to advance on a ball hit to centerfield with less than two outs is seen in the following table.
Less Than 2 Outs        Chances   Attempted    Out       Success
                                  Advance      Trying    Rate
----------------------------------------------------------------
1st to 3rd on single    1079      305          6         .98
2nd to home on single   1039      700          22        .97
1st to home on double   469       243          13        .95
1st to 2nd on flyball   1385      23           2         .91
2nd to 3rd on flyball   1008      360          11        .97
3rd to home on flyball  689       599          15        .97
Total                   5669      2230         69        .97
Notice how 61% of baserunners don’t even try for the extra base with less than 2 outs. Of those who challenge the outfielder, only 3% get thrown out, and only 1% of all baserunners facing the decision of whether or not to advance get gunned down. That’s what I meant when I said they take the risk only when it’s a sure thing.
Here’s the same chart with 2 outs.
Less Than 2 Outs        Chances   Attempted    Out       Success
                                  Advance      Trying    Rate
----------------------------------------------------------------
1st to 3rd on single    699       262          3        .99
2nd to home on single   813       784          33       .96
1st to home on double   304       225          8        .96
Total                   1816      1271         44       .97
So with two outs and the runners moving on contact, and in a situation where one would expect to see additional risks taken because of the greater possibility of stranding runners, the success rate is the same at 97%.
There are three possible explanations for the high overall success rate. One is the possibility that runners and coaches are extremely reluctant to try and advance for fear of getting thrown out and the shame that comes with it. Certainly, being thrown out can be a rally killer, but a 1% failure rate is almost like taking no risk at all.
Another explanation is the extreme difficulty in throwing a runner out from centerfield. Consider all the unlikely things that must happen for a runner to be thrown out. First the defender must field the ball cleanly, then hit the cutoff man with a strong throw, or throw a strike from the outfield to the base in question. If cutoff, the infielder then needs to turn and throw a strike, usually from the outfield grass, without first looking. If all these things go right, there’s still a chance the ball might hit the baserunner. If not, the fielder needs to catch it cleanly, often on a hop, position himself properly and apply the tag. A play at the plate brings additional challenges. A ball thrown from centerfield frequently hits the pitcher’s mound knocking it offline or slowing it down, while the catcher must try and block the plate and brace himself for a collision while still making the catch and applying the tag.
The final possibility is that centerfielders as a whole don’t possess exceptionally strong throwing arms. Rightfielders tend to have the strongest arms because of the need to make the long throw to third base. Also, the prototypical centerfielder is slender and swift, hardly the type of ballplayer known for a cannon arm (yes, I’m referring to you Juan Pierre and Coco Crisp). Ichiro is the exception that makes the rule although he was a rightfielder for his entire MLB career until late in 2006.
Of the three possible explanations for a 97% success rate, the second and third go hand in hand connoting a degree of difficulty that is undeniable. But, given the difficulty of the task, wouldn’t baserunners be more inclined to take the risk? Which brings us back to explanation #1 – there must be a decided reluctance among runners and coaches to try for the extra base.
How reluctant are they and what is the right amount to run? For that we turn to a methodology frequently used to analyze the value of the stolen base. It’s based on the Run Expectancy table here, i.e. the number of runs one can expect for the remainder of an inning given the number of runners on base and the number of outs. From the table, one can calculate the break-even point for various strategies. For instance, if staying put on a base is expected to yield 1.2 runs for the remainder of an inning, and going for the extra base increases the yield to 1.4 runs, but the result of getting thrown out would decrease the expectancy to 1.0 runs, then the risk is equal to the reward and the break-even point is a 50% success rate.
Using that methodology, the generally accepted break-even point for stealing second base is between 67% and 75% as described in this Baseball Analysts article earlier in the season. This type of analysis is common for stolen bases and bunts, but to my knowledge has never been published for runners trying to advance on batted balls - until now.
The graph below shows all the possible scenarios and break-even points for 0 outs and 1 out compared to the actual success rate for each situation.
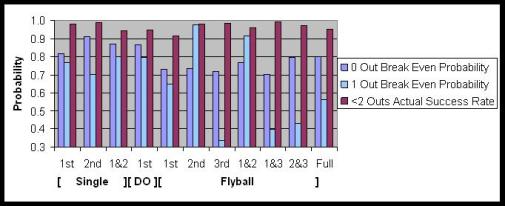
Notice how the break-even points are usually lower with one out than with no outs. This implies that runners should take more risks later in the inning, which makes sense because the more outs there are, the greater chance of a runner getting stranded on the bases. The exception appears to be when a runner is trying for 3rd on a flyball. In that situation, he should be more cautious with one out than with no outs.
Also, the break-even point can be wildly different depending on the number of outs. For instance, with a runner on 3rd and nobody out, the break-even point on a flyball to centerfield is .72 (the flyball being the first out), whereas with one out (two outs after the flyball is caught) the break-even point is a miniscule .34. The break-even analysis indicates that coaches should send guys from 3rd almost every time on a flyball to center with one out. Even if they’re thrown out 65% of the time, the net result will be positive. Basically the risk of sending a dead duck to the plate is worth it compared to relying on the next batter to knock the run in. And yet, the actual success rate in that situation is an incredible 98%! The chart visually depicts that in every situation the actual success rate far exceeds what one would expect using break-even analysis.
Clearly the run environment has a lot to do with break-even points. This includes the ballpark, the stinginess of the pitcher and defense, the score of the game, and the ability of the upcoming batters to drive runs in. Runners should be more cautious with big boppers hitting behind them, while they should be more aggressive toward the bottom of the batting order. Dan Levitt has a good discussion of run environments in his analysis of bunting here. For the sake of simplicity, this analysis ignores the run environment and looks at the situation as a whole, based on a season’s worth of data.
It’s somewhat ironic how the prototypical batting order has the speedy guys up front who would naturally be more aggressive baserunners, followed by the run producers who create a run environment where the speedy guys should be less risky on the bases. I guess I subscribe to the theory that those with the highest OBP should bat in the #1 and #2 spots regardless of how fast they are. But, that’s another topic for another day. Now back to the issue at hand.
With two outs, the chart is simpler because of the absence of runners advancing on flyballs, and looks like this:
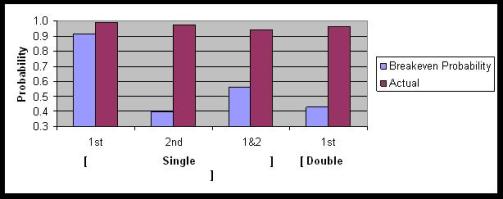
When trying to score with 2 outs, the break-even probability is between .40 and .55 depending on the situation, while the actual success rate is well north of .90! Once again, the chart indicates that the actual success rate is significantly higher than the break-even value for every situation. This data reinforces my previous verdict that runners/coaches are phenomenally risk averse when it comes to taking the extra base.
For as long as I can remember, baseball announcers were always warning fans that it’s a mortal sin for ballplayers to make the first or third out at 3rd base. The data above tests that claim and supports half of the general tenet. With two outs, the highest break-even mark is at 92% when a runner tries for 3rd on a single. Similarly, the first graph showed us that runners trying to advance to 3rd on a flyball caught for the second out have break-even rates of 97% with a runner on 2nd and 92% with runners on 1st and 2nd. So it’s clear that making the final out at 3rd with two outs is not recommended. However, with nobody out, the story is different. Runners trying to advance to 3rd have a break even rate of 81%, but runners trying to score have break-even rates of 91% or 87% depending on the situation. So it appears that the greater sin is getting thrown out at home with nobody out, not at 3rd.
Although my analysis was conducted using only balls hit to centerfield, the results appear to be similar for hits to left and rightfield. According to Dan Fox in his 3-part series on baserunning here, the total success rate from 2000-2004 is .94 for balls hit to leftfield and .96 for balls hit to right not counting runners advancing on flyball outs. It should also be noted that the break-even numbers are conservative estimates. The actual break-even value is lower than indicated because the analysis ignores the possibility of trailing runners advancing on a throw, or of a throwing error allowing a runner to take an extra base. Finally, the analysis doesn’t look at singles stretched into doubles, doubles into triples, or triples into inside-the-park homers because the Retrosheet information doesn’t lend itself to that level of detail. Assuming similar reluctance and success rates, one can extrapolate the information to conclude that the total impact of runner’s reluctance is significantly higher than any estimate based only on baserunners trying to advance.
In conclusion, this is what we know so far:
1. Runners and coaches are extremely reluctant to go for the extra base on centerfielders
2. This “runner’s reluctance” applies not only to balls hit to centerfield as studied here, but to left and rightfield as well
3. Break-even analysis indicates that actual success rates are universally higher than break-even rates
4. In general, runners should take more risks as the number of outs increase
5. Runners should be the most cautious when trying for 3rd with two outs, or when trying for home with zero outs (not 3rd as the old adage states)
6. With two outs, runners should try for home even if the failure rate is greater than 50%.
What we don’t know is the impact of runner’s reluctance relative to runs scored and wins. For that you’ll have come back tomorrow for Part Two of the analysis.
Ross Roley is a lifelong baseball fan, a baseball analysis hobbyist, and former Professor of Mathematics at the U.S. Air Force Academy.