Rich Lederer • Baseball Beat
Patrick Sullivan • Change-Up
Jeremy Greenhouse • Touching Bases
Dave Allen • F/X Visualizations
Sky Andrecheck • Behind the Scoreboard
Marc Hulet • Around the Minors
Al Doyle • Past Times
Retired Uniforms:
Bryan Smith • WTNY
Joe Sheehan • Command Post
Jeff Albert • The Batter's Eye
RSS Feed
Home
*Examining the Past, Present, and Future*
Lineup Card
Recent Entries
» Putting Together a Reality Team
» Historical Hall of Fame Vote Comparisons: 2012
» An All-Christmas Team
» The New-Look Angels
» John Denny: The Forgotten Cy Young Award Winner
» Money Isn't Everything
» What Would It Take to Hit .400 in the 21st Century?
» Halos Heaven
» Brandon McCarthy's Breakout Season
» Link-o-Rama
» Historical Hall of Fame Vote Comparisons: 2012
» An All-Christmas Team
» The New-Look Angels
» John Denny: The Forgotten Cy Young Award Winner
» Money Isn't Everything
» What Would It Take to Hit .400 in the 21st Century?
» Halos Heaven
» Brandon McCarthy's Breakout Season
» Link-o-Rama
Best of Baseball Beat
Abstracts From the Abstracts
1977 Baseball Abstract
1978 Baseball Abstract
1979 Baseball Abstract
1980 Baseball Abstract
1981 Baseball Abstract
1982 Baseball Abstract
1983 Baseball Abstract
1984 Baseball Abstract
1985 Baseball Abstract
1986 Baseball Abstract
1987 Baseball Abstract
1988 Baseball Abstract
1978 Baseball Abstract
1979 Baseball Abstract
1980 Baseball Abstract
1981 Baseball Abstract
1982 Baseball Abstract
1983 Baseball Abstract
1984 Baseball Abstract
1985 Baseball Abstract
1986 Baseball Abstract
1987 Baseball Abstract
1988 Baseball Abstract
Bert Blyleven Series
Meeting Up and Hanging Out with Bert
The Results Are In And...
Aficionado Heavily Invested in Blyleven
Latest on Blyleven's Chances for the HOF
The Internet Zealot Responds
400 Down and 5 to Go...
Bert Be Home By Eleven?
Blyleven's Forgotten Season (1973)
HeyMan, Your Comments Don't Hold Water
The Waiting is the Hardest Part
Another Addition to the Blyleven Series
Search for the Truth
As Dominant as His HOF Contemporaries
Listen, Buster
A Larger Step for Blyleven
Answering the Naysayers (Part Two)
Another Small Step for Blyleven
Q&A: Blyleven on the Twins
The Majority Rules, Right?
It's All Dutch to Some
The Hall of Fame Case for Bert Blyleven
Q&A: Blyleven on Felix Hernandez
Clemens Rocketing Up Charts
Poz: An Interview With a KC Star
A HOF Chat with Tracy Ringolsby
Up Close and Personal
A Peek Into the Mind of a HOF Voter
Answering the Naysayers
It's That Time of the Year (Again)
"If Cooperstown is Calling..."
The Bert Alert
One Small Step for Blyleven...
Only the Lonely
Exclusive Interviews
Lee Sinins
Alex Belth
David Pinto
Will Carroll
Mike Carminati
Aaron Gleeman
Joe Sheehan
Jay Jaffe
Jeff Peek
Tracy Ringolsby
Joe Posnanski
Bill James Part I, II, III
Jon Lalonde
Chuck Tiffany
Dayn Perry
Fay Vincent
Nate Silver
Alex Belth
David Pinto
Will Carroll
Mike Carminati
Aaron Gleeman
Joe Sheehan
Jay Jaffe
Jeff Peek
Tracy Ringolsby
Joe Posnanski
Bill James Part I, II, III
Jon Lalonde
Chuck Tiffany
Dayn Perry
Fay Vincent
Nate Silver
Bullpen
Rich Lederer
The Odd Couple (with Alex Belth)
The MostUnder Over Underrated Player in Baseball (with Brian Gunn)
Three Wise Men (roundtable by Alex Belth)
Infrequently Asked Questions (interview with Matt Welch)
Interview (Orioles Think Tank)
Bernie and the Yanks (Bronx Banter)
Hope and Faith: How the LAA Win the World Series (Baseball Prospectus)
NL West (The Soul of Baseball)
Greatest Living Hitter? (Sports Illustrated)
Roundtable: 2008 HOF Ballot (Armchair GM)
The Most
Three Wise Men (roundtable by Alex Belth)
Infrequently Asked Questions (interview with Matt Welch)
Interview (Orioles Think Tank)
Bernie and the Yanks (Bronx Banter)
Hope and Faith: How the LAA Win the World Series (Baseball Prospectus)
NL West (The Soul of Baseball)
Greatest Living Hitter? (Sports Illustrated)
Roundtable: 2008 HOF Ballot (Armchair GM)
Patrick Sullivan
Designated Hitters
David Bromberg (Q&A: John Denny)
Mark Armour (H. Killebrew and Versatility)
Joe Lederer (Soundtrack of a Prospect)
David Bromberg (Clemente's Autograph)
David Bromberg (Woody Fryman)
D. Baumstein (WAR Against Age: Pitchers)
Doug Baumstein (The WAR Against Age)
Doug Baumstein (A Lifetime on the Road)
John Fraser (Pick Six)
Mark Armour (How to Score More Runs?)
Bill Parker (What Opening Day Tells Us)
Stan Opdyke (Pat Rispole)
Chris Jaffe (Evaluating Baseball's Mgrs)
Stan Opdyke (Baseball Radio in NYC, 1953)
A. Nathan (Performance of Baseball Bats)
Michael Weddell (Edgar Martinez/HOF)
Jon Weisman (100 Things Dodgers Fans...)
Stan Opdyke (Connie Mack and Vin Scully)
Eric Walker (Evaluating Run Production)
Brent Mayne (The Intangibles of Catching)
Chris Moore (Best Fastballs in Baseball)
Dave Baldwin (The Batter’s Brain)
Shawn Haviland (Ivy League to MLB)
Larry Granillo (Walking Off)
Rob Iracane (Solo HR Won't Break You)
Tommy Bennett (Charm of AM Radio)
Harry Pavlidis (Johan Santana's Fast Start)
John Walsh (WAR and Remembrance)
Eric Walker (Precisely Inaccurate)
Bob Timmermann (As They See 'Em)
Geoff Young (Unicycles and Delusions)
Baseball Analysis at Tufts (Groundballers)
Baseball Analysis at Tufts (GB Out Rates)
G. Rybarczyk ('09 Hit Tracker Projections)
Joe Lederer (Curt Schilling/HoF)
Conor Gallagher (Hall of Fallacies)
Chris Green (Jim Rice, HoF, the Numbers)
Shawn Hoffman (Baseball's Bear Mkt?)
Paul Anthony (Manny Syndrome)
Ross Roley (World Series Odds)
B. Timmermann (Catcher's Interference)
R.J. Anderson (Waiting the Hardest Part)
Maury Brown (Cubs, MLB, and Cuban...)
Myron Logan (Dee-Fense, Dee-Fense)
Craig Calcaterra (Frivolity, Part I, Part II)
Chad Finn (Ode to Baseball Cards)
David Cameron (Mariners Foibles)
Chris Dial (Chipper Jones)
Pat Lederer (Memory Lane)
David Appelman (Clutch Pitching)
Bob Rittner (DH)
Jonathan Mayo (Roger Clemens)
Lisa Winston (My Son-in-Law...)
Russ McQueen (The Yellow Hammer)
Bob Rittner (I'm OK, You're OK)
Mark Armour (In Defense of the HOF)
Pat Jordan (Friends)
Dan Levitt (Analysis of Terry Ryan)
Doug Baumstein (Trading Econ 101)
Ross Roley (Runner's Reluctance II)
Ross Roley (Runner's Reluctance I)
Mark Armour (No-Longer Lovable Sox)
Bruce Regal (Stealthy and Wise)
Brian Gunn (Roid Monster)
Current/McEvoy (Value of the SB)
John Rickert (Sinister Thefts)
Nate Silver (Sabermetrics)
David Vincent (Home Run Production)
Joe P. Sheehan (Enhanced Gameday II)
Mark Armour (An Ode to Sport)
David Gassko (All-Time Worm Burners)
Joe P. Sheehan (Enhanced Gameday)
John Walsh (When Titans Clash)
Fox/Williams (Quantifying Coaches II)
Fox/Williams (Quantifying Coaches I)
Jacob Luft (Bull Durham Rant)
Chad Finn (Strat-O-Matic)
Lisa Winston (Rotisserie Baseball)
Dave Studeman (Baseball Stats)
Steve Treder (Roger Craig)
Marc Normandin (Jeff Bagwell)
D. Appelman (Expanding Strike Zone)
Jeff Sackmann (Worst MiL Defenders)
Jeff Sackmann (Best MiL Defenders)
Maxwell Kates (Van Lingle Mungo)
David Appelman (Pitch Location)
Kent Bonham (Danny Ray Herrera)
Glenn Stout (Two Baseball Poems)
Bruce Regal (The Challenge Round)
Mark Lamster (Barry & Ty)
Geoff Young (NL West)
Tom Lederer (The Ryan Express)
Brian Erts (Great Leap Forward)
David Pinto (Parity and the N.L.)
Jacob Luft (Fathers and Daughters)
Jamey Newberg (Pete's Sake)
Jeff Albert (A. Jones Swing Analysis)
Jeff Albert (A-Rod Swing Analysis)
Keith Law (Death, Taxes, and Waivers)
Peter Abraham (Tales of Torre Tales)
Larry Borowsky (Let 'er Rip II)
Dan Levitt (Empirical Analysis of Bunting)
Jonah Keri (If I Met Warren Cromartie...)
Bob Klapisch (War Stories)
Bob Timmermann (John F. Kennedy HS)
Kent Bonham (Aluminum Adjustments)
Al Doyle (More Than Superstars)
Ross Roley (Instant Replay)
David Vincent (Barry Bonds Homers)
Chad Finn (Our Favorite Obscurities)
Bill Deane (1979 NL MVP)
Mark Armour (Rise/Fall of Artificial Turf)
Jeff Angus (Wally Moon Camp)
David Berri (Money and Baseball)
Larry Borowsky (Baseball w/o the #s)
Derek Zumsteg (The Irrational Market)
David Regan (Free Agent Contracts)
Peter Schmuck (Steroids and the HOF)
David Appelman (Pitchers, Pitch by Pitch)
Dan Fox (Swinging, Taking, Fouling, Etc)
Patrick Sullivan (Study of NYY CF/BOS LF)
Will Leitch (Baseball Journalism)
Jeff Sullivan (Pitcher Release Points)
Steve Treder ('69-'70 Giants)
Maury Brown (Charlie Finley)
John Brattain (Bob Johnson)
Bob Klapisch (The Case for Bert Blyleven)
Jeff Peek (Pride and Prejudice)
Dayn Perry (Bert and Warren)
Rob Neyer (If Don Sutton Was Great...)
Lisa Winston (Minor League Memories)
Alex Belth (Otis Redding Was Right)
David Cameron (Long Live the King)
Jeff Angus (Baserunning Study)
Bert Blyleven (Baseball Playoffs)
Boyd Nation (Not a Prospect List)
James Click (Batters-Baserunners Study)
Jeff Shaw (Why I Love Baseball)
David Gassko (BIP/BFP Fielding Study)
Jay Jaffe (Milwaukee Sausage Race)
Jamey Newberg (Remember When)
Bob Klapisch (Press Box to the Mound)
Dan Levitt (Predictive Value of BB)
David Vincent (Official Scorer)
Jon Weisman (Rick Monday)
Larry Borowsky (Let 'er Rip)
Will Carroll (Fictional Short Story)
Bob Timmermann (Japanese Baseball)
Cyril Morong (Best Pitching Seasons)
Sean Forman (Monte Carlo Win-Loss)
Brian Gunn (My Little Blue Book)
Joe Lederer (My Dad and Baseball)
Bill Deane (Bob Gibson, 1968)
Mark Armour (1977 Yankees)
Darren Viola (Retrosheet)
David Pinto (RFK)
Dayn Perry (Brave Heart)
Matt Welch (Dave Hansen)
Kevin Kernan (Jack McKeon)
Tom Lederer (Dodgers Road Trip)
Steve Lombardi (Slider)
Studes (Picturing Baseball)
Mike Carminati (Luck of the Drawl)
Eric Neel (Vin Scully)
J.C. Bradbury (Leo Mazzone)
John Sickels (Bill James)
Search Baseball Analysts
Archives
By Category:
Around the Majors Content Only
Around the Minors Content Only
Baseball Beat Content Only
Baseball Beat/Change-Up Content Only
Baseball Beat/WTNY Content Only
Behind the Scoreboard Content Only
Change-Up Content Only
Change-Up/Around the Majors Content Only
Command Post Content Only
Crunching the Numbers Content Only
Designated Hitter Content Only
F/X Visualizations Content Only
Past Times Content Only
Saber Talk Content Only
The Batter's Eye Content Only
Touching Bases Content Only
Weekend Blog Content Only
WTNY Content Only
By Month:
February 2012
January 2012
December 2011
October 2011
September 2011
August 2011
July 2011
June 2011
May 2011
April 2011
March 2011
February 2011
January 2011
December 2010
November 2010
October 2010
September 2010
August 2010
July 2010
June 2010
May 2010
April 2010
March 2010
February 2010
January 2010
December 2009
November 2009
October 2009
September 2009
August 2009
July 2009
June 2009
May 2009
April 2009
March 2009
February 2009
January 2009
December 2008
November 2008
October 2008
September 2008
August 2008
July 2008
June 2008
May 2008
April 2008
March 2008
February 2008
January 2008
December 2007
November 2007
October 2007
September 2007
August 2007
July 2007
June 2007
May 2007
April 2007
March 2007
February 2007
January 2007
December 2006
November 2006
October 2006
September 2006
August 2006
July 2006
June 2006
May 2006
April 2006
March 2006
February 2006
January 2006
December 2005
November 2005
October 2005
September 2005
August 2005
July 2005
June 2005
May 2005
April 2005
March 2005
February 2005
January 2005
December 2004
November 2004
October 2004
September 2004
August 2004
July 2004
June 2004
May 2004
April 2004
March 2004
February 2004
January 2004
December 2003
November 2003
October 2003
September 2003
August 2003
July 2003
June 2003
Reference
Organizational Stats
Arizona Diamondbacks Bat / Pitch
Atlanta Braves Bat / Pitch
Baltimore Orioles Bat / Pitch
Boston Red Sox Bat / Pitch
Chicago Cubs Bat / Pitch
Chicago White Sox Bat / Pitch
Cincinnati Reds Bat / Pitch
Cleveland Indians Bat / Pitch
Colorado Rockies Bat / Pitch
Detroit Tigers Bat / Pitch
Florida Marlins Bat / Pitch
Houston Astros Bat / Pitch
Kansas City Royals Bat / Pitch
Los Angeles Angels Bat / Pitch
Los Angeles Dodgers Bat / Pitch
Milwaukee Brewers Bat / Pitch
Minnesota Twins Bat / Pitch
New York Mets Bat / Pitch
New York Yankees Bat / Pitch
Oakland Athletics Bat / Pitch
Philadelphia Phillies Bat / Pitch
Pittsburgh Pirates Bat / Pitch
St. Louis Cardinals Bat / Pitch
San Diego Padres Bat / Pitch
San Francisco Giants Bat / Pitch
Seattle Mariners Bat / Pitch
Tampa Bay Devil Rays Bat / Pitch
Texas Rangers Bat / Pitch
Toronto Blue Jays Bat / Pitch
Washington Nationals Bat / Pitch
All-Star Links
Official Websites
News and Notes
Baseball News Blog
Baseball Newstand
ESPN Baseball
Fox Sports Baseball
Pro Sports Daily
Roto World
The Roto Times
USA Today Baseball
Baseball Newstand
ESPN Baseball
Fox Sports Baseball
Pro Sports Daily
Roto World
The Roto Times
USA Today Baseball
Reference and Analysis
Baseball Almanac
Baseball America
Baseball Archive
Baseball Contracts
Baseball Cube
Baseball Graphs
Baseball Library
Baseball Musings Player Database
Baseball Page
Baseball Primer
Baseball Prospectus
Baseball Reference
Baseball Statistics
Baseball Truth
Boxscore Central
Diamond Mind Baseball
Doug's Stats
FanGraphs
Fast Balls (pitchfx catalog)
Hardball Dollars
Hardball Times
Hit Tracker
Retrosheet
Rotobase/Rotoblog
Stat Corner
STATS
Tango on Baseball
Yahoo Sports MLB
Web Gems
Bill James Primer
Sabermetric Manifesto (Grabiner)
Pitching and Defense (McCracken)
Pitching and Defense (Tippett)
Transactions Primer (Neyer)
Baseball Stats (Batter's Box)
Prospect Report (Cameron)
Pitcher Workloads (Sheehan)
Goodbye to Old Baseball Ideas (Rickey)
Sabermetric Manifesto (Grabiner)
Pitching and Defense (McCracken)
Pitching and Defense (Tippett)
Transactions Primer (Neyer)
Baseball Stats (Batter's Box)
Prospect Report (Cameron)
Pitcher Workloads (Sheehan)
Goodbye to Old Baseball Ideas (Rickey)
Columnists
Baseball Blogs
Around the Majors
Athletics Nation
Baseball Crank
Baseball Musings
Baseball-Reference Blog
Batter's Box
Big League Stew
Bronx Banter
Catfish Stew
Cub Town
Dan Agonistes
Dodger Thoughts
DRays Bay
Ducksnorts
Futility Infielder
Halos Heaven
Inside the Rockies
It Might Be Dangerous
Knuckle Curve
LoHud Yankees Blog
Lookout Landing
Management by Baseball
Metaforian
Metsgeek
Mike's Baseball Rants
Only Baseball Matters
Redbird Nation
Red Reporter
Sabernomics (Braves)
Seth Speaks
ShysterBall
6-4-2 (Angels/Dodgers)
The Book
TheCubdom
The Cutting Edge
The House That Dewey Built
The View From The Bleachers
Tiger Blog
U.S.S. Mariner
Viva El Birdos
Where's Kernan
Minor Leagues
Arizona Fall League
BA Player Finder
Cal Leaguers
Jamey Newberg
JDM's Scoresheet Baseball
Minor League Baseball
Minor League Park Factors
Minor League Splits
No Pepper
Sickels' Minor League Ball
Warm October Nights
BA Player Finder
Cal Leaguers
Jamey Newberg
JDM's Scoresheet Baseball
Minor League Baseball
Minor League Park Factors
Minor League Splits
No Pepper
Sickels' Minor League Ball
Warm October Nights
Amateur
Boyd's World (College)
Cape Cod Baseball League
College Baseball Blog
College Baseball Insider
Collegiate Baseball Newspaper
College Splits
College Splits Blog
Dirtbags Baseball (Long Beach State)
NCAA Baseball
NCBWA
Team One Baseball (High School)
Texas A&M & Baseball
Cape Cod Baseball League
College Baseball Blog
College Baseball Insider
Collegiate Baseball Newspaper
College Splits
College Splits Blog
Dirtbags Baseball (Long Beach State)
NCAA Baseball
NCBWA
Team One Baseball (High School)
Texas A&M & Baseball
Historical
Cuban Baseball
House of David
Jim "Mudcat" Grant's Web Page
Negro League Baseball Players Assoc
Negro Leagues Baseball Museum
1919 Black Sox
Pacific Coast League
Philadelphia Athletics Historical Society
Shoeless Joe Jackson Society
SABR-L Archives
Walter O'Malley
House of David
Jim "Mudcat" Grant's Web Page
Negro League Baseball Players Assoc
Negro Leagues Baseball Museum
1919 Black Sox
Pacific Coast League
Philadelphia Athletics Historical Society
Shoeless Joe Jackson Society
SABR-L Archives
Walter O'Malley
Miscellaneous
Forums
Credits
Ticket Center
Tickets to Baseball -
Premium Red Sox Tickets - Tickets to Marlins Games - Cardinals Game Tickets - NY Yankee Tickets - Tickets Oakland Athletics - Dallas Cowboys Tickets - Arizona Cardinals Tickets - Tickets Seattle Seahawks - Buffalo Bills Tickets Online - Tickets to Dolphins Football
Buy Boston Red Sox tickets,
Philadelphia Phillies tix,
NY Yankees tickets,
NY Mets tickets, and
MLB All Star game tickets at ABC tickets
Not sure where to find the best online sportsbooks? Start your search with PlayersJet.
Get deals at SportsMemorabilia.com on baseball apparel, including Phillies jerseys and more for adults and children.
Shop the largest selection baseball equipment on sale at Sports Unlimited. Check out tons of baseball gloves, youth baseball gloves and catchers gear from Rawlings, Wilson, Nike & Under Armour.
2011 Draft Order
Courtesy of Baseball America
First-Round:
 1. Pirates (57-105)
 2. Mariners (61-101)
 3. Diamondbacks (65-97)
 4. Orioles (66-96)
 5. Royals (67-95)
 6. Nationals (69-93)
 7. Diamondbacks (for B. Loux)
 8. Indians (69-93)
 9. Cubs (75-87)
10. Padres (for Karsten Whitson)
11. Astros (76-86)
12. Brewers (77-85)
13. Mets (79-83)
14. Marlins (80-82)
15. Brewers (for Dylan Covey)
16. Dodgers (80-82)
17. Angels (80-82)
18. Athletics (81-81)
19. Red Sox (from DET for Martinez)
20. Rockies (83-79)
21. Blue Jays (85-77)
22. Cardinals (86-76)
23. Nationals (from CWS for Dunn)
24. Rays (from BOS for Crawford)
25. Padres (90-72)
26. Red Sox (from TEX for Beltre)
27. Reds (91-71)
28. Braves (91-71)
29. Giants (92-70)
30. Twins (94-68)
31. Rays (from NYY for Soriano)
32. Rays (96-66)
33. Rangers (from PHI for Lee)
Supplemental First Round:
34. Nationals (Dunn)
35. Blue Jays (Downs)
36. Red Sox (Martinez)
37. Rangers (Lee)
38. Rays (Crawford)
39. Phillies (Werth)
40. Red Sox (Beltre)
41. Rays (Soriano)
42. Rays (Balfour)
43. Diamondbacks (LaRoche)
44. Mets (Feliciano)
45. Rockies (Dotel)
46. Blue Jays (Buck)
47. White Sox (Putz)
48. Padres (Garland)
49. Giants (Uribe)
50. Twins (Hudson)
51. Yankees (Vazquez)
52. Rays (Benoit)
53. Blue Jays (Olivo)
54. Padres (Torrealba)
55. Twins (Crain)
56. Rays (Choate)
57. Blue Jays (Gregg)
58. Padres (Correia)
59. Rays (Hawpe)
| Designated Hitter | October 10, 2011 |
John Denny: The Forgotten Cy Young Award Winner
A friend of mine, Ross Moskowitz, is the director of Camp Westmont, a beautiful summer camp in the Pocono Mts. of Pennsylvania. It's the kind of place every kid should be able to attend at least once in their lives. He's also a baseball man. Played Division One NCAA baseball at the University of Maryland. So when he told me that John Denny was going to be his baseball instructor this past summer, I thought it would make for a very interesting story/interview. How does a good pitcher become the best pitcher in the world for one season and win the Cy Young award? From Bob Turley to Randy Jones to Mark Davis to Pat Hentgen, just to name a few, there have been a bunch of pitchers who've taken that step.
I spent a morning with John Denny at the end of August. He's 58 years old now and has kept in great shape. Simply put, he's one of the nicest, soft-spoken people I've ever met. Aside from working for the Arizona Diamondbacks for a few years, he hasn't had that much to do with Major League Baseball since he retired in 1986. Like most former ballplayers, he has a amazing memory of games, players, even specific at-bats from 25-35 years ago. He's also quite introspective about himself and his place in the game's past. His response to my question "So you won Game One of the 1983 World Series?" was unexpected. "Yeah, how about that," as if he still couldn't quite believe his good fortune. We went off topic at times, but his stories about his Hall of Fame teammates were worth hearing. I turned on the tape recorder.
David: In looking at your career, the numbers tell a story of a pitcher with obvious talent, twice leading the NL in ERA, who would follow those seasons with quite a few off years. Were injuries a major factor?
John: Injuries were a big problem for me. My rookie year, 1975, I started the season 2-2 for St. Louis, they sent me back to Triple-A for a month. When I came back, I won seven games in a row, I'm 9-2 and some people were talking about me as a Rookie of the Year candidate. One day, I'm jogging in the outfield in Cincinnati and I tore a lateral ligament. We were only a few games out of first, so I pitched through it and wound up 10-7. The next year, 1976, I was healthy and led the league in ERA (2.52). Then, in 1977, I started the season 7-0 and I strained my hamstring covering first base, then tore that hamstring at Dodger Stadium. And I wound up going 8-8. 1978, I was healthy again and had another good year (14-11, 2.96 ERA).
David: Who was your manager with the Cards?
John: Red Schoendeinst was my first manager, then Vern Rapp and finally Ken Boyer. This was right before the Whitey Herzog era. I would've loved to have played for Whitey, but I was traded to Cleveland. But I loved my time in St. Louis. I played with Joe Torre, Bob Gibson and Lou Brock. They were true professionals and some of that rubbed off on me.
David: So you go from a great baseball city to playing in Municipal Stadium?
John: It was tough. That park seated 80,000 people, so even if we had 40,000 people in the stands, which we rarely did, it was half empty. And I think that affected a lot of our players. We had a good rotation. Bert Blyleven, Rick Sutcliffe, myself, Rick Waits, who won 15-16 games one year. Later, Len Barker. After a few years, I became a free agent while with Cleveland. And George Steinbrenner offered the world to me, but I turned him down.
David: I never knew that.
John: My agent handled it all. I never met Steinbrenner, but his quote the next day in the newspapers was something like "John Denny will never wear a Yankee uniform as long as I'm alive." I would've loved to have played for the Yankees, but word was he was very interfering, came down to the locker room all the time. I didn't think I could play for an owner like that.
David: I've never been shy about my feelings for him. I believe he demeaned the game more than anyone in my lifetime. Younger people, especially Yankee fans, forget just how hated he was in New York until they started winning again in 1996.
John: Well, he offered me the best contract with wonderful perks and opportunities for the future. I would've been way better off financially. But my thinking was I worked very hard and I played the game very hard. And I pictured myself working my butt off, putting every ounce of energy I had into the game. I was a thinking pitcher and I studied the hitters. And I pictured if things weren't going well, he'd call me into his office and air me out. And then go to the papers and tell them what he just did. I didn't want to put myself in that situation. And I eventually wound up with the Phils and I loved my time there. I missed almost the entire 1982 season, but then got involved with a strength and flexibility coach that Steve Carlton recommended and he helped me enormously.
David: Before we get to your time with the Phils, let me ask you, "Who was your toughest hitter to face? Who lit you up?"
John: Easy, Tony Gwynn. His pitch recognition was incredible. So I'd make some adjustments and the minute I thought I had him, he'd make adjustments too. Always one step ahead of me. As time went on, I thought I was starting to figure him out. If he had a weakness, it was inside. But you couldn't live in there. The moment you thought you could pound him inside, he'd make that adjustment and take you deep. So I'd go to my sinking fastball and start to pitch him away, but he used to take that to left field really well.
David: How was Willie Stargell to face?
John: I don't know what my actual stats against him were, but I'll tell you this story about Stargell. I was pitching in Pittsburgh one night and I threw him a fastball, down and away. He turned that sucker around right up the middle. I could hear that ball singing as it went by me. It short-hopped the fence in left center for a double. He hit it so hard and I remember thinking to myself that ball might've killed me. From then on, I pitched him only inside and I didn't care if he hit it five miles. He was a true professional too, an old school guy and I was a newer type of player. And I learned so much from the old schoolers.
David: Who else?
John: Pete Rose. I pitched a great game one night with St. Louis against the Big Red Machine — Monday Night Game of the Week. The next day he calls me over before our game. I'm 23 years old and I'm wondering what does Pete Rose want to talk to me about? He says "John, I just want to tell you last night you threw one hell of a ballgame. Your fastball was in on my hands all night. But I'll tell you something, next time I'm gonna get you good, you S.O.B." More than anyone, he helped show me how to be a professional and still show respect to the other team and the other players and still be the man and the player you need to be.
David: Let's talk about the 1983 Phils and your Cy Young season. Who was your pitching coach there?
John: Claude Osteen, who had been my teammate and pitching coach with the Cardinals. He was the perfect pitching coach for me.
David: The 1983 Phils are one of my favorite teams. The team had started to age quite a bit, had a lot of veterans, Schmidt, Carlton, Rose. Then they get even older by adding Joe Morgan and Tony Perez at the end of their careers and they win the pennant. Remarkable story.
John: They called us "the Wheeze Kids." (The 1950 pennant winning Phils were called the Whiz Kids).
David: Right. Now, obviously, you were healthy. Did you add a new pitch, change your motion?
John: No, but a few things happened. First, I was in great shape, the best of my career. I had started working out with a strength and conditioning coach, Van Hoefling. He had been with the Los Angeles Rams and when Roman Gabriel was traded to the Eagles, Van followed him to Philly. And Lefty and I got involved with him. And he was great for me. But no new pitch or motion. I was basically a fastball, curve pitcher. And I could add some sink or movement to both of them, so I guess I threw four pitches.
The biggest difference was that I was playing on a team with guys who knew how to win and it rubbed off on me.
David: It was attitude?
John: Attitude and being in great shape. Here's one example and this is what I loved about Pete Rose. I'd get two strikes on a batter and I'd hear him yell or whistle from his position at first base. "You got two strikes on this guy, you know what to do." Because you never want to lose a batter with two strikes on him, you need to finish him off. And Rose was the kind of guy who pounded it home. Just like his career. He took the talent he had and pounded it home, never let up. He stayed on me all year. I am so blessed I was able to play with him. And Lefty and Schmitty and Morgan and Perez too.
Lefty and I had lockers next to each other. Talk about two different guys. I was a Christian and he believed in Eastern religions, mysticism. But we were so close, worked out in the offseason together. One time I said to him, "Lefty, I've never thrown a slider in my life, show it to me." So he held the ball up, put his hand up and says "I just turn my wrist a little bit like this and I throw the shit out of it." (Laughter).
He had great catchers in Bob Boone and Tim McCarver who got to know him as well as he knew himself. I don't recall Lefty shaking off many pitches. And it was a combination of three things. I know what I'm doing out here, I really don't need to take charge because my catcher is handling it very well and I know I can throw what they want.
David: What a huge advantage for a pitcher.
John: Oh yeah. One of the things I tried to do was not to get into a disagreement with any catcher. If he's calling for a fastball down and away and I want to throw up and in, I would say to myself "What the heck, I can throw down and away and still get this guy out." And it made me a better pitcher and it also made my catcher better too because now he knows that I trusted him and then they would work even harder and call a better game." And Lefty had his catcher's trust and that's huge.
David: What was it like in 1983 to look behind you and see Rose at first, Morgan at second and Schmidt at 3rd?
John: You know, the first real ballgame I ever saw in my life, I was ten years old (1963) and my Little League coach, who I still stay in touch with, he was like a father figure to me, took me to Los Angeles from where I was born and raised in Arizona.
David: Were you a Dodgers fan?
John: Well, actually I used to listen to the Giants all the time because I could get KNBR radio very well where I lived. Willie Mays was my favorite player. So he took me to a Dodgers/Giants game. Juan Marichal and Don Drysdale and the Dodgers won 1-0 in the bottom of the 9th inning. I can still remember Marichal throwing that incredible overhand curve for a strike with that big leg kick. So at 10 years old, I get to see two great Hall of Fame pitchers in this great pitching duel and in 1983, I get to play alongside five Hall of Famers.
Now we played mostly on Astroturf back then. Perez, Morgan and Rose were all on their way out, had already lost a step, but anytime there were runners in scoring position, they'd always dive for balls. They saved me run after run after run. They always gave it everything they had and we won the pennant that year to a large degree because of their professionalism. And that leadership rubbed off on Schmitty and we desparately needed that because he could be quite volatile. The fans could really get on him.
David: Give me an example of Schmidt's leadership.
John: I was pitching against Nolan Ryan in Philadelphia. I was down 2-1 in the bottom of the 8th. Ryan was so unhittable that day, throwing darts. Top of our order, he goes through the first two guys. Garry Maddox or Gary Matthews, I can't remember which, draws a walk. Schmitty comes up and Ryan had been making him look terrible all day. Schmitty had no chance. Ryan was on the attack the whole game — attack, attack. He goes 3-2 on Schmitty. And Schmidt would always try to analyze what pitch was coming. Everyone on the bench was hoping for a fastball, because if Ryan dropped that hook on him, he had no chance.
Ryan was grunting on every pitch, never saw anyone throw harder than he did that day. He was so intimidating. Fastball. Ball landed in the second deck and we won the game 3-2. Now that's talent, but it's also leadership because Schmitty knew no one else on our club could touch Ryan that day. It was up to him.
David: So you win the pennant and you win Game One of the World Series?
John: Yeah, how about that.
David: Was the game at the Vet?
John: No, it was in Baltimore, won it 2-1, beat Scott McGregor. I gave up a home run to Jim Dwyer, who was my minor league teammate on the Cardinals, pitched well rest of the game. Only game we won.
David: 19-7, 2.37 ERA, Cy Young Award, win a World Series game.
John: Pretty great year to live through.
For the past 30 years, David Bromberg has lived in Northeast Pennsylvania, former home of the Scranton/Wilkes Barre Red Barons (Phils Triple A team) and current home of the S/WB Yankees Triple A team. He was dubbed "the most inveterate baseball fan in northeast Pa. by Ron Allen, who hosted the local nightly sports radio call-in show there.
| Designated Hitter | June 13, 2011 |
Harmon Killebrew and “Versatility”
The recent death of Harmon Killebrew prompted many touching reminiscences about a man with seemingly no enemies, despite carrying around the nickname of “Killer” for most of his life. (He did not really need a nickname; both his first and last names are unique in major league history.) By all accounts, he was a gentle and loving person, who also happened to hit home runs more frequently than anyone of his time. He hit 45 or more round trippers six times in the 1960s, while no other American League batter did it more than once. For baseball fans of a certain age, no player will ever better personify the word “slugger.”
Another interesting thing about Killebrew, perhaps unique among Hall of Fame players: he was repeatedly shifted between three defensive positions throughout his career, getting 44% of his starts at first base, 33% at third base, and 22% in left field. While many players shift positions along the defensive spectrum as they age, moving from shortstop to third base, or from left field to first base, Killebrew’s managers shifted their star hitter, nearly to the end of his career, depending mainly on the other players on the team. (It would be as if Tony LaRussa started playing Albert Pujols at third base. Oh, wait …)
Let’s review:
1954-58. Forced to start his big-league career early because of the bonus rule, Killebrew spent parts of five seasons as a little-used infielder for the Washington Senators.
1959. Having traded Eddie Yost, manager Cookie Lavagetto gave Killebrew the third base job. Harmon responded with a league-leading 42 home runs, and started his first All-Star game.
1960. Harmon remained at third until mid-season, when Lavagetto decided he needed to get Reno Bertoia into the lineup (or Julio Becquer out of it) and shifted Killebrew across the diamond to first base.
1961. With the franchise now in Minnesota, Killebrew spent the first half of the 1961 season splitting time between first and third, until Sam Mele became the skipper in mid-season and kept Killebrew at first. (I am not going to recite lots of offensive statistics, so just go ahead and assume that Killebrew hit 45 home runs and batted .260 with a bunch of walks, since he did that every year.)
1962. Just prior to the start of the 1962 season, the Twins acquired Vic Power, a great defensive first baseman, and moved Killebrew to left field for the first time.
1963. Left field.
1964. Left field. Tony Oliva took over in right field in 1964, and Power was discarded early in the season, creating a perfect opportunity to get Killebrew back to first base. Instead Mele shifted Bob Allison and left Killebrew in the outfield.
1965. Killebrew moved to first base (and Allison to left), but Harmon began shifting to third often by mid-season so that the team could play Don Mincher against right-handed pitchers. In early August Killebrew hurt his arm during a collision (while playing first base), but returned in September and played all seven games—at third—in the World Series.
1966. He played all 162 games, moving between third base, first base, and left field depending on who else Mele wanted to play. The Twins also had Cesar Tovar playing all over the field, leaving Mele about seven million possible defensive alignments. Tovar played this role for several years.
1967. Mincher was traded to the Angels, allowing Killebrew to play a full season at first base (160 games) for the first time in his career.
1968. A full-time first baseman again, Killebrew ruptured his hamstring in the All-Star game stretching for a throw on Houston’s AstroTurf (which was blamed at the time for the injury). When he returned in September Rich Reese had taken over at first, so manager Cal Ermer put Harmon (recovering from a severe injury) back at third base to play out the season.
1969. New manager Billy Martin took one look at the 33-year-old slugger coming off major surgery, and decided to return Killebrew to the 3B-1B role, allowing Martin options at the other corner spot. Harmon started all 162 games (96 at third base, 66 at first), drove in 140 runs, and won the MVP award, while the Twins nabbed the inaugural AL West title.
1970. Martin was replaced as skipper by Bill Rigney, who made Reese more of a full-time player. Killebrew started 129 games at third, but still managed 26 back at first.
1971. Killebrew again played both corner spots, though Reese’s poor season (.219) gave Killebrew several long stretches at first, where he started 82 times.
1972. For the first time since 1958 (when he played just nine games in the field), Killebrew played just one defensive position, first base. He was 36 and had slowed down quite a bit, though he could still rake (138 OPS+).
1973-75. With the advent of the designated hitter, the elderly Killebrew seemed to have a ready-made role. Unfortunately, the Twins also had a hobbled Tony Oliva, who needed the role even more. Killebrew eventually made it to DH, but spent his final three seasons fighting injuries and ineffectiveness.
OK, so the question is: how much defensive value did Harmon Killebrew have? According to bWAR, Killebrew’s cumulative defensive value was -7.6 wins, meaning that his place on the field cost his teams nearly 8 games on defense when compared with a replacement level player. Killebrew was a big guy, not fast, and no one ever accused him of being a good glove man. On the other hand, one wonders whether he could have been better on defense had he been allowed to play one position (preferably first base) for 15 years.
More importantly, did Killebrew’s ability to play multiple positions, often day-to-day, provide additional value to his team? In 1969 Martin played Harmon at third base 2/3 of the time so that Rich Reese could play first base. In an otherwise undistinguished career, Reese hit .322 with 18 home runs (good for a 139 OPS+), Killebrew had his best year, and the Twins led the league in runs. According to bWAR, Harmon’s (mostly) third base play cost the team 1.3 games on defense. This might be true, and Harmon’s isolated value might have been better had he just played first base all season and let Frank Quillici or someone play third. In order to get Reese’s bat in the lineup (or Mincher’s, Power’s, or Bertoia’s), Killebrew was asked to play a position he could not play particularly well.
It seems to me that Killebrew’s “value” to the Twins might have been greater than his statistical record might show.
Another player shifted around the diamond throughout his career was Pete Rose. Unlike Killebrew, Rose did not move day-to-day—he stayed in one place for several years before moving on. Also unlike Killebrew, Rose was an outstanding defensive player for part of his career, before being asked to move again. Rose came up as a second baseman in 1963, then moved to left field (1967), right field (1968), left field (1972), third base (1975), and first base (1979). Let’s examine his move to third base.
Rose won two Gold Gloves in right field, where he had good range though only a fair arm. He was moved to left field in 1972 largely in deference to Cesar Geronimo, a great defensive player with a cannon. In left field, Rose was outstanding. How outstanding? According to the defensive runs metric used on baseball-reference.com, here are the best outfielders in baseball over the years 1972-74, in aggregate.
Pete Rose 52
Paul Blair 52
Cesar Geronimo 34
Bill North 30
Bobby Bonds 26
Other than Rose, these are all center fielders. As a hitter, Rose trailed only Willie Stargell, Cesar Cedeno and Reggie Jackson in batting runs among outfielders, making him every bit as valuable as he was famous.
Nonetheless, in May 1975 Sparky Anderson moved Rose to third base. The effect on the Reds was to replace third baseman John Vukovich, hitting .211 with zero home runs, with left fielder George Foster, who would hit .300 with 23 home runs. Rose continued to hit as well as ever, and the team won 108 games and the World Series.
Over the 1975 and 1976 seasons combined, Rose had the sixth highest total of batting runs in the major leagues, but rather than being worth two wins per season on defense (as he had been in left field) he was now worse than replacement level. Meanwhile, George Foster became a star and the Reds won two championships. Anderson could have moved Foster to third base, but he thought Rose could handle it. Given what happened to the Reds, I am forced to conclude that Anderson knew what he was talking about.
So, what am I saying? I am not saying that there should a new statistic to measure flexibility, nor am I suggesting that the WAR values we have become familiar with are wrong, or should be adjusted. I am saying: assessing “value” is complicated.
Mark Armour is a baseball writer living in Corvallis, Oregon, and the director of SABR’s Baseball Biography Project. His book Joe Cronin: A Life in Baseball was published in 2010 by the University of Nebraska Press. He and Dan Levitt are working on a sequel to their 2003 book Paths to Glory.
| Designated Hitter | April 20, 2011 |
Soundtrack of a Prospect
I snuck out of work a little early to catch the biggest headliner Southern California had to offer this past Friday. No, I’m not talking about The Black Keys or Kings of Leon, two of the biggest acts performing at Coachella, one of the largest and most popular music festivals west of Rosenblatt Stadium. Instead of driving 130 miles east to Indio, I headed 30 miles north to Jackie Robinson Stadium, home to the 23rd-ranked UCLA baseball team and the stage of the country’s top amateur pitching – if not overall – prospect, Gerrit Cole. The Bruin righty was set to toe the rubber against Pac-10 rival and 20th-ranked University of Arizona Wildcats.
I knew the drive from Huntington Beach to Los Angeles would afford me time to listen to some tunes, so I prepared the trip with a “2011 Coachella” playlist, chock-full of the weekend’s performers. What follows is a breakdown of Cole’s performance along with concurrently performing acts from Coachella’s Friday set times.
4:28 PM – Ozomatli, “City of Angels”
But see we’re living in LA
And what you thought was the sun
Was just a flash from the K
Living within walking distance of Long Beach State’s Blair Field, I’ve been lucky enough to watch the collegiate careers of such hurlers like Jered Weaver (Long Beach State), Ian Kennedy (USC), and Ricky Romero (Cal State Fullerton), to name a few. While living in San Diego, I also checked out Friday night starts by Stephen Strasburg (San Diego State) and Brian Matusz (University of San Diego). I was excited to add Cole to the list of college arms I’ve witnessed up close.
Cole, who checks in at 6’4” and 220 pounds, is expected to be one of the first two picks in this June’s draft, improving on his 28th-overall selection by the Yankees in the 2008 draft. With what many consider three - if not four - “plus” pitches, Cole ranks third all-time (321) on the UCLA career strikeout list, trailing only former Bruin Alex Sanchez (328) and teammate Trevor Bauer (354).
I promised my buddy Jason, who I’m meeting for tonight's tilt, that I’d be there early so we could watch some of the pre-game action before the crowd arrives. Jason, being a University of Arizona alum, is just as excited to see sophomore Kurt Heyer pitch as I am to see Cole. Heyer, U of A's Friday night starter for a second-straight season, ranks third in the nation in strikeouts, so a low-scoring affair could be in the cards tonight.
5:46 PM - Ariel Pink's Haunted Graffiti, "Flashback"
Everyone was lurking on the streets
Always searching, always meeting for some action
Getting near the satisfaction
Well, so much for getting to sneak an early peek at Cole. I finally roll into the parking lot of Jackie Robinson Stadium with only a few minutes to spare before the 6:00 PM first pitch. Coincidentally, Friday's game marked the 64th anniversary of Jackie Robinson breaking Major League Baseball's color barrier and a few minutes before game time, this tidbit was brought up by the public address announcer, to which the entire crowd greeted with cheers.
As I made my way to the ticket booth to meet Jason, I feared that the turnout for this game was going to be pretty good, which should be expected for a Friday night game between two ranked teams and a legitimate college star on the mound. I was worried that a seat behind the plate among the scouts was out of the question, but as Jason and I walked up the steps along the first base line to the concourse, we were both pleased to see most had put their general admission tickets to use behind each teams' respective dugouts. We made our way to the third row, where I promptly set-up shop, doing my best "amateur scout scouting amateurs" impression.
Notepad, check. Game notes, check. Team stats from collegesplits.com, check. Stop watch, check. iPhone in camera mode, check. Stalker radar gun, no dice. But the two guns directly in front of me and the one next to me would work just fine.
6:14 PM - Ms. Lauryn Hill, "Everything is Everything"
It seems we lose the game
Before we even start to play
As we watched Cole toss the last of his warm-up pitches to begin the game, Jason turned to me and said "My Wildcats don't have a chance." I nodded in agreement, as Cole's delivery was anything but max-effort. Working from the far leftside of the rubber, his fastballs flew out of his right hand (three-quarter slot) with ease while registering a ho-hum 94 and 95 on the radar gun in front of me. The rest of Cole's body (athletic with a thick lower torso) followed right behind in a repeatable, smooth delivery.
Cole started the game as well as one could, striking out the first two batters looking and swinging, respectively, then getting catcher Jeff Bandy to fly out to shallow left-center.
As Heyer took to the hill and started his sequence of warm-up pitches, I noticed a stark difference between the two pitchers’ motions. Heyer, who’s listed at a generous 6’2” and 200, has a not-so-fluid, dipping motion towards the plate. “Looks like [Roy] Oswalt,” Jason says, and he’s right. Heyer’s velocity doesn’t look overly impressive, so I’m guessing his funky delivery, movement on pitches and ability to spot the ball are the factors leading to his mounting strikeout totals.
Not to be outdone by Cole, Heyer retires the side in order: ground-out, strikeout looking, strikeout looking. “Maybe we do have a chance,” Jason tells me as Heyer hops over the first base chalk line toward the Arizona dugout.
6:26 PM – YACHT, “It’s Coming To Get You”
It’s coming to get you
It’s coming to get you, get you
It’s coming to get you
Cole starts off the top of the second by throwing a 96-mph heater on the outside corner of the plate. There is a buzz around where we are sitting, as the scouts compare radar gun readings and scribble down notes after every pitch. It seems Cole has more guns pointing at him than Mussolini.
Cole breezes through the inning and the heart of the Arizona order, fanning two and getting a third to pop out in foul territory behind first base. Cole’s using his fastball to blow past hitters for strikes and also set them up to look silly when he unleashes his slider and change-up, both arriving at the plate with the same velocity (87 MPH) but with much different action: the slider travels on a more horizontal plane while the change-up seemingly adds weight a few feet from the bat and suddenly disappears from view.
6:58 PM – Afrojack, “Take Over Control”
I want you to take over control
Take over control
Take, take, take, take over control
At this point, Cole’s velocity on his fastball has been consistent and impressive, but not overpowering. He is, however, mixing his pitches well and keeping the hitters off balance, working the ball mostly on the inner and outer parts of the plate. Any mistakes seem to miss high with the fastball and away to right-hand hitters with his off-speed pitches. Cole has thrown quite a few balls out of the strike zone at this point but Arizona hitters haven’t been helping themselves, either fouling off the pitches or swinging and missing altogether. While calling Cole wild this early in the game would be unfair, he’s been effective while missing the plate.
With the game still scoreless in the top of the third inning, a Cole slider catches a little bit too much of the plate and Arizona’s Seth Mejias-Brean pokes a single to centerfield for the game’s first hit. In an all-to-familiar play since the NCAA’s latest imposed aluminum bat standards, Arizona tries to move the runner over by way of bunt, but the batter fouls out after a two-strike attempt. I understand scoring runs against Cole won’t be easy, but Arizona carries the third-best team batting average in the nation and their slugging percentage is good enough to rank 10th. Speedster 2B Bryce Ortega is given the green light to swing the bat and promptly turns on a 0-1 fastball and launches it over the shallow left fielder’s head, and one-hops over the wall for a ground-rule double. Back to the top of the lineup, Joey Rickard weakly grounds out to third base for the second out of the inning, but Mejias-Brean scores on the play. Wildcat 1B Cole Frenzel then golfs a weak liner down the first base line for a double, plating Ortega. Cole gets the ball back and pounds his fist into his glove in frustration. Detractors of Cole, especially when he prepped at Orange Lutheran, would bring up that he was immature or showed signs of frustration that would lead to trouble on the mound. To me, Cole’s reaction to the two runs was merely a sign of his competitive nature that I expected him to channel into a positive focus. Two pitches later and another out via the air (foul-out to 1B) and Cole was out of trouble. Through three innings, Cole has shown good command (no walks and only one three-ball count), five strike outs, only one well-hit ball and is facing a 2-0 deficit. So goes the life of a pitcher, right?
UCLA helps Cole out by scoring three runs in the bottom of the inning due to a string of five hits and one free pass issued by Heyer. Heyer’s fastball hasn’t been missing bats like Cole’s has but his movement is impressive and his fastball has been sitting between 90 and 92-mph.
7:25 PM – Cold War Kids, “Broken Open”
I have been broken open
This was not my master plan
Jason and I spend the third inning chatting with the scouts surrounding us, including two representing the Seattle Mariners (who own the #2 overall selection in this year’s draft and could very well land Cole if Rice University’s Anthony Rendon is taken by the Pittsburgh Pirates with the first pick). Also in attendance are scouts from the Cleveland Indians, Milwaukee Brewers and San Francisco Giants. Sitting two rows behind me with a radar gun and notepad is a gentleman in a University of Vanderbilt visor and windbreaker. Vandy at the time of the game was ranked #1 by Baseball America but after dropping two of three against South Carolina over the weekend, the Commodores currently rank #4. No doubt Vanderbilt is looking towards NCAA Regional play and advance scouting against possible post-season opponents.
The fourth inning was of no interest, unless you are impressed by Cole striking out the side and hitting 98 on the gun twice. One of the Mariner scouts asks the non-uniformed Arizona Wildcat player in front of us who is charting the game if he thinks Cole will touch 100 mph and the teen nods yes and the scout concurs. Unfortunately, Cole wouldn’t hit triple-digits during the game, but it should be noted that he maintained 98-mph velocity in the 7th inning and 96-mph with his 123rd and final pitch of the game.
In the fifth, Mejias-Brean flies out – with only one game to draw conclusions from, it seems to me that Cole will be a fly-ball pitcher as a professional - then Arizona puts together back-to-back singles to bring up Rickard, who promptly deposits a 1-1 fastball over the leftfield fence for a three-run homer. Cole hangs his head for just a second before getting a new ball from the umpire but one can’t fault him on it…had Rickard been using a wood bat, it most likely would have been shattered into pieces but with an aluminum bat, he was able to turn on the ball and fist it 335 feet. The five runs would be all Arizona needed to tag Cole with the loss.
7:42 PM – Interpol, “All of the Ways”
Tell me you're fine
Tell me it's hard to fake it time after time
Who is this guy
Three batters into the sixth and I was convinced that this was going to be Cole’s last inning. A one-out error by his shortstop caused Cole to drop his head and slump his shoulders while he tried to collect himself on the mound. Arizona followed up with yet another weakly hit single, leaving runners at the corners.
During the earlier part of the game, Cole’s delivery to the plate out of the stretch was a consistent 1.28 seconds but now, at barely 80 pitches, Cole was up to 1.31 and 1.32 seconds to home. His slider was becoming flat and he was increasingly missing his spots. It seemed fatigue (or disappointment) had started to set-in. Then, Arizona decided to lay down a bunt to bring the runner at third home. The bunt rolled toward the left side of the mound and Cole pounced on it and with his momentum taking him towards the plate, he quickly flipped the ball to his catcher, who applied the tag just before the Arizona runner slid into home. “Out!” shouted the umpire and even over the roars of the home crowd, Jason and I could hear Cole grunt “Yeah!” and give his best Tiger Woods upper-cut fist pump.
As quickly as it had disappeared earlier in the inning, energy/adrenalin/confidence returned to Cole and he fanned the next Wildcat batter, the last pitch being a hard changeup that dove away from the batter. As Cole sprinted into the dugout, the scouts talked among themselves about Cole’s recovery during the inning.
7:58 PM – Sleigh Bells, “Rill Rill”
So this is it then?
You’re here to win, friend
One scout returns to his seat after taking a break during the bottom-half of the sixth inning. Instead of holding a radar gun while we watch Cole take the mound in the seventh inning, the grizzled talent evaluator turns his attention to the steaming cup of chili he bought at the snack bar. The smell of the cheese and onions teases my empty stomach so I lean over to the scout and ask, “How would you rate the chili? It smells like a 70.” Without missing a beat, the scout plays along. “Usually it’s an 80 but the weather tonight is too warm, so it’s only a 60.”
Cole’s game is back on track, as he retires the side in order, including a three-pitch strikeout of Frenzel, capped off by a 87-mph back-door slider on the outside corner to freeze Arizona’s #2 hitter.
8:19 PM – Brandon Flowers, “Playing With Fire”
They seem to be leaning
In the wrong direction
First impressions of Cole when I saw him warming up in the bullpen before the game was that this is a big kid with girth in all the right places for a power pitcher: butt, quads and calves. After seeing him repeat his delivery pitch-after-pitch and field his position well, I was fully convinced of Cole’s athleticism. What I saw next left me (and Jason and the scouts and the fans and, most importantly, Robert Refsnyder) off-guard.
With one out in the top of the 8th, Refsnyder laced a single to right field. Throughout the game, Cole kept runners in check with casual tosses to first and flashed a double-move a few times when he was facing runners at the corners. After a few throws that caused Refsnyder to slide headfirst back to the bag, Cole showed a set of quick feet, firing a shin-high bullet to the bag, catching Refsnyder leaning and erasing the runner from the base paths. Cole gave another first pump as the ball was returned. One pitch later - a 96-mph four-seamer resulting in an infield pop-up – and Cole’s night was over.
9:23 PM – Cut Copy, “Hearts on Fire”
There’s something in the air tonight
A feeling that you have that could change your life
During the drive home, I didn’t listen to any music. I replayed most of the night in my head, trying to figure out the negatives I’d need to bring up when breaking down Cole’s performance. As I parked my car, I checked the UCLA website for the night’s boxscore to compare with my game charts. The final stats, along with my scribbled down notes, left me with barely, if any, red flags or weaknesses to assign the UCLA pitcher.
Cole’s final line: 8 innings, 123 pitches, 9 hits, 5 runs (all earned), 0 walks, 11 strikeouts. Of the 33 batters faced, Cole threw 22 first-pitch strikes. He gave up a hard-hit, ground-rule double, a college-bat home run and that was about it. His velocity and movement confirmed what all the scouting reports had said. Physically, Cole looked the part of a top-notch prospect. Sure, it wasn’t his best outing of his young career and it wasn’t a game I’ll tell my grandchildren about ... the chili, on the other hand … but he flashed enough brilliance to show why many expect him to become the top pitching prospect the minute he signs with his new Major League team.
So there you have it, the soundtrack of a prospect. Cole is clearly no one-hit wonder and, based on the hype and performance I witnessed, he’ll be music to a team’s ear come June.
| Designated Hitter | March 01, 2011 |
Roberto Clemente's Autograph
I am not now, nor have I ever been, a collector of autographs, baseballs, baseball cards, etc. As a kid in the '50s, I'd buy baseball cards to look at, memorize the stats on the back and to flip them (heads or tails, against the wall, anything we could think of). The following spring, I'd throw out last year's cards and start again. The most fun about getting autographs was you got to be next to the player to ask for it. That was thrill enough for me. It never crossed my mind that people in the future would make money from collectibles.
I was a Pirate fan living in New York City during the '60s. There weren't many of us. Roberto Clemente was my guy. In the same way that Mickey Mantle or Willie Mays or Sandy Koufax were your guys if you were a Yankee, Giant or Dodger fan. I loved him, wanted to play like him and tried to emulate him on the field. And I wanted his autograph. I can tell you literally dozens of great Clemente stories that I was around for during this era. Here's one of my favorites.
Getting Clemente's autograph was not the easiest thing in the world. He went through his baseball life with a chip on his shoulder. Not that he wasn't justified. With the exception of Jackie Robinson, I doubt any ballplayer was treated as badly by the press as Clemente was and he took every slight personally. He was black, Latino and spoke not one word of English when he came here in 1954 at the age of 19. Sportswriters, perhaps just not used to dealing with Latino players, would quote him phonetically, which made him look bad. "I theenk I have goood seeson." Learning to speak English was not easy for him.
You had to ask for his autograph when he was in a good frame of mind. Me and my buds would go down to the hotels where the teams were staying when they were in town to play the Yankees or Mets. Most teams stayed at the Hotel Roosevelt, the Pirates at the Hotel Commodore. We'd get there on Saturday mornings just before the bus would take them to the Bronx or to Shea and ask for their autographs in the lobby. Most would sign, some wouldn't.
I first got Clemente's autograph on August 18, 1964, which I knew was his 30th birthday. I was rowing boats six days a week all summer as a dock boy at Brooklyn Day Camp. I called in sick that day and went to Shea for an afternoon Pirate/Met game. Back then, I used to write to the Pirates for glossy photos of the players and they'd always oblige. So I had a few pages of Forbes Field stationery with me.
After the game, I waited outside the clubhouse for the Pirates to board their bus. Clemente comes out and a bunch of kids swarm around him. "Can I have your autograph, Roberto?" For whatever reason, he wasn't signing that day. Frank Oceak, the Pirates 3rd base coach, sees me holding my pen and paper and tells me, "Talk to him in Spanish and he'll sign for you." The proverbial light bulb goes on over my head! I took three years of torturous Spanish classes with Mr. Capitano in Junior High School!! "Roberto, Feliz Cumpleanos," I say. He puts down his suitcases, smiles and signs his name on my Forbes Field paper. I kept telling myself that Roberto Clemente likes me. A great moment.
Many decades later, the autograph on that paper is worth quite a bit. Supply and demand. Clemente didn't sign that many and died at age 38. Pete Rose has made his living by signing his name for the past 22 years. I took my Clemente autograph to a card show one time and showed it to a dealer, who immediately offered me $500 for it. Which told me it was worth much more than that. It is not for sale.
For the past 30 years, David Bromberg has lived in Northeast Pennsylvania, former home of the Scranton/Wilkes Barre Red Barons (Phils Triple A team) and current home of the S/WB Yankees Triple A team. He was dubbed "the most inveterate baseball fan in northeast Pa. by Ron Allen, who hosted the local nightly sports radio call-in show there.
| Designated Hitter | February 13, 2011 |
Remembering Woodie Fryman and the 1966 Pirates
Woodie Fryman died last week at the age of 70. He was as average a pitcher as you can be. 141-155 during an 18 year career. He used a double-pump windup, which you didn't see very much of anymore when he broke into the majors in 1966. He was 12-9 that year with a 3.81 ERA — not bad for a rookie. Until you consider that Forbes Field was a huge pitcher's park, this was during the enormous strike zone era, and he pitched three consecutive shutouts in a two-week stretch. The rest of his season was absolutely average. The one thing that stands out is that he threw four one-hitters. I was at the first of them.
I was a rabid Pirate fan living just a few miles from Shea Stadium. July, 1966 and Fryman is pitching a Friday night game at Shea. One aside. The 1966 Pirates will forever be my favorite team. Matty Alou won the batting title, Willie Stargell had his first big power year, and shortstop Gene Alley and second baseman Bill Mazeroski helped set the all-time record for double plays in a season. And then there was Roberto Clemente. He won the National League Most Valuable Player award that year. If your only memory of Roberto is the 1971 World Series, picture him dominating games like that for an entire season. He was something to see. The Pirates were thrilling to watch and I almost never missed a game when they came to town.
Pittsburgh led the NL for most of that season, eventually finishing third to the Dodgers and Giants, three games out of first place. Whenever they team played in San Francisco or Los Angeles, I'd stay up very late listening to the games, trying to get Bob Prince coming in above the static calling the games on WWVA radio, out of Wheeling, West Virginia. The crime of that season was the Dodgers had Sandy Koufax and Don Drysdale, the Giants had Juan Marichal and Gaylord Perry, and we had only Bob Veale and Al McBean!! You call that fair???
Back to Fryman's gem. Ron Hunt leads off the game for the Mets. Chops a ball over Woodie's head. Gene Alley, at short, charges it and tries to one-hand it and throw to first, but the truth is not even Ozzie Smith or Omar Vizquel could've made that play. Infield single. Hunt gets thrown out trying to steal second base and then 26 up and 26 down. A one-hit shutout. Faced only 27 batters. No incredible fielding plays, just 26 up and 26 down. Easily the best pitched game I've ever seen in person. Stargell hit two home runs and the Pirates won 12-0.
After the game, Pirates manager Harry Walker insisted on speaking to Dick Young of the Daily News, the official scorer that night. These were two rather hot-headed guys. Walker wanted Young to change the infield hit to an error, so at least Fryman could have his no-hitter. The whole thing escalates, pushing, shoving and cursing. Walker was suspended for one game and Young wrote articles for days afterward about what a jerk Harry Walker was.
By the time the Pirates became an NL power (five NL East titles between (1970-75), Woodie Fryman was long gone. But I'll never forget that night 45 years ago.
David Bromberg has been going to baseball games since 1955. He was at Yankee Stadium two days before Don Larsen's perfect game in 1956 and at Shea Stadium two days before Jim Bunning's perfect game in 1964. He's never attended a no-hit game.
| Designated Hitter | August 17, 2010 |
The WAR Against Age – The Pitchers
In my last article, I examined at what ages the forty greatest hitters* of all time, as measured by Wins Above Replacement (“WAR”), had their five best seasons to learn about aging patterns and how certain individual players fared. Here, I take a look at forty top pitchers and their best seasons. Because pitcher usage has changed dramatically over time, I eliminated all pitchers who played the bulk of their careers before World War II.
I don’t think that Walter Johnson’s typical workload of 350+ innings in his best seasons or Cy Young’s 400+ innings in his best seasons is particularly enlightening for purposes of today’s game because modern players are unlikely ever to pitch like that again. That is to say nothing of Old Hoss Radbourne’s 19.8 WAR season in 1884, in which he pitched 678 innings and went 59-12. (Considering his ERA-plus was 207 that year, and he pitched about 2/3 of his team’s innings, I think his WAR (he had 20.3 when you factor in hitting), although the highest single season number of all time, seems a bit low). In any event, after taking out the old-time pitchers, the top-40 post-World War II pitchers takes you down to number 67 of all time, Dave Stieb.
I plotted on the bar graph below the top 5 pitching seasons measured by WAR (I did not factor in WAR for hitting) for the 40 top-rated post-war pitchers (200 data points in all). For comparison sake, I have also included the chart for hitters from my last article, adjusted so that the pitchers and hitters are set out in the same scale.
Top 40 WAR (Post-World War II) Pitchers:
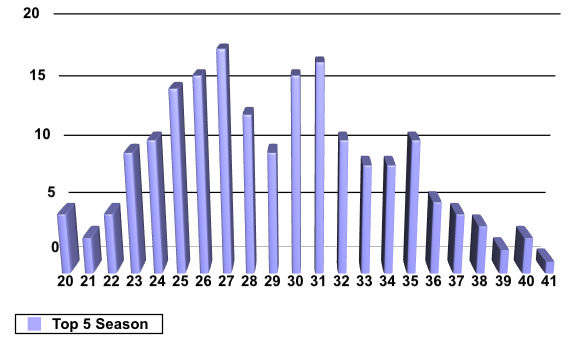
Top 40 WAR Hitters:
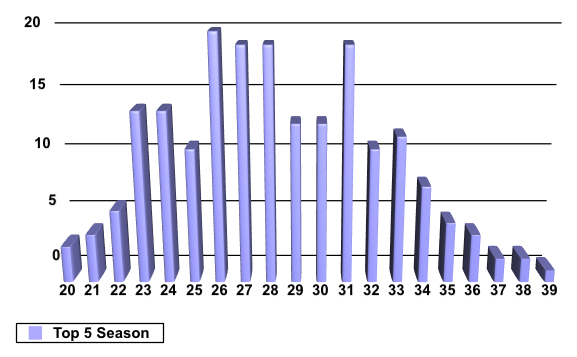
The Pitchers vs. the Hitters
The first thing that jumps out from looking at these graphs is that pitchers seem to spread out their peak seasons far more than hitters. Although great hitters and pitchers start putting up peak seasons at age 20, the pitchers are far more likely to have a peak performance late in their careers. Just three hitters had one of their best seasons at age 38 or later (one was Barry Bonds at 39, one was Ted Williams who had his fifth best season and one was Cap Anson), and none at age 40, whereas the pitchers had 10 such seasons starting at 38 (5% of the sample) and four at 40 or 41, by which time all great hitters had tailed off. Similarly, the peak for pitchers is far less prominent than for hitters. For the hitters, 103 of the best seasons, more than half the sample, were between ages 26 and 31. For the pitchers, by contrast, at the same ages (which is also the six year span with the highest number of peak years) there are just 88 of the 200 seasons recorded. The median age for a pitcher’s top season was 29, a year later than for the hitters. Another interesting observation is that aggregately both the hitters (at 29 and 30) and pitchers (at 28 and 29) showed a decrease in peak years before spiking again. In my last article, I had chalked up this anomaly as merely a sample size issue, but now I wonder if there is something more at play. Perhaps players need an adjustment period to cope with diminishing physical skills.
The Individual Performances
One of the things that makes an exercise like this interesting is to look at the individuals who make up the sample and examine some of their performances. On the old side, it is not shocking that Phil Niekro and Ryan put up great age 40 seasons. John Smoltz, had the other age 40 season on the chart, which I found surprising. Warren Spahn’s age 41 season ends the chart. (Incidentally, at a baseball card show when I was 13, Spahn taught me how to throw a knuckleball. He claimed he threw one once in his career, popping up Ted Kluszewski. He also recounted how kids at Ebbets field threw sandwiches at the visiting pitchers in the bullpen, and he and his teammates would collect them and, occasionally, eat them).
Smoltz, for his part, was the pitcher with the biggest range among his top 5 seasons, producing them from ages 24 to 40. Other pitchers with a greater than ten year span for their best five seasons include Roger Clemens (23-34), Spahn (26-41), Bert Blyleven (20-33), Nolan Ryan (26-40), Steve Carlton (24-37), Mike Mussina (23-34), Rick Reuschel (24-36) (one of the most surprising things I saw was that Reuschel has the 30th highest WAR for pitchers all time, ensconced between Tom Glavine and Bob Feller, two no-doubt Hall of Famers (or future Hall of Famers)), Jim Bunning (25-35), Tommy John (25-36), Jerry Koosman (25-36), David Cone (25-36), Chuck Finley (26-37) and Frank Tanana (20-30).
On the young side of the spectrum, the eight age 20-21 seasons on the chart belong to six pitchers, Blyleven, Feller, Don Drysdale, Dennis Eckersley, Tanana and Bret Saberhagen. Blyleven, 13th all time in pitchers’ WAR (making it very hard to deny his Hall of Fame credentials, but Rich speaks far more eloquently on that subject than I do), turned in four of his top-5 season at 20, 22, 23 and 24 (with his fourth best season at 33). Perhaps his underwhelming won-lost records for those early years (16-15, 20-17, 17-17, 15-10, respectively), coupled with a long career thereafter of being very good has caused him to be underrated in the popular (sportswriters’?)
consciousness.
Feller, another young peak performer, suffers no such lack of recognition among baseball’s cognoscenti, and for good reason. Rapid Robert’s best five seasons were at 20, 21, 22, 27 and 28. Of course, he missed all of his age 23-25 seasons, and most of his age 26 season, to World War II, creating an equally compelling “what might have been” discussion as the one for Ted Williams. Another “what might have been” could easily be created for Frank Tanana, who put up four of his top 5 seasons between 20 and 23, including three 7+ WAR seasons from 21-23. To put that in perspective, among the last ten Cy Young award winners (Lincecum twice, Peavy, Webb, Carpenter, Grienke, Lee, Santana, Sabathia, and Colon) they have just four 7+ WAR seasons aggregately in their careers (Grienke, Lee and Santana twice). Had Tanana not blown out his arm, he may have been among the all time greats. That he was able to reinvent himself into an effective junk-baller is a credit to him.
On the other end of the spectrum, late peaking pitchers include knuckleballer Phil Niekro (his top five were between age 35 and 40), fireballer Randy Johnson (31, 33, 35, 37 and 38), spitballer Gaylord Perry (between 30 and 35) and sinker baller Kevin Brown (31-35). Smoltz had three of his best seasons at 38-40, but his other two top seasons were at 24 and 29.
Brown was also one of the models of consistency with a definitive peak, putting up his best five seasons in a row. Robin Roberts (23-27) was also on that list. Greg Maddux (26-31), Sandy Koufax (25-30) and Hal Newhouser (23-28) each put up their best six seasons in a row.
Conclusion
When viewed aggregately, pitchers, like hitters, apparently age in predictable ways, with peak years likely to take place between 26 and 31. On deeper inspection, however, it is clear that pitchers are less predictable. A 37 or 38 year old pitcher, or even older, has a reasonable possibility of turning in a personal peak year, whereas a hitter is not likely to do so. Indeed, each of the five oldest peak years for hitters have extenuating circumstances (Bonds (37 and 39) because of presumed steroid use, Williams (38) because service in World War II almost certainly cost him a top season when he was younger, and Cap Anson (37 and 38) because he played in the equivalent of baseball’s pre-historic times, where talent was almost certainly not as uniformly recognized and spread out among the leagues. If those players’ late career seasons are discounted, no top hitter would have had a peak season after 36. By contrast, the top 40 post-war pitchers put up 15 (7.5%) of their top seasons at 37 or older. Nor is it clear that a single type of pitcher is destined for late-career success, as pitchers such as Phil Niekro, Spahn, Randy Johnson, Carlton, Ryan, Smoltz, Koosman, Cone, John, Finley and Reuschel each put up one of their best five seasons at 36 or older.
If anything, the late success of pitchers seems to show what baseball fans already understand, that pitching effectiveness is not the result of merely being able to throw hard (no doubt each of these pitchers could throw harder when they were younger). Rather, factors such as an improved or learned pitch, better control, or even better discipline and thought processes on the mound no doubt contributed to many pitchers’ late career resurgences. Another conclusion that should be apparent is that next year’s prized free agent, Cliff Lee, who will be entering his age 32 season, is not nearly as assured of regressing from his incredible current peak as a 32 year-old hitter would be. No doubt, many GM’s are willing to bet that he can produce excellent seasons in his mid-30’s, just as some
great pitchers have done before.
* Note that I intentionally omitted Albert Pujols from that analysis, as it is by no means clear that he may not still have one of his five best seasons in the remainder of his career. In posting that article, the footnote on that subject apparently became embedded.
Doug Baumstein is an attorney and Mets fan living in New York.
| Designated Hitter | July 30, 2010 |
The WAR Against Age
In this article I examine at what ages baseball’s very best hitters had their best seasons as measured by wins above replacement (“WAR”). I looked at the top 40 position players in career WAR and plotted their top 5 seasons against their age during that season. Thus, with 200 data points in all, I created the below chart plotting a player’s personal top 5 season against his age. 
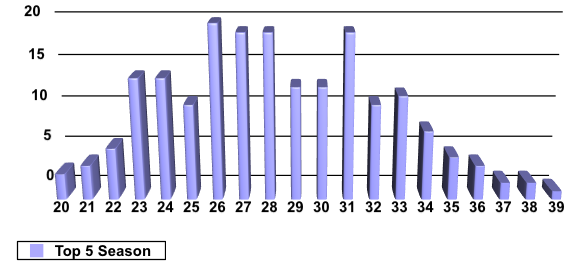
Obviously, looking just at the numbers is not that enlightening, so I also noted some of the more interesting results as they pertain to individual players. For example, the three 20-year old seasons that were among the personal top 5’s of the players on the list belonged to Mel Ott, Al Kaline, and Alex Rodriguez. I, for one, would not have guessed that one of A-Rod’s best seasons was his first complete season. The four 21-year old seasons that make the list belong to Rickey Henderson, Eddie Matthews, Jimmie Foxx and Ken Griffey Jr.
On the other end of the spectrum, the 39 year-old season belongs to Barry Bonds, who likely found his fountain of youth in a syringe. The two age 38 seasons on the list almost certainly had nothing to do with chemical enhancement, as they belong to Cap Anson and Ted Williams. Anson, as it turns out, was not only a great old-time player (even if less than a great human being), but was one of the greatest old players, turning in his best five seasons at 29, 34, 36, 37 and 38. Williams, for his part, of the top 40 hitters, had the biggest age gap among his top 5 seasons, turning in one at 38 and one at 23. That, however, is likely more a function of geopolitics than playing ability, as Williams turned in an 11.0 and 11.3 WAR season at the age of 23 and 22 in 1942 and 1941 and an 11.8 and 10.3 WAR season during his age 27 and 28 seasons in 1946 and 1947. Although, had he played and not fought in World War II there is no guarantee he would have exceeded the 9.9 WAR season he had at 38 years-old (10 WAR seasons are few and far between), had he had one such season during the three years between 1943 and 1945, the 15 year difference among his top 5 seasons would not have existed. Other top players who turned in at least two of their top 5 seasons more than ten years apart include Barry Bonds (age 28 to 39), Tris Speaker (24-35), Al Kaline (20-32), Carl Yastrzemski (23-33), Joe DiMaggio (22-33), Rickey Henderson (21-31), A-Rod (20-31), Eddie Matthews (21-31) and Chipper Jones (24-36).
A number of players put together their 5 best seasons in a row, showing a true peak and incredible consistency. Those players include Hank Aaron (25-29) (I always thought of him as someone who had his best years late, but he actually peaked on the young side), Honus Wagner (31-35) (a renowned older superstar), Joe Morgan (28-32), Wade Boggs (27-31) (I would not have guessed that he was a top 40 WAR hitter, and he was actually number 27, ahead of George Brett (number 30) who I consider the better player), Charlie Gehringer (30-34) and Rod Carew (27-31). A few others put up their best 5 seasons in a six year span, including Roger Connor (27-32), Roberto Clemente (31-36) and Jeff Bagwell (26-31). I find Clemente’s late surge especially interesting. I have always believed that, to the casual fan, Clemente was one of the most overrated players ever. He died after his age 37 season, shortly after the most productive stretch of his career, possibly increasing the halo effect surrounding his untimely and tragic death, and potentially creating a stronger impression of his playing abilities than might otherwise have been deserved had he gone through a typical decline phase.
I also looked at some players outside of the top 40 to see if there were any interesting patterns. Craig Biggio showed a consistent peak, turning in his top 6 WAR years from 28-33. Jim Edmonds showed a late peak, turning in his top five years from 31-35. Paul Molitor’s top five seasons also showed a late peak at the ages of 34, 35 and 36, although his age 25 and 30 seasons also constitute his top 5.
Conclusion
When I started this exercise (and I did look at a lot more stars from the so-called steroid era, even if they were not in the top 40), I expected to see that modern stars, as a result of advances in training, exercise, medicine and performance enhancing drugs would turn in the best “old” seasons. Other than Barry Bonds’ anomalous age 39 season, the evidence seemed to point the other way, as players such as Honus Wagner, Cap Anson and Roberto Clemente all showed later peaks than typical current-day star players. Also, I was surprised that 7 (or roughly one in six) of the superstars who I looked at turned in one of their top 5 seasons at age 20 or 21. While it is not surprising that superstars break in early, it is surprising that many had among their best seasons before they legally could buy a beer in today’s world (although Jimmy Foxx didn’t seem to have a problem in procuring a beer in his time).
I also performed a quick review of post-World War II pitchers. Although I did not find anything all that surprising, pitchers seemed to show a far greater dispersal in value at different ages. Time permitting, I will take a look at that data and prepare a similar study, and see if pitchers age differently than hitters or whether their peak seasons generally occur during their late 20’s.
Doug Baumstein is an attorney and Mets fan living in New York.
| Designated Hitter | June 01, 2010 |
A Lifetime on the Road
One of the great insights of the sabermetric revolution is the recognition that when evaluating a player, context counts. Ballparks, scoring environments, teammates, leagues and a host of other factors often give the illusion of success (or failure) to a ballplayer’s career. In this article, I take a look at some players through the prism of their road statistics to try to tease out differences in performance and ability that may cause you to think differently about certain stars of the last 50 years.
Intuitively, we recognize that hitters who play in great environments like Coors are benefitted and that players in cavernous stadiums are generally hurt. I am not sure, however, that we ever truly appreciate that some players, as a result of hitting style, luck or other reasons, are inordinately benefitted or hindered by their home ballpark.
By looking at just a player’s career road statistics, I try to separate out the effect of a player’s home ballpark and come to some interesting observations when certain hitters are compared “all else being equal.” The theory is simple, by examining a player’s away statistics, we get to view a player’s production playing at what is close to a league-average neutral park because all the park’s except the player’s home stadium are counted. The methodology is also equally simple, for purposes of this article, I will lay out a player’s slash statistics (avg./obp./slg.) and double his home runs, hits, RBIs and runs accumulated on the road so that the totals replicate traditional career numbers. Obviously, players play very similar amounts of games on the road and at home, so doubling does not reflect differences in opportunity and, by focusing on career statistics, sample size problems are easily avoided. Also, the players I compare here (usually with a player A and player B format) were contemporaries, so they may be playing in the same ballparks at the same time (although league differences may skew the results a bit). Nevertheless, the “road career” I have created here often differs markedly from the numbers we associate with a lot of the great players discussed.
From looking at a lot of home and road splits, I made a number of observations I will pass on. For a host of reasons, some of which we can guess about, over the course of their career, players generally perform better at home than on the road. Additionally, players probably deserve some credit for learning to take advantage of their home ballparks (or were recognized by talent evaluators for having skills that would translate well to a particular ballpark), so taking away their home stats probably over-penalizes a player a bit. Finally, it is clear that two venerable ballparks, Fenway and Wrigley, result in giant advantages for certain hitters. So I suspect that a number of Red Sox and Cubs fans will have particular views about this article. All the players discussed below had complete careers after the retro sheet era, so there are not gaps in their numbers. Without further ado, here are some comparisons for discussion:
Example 1 – The Hall Of Very Good
For my first example, I am comparing two players whose careers largely overlapped in the National League. Both were multiple gold glove fielders playing the same position in the middle of the defensive spectrum. Both played in lower run scoring environments than today. Both are in the Hall of Merit, but only one is a cause celebre as an unjust Hall of Fame snub.
Player A won 5 gold gloves, was an eleven time all star and won one MVP. He performed better at home and his slash line away is .277/.340/.443. If he spent his career on the road, he would have accumulated 2066 hits, 268 homers, 996 RBIs and 1056 runs.
Player B also won 5 gold gloves (starting right after the run of Player A) and was a nine time all star. His highest MVP performance was fourth. He too performed better at home, and his slash line away is .257/.342./406. His “career on the road” yields 2092 hits, 256 homers, 1176 RBIs and 958 runs.
Both players are pretty even, but seeing the above, I would take Player A. If you haven’t guessed, Player A is Ken Boyer, Player B is Ron Santo. Santo mashed at Wrigley over his career (.296/.383/.522), but was just ordinary on the road. Take away the Wrigley advantage, and these guys were about as even as they come in playing ability. (The comparison above is not entirely fair, because, even though their careers overlapped, Santo peaked in the ultra-low scoring environment of the late 60’s, by which team Boyer’s career was basically over.) Nevertheless, the numbers cause me to question whether Santo really is as deserving for the Hall of Fame as many now believe (and frankly, I did before looking at his splits).
Example 2: The Best Right Handed Hitter of the Steroids Era?
The next four players were all born within a few months of each other in 1968 (two share a birthday, which already will alert some trivia buffs). These right handed sluggers debuted between 1988 and 1992. Who was the best?
Player A has a .297/.414/.511 slash line on the road. His career on the road yields 2444 hits, 418 dingers, 1630 RBIs and 1368 runs. He is a 5 time all star and two time MVP. With the glove, he is best remembered as a hitter.
Player B has a .288/.384./.501 slash line on the road, and would have had 2704 hits, 1594 runs, 494 homers, and 1670 RBIs had his entire career been played on the road. He was a nine time all star and his best showing for MVP was second. Although not a good fielder, he was versatile, having played all over the diamond during his career. He is also generally regarded as one of the surlier stars of the past twenty years.
Player C has a .291/.398/.521 away slash line, with 2306 hits, 1422 runs, 430 home runs, and an even 1500 RBIs. He was a four time all star, one time MVP and garnered one gold glove (and was generally regarded as a good fielder).
Player D has a .320/.388/.572 slash line. This road warrior’s away career would have garnered 2328 hits, 1094 runs, 464 homers and 1414 RBIs. He was a twelve time all star and his best showing for MVP was a couple of second places. Oh, did I mention he was a catcher?
If you haven’t guessed, the above are, in order, Frank Thomas, Gary Sheffield, Jeff Bagwell and Mike Piazza. Piazza’s power and overall hitting on the road is astounding, as he gets an additional 20 to 30 points in average over the other greats here and sports a slugging percentage fully 50, 60 and 70 points better than Bagwell, Thomas and Sheffield, respectively. Piazza had the unlucky circumstance of having played most of his career in Chavez Ravine and Shea, two parks that are tough on right handed power hitters. Even his short stopovers in Oakland, San Diego, and a week of games for the Marlins were all played in pitchers’ parks. He is one of the small percentage of players whose road numbers are better than his home numbers (.294/.364/.515). He averaged 38 homers per 162 games on the road. A good argument can be made that Piazza was the best right-handed hitter of this bunch. I don’t know that many would have argued that before seeing the numbers. Rather, I imagine most people would think Frank Thomas was the best hitter of this group. Thomas, for his part, had 100 more home runs at home than on the road, showing he may have benefitted inordinately from favorable home parks well suited for his hitting. His career home numbers, primarily at Comiskey, are a phenomenal .305/.424/.599.
As a side note, Manny Ramirez, who is four years younger than this group, has even more impressive away numbers (as well as a much closer association with the “steroids era” than Thomas, Bagwell and Piazza). At the time of this writing, his road slash numbers are .313/.408/.582, even better than Piazza’s, and he has produced comparable line, .313/.414/.596, at home.
Example 3: a Trio of 3000-Hit Slap Hitters
When I think of great career hitters for average, three names that jump to mind are Tony Gwynn, Wade Boggs and Rod Carew. Among the three, they all finished with between 3010 and 3143 hits, all hit between .328 and .338, with on base percentages between .388 and .415 while slugging between .429 and .459. Below are three slash lines, and the number of hits they would have if they played all their games on the road.
Player A: 3088 hits, .323/.385/.425
Player B: 3172 hits, .334/.384/.451
Player C: 2774 hits, .302/.387/.395
In order, that is Carew, Gwynn, and Boggs. Carew and Gwynn, on the road, hit like Rod Carew and Tony Gwynn. Wade Boggs hits like Al Oliver (career 2743 hits, .303/.344/.451).
Boggs is not the only 3000 hit-club member who received a big boost from Fenway. One of the most notable “road careers” is that of Carl Yastrzemski, who put up a career .264/.357/.422 on the road, with what would have been 3194 hits, 430 homers, 1644 runs and 1562 RBIs. Not a lot of .264 hitters get to 3000 hits, so it is hard to believe that Yaz could have gotten there without the benefit of a home park that suited him well and helped keep him in the lineup for 23 years. His career line at home is an impressive .306/.402/.503.
Example 4: Let Wrigley Double Your Pleasure
Now let’s take a look at three Cub icons, Ryne Sandberg, Billy Williams and Mr. Cub himself, Ernie Banks. I have compared the first two to long-time Tigers Lou Whitaker and Al Kaline (the number one and three most comparable players to each, respectively, according to Baseball Reference) and Banks to his top comparable, Eddie Mathews. Only one of the long-time Cubs’ road numbers hold up, can you guess who?
So here are the second sackers:
Player A: With a .269/.326/.412 line, this second baseman’s road career yields 2256 hits, 1184 runs, 908 RBI and 236 homers.
Player B: With a .274/.357/.406 line, this second baseman would have tallied 2394 hits, 1310 runs, 1070 RBIs and 196 homers with a career entirely on the road.
And the outfielders:
Player A: With a .278/.349/.459 line, this outfielder’s life on the road would garner 362 homers, 2596 hits, 1363 RBIs and 1298 runs.
Player B: With a .292/.369/.458 line, this outfielder would clout 346 homers, with 1510 RBIs, 1568 runs, and 2998 hits if his career took place solely on the road. I am pretty sure he would not have found a way to get a couple more hits.
And the slugging infielders:
Player A: His .259/.311/.462 on the road would result in 444 homers, 2424 hits, 1454 RBIs, 1168 runs and an inordinate number of outs.
Player B: His .277/.382/.529 line would result in 548 homers, 2468 hits, 1574 RBIs, 1624 runs and likely consideration as a member of the inner circle of Hall of Famers.
In all the examples above, the Cub is always Player A. Take Ryne Sandberg out of Wrigley, and he doesn’t look like a Hall of Famer, even for a second baseman. Of course, his .300/.361/.491 career line at Wrigley counts toward his bottom line, so he skated in to Cooperstown. In this exercise, however, Whitaker’s career looks more impressive than Sandberg’s when you factor in the longer effectiveness as well as the additional 30 points in on base percentage. That Whitaker couldn’t even manage to stay on the Hall of Fame ballot is a travesty.
Williams holds up remarkably well (and better than I would have thought), considering he wasn’t quite the hitter Kaline was when factoring in home numbers. Williams’ home slash stats of .302/.374/.525 are still much better than his road numbers, however.
The Mathews/Banks comparison is especially revealing, as Banks and Mathews played in the same league at the same time. Mathews simply laps Banks. Mathews was better on the road than at home (.264/370/.488) over the course of his career. Hank Aaron, Mathews’ right-handed power-hitting teammate, produced virtually identical numbers home and away, so it is not self-evident that the Braves’ ballparks were a burden on right-handed power hitters. (Willie Mays, like Aaron, also produced virtually identical numbers at home and on the road, refuting the oft-repeated, and oft-debunked, myth that his power numbers were sapped by unfortunate home venues.) Banks was a different, and better, hitter at home, where he had a career line of .290/.348/.537, a more than .110 point difference in OPS. Considering he played fewer than half his games at shortstop, had Banks spent his “career on the road,” so to speak, it is not clear he would have been a Hall of Famer, and certainly would not have been thought of as an elite member of the Hall, as he generally is now.
Conclusion
I suspect a lot of people will argue that this methodology is unnecessary because OPS plus factors in home ball parks or that a player should receive full credit for taking advantage of his environment. I think, however, that looking at only road statistics serves as a great equalizer in assessing such questions as, “who was better?” When we ask that question, we generally don’t mean to look merely at accumulated statistics without context, but to examine the question in light of a platonic ideal of a great hitter. A great hitter is a great hitter at home, on the road or in the middle of a cornfield. Hits, and especially home runs, are often the result of hitting a ball well in a stadium that rewards it, and not all players end up in parks that reward their skills. Simply, ballparks do not behave equally or match a hitter’s strengths equally. By looking at the amalgamated statistics of a player on the road, I believe we gain better insight into a player’s performance by eliminating the home field advantages or disadvantages that a player faces in half his at bats.
Finally, for some parting thoughts, here are some other observations I made. For example, I always considered Kirby Puckett and Don Mattingly interesting comparables in terms of Hall of Fame debates. Puckett hit just .291/.330/.431 on the road compared to .302/.353/.450 for Mattingly. In my mind, neither cuts it as a Hall of Famer based on their short careers. If I ever thought there was an offensive difference between Dave Winfield (.289/.356/.485) and Eddie Murray (.286/.356/.482) I certainly can’t believe there is one now. I find it hard to make a strong case for Jim Rice as a Hall of Famer based on his weak road stats (.277/.330/.459), especially when Edgar Martinez (.312/.412/.514) is such a long shot. I have a heightened appreciation of Jeff Kent (.290/.353/.504) who toiled for several teams, mostly in pitchers’ parks. The magnitude of difference between Larry Walker on the road (.278/.370/.495) and at home (.348/.431/.637), while predictable, is nevertheless astounding.
Often, a review of splits confirms our perception of a player, but in some cases, it challenges it. While not the ending point of all debates, looking at road statistics provides new and often unexpected insights.
Doug Baumstein is an attorney in New York and Mets fan.
| Designated Hitter | May 29, 2010 |
Pick Six
The near perfect website called Baseball Reference rents out the heading sections of its player-pages to help support its unequalled statistical product. Unique to this kind of sponsorship is that the Reference auctions off access to the headings, creating a kind of fan marketplace, with better players yielding higher prices than lesser players. This means the player pages of legends like Ted Williams and Willie Mays are nabbed by blogs or memorabilia companies eager to piggy-back on more visible pages. Yet the lesser, and more importantly cheaper, player-pages typically have far more clever text; usually some blend of sarcasm and nostalgia created by someone very bored and devoid of real commitments, someone like myself.
One of my favorites of this type headlines Giants great Johnnie LeMaster’s page. Submitted by David Rubio, it reads “Underachievers have always had a place in my heart. Johnnie was a favorite of mine.” The LeMaster line led me searching for more. I thought another Giants shortstop would be a natural target for someone with the right love of the esoteric and immature, Jose Uribe. Unfortunately no one had bothered to sponsor poor Jose. But the drifting got me thinking about a question: who is the greatest shortstop to ever play for the San Francisco Giants? My instinct was to dismiss recent players outright, I had watched every shortstop since the mid-80s and not one of them had found a place in my heart. I also knew little about the 6-hole guys who played for the early teams so my curiosity and presumptions led me to the beginning, 1958.
The mid-fifties were not kind to the New York Giants. Although a young Willie Mays had transfixed the city since stepping on the field in 1951, the Giants lingered in the shadows of the two outer-borough clubs for much of decade. The idea of the team moving was also not a novel concept in 1957. The Giants had bounced around Manhattan since the inception of the club in 1883, so news of a potential move rarely startled a fan-base who was so comfortable with moving that they brought the name of their home, the Polo Grounds, to each new stop. Throughout the '50s there was often talk that the team would go west, although most thought Minneapolis-St. Paul the likely place because the Giants AAA affiliate played there and an aggressive group of locals enticed Giants’ owner Horace Stoneham with promises of a world class stadium that fans could actually drive their cars to. And, unlike the Dodgers, who played in the middle of Flatbush just off Prospect Park, the Giants, partly due to their very urban roots, attracted fans from the white collar commuter-class from lower Up-state, Connecticut, New Jersey, and city dwellers that, although not quite indifferent, were typically less rowdy and tribal than their neighbors from the working-class enclaves on Long Island. These different demographics, along with routine discussions about the team moving, wrought different reactions when both teams decided to move west for the 1958 season. Although Giants fans were disappointed, there was nothing like the shock and pain that Brooklyn-ites displayed when the Dodgers announced the news. In fact, there is a line that Giants fans were the kinds of people who had been leaving the east coast for California since the end of the war anyways and that Dodgers fans would never leave Brooklyn. Although this was of course hyperbole, it captured some sense of the two divergent moods as the two clubs headed to California.
In the San Francisco of 1958, like much of the country, the post-war boom was not over but stalling. Democratic politicians, like the little known junior senator from Massachusetts, were talking about a stagnant America, tying the aging and ever-golfing President Eisenhower to the slowing of the American economy and the waning of US influence abroad. But still for many, San Francisco represented everything vibrant and open about the American experiment: possessing all of its virtue absent its Puritan baggage. Landing a Major League Baseball seemed to finally ratify worldly greatness on a city that was always looked upon as the loose and brash cousin of the established cities of the eastern seaborne. San Francisco had always possessed wealth and art and physical beauty, but now it had Mays. And owner Horace Stoneham had his ballpark that people could drive to, although not quite yet. The club started out in the Mission, at Seals Stadium before a raucous crowd basking in major league validation. At shortstop was a 29 year-old Manhattan hold-over named Daryl Spencer. “Big Dee” was a tall, lean man and not very good at hitting or playing the field. He had a little pop, especially for the era, but he peaked his rookie year, 1953, on a bad team that felt the loss of Mays’s stint in the service. Spencer continued to be a decent home run hitter through the decade but never topped his inaugural season and fizzled out for the Giants after the first year in San Francisco.
Next year Spencer moved over to second base to make room for defensive specialist Eddie Bressoud. The LA product was a classic pre-Ripken era shortstop; slight, quick-feet, and a really bad hitter. Although still sharing the load with Spencer for some of the time, Bressoud played most of the games in ’59 and 60’. He hit around .230, got on base very little, and kept a lot of runs from being scored by the other team. The Giants were as mediocre as Bressoud both years, finishing 3rd and 5th respectively. Bressoud’s departure cleared the way for the Puerto Rican youngster, Jose Pagan, one of the slough of young Latino infielders that invaded the league in the late 1950s. But like Bressoud, Pagan struggled at the plate. His first year with the reins he hit .253, stole 8 bases, and played above average shortstop. Next year he remarkably finished 11th in the MVP voting, and looking at the numbers, I can’t see any rational reason why. The Giants were good of course, making it to the World Series for the first time in the new digs in ’62, but Pagan stole very little, hit very little, got on base very little, and played mundane, although beautiful, shortstop. It reminds how much of baseball evaluation was, and is, fueled by eyeballs. Baseball people still think they can see a good baseball player when actually you can only count how good a baseball player is.
Pagan hung around, achieving what most clubs expected out of shortstops of the time, then ripened and fell in 1965 for Jayson Werth’s grandpa, Dick “Ducky” Schofield. Ducky had a long career, starting in St. Louis in 1953 and wrapping up with a bad Brewers team in 1971. Schofield was not much more than a space-holder for the Giants in ’65. They traded Pagan outright for the veteran early in the season and got the raw end of the deal. Schofield was like a bad clone of Pagan: wiry, slick, and unable to hit pitches. He barely hit .200 and the Giants cut their losses after the season and waived the plucky Ducky.
Known primarily as a well-loved Giants second baseman, the man who filled shortstop for most of the ’66 season was Tito Fuentes. Cuban born, Fuentes is an interesting historical footnote because he was one of the last Cuban players signed before the American embargo against Cuba, which in unwitting Orwellian Doublespeak Congress dubbed the Cuban Democracy Act. Fuentes played sparingly in ’65, spelling Schofield and playing some second and third. In ’66 he won the job and, in the light of hindsight, played no better than average. But context being truth, average play, especially when done with Latin flourish, looked a lot better than it actually was. Tito finished 3rd in the Rookie of Year that year and won over Bay Area hearts with his smile and glove. Tito moved over to second full-time the following year where he became a baby-boomer favorite, playing slick D and hitting half-way decent on several unmemorable teams in the '70s.
Tito’s move to second allowed former Astros manager Hal Lanier to step in. The prospect apparently fit the mold better than Fuentes, being both average with the glove and a bad hitter. I suspect Hal was the typical manger type; very good at explaining how much he knew about the game, how good his instincts were, but not very good at actually playing baseball. Hal never hit above .231 as the Giants starting shortstop and never slugged above .300. It’s remarkable, going through the research for this piece, how stubbornly ignorant the baseball world was for so long. Tracking shortstops, there was a numbing faith in perceived characteristics that often had very little to do with play on the field. Perhaps no other position in the sport has been shaped by “type” more than shortstop.
Lanier lingered through the late '60s until he was uprooted by Chris Speier. Speier was a scout’s dream, and also a case study in how scouts often get it wrong. Michael Lewis goes into this in Moneyball: The Art of Winning an Unfair Game, how some scouts can develop an odd visual attraction to a player. Billy Beane became convinced that he was touted so highly not just because he could run fast and hit baseballs a long way on occasion, but because he looked like an all-American kid. It has instilled in him, as an evaluator, a penchant for the overlooked chubby guy or the undersized pitcher—so long as they can play. Chris Speier looked like an all-American kid when the Giants drafted him with the second pick overall in 1970. He was a golden boy; local legend (just across the bay in Alameda), sandy haired, and fresh from UC Santa Barbara where he was second team all-conference, but hadn’t exactly lit the place on fire. If scouts had bothered to investigate they would have likely found that Speier was a good all-around athlete with a good attitude and lots of holes in his swing. Speier breezed through the minors though, posting a pretty solid year in AA Amarillo with 6 pops and a .285 clip.
The lone season in Amarillo sold the organization who gave Speier the starting job in 1971. Yet they kept Lanier around, likely to teach the kid the game and Hal must have taught him everything he knew because Speier turned into a prototypical Giants shortstop. His rookie campaign with the big club did not go well but he followed it up with an impressive sophomore season that landed him in the All-Star game. Looking at the 1971 All-Star game is interesting because it suggests that the Giants were not the only club infatuated with the idea of type. Starting that game for the National League was Cub favorite Don Kessinger. Kessinger defined the shortstop type: 6’1”, 170, scrappy, smooth, and very bland in the batter’s box. Unfortunately for the Cubs, and the league really, Kessinger was the best of the type, playing in six all-star games over a seven year period spanning the late '60s and early '70s (the one year he missed his numbers were virtually identical to the award seasons). So it is easy to see how the Giants might be coaxed in to believing their young all-star would be very good indeed. And if Speier had simply replicated what he had accomplished his sophomore season he likely would have become the obvious answer to the question I pose here—but that did not happen. In '73, another all-star campaign it should be noted, Speier regressed in every phase of the game. He dipped in all the relevant offensive categories and had one of his worst seasons defensively, using the Reference’s version of UZR figures. The following year he was awarded another presence in the All-Star based on very Kessinger-like play. After '73 Speier did not have another productive season but remained the Giants starting shortstop for another three years. As testament to how powerful this concept of the shortstop type remained in baseball into the '80s, even after Ripken showed what was possible, Speier managed to play another 16 seasons in the big leagues.
By now, even if you never saw LeMaster play or are not familiar with his numbers, you can probably guess which type of shortstop he was. But before we get to 1978 Tim Foli deserves a word. Drafted first overall by the Mets in 1969, Foli was, you guessed it, 6’0”, 179, smooth, scrappy, and apparently a great teammate, convincing one that being a great teammate is synonymous with being a bad hitter. Ever heard someone say Ted Williams was a great teammate? The Giants, in a deal similar to the Lanier/Pagan trade, acquired Foli when they sent Speier to the Expos the first month of the season, 1977. He was Speier’s age and his double at the plate, yet Foli was not just average in the field the way his predecessor had been—he was better than average and at times he was excellent. Although his error totals crept into the teens most years, he covered a great deal of ground and had the knack of making outs on balls that most shortstops could just simply not get too. His UZR number of 16 in 1974 with the Expos is Vizquel-like and his steady 7s and 9s through most of his career put him in nice company. The Giants would have been far better off holding on to Foli but they couldn’t resist young Johnnie LeMaster—who true to type was of course an awful hitter, but was also dreadful in the field. The Giants were burdened with LeMaster as their everyday shortstop for seven seasons and it’s not coincidence that some of the worst Giants teams to date were helmed by Johnnie LeMaster at shortstop. I’m sure he was a great teammate but he was a very bad baseball player.
Jose Uribe brought the Giants a level of consistency at shortstop that they simply had not found since moving west. Uribe’s offensive numbers are no better than his predecessors—although his ability to steal bases separates him from the pack—but defensively he was good. His second full year in the big leagues, after a shaky rookie campaign, he had an excellent defensive season, racking up a 15 UZR. When the Giants needed him most, during the ’87 playoff year, he scored a 9 in the field and had his best offensive year with a huge spike in OPS and batting average. Following Uribe was what the Giants thought would be their first real break from type. Not necessarily in build, because Royce Clayton was similar in stature to the others, but the Giants thought they found a shortstop who could actually be a force offensively. He ended up showing that he could, becoming a good hitter and base-stealing threat, but only after the Giants had passed on him.
Although his first two years were productive and in 2007 he pulled off the best UZR clip of his career, 23, Omar Vizquel’s years with the Giants were not his best. He was a solid player however, and gave the Giants a chance to compete in the final years of the Bonds era. Ignoring Renteria because of his brief time in San Francisco, we’re left with the surprising answer to my question, Rich Aurilia—and it’s not even close. During Aurilia’s prime he was a critical part of the Giants success and in 2001 had a capstone, MVP-type season with 37 homers, 97 RBIs, a .324 batting average, and led the league with 206 hits. He hit over 10 homers eight times in his career, drove in over 60 six times, and played serviceable shortstop with above-water UZR ratings for most of his prime. But I think this all might have been a waste of time because if you go to Aurilia’s Baseball Reference player page, the sponsor heading reads simply, “The best shortstop in San Francisco Giants history.” They got it right.
John Fraser is a historian with the California State Parks and a longstanding member of a fantasy baseball league. For added excitement in his spare time, John reads the sponsorship entries on Baseball-Reference.
| Designated Hitter | April 26, 2010 |
How to Score More Runs? Play the Best Hitters
In the past twenty years Major League Baseball has seen a pronounced increase in run scoring, a phenomenon often credited to the use of performance enhancing drugs. You may have heard about this. Teams scored 4 to 4.5 runs per game nearly every year from 1975 and 1992 but have exceeded those levels ever since, scaling 5 runs per game in 1999 and 2000. Although diluted pitching is mentioned on occasion, or smaller ballparks, or a smaller strike zone, this period is likely destined to be known as the “steroid era,” reflecting the popular consensus of the causes of the higher offensive levels. Those who believe that the use of PEDs has decreased in recent years point to the major leagues 4.61 runs per game last year, the second lowest total in the past 15 years. More skeptical people would point out that the offense is still at a higher level than it had been in the previous 40 years. Either way, run scoring is often seen as a proxy for the prevalence of PEDs.
Of course, there are other explanations for the run scoring, and the true cause is likely a combination of several factors which work together. To give just one example, the strike zone, especially about a decade ago, had shrunk to such a degree that a bulked up slugger could repeat the same powerful stroke on every swing. Whereas Henry Aaron's swing had to be flexible enough to handle a letter high fastball and a breaking ball at the knees, Mark McGwire’s swing did not. The reduced strike zone, I would argue, helped lead to the bulked up bodies and the various methods, good and bad, of attaining them. The causes work together.
One factor often overlooked in the increased offense is a very basic one: managers are choosing to play better hitters than they used to. As an illustration, I present the story of Don Buford.
Buford was a college football and baseball star at USC who did not begin his pro career until he was 23. He always had great on-base skills (walking over 90 times twice in the minors) and even a little power, despite his 5-feet-7, 160 pound frame. In 1963, at age 26, he led the International League in batting average, doubles, runs scored, and stolen bases and was named the minor player of the year by The Sporting News. The White Sox organization moved him to third base in 1962, and then moved him to second base for his rookie major league season of 1964. He never became a great infielder, but he was a fine offensive player right away. In 1965, he hit .283 with 67 walks and 37 extra base hits, standout numbers in the 1960s especially for a middle infielder. He was not a kid, 28 years old, but one of the better players in the American League.
In 1966 Eddie Stanky replaced Al Lopez as manager, took one look at Buford and decided he needed to steal more bases and bunt more. This sort of worked—Buford stole 51 bases, and led the league with 17 sacrifices—but he was a less valuable player. The 1967 White Sox contended until the final weekend despite hitting .225 and scoring just 3.28 runs per game, both totals next-to-last in the league. Buford was seen as epitomizing this team—chopping down on the ball to beat out hits, hitting behind the runner, stealing bases—and the club was seen as proof that you could win without any hitting. After the season the White Sox made a six player deal with the Orioles, sending Buford and two pitchers for Luis Aparicio, a good shortstop who would fit right into their offense.
With the Orioles Buford had no place to play, as the club had Brooks Robinson at third base and Dave Johnson at second base, and manager Hank Bauer used Buford as a reserve infielder. At the All-Star break he had started 22 games and played in 26 others, mainly at second, and was hitting .234. During the break, Bauer was fired and replaced by first base coach Earl Weaver.
Usually when a manager, especially a rookie manager, takes over at mid-season he just keeps doing what the other guy was doing. Why call attention to the fact that you thought your predecessor was wrong? Earl Weaver did not really think that way. Weaver had managed against Buford in the minor leagues, and believed that he was a better player than Bauer did. In his first game as manager, he played Buford in center field and hit him leadoff in the order. Buford walked and scored in the first, homered in the fifth, and the Orioles beat Washington 2-0. Buford led off every game the rest of the season, and responded by hitting .298 with 11 home runs and 45 walks in the final 82 games of the season. In 1968, these were star numbers. “Don Buford is the spark plug,” said Frank Robinson after the season, “the guy who always gets on base, who doesn’t scream or yell, but when you see him out there on a sack, you just have just got to bring him home.” Buford scored 45 runs in the second half of the season.
Buford led off for the Orioles the next three years, and helped ignite a league-leading offense for one of the greatest teams ever assembled. Buford did not become more valuable as a player by lifting weights or moving to a better park so much as he played for a manager who allowed him to be the player that he could be. Weaver did not want Buford to chop down on the ball and run like hell to first base. According to Buford, Weaver just wanted him to get on base and hit line drives.
This pattern is also seen in the career of Joe Morgan, a similar, though decidedly better, player. They were about the same size, both second basemen, though Buford was out of position there, and both had decidedly underrated on base skills. While Buford’s skills were misunderstood by Eddie Stanky, Morgan’s were misunderstood by Harry Walker. Morgan hit .260 every year with a bunch of steals, so Walker had him sacrifice and hit behind the runner. Morgan also had extra base power and walked 90 or 100 times a year, but middle infielders were not really judged that way in 1970. Morgan’s power was seen more as a source of trivia than part of the conversation when discussing his value.
Unlike Walker, and unlike most everyone else at the time, Morgan knew how a baseball offense worked and he did not mind telling people about it. When a reporter asked him about his stolen bases, he would say, “Stolen base totals don’t impress me unless the player has a high stolen base percentage.” He talked about getting on base even when no one was asking him about it. Walker did not care for Morgan’s outspoken confidence, an attitude Morgan believed was racially motivated. When he was leading the Astros in home runs in the middle of the 1971 seasons, Morgan said, “This team’s going nowhere if I lead the team in home runs.” When he did, in fact, lead the team in home runs and his team finished fourth, he reminded reporters of his earlier prediction, adding, “no matter what some people might tell you.” Harry Walker correctly interpreted this as a criticism of his baseball acumen, and Morgan was soon sent to the Reds in an eight-player deal that kicked the Big Red Machine into a new gear.
While Earl Weaver has received proper credit for his role in utilizing the talents of Don Buford, Sparky Anderson’s effect on Morgan has gotten less attention than it warrants. While some in the press were raving about the Astros acquisition of Lee May in the deal, it was Anderson who said of Morgan, “He gets on base an awful lot of times. His on base ratio is unbelievable.” Unlike Walker, who considered himself a teacher of hitting, Anderson told Morgan to get on base and crush the ball whenever he swung. The Reds already had two big egos in Pete Rose and Johnny Bench, and Anderson was perfectly comfortable adding a third. Anderson later called Morgan “the smartest man I ever coached.” Walker was threatened by Morgan’s obvious intelligence, while Anderson considered it an asset. Bench and Rose quickly saw what they had, and made it clear that chopping down on the ball would not be acceptable.
So what do we make of all this? In the past generation or so, there has been a growing appreciation for plate discipline, the willingness to see a lot of pitches and get on base. Teams are stressing this skill in the minor leagues, players are becoming more aware of the value of patience, and managers are utilizing on-base percentage in deciding who makes the team and who plays. Assuming this is a good thing, that managers are doing a better job of playing the right guys and directing the offense more effectively, than it stands to reason that this revolution should, in and of itself, be leading to more runs being scored.
Weaver was ahead of his time in his ability to put the right guys on the field, with Buford being perhaps the best example of this. Similarly, Sparky Anderson deserves credit for allowing Joe Morgan to be Joe Morgan. In today’s game, there is a much greater understanding of how runs are scored and how players should be developed to produce those runs. This appreciation has, every obviously, led to higher scoring games. Returning to pre-1993 offensive levels will take more changes than just removing performance enhancing drugs.
Mark Armour is a baseball writer living in Corvallis, Oregon, and the director of SABR’s Baseball Biography Project. His book Joe Cronin: A Life in Baseball was recently published (to good reviews) by the University of Nebraska Press. He and Dan Levitt are working on a sequel to their 2003 book Paths to Glory.
| Designated Hitter | April 07, 2010 |
What Opening Day Tells Us (or not)
I totally understand where it comes from, but there's nothing quite like the elation and consternation that surrounds every little thing that happens on baseball's Opening Day. Every individual event is a good sign or a bad sign (or both); guy A got three hits and is ready to take a big leap forward; guy B took an oh-fer and is on the way out. This much attention won't be paid to a game again until October.
Ultimately, of course, we all know that there are 161 more of these (or 2415 of them league-wide, minus a few rainouts), and what happened in this one doesn't mean any more (or less) than what happens in any of the others. But just for fun, I thought I'd use my indispensable Baseball Reference Play Index subscription to look at some big opening day successes and failures and at what those players did for the rest of the season, and see whether any patterns emerge.
Two Homers
Albert Pujols managed to hit two out on Monday, to no one's surprise, and so did Garrett Jones. Since 2000, 24 other guys have done it a total of 27 times (including another by Pujols) with Dmitri Young hitting three out in 2005. The list includes prodigious sluggers like Bonds, Pujols, Guerrero, and Juan Gonzalez; guys having uncharacteristic power years like Shannon Stewart (who hit two out on opening day 2000, a year in which his 21 HR eclipsed his second best by 62%) and Ivan Rodriguez (who went on to hit 27 in just 91 games in 2000); and others like Felipe Lopez (who hit just 7 more homers in all of 2009) and Corey Patterson (11 more in 82 more games in 2003). Oh, and Chris Shelton (who got just 408 more PA in 2006 and has had just 145 more in the majors since) and Tony Clark (who had just 74 more PA and 2 more HR left in his 2009 season, and very likely his career).
In those 27 seasons, the players have averaged 27 home runs per season, one homer every 19.7 plate appearances, 33 homers per 660 PA. Over those 24 players' entire careers, they've averaged a homer every 22.9 PA, or 29 every 660.
So you could look at it a few ways. On one hand, guys who hit 2 homers on opening day see their season-long homers increase by 13.8% over their career norms, which sounds like a lot. On the other hand, they've already hit two of those, so for the rest of the season -- assuming they're healthy and good enough to play the season out at all -- they've only got two "extra" homers left. Basically, it seems to me, the fairest thing would be to expect them to hit from games 2 to 162 the exact same number of HR that you had expected them to hit all season long. The two on opening day are a nice bonus, but not a sign of a sudden transformation.
Four Hits (or more)
As a Twins fan, I was all set to start grumbling about Carlos Gomez's debut with the Brewers, but then I was reminded that in his first five games with the Twins, Go-Go did this. Gomez, Pujols and Carlos Gonzalez all went 4-for-5 on Monday. Just how little does that mean for their next six months or so?
Well, as you'd expect, darn little. 20 guys managed four hits on opening day last decade (two of them, Craig Biggio and Aaron Miles!!?!, got five -- and then Miles turned around and got 4 again the following year). And like the homer-hitters, they're all over the map. 2009's hit-collecting heroes were Adam Lind, who never looked back, and Emilio Benifacio, who never looked so good again.
In the seasons in which those 20 hitters collected four or five on opening day, they combined to hit nearly .291. In the years prior to that one (which I should've done above, no doubt, rather than looking at their careers as a whole -- and even better, I should be looking at only the preceding three seasons or so -- but it's too late now), they hit a shade over .280.
Seems fairly significant, but a lot of it is just that great opening day itself; give them one hit that day rather than four (or two rather than five, so we're subtracting 60 hits and 0 AB from the whole), and their collective single-season average drops to .284. And, a lot of it is driven by Derrek Lee, whose four hits on opening day 2005 was the kickoff to a campaign in which the theretofore .266 hitter hit .335; if we remove Lee from both sides of the equation, the other 19 were career .282 hitters who hit .288 that season (and if we then take three of their 4-5 opening day hits back out, the season average drops to .281, almost exactly their prior career averages).
All of which is to say that I don't think the data support a conclusion that a player who collects four hits on opening day is likely to perform better the rest of the season than he has in the past. It so happens that Gomez and Gonzalez might both be ready to break out in some way this season (and let's be honest -- if Pujols just decided to hit .400 this year and went out and did it, would you be that surprised?), and if they do, maybe you'll hear people say that you could see the change in them from day one of the new season.
But I don't think you could.
The Oh-fer
Seven different guys were saddled with oh-for-fives on opening day 2010, including some pretty big names: Jacoby Ellsbury, Denard Span (who swung the bat like he thought if he hit it it might find his mother again), James Loney, Skip Schumaker, Aaron Rowand, and the Cabrerae Orlando and Melky. Those seven guys went 0-for-35 with a walk (Melky's) and 10 strikeouts.
Every year there's a guy or two who surprises everybody by just stinking up the joint all year (or just for the first half), seemingly from day one. Last year it was Ortiz and Burrell. Seems like Paul Konerko has been that guy two or three times in his career. Are one of these seven going to be That Guy 2010?
There are 68 guys who went at least 0-for-5 in opening days since 2000, and that's too many for me to check, so I'm going to keep the sample similar to the above and go from 2006 on. That gives us 27 names -- 25 0-for-5s, and Jason Bay and Placido Polanco each went 0-for-6 in 2008 (Polanco racking up an eye-popping -.354 WPA).
Let's see...this group of guys actually put up better batting averages in their oh-fer year than they had previously; they were career .267 hitters who, that season, hit .274. But the takeaway point here is that there's just no correlation with anything at all. Matt Holliday started off the 2007 season 0-for-5 and had the best year of his career, finishing second in the MVP voting. Jose Reyes started 2006 0-for-5 and made the jump from .273/.300/.386 to .300/.354/.487. On the other hand, Andruw Jones' opening day goose egg was the harbinger of his sudden collapse in 2007. Jeff Francouer started his first full season with a big zero, and ended up showing his true colors after a promising half-season in 2006. Travis Buck had a promising partial year in '07, but '08 was awful from day one, and he's never recovered. JJ Hardy and Ryan Doumit had nightmarish 2009s, and both of them got started on it straight away. David Dejesus' bad start to 2007 led to his worst batting average by 20 points and worst full-season OPS by nearly 60.
Interestingly, a couple other guys had kind of famous collapses either the year before or the year after their oh-fer start. Alfonso Soriano came up empty to start 2008, but wasn't terrible until 2009. Jason Bay's 0-for-6 in 2008 looked like a carryover from his awful 2009, but he came back strong. Other guys are just bad hitters -- Jason Kendall, Willie Tavaras. And a lot of others were just their normal, every-season selves having a bad day.
So if a guy has a really, really bad opening day, is that a bad sign? Well, it's not a good sign. And for some guys, it certainly seems to be the beginning of very bad things. But for many more, it's just a bad day. If you think you can tell one apart from the other, go ahead and take your chances.
The Auspicious Debut
Since 1920 (as far back as BBREF goes for these purposes), there have been 30 guys who (a) made their major league debut on their team's opening day and (b) hit a home run in that game. (Nobody's ever hit two or more.) Jason Heyward, the Jay Hey Kid, was the 30th.
I'm not going to mess with a spreadsheet for this one, but it's a good idea to take a look at that list. A couple really good players on the list. Orlando Cepeda, Ken Boyer, Luis Gonzalez, Will Clark. And a lot of guys I've almost never heard of. And Jordan Schafer, and Kosuke Fukudome, and Kenji Johjima, and Travis Lee.
On the other hand, sorting the list by age tells a different story. Heyward was the second-youngest ever to do it, less than a month behind Hall of Famer Cepeda, and the next guy to have done it was nearly a year older (though it's worth noting it's a guy who totaled 79 PA in the big leagues). But it's not like he's surrounded by great players on that list. He just happens to be right behind one guy who was really good for a fairly long time.
The point is, as I guess the point of all of this was: Jason Heyward might be every bit the special player everybody thinks he is, but one home run -- even one 450-foot home run in one's first-ever at bat -- doesn't prove it, or even provide particularly strong evidence of it. If there's anything we can learn from any of these opening day stats or events, it's months (or, in Heyward's case, years) before we know we can learn those things, and that they weren't just random blips. Opening day is just about the greatest day of the year, for all kinds of reasons. But I think I'd find it even greater if people didn't get in quite such a tizzy over one day (or even one month, or two, but that's another post) in a looooooooong season.
Bill runs the blog The Daily Something, featuring a largely sabermetrics-focused post on some topic related to baseball five days a week. You can become a fan on Facebook or follow him on Twitter.
| Designated Hitter | March 27, 2010 |
Pat Rispole and the 1957 Brooklyn Dodgers
Author's Note: While it is safe to say anyone who visits this blog knows something about the Brooklyn Dodgers, few people know anything about Pat Rispole. Pat lived in Schenectady, New York. He taped an astounding number of baseball games during his lifetime. In 1957 Pat taped Brooklyn Dodger broadcasts. After the Dodgers moved to Los Angeles, he taped Yankee games. Beginning in 1962, Pat taped New York Met games. He taped many World Series broadcasts. Pat also recruited people from around the country to tape baseball games. Pat traded reel-to-reel tapes he had from his extensive sports and non-sports collection to people who taped baseball broadcasts for him. Pat Rispole died at the age of 53 on June 10, 1979. A portion of Pat's enormous audio collection was sold after his death to John Miley, who purchased many of Pat's sports tapes, and to Phil Gries, who purchased many of Pat's non-sports tapes. Phil has catalogued the tapes he purchased from Pat's collection and the numbers are amazing. Phil has 3,131 audio broadcasts from the years 1957 to 1977, mostly consisting of TV shows, with a few radio broadcasts mixed in. A few dozen Met and Yankee radio broadcasts from 1972 that somehow were not included in the sports tapes sold to John Miley were included in the tapes sold to Phil Gries. Pat Rispole left us with audio treasures that live on long after his death. I hope this article will inspire someone to write a more detailed article about Pat and the recordings he made.
On April 16, 1957, Pat Rispole tuned in Albany radio station WOKO, threaded a tape onto his reel-to-reel tape recorder, and pushed the record button before the Phillies Robin Roberts delivered the first pitch of the game and season to Brooklyn Dodger lead-off hitter Jim Gilliam. Twelve innings later, after a 7-6 Dodger victory, Pat had a complete-game broadcast preserved on tape. Clem Labine got the win that night, but Pat Rispole deserves credit for the save.
Twelve 1957 Brooklyn Dodger radio broadcasts, including the season opener mentioned above, are currently available for sale to the public. Years ago John Miley transferred the 1957 Brooklyn Dodger broadcasts discussed in this article from Pat Rispole's reel-to-reel tapes to cassette tapes and then later, as technology changed, to CD's. John sold the cassettes and CD's to the public through the Miley Collection. John had former Boston Red Sox broadcaster Ken Coleman put a brief statement on each cassette and CD that he sold. In every Miley Collection recording I have heard, Ken Coleman's opening remark is the same: "This is Ken Coleman speaking. We present for you another complete game broadcast from the Miley Collection. We hope that you enjoy." Well, that's good enough for me. I hope you enjoy what follows.
April 21, 1957 Pirates/Dodgers at Ebbets Field
The Dodgers brought a 3-0 season record into the first game of an Easter Sunday doubleheader against the Pittsburgh Pirates. This game, recorded by Pat, was the first Dodger loss of 1957. When the season ended, there would be sixty-nine others to add to it. Brooklyn won eighty-four games in 1957, so the Bums had a good year.
Don Newcombe was hit hard and often in this 6-3 loss to the Pirates. In the third inning, Newcombe gave up back-to-back-to-back solo homeruns to Frank Thomas, Paul Smith and Dick Groat. Newcombe was removed with one out in the third, after giving up four earned runs and seven hits. Rene Valdes pitched effectively in relief, going 3 2/3 scoreless innings before being replaced by pinch-hitter Sandy Amoros. The final Pirate runs were scored on a two-run homerun by Bob Skinner off of Sandy Koufax.
Brooklyn was held to two hits by the pitching of Vern Law, Bob Purkey and Roy Face. The Dodger runs were scored in the ninth on a three-run homerun by Carl Furillo. The only other Dodger hit was a fifth inning single by Gil Hodges.
May 7, 1957 Reds/Dodgers at Ebbets Field
A Dodger fan might not want to hear what was preserved on Pat's tape. The Cincinnati Reds won 9-2, although the game was not as lopsided as the score indicated. Going into the top of the ninth, the Dodgers trailed 4-2. Dodger relief pitchers Ed Roebuck and Ken Lehman were hit hard in the ninth, and the Reds turned a close game into a rout. Hal Jeffcoat pitched a complete game for the Reds, allowing six hits, three walks, and two unearned runs.
The major baseball headline that night was not the Dodger loss. In the second inning of the broadcast, Dodger announcer Al Helfer relayed the sad news that in the Cleveland-New York game young Indians pitcher Herb Score was hit in the face by a line drive and carried from the field on a stretcher. The injury cut short what looked to be a brilliant career.
May 14, 1957 Dodgers/Braves at County Stadium
This broadcast recorded by Pat Rispole must be heard to be believed. In 6 2/3 innings, Milwaukee starter Bob Buhl walked nine, gave up five hits, and came away with a 3-2 victory. In the sixth inning, Buhl walked the bases loaded with none out. Roy Campanella lifted a fly ball to Braves' right fielder Hank Aaron for the first out of the inning. Carl Furillo, the Dodger runner at third, was anchored to the bag even though Hank Aaron's throw was to third base. Vin Scully, mentioning to his listeners that the Dodgers had squandered a gift run, described Furillo angrily kicking the third base bag after the play was over. The baserunning gaffe was highlighted when Buhl struck out Don Zimmer and retired Don Newcombe on a pop fly to shortstop Johnny Logan to end the inning. The Dodgers scored two runs in the seventh, but the squandered chance in the sixth proved costly in a 3-2 Dodger defeat. Newcombe pitched effectively, but got the loss.
May 30, 1957 Dodgers/Pirates at Forbes Field
This first game of a Memorial Day doubleheader, recorded by Pat, was a 4-3 Dodger victory. The Dodgers won behind the pitching of Sal Maglie. Brooklyn scored its runs in the middle innings against Pirate starter Vern Law. In the fourth, Duke Snider singled in Gino Cimoli; in the fifth, Don Zimmer hit a sacrifice fly that scored Roy Campanella; and in the sixth, Duke Snider hit a two-run homerun. Clem Labine preserved the Dodger victory with 1 1/3 innings of shutout relief.
June 4, 1957 Cubs/Dodgers at Ebbets Field
To the delight of everyone who has heard this game, Pat Rispole recorded an absolute gem of a broadcast. Sandy Koufax was the Dodger starter, and as was the case so often, the combination of Koufax and Vin Scully was sensational. Read the words, but try to imagine Vin saying them:
"Just the start of things, so pull up a comfortable chair. If you want to take your shoes off, go ahead, wiggle your toes, and we hope you'll have a cold Schafer or two throughout the evening. Dodgers and Cubs opening the homestand.""1 and 2 pitch, fast ball got him swinging, and that thing was moving, so maybe Koufax is starting to loosen up a little bit. He wasn't very fast to Morgan or Speake, but that last strike to Ernie Banks had something on it."
"The runners go, the 3-2 is cut on and fouled away down the right field line on top of the roof and out of the ballpark. So the kids that are listening to the ballgame on the soda-pop stands outside, you'll run that one down, almost to Bedford Avenue."
"Koufax ready, now the 1-1 pitch, fastball cut on and missed and that was moving, 1 and 2. So one thing I'm pretty sure about this stage of the game now, Koufax has loosened up. He appeared to be a little stiff pitching to Morgan, even though he struck him out. Pin-wheeled his arm around, did a couple of knee bends, now he's starting to pitch with a loose motion."
"We understand at the agency, that we now have a young girl writing commercial copy. And I'll bet ya her fine hand was in that last one, 'sunlight on a drift of snow.' Well, all right. (In the background, Jerry Doggett is heard saying, 'Thanks Vin.') (Vin laughing lightly) Zimmer batting .229. (The commercial played between innings and read by Jerry Doggett included the line, 'And when you lift a glass of Schaefer, man it's like sunlight on a drift of snow.')"
"And the strike one pitch, fastball cut on, there is a high foul to the right of the plate. Neeman coming back, right to the lip of the dugout, and can't make it. The ball lands on the roof. And somebody makes a great catch by the name of Barney Stein. Barney who takes great sports photos for the New York Post, he's also the Brooklyn Dodger official photographer. And that thing kangarooed from the dugout roof right up into the camera booth, and there was Barney to grab it. He dropped a nine thousand dollar camera in the process. No, not really."
"I might have said earlier, with the first two batters up there, that Koufax appeared not to be loose. But now he is firing. He struck out the side in the second inning."
Koufax no-hit the Cubs through 5 1/3 innings, striking out eight batters in the process. With Bobby Morgan on base via a walk, Bob Speake broke up the no-hitter and shutout with a homerun. The Dodgers, leading 7-2, allowed Sandy to pitch into the eighth inning, when he ran into trouble again. A single by Bobby Morgan and a walk to Bob Speake brought Ernie Banks to the plate with one out. Banks belted a three run homerun to narrow the Dodger lead to 7-5. Koufax retired Lee Walls, but when Frank Ernaga doubled, Walt Alston lifted Koufax for relief ace Clem Labine. In 7 2/3 innings, Koufax walked five, struck out twelve, and gave up five earned runs on four hits. Labine pitched out of trouble in the eighth and ninth innings to secure the Dodger victory.
The Dodger offense got started early with three first inning runs. The big hit in the inning was a two RBI double by Roy Campanella off the Schaefer scoreboard in right. Brooklyn scored three more in the third to break the game open. The final Dodger run was a fifth inning solo homer by Gil Hodges against pitcher/author Jim Brosnan.
July 14, 1957 Braves/Dodgers at Ebbets Field
A come from behind victory is always fun if your team gets the win. The Dodgers trailed 2-1 going to the bottom of the ninth in this game recorded by Pat. In the ninth, Gino Cimoli reached on a leadoff walk. Gil Hodges then belted the first pitch he saw from Braves starter Bob Buhl over the left field wall. Gil's homerun made Johnny Podres, pitching in relief of Sal Maglie, a winner by a 3-2 score.
At the close of play on July 14th the Dodgers were tied for fourth place with the Reds. The Dodgers were only 2 1/2 games behind the first place Cardinals. The sixth place Giants were nine games out.
July 20, 1957 Cubs/Dodgers at Ebbets Field
Twenty-one year old Don Drysdale was the starter and winner in this 7-5 Dodger victory recorded by Pat. The Dodgers scored four runs in the first to overcome a first inning Cub run. Ex-Cub Randy Jackson's solo homer in the sixth gave the Dodgers a 5-1 lead. The Cubs were able to make the game uncomfortably close with three unearned runs in the seventh inning. Clem Labine secured the Dodger victory with 2 1/3 innings of one run relief pitching.
After the July 20th victory, Brooklyn was in second place, 1 game behind Milwaukee. Only three games separated the top five teams in the league. The sixth place Giants were 11 games behind the Braves.
July 28, 1957 Dodgers/Reds at Crosley Field
Johnny Podres and Carl Furillo were the pitching and hitting stars in this 7-2 Brooklyn victory recorded by Pat. Podres was a masterful pitcher on the road all season long, and this two run complete game performance against the Reds was no exception. Podres fell behind 1-0 in the first after giving up a RBI single to Frank Robinson. The Dodgers tied it in the third, and then in the fourth Carl Furillo hit a grandslam against Reds starter Brooks Lawrence. The Dodgers scored two in the eighth and the Reds answered in the bottom of the inning with a Ted Kluszewski pinch hit solo homerun to finish the scoring for both teams.
At the close of play on July 28th the National League pennant race was tightly bunched at the top. The first place Braves were 1 1/2 games ahead of the third place Dodgers, and only 3 games ahead of the fifth place Phillies.
August 5, 1957 Giants/Dodgers at Ebbets Field
This game recorded by Pat was the opener of a four game series against the Giants. Don Drysdale pitched 8 2/3 innings to earn his ninth victory of the season in a 5-2 Dodger win. Clem Labine got a one out save by retiring Willie Mays on a ground ball to shortstop Charlie Neal to end the game and strand two Giant runners on base The Dodgers scored single runs in the second, third and fifth to take a 3-2 lead. Two insurance runs in the seventh made a nervous ninth inning easier to bear.
The Dodgers lost the next three games of the series to the Giants. The August 7th loss was crushing. Brooklyn gave up five runs in the ninth inning to turn a 5-3 lead into a heartbreaking 8-5 loss in a game played at Roosevelt Stadium in Jersey City, NJ. The three defeats sent Brooklyn into a tailspin that coincided with a hot streak for Milwaukee. From August 6th to August 18th, the Dodgers played exclusively against two second divisions teams, the Pirates and Giants. During that stretch Brooklyn went 5-9. The Braves during that same stretch went 10-3 playing against two first division teams, the Reds and Cardinals. At the close of play on August 18th, Brooklyn was in third place, 7 1/2 games behind first place Milwaukee. Brooklyn was still in a pennant race, but things were not looking good.
August 31, 1957 Giants/Dodgers at Ebbets Field
This 7-5 Dodger victory recorded by Pat was the next to last game ever played between the Dodgers and Giants at Ebbets Field. Ed Roebuck was the pitching and hitting star. Roebuck pitched 3 1/3 innings of shutout relief and hit a solo homerun. The Dodgers took a 4-2 lead in the fifth inning on a two run homerun by Gil Hodges. The Giants took the lead away in the sixth on three unearned runs. With two outs and none on in the bottom of the sixth, Roebuck singled to start a two run rally that gave the Dodgers the lead. Roebuck added an insurance run with his homerun in the eighth.
Brooklyn was in second place after the victory, 7 games behind Milwaukee. A doubleheader loss to the Phillies at Ebbets Field a few days later on Labor Day all but eliminated the Dodgers in the pennant race. The double defeat dropped the Dodgers to third place, 10 games behind the Braves.
September 8, 1957 Dodgers/Giants at the Polo Grounds
This Sunday afternoon game is the last game of the season currently available to the public from the recordings Pat Rispole made of 1957 Brooklyn Dodger broadcasts. Any baseball fan with a sense of history should listen to it. The game, the last meeting ever between the historic New York rivals, was won by the Giants, 3-2. Jerry Doggett broadcast the first four innings and a somber Vin Scully took over in the top of the fifth. Vin, contemplating the likely departure of the Dodgers and Giants from New York at the end of the season, was at his brilliant best:
"I don't know how you feel about it at the other end of these microphones, whether you are sitting at home, or driving a car, on the beach or anywhere, but I know sitting here watching the Giants and Dodgers apparently playing for the last time at the Polo Grounds, you want them to take their time, 2-0 pitch is low ball three, you just feel like saying: Now don't run off the field so fast fellas, let's take it easy, we just want to take one last lingering look at both of you.""Yes, the Giants and the Dodgers, baseball's greatest rivalry, being played for perhaps the last time at the Polo Grounds. And it doesn't make you feel very good."
"Well it's funny, but being a kid raised in New York and you sit here watching this ballgame and looking at the Polo Grounds, and your memories go wild. Strike one pitch to Gino is down low. Not just baseball, they had some great football games, and great stars who played here at the P.G. You can almost see them running around out there...... Did you ever see a Fordham-St, Mary's football game, years ago before the war? That's something you remember."
"We roll to the last of the sixth inning in this ballgame, the last time these two teams will play at the Polo Grounds. Memories, memories."
"And so to the ninth inning, what very well may be the last inning ever played here at the Polo Grounds between the Giants and the Dodgers."
"So if it is the last inning of the last game to ever be played between the Giants and the Dodgers here at the Polo Grounds, if time is going to slam the door on this great rivalry over here, then Sandy Amoros has the privilege of being the fellow with his foot in the door, trying to keep it open. Amoros hitting for Eddie Roebuck."
"Marv [Grissom] ready, the 1-1 pitch to Amoros, cut on and bounced down to O'Connell, Danny up with it, he throws, that does it. The New York Giants saying good-bye to the Dodgers and vice-versa here at the Polo Grounds and the Giants win it 3-2. We'd be remiss [not] to say it's kind of a sad day for everybody concerned, if this will be the final game played here."
"And you just kind of say good-bye and let it go at that. I guess everybody has his own thoughts, and that will do it. Final score 3-2 New York."
Although the September 8th Dodger-Giant game is the last recording made by Pat from the 1957 Dodger season that is currently available for sale to the public, one other game, the last game ever played by the Brooklyn Dodgers, is so significant that I would like to review it briefly. No article about the Dodgers final year in Brooklyn would be complete without it.
On September 29th the Brooklyn Dodgers ended the 1957 season at Connie Mack Stadium against the Philadelphia Phillies. Ed Bouchee hit a two-run homerun to give Philadelphia the only runs they needed in a 2-1 victory. Brooklyn born Sandy Koufax was the last pitcher to throw a pitch for the Brooklyn Dodgers when he retired Willie Jones on a strikeout. The catcher who caught Sandy's last pitch was Brooklyn-born Joe Pignatano. In the ninth, Bob Kennedy hit a fly ball to Phillies centerfielder Richie Ashburn for the final out of the game and season.
The next Dodger regular season home game was played in Los Angeles. The 1958 Dodger home opener was not broadcast on an upstate New York radio station. If it had been, Pat Rispole probably would have recorded it.
*******************
Sources and notes:
Retrosheet was on my computer almost constantly while I wrote this article. What a fantastic website. The information on Retrosheet is free and copyrighted by Retrosheet. Interested parties may contact Retrosheet at www.retrosheet.org.
The broadcasts recorded by Pat Rispole were the other main source I used in writing this article. John Miley has released some of Pat's many baseball recordings, including all the Brooklyn Dodger radio broadcasts I have discussed in this article, in his Miley Collection. I have been a customer of John since basically forever. He has never failed to provide quick and reliable shipment of the orders I have placed with him. I thank John for a lengthy phone conversation I had with him several years ago. I didn't take any notes about the conversation at the time, but notes weren't needed. What John told me was so interesting I could not forget it. I am not sure I would have written this article unless I had that conversation with John Miley.
Phil Gries has been very helpful to me from my first email to him. Phil purchased many of Pat Rispole's non-sports tapes. I thank him for some very interesting emails. Phil attended the July 4, 1957 doubleheader at Ebbets Field against the Pirates. How I envy him; I wish I had seen a game at Ebbets Field. Phil lived in Brooklyn on Bedford Avenue, which makes him a legend in my book.
I spoke on the phone to John Furman, a friend of Pat, for about twenty minutes on February 15, 2010. I thank him for an interesting conversation about his friend. I also thank Paul Thompson, who sent me informative emails about taping baseball games for Pat and getting tapes from Pat in return.
Thanks, too, to Donald from Detroit, AKA Polo Grounds 1957, whose last name I do not know and whose internet comment years ago made me aware for the first time of the name of the fellow who taped all the games that I enjoyed hearing so very much.
I also thank Pat Rispole. RIP. In my phone conversation with John Furman, John described Pat as being quiet, articulate, kind, and generous. Anyone who enjoys listening to baseball broadcasts from the 1950's and 60's should join me in thanking Pat, for he is the person most responsible for the rich audio history we have of baseball radio broadcasts from that era. I have enjoyed writing about him. I hope the readers of this blog have enjoyed learning a little about someone who did so much to preserve an important part of baseball history.
Update (4/16/10): Stan received his wish as Jennifer Gish of the timesunion.com wrote a "more detailed article about Pat and the recordings he made." Congrats to Stan and Pat.
| Designated Hitter | February 08, 2010 |
Evaluating Baseball's Managers
[Editor's Note: Chris Jaffe, writer for The Hardball Times, has written a new book, “Evaluating Baseball’s Managers.” The commentary below is the introductory essay to EBM’s Chapter 5, which is titled “Rise of the Fundamentalists, 1893-1919.”]
The importance of managers peaked at the turn of the century. They inhabited a specific period in the evolution of baseball between two crucial metamorphoses of the game. First, in the late nineteenth century, field generals like Gus Schmelz and Ned Hanlon caused the rise of the modern manager and the extinction of the old business manager. By placing a premium of the preparation of players before contests and handling strategy during them, the position of manager came into its own. A generation later, the rise of the front office diminished the manager’s position by serving as a rival power source within the franchise. Between these transformations, managerial power in the sport crested. Managers ascended into the ranks of ownership with greater frequency than at any other time in baseball history, as there were fewer steps between themselves and owners. Even those who did not own a share of the club frequently had considerable autonomy. When John McGraw became Giants manager, he told the owners which players to keep or remove from the roster, indicating who called the shots for that franchise. Not all managers wielded such authority in this era, and many held considerable power in the future, but they had their strongest opportunity to control the entire franchise at the turn of the century.
Managerial power also reached its zenith because coaching was more important in this period than any other. Old time baseball is often remembered as a glory era, when players dedicated themselves to the craft of the game in a way that modern players with their supposedly softer attitudes never could. Though this attitude is very frequent in the modern day, ideas that the old-timers were better, wiser, and more dedicated are as old as the game itself.
People look at John McGraw and his devotion to those precious fundamentals. He ordered his players come to the park to practice and work out for several hours every day, making the athletes perform precisely in accordance with his formidable will. Other managers, like Frank Chance, made a similar fervent push for sound ball. Chance’s Cubs had a well-earned reputation as the sharpest players in the league.
However, not only was the deadball era far from being the golden era of fundamentals, but the evidence used to make it seem like a Mecca of proper execution are the very facts that indicate otherwise. John McGraw did not want his players practicing constantly because they were so committed, but because those who earned a spot in major league baseball commonly displayed poor fundamentals. The book Crazy ‘08 by Cait Murphy provides an interesting window into baseball during the 1908 NL pennant race. Despite focusing on teams that diligently practiced their basics – McGraw’s Giants and Chance’s Cubs – examples of shoddy play litter the book. It was not a matter of errors; the gloves and conditions of the day made muffed grounders understandable. The problems went deeper. Virtually every game contained at least one boneheaded play that could not be blamed on the conditions. Flies landed between fielders. A base runner would be doubled off on a pop up. An outfielder would misplay a grounder for an inside-the-park home run. These plays still happen, but not nearly as often. If the Cubs and Giants played like that, imagine how the doormats played. There were also some extremely smart plays, but the floor for proper conduct was much lower in 1908.
It seems strange that teams that practiced so religiously played so poorly, but think for a second. Much of what is now received wisdom was still being worked out. In the last quarter of the nineteenth century, players slowly began figuring out how to work together, or back each other up. For example, what should a catcher do when a base runner is caught in a run-down between first and second? Where should the shortstop go when the runner on first heads for third on a single to right? People are not born knowing the answers.
Look at it from the point of view of someone born in 1879 earning a roster slot in 1900. He grew up in a world where even the best players at the highest levels were still learning the core basics. It did not trickle down to Iowa’s cornfields or Pennsylvania’s coal mines overnight. Neither TV nor radio existed to teach him how the pros acted. Odds were very good he had never seen a big league game, and may not know anyone who has. Sandlot baseball has always been self-regulating, but there is usually at least some fundamental knowledge for kids to rely on. When he starts playing semipro ball, his manager was likely another player, probably under 30 years old himself. That man hopefully has some exposure to the basics being threshed out, but that was not guaranteed. Even if the skipper had basic knowledge of fundamentals, perhaps he cannot coach well. Depending on the club’s finances, he might be a business manager. If a kid could hit or possessed a strong arm, he would receive playing time, no matter how ignorant he was of fundamentals.
Thus you end up with the following story told by baseball historian Fred Stein. In 1897, a rawboned young buck called Honus Wagner began playing for the Louisville Colonels. His manager, a not yet 25-years-old Fred Clarke, told the kid to “lay one down” in his next at bat. Instead, Wagner hit a home run. Appreciative of the result but curious as to why the rookie ignored his instructions to bunt, Clarke asked Wagner what happened. Shamefacedly, the future Hall of Famer shortstop admitted he had never heard the phrase “lay one down” before. He had no idea what his manager was talking about. This was the situation Clarke, McGraw, and Chance contended with.
Fundamentals first have to be developed. Then they diffuse. Next, their instruction becomes institutionalized. Once the lessons become second nature to one generation, the next wave can be fully and immediately immersed in them. Nowadays, high schoolers are better versed in solid fundamentals than many big leaguers a century ago. After enough years and decades go by, fundamentals are so ingrained even Little Leaguers learn them, and you assume that everyone getting paid to play the game knows them by heart. Even a poor kid from the Dominican Republic has access to more knowledgeable adults and coaches than was the case for an 1890s Wisconsin farm boy.
This might oversell the point. At SABR’s annual convention in 2007, I heard Cait Murphy talk about what she learned from researching her book, and she was surprised at how advanced the level of play sometimes was. Examples of intelligent play existed – for instance the Cubs had worked out an impressive system of defensive signals amongst each other. However, such plays coincided with embarrassing miscues, as the floor for acceptable play was quite low. A wide discrepancy existed in the quality of fundamental ball played in these years. The more advanced examples of shrewd gamesmanship were often the result of major league managers instilling those values into their charges.
This explains why coaching fundamentals mattered so much for this generation of managers. The basic ideas of how to play had been worked out, now it was a time to diligently instruct them to the players. McGraw, Chance, and their ilk focused on the fundamentals because their players so sorely lacked knowledge that these pointers could significantly improve squads.
A century later, in his bestseller Moneyball, Michael Lewis introduced the phrase “market inefficiency” to baseball fans. He argued the 2002 A’s won 103 games despite a low payroll because they realized the baseball world undervalued the importance of on-base percentage. By exploiting this gap between reality and perception, A’s GM Billy Beane made his team a winner. A century earlier, the market inefficiency was fundamentals. The best managers, such as McGraw and Chance, were those who could transform raw clumps of talent into majestic creations. One should not underestimate how important sound play was back then. In the early twentieth century some teams made 100 fewer errors a year than their rivals. Combined with improved base running, solid mental play, and all those other little things, proper fundamentals were worth many wins.
Chris Jaffe is an instructor of history and a columnist for the The Hardball Times. He lives in Schaumburg, Illinois. For more information about Chris Jaffe and Evaluating Baseball’s Managers, visit the author’s website.
| Designated Hitter | January 23, 2010 |
Baseball on the Radio in New York City in 1953
Author's Note: Ernie Harwell's birthday is January 25th. When I sat down to start writing this article last month, I had that birthday in mind as a deadline. I thank Rich for allowing me to print it here in time for time for Ernie's birthday. Happy Birthday Ernie. Listening to you broadcast a game was always a pleasure.
In 1953, a baseball fan in New York City turning the radio dial had several delightful choices. The trio of Red Barber, Connie Desmond and Vin Scully were the voices for the Dodgers; Russ Hodges and Ernie Harwell called Giant games; Mel Allen, Joe E. Brown and Jim Woods were the broadcasters for the Yankees. Never before and not since have so many excellent broadcasters congregated in one city in one season to broadcast big league baseball.
Before 1939, the three New York teams, fearful that radio play by play would curtail attendance, kept radio broadcasts out of their ballparks. There were some exceptions to the radio ban. A few opening day and other scattered games were aired. All-Star games and the World Series were broadcast on New York radio stations. However, New Yorkers were unable to hear major league baseball on a regular basis until Larry MacPhail, brought to New York from the Cincinnati Reds to take over operation of a moribund Brooklyn Dodger franchise, broke the radio blackout in 1939.
Red Barber was the first of the seven legendary broadcasters of 1953 to take the air for a New York team for a full season of games. Red's first broadcasting job, taken while he was a student at the University of Florida, was at radio station WRUF in Gainesville, Florida. During his time at WRUF, Barber was able to hear the powerful signal of Cincinnati's WLW at his home in Gainesville. Red followed that radio signal to its source to audition for a job at the radio station that has long been dubbed as "The Nation's Station" because of the wide sweep of its AM transmitter.
In 1934, Red realized his goal of a job at WLW. Powel Crosley, the owner of stations WSAI and WLW in Cincinnati, took over control of the Cincinnati Reds during the Great Depression. With a team and two radio stations, Crosley naturally looked for a broadcaster to air the games of the team he owned. There were plenty of capable broadcasters in the Cincinnati area, but the job went to the young man in Florida who had never broadcast or even seen a big league baseball game.
Red's radio work involved more than sports and baseball broadcasts. Only about twenty Reds games were broadcast on the radio in 1934, so Red worked more as a staff announcer than as a baseball broadcaster in his first year in Cincinnati. The next year Red's baseball broadcasting career blossomed. Larry MacPhail brought lights to the Reds home park in 1935, and the Reds played the Philadelphia Phillies in the first night game in major league history on May 24th. Red Barber broadcast that game over the new Mutual Broadcasting network. Red's call of the major's first night game was the first sporting event ever carried by Mutual. After the end of the regular season Red was back in the national spotlight as a broadcaster for Mutual's coverage of the 1935 World Series between the Cubs and Tigers.
Red stayed in Cincinnati until the end of the 1938 season. Powel Crosley did not want to see his talented broadcaster leave. Red was offered more money to stay in Cincinnati than he would make in Brooklyn, but the lure of greater career possibilities in New York caused Red take the Dodger job.
Mel Allen will always be remembered as the voice of the Yankees. However during his early years as a baseball broadcaster Mel was actually the voice for two major league teams, the Giants and the Yankees. After Brooklyn broke the New York radio blackout, the Yankees and the Giants in 1939 joined forces to broadcast their home games over WABC. Brooklyn broadcast its entire schedule, home and away, although road games were recreated.
The principal broadcaster for the Yankee and Giant games in 1939 was Arch McDonald, a veteran broadcaster who had done Senator games in Washington, DC. McDonald's assistant was Garnet Marks. Marks was fired early in the season, and in June of 1939, Mel Allen was hired to take his place. After the 1939 season, McDonald returned to Washington and Allen became the primary broadcaster for Yankee and Giant home games in 1940.
Like Red Barber, Mel Allen was raised in the South. At the age of fifteen Mel enrolled at the University of Alabama. After completing his undergraduate degree, he began law school, also at the University of Alabama. While in law school, Mel became the public address announcer for University of Alabama football games. Shortly before the 1935 season the radio broadcaster for University of Alabama football games quit. The P.A. announcer was transferred to the radio booth to call Alabama football and a brilliant broadcast career was born.
In 1936, Mel traveled to New York for a winter vacation. While in New York he decided to audition for a job, and he landed a staff position at CBS radio in early 1937. Allen appeared in a variety of capacities for CBS including game shows, soap operas and big band broadcasts. In 1938 Mel appeared along with France Laux and Bill Dyer for CBS radio coverage of the World Series between the Cubs and Yankees. It was the first of many World Series broadcasts for perhaps the most recognizable voice in baseball broadcasting history.
Connie Desmond was the third of the seven legendary broadcasters to arrive in New York. In 1942 Desmond was hired to work at radio station WOR. Connie began his broadcasting career in 1932 in his hometown, Toledo, Ohio. During the 1942 baseball season, Connie teamed up with Mel Allen to broadcast Giant and Yankee home games over WOR. Connie also worked at WOR in a variety of capacities, including music shows that featured his own singing.
Red Barber's assistant broadcaster, Al Helfer, went into the military after the 1942 season. Desmond met with Barber and asked for Helfer's job. Connie was hired as Barber's assistant. In 1943 the Giants and Yankees did not broadcast any of their games, so Connie and Red were the only big league broadcasters on the air in New York during the 1943 season.
After World War II, a pivotal figure in New York baseball broadcasting returned from military duty. Larry MacPhail returned to New York, but not with the Dodgers. MacPhail became a co-owner of the Yankees and once again he brought change to baseball broadcasting in New York. MacPhail was not satisfied with the broadcasting partnership between the Giants and Yankees. In 1946, the Yankees began broadcasting all their games, home and away, on WINS. Mel Allen, also out of the military, returned as the principal Yankee broadcaster. The Giants hired Jack Brickhouse as their primary broadcaster in 1946. For the first time, all three New York teams were on the radio for a complete season of home and away games.
Russ Hodges was the fourth of the legendary broadcasters to reach New York. In 1946, Russ was hired to assist Mel Allen on Yankee broadcasts. Before taking the Yankee job, Hodges broadcast for the Cubs and White Sox in Chicago, and for the Senators in Washington, DC. Like Allen, Russ Hodges was a law school graduate. Hodges stayed with the Yankees until the Giants hired him to be their primary broadcaster for the 1949 season.
Ernie Harwell arrived in New York during the 1948 season to broadcast for the Brooklyn Dodgers. Ernie began his baseball career at an early age. When he was five years old he was a bat boy for visiting teams of the minor league Atlanta Crackers. At the age of sixteen, Ernie became the Atlanta correspondent for the "Baseball Bible," the Sporting News. Harwell began his broadcasting career at WSB in Atlanta in 1940 after graduating from Emory University. Ernie broadcast Atlanta Cracker games before the war, and after being discharged from the Marines, he resumed his baseball broadcasting career with the Crackers in 1946.
Ernie was brought to New York to fill in for an ailing Red Barber during the 1948 season. That year, the Dodgers began live broadcasts of their road games. Red Barber became severely ill with a bleeding ulcer during a Dodger road trip. Connie Desmond took over as the sole broadcaster for the Dodgers while Dodger management sought a replacement for Red. The Dodgers looked to Atlanta and the talented Harwell to fill in during Red's illness. However, Ernie was under contract to the Crackers, so Ernie's boss in Atlanta, Earl Mann, needed to be compensated for losing his play by play broadcaster. For the only time in major league history, a team traded a player for a baseball broadcaster when the Dodgers shipped minor league catcher Cliff Dapper to Atlanta for the services of play-by-play broadcaster Ernie Harwell.
Ernie remained with Red Barber and Connie Desmond through the end of the 1949 season. Ernie left the Dodgers to join Russ Hodges in broadcasting New York Giant games in 1950. To the delight everyone who has had a chance to listen to him during the past sixty years, Red Barber chose Vin Scully to replace Ernie in the Dodger broadcast booth.
Vin Scully graduated from Fordham in 1949. While he was in college he worked at the campus FM station and also played the outfield on the varsity baseball team. Vin sent letters to radio stations up and down the Eastern seaboard in search of a broadcasting job after graduation. He landed a temporary job as a summer replacement announcer in Washington, DC for the CBS affiliate, WTOP. Management at WTOP appreciated his talent, but at the end of the summer, they had no permanent job for him. Vin left Washington with a promise of a future job at WTOP, but no immediate employment.
Vin returned to his home in New York and contacted CBS radio in search of a job. Vin was able to meet with Ted Church, who was director of CBS radio news. Church had no job for him, but he did introduce Vin to Red Barber, who in addition to being the Dodger play-by-play broadcaster, was the director of sports for CBS radio. Red had no job to offer, though he was favorably impressed after talking with the youngster.
One of Red's primary duties as director of sports for CBS radio was selecting broadcasters to go to various college games throughout the country for the CBS college football roundup show. Luckily for Vin, in 1949 Red was unable to find a broadcaster for the Boston University-University of Maryland football game played at Boston's Fenway Park. Red remembered the young man he had met at CBS headquarters in New York and arranged for Vin to fill in at the last minute in Boston. Vin's performance impressed Red enough to give the youngster another assignment on the football roundup and a chance to be a major league broadcaster for the Dodgers.
Vin joined the Dodger broadcast booth after an eventful meeting with Red Barber and Branch Rickey that took place after Red returned to New York from a 1949 college football broadcast on the West coast. In an interview with author Ted Patterson for the splendid book, The Golden Voices of Baseball, Vin recalled the terms of his employment: "The agreement reached was that I would go to spring training on a one-month option. Either I make it, or they could lose me in the Everglades."
Jim Woods was the last of the seven legendary broadcasters to reach New York. In 1953, Jim teamed with Mel Allen to broadcast Yankee games. Joe E. Brown joined Woods and Allen for some Yankee broadcasts, but Brown primarily worked on the Yankee pre- and post-game shows. Woods had an eventful career before he arrived in New York. Jim replaced Ronald Reagan as the football radio voice of the Iowa Hawkeyes in 1939. After spending four years in the military during World War ll, Woods eventually landed in Atlanta where he replaced Ernie Harwell after Ernie left the Crackers to broadcast for the Brooklyn Dodgers. Woods followed Ernie's path to New York as a major league broadcaster in 1953.
The seven splendid broadcasters were together in New York for just one season. Ernie Harwell left the Giants to become the principal broadcaster for the Baltimore Orioles in 1954. Harwell's departure was not the only shift in the New York baseball broadcasting landscape. After the 1953 season, Red Barber left the Dodgers to join Mel Allen and Jim Woods in the Yankee broadcast booth.
Vin Scully and Connie Desmond continued as Dodger broadcasters in 1954. However, Connie missed some games because of alcoholism. In 1955, the only year Brooklyn won the World Series, Connie was gone from Dodger broadcasts. Dodger owner Walter O'Malley gave Connie a last chance to continue his career in 1956, but when Connie began drinking again, he was replaced for good by Jerry Doggett before the end of the season.
The Yankee broadcast team of Mel Allen, Jim Woods and Red Barber stayed together until the end of the 1956 season. Phil Rizzuto, whose Yankee playing career ended in 1956, was hired to replace Woods as a Yankee broadcaster. Woods was able to stay in New York by shifting to the Giants broadcast booth in 1957.
The departure of the Brooklyn Dodgers and New York Giants for Los Angeles and San Francisco after the 1957 season forever changed the face of baseball and baseball broadcasting in New York. Vin Scully and Russ Hodges relocated with their teams to the West coast. Remarkably, in 2010, Vin will begin his 61st consecutive season as a Dodger broadcaster. After the 1957 season, Jim Woods departed New York for Pittsburgh, where he teamed with Bob Prince to form one of the best play-by-play tandems in the history of baseball broadcasting.
In 1964, Mel Allen was fired by the Yankees. Mel broadcast for the Atlanta Braves and Cleveland Indians after leaving New York. Mel returned to the Yankees as a cable-TV announcer for SportsChannel in 1978. His primary fame though after 1964 was as the voice for the popular TV show, This Week in Baseball. TWIB with Mel Allen was on the air for seventeen terrific years.
Red Barber, the man who in 1939 was the first broadcaster for a New York team, was the last of the seven legendary broadcasters of 1953 to broadcast for a team in New York. After the 1966 season Red was fired by the Yankees. In the last years before his death, Red returned to radio as a regular guest of Bob Edwards on NPR's Morning Edition.
Sources:
Sports on New York Radio: A Play by Play History by David J. Halberstam is an absolute gem for anyone interested in the history of sports broadcasting. Ted Patterson's Golden Voices of Baseball is rich in pictures and commentary about the history of baseball broadcasting. The book includes two CD's containing excerpts of the author's interviews with various broadcasters. Both books are well worth their purchase price.
Also useful in this article were interviews of Vin Scully and Red Barber broadcast on Larry King's radio show for Mutual in 1982. A partial transcript of the King-Barber interview is available at Dodger Thoughts. I also used material from a radio program produced by a Cincinnati NPR station that was narrated by Marty Brennaman. The CD is available for purchase through the Cincinnati radio station's internet site.
Ross Porter's essay about Ernie Harwell, gives some details about Ernie's life that I included in my article. Also, Ernie has an audio scrapbook that is rich in information and is a delight to hear. It is available for purchase on the internet.
Some of the material about Mel Allen was taken from Mel's obituary in the New York Times. The obit from the New York Times is online. There are a few errors in the obituary though. Also helpful was a taped interview of Mel done by baseball broadcast historian Curt Smith.
Stan Opdyke grew up on the East Coast listening to baseball on the radio. He still prefers baseball on the radio (if the broadcasters are good) to baseball on TV.
| Designated Hitter | January 18, 2010 |
Comparing the Performance of Baseball Bats
The game of baseball as played today at the amateur level is very different from the game I played growing up in Rumford, Maine in the early 1960s. In my youth, wood bats ruled. Nowadays, almost no one outside the professional level uses wood bats, which have largely been replaced by hollow metal (usually aluminum) or composite bats. The original reason for switching to aluminum bats was purely economic, since aluminum bats don’t break. However, in the nearly 40 years since they were first introduced, they have evolved into superb hitting instruments that, left unregulated, can significantly outperform wood bats. Indeed, they have the potential of upsetting the delicate balance between pitcher and batter that is at the heart of the game itself. This state of affairs has led various governing agencies (NCAA, Amateur Softball Association, etc.) to impose regulations that limit the performance of nonwood bats. The primary focus of this article is on the techniques used to measure and compare the performance of bats.
Any discussion of bat performance needs to begin with a working definition of the word “performance.” Or, said a bit differently, what is meant by the statement, “bat A outperforms bat B”? Among people who have thought about this question, a consensus has emerged that a good working definition of performance is batted ball speed (or simply BBS). Generally speaking, if you want to improve your chances of getting a hit, then you want to maximize BBS, regardless of whether you are swinging for the fences or just trying to hit a well-placed line drive through a hole in the infield. The faster the ball comes off the bat, the better are your chances of reaching base safely. So, we will say that bat A outperforms bat B if the batter can achieve higher BBS with bat A than with bat B.
Which then brings up the next question: What does BBS depend on? I answer that by writing down the only formula you will find in this article:
This “master formula” is remarkably simple in that it relates the BBS to the pitch speed, the bat speed, and a quantity q that I will discuss shortly. It agrees with some of our intuitions about batting. For example, we know that BBS will depend on the pitch speed, remembering the old adage that `'the faster it comes in, the faster it goes out.'' We also know that a harder swing—i.e., a larger bat speed--will result in a larger BBS. All the other possible things besides pitch and bat speed that BBS might depend on are lumped together in q, which I will call the “collision efficiency.” As the name suggests, q is a measure of how efficient the bat is at taking the incoming pitch, turning it around, and sending it along its merry way. It is an important property of a bat. All other things equal, when q is large, BBS will be large. And vice versa. For a typical 34-inch, 31-oz wood bat impacted at the “sweet spot” (about 6 inches from the tip), q is approximately 0.2, so that the master formula can be written BBS = 0.2*(pitch speed) + 1.2*(bat speed). This simple but elegant result tells us something that anyone who has played the game knows very well, at least qualitatively. Namely, bat speed is much more important than pitch speed in determining BBS. Indeed, the formula tells us that bat speed is six times more important than pitch speed, a fact that agrees with our observations from the game. For example, we know that a batter can hit a fungo a long way (with the pitch speed essentially zero) but cannot bunt the ball very far (with the bat speed zero). Plugging in some numbers, for a pitch speed of 85 mph (typical of a good MLB fastball as it crosses home plate) and a bat speed of 70 mph, we get BBS=101 mph, which is enough to carry the ball close to 400 ft if hit at the optimum launch angle. Each 1 mph additional pitch speed will lead to about another 1 ft, whereas an extra 1 mph of bat speed will result in another 6 ft. On the other hand, if the bat were a “hotter bat” with q=0.22, that would add 3 mph to BBS, adding a whopping 18 ft to a long fly ball.
The master formula tells us that the quantities that determine bat performance are the collision efficiency and the bat speed, leading us to ask our next question. What specific properties of a bat determine its bat speed and collision efficiency? There are two such properties: the ball-bat coefficient of restitution (BBCOR) and the moment of inertia (MOI). In the following paragraphs, I’ll explain what these properties are and how they contribute to bat performance. The interplay among the various quantities is shown schematically in the picture below.
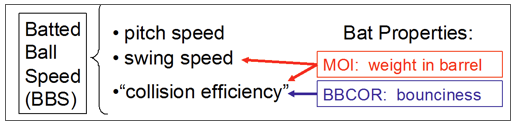
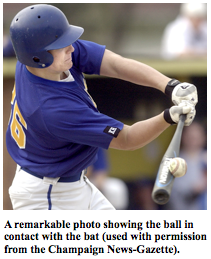 Let’s start with the BBCOR, which is a measure of the “bounciness” of the ball-bat collision. First a brief digression. During a high-speed ball-bat collision, the ball compresses by about 1/2 of its natural diameter and sort of wraps itself around the bat, as shown in the accompanying photo. It then expands back out again, pushing against the bat. During this process, much of the initial energy of the ball is converted to heat due to the friction from the rubbing of threads of yarn against each other. Try dropping a baseball onto a hard rigid surface, such as a solid wood floor. The ball bounces to only a small fraction of its initial height, reflecting the loss of energy in the collision with the floor. A wood bat with its solid barrel behaves more or less like a rigid surface. But a hollow aluminum bat is different since it has a thin flexible wall that can “give” when the ball hits it. Some of the ball’s initial energy that would otherwise have gone into compressing the ball instead goes into compressing the wall of the bat. The more flexible the wall, the less the ball compresses and therefore the less energy lost in the collision. This process is commonly called the “trampoline effect,” and the BBCOR is simply a quantitative measure of that effect. A wood bat has essentially no trampoline effect and has a BBCOR ≈ 0.50. Hollow bats can have a substantially larger BBCOR, leading to a larger q and a correspondingly larger BBS. For example, a bat with BBCOR = 0.55 will have about a 5 mph larger BBS. Indeed, the technology of making a modern high-performing bat is aimed primarily at improving the trampoline effect—i.e., increasing the BBCOR and consequently the BBS. For aluminum this is achieved by developing new high-strength alloys that can be made thinner (to increase the trampoline effect) without denting. The past decade has seen the development of new composite materials that increase the barrel flexibility beyond that achievable with aluminum, giving rise to a new generation of high-performing bats.
We now turn to the MOI, which depends on both the weight of the bat and the distribution of the weight along its length. For a given weight, the MOI is largest when a larger fraction of the weight is concentrated in the business end of the bat (i.e., the barrel). The MOI affects bat performance in two ways in that both q and the bat speed depend on it. A larger MOI means a larger q (and vice versa), in complete agreement with our intuition. A heavier bat will be more efficient than a light bat in transferring energy to the ball. But, contrary to popular belief, it is not the total weight of the bat that matters but rather the weight in the barrel, where the collision with the ball occurs. That’s why it is the MOI that matters and not just the weight. But a larger MOI also means that the bat won’t be swung as fast, which again agrees with our intuition. Once again, research has shown that it is the MOI of the bat and not just the weight that affects swing speed.
The fact that the MOI affects bat performance in two opposite ways raises an interesting question. If I have two bats with the same BBCOR but with different MOI, which one will have the larger BBS? For example, if I “cork” a wood bat, which reduces its MOI, will the resulting increase in swing speed compensate for the reduction in collision efficiency? Current research suggests that the answer is “no” and that corking a bat does not lead to a larger BBS. For a detailed account, see this article. By the way, corking a wood bat does have some important advantages, even though higher BBS is not one of them. By reducing the MOI, the batter will have a “quicker” and more easily maneuverable bat, allowing him to wait a bit longer on the pitch and to make adjustments once the swing has begun. So, although corking a bat may not lead to higher BBS, it certainly may lead to better contact more often.
For bats of a given length and weight, the MOI will generally be smaller for an aluminum bat than for a wood bat. After all, a wood bat is a solid object, so a larger fraction of its weight is concentrated in the barrel than for a hollow nonwood bat. Here is another simple experiment you can do. Take two bats of the same length and weight (e.g., 34”, 31 oz), one wood and one aluminum, and find the point on the bat where you can balance it on the tip of your finger. You will find that the balance point is farther from the handle for the wood bat than for the aluminum bat, showing that a larger concentration of the weight is in the barrel for the wood bat. However, keeping in mind the corked bat discussion, the lower MOI for an aluminum bat results in no net advantage or disadvantage for BBS. The real advantage in BBS of aluminum over wood is in the BBCOR (i.e., the trampoline effect).
Let’s talk briefly about how bat performance is measured in the laboratory. Details can be found at this web site. Briefly, the basic idea is to fire a baseball from a high-speed air cannon at speeds up to about 140 mph onto the barrel of a stationary bat that is held horizontally and supported at the handle. Both the incoming and rebounding ball pass through a series of light screens, which are used to measure accurately its speed. The collision efficiency q is the ratio of rebounding to incoming speed. The MOI is measured by suspending the bat vertically and allowing it to swing freely like a pendulum while supported at the handle. The MOI is related to the period of the pendulum. Once q and the MOI are known, these can be plugged into a well-established formula to determine the BBCOR. To calculate BBS, the master formula is used along with a prescription for specifying the pitch and bat speeds, the latter of which will depend inversely on the MOI.
Various organizations use this information in different ways to regulate the performance of bats. The Amateur Softball Association regulates BBS, using laboratory measurements of q and MOI along with the prescriptions noted above to calculate BBS using the master formula. For the past decade, the NCAA has regulated baseball bats by requiring that q is below some maximum value and the MOI is above some minimum value, the latter limiting the swing speed. Together the upper limit on q and lower limit on the MOI effectively limit the maximum BBS. The maximum q is set to be the same for nonwood as for wood. The lower limit on MOI is such that the best-performing nonwood bat outperforms wood by about 5 mph. You may have seen the words “BESR Certified” stamped on NCAA bats. The BESR is shorthand for the Ball Exit Speed Ratio; numerically, BESR = q + 1/2. Starting in 2011, the NCAA will instead regulate the BBCOR, taking advantage of the fact that for bats of a given BBCOR, the BBS does not depend strongly on MOI. Moreover, the NCAA has set the maximum BBCOR to be right at the wood level, so it is expected that nonwood bats used in NCAA will perform nearly identically to wood starting next year.
Alan Nathan has been a Professor of Physics at the University of Illinois since 1977. His research specialty is experimental nuclear/particle physics, with over 80 publications in scientific journals to his credit. He is a Fellow of the American Physical Society. For the last decade he has added the physics of baseball to his research portfolio and has written numerous papers on the subject for scientific journals, primarily on the physics of the ball-bat collision and the aerodynamics of baseball in flight. In addition, he has given many talks on the subject to both scientific and popular audiences and maintains a "physics of baseball" web site that is visited frequently. He is Chair of SABR's Baseball & Science Committee and a member of the scientific panel that advises the NCAA on issues related to bat performance.
| Designated Hitter | December 28, 2009 |
Edgar Martinez and the Hall of Fame
Edgar Martinez is listed for the first time on this year’s Hall of Fame ballot. While Martinez is a very long shot for actually earning 75% of the writers’ votes in his first year of eligibility, I believe that Martinez meets the historical standards for Hall of Fame entry and should earn one’s vote.
Evaluating Edgar Martinez’ career presents some fairly unique challenges.
- Martinez played the majority of his career at DH, eventually finishing third behind Harold Baines and Hal McRae in career games played at DH. How do we evaluate a player who made no defensive contributions for most of his career?
- If one votes for Edgar Martinez, does that open the door for too many other candidates, such as Fred McGriff who also makes his debut on this year’s Hall of Fame ballot?
- Martinez had a somewhat short overall career compared to other Hall of Fame caliber players. How does he compare to position players with roughly comparable career length?
- Even measuring Martinez’ offensive contributions can be a bit tricky because he excelled at getting on-base and hitting doubles during an era better known for home run hitting.
Let’s start with that last challenge, and then we’ll work our way backwards through the remaining challenges.
First a Detour: wOPS+
I love using the OPS+ statistic (called adjusted on-base + slugging percentages) compiled at www.baseball-reference.com. It does most of the heavy lifting for us since it is adjusted for ballpark effects and the offensive context of the league and year. It’s readily accessible, because one can easily sort and filter based on it. The scale is also easy to grasp: 100 is average, and OPS+ scores above 100 are better than average.
The problem with OPS+ is that using on-base percentage plus slugging percentage just isn’t very accurate to start with. On-base percentage is considerably more important for creating runs. How much more important? Well, there’s no need to reinvent the wheel here. Tom Tango wrote recently that one can greatly improve OPS+ by weighting the on-base percentage by 1.2 and the slugging percentage by 0.8. We’ll call it weighted OPS+ or wOPS+. To be precise, we’ll define it as:
This will give us a statistic adjusted for offensive levels and home ballpark, is an accurate reflection of offensive contributions toward creating runs, and is still fairly easy to compute. We use just four pieces of input data, all of which are readily available in the Special Batting section of player batting data on baseball-reference.com.
We’ve got our shiny new hammer. Now let’s go find some nails.
Edgar’s Moderately Short Career
One objection to Edgar Martinez’ possible Hall of Fame credentials is that his career was a bit short by Hall of Fame standards. Martinez totaled 8,672 plate appearances, which isn’t too short. Let’s look at those with 7,500 – 9,500 plate appearances who played since 1901 and see where Martinez’ career batting quality ranks among those with similar career lengths.
| Name | wOPS+ |
|---|---|
| Rogers Hornsby | 171 |
| Mark McGwire | 157 |
| Manny Ramirez | 152 |
| Joe DiMaggio | 149 |
| Jeff Bagwell | 147 |
| Edgar Martinez | 147 |
| Harry Heilmann | 145 |
| Jim Thome | 145 |
| Alex Rodriguez | 144 |
| Jason Giambi | 142 |
| Chipper Jones | 142 |
| Willie Stargell | 141 |
| Brian Giles | 139 |
| Mike Piazza | 139 |
| Larry Walker | 137 |
| Duke Snider | 137 |
| Arky Vaughn | 136 |
| Norm Cash | 136 |
| Will Clark | 136 |
| Jack Clark | 136 |
These are the best batters in baseball history with career lengths roughly similar to Edgar Martinez’ career length. Obviously, it includes active players, with statistics through 2009, many of whom will retire with longer careers but with somewhat lower wOPS+ as they complete their decline phases.
Where’s the cutoff between the Hall of Famers and the non-Hall of Famers? If we ignore steroid problems, everyone above Brian Giles appears to be a Hall of Famer, although others may read the data differently. Jason Giambi’s Hall of Fame credentials are questionable, but he had a very high peak, with three consecutive top 5 MVP ballot finishes.
Below Brian Giles on that last table, one can still be a clear Hall of Famer by batting well and playing a premium defensive position, such as Piazza and Vaughn did, but we start to enter a gray area. There are many, many Hall of Famers below the top twenty that I listed, but it’s a dicey proposition the further down one goes. Incidentally, new Hall of Famer Jim Rice has a career wOPS+ of 124 on this list, not that he represents the dividing line between whether a guy comfortably fits into the Hall of Fame.
Edgar ranks sixth, surrounded by Hall of Fame caliber players. Here’s our starting point, that Edgar Martinez had a Hall of Fame caliber career based on the quality of his batting.
Edgar versus Crime Dog
Another worthy objection to letting Edgar Martinez into the Hall of Fame is that we end up with far too many modern batters in the Hall. Edgar wasn’t really that special, right? For example, looking just at the newcomers for next year’s 2010 ballot, if one votes for Edgar, doesn’t one first have to vote for Fred McGriff?
Not necessarily.
Comparing career wOPS+ totals shows a clear advantage to Martinez. However, now that we are comparing McGriff, a guy with a much longer career, that may not be a fair comparison. Edgar had an unusual career progression, with his early years spent clobbering minor league pitching and a short decline phase at the end of his career. Let’s instead look at individual years to see, in their best seasons, which player was a better batter. Here are all of their seasons where they had enough plate appearances to qualify for the batting title (502 in most years, but less for 1994-95 due to shortened seasons):
| Name | Year | wOPS+ |
|---|---|---|
| Edgar Martinez | 1995 | 184 |
| Edgar Martinez | 1997 | 166 |
| Edgar Martinez | 1996 | 166 |
| Fred McGriff | 1989 | 163 |
| Fred McGriff | 1992 | 161 |
| Edgar Martinez | 1992 | 161 |
| Edgar Martinez | 2001 | 160 |
| Edgar Martinez | 1998 | 157 |
| Edgar Martinez | 2000 | 155 |
| Edgar Martinez | 1999 | 153 |
| Fred McGriff | 1988 | 152 |
| Fred McGriff | 1994 | 151 |
| Fred McGriff | 1990 | 150 |
| Fred McGriff | 1991 | 146 |
| Edgar Martinez | 2003 | 142 |
| Fred McGriff | 2001 | 141 |
| Fred McGriff | 1999 | 140 |
| Edgar Martinez | 1991 | 139 |
| Fred McGriff | 1993 | 139 |
| Edgar Martinez | 1990 | 134 |
| Fred McGriff | 2002 | 122 |
| Edgar Martinez | 1994 | 121 |
| Fred McGriff | 1995 | 118 |
| Fred McGriff | 1996 | 117 |
| Fred McGriff | 1998 | 112 |
| Fred McGriff | 2000 | 110 |
| Fred McGriff | 1997 | 106 |
| Edgar Martinez | 2004 | 95 |
I don’t know whether Fred McGriff will eventually be in the Hall of Fame or not, but this table rather clearly shows that Edgar was the better hitter, with 8 of the 10 best seasons between the two of them. Martinez shouldn’t have to wait in line behind McGriff on anyone’s Hall of Fame ballot.
Stop Ignoring the 600-Pound Gorilla in the Room!
Probably the biggest objection to voting Edgar Martinez into the Hall of Fame is one that I’ve ignored so far: he spent the bulk of his career as a designated hitter.
How much is a player with no defensive value worth? According to Tom Tango’s positional adjustments, which are used for the Win Value metrics on Fangraphs.com, a DH is 22.5 runs per season worse than the average non-DH position player. However, Tango added back in another 5 runs for the difficulty of batting as a DH, resulting in a -17.5 runs per season positional adjustment.
What is so difficult about being a DH? It’s a little bit like having to be a permanent pinch hitter, and we all recognize that it is more difficult to perform well as a pinch hitter coming in cold off the bench. As summarized on p. 113 of The Book by Tango, Lichtman and Dolphin:
Players also lose effectiveness when being used as a designated hitter; the DH penalty is about half that of the PH penalty. This does vary significantly from player to player – some players hit as well as a DH as they do otherwise, while others perform as badly as pinch hitters.
So there can be a unique skill at batting well as a DH.
The result is that an average DH is worth about five runs per season less than an average fielding first baseman. Yes, that’s a disadvantage, but it isn’t huge. A DH can be more valuable than a below average first baseman with comparable batting statistics because the difficulty of batting as a DH partially offsets the defensive value of a below average fielding first baseman.
Being a DH is a negative marker for a Hall of Fame candidate, but, viewed rationally, it shouldn’t be an impossible hurdle.
Comparing Edgar to Other DHs
Perhaps the easiest way to evaluate Edgar is to just compare him to other DHs. We have to have some designated hitters in the Hall of Fame, right? Paul Molitor is already there and a plurality of his games played, including most of his best seasons, were when Molitor played primarily as a DH. Frank Thomas played over half of his career as a DH and he’ll be in the Hall eventually. It’s not unreasonable to think that we ought to have a couple of Hall of Fame DHs considering that the American League has had designated hitters since 1973, a span of over 35 years.
So here’s a list of the top 20 seasons for designated hitters, again using our wOPS+ rate statistic:
| Name | Year | wOPS+ |
|---|---|---|
| Edgar Martinez | 1995 | 184 |
| Frank Thomas | 1991 | 180 |
| David Ortiz | 2007 | 169 |
| Edgar Martinez | 1997 | 166 |
| Edgar Martinez | 1996 | 166 |
| Travis Hafner | 2005 | 164 |
| Milton Bradley | 2008 | 163 |
| Frank Thomas | 2000 | 160 |
| Edgar Martinez | 2001 | 160 |
| Travis Hafner | 2004 | 159 |
| Travis Hafner | 2006 | 159 |
| Edgar Martinez | 1998 | 157 |
| Manny Ramirez | 2001 | 157 |
| David Ortiz | 2006 | 157 |
| Edgar Martinez | 2000 | 155 |
| Rafael Palmeiro | 1999 | 154 |
| David Ortiz | 2005 | 153 |
| Edgar Martinez | 1999 | 153 |
| Hal McRae | 1976 | 153 |
| Jim Thome | 2006 | 152 |
These are very fine seasons. You may remember that Milton Bradley led the American League in raw OPS in 2008, yet his season ranks only seventh on this list.
I don’t have any trouble eyeballing this list and concluding that Edgar Martinez has had the best career as a DH of any player in history so far. The best DH in history is not Hall of Famer Paul Molitor, nor future Hall of Famer Frank Thomas. It’s not Harold Baines, the longevity leader, or David Ortiz, the popular current star at DH. It’s Edgar Martinez.
That’s a Hall of Famer.
Other Considerations
According to the Hall of Fame:
Voting shall be based upon the player's record, playing ability, integrity, sportsmanship, character, and contributions to the team(s) on which the player played.
As far as integrity, sportsmanship and character go, let’s point out that Edgar Martinez was once honored with the Roberto Clemente Award for charitable contributions to his community. I also am unaware of any claims that Martinez used performance-enhancing drugs, for those inclined to go there. I don’t see much room for debate: character issues will not hurt Martinez’ candidacy.
While I would be surprised if the BBWAA membership agrees with me, in my opinion, Edgar Martinez is a Hall of Fame caliber player and should be voted in.
Michael Weddell is one of the Research & Analysis columnists for the fantasy baseball website www.BaseballHQ.com and a contributor to Ron Shandler’s Baseball Forecaster: 2010 Edition. Michael roots for the Tigers with his wife and adult children in metropolitan Detroit.
| Designated Hitter | December 17, 2009 |
100 Things Dodgers Fans Should Know & Do Before They Die
[Editor's note: In conjunction with Stan Opdyke's guest column on Connie Mack and Vin Scully, author Jon Weisman has granted us permission to publish "Vin," the number two item in 100 Things Dodgers Fans Should Know & Do Before They Die. As a lifelong Dodgers fan, Jon has listened to Scully broadcast games for four decades. In his wonderful book, he covers (among other topics) Vin, Jackie, 32, Fernandomania, Ebbets Field, The Move, Coliseum Carnival, Chavez Ravine, 'The Worst Club Ever to Win a World Series,' Walter Alston, Campy, Piazza, Dodger Dogs, Roseboro & Marichal, Arrive Late/Leave Early, Branch Rickey, Dodgertown, Nightline, The First High Five, and a section on Maury Wills that Weisman aptly named 'Go. Go. Go. Go. Go' after the chant that I can remember echoing throughout Dodger Stadium in 1962 when I was seven years old. This book is not only a must own for Dodgers fans but an entertaining and enjoyable read for baseball fans in general.]
He’s an artist. Of course he’s an artist. You don’t need a book to tell you that, to tell you that the man could broadcast paint drying and turn it into something worthy of Michelangelo, to tell you that his voice is a cozy quilt on a cold morning, a cool breeze on a blistering day; that he’s more than someone you listen to, that he’s someone you feel.
But saying he’s an artist is not meant as a cliché or as a convenient way to sum him up. It’s meant to stress that spoken words at a baseball game are themselves an art form, and, sure, sometimes they’re the equivalent of dogs playing poker, but when Vin Scully strings words together (and he’s done so at Dodger games — extemporaneously, mind you — for 25,000 hours or more), they’ll carry you away on wings.
If it weren’t so satisfying, it could make you weep.
 But it’s not as if Scully – and at this point, it’s hard to resist referring to him by his first name, so vital and personal is the Dodger fan’s relationship with him – sets out to construct pieces for the Smithsonian. His principal goal has always only to simply tell you what’s going on. He’ll never miss a pitch. He will make a mistake here and there, and in that respect he’s like everyone else on the planet. But he never, ever loses sight of his task.
He is prepared with background on the players and the teams he covers. He has a knack for sifting out what’s interesting about the men on the field, and an infectious childlike enthusiasm for what he discovers. Reflecting his desire not to leave any listeners or viewers in the dark, he’ll repeat stories on different nights of the same series, but as long as you know that’s part of the deal, there’s no issue.
“One of the biggest reasons that I prepare is because I don’t want to seem like a horse’s fanny, as if I’m talking about something I don’t know,” Scully said in an interview. “So in a sense you could say I prepare out of fear. That’s really what you do. I think I’ve always done that since grammar school.”
That may be equal parts humility and truth. Scully’s utter genius, however, is the way he reacts when the moment takes him beyond preparation, the way he offers the lyrical when other broadcasters remain stuck in the trite. He offers bon mots covering pedestrian occurrences: Who else could deliver baseball play-by-play’s timeless philosophical comment: “Andre Dawson has a bruised knee and is listed as day-to-day. … Aren’t we all?” His work during Sandy Koufax’s perfect game, Hank Aaron’s 715th home run, Bill Buckner’s error and everything in between are all unforced majesty.
As far as rising to the occasion, Scully’s landmark call of Kirk Gibson’s showstopping, history-making homer in Game 1 of the 1988 World Series was practically its equivalent from a broadcasting perspective, minus the gimpiness. “In a year that has been so improbable, the impossible has happened” ranks with Al Michaels’ “Do you believe in miracles? Yes!” among the most memorable lines in sportscasting history for spontaneously summing up a moment. And yet, could anyone have been less surprised that Scully came up with such a wonderful remark? His broadcasts have been dotted with them ever since he joined the Brooklyn Dodger broadcast team in 1950 as a recent Fordham college graduate who had been singularly dreaming of such a job since boyhood.
“When I was 8 years old, I wrote a composition for the nuns saying I wanted to be a sports announcer,” Scully said. “That would mean nothing today – everybody watches TV and radio – but in those days, back in New York the only thing we really had was college football on Saturday afternoons on the radio. Where the boys in grammar school wanted to be policemen and firemen and the girls wanted to be ballet dancers and nurses, here’s this kid saying, ‘I want to be a sports announcer.’ I mean it was really out of the blue.
“The big reason was that I was intoxicated by the roar of the crowd coming out of the radio. And after that one thing led to another, and I eventually got the job as third announcer in Brooklyn. And I never thought about anything except the first year or two not making some terrible mistake is all. I worked alongside two wonderful men in Red Barber and Connie Desmond, but I never thought about becoming great. … All I wanted to do was do the game as best I could. And to this day that’s all I think about.”
Lots of people try to do their best, and for that they all deserve praise. But the best of some is better than the best of others, and even though he can’t bring himself to say it, we know into which of those categories Scully fits. Regardless of how intense or carefree one’s love for the game might be, Scully measures up to it and redoubles it. The Dodgers’ play-by-play man is an American Master.
Jon Weisman is the founder and writer of the Los Angeles Times blog Dodger Thoughts, the leading website providing commentary on the Los Angeles Dodgers. For more than 20 years, he has written for the Los Angeles Times, Los Angeles Daily News, SportsIllustrated.com, The Hardball Times, and other publications about baseball and virtually every other high school, college and professional sport. He has also written live-action and animation television scripts for shows including So Weird, W.I.T.C.H., Starship Troopers, Men in Black, and Disney's Hercules, and is currently Associate Editor, Features for Variety. A holder of degrees from Stanford and Georgetown, Weisman lives in Los Angeles with his wife and three children.
| Designated Hitter | December 17, 2009 |
Connie Mack and Vin Scully
At an inconsequential Spring Training game in Florida in 1950 the torch was passed. In the broadcast booth for the Brooklyn Dodgers was a nervous youngster who at the ripe old age of 22 was about to begin his big league broadcasting career. On the field below him was a very old man who was about to begin his final year in major league baseball. The old man stepped down as manager of the Philadelphia A's after that season. Sixty years later, the young man in the broadcast booth is still the broadcaster for the Dodgers.
The major league careers of Connie Mack and Vin Scully intersected at the midpoint of the 20th century. Connie Mack was born Cornelius Alexander McGillicuddy in 1862, before the Emancipation Proclamation was issued, at a time when Abraham Lincoln was President and America was engaged in the Civil War. Today, Vin Scully is broadcasting for the Los Angeles Dodgers at a time when a black man is President.
Connie Mack began his major league career in 1886 as a catcher for the Washington Senators of the National League. He played with the Senators for four seasons. In 1890, Connie, along with many of his fellow players, bolted the National League to form the Players League. Unfortunately for Connie and his fellow players, the Players League folded after just one season.
In 1891, after the demise of the Players League, National League owners assigned Connie's contract to Pittsburgh. During the 1894 season Connie took over as playing manager for the Pirates. After a poor finish in 1896, Connie was fired by the Pittsburgh owner.
Connie's dismissal proved to be a blessing. In 1897, Connie left the National League to join Ban Johnson's Western League as a manager, part-time player, and part owner of the Milwaukee franchise. When Johnson transformed his Western League into the American League at the turn of the century, Connie Mack was poised to resume his major league career, this time as a manager and an owner.
In 1901, Ban Johnson sent Connie to Philadelphia to establish an American League franchise in that city. Connie built a strong team and in 1905 his Philadelphia Athletics played and lost in the World Series to John McGraw's New York Giants. Connie's teams remained powerful through the 1914 season. When the A's lost the 1914 World Series to Boston's "Miracle Braves," Connie jettisoned the team he had developed, much like the Florida Marlins would do after the 1997 World Series. Like the Marlins, the Philadelphia A's sank to the bottom of the standings.
In the mid-1920s, Connie began building a team to rival the accomplishments of his earlier championship A's teams. In the latter part of the roaring 20s and the early years of the Great Depression, Connie's A's defeated powerful New York Yankee teams that featured Babe Ruth and Lou Gehrig. The Great Depression led Connie to dismantle his team. Once more, the Philadelphia A's went to the bottom of the American League standings.
Connie was unable to build another championship team; the A's did not win another World Series title until the franchise shifted to Oakland. Connie Mack remained as manager of the Philadelphia A's throughout all the last place finishes the franchise endured. No doubt Connie's ownership of the team saved him from the fate that inevitably befalls managers of losing franchises.
Age and infirmity caused Connie to step down as manager after the 1950 season. Shortly thereafter, amid rising debt, the Mack family lost control of the franchise. The team relocated to Kansas City after the 1954 season.
As Connie Mack's career was coming to a close, Vin Scully began an amazing broadcasting career that is still in progress today. Vin attended college at Fordham and worked on the campus FM radio station. After graduation, in search of a broadcasting job, Vin sent his resume to radio stations both near and far from his New York home. Vin's letter writing bore fruit; he was hired as a temporary summer replacement announcer at WTOP in Washington, DC, the same city where Connie Mack made his big league debut in 1886.
Vin has said that going from a college FM station to an on-air job with the CBS affiliate in the Nation's Capitol was like going from the campus to the big leagues. Vin's stay in the big league atmosphere of WTOP was short lived; the management at WTOP told him that though they liked his work, they had no permanent job for him. Vin left Washington with vague promises of possible future employment at WTOP, but when he returned to his New York home he had no broadcasting job.
Vin's career took off after a meeting with Red Barber, who would become his mentor. Red hired Vin for a radio broadcast of a college football game in Boston for the CBS football roundup show. In a 1982 radio interview, Barber told Larry King about the circumstances that led to Vin being hired by the Dodgers (thanks to Jon Weisman for permission to quote from his transcription):
I was out at the end of the football season, doing a California-Stanford football game. And at halftime, the engineer handed me a note and said, "Ernie Harwell has joined Russ Hodges at the Polo Grounds. So flying back to New York, I kept thinking, "Who are we gonna get? Who are we gonna get for the third man?" Then I said, "That red-headed fellow that went up to Boston did a good job." So I sent for him, and talked to him for a bit. And then I said, "Would you be interested?"Well, his eyes got as big as teacups. So I said, "You'll have to talk to Mr. Rickey." Well, in about an hour Mr. Rickey called back, and he said, "Walter"—he always called me Walter—"Walter, you've found the right man."
I cannot imagine any baseball fan who would dispute Mr. Rickey's assessment. Red Barber and Branch Rickey provided Vin with his initial opportunity, but the youngster had to make the most of it. Vin reported to Spring Training in 1950 with as much pressure to make good as any big league player looking to earn a job.
A few years ago in a 2006 interview on a Seattle Mariners pregame radio show, Vin was asked by Mariner broadcaster Rick Rizzs to recall his first broadcast for the Brooklyn Dodgers. Vin responded:
Well, I think the very first one was an exhibition game and we were playing the Philadelphia Athletics and the manager that year was Connie Mack. Now the next year Jimmy Dykes became the official manager but my first broadcast was with the A's in Vero Beach with Mr. Mack right there in the black suit, and the celluloid collar, and the straw hat. So, I remember in that game I think Ferris Fain was the first baseman and it seems to me there was a triple play which Red Barber called and I remember sitting there thinking, "He made it sound so easy," and I was scared to death.
Vin's career after that Spring Training game has made him an eye witness to some of the most memorable moments in baseball history. Vin was in the same radio booth as Red Barber when Red had the unfortunate duty to describe Bobby Thompson's home run in the third game of the 1951 National League playoffs. Vin was on the air for a much more joyous occasion, the final out of the 1955 World Series that brought Brooklyn its only world championship. A year later, Vin, along with Mel Allen, broadcast Don Larsen's World Series perfect game. On September 29, 1957, Vin was at Philadelphia's Connie Mack Stadium to broadcast the last game in the franchise history of the Brooklyn Dodgers. In 1958, he broadcast the first game played by the Los Angeles Dodgers. Vin also brilliantly called the last inning of Sandy Koufax' perfect game in 1965, a call that can be heard here thanks to Rob McMillin. He was in Atlanta in 1974 for the radio call of Hank Aaron's historic 715th career home run. In 1986, he was on national television at the World Series to call a little ground ball that went through Bill Buckner's legs. In 1988, he was at Dodger Stadium to make a memorable call ("In a year that has been so improbable, the impossible has happened") of Kirk Gibson's dramatic pinch hit World Series home run.
On the radio show where he reminisced about his first big league broadcast, Vin was asked, "Vinnie, how long do you want to do this?" Vin's answer was, "I don't know, but I can tell you a favorite expression of mine: If you want to see God smile, tell Him your plans."
After 60 years in the broadcast booth, Vin is nearing the end of his extraordinary broadcasting career. When Vin is in his final year, whenever that may be, I hope that some youngster will be in the first year of a six-decade long baseball career. If that happens, and if that person is a worthy successor to Connie Mack and Vin Scully, more than 60 years from now a postscript to this story can be written.
Stan Opdyke was a Dodgers fan as a kid during the Sandy Koufax, Don Drysdale, and Maury Wills era. His biggest baseball thrill was watching Koufax pitch the Dodgers to the National League pennant on the last day of the season at Connie Mack Stadium in 1966. He also got Vin Scully's autograph at Connie Mack Stadium in the mid-1960s. Vin was standing in the dugout before the game, and he called out his name and asked him to sign his autograph book. Scully graciously did. Meanwhile, the other kids looked at him like he was nuts. Why would he want an autograph of someone who looked and dressed like their father?
| Designated Hitter | November 23, 2009 |
Common Run-Production Formulae Evaluated
A Review of Basics
There are two sets of equations that together constitute the backbone of the art of modern statistical analysis: those that project team games won from runs scored and runs yielded, and those that project team runs scored (or yielded) from some combination of reasonably available team statistics. Since that second type is so important, it is worth taking a look at the many specimens out there—their logical bases and their actual performance.
Here we will look at what the more common formulations are and how they stack up against one another. The survey will cover the period of 1955 through 2009. The reason it starts in 1955 and no earlier is simply that several of these methods use stats that simply weren't available before 1955 (such as IBB or SF).
As an aside, let me say that in the course of preparing this overview I was struck by two things: how few people seem to understand how to write out equations, in particular how to use nested parentheses, and how many seem willing to specify some non-standard statistic without then defining it exactly. As to writing out equations, first consider this piece of simple arithmetic:
X = 3 x 5 + 7
Is the wanted answer 22 or 36? That depends on whether the writer intended--
X = (3 x 5) + 7
or
X = 3 x (5 + 7)
That is not an artificial example: one of the formulae evaluated below is given (in several places around the web) in exactly this form:
R = A*B/(B+C) + D |
Jolly good luck deciphering that without extrinsic information. On further examination of the associated text, it turned out that what was meant was—
R = (A x [B / { B + C } ]) + D
— which brings up the other point about writing out equations: there are other enclosure marks than the parenthesis, to wit the bracket and the brace, both of which are illustrated in the preceding example. Using them makes untangling nested expressions very much easier.
(In principle, there is an implied order of precedence for arithmetic operations such that parentheses are often not needed, but not only do few people know it—I'd have to look it up—but there is never any guarantee that the writer of a given equation knows it either, or even knows that it exists.)
My other peeve is illustrated by these sorts of formulae:
R = ( [1B x 3] + [2B x 5] + [3B x 7] + [HR x 9] + [BB x 2] + [SB x 1] - [Outs x 0.61] ) x 0.16
R = (0.47 x 1B) + (0.78 x 2B) + (1.09 x 3B) + (1.40 x HR) + (0.33 x (BB+HB) + (0.30 x SB) - (0.60 x CS) - (?? x [AB-H]) - (0.50 x OOB) — (ignore the ?? as it is not germane to the point here)
In the first, whatever is "Outs"? In the second, whatever is "OOB" (even when expanded to "Outs on Base")? Is "Outs" all outs made by the team? Outs made only by batters? A particular estimate of all outs (such as [AB - H] + SH + SF + CS + GDP)? And what about OOB? Is it all team outs minus batters' outs? Some particular combination of standard stats (such as GDP + CS)? Or what? Which bodily part experiences the pain if the actual, exact meaning is explicitly stated? (Mind, not every formula presenter is guilty of all, or even any, of those sins; but altogether too many are.)
An interesting side question is just what stats is it "fair" to use? For example, one writer states that he means a particular term in a particular formula to signify an out made by a player trying to stretch a single into a double or a double into a triple (or the rare case of a triple into an inside-the-park home run). That's clear, and no doubt meaningful in the context, but whence such data? OK, yes, Retrosheet.org has it all there for those with the diligence and patience to mine it, and Baseball-Reference.com has done an awful lot of that mining. But whether a particular stat is "readily" available can be a tough call.
I suppose at bottom much depends on ultimate purposes: if the idea is to write up a technical paper examining the mechanisms of run-scoring, then anything that can be extracted from the record is fair dinkum; but if the idea is to make a tool suited for frequent and straightforward work, then using stats not readily available would seem to render the equation containing them unsuited for its purpose.
There are, though, a couple of stats that are sort of on the margin. Those are CI, catcher's interference, a typically very small but nonetheless official and significant stat, significant in that it is a component of PA, plate appearances—but is almost universally left out of published PA tallies and almost never published in itself (and suppose there's a Dale Berra or Roberto Kelly on the subject team?). And there's Eb (opponents' errors allowing an otherwise-out batter to reach base, which Baseball-Reference lists as ROE for "Reached On Error"). Omitting CI will—for most teams in most years—have very little, if any, effect, but I am surprised that Eb is so generally unused. (In the one case it is used, estimating it instead of using the exact number decreases average accuracy by about 0.08 of a run, which is about 0.1%; that may not seem like a lot, but wait and you'll see.)
Before we get to specifics, we ought also to consider what we are looking for and how to determine if we are getting it. What we want, of course, is accuracy: we want to feed in the stats for a team and, ideally, always get back the exact number of runs actually scored by the team that posted those stats. Obviously, we will not in general be able to get perfect results, so the way we evaluate various equations is by how closely they approximate perfection.
Formula makers have devised various ingenious ways to measure how well such things do; here, I will use some simple metrics that seem to my possibly naive mind to well express what we are seeking. The first, and foremost, is simply average percentage error. If formula X estimates Rest runs for a given team in a given year, and that team actually scored Ract runs—so that the absolute error is Rest - Ract runs—the percentage error will be:
Epct = 100 x ( [Rest - Ract] / Ract)
Expressing error as a percentage is important, because absolute error sizes—actual numbers of runs off— are misleading: an absolute error of 10 runs signifies one level of accuracy for a team that scored 400 runs and quite another for one that scored 800 runs.
If we then take the unsigned value of the percentage error (that is, ignore whether it is positive or negative), we have a measure of the relative size of the error. We can then just average all the percentage error sizes over whatever time span we are examining to get an overall average percentage error size. That tells us how closely, on average, the subject formula's estimate of runs came out relative to the actual value.
But average size of error is not the only metric of importance. If a runs predictor is truly modelling run scoring fairly well, then its errors ought to be symmetrical: that is, they should scatter evenly around perfect accuracy. A formula that comes in with a given average size of error but has, say, twice as many over-estimates as under-estimates is clearly not working as well as one of roughly equal size accuracy that comes in with its errors about evenly divided between over and under.
Finally, we would expect that the better a runs-predictor is working, the more nearly its cumulative total error with + and - considered will trend to zero. That is, the cumulative sum of all its errors over the subject time span (with over- and under-estimates cancelling) should be nearly zero. This is related to but slightly different from the criterion above.
And for completeness, we should still also tabulate the absolute sizes of errors, both as an average error in runs and as—to keep the control freaks happy—as a standard deviation in runs.
With all that understood, we can turn to particular run-scoring formulae. All such run-scoring equations fall into two broad classes, which we can call "linear" and "multiplicative"; each has its devotees, and we will take an overview of each class separately.
The Formulae
The Multiplicative Approach
The Theory
The basic idea behind multiplicative approaches is quite simple: run-scoring consists in getting runners on, then driving them in. Equations based on that principle are "multiplicative" because they are probabilistic--that is, they seek to estimate the probability of runs scoring based on the occurence of certain game events. It is a base fact of probability analysis that the probability of two independent events both occuring is the multiplicative product of the independent probabilities of each one occurring: if the chance of a randomly selected person being male is 50%, and the chance of a randomly selected person being blue eyed is 16%, then the probability that a randomly selected person is a blue-eyed male is 8% (0.5 x 0.16). In multiplicative run-scoring equations, the factors being multiplied represent the probability of a batter getting on base and the probability of another batter advancing any runners already on base.
For the first term, the chances of a batter getting on base, it might seem that all that is needed is the now-familiar on-base percentage; but the OBP does not take into account the reality that a man who has successfully reached base may then be thrown out on the bases. A man thrown out on the bases may as well have never reached base (as far as the chances of his becoming a run scored), so multiplicative formulae need to in some way estimate net runners on base. That is not as easy as it might sound, because some data are not so easy to obtain. For example, by definition, total plate appearances equals runs plus left on base plus total outs:
PA = R + LOB + Outs
so that
R + LOB = PA - Outs
(And, of course, R + LOB is the number of men who reached base and were not later thrown out.) But total team Outs made is not so easy a datum to come by, unless one can find lines of "opponents' pitching"; otherwise, one has to assemble it from numerous pitching splits. If one has that capability, then one can use the exact datum; if not, one has to estimate it.
(Sidebar: for reasons best known to themselves, few if any stat services any longer tabulate LOB, once one of the fundamental stats ("No runs, two hits, one man left on base, and at the end of five . . . ." It can be adduced, using the simple equation above, if one can first assemble a total team Outs datum.)
If one has to estimate, some stats for runners thrown out on base are commonly available: caught stealing (CS) and grounded into a double play (GDP, or GIDP). But there are far more ways than those to be put out on the bases: pickoffs, throwouts trying to extend a hit, and so on. The general approach of multiplicative formulations is to either take the gross OB and multiply by an empirical estimation constant, or to take the gross OB, subtract what is known about outs on base, then apply an empirical estimation constant.
The base-advance component is the trickier of the two, and it is in constructing that component that multiplicative equations most differ from one another. The simplest and most obvious runner-advance stat is hits; moreoever, since the more extra bases a hit goes for the more it will advance any runners on, hits in any run-advance component are invariably weighted. The simplest weighting, one commonly used, is the Total Base (TB) value, which assigns each hit a weight equal to the number of bases (that is, for example, 3 for a triple). More advanced approaches use different weightings that presumably better represent the effective runner-advance value of a given hit. (To clarify: if one examines the eight possible base-occupancy situations, it is clear that overall a triple will not have 1.5 times the advance value of a double—what the exact relative values may be is something each formulator works out on his own, by such means as seem good to him.)
But, while hits must clearly dominate base-advancing, there are many other stats that reflect actions that can advance runners on base. Those include walks, hit batsmen, and catcher's interference, which will move along any runners on first or in sequence thereafter; stolen bases, which are pure (no batter action) base advances; sac bunts and sac flies; wild pitches and balks; and certain errors. Determining values for these lesser but not negligible actions is another thing each analyst working on the question has to do for himself.
(Note, though—and this applies to the linear methods, too—that while certain of the "lesser" stats may triflingly increase accuracy for a formula that works with actual, historical data, they will be deceptive if used when such formulae are to tried prospectively (that is, for predicting the future based on the past), because those actions are not under the control or influence of the offense. Such things as balks, wild pitches, and opponents' errors are essentially random happenings, and so a general empirical constant is best used to stand in for those things as a whole.)
The Formulations
I will here just list each and show the equation as I gleaned it from one or more sources on the web. If any of those equations seem to anyone reading this as incorrect expressions of the maker's intent, please email me. The accuracy surveys will come after we have introduced all the equations of both classes.
At least as early as 1964, a run-scoring equation of passable accuracy existed: Earnshaw Cook's "DX", which has an average accuracy of around 3½ percent, and which had a "simplified" form essentially identical to the original famous "Runs Created" formulation Bill James put forth 15 or 20 years later. For this evaluation, I tried to use all the current methods I could find documented around the web. I probably missed some, and would be pleased to hear from anyone who has one or more others to suggest (just email me with the formula—written out nicely, please, as spoken of earlier—and some info on who made it when), and if enough roll in I will try to assemble a follow-up survey. But for now, these are they:
Basic Runs Created:
        (H + BB) x TB

  RC =  -------------

           AB + BB
This (hereafter RCbasic) was Bill James' first opus. Its chief virtue is its extreme simplicity of both form and calculation: one can easily understand it, and one can easily reckon it.
Stolen-Bases Runs Created:
        (H + BB - CS) x (TB + [0.55 x SB])

  RC =  ----------------------------------

                    AB + BB
This (hereafter RCsb) is a modification of the "Basic" version to account for the value of, yes, stolen bases (and the corresponding caught-stealings).
"Technical" Runs Created:
  RC = (H + BB + HB - GDP - CS) x (TB + [0.26 x {BB - IBB + HB}] + [0.52 x {SH + SF + SB}]) / PA


     PA = AB + BB + HB + SH + SF
This (hereafter RCtech) is a substantially greater modification of the "Basic" version, to account for all sorts of other lesser data.
"Technical" Runs Created, 2nd Version:
  RC = (H + BB + HB - GDP - CS) x

     (TB + (0.26 x (BB - IBB + HB)) + (0.62 x SB) + (0.5 x (SH + SF) - (0.03 x SO) / PA


    PA = AB + BB + HB + SH + SF
This (hereafter RCtech2) is a minor variation of the form above.
"Technical" Runs Created, 2nd Version, alternate:
  RC = (H + BB + HB - GDP - CS) x

     (TB + [0.24 x {BB - IBB + HB}] + [0.62 x SB] + [0.5 x {SH + SF}] - [0.03 x SO]) / PA


    PA = AB + BB + HB + SH + SF
This (hereafter RCtech2a) is another very small variation of the RCtech2 form (0.26 becomes 0.24).
"Technical" Runs Created, 3rd Version:
  RC = (H + BB + HB - GDP - CS) x

     (BaseWeights + [0.29 * {BB - IBB + HB}] + [0.492 * {SB + SH + SF}] - [0.04 * SO]) / PA


    BaseWeights = [1.125 * 1B] + [1.69 * 2B] + [3.02 * 3B] + [3.73 * HR]

    PA = AB + BB + HB + SH + SF
This (hereafter RCtech3) is the most complex yet of the variations on the RC formula; it is the only one to assign non-TB weights to base hits.
Base Runs:
  BaseRuns = (A x [B / {B + C}]) + D


   where:
A - H + BB + HB - HR - (0.5 x IBB)
B - (BaseWeights + [0.1 x {BB - IBB + HBP}] + [0.9 x {SB - CS - GDP}]) x 1.1
C - (AB - H) + CS + GDP
D - HR
BaseWeights = [1.4 x TB] - [0.6 x H] - [3.0 x HR]
This (hereafter BR) is David Smyth's offering in this category. Wikipedia cites Tom Tango as stating that BaseRuns models the reality of the run-scoring process significantly better than any other run estimator. (We shall see.)
Total Offensive Productivity:
  AdvR = (BaseWeights + [0.301 x {BB + HB}] + [0.526 x SH] + [0.912 x SB]) / PA

  Adv = (AdvR x 0.867) + 0.0412

  OBnet = PA - Outs


  TOP = OBnet x Adv


     BaseWeights = 1B + [1.551 x 2B] + [3.455 x 3B] + [4.421 x HR]

     PA = AB + BB + HB + CI + SH + SF

     Outs = all team outs
This (hereafter TOP) is mine own. It is sufficiently complex that the making of it (above) is split into multiple pieces for comprehensibility, since it uses the y = mx + b method for best-fitting the relation between runners scored and base-advance events.
Total Offensive Productivity, Dumbed-Down:
This (hereafter TOPdd) is as above, but with all coefficients rounded to only two decimal places of accuracy. No recalculating was done (though the coefficients do interact). The point was to see if using three decimal places, which many but not all formulae do, made any material difference.
Total Offensive Productivity, No Error Data:
  PA = AB + BB + HB + CI + SH + SF

  AdvR = (1B + [1.551 x 2B] + [3.455 x 3B] + [4.421 x HR] + [0.301 x {BB + HB}] + [0.526 x SH] + [0.912 x SB]) / PA

  Adv = (AdvR x 0.867) + 0.0412

  OBnet = (0.907527925021 x [H + BB + HB + CI + Eb - HR - CS]) + HR

    Eb = 0.017734746015 x ([AB - H)] + SH + SF)


  TOP = OBnet x Adv
This (hereafter TOPnoEs) is the full formulation except with opponents' errors (Eb)—and thus net runners on base—estimated by a couple of empirical coefficients. I inserted it here to show how much estimating net on-base does or does not cost accuracy as compared to using exact values (because they are not always simple to obtain). Because this is estimating a datum that should be known exactly, it uses full-accuracy constants (no point in double-crippling it)
The Linear Approach
The Theory
In a sense, there is no theory to linear methods (usually referred to as "linear weights", though that really signifies only one such method). Linear methods are based on what we might call the "ant on a globe" principle: place an ant on the surface of a sufficiently large globe and the surface, though actually curved, will seem flat. Indeed, we humans experience that every day on planet Earth, which is why so many people believed it flat for so long. Linear methods are not concerned with the full shape (and hence describing equation) of the relations between common baseball stats and runs scored: they assume that over the relatively short stretches of such curves that we are in practice concerned with, the relations can be considered to be straight lines (hence "linear"). From that assumption, it follows that one can construct runs by simply adding up the effects of each stat that might have some influence on run scoring, with that stat appropriately "weighted" by an empirical constant derived from experience.
The chiefest objection to linear methods is that they do not actually model run-scoring, which is a non-linear process. Countering that indubitable assertion is the sheer fact that they can and do produce good results. Further, they have this virtue: you can construct team values from individual-player values by simple addition.
(You cannot do that for multiplicative methods because in general the product of the averages is not equal to the average of the products. What that mouthful means can be shown quite easily:
X x Y = Z
2 x 4 = 8
4 x 8 = 32
-------------
3 x 6 = 18 but ([8+32]/2) = 20
That is, averaging the X's and the Y's and multiplying those averages gives a different result than averaging the individual Z's.)
The Formulations
Estimated Runs:
    ER = ( [1B x  3] + [2B x 5] + [3B x 7] + [HR x 9] + [BB x 2] + [SB x 1] - [Outs x 0.61] ) x 0.16

          Outs = (AB - H) + CS + GDP
This (hereafter ER) was created by Paul Johnson and got a nice write-up from Bill James; James seems to despise linear methods, and it is widely reported around the web that he apparently did not recognize Johnson's formulation as a linear method. There are other variants of this method, as described farther below; which version came first I cannot readily ascertain.
Estimated Runs a:
    ER = ( [1B x  3] + [2B x 5] + [3B x 7] + [HR x 9] + [{BB + HB + CI} x 2] + [SB x 1] - [Outs x 0.61] ) x 0.16

          Outs = (AB - H) + CS + GDP
This (hereafter ERa) is the above, but with HB and CI included; I just tried those on an off chance, and it much the results, so I include it.
Estimated Runs 2:
ERP = ([2 x {TB + BB + HB}] + H + SB - [0.605 x {AB - H + CS + GDP}]) x 0.16
This (hereafter ER2) is a variation on the method above; as I said, I don't know which came first.
Estimated Runs 3:
ER3 = (TB * 0.318) + ([BB - IBB + HB - CS - GDP] * 0.333) + (H * 0.25) + (SB * 0.2) - (AB * 0.085)
This (hereafter ER3) is a yet another variation on the ER method. (The numbering, again, does not here imply a sequence.)
Extrapolated Runs:
  R = (0.50 x 1B) +

      (0.72 x 2B) +

      (1.04 x 3B) +

      (1.44 x HR) +

      (0.34 x [HB + BB - IBB]) +

      (0.25 x IBB) +

      (0.18 x SB) -

      (0.32 x CS) -

      (0.09 x [AB - H - SO]) -

      (0.098 x SO) -

      (0.37 x GDP) + (0.37 x SF) +

      (0.04 x SH)
This (hereafter XR) is one of Jim Furtado's efforts at a linear formula; there is another one, listed below. I am unsure of their order of creation.
Extrapolated Runs 2:
  xRun = (1B x .51) +

         (2B x .8) +

         (3B x 1.14) +

         (HR x 1.46) +

         ([{BB - IBB} + HBP] x .33) +

         ([IBB + SB] x .18) +

         ([SH + SF] x .21) +

         ([CS + GDP] x -.17) -

         (0.10 x Outs)

     Outs = (AB - H + SF + SH + CS + GDP)
This (hereafter XR2) is a modified version of the above. I am unsure, actually, which version preceded which.
The Shoot-Out
The Results
Just for fun, I also included, as a sort of baseline, what one might call an "worst-possible-way" method. All it does is assign every team in every season the league-average runs for that league and season—that is, it doesn't "predict" at all, but assumes every team is "average". Any way of "projecting" runs that does worse than this is actually "anti-predicting".
The column headings are mostly self-explanatory, but here are notes on a couple. "Cumulative Error" is all actual errors added up, with sign (that is, plus and minus); the lower, the better. "Per Team-Year Error" is just the Cumulative Error divided by the number of team-seasons it was gathered over; it is not terribly important, but helps put the cumulative number in some sort of perspective.
As noted, the data are from the years 1955 through 2009, inclusive. The formulations are listed in order of average percentage accuracy, lowest to highest. The envelope, please . . . .
| Method | Average Error Percentage |
Cumulative Error (Runs) |
Per Team-Year Error (Runs) |
Average Error Size (Runs) |
Standard Error (Runs) |
Percent Under |
Percent Exact |
Percent Over |
|---|---|---|---|---|---|---|---|---|
| Averaged | 7.67653288572 | +66 | +0.0484581497797 | 52.7459618209 | 66.1521968803 | 49.0% | 0.6% | 50.4% |
| ER | 2.95275569685 | -16061 | -11.7922173275 | 20.6174743025 | 25.9099639273 | 69.7% | 1.2% | 29.1% |
| RCbasic | 2.92417501178 | -2292 | -1.68281938326 | 20.281938326 | 25.6796805975 | 51.2% | 1.4% | 47.4% |
| RCsb | 2.90765660618 | -2690 | -1.97503671072 | 20.1820851689 | 25.416645688 | 51.9% | 1.2% | 46.8% |
| RCtech | 2.85383691716 | +9611 | +7.05653450808 | 20.0007342144 | 25.3367764524 | 38.5% | 2.1% | 59.3% |
| ER3 | 2.75487616896 | +4123 | +3.02716593245 | 19.1138032305 | 24.0931787811 | 46.2% | 1.3% | 52.5% |
| BaseRuns | 2.75190018218 | -11315 | -8.30763582966 | 19.1651982379 | 24.1673232912 | 64.3% | 2.1% | 33.6% |
| RCtech2a | 2.75003868729 | -2586 | -1.8986784141 | 19.1365638767 | 23.9341798885 | 53.5% | 1.6% | 44.9% |
| RCtech2 | 2.74082458403 | +1592 | +1.16886930984 | 19.1174743025 | 24.24.0136808913 | 48.9% | 1.5% | 49.6% |
| XR2 | 2.68914080266 | +7057 | +5.18135095448 | 18.6218795888 | 23.5352846865 | 41.4% | 1.4% | 57.2% |
| ERa | 2.68565957806 | -7257 | -5.3281938326 | 18.6439060206 | 23.6679360665 | 59.1% | 1.4% | 39.5% |
| ER2 | 2.67680686519 | +3144 | +2.30837004405 | 18.5374449339 | 23.4423017981 | 45.1% | 1.7% | 53.2% |
| TOPnoEs | 2.59951137936 | -323 | -0.237151248164 | 17.9596182085 | 22.8709281276 | 48.8% | 1.5% | 49.8% |
| RCtech3 | 2.5773991588 | +1858 | +1.36417033774 | 17.8325991189 | 22.5678176251 | 45.6% | 1.8% | 52.6% |
| XR | 2.53012140594 | +4370 | +3.20851688693 | 17.4948604993 | 22.1657307104 | 42.8% | 1.4% | 55.8% |
| TOPdd | 2.46168703878 | +2360 | +1.73274596182 | 16.9779735683 | 21.6911728627 | 45.3% | 2.3% | 52.3% |
| TOP | 2.44818804968 | +120 | +0.0881057268722 | 16.9133627019 | 21.6186642088 | 48.9% | 2.5% | 48.6% |
(The darker lines are multiplicative measures, while the lighter are linear.)
Some Reflections
First off, it is manifest that the best of the multiplicative and the best of the linear methods produce results that are quite close enough for folk music. Second, it is clear that the differences in performance of all these methods are far less consequential than the general accuracy of all. For perspective, let's keep in mind that a difference in accuracy of 0.14% is only about one run per team per season. Look at it: best to worst is only an average difference of less than 4 runs per team per season.
One thing, though, that is clear is that none of the linear methods is really close to a symmetrical distribution of its errors. That is scarcely a fatal flaw, but it does suggest that they are, as is known, not modelling process but empirically matching data. Now there are a lot of empirical constants in the multiplicative methods, too, but the thing is that the linear systems are their constants, and nothing else.
I thought it might be useful to take a look at graphical representations of a couple of these methods. For economy, I chose the best linear and the best multiplicative methods. Here they are:


There are differences, but you've got to look awfully hard to find them. And you will also notice—again, if you look carefully—what a tabled presentation would show better (but is too long for here), which is that these two rather different methods get mostly the same results for the same teams (look at the odd little dots that are fairly isolated), which demonstrates what we already knew: that variations from projection are essentially chance.
My own summing-up is that if you need convenient ease of use, as when doing calculations by hand, the XR method is easiest. If you want the sense that you're really modelling what happens, want best available accuracy, and have the use of a computer to do the heavy lifting of calculation, use the TOP formula. (The needed stats can be downloaded from various standard sources.)
The question of how these various methods can be used to analyze individual players is a fascinating one, but, owing to length, one for another time.
Eric Walker has been a professional baseball analyst for over a quarter-century. His paper "Winning Baseball", commissioned by the Oakland A's for the purpose, first instructed Billy Beane in the concepts later called "Moneyball"; Walker has also authored a book of essays, The Sinister First Baseman and Other Observations. Walker is now retired, but maintains the HBH Baseball-Analysis Web Site.
| Designated Hitter | November 12, 2009 |
Exploring the Intangibles of Catching
Baseball and statistics go together like peanut butter and jelly. The fact is, just about every position on the field can be successfully evaluated with numbers. But, in my opinion, the catching position is one spot that requires closer inspection. Rating receivers is hard to quantify because this position relies so heavily on intangibles.
Allow me to explain and show you how I see it from a catcher’s perspective. For every pitch, you’ve got about eight million variables coming at you. Who is the hitter and how have I attacked him in the past? What is the game situation? What are your pitcher’s strengths and weaknesses? What is the game plan/scouting report? Who is the umpire and what is his strike zone today? What does your manager want? The list goes on and on. And you need to process all this information and put down the correct number...right now.
Because for me, calling a game and having a good relationship with your pitchers and the umpire may have more of an effect on your team than anything else you might do. These intangibles aren’t flashy and won’t put butts in the seats like a home run hitting catcher can, but it might translate to more wins for your team.
I also believe good receivers must be good psychologists. You’ve got to know every individual on the staff and know whether they need to be kicked in the ass or patted on the back. The same applies for the umpire behind you. You’ve got to figure out what makes these guys tick and how to get results. Whether it’s playing the tough guy, the smart guy, or just offering words of encouragement, a good catcher knows how to get the most out the people he works with.
In this essay, I’d like to briefly cover some of these intangibles—communicating with pitchers, pitch selection and pitch counts, and controlling the pace of game. Before I get into that though, I hope you’ll indulge me as I go off on a little jag about coaches calling pitches. One last note, forgive me if I come off like I’m teaching. I’m a coach’s son and have a lot of that blood in me!
Coaches, Please Don’t Call the Game
Hear me out as I get something off of my chest. It concerns the epidemic I see of coaches calling pitches from the dugout. This bothers me on so many different levels I don’t even know where to start. Honestly, I think it should be outlawed and banished from the game. To begin with, how about the time it takes for the catcher to look over every single time to get a pitch selection? It drives me nuts to watch games that drag on forever as the coach satisfies his ego. I mean, what is the upside? Shouldn’t the kid be learning his craft? What good are you doing as a coach if you are turning out pitchers and catchers who cannot think and make quality decisions for themselves? It’s like graduating from school and not knowing how to read. Trust me—coaches don’t call pitches in pro ball. And the way things are going, amateur baseball is unleashing heaps of brain-dead players into the professional ranks. Yes, kids are going to make mistakes; yes, they are going to make stupid decisions. But that is how they learn. As pitching great Christy Mathewson wisely stated, “you can learn little from victory. you can learn everything from defeat.” Calling a game is a huge part of a catcher’s and pitcher’s development. Having a coach call the games stunts growth.
The bottom line, anyway, is: the best pitch a kid can throw is the one he can un-leash with conviction, even if it’s not the perfect choice. There is no way he can do that if the pitch is coming from the dugout. Talk about handcuffs. How about the little subtleties and changes only the catcher can notice in a hitter’s stance? The coach can’t possibly see that from his perch. How can a receiver anticipate and plan ahead when he is just robotically putting down signals? None of it makes any sense, and it drives me crazy. You may see pro catchers glancing into the dugout to get signs and think that if it’s good for them, it’s good for you. Let me tell you that except for rare instances, these glances have nothing to do with pitch selection. they almost always deal with controlling the running game—when to pitch out, throw over, slide step, and so forth. If you pay close attention, you will notice that pro catchers rarely look over when no one is on base. To be honest, if I were the manager, I would let the battery control the running game, too. But that is a whole different subject. Don’t get me started!
I was very fortunate to play for coaches and managers who never put the hand-cuffs on me. They would make corrections when I was wrong and suggestions when appropriate; however, they never stunted my growth by taking away the reins. As a result, the ability to call a good game and the subsequent trust that developed with my staff turned out to be my strong points. They kept me in baseball a long time and made the house payments. I am very grateful to my coaches for trusting me and seeing me through the learning curve.
I’ll finish this little rant with a plea to amateur coaches everywhere. Please take your hands off the steering wheel and let go of some of the control. Teach your players well, and then unleash them on the game to do what they will. A smarter, better developed athlete will emerge, the pace of the game will improve, and, trust me, the decisions won’t be half bad—maybe even better than yours.
Communicating with Pitchers
Now let’s switch gears and focus on the importance of the pitcher and catcher being on the same page. A good receiver takes the time to know his pitcher’s likes and dislikes and finds out where he (the pitcher) feels his limits are. He’s a good communicator and asks questions. Questions like: Do you like to throw the fastball up when ahead in the count? Do you like to bounce your breaking ball in the dirt? If we are in a strikeout situation, what is your best “out” pitch? Ask him to list his pitches in order of his confidence level. As a catcher, you want to get to the point where you and the pitcher are of the same mind. Your pitch choices are the same as his. As he stands on the rubber and decides on the next pitch, you want your signal to more or less take the words right out of his mouth. Nothing is better than when a pitcher and catcher are on the same wavelength and together slice through the opposing lineup.
Taking the time to communicate and learning how to call a good game helps a catcher earn the trust of his staff. Most great receivers aren’t remembered as box of rocks. Having the ability to put down the right signs takes a huge load off the pitcher’s shoulders by letting him focus on execution rather than choices. Yogi Berra summed it up nicely when he wisely stated, “Think! How the hell are you gonna think and hit [or pitch] at the same time?” Helping shoulder the mental load of pitch calling can help your staff concentrate on what’s important: throwing strikes.
Pitch Selection and Pitch Counts
I don’t have an enormous amount of information regarding proper pitch selection because what might be right for one situation won’t fit another situation. A huge list of variables must be filtered through the mind of the catcher, and they are constantly in flux. Some of the components affecting the decision-making process are the strengths of the particular pitcher, the weaknesses of the hitter, the game situation, and the umpire, to name just a few. Like I said, the list goes on and on and is rarely the same twice. Even though there is nothing written in stone, here are a few of the guidelines I followed.
The catcher’s primary focus should be to help the pitcher get outs as quickly and efficiently as possible. Keep your pitcher focused, and don’t let him get caught up in the thrill of making hitters look bad or the trap of trying to make a perfect pitch. Realize that the idea is not so much to “trick” hitters but rather to pound the strike zone in good locations, resulting in quick outs. Keep the pitch count down. Make the opposition swing the bat often and early by keeping your pitcher around the strike zone. I’ll take a first pitch ground out over a strikeout any day of the week. Both scenarios result in an out; however, the ground out requires only one pitch whereas the strikeout takes at least three. Over the course of a game, those numbers can really add up. Keep the pitcher focused on being efficient rather than wasting energy on something else.
Along those same lines, it’s important for the catcher, coach, and pitcher to realize that there’s rarely a pitch you just can’t throw to someone. Usually, even a “bad” pitch selection thrown in the right spot will work. From years of experience seeing thousands of outs, I can tell you that more often than not success or failure depends on the location of the pitch. I will say that again: location, location, location. It’s like real estate. that being said, don’t fall into the trap of setting up on the corners too much or letting the pitcher get too “fine.” If he is obsessed with throwing the ball in the perfect location (i.e., down and right on the corner), then unless his name is Greg Maddux, he is not going to be throwing a lot of strikes. You don’t want to put the hitter in the driver’s seat by getting yourself in counts where you have to pipe a fastball. Again, make hitters swing the bat and get quick outs by pounding the strike zone early with quality pitches.
The last thing to mention on the subject of what pitch to call is always to go with your pitcher’s strength. For example, if confusion arises because a certain hitter is known as a great change-up hitter but that is also your pitcher’s best pitch, go with the change-up. Again, if that is the pitcher’s best chance of throwing a strike in a good location and he can do it with conviction, then that is the best choice no matter what the scouting report says. Always call the game according to your pitcher’s strength instead of the hitter’s weakness.
Pace of Game
As a catcher, you also control the pace of the game. You’re kind of like a point guard in basketball. You can push the ball up the court and play the fast break game or you can slow it down and stall. The speed pedal is under your foot, and by toying with it you can control momentum shifts. I’m not going to lie—as a general rule, I have a heavy bias for pushing the action. I love quick play and recommend it for a number of reasons. That being said, when the offense was rolling and crushing my pitcher, I definitely tried to break the opposing team’s momentum by slowing down the action. Outside of that situation, though, I tried to put the signs down quickly and confidently and felt that doing so positively impacted my team. How so? Well, for one thing, I liked to get my pitcher in the groove of getting the ball, getting on the rubber, and letting it go. Like I’ve said before, the less time a pitcher has to think, the better. Pushing the action also keeps your defense on its toes. I know from playing middle infield that there is nothing worse than a pitcher who takes a minute in between every pitch. How about this reason—fans love quick games. But probably the biggest and best reason for speeding up play is that you take the opposition out of its comfort zone. In general, ballplayers know how to play the game at one speed—slow. Most have no idea how to compete at a quick pace. Pushing the issue by getting the ball back to the pitcher right away and quickly putting down the signal makes good sense if for no other reason than it makes the opposition uncomfortable.
Brent Mayne was a major league catcher from 1989 to 2004. He played most of his career with the Kansas City Royals but also spent time with the Mets, A's, Giants, Rockies, Diamondbacks, and Dodgers. He ranks 75th in the history of baseball with 1,143 pro games caught, and his .993 career fielding percentage is 4th all-time. Brent also has the distinction of being the only catcher in the twentieth century to have won a game as a pitcher. He caught Bret Saberhagenʼs no-hitter in 1991. An All-American in college, Brent was drafted in the first round (13th pick overall) and inducted into the Orange Coast College Hall of Fame in 2006. Mayne was a decent hitter with occasional power and compiled a career high .301 batting average in consecutive seasons (1999-2000).
In retirement, Mayne has gone on to serve on the board of directors of the Braille Institute and the Center for Hope and Healing. He is also the author of a book titled "The Art of Catching" and creator of a website, blog and podcast series at www.brentmayne.com.
| Designated Hitter | September 21, 2009 |
Best Fastballs in Baseball
A few weeks back, Jeremy Greenhouse presented a new method for evaluating who throws best pitches in baseball. Building on work by Dave Allen and John Walsh, the principle is to evaluate pitches based on their outcomes. Jeremy's innovation was to use regression to predict the likelihood of each outcome, given the velocity and movement of each pitch. Previous methods (such as those at FanGraphs, have the problem of giving too much credit to lucky pitchers. If two pitchers throw exactly the same pitch, Bronson Arroyo may get an out, and Chris Carpenter gives up a hit. The outcome-based method would give exactly the same credit to both pitchers.
While Jeremy was working on his analysis, I was working in parallel on a similar method. I've used a kernel density estimator and expectation-maximization algorithm to classify each of the 480,000 pitches throw by right-handed pitchers to right-handed batters between 2007 and 2009, and then estimate the likelihood of relevant outcomes. Some differences, instead of movement and velocity, this analysis includes five parameters: horizontal location, vertical location, velocity, vertical movement, and horizontal movement. Further, we can look at each pitch along each dimension in isolation to give a rough estimate of the importance of each dimension.
Note that although this method is not biased to favor lucky pitchers, it may be biased to punish pitchers with "intangibles." We can build any physically measurable factor into our model, but that won't help us quantify the value of "deception." I fully believe that some pitchers have strange deliveries that throw a batter's timing off, and some are better at sequencing their pitches. This method will undervalue them, because it is essentially evaluating each pitch in isolation. This method will fail to account for pitch selection or sequencing, or any contextual variables. Having a variety of pitches allows a pitcher to set up better pitch sequences, which will make the same fastball more successful. This method can't account for that.
Relative Importance of Components
Once each pitch was evaluated along each of the 5 dimensions, we could look to see how well these values correlated with the overall value of the pitch. This is sort of daft--we have a high powered mathematical algorithm that takes into account high-order statistical dependencies, and then we use a linear regression to evaluate the components. In using the regression for this step, we will lose the ability to look at nonlinearities and interactions, but its a first step. Depending on which pitches we look at (just 4-seamers, or all fastballs), this linear model explains 50 to 90% of the variance.
Regardless of how which pitches we include, the most valuable component is Velocity (with a beta of .592), followed by vertical location and movement (.494, .338 respectively). horizontal location limps in next at .163, and horizontal movement had might as well stayed home, at .070. These numbers change slightly depending on the parameters of the model, and the filters and such, but the general picture remains the same.
Top 20 Fastballs
Here is a list of the top 20 fastballs thrown between 2007 and August 2009, inclusive. Pitches are averaged by pitch type (4-seam fastball, FB; 2-seam fastball, FT; cut fastball, FC), for each pitcher and then ranked by average value. The marginal value of the pitch dimensions are summarized in Control, Velocity and Movement, evaluated by calculating how much value would drop by removing these dimensions. These values are represented as weighted Z scores.
| Rank | Player | Value | Type | Control | Velocity | Movement |
| 1 | Zack Greinke | -0.0313 | FT | 1.13 | 2.68 | 0.90 |
| 2 | Roy Halladay | -0.0304 | FT | 0.73 | 2.19 | 0.72 |
| 3 | Ronald Belisario | -0.0181 | FB | 0.38 | 2.05 | 0.33 |
| 4 | Ubaldo Jimenez | -0.0166 | FB | 0.33 | 2.14 | 0.25 |
| 5 | Jonathan Broxton | -0.0164 | FB | 0.18 | 1.87 | 0.09 |
| 6 | Felix Hernandez | -0.0155 | FB | 0.38 | 1.94 | 0.25 |
| 7 | Roy Halladay | -0.0150 | FC | 0.50 | 0.96 | 0.55 |
| 8 | Heath Bell | -0.0149 | FB | 0.41 | 1.39 | 0.28 |
| 9 | Mariano Rivera | -0.0130 | FC | 0.19 | 1.32 | 0.32 |
| 10 | Bobby Jenks | -0.0123 | FB | 0.31 | 1.15 | 0.07 |
| 11 | Daniel Bard | -0.0122 | FB | 0.13 | 1.42 | -0.01 |
| 12 | Brandon Morrow | -0.0118 | FB | 0.11 | 1.20 | 0.21 |
| 13 | Joel Zumaya | -0.0112 | FB | -0.08 | 1.95 | -0.14 |
| 14 | Vin Mazzaro | -0.0106 | FB | 0.34 | 1.04 | 0.26 |
| 15 | Andrew Bailey | -0.0101 | FC | 0.38 | 0.51 | 0.37 |
| 16 | J.J. Putz | -0.0095 | FB | 0.20 | 0.96 | 0.14 |
| 17 | Joe Nathan | -0.0092 | FB | 0.19 | 0.63 | 0.26 |
| 18 | Freddy Dolsi | -0.0090 | FB | 0.12 | 1.47 | 0.12 |
| 19 | Chris Carpenter | -0.0090 | FB | 0.24 | 1.34 | 0.26 |
| 20 | Kevin Jepsen | -0.0090 | FB | 0.18 | 0.99 | 0.13 |
Pitcher Plots
Below, I've plotted the pitch values on a pitch-by-pitch basis for a few pitchers I selected arbitrarily. The first plot shows the movement and the velocity of each pitch, to give a sense of how successful the pitch classification system was. The second and third plots show the expected value of each pitch plotted against its X location and velocity.
#1 Zack Greinke, 2-Seam Fastball
Greinke's two-seam fastball was given the highest rating in both control and movement and velocity. These values reflect how much the value of the pitch decreases when you remove that dimension from the equation. So it is a little misleading, since a better pitch has more to lose if you remove an important dimension. There are many guys who throw harder than Greinke, but there are no pitchers who would suffer more if they suddenly had league-average velocity.
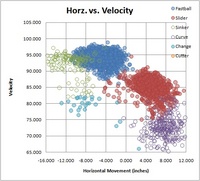
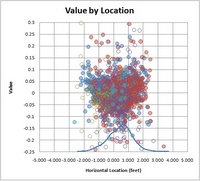
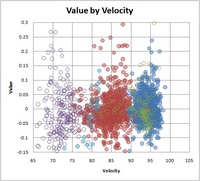
#2 Roy Halladay, 2-Seam Fastball
#7 Roy Halladay, Cutter
My classification system says that Halladay has 3 pitches: the 2-seam fastball, the cutter, the curveball. He probably has a change-up that is being misclassified as well. But however you split it, they are a very good pair of pitches. The value-by-location plot shows pretty good control; he hits the outside half of the plate frequently.
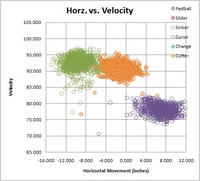
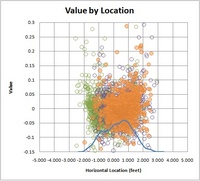
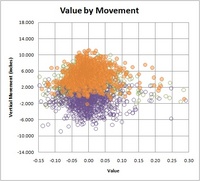
#3 Ronald Belisario 4-Seam Fastball
If you don't know who Ronald Belisario is, you're not alone. His fastball averages 95 mph, and crosses the plate in the zone 56% of the time. He has a 1.92 ERA in 65 innings, though with a somewhat low BABIP. We only have 319 pitches to analyze, so he's likely getting somewhat lucky,
#5 Jonathan Broxton, 4-Seam Fastball
Broxton has a crazy good, totally boring fastball. Its all about velocity. He averages nearly 97 mph, and you can see from the value by velocity graph that he can touch 100, where his value spikes. His vertical movement is good, averaging 10 inches. He also has good command, hitting the strike zone 57% of the time. No bells or whistles here, just heat.
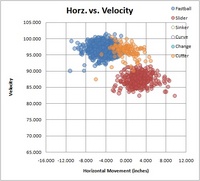
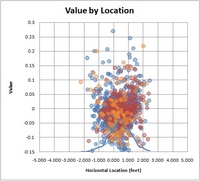
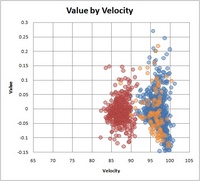
#9 Mariano Rivera, Cutter
If Rivera wasn't included as one of the top fastballs, we'd know something is wrong. Want to see something really beautiful? Check out the histogram at the bottom of the value-by-location plot. That's control.
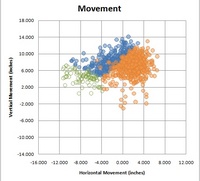
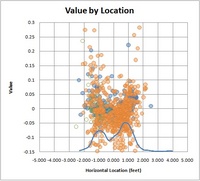
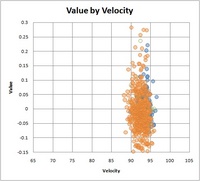
#11 Daniel Bard, 4-Seam Fastball
Our scouts tell us Bard relies a 96 mph fastball that can reach 101 mph and a 82 mph slider wih bite. He also supposedly has a high 80s cutter, a low 90s sinker, and a change-up. We don't have enough data from Bard to see his full range--he only barely makes the 100 pitch minimum--but we can still get an initial look.
Pitch F/X agrees with the scouts: he has a very consistent 97 mph fastball with 11 inches of vertical movement. He relies heavily on the fastball and slider, but he has also thrown a handful of change-ups. He has not yet thrown a low 90s sinker or high 80s cutter in the majors. The lateral location of his pitches looks bimodal, almost like he's either trying to throw inside, or hit the outside edge. Those inside pitches account for many of his worst pitches. His best pitches were high and outside.
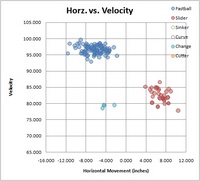
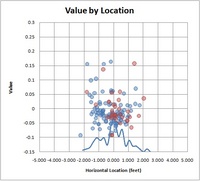
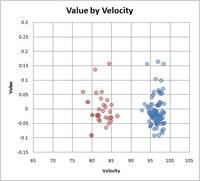
#27 Jonathan Papelbon, 4-Seam Fastball
When he's not dancing, he throws this...
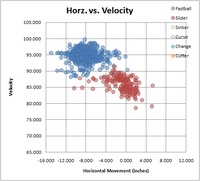
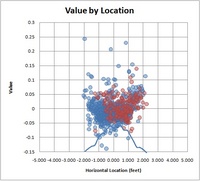
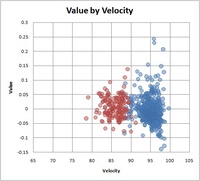
Other Rankings of Note
#22 Adam Russell
#29 Grant Balfour
#30 Josh Beckett
#32 Matt Lindstrom
#43 Frank Francisco
#45 Justin Verlander
#50 Zack Greinke's other fastball
| Designated Hitter | September 17, 2009 |
Unraveling the Batter’s Brain
[Editor's Note: Dave Baldwin is a former MLB pitcher. He pitched for the Washington Senators (1966-1969), Milwaukee Brewers (1970), and Chicago White Sox (1973). His best season was 1967 when he posted an ERA of 1.70 with 12 saves. Dave has been a member of the Society for American Baseball Research since 2002.]
Part of any pitcher’s job is to understand what goes on in the murky, cobwebby recesses of a batter’s head as the ball is hurtling toward the catcher’s mitt. In fact, this is a pitcher’s most formidable task because the wiring of the batter’s brain is a neuronal mishmash, poorly understood even by the best of baseball’s neuroscientists.
But let’s not be too hard on the batter’s poor brain—it is asked to do an incredibly tough job. During the first two-thirds of the pitch’s flight, the batter simultaneously collects information and performs critical calculations with respect to the ball’s trajectory. From these calculations, he predicts where and when the ball will be at the potential point of impact with the bat. When the ball is approximately twenty feet from the ball/bat contact point, a decision is made and the batter commits to taking the pitch or swinging. That decision is absolutely irreversible if the batter is taking, and if the batter is swinging, he can’t change the trajectory of the bat’s sweet spot (although he can still attempt to check the swing by pulling his hands against his body).
So Little Time
A good fastball traveling at, say, 90 miles per hour (mph) takes about four-tenths of a second or 400 milliseconds (msec) to get from pitcher’s hand to the contact point (assuming the pitcher releases the ball about five feet in front of the pitching rubber and contact is made about a foot in front of home plate). The batter’s noggin has about 270 msec or a little more than a quarter of a second to get its ducks in a row and start the swing. But, although the bat has started its journey, the batter’s conscious mind is still unaware that the batter has decided to swing.
How do we know this? In the 1970s, neurophysiologist Benjamin Libet conducted a series of experiments to determine the relationship between the conscious intention to carry out an action and the initial brain activity that must precede the action. He found that the brain lights up about 350 msec before the conscious mind is aware the action is to be taken (Libet, 1985; Libet, et al., 1983). But the batter’s brain has only 270 msec to decide whether and where to swing. If these decisions were to be made by the conscious mind, the ball would be in the catcher’s mitt before the batter could do little more than start moving the bat. In fact, the ball is only 50 msec (about seven feet) away from the contact point when the batter’s conscious mind finally realizes that he is swinging the bat. The batter can do nothing to alter the swing in that final 50 msec. Thus, he is hitting with his unconscious mind.
What we are calling the “conscious mind” is primarily the cerebral cortex. The “unconscious mind” comprises those brain components that collectively produce mental phenomena occurring without the person being aware of them. The ancient, deep-brain region called the limbic system (amygdala, hippocampus, hypothalamus, etc.) is a major part of the unconscious mind. It interacts with the cerebellum, a brain structure responsible for coordinating muscle activity during the batter’s actions. This is the same quick neural circuitry that tries to save a hiker who is the target of a rattlesnake’s strike. A hiker dodging a two and a half-foot strike of a five-foot snake has about 200 msec to come to the conclusion to jump—even less time than is granted the batter, but the hiker’s problem is much simpler, of course.
What the Batter's Brain Must Do
Let’s consider the steps the batter’s brain must take during those critical 270 msec. First, the unconscious apparatus must gather information about the behavior of the ball. If it fails in this initial task, the batter might just as well go up to the plate with a wet noodle instead of a bat.
The batter needs to begin collecting pitch information as soon as possible. To prepare for this “quick read,” the batter’s conscious mind concentrates on an imaginary “box” where he expects the pitcher’s release point to be. Thus, his cerebral cortex is thoroughly occupied and doesn’t hinder the unconscious mind. If he has guessed correctly and the ball is released from that box, he can begin to evaluate the pitch as it leaves the pitcher’s hand. Otherwise, the batter must spend precious milliseconds searching for the ball.
Not only must the batter predict where the ball will be at the instant of bat/ball contact but when the ball will arrive there, as well. To do this, the batter observes the trajectory and calculates the rate at which it is changing in each of the spatial dimensions. The visual parameters used by the batter to accomplish this are the apparent size of the ball’s image (used to estimate distance to the ball), distance of the image off the foveae of the batter’s retinas, and the horizontal angles of the right and left eyes. The time until bat/ball contact is calculated by the ratio of the image's apparent size to the rate of change of this size. These calculations are performed without the batter’s awareness.
During the early stage of the trajectory, the image seems to be coming very nearly directly at the batter’s eyes, but as the ball gets closer to the contact point, the horizontal angles of the eyes expand, and the eyes have increasing difficulty keeping the image on the foveae. In fact, the eyes aren’t able to follow the pitch all the way to the ball/bat contact—the image “outruns” the foveae when the ball is about five feet from the contact point (Bahill & Baldwin, 2004). This doesn’t matter since the batter can do nothing at that point to alter the trajectory of the bat’s sweet spot. During the last five feet of the pitch’s flight, the batter would do just as well if he had his eyes closed.
Note that the ball “appears” to approach the contact point more rapidly in the later stages of its flight, even though the 90 mph pitch actually slows by about eleven and a half mph because of drag force during the flight. The batter’s mind makes adjustments for this phenomenon. To experience this illusion, watch the median stripes on a highway as you travel at a constant speed of 60 mph. A stripe that is quite distant down the highway will seem to creep toward you, while a stripe very near the car will seem to whiz by, even though the car is moving at the same speed relative to the two stripes, of course.
Besides using the visual clues discussed above, the batter might also check out the ball’s spin pattern for indication of pitch behavior. Some batters report seeing a pattern of stripes (and maybe a dot) made by the red seam as it whirls around the axis of the ball; some say they can’t see anything but a gray blur. If a batter’s unconscious mind recognizes the spin of the pitch, it has information about the direction and magnitude of the ball’s spin-induced deflection (Bahill, et al., 2005). The trajectory of any spinning pitch (i.e., one that isn’t a knuckleball) will be deflected by the spin to some extent. Hitting a baseball is a skill of precision—the batter must adjust to even a slight deflection.
I surveyed fifteen former major league position players and found that only eight remember seeing the seam spin pattern. These results might indicate visual differences, or they might stem from variation in the way the pattern is processed and stored in the brain. Coaches generally assume that the ability to see the spin pattern will make for a better hitter, but the success of a batter doesn’t seem to be related to his ability to recall seeing this pattern. Using two Hall of Famers as examples, we note that Frank Robinson has reported he was able to see the seam, but Mike Schmidt has said he was never able to see it (Schmidt, 1994).
Taking Advantage of the Batter's Brain
How can the pitcher benefit from knowing how the batter’s brain works? For many decades pitchers have known how to “set up” the batter for an out pitch. The pitcher does this by using the residual image of the previous pitch to confound the hitter. This works because the image resides somewhere in the unconscious mind, retained in short-term memory. The pitcher sets up the batter by showing him a pitch—say, a high, inside, smoking fastball. The batter can’t help but maintain the memory for some short period—long enough to allow the pitcher, working quickly, to come back with an ever sooooo slooooow curve while smoke is still hanging around in the batter’s cranium. Psychologists call this “visual priming”—an earlier visual stimulus influences response to a later visual stimulus. Knowing how to set up the batter is an important part of knowing how to pitch.
The pitcher can also benefit from a distraction of the batter’s unconscious mind or from giving the cerebral cortex extra information to process, thus interfering with the unconscious operations. I once had a catcher who would, on occasion, toss a handful of dirt on the batter’s shoes just as the pitcher was releasing the ball. He would do this only on a crucial pitch at a crucial point in the game. This made the batter’s unconscious mind spend some milliseconds trying to deal with the surprise.
Another way to accomplish this is to startle the batter with a loud or threatening noise. A few pitchers in baseball history have developed the knack of giving out a resounding grunt just as they released the pitch. And I remember hearing of a catcher who, now and then, would blast the batter with an ear-splitting whistle at an opportune moment. Both of these tricks distracted the batter. The unconsciousness switches from processing visual information to handling the unexpected auditory information. This switch has some real-life practical applications, such as heeding the snorting of a charging rhinoceros.
Several pitchers have had success in giving the batter’s conscious mind plenty of time to make decisions. The “eephus” thrown by Rip Sewell in the 1930s and ‘40s, and Steve Hamilton’s “folly floater” of the ‘60s are prime examples of pitches that worked well in part because they allowed the batter’s clumsy cerebral cortex to get involved. These pitches were lobs that reached a height of twenty feet or more at the apex. Pitches tossed to such a height take more than a second to reach the potential contact point—long enough to give the cerebral cortex plenty of time to get wound around itself, pondering how to slant the swing.
This is a difficult problem because a swing angled with a slight uppercut (usually the most effective angle on a normal pitch) will cut perpendicularly across the path of the descending lob, making timing the swing extremely difficult. The best angle with respect to timing the lob is an acute uppercut, one that will result in a high pop-up if the batter manages to make contact. Anyone who has attempted to fungo line drives has realized that tossing the ball high makes the task very challenging. To avoid this dilemma, experienced fungo hitters, such as Jimmie Reese, would give the ball a very short toss and hit it when it is almost stationary, near its apex.
The batter’s mind usually fails to resolve the swing-angle problem of the lob. Late in his career Steve Hamilton told me that, although he had thrown the folly floater many times, it had resulted in a hit only once—Frank Howard, showing remarkable presence of mind, had tapped the pitch over the first baseman’s head for a looping single.
Researching the Batter's Brain
In this article we’ve seen that batters’ brains carry out very complex operations. Given the importance of the unconscious components of the batter’s mind, perhaps research into how they are affected by various performance enhancers would be appropriate. For example, we have evidence that some scents—those of lemon, peppermint, and cinnamon—have a beneficial affect on the cerebral cortex, resulting in improved performances in mental and physical tests (Zoladz, 2005), but little is known about how these or more powerful performance enhancing chemicals affect the unconscious mind. With advances in technology giving us extremely precise measurements of the pitch, the hitting process, and the concomitant patterns of neural activity, we might be able to learn a great deal about what happens in the batter’s unconscious mind. In the future, the batter’s box might become an indispensable neurophysiological laboratory.
Note: In this article, all times are rounded to the hundredth of a second, and distances are rounded to feet.
References:
Bahill, A.T. and Baldwin, D.G. 2004. “The rising fastball and other perceptual illusions of batters.” In Biomedical Engineering Principles in Sports. G.K. Hung and J.M. Pallis, eds. NY: Kluwer Academic / Plenum. pp. 257-287.
Bahill, A.T., Baldwin, D.G., & Venkateswaran, J. 2005. “Predicting a baseball’s path.” American Scientist, 93(3):218-225.
Libet, B. 1985. “Unconscious cerebral initiative and the role of conscious will in voluntary action.” Behavioral and Brain Sciences, 8:529-566.
Libet, B., Gleason, C. A., Wright, E. W., and Pearl, D. K. 1983. “Time of conscious intention to act in relation to onset of cerebral activity (readiness-potential): The unconscious initiation of a freely voluntary act.” Brain, 106:623-642.
Schmidt, M. and Ellis, R. 1994. The Mike Schmidt Study: Hitting Theory, Skills and Technique. Atlanta: McGriff and Bell Inc.
Zoladz, P.R. and Raudenbush, B. 2005. “Cognitive enhancement through stimulation of the chemical senses.” North American Journal of Psychology, 7:125-140.
Dave Baldwin is a former pitcher, geneticist, and engineer. He is now retired and living in Yachats, Oregon. His memoir is described at http://www.snakejazz.com/.
| Designated Hitter | September 03, 2009 |
Ivy League to MLB: Advanced Metrics and Minor League Baseball
Hello loyal readers of Baseball Analysts. My name is Shawn Haviland and I am a right-handed pitcher in the Oakland A’s organization, currently pitching for the Kane County Cougars in the Midwest League.
Prior to being drafted by Oakland I attended Harvard University, graduating in the spring of 2008. After playing in the Northwest League for the Vancouver Canadians I began blogging about my experiences, starting with my off-season workout regimen and continuing on through the season recapping each start and discussing other parts of the minor league experience. I’ve been reading The Baseball Analysts for a while and really enjoy the work that they do so hopefully I can keep up the high standard that has been set.
I became interested in advanced metrics a few months before this season when I first heard about Batting Average on Balls In Play (BABIP) through my search for answers as to why I was striking out more than a batter per inning but still had a batting average against of over .260. It seemed like every time they put the ball in play it was going to be a hit. From there I was hooked on the “numbers behind the game.” Despite my interest, the “saber metric revolution” hasn’t really made a huge impact on minor league baseball from the standpoint of how pitchers approach the game.
Minor league pitchers focus on only a few statistics: ERA, WHIP and K/BB ratio. Our pitching instructor preaches that if you want to advance to the next level (the only thing that minor league players really care about) you need to have a below league-average ERA, a WHIP below 1.3 and a strikeout-to-walk ratio of at least 3 to 1. Seems easy enough but as I know now I have less control over these statistics than I would like to think.
For example, my season this year has been a tale of two different halves. The first half of the year I was very successful hitting each mark, I was in the top 10 in the league in ERA, had a WHIP below 1.3 and was averaging approximately 8 strikeouts and 2 walks per game. The second half of the year my strikeout-to-walk ratio has stayed around 3 to 1 (7.5 to 2.8) but my ERA and WHIP have shot up, despite the fact that I feel like I have executed my pitches better in the second half of the season than the first half. What happened, you might ask? The answer here seems to be that my BABIP has gone up almost every month all the way up to over .360 in August.
| Month | BABIP | ERA |
|---|---|---|
| April | .303 | 2.35 |
| May | .304 | 3.06 |
| June | .346 | 5.61 |
| July | .327 | 6.46 |
| August | .368 | 4.54 |
(You can check out my full month-by-month splits and other assorted numbers of interest on minor league splits.com.)
I know that BABIP is not the only factor that is affecting my ERA but it certainly is not helping me achieve the organizational goal of having a below league-average ERA. The fact of the matter and the unfortunate thing for anyone victim of high BABIP, is that these stats are not prevalent in minor league clubhouses. Coaches see a rising ERA and think that the pitcher is pitching worse, which may be the opposite of the case.
Now if I handed that last paragraph to the majority of minor league baseball players I probably would be met with a blank stare. However, if I asked minor league pitchers about their ground ball ratio, most would be able to tell you exactly what their ratio is (mine is .89) and how they are trying to improve their ratio by throwing different pitches to force ground balls.
Batted ball type is the area where advanced metrics has broken into minor league baseball. Our roving pitching instructor Gil Patterson constantly says that it is “impossible to hit a ball out of the park if it is on the ground.” During instructional league we talked a lot about if you are able to make the hitter hit the ball on the ground the worst-case scenario, unless they hit the ball directly down the line, it is going to be a single. If you can make a team hit three singles to score a run you are going to be very successful. While BABIP is slightly higher on ground balls than fly balls it is worth the sacrifice because doubles, triples and home runs are what really hurt pitchers and allow for multiple runs to be scored very quickly.
Pitching for ground balls also eliminates the effect of the ballpark you play in. Our High-A team is in Stockton, California, in the hitters’ paradise that is the California League. Every pitcher that I have talked to says, “Pick up a sinker or a cutter in Kane County because you are going to need it in Stockton.” If you turn on the television and watch any major league baseball game the number of pitchers who are throwing predominantly four-seam fastballs is dwindling. Brian Bannister is a perfect example of this, in that he as all but scrapped his four-seam fastball and instead throws a sinker and a cutter.
The majority of teams in the major leagues rely heavily on home runs as a source of run production; and after the high-powered offense era pitchers are finally catching up and realizing that velocity is not the most important factor in success (although it is nice to throw gas) but rather the ability to make the hitter hit the top of the ball truly breeds success. Armed with this information, pitchers, like Bannister, are making adjustments to force the hitters to keep the ball in the yard.
This brings up the argument as to what is more important: pitch type or pitch location. When we have our pitchers' meetings to formulate the game plans against opposing hitters, axioms like, “he can’t hit a curve ball,” or “he has a long swing, so he won’t be able to catch up to a fastball,” are consistently thrown around. I have never liked speaking in absolutes because I don’t think that there is a hitter in pro ball, or college baseball for that matter, who can’t hit a certain pitch. The players who have a hole that blatant were weeded out long ago. However, there are players who cannot hit a well-located fastball or curveball. My point being that every hitter can hit a fastball belt high right down the middle or a hanging curveball so to simply throw a pitch that the hitter “can’t hit” is not enough. As with real estate, pitching is all about location, location, and location. Although I have no statistical proof, I would argue that throwing the “wrong” pitch in a good location is going to lead to a lot more success than throwing the “right” pitch that is poorly located.
Vladimir Guerrero is one of the best fastball hitters in the game today but you will see him weakly hit a well-placed fastball. Hitters have the hard job, they need to recognize what pitch is coming and then hit a round ball with a round bat to a place that is not occupied by a defensive player. As a pitcher, all you have to do is locate your pitch and let the batter hit it at someone. Statistics tell you that more times than not the hitter is going to get himself out.
Thanks for reading. If you have any thoughts or questions, feel free to leave comments below, email me or check out my blog Ivy League to MLB.
| Designated Hitter | August 27, 2009 |
Walking Off
“...in the Retrosheet era.”
There's no denying the immense drama that surrounds the walk-off home run. From Bobby Thomson in 1951 to Bill Mazeroski in '60, Kirk Gibson in '89, Joe Carter in '93, Big Papi in 2004 and more, the walk-off home run has been inspiring writers and baseball fans alike for decades. It's even helped get certain players elected to the Hall of Fame.
Thanks to SABR, we know that the current leaders in career walk-off home runs are some of the all-time greats: Frank Robinson, Mickey Mantle, Jimmie Foxx, Stan Musial, and Babe Ruth, all with 12 career walk-offs. It's a formidable group and, unlike the Thomsons and Mazeroskis above, there's not a single surprising name on that list.
But the home run is not the only way to earn a walk-off victory. For our purposes, we’ll use the most liberal definition of a walk-off victory (WoV), which is "a run-scoring event in the bottom half of the last inning of the game that gives the home team a winning margin." This means that any event that causes a run (or runs) to cross the plate can be considered a "walk-off". Base hits, ground-rule doubles, bases loaded walks, steals of home, sacrifice flies, passed balls, wild pitches, errors, balks, and even interference can all lead to a WoV.
I thought it'd be interesting, then, to do a study of these non-home run walk-off events. When you start looking at the data, you find that there are a lot of questions that can be asked: if Ruth, Mantle, Robinson, et al are the leaders for home runs, who are the leaders for the other categories? Is it a certain type of hitter? And what kind of situation leads to the most WoV's? Are there any seasons where the WoV was abnormally frequent?
And once you start poking around with those questions, more come flooding out: who has given up the most WoV's? What pitcher-batter combo has teamed up for the most WoV's in history? In that same vein, what batter-baserunner combo has teamed up to score the most WoV-runs? Does the list change if we only consider the baserunner who scored the winning run? And who is the baserunner who has scored the most winning runs in WoV's? What about non-winning runs?
As you can see, there is plenty to answer about walk-off victories if we just look at the data – and some of it is bound to be interesting. So, using the Retrosheet play-by-play data from 1954-2008, this is what I've found. I'll break the discussion into Batters, Pitchers, and Baserunners to keep it manageable. And if there's something about the data that I didn't include or that I haven't considered, please let me know.
The Basics
But first, some general information about WoV’s.
In the Retrosheet era, there have been 9,887 games ending in a walk-off fashion. The top five walk-off events in that time are so:
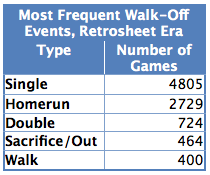
Error, wild pitch, fielder’s choice, and triple are the only other walk-off categories that occurred more than 100 times. Excluding the nearly 2,800 games won by walk-off home runs, the teams with the most walk-off victories (and defeats) are as follows:
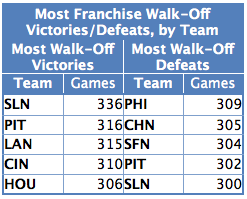
Again, this data only spans the Retrosheet era. It’s still surprising to see the Astros so high on career victories, though, considering how many other teams had a seven-year head start.
Finally, before we get too deep into the details of the batter and pitcher data, it seems like this is a good place to list the single-season leaders for walk-offs, for both pitchers and hitters. As with most everything else, this list excludes walk-off home runs:
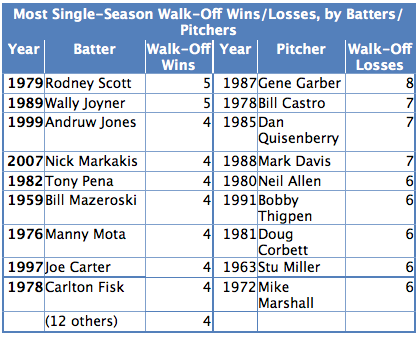
The Batters
Looking at the remaining 7,100 non-home run walk-off events, the vast majority were officially scored as singles (4,805 walk-off singles). Many are more complicated than a mere base-hit (one-, two-, and even three-base errors, etc) but, for our purposes, they will be counted as a single.
We also find plenty of non-batting events in the data: stolen bases, balks, wild pitches, and passed balls are all there in the data. If we remove those from consideration for now - so that we don't credit, say, Cliff Floyd with a walk-off hit when John Rocker balks in the winning run - then the leaderboard for most career walk-off victories, non-home run variety looks like this (and, yes, we do count HBP, BB, errors, and other events that the batter initiated in this list):
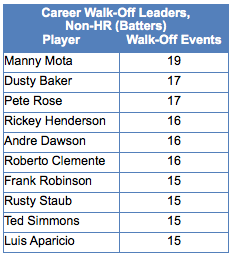
There are quite a few unsurprising names on that list, Hall of Famers known for their run producing ability. But there are also a number of very surprising names. Manny Mota is number one? Dusty Baker tied with Pete Rose for number two? Rusty Staub? Ted Simmons?
A couple of interesting things to note: nearly half of Mota's non-home run WoV's came as a pinch hitter (he also has one walk-off HR to his credit). That's nine times he was called in from the bench in a game-changing role in which he came through to win the game. Talk about your go-to guy off the bench. Also, Frank Robinson appears in the top 10 on this list, with 15 non-home run WoV's (including one sacrifice), which is very impressive in itself. However, he also sits atop the walk-off home run leaderboard with 12. Combining the two, he sits all alone at the top of the WoV leaderboard, with 27 homers and non-homers alike. Yet another reason to love the career of baseball's most underrated superstar.
Breaking those down even further, here are the walk-off leaders in each of the more standard offensive categories:
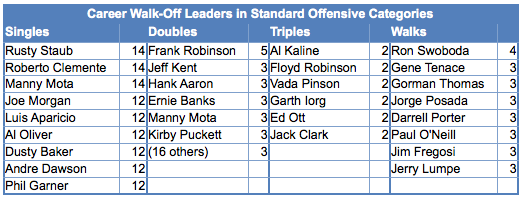
And the less-than-standard offensive categories:
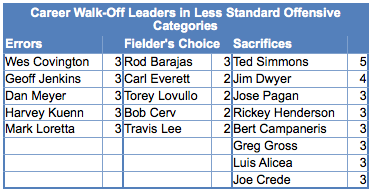
It should be noted that there are no players with more than one walk-off HBP. And please also note Frank Robinson atop the walk-off doubles list. That's 17 career walk-off extra base hits. He's the walk-off king.
But what about the inning/outs situation? When are WoV's most likely to happen? The table below shows the frequency of non-home run WoV's in the 9th through 14th innings, broken down again by the number of outs.
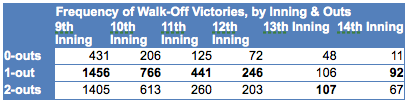
And, finally, who is most likely to get that WoV? Is it the high-average/high-OBP guys in the leadoff spot or the sluggers in the middle of the lineup, or does it even matter? With Manny Mota, Pete Rose, Andre Dawson and Frank Robinson all atop the leaderboard, it's hard to say.
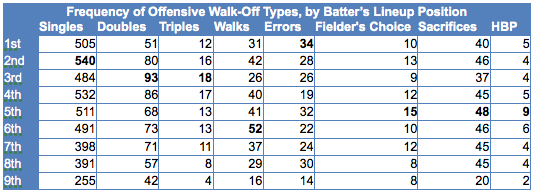
The Pitchers
The "walk-off hit" has a very different meaning when you flip it around and start talking about the man on the mound. Whereas the batter and his teammates are thrilled by the moment - the journey from tension and worry to joy and exuberance is as quick as the flight of the ball - the pitcher and his teammates are devastated, walking off the field with heads hung down. As a pitcher, that is the one situation that you do not want to be in: the guy giving up the lead completely and for good, with no chance to recipricate.
Being the all-time leader in this category, then, is one of the more dubious honors in baseball. Who do we find on the leaderboard?
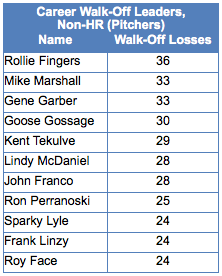
Similar to the leaderboard for hitters, this includes all events a pitcher might be considered responsible for, including wild pitches and HBPs. Passed balls and errors are excluded. We also continue to exclude home runs from the discussion.
Seeing Hall of Famers Rollie Fingers and Goose Gossage on the list shouldn't be too much of a surprise, considering the number of the games that they closed out. Frank Linzy and Ron Perranoski are the biggest surprises, as they only finished 342 and 458 games, respectively. After them, it's Mike Marshall who finished the fewest games in his career, with 549.
The fact of the matter is, if you keep putting the same guys out time and again in the ninth inning (and later) of tight ballgames, they're inevitably going to lose some games. It's almost amazing that, of Rollie's 709 games finished, he only gave up the walk-off in 36 of them (49 if you include home runs).
Not all walk-off losses (WoL) are the same, though. In the table below, the data is broken down by the size of the lead that was blown.
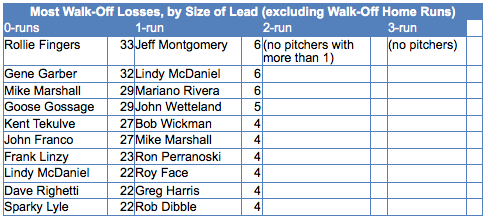
And, in the interest of thoroughness, the same list, but with walk-off home runs included, is provided below:
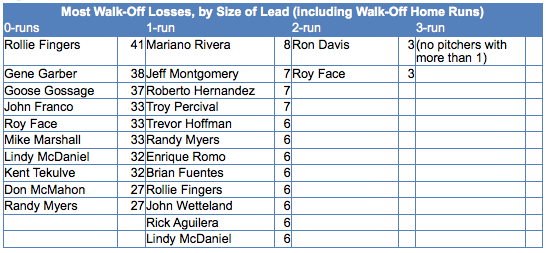
Finally, the question needs to be asked, what batter-pitcher matchup has ended in the most walk-offs?
Maybe not surprisingly, we don't have to go too far back to find the answer: between Sept 12, 2004, and Sept 1, 2005, Atlanta's Andruw Jones earned the walk-off victory in extra innings from Montreal's/Washington's Luis Ayala three separate times. Here are the three games (I had to include HRs in this search to find a unique candidate):
- Sept 12, 2004: Montreal @ Atlanta, 8-8, bottom 12, no outs, runner on first - RBI Double
- July 26, 2005: Washington @ Atlanta, 2-2, bottom 10, 2 outs, bases loaded - four pitch walk
- Sept 1, 2005: Washington @ Atlanta, 7-7, bottom 10, 0 outs, bases empty - solo home run
No other batter-pitcher matchup ended in a walkoff more than twice.
The Baserunners
One thing about walk-off's is that we remember them for the batter. The runner who earned his way onto the basepath and actually scores the run is easily ignored. For example, when we think back to Game 7 of the 2001 World Series, it's not Jay Bell that we remember for scoring the winning run, it's Luis Gonzalez.
But in the long history of the Major Leagues, it seems certain that there are some players who found themselves in these situations over and over again. At some point, you have to start thinking that they may have some actual skill at it. The leaders for most walk-off runs scored (and most walk-off winning runs scored) are as follows (excluding batter-runners scored via home runs):
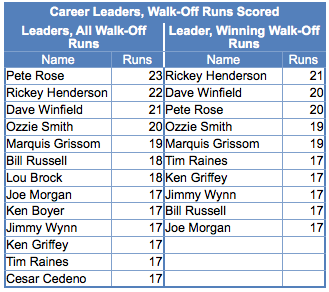
Now there's a list that shows some greatness. Nothing but Hall of Famers and quality run scorers. It makes perfect sense that they would be on base for so many WoV's.
Eyeballing the list, it seems that it’s the top of the order guys – the #1 and #2 hitters like Rickey and Rose – who cross the plate the most. And while this makes intuitive sense, it seems worth checking. The list, excluding batter-runners scoring themselves via home runs, is below:
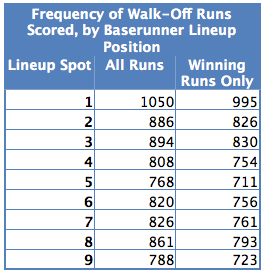
Okay, so no surprise there. But where do the winning runs come from, though? From what base?
It should be obvious that, across all WoV's, the winning run scores from third more often than any other base. But does this carry across all walk-off types, though? The table below shows the frequency in which the winning run scored from each base for the major offensive categories. If the game is tied, the first runner to cross home plate is considered the 'winning run'; if down by 1, it's the second runner to score, and so on.
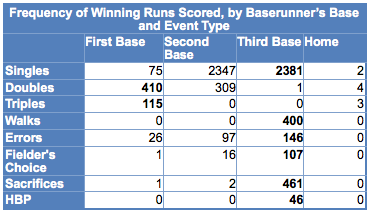
And just for kicks, here's a list of players who scored the most winning runs by driving themselves in via the home run. I know that we're not really focusing on the walk-off home runs in this post, but it seems worth exploring for a minute. It's good to see Frank Robinson at the top of the list again.
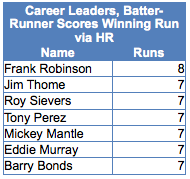
And finally, as with the pitchers, the question has to be asked, what is the most prolific walk-off batter-baserunner combo, and does it change if we look only at the winning runs? Excluding walk-off home runs, the list looks like this:
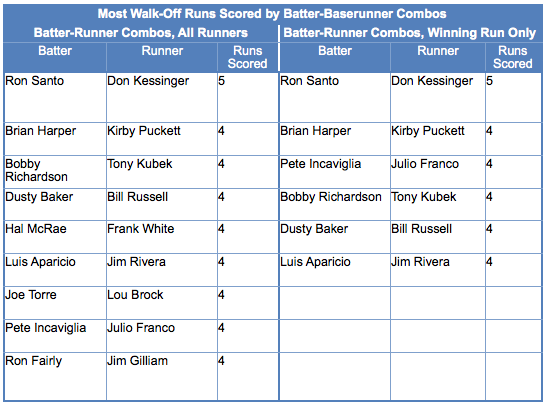
The most surprising thing about those lists is how none of the top walk-off run-scorers show up. It's probably a product of player movement, but it's hard to say for sure. Don Kessinger and Kirby Puckett are the only players on the list who were also driven in three different times by an additional player. Pete Rose and Rickey Henderson, while never being driven in by the same guy four times or more, do have two different teammates who they matched up with three times each.
(Oh, and I’d talk about the stolen base leaders right here, but, sadly, they aren’t all that interesting. Of the 22 walk-off steals, no player has done it more than once. George Brett, Pete Rose, Rod Carew, and Eddie Murray are the biggest names on the list, with no Rickey Henderson or Tim Raines to be found. A few are recorded as steals of home, but many are also due to errors. In short, it’s a mish-mash.)
Conclusion
Well, that’s about all I can manage to squeeze into this post without delving into utter minutiae. (How often has a game been won with a walk-off single by the number 7 hitter with a runner on second with one out in the 10th and the home team down by one run? Who scored the most winning runs from first base in 1973?) There seems to be an unending amount of information to be found in the walk-off listings. I just hope I’ve been able to share the interesting facts.
In the end, though, I don’t think there’s a typical walk-off scenario to be found. The hitters at the plate, the baserunners who score the winning runs, and the pitchers who are responsible for the loss are all sufficiently varied in their notoriety/stats/skills that it really does seem to be “the luck of the draw.”
If I did have to describe the “typical” walk-off victory – with the caveats above – it would be this: it’s a tie-game in the bottom of the ninth and the top of the order is coming up. The leadoff hitter (or #2 hitter) gets on base and is moved into scoring position, where he is driven in by either a base hit or home run from the middle-of-the-order power guys. It helps to have all-star-or-better quality players batting in either of those lineup positions.
I’m guessing you probably could’ve guessed that. Still, it’s always nice to have the data to back it up. Now, the next time you see your team get that walk-off hit, you can say that you saw it coming.
Larry Granillo lives in Milwaukee and writes the blog Wezen-Ball.com, where he uses some do-it-yourself statistical analysis and various contemporary accounts (including newspapers and magazines) to look at the game of baseball, both past and present - and, whenever possible, at where the two meet.
| Designated Hitter | August 20, 2009 |
Solo Homers Will Not Break Your Back
A good deal of words have been written decrying the increased home run numbers thanks to the unfortunate placement of outfield walls in the new Yankee Stadium. In their efforts to faithfully reproduce the exact dimensions from the old park across the street, the Yankees nailed the distance from home plate in almost all of the right places. Right field corner, left field corner, straight-away centerfield, and the halfway marks between. However, they failed to take into account a nifty new scoreboard that covers part of the wall in right field and, unfortunately, causes the wall to lose its gentle curve. In effect, a good deal of the right field wall is about nine feet too close to home plate. What you have, in effect, is a straight wall in right field that simply begs left-handed hitters like Johnny Damon to deposit an easy homer above its shallow border. But really, is this really part of some sort of dastardly plan by the Yankees to grab advantage over their foes? I think not.
To date, there have been a whopping 185 home runs hit at New Yankee Stadium, already 15% more tater tots than were hit at the old place last season. But while 50% of the homers last year were hit with no runners on base, that figure has risen to 65% in the new place. On average over the past few years in the MLB, about 58% of home runs are of the solo variety. Is there something about the new park that decreases scoring overall even as homers fly out at a record rate? To wit: New Yankee Stadium is only seventh in the league for scoring; last year, the old place was ninth. Scoring is up only 0.5 runs per game between the old park and the new park. If the Yankees and their opponents keep up their current pace of slamming homers, the new place will end up with 240 homers hit, a full 50% more than last year, or about one extra homer per game.
Those two increases don't seem to mesh well. If the Yanks and their opponents are hitting an extra home run per game but scoring is only up half a run per game, where is that extra run going? Obviously, the huge percentage of solo home runs is providing solace to opposing pitchers who have been victims of the short dimensions in right field. Take Indians starter Anthony Reyes. On April 17th, the Indians lost to the Yankees by one measly run, 6-5, despite Reyes and two relievers allowing five homers to the Yanks. But, all five homers were solo shots, which kept the Indians alive in the game (they only had one home run in the game, a solo shot).
So what explains the high percentage of solo home runs in the New Yankee Stadium? One explanation is almost so obvious that I missed it at first: when a guy who hits in front of you hits a home run, he is unclogging the bases of those pesky baserunners. That leaves you, the batter, with an empty canvas on which to paint your own home run. Sorry, but that will only be one RBI for you, sir. In fact, Johnny Damon and Mark Teixeira have accomplished the back-to-back trick six times already this year, a franchise record. They've done it three times at home and the rest of the team has done it four more times, plus one occurrence of back-to-back-to-back home runs. That's nine home runs that must be solo shots because the gentleman ahead did the hitter a favor and cleared the bases.
Not that allowing all these solo home runs is going to get any pitcher off the hook, but if scoring is only up by half a run per game, then at least any wary pitcher nervous about giving up the farm when visiting Yankee Stadium can relax. You might give up a bunch of home runs, but if you're smart, you'll wait until the bases are empty.
==========
Rob Iracane co-edits Walkoff Walk, a thoughtful blog dedicated to baseball and the human condition. He and Kris Liakos have been active for over 18 months and their biggest claim to fame is posting a video of a shrimp running on a treadmill backed by "Yakety Sax" whenever an MLB team wins on a Walkoff Walk.
| Designated Hitter | July 30, 2009 |
The Staticky Charm of AM Radio
There's something human in static. Record collectors are fond of saying vinyl recordings have a warmer sound than their digital brethren, but I think the real humanity is in the airwaves.
I.
Medium wave amplitude modulation radio broadcasting was invented just a few years after the dawn of the modern era in baseball (when the rules we are familiar with today became codified). Guglielmo Marconi was awarded the first patent for the radio in the United States in 1900. Six years later, Reginald Fessenden propagated the first AM transmission from Brant Rock, Massachusetts. Radio remained a hobbyist's pursuit until it exploded in the wake of World War I. The 1920s heralded the beginning of the Golden Age of radio. It is no coincidence that the 1920s also represented the Golden Era of baseball.
Radio represented one of the first mass-media in the United States. Just as mass media were fueling national culture and the development of full-fledged consumer culture in the 1920s, so too was radio building the very first media markets. The first radio call of a live baseball game was broadcast on the first commercial radio station, Pittsburgh's KDKA. On August 5, 1921, Harold Arlin used a shoestring setup (he used a modified telephone) at Forbes Field to announce a contest between the Pirates and the Phillies.
The Pirates won 8-5. It was a brief game, lasting less than two hours, but featured a home run by Phillies centerfielder Cy Williams and a triple by Pirates third baseman Clyde Barnhart. It must have been thrilling to hear Arlin describe that moment when a runner approaches second base so fast that it dawns upon the announcer that the runner might just be headed for third.
For several years, subsequent broadcasts were not conducted live, but rather were recreations from play-by-play wire accounts. They often lagged innings behind the action on the field. But they also opened up the game to a broader audience. Despite owners' fears that radio would discourage fans from showing up at the ballpark in person, the prevalence of baseball radio broadcasts grew apace. As radios became centerpieces of the American living room, baseball enmeshed itself as part of the daily life of millions.
II.
The reality of a live broadcast is that the time is difficult to fill, and the long pauses or awkward attempts at filler make the broadcasts intimate. Indeed, Harold Arlin remembered not being exactly sure what to do or say:
"Nobody told me I had to talk between pitches [...] Sometimes the transmitter didn't work. Often the crowd noise would drown us out. We didn't know whether we'd talk into a total vacuum or whether somebody would hear us."
What's remarkable about baseball on the radio is just how much sense it makes. Most sports are chaotic, with infinite possible constellations of players on the playing surface. In baseball, there is only the count (of which there are only twelve states), the base/out situation (of which there are 24 states), and the inning (which of course there are usually nine). When the announcer relays that the shortstop, batting in a 2-2 count with runners on the corners, has roped a line drive down the third base line, you can imagine just what it looks like. With that sort of information alone, millions of boys and girls have surreptitiously used a transistor radio to reconstruct the Polo Grounds or Shibe Park right there in English class.
For decades' worth of Opening Days, the transistor radio was a shibboleth for manic baseball fans celebrating for the first time all winter the rich sounds of staticky play-by-play in their ear. You can make us work or go to school, they secretly shared, but you cannot make us pay attention.
And the broadcasters were our friends. They spent so much time talking into the emptiness and to each other that radio broadcasts became intimate. Radio announcers Graham McNamee, Red Barber, Mel Allen, Jack Brickhouse, Vin Scully, Harry Caray, and Harry Kalas (and countless others) became as members of an extended family.
III.
A few select stations pumped their frequencies with such potency that their broadcasts arced along the contours of the earth, through hills and mountains all but unimpeded, to even rural communities (the places we today call exurbs). Clear channel AM stations (like New York's WFAN and Chicago's WGN today) had no competition on their particular frequencies for hundreds of miles, allowing them to reach hundreds of thousands of households with every broadcast.
Slowly, radio broadcasters cottoned on to the cadence and style of a live broadcast. They began to fill up the empty space between pitches with players' statistics, provided to them on mimeographed sheets reproduced from media guides. Their catchphrases became just as reconstructable as the base-out state on the field. They were indelibly marked into memory.
Slowly, media markets emerged. Regional rivalries heightened as fans followed every play of every game and homer announcers embellished and enlarged the truth. Before there were regional television deals or network-neutrality violating online streaming video websites, a team's radio station provided the crucial link between fans and teams that remains the solitary reason why baseball became America's pastime.
IV.
The beginning of the decline of baseball on the radio was marked by one of baseball's iconic moments. It was one of those giants of broadcasting, the voice of the Giants, Russ Hodges, who penned its first epitaph. On October 3, 1951, Bobby Thomson roped a line drive off Ralph Branca over the left field fence at the Polo Grounds, giving the Giants a ticket to the World Series. Even to someone like me, much too young to have experienced the Shot Heard 'Round the World myself, it sounds more like this:
"There's a long drive--it's gonna be, I believe--THE GIANTS WIN THE PENNANT! THE GIANTS WIN THE PENNANT!"
Coincidentally, the third game of the three-game tiebreaker was also the first coast-to-coast live broadcast of a baseball game on a different frequency band: VHF television. NBC broadcaster Ernie Harwell's pedestrian call ("It's gone!") goes unremembered. In fact it is a sort of cosmic accident that Hodges's radio call was recorded at all, as a fan happened to record the final few innings to share with a friend.
Even though millions caught the game on the radio, the fact that something so spectacular happened on the live television broadcast made everyone who saw it an instant convert. Brian Biegel, in Miracle Ball (which chronicles his search for the Thomson home run ball) quotes Hall of Fame curator Ted Spencer:
"It was a special moment because it may have been the first thing we saw on TV in our house--1951 was the year we got a TV. I've always talked about it as baseball's first TV event. That home run was played continually all that night. Remember, there's no satellite, there's no twenty-four-hour-a-day news. News was fifteen minutes in those days--6:00 to 6:15 local and 7:00 to 7:15 NBC. But it was all over the place. It was fabulous. I think from that point on, baseball and TV really came together."
Regularly scheduled television programming had begun just four years prior to the Shot Heard 'Round the World. In 1950, just 9.0% of American households had a TV set. By 1951, the number was 23.5%, the largest year-over-year percentage point increase on record. And for all those early adopter households, this was one of the first "event television" moments. While radio remained an important part of baseball broadcasting, it never again held the place it once did.
V.
My experience with baseball on the radio has been very personal. As a young boy (an only child, no less), I would sneak to my family computer, which was the first I had used with a microphone. I would imagine a situation--inevitably the ninth inning and certainly with the bases loaded. Somehow it always seemed that Darren "Dutch" Daulton was at the plate (although on his nights off, John Kruk could pinch hit). Huddled next to the Macintosh SE, I would record myself doing Harry Kalas's home run call over and over again: "Outta heeeeere!" I can only imagine how many other kids have done the same thing (or perhaps some slightly less technological analog) since baseball was first broadcast over AM radio.
I don't dislike baseball on television; of course I enjoy watching it. I enjoy following a game on the computer with Gameday because it allows me the same sort of constructed reality that the radio did. Now that streaming video and audio are available on cell phones and laptops I wonder about the fate of that essential baseball institution, the radio broadcast. We live in a world of blackouts and interrupted coverage, of Joe Buck and Scooter the animated baseball. They spend so much time filling the pauses, and they say so little of much importance, because they really don't have to say anything. The action, after all, is right there to watch on the field. With the recent news that Vin Scully plans to retire after the 2010 season, I worry that we may be witnessing the final years of baseball on the radio.
I hope that the radios--the ones on workbenches and in cars, the ones stowed away in school lockers and backpacks, the ones perched on radiators in bathrooms and high up on the shelf at gas stations--I hope they don't disappear. Because to listen to baseball on the radio is to imagine the game, to imagine yourself there, to imagine the men in the booth. If it dies, I fear we will lose that imagination as well.
----------
Tommy Bennett writes for Beyond the Boxscore. He is a law student living in New York and a lifelong Phillies fan.
| Designated Hitter | May 14, 2009 |
Johan Santana's Fast Start in PITCHf/x
Johan Santana - have you heard of him? He's pretty good. The man is the ace of the Mets, was the ace of the Twins, and is one of the best left-handers in the game. He does it with a consistent, metronomic delivery that pumps out four difficult pitches.
| cfx | # | lhh | rhh | mph | pfx_x | pfx_z | deg |
| Change-up (CU) | 1427 | 152 | 1275 | 81.2 | 7.0 | 6.8 | 134.6 |
| Two-seam fastball (F2) | 1022 | 166 | 856 | 92.0 | 7.6 | 7.8 | 135.7 |
| Four-seam fastball (F4) | 1992 | 645 | 1347 | 92.2 | 5.4 | 10.2 | 152.1 |
| Slider (SL) | 582 | 322 | 260 | 84.5 | 0.5 | 3.6 | 171.3 |
Notes: PITCHf/x data from Gameday, classifications by the author ("cfx"); data covers 2007 (partial), 2008 and 2009; mph is the average speed at 55 ft. from the back of home plate; pfx_x and pfx_z are the lateral and vertical deviation from the path of a spin-less ball (inches); deg is the angle of the spin axis
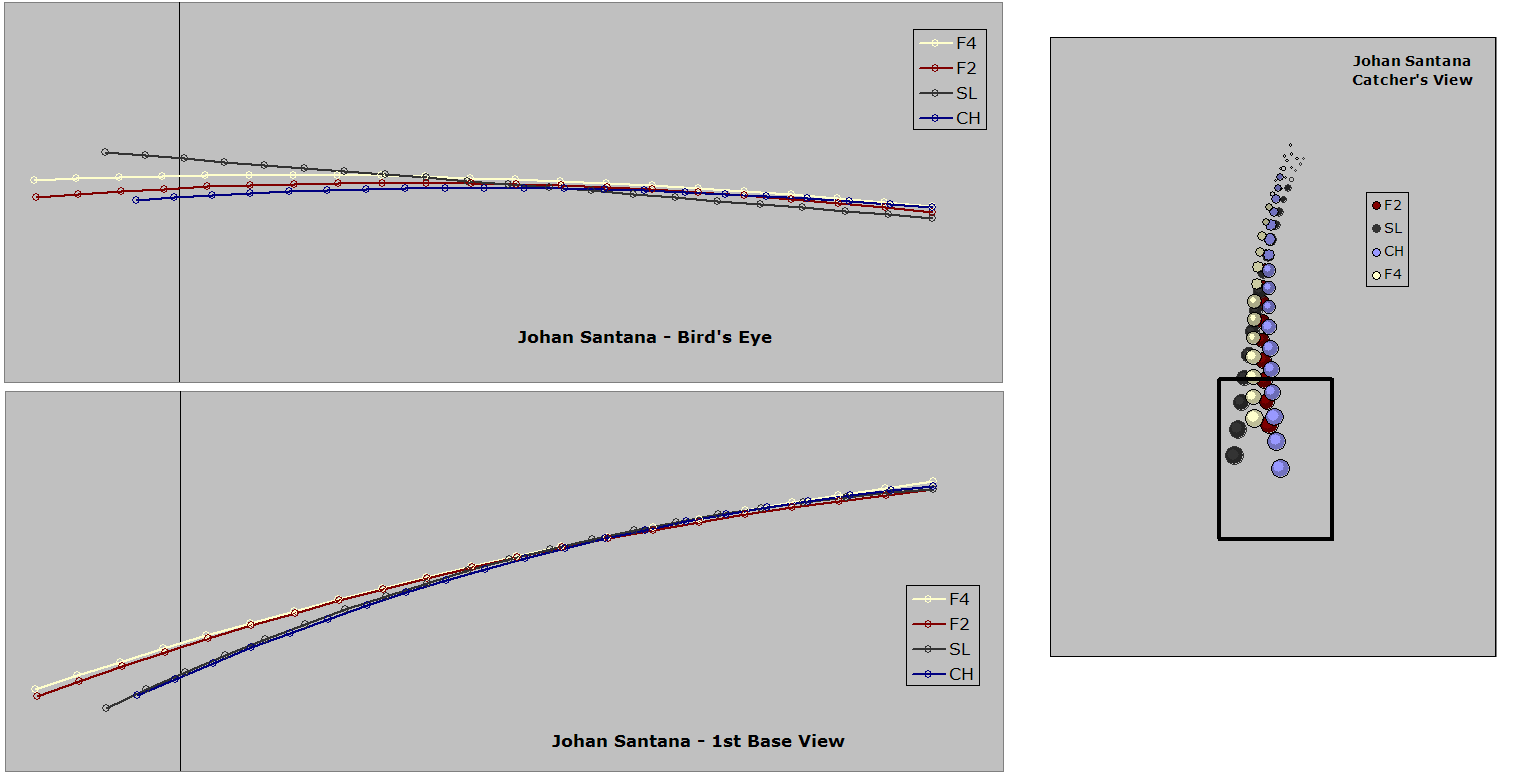
Santana's slider is one of the best in baseball, which is a fine indication of the consistency of his delivery. But that's all old news. What brings me here is to explore Johan 2009. He's off to a great start, even better than years past, which begs a simple question. What's he doing differently? If anything, that is.
It's early, and I'm only looking at games through May 6, so this doesn't include Johan's most recent start. Some trends have emerged that merit watching. That's about all you can do with most early season returns. Keep that in mind.
The biggest change is in pitch selection. Johan is throwing far more four-seam fastballs (or simply "fastballs") and far fewer two-seam fastballs ("sinkers"). Santana also appears to be throwing fewer sliders, a pitch he mostly uses against lefties. His change-up is primarily a gift to right-handed hitters everywhere (the gift of zilch, that is) but got a little extra use against lefties in 2008.
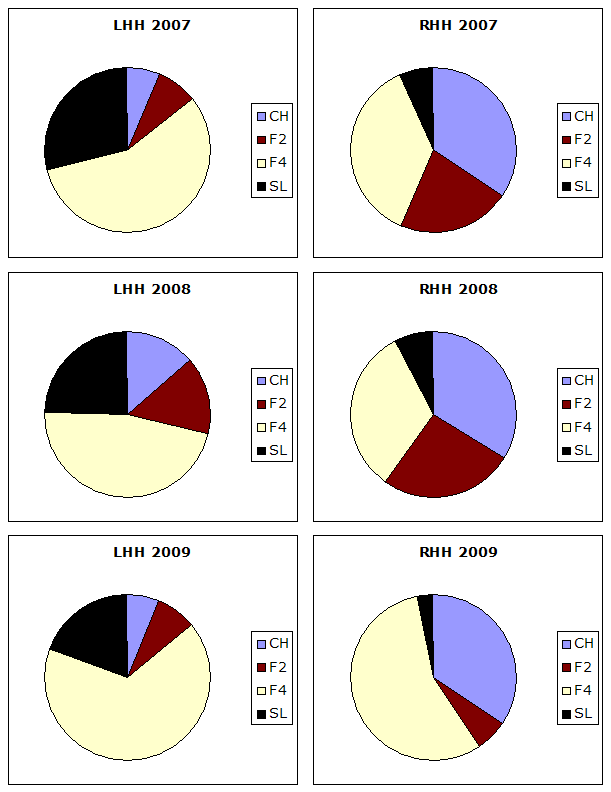
That's a siginficant increase in heaters. Another look is from a four-start moving average of pitch mix.
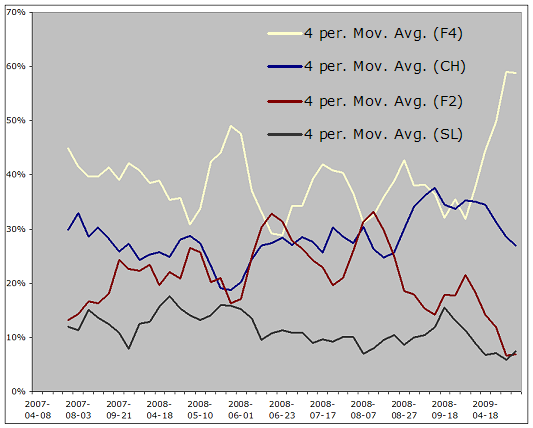
I made sure to include this chart, because, when you squint, you can see a giraffe. But why is he doing this? Santana's four pitches are all above average. The change is one of the best, and both of his fastballs and the slider are solid pitches.
    rv100
CH  -3.7
F2  -1.7
F4  -2.0
SL  -1.5
If you're going to cut back on two pitches, they'd be the sinker and slider. I'm not sure why you would, neither pitch is hurting anyone but Santana's opponents. Breaking it down by season and, for good measure, batter hand, you do start to get the idea that the sinker and slider aren't what they used to be, while the change and fastball may be even better.
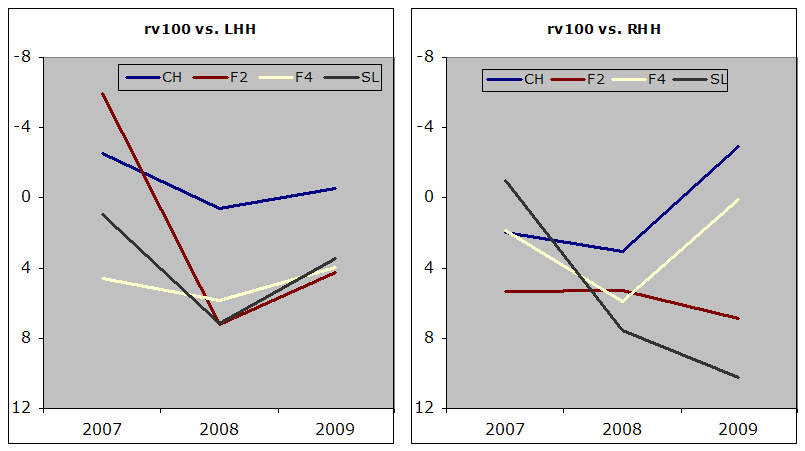
It's early, Santana is one of the greats and can beat you a few ways, so I'm not reading too much into this. I'm working with a short season and a partial data set (2007 didn't have full PITCHf/x coverage), too. But he's pitching well, he is throwing more heaters and fewer sinkers, and Santana's change-up is still a world beater.
Harry Pavlidis writes for Beyond the Box Score, The Hardball Times and Out of the Ivy. His own blog, Cubs f/x, feels neglected once in a while.
| Designated Hitter | April 23, 2009 |
WAR and Remembrance
Baseball fans love to argue. Did Dustin Pedroia really deserve the MVP award last year? (After all, he was only 18th in the AL in OPS.) Sure, Manny can hit (can he ever!), but he gives it all back with the glove, right? On the flip side, is Adam Everett, with his fabulous defense, a valuable player? We older folks like to argue about the players of our youth: For example, who had the better career, George Brett or Wade Boggs? In the end, it usually comes down to putting a value on a player, a total value that includes hitting, defense, baserunning and everything else.
Well, Sean Smith -- you know, the guy who does the CHONE player projections -- is putting an end to some of these arguments. What Sean has done, bless his soul, is evaluate players on just about every aspect in which a player contributes to winning. And he's done this for all players going all the way back to the middle of the last century. Bravo, Sean!
So, what are these different aspects of baseball, the important contributions a player can make towards winning? Here's the list:
o batting
o baserunning
o avoidance of grounding into double plays
o defensive range
o catcher defense
o defensive arm for outfielders
o double-play proficiency for infielders
Sean has analyzed over 50 seasons of play-by-play data available at Retrosheet and determined each player's value in the above categories, expressed in runs above or below that of an average player. For the defensive categories, players are compared to the average for that position. I won't go into the methodology for all these categories, you can refer to Sean's explanations here. I do want to mention Sean's Total Zone system, which he uses to measure defensive range. After hitting, defensive range (and catcher defense) is the biggest contribution to a player's value. Total Zone uses Retrosheet play-by-play data to evaluate defensive range for all players of the last 55 years or so. It's a clever system that squeezes just about every bit of information from the play-by-play data, data that is not as complete as modern play-by-play data from professional statistics providers like Baseball Info Solutions or STATS, Inc. See here for more details on Total Zone.
Of, course there's a lot more here than just defense, as you can see in the list above. Now, we've known how to measure baserunning and outfield arm proficiency for a while and the other categories, given the Retrosheet data are treated in a similarl way. The important thing that Sean has done is to 1) put in the dirty work to make all these different evaluations and 2) put them altogether to allow us to get a total picture of player value. Oh, and 3) he's posted it all on the web for all to use (at no charge).
Do you realize how great this all is? I recently wrote an article for the Hardball Times that did an in-depth comparison of Carl Yastrzemski and Manny Ramirez. I got the hitting from baseball-reference.com, defensive range from Sean's own Total Zone system and the outfield arm ratings came from my own work at THT. I couldn't locate comprehensive baserunning information, so I had to work that out (a less complete analysis) on my own. Now, to write that article, I would could do all my "shopping" at Baseball Projection.
Sean then goes a couple of steps further with the data he has compiled. He translates "runs above average" to "runs above replacement", since a player's true value is best measured against a replacement level player. Along the way he gives each player a "position adjustment". Remember when I wrote that range is measured against the average defender at the same position? Well, the position adjustment accounts for the fact that the value of an average fielder is not the same for each position.
The last step is translating runs into wins and, since we are now relative to replacement, these are Wins Above Replacement, or WAR. I've been very brief in describing the system, if you want more info about determining overall player value, I heartily recommend a series of posts at FanGraphs, which goes through the process step-by-step, starting here.
Speaking of FanGraphs, those good folks have been doing similar work. They also produce WAR values for all players, using a different fielding system (known as UZR) and play-by-play data purchased from Baseball Info Solutions. Their data set goes back only a few years, though, so you need to use Sean's WAR database, if you want to look at, I dunno, who really should have won the MVP awards in 1974...
-------------------------------------------------------------
Jeff Burroughs is the guy who, when reciting the names of MVP winners, you always leave off the list. Well, him and Zoilo Versalles, I guess.* It's not that he was underserving of the award, although, he was, as we shall see shortly. It's just that looking back, he doesn't seem like much of a star. He actually was a very good hitter for a few seasons and I'm sure he's not the MVP-winner with the worst career.
*What? You mean, you don't find yourself reciting the names of AL MVP winners? That's strange, I do it all the time. Pennant winners and World Series champs, too. Just don't ask me who the 13th President of the United States was.
Jeff Burroughs in 1974 was probably the best hitter in the American League. The 23-year-old Texas Ranger hit .301/.397/.504, which is even better than it looks, since offensive levels were quite a bit lower 35 years ago. Burroughs finished third in on-base average and slugging percentage and finished among the top ten in just about every important offensive category. He only led the league in one category, but it was the right one for garnering MVP votes: RBI.
We can get an overall measure of Burroughs' hitting by considering the Batting Runs part of the WAR database. Here are the AL leaders for 1974:
 ------------------ ------ ---------
| Name             | Team | BatRuns |
 ------------------ ------ ---------
| Jackson_Reggie   | OAK  |      49 |
| Burroughs_Jeff   | TEX  |      48 |
| Carew_Rod        | MIN  |      35 |
| Allen_Dick       | CHA  |      34 |
| Rudi_Joe         | OAK  |      34 |
| Yastrzemski_Carl | BOS  |      33 |
| Bando_Sal        | OAK  |      27 |
| Tenace_Gene      | OAK  |      27 |
| Gamble_Oscar     | CLE  |      27 |
| Grich_Bobby      | BAL  |      27 |
 ------------------ ------ ---------
Burroughs is right there with Reggie Jackson at the top of the list. Jackson finished fourth in the MVP balloting, which may be explained by Burroughs' advantage in RBI, 118 to 93. In any case, from a hitting standpoint, Burroughs was certainly not a bad choice for MVP.
But, baseball is more than hitting, of course — how did Burroughs do in the non-hitting categories? Burroughs was not a fast player, at all, so we don't expect him to excel at baserunning, defensive range and avoiding the GDP. But did he at least hold his own? Did the 1974 American League MVP at least approach the average players in the "extra" categories? I'm sorry to report that he did not.
Here's how Burroughs fared in the non-hitting categories:
o Defensive range - Burroughs was 17 runs worse than an average right-fielder. That's the worst range mark of any AL player in 1974.
o Outfield arm - sometimes slow guys have good arms. Not in this case. Burroughs cost his team an additional five runs with an ineffectual throwing arm.
o Baserunning - Two stolen bases and three caught stealings give you an idea of Burroughs' speed. He was also below average in advancing on the basepaths, giving him a net baserunning value of -3 runs.
o GDP - Burroughs grounded into 17 double plays in 1974, a few more than the average batter would have, given the same opportunities. Good for -2 runs.
o Position - it's not his fault, of course, but Burroughs played right field in his MVP year, which is an offense-first position. The adjustment for right fielders is -8 runs.
The 1974 AL MVP was below average in every single non-hitting category for a grand total of -35 runs. Yikes, that negates a good chunk of his batting runs (which was +48, you'll recall). In fact, without considering hitting, Burroughs was the very worst player in all of baseball in 1974 and he was one of only four players who was below average in each of the non-hitting categories. This dude was seriously one-dimensional.
So, who should have won that 1974 AL MVP? Well, if you don't require your MVP to play on a playoff team (Burroughs's Rangers did not make the playoffs), then you could rank MVP candidates according to their overall win value, or WAR:
 ----------------- ------ --------- ------- ----- ------ ------ ---------- ------
| Name            | Team | Batting | Range | Arm | BsRn | GIDP | Position | WAR  |
 ----------------- ------ --------- ------- ----- ------ ------ ---------- ------
| Grich_Bobby     | BAL  |      27 |     5 |   3 |    5 |   -2 |        4 |  6.9 |
| Jackson_Reggie  | OAK  |      49 |     0 |  -2 |    0 |    2 |       -8 |  6.7 |
| Carew_Rod       | MIN  |      35 |    -9 |   2 |    5 |    2 |        4 |  6.6 |
| Rudi_Joe        | OAK  |      34 |     0 |   3 |    1 |    1 |       -8 |  5.6 |
| Campaneris_Bert | OAK  |      13 |     6 |   1 |    4 |    1 |        8 |  5.4 |
| Money_Don       | MIL  |      19 |     0 |   2 |    3 |    0 |        4 |  5.4 |
| Maddox_Elliott  | NYA  |      19 |     4 |   6 |    4 |   -1 |       -2 |  5.1 |
| Bando_Sal       | OAK  |      27 |    -4 |   0 |    1 |    0 |        3 |  5.0 |
| Tenace_Gene     | OAK  |      27 |     4 |   0 |   -5 |   -1 |       -2 |  4.6 |
| Robinson_Brooks | BAL  |       5 |    14 |   1 |    0 |   -1 |        4 |  4.4 |
 ----------------- ------ --------- ------- ----- ------ ------ ---------- ------
BsRn - baserunning runs
Range - includes catcher defense
Arm  - includes infield DP rating
For me, it comes down to Bobby Grich, Jackson and Rod Carew. Pay no attention to the 0.3 wins separating these three — no system is accurate enough to distinguish players this close. Grich played a prime defensive position and played it exceptionally well. He won a Gold Glove at second base in '74, and was excellent with the bat and on the basepaths. Reggie, we already saw, was one of the top two hitters in the league, and he hangs on to those batting runs by coming out average in the other categories (except for position adjustment). Carew was top notch in everything except defensive range (he was still playing second base at this point).
In the actual vote, Grich finished ninth and Carew seventh. You might notice the absence of somebody from the above list: Jeff Burroughs, who totaled 4.0 wins over replacement for the season.
-------------------------------------------------------------------
Over in the National League, the voters did not fare much better: they elected Dodger first basement Steve Garvey over several more valuable players. The problem in this case was not neglecting the other categories (although I suspect many writers did so), but rather not doing a good job of evaluating offensive value.
Sean Smith's WAR database rates Garvey as the NL's ninth most productive hitter in 1974:
 --------------------- ------ ---------
| Name                | Team | Batting |
 --------------------- ------ ---------
| Schmidt_Mike        | PHI  |      49 |
| Wynn_Jimmy          | LAN  |      47 |
| Morgan_Joe          | CIN  |      46 |
| Stargell_Willie     | PIT  |      46 |
| Smith_Reggie        | SLN  |      40 |
| Zisk_Richie         | PIT  |      33 |
| Bench_Johnny        | CIN  |      32 |
| Garr_Ralph          | ATL  |      31 |
| Garvey_Steve        | LAN  |      29 |
| McCovey_Willie      | SDN  |      28 |
 --------------------- ------ ---------
Why did the voters elect Garvey over these other superior hitters? Well, some of these guys were on non-contending teams, including Mike Schmidt, but that doesn't explain why Garvey's teammate Jimmy Wynn finished fifth in the voting (not to mention the Pirates, Reds and Cardinals in the above list).
Garvey batted .312/.342/.469 on the year, with 21 homers and 111 runs driven home. He did not lead the league in any category, though he was Top 10 in several. Here's my take on how he won the MVP: he batted over .300, knocked out 200 hits and had the highest RBI total of players on an NL playoff team (the other being the Pirates). That and the great hair, of course.
Did Garvey do anything in the non-hitting categories to boost his case and vault him over the better hitters in 1974? No, not really. Here are the numbers:
 --------------------- ------ --------- ------- ----- ------ ------ ---------- ------
| Name                | Team | Batting | Range | Arm | BsRn | GIDP | Position | WAR  |
 --------------------- ------ --------- ------- ----- ------ ------ ---------- ------
| Garvey_Steve        | LAN  |      29 |     0 |   0 |    3 |    2 |      -10 |  4.8 |
 --------------------- ------ --------- ------- ----- ------ ------ ---------- ------
I don't think of Garvey as a speedster, but he was above average in the speed categories of baserunning and avoiding double plays. He was average in defensive range and arm (although he was famous for having a very weak arm), but he takes a -10 run hit for playing first base. An overall WAR value of 5 is nothing to be ashamed of, but Garvey was not among the ten most valuable National League players in 1974:
 --------------------- ------ --------- ------- ----- ------ ------ ---------- ------
| Name                | Team | Batting | Range | Arm | BsRn | GIDP | Position | WAR  |
 --------------------- ------ --------- ------- ----- ------ ------ ---------- ------
| Schmidt_Mike        | PHI  |      49 |    17 |   1 |    1 |    2 |        4 | 10.0 |
| Morgan_Joe          | CIN  |      46 |     3 |   1 |    8 |    1 |        4 |  8.8 |
| Wynn_Jimmy          | LAN  |      47 |    12 |   2 |   -1 |    2 |       -2 |  8.4 |
| Bench_Johnny        | CIN  |      32 |    11 |  -1 |   -1 |    0 |        9 |  7.5 |
| Evans_Darrell       | ATL  |      18 |    18 |   2 |    2 |    1 |        4 |  6.8 |
| Stargell_Willie     | PIT  |      46 |     1 |   1 |   -2 |    0 |       -7 |  6.2 |
| Rose_Pete           | CIN  |      18 |    15 |   5 |    4 |    1 |       -9 |  6.0 |
| Smith_Reggie        | SLN  |      40 |     8 |   0 |   -2 |   -3 |       -7 |  5.7 |
| Cedeno_Cesar        | HOU  |      20 |     4 |   4 |    7 |    1 |       -2 |  5.7 |
| Oliver_Al           | PIT  |      28 |     6 |  -4 |    6 |   -3 |       -4 |  5.2 |
 --------------------- ------ --------- ------- ----- ------ ------ ---------- ------
Wow, look at the fabulous season that Mike Schmidt had. Best hitter in the league, one of the best defensive players and above average in all the other categories. Achieving a WAR of 10 is no small feat: it has only been done 36 times since 1955.
The fantastic thing about having this WAR database (did I thank Sean for this yet?) is it makes clear just how some very good players end up getting underrated, because a lot of their value comes in the non-hitting categories. Jimmy Wynn, Darrell Evans and arguably Cesar Cedeno fall into this group. Wow, just noticed that Pete Rose had a great year with the glove in 1974.
In case you were wondering, Steve Garvey ranked 14th in WAR in the NL in 1974.
-------------------------------------------------------------------
So, I hope I have given you a flavor for just how useful Sean's WAR database really is. You could use it to answer many, many questions, of course. Which players are underrated because much of their value is in the non-hitting categories? Which players were the most well-rounded or one-dimensional? Who had value because of speed and who despite of a lack of it? Or let's talk about teams: The 1985 Cardinals stole 314 bases — how much impact did their baserunning have on their offense? Were they the best baserunning team of the last half-century? Who were the best defensive teams and the worst?
Oh, the mind reels at the possibilities. All the numbers are there, waiting to be looked at. Thank you, Sean.
John Walsh is a regular contributor to the Hardball Times. He welcomes comments via email.
| Designated Hitter | April 16, 2009 |
Precisely Inaccurate
Perhaps the widest and deepest pitfall lying in wait for any who deal in numerical analyses is forgetting the distinction between precision and accuracy. If I state that Team X's opening-day first pitch was delivered at 1:07:32 pm, I am being quite precise; but if in fact it was a night game, then the statement that the pitch was made sometime between 7:35 and 7:40 pm, though far less precise, is far more accurate.
It is all too easy to be hypnotized by the ability to calculate some metric to a large number of decimal places into believing that such precision equates to accuracy. As a case in point, let us look over the concept of "park factors". It is undoubtable that ballparks influence the results that players achieve playing in them, and in many cases--"many" both as to particular parks and as to particular statistics--those influences are substantial. Park factors are intended as correctives, numbers that ideally allow inflating or deflating actual player or team results in a way that neutralizes park effects and give us a more nearly unbiased look at those players' and teams' abilities and achievements. So much virtually everyone knows.
The idea behind the construction of park factors, stated broadly, is to compare performance in a given park with performance elsewhere. As an example, a widely used method for educing park factors for a simple but basic metric, run scoring, is the one used by (but not original to) ESPN. The elements that go into it are team runs scored (R) and opponents' runs scored (OR) at home and away, and total games played at home and away.
           (Rh + ORh) ÷ Gh
  factor = ───────────────
           (Ra + ORa) ÷ Ga
That comes down to average combined (team plus opponents) runs scored per game at home divided by the corresponding figure for away games. Let us see what some of the things wrong with that basic approach are, and if we can improve on it.
A "park factor" is supposed to tell us how the park affects some datum--here, run scoring. Perhaps the most obvious failing of the ESPN method is made manifest by the simple question compared to what? In the calculation above, run scoring at Park X is being compared to run scoring at all parks except X. Thus, each park for which we calculate such a factor is being compared to some different basis: the pool of "away" parks for Park X is obviously different from the pool of "away" parks for Park Y (in that X's pool includes Y but excludes X itself, while Y's includes X but excludes Y itself). Now that rather basic folly can be fairly easily corrected for; let's call the average combined runs per game at home and away RPGh and RPGa, respectively. Then, if there are T teams in the league,
                        RPGh
  factor = ───────────────────────────────
           {[RPGa x (T - 1)]   [RPGh]} ÷ T
But there remain considerable problems, the most obvious being that the pools are still not identical, in that schedules are not perfectly balanced: Teams X and Y can, and probably do, play significantly different numbers of games in each of the other parks. Even if we throw out inter-league data, which is especially corrupt owing to the variable use of the DH Rule, we still have differing pools for differing teams, at least by division (and possibly even within divisions, owing to rainouts never made up). Well, one thinks, we can see how to deal with that: we would normalize away data park by park, then combine the results, so the "away" pool would, finally, represent the imaginary "league-average park" against which we would ideally like to compare any particular park's effects.
Let us remain aware, however, before we move on, that there are yet other difficulties. We have been using the simple--or rather, simplistic--idea of "games" as the basis for comparing parks' effects on run scoring. But even at that level, there are inequalities needing adjustment, in that the numbers of innings are not going to be equally apportioned among home batters, away batters, home pitchers, and away pitchers, in that a winning team at home does not bat in the bottom of the last inning. There is also the further question of whether innings are the proper basis for comparison. For most stats, the wanted basis for comparison is batter-pitcher confrontations, whether styled PA or BFP. But there are complexities there, too. A batter's ability to get walked, or a pitcher's tendency to give up walks, might seem best based on PAs or BFPs; but higher numbers of walks mean a higher on-base percentage, which means that more batters will get a chance to come to the plate (it is that "compound-interest effect" of OBA that is often not properly factored into metrics of run-generation, individual or team: not only is the chance of a batter becoming a run raised, but the chance of getting that chance is also raised). That will increase run scoring in a manner that a metric measured against PAs will not fully capture. And there are yet other questions, such as whether strikeouts should be normalized to plate appearances or to at-bats.
But for our purposes here--getting a grand overview of the plausibility of "park factors"--such niceties, while of interest, can be set aside. Let's look at the larger picture. Let's say we want to get a Runs park factor for Park X. We have seen that we need to use normalized runs per game on a park-by-park basis if we are to avoid gross distortions from schedule imbalances and related factors. How might that look for a real-world example? Let's take, arbitrarily, San Francisco in 2008. Here are the raw data:
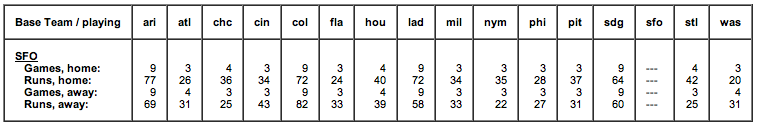
And here are the consequent paired raw factors:
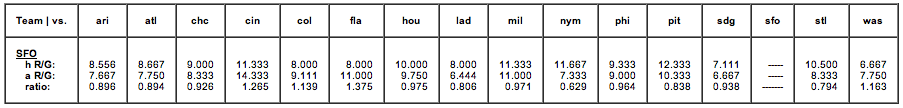
But, because we have used a particular park for these figurings, all those numbers are relative to that park. What we want are numbers relative to that imaginary "league-average" park. For example, if we had chosen the stingiest park in the league, all the factors would be greater than 1; had we chosen the most generous, all the factors would be under 1. But all we have to do is average the various factors--in which process we assign the park itself, here San Francisco (I refuse to use the corporate-name-of-the-day for that or any park), a value of 1, since it is necessarily identical to itself--and then normalize the factors relative to that average. When we do that, we get what ought to be the runs "park factor" for each National-League park relative to an imaginary all-NL average park:

The average is not exactly 1.000 owing to rounding errors, but it's close enough for government work. If we sort that assemblage, it looks like this:
But before we jump to any conclusions whatever about those results, let's ponder this: they were derived from data for one park, one team. Yet, if the methodology is sound, we ought to get at least roughly the same results no matter which park we initially use. Imagine a Twilight-Zone universe in which the 2008 season was played out in some timeless place where each team played ten thousand games with each other team, yet still at their natural and normal performance levels as they were in 2008. Surely it is clear that we then could indeed use any one park as a basis for deriving "park factors" since, in the end, we normalize away that park to reach an all-league basis. In that Twilight Zone world, any variations from using this or that particular park can only be relatively minor random statistical noise. San Francisco is to Los Angeles thus, and San Francisco is to San Diego so, hence Los Angeles is to San Diego thus-and-so (in a manner of speaking). So what do we see if we try real calculations with real one-season data? Let's continue with the National League in 2008. Shown are the "park runs factors" for each park as calculated from each of the other parks as a basis. If the concept is sound, the numbers in each row across ought to be roughly the same. Ha.
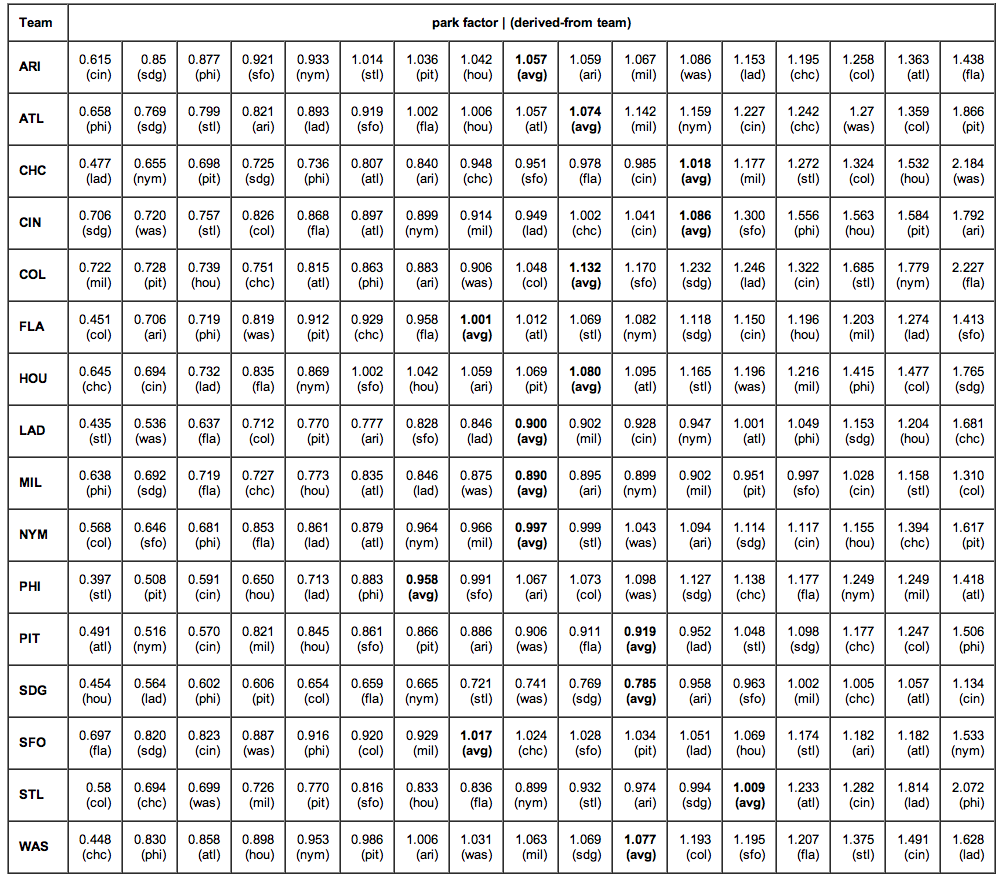
Well, now we know something, don't we? This just doesn't work. But it's not the methodology. Nor is it the various minor factors we saw earlier: those don't produce 3:1 and greater spreads in estimation. No, what we are dealing here, plain and simple, is the traditional statistical bugaboo--an inadequate sample size. Here is a possibly instructive presentation: the averaged run-factor values from that table above compared to what the simplistic ESPN formula yields:
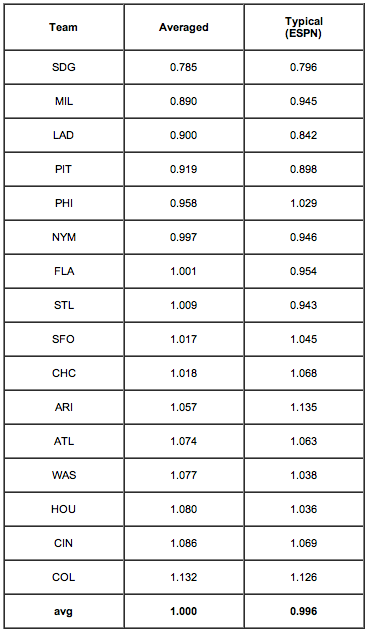
Instructive, indeed. The agreement is not perfect, as we would not expect it to be. The "average" column is a little better than the ESPN column because it allows better for the differing numbers of games on the schedule, but by using the average for each park of the values derived from all the other parks we are approximating the ESPN method.
The entire point of this lengthy demonstration has been to lift the lid off those nice, clean-looking, precise park-effect numbers to show the seething boil in the pot. The end results are not totally meaningless: we can say with fair credibility that San Diego's is a considerably more pitcher-friendly park than Colorado's, and that the Mets and the Marlins were playing in parks without gross distorting effects. But to try to numerically correct any team's results--much less any particular player's results--by means of "park factors" is very, very wrong.
But wait, there's more! (As they say on TV.) If the problem is a shortage of data, why not simply expand the sample size? Use multi-year data? That would be nice, and useful, were no park changed structurally over a period of some years. But consider: not even counting structural changes, in the last ten seasons (counting 2009), a full dozen totally new ballparks have come on line. When one considers that pace, plus the changes (some even to a few of those new parks), it becomes painfully obvious that trying multi-year data is as bad or worse. Even for a particular park that might itself not have been at all changed for many years, there remains the issue that the standard of comparison--that imaginary league-average park--will have changed, probably quite a lot, over that time, owing to changes in the other real parks. So we can't use multi-season values, and single-season values are comically insufficient for anything beyond broad-brush estimations, estimations more qualitative than quantitative.
I should point out that none of this is today's news. In 2007, Greg Rybarczyk at The Hardball Times noted that the home-run "factor" for the park in Arizona was 48 in one season and 116 in the next. Back in 2001, Rich Rifkin at Baseball Prospectus remarked that "Unfortunately, it is problematic to average out a park factor over more than a few years because the conditions of one or more of the ballparks in a league change. New stadiums are built, existing stadiums change their dimensions, and abnormal weather patterns have an impact." (Regrettably, the next sentence was "Nonetheless, a 10-year sample is likely to be more accurate than a one-year accounting.") Probably the defining essay on the subject is the 2007 paper titled "Improving Major League Baseball Park Factor Estimates", by Acharya, Ahmed, D'Amour, Lu, Morris, Oglevee, Peterson, and Swift, published in the Harvard Sports Analysis Collective. But, justifiably proud as they are of their improved methodology, even they concluded that "Unfortunately, the lack of longer-term data in Major League Baseball . . . makes it extraordinarily difficult to assess the true contribution of a ballpark to a team's offense or defensive strength."
Precisely accurate.
Eric Walker has been a professional baseball analyst for over a quarter-century. His paper "Winning Baseball", commissioned by the Oakland A's for the purpose, first instructed Billy Beane in the concepts later called "Moneyball"; Walker has also authored a book of essays, The Sinister First Baseman and Other Observations. Walker is now retired, but maintains the HBH Baseball-Analysis Web Site.
| Designated Hitter | March 26, 2009 |
As They See 'Em: A Fan's Travels in the Land of Umpires
Back in 1988, in an attempt to make a little extra money during graduate school at UC Berkeley, I tried out to be an umpire for intramural softball. We were given a brief instruction on what to do and a mock game was set up as a tryout.
I was working first base and there was a grounder hit to the second baseman. I tried to remember where I was supposed to stand (about 15 feet behind the bag at a 45 degree angle to either side depending upon whether or not the throw was coming from the left or right side of the infield). The ball was hit... somewhere... and I ran to stand in position. Except I stood near the pitcher in the middle of the play. And then I tripped over my own feet and fell over. I found other part-time employment.
 Bruce Weber, a New York Times reporter, had a bit more success when he visited the Jim Evans Umpire School back in 2005 and he ended up writing an interesting book about the lives of umpires, both minor and major leaguers, in his As They See 'Em: A Fan's Travels in the Land of Umpires (Simon and Schuster, $26).
Starting with the bizarre world of umpire school (one student's employer told him "they have a school for that?"), where prospective umpires are put through drill after drill to get them to see a game as an umpire does, instead of as a fan. Weber also has some interesting stories about how umpires are drilled in how to argue with managers and players, and even more importantly, how to take off their mask without having their cap fall off. The latter is extremely important it turns out, although if more umpires start using the hockey style masks, that arcane art may disappear.
Like players, umpires are taught where to position themselves and how to anticipate plays. The most common time you will see an umpire out of position is when a player does something completely unexpected, such as throwing to the wrong base. After all, if the player shouldn't throw to a certain place, why should they be in position to cover a situation caused by a player's mental error.
As Weber points out, umpires are part of baseball that has no constituency that likes it. Players and managers don't like umpires, and umpires like to call players "rats." Front offices don't like umpires. Even the Commissioner's Office, which employs umpires, really doesn't like them. Former Commissioner Fay Vincent says that teams view umpires like they were bases, just pieces of equipment that you have to have to play the game.
One of the hardest things Weber faced in writing his book was getting people to talk to him. Players and managers generally didn't want to speak to him because they feared payback from umpires. Even Earl Weaver, long out of the game, wouldn't speak to Weber about umpires. Umpires didn't want to speak too much out of turn because they feared for their job security.
Umpires who graduate at the top of their classes at one of the two umpire schools (Harry Wendlestedt operates the other one), are given jobs in Rookie or Short-season A leagues as parts of two-man crews who drive hundreds of miles between cities and stay in motels that often appear as if they have hourly rates. MLB views minor league umpiring as "seasonal work" so the pay is low, sometimes around $800 per month. It's a job you have to love somewhat because most people could make better wages at McDonald's.
For the privileged few who make it to the majors (there are 68 full-time MLB umpires), the job becomes even more tense. Every call is scrutinized and there is nothing positive that an umpire can do. They can only screw up.
Since an MLB umpire's job is so coveted, Weber could only get a few umpires to speak to him on the record and even some were not entirely forthcoming. The disastrous mass resignation plan of 1999 has left deep wounds among the corps of umpires. Interestingly, Weber points out that even though umpires were no longer separated by league at the time, the battle lines in that dispute split along AL-NL lines, with the AL umpires (who long felt that they were below the NL in the pecking order) taking the opportunity to assert leadership in a new union.
I found the best parts of the book when Weber goes into some detail about the mechanics of umpiring. It's one part of baseball that few people seem to care about, unless they think an umpire screwed up. Then people are experts on the matter.
For example, when there is a bunt play going on and the defense puts on "the wheel" play, watch the umpires. They don't move. They have to watch the bases. But if there is a ball hit down the left- or rightfield lines, the umpires will wheel around, while the infielders will generally stay by their bases to make a play on a runner or the batter-runner. (If you want to be an umpire, learn to say "batter-runner," "ball-strike indicator," and don't let anyone call you "Blue.") Umpires also have responsibilities to make sure that all the runners touch their bases and it's a subtle skill that they pick up over time.
Weber also gets umpires to explain how pitchers like Greg Maddux and Tom Glavine get seemingly wider strike zones than other pitchers. Briefly, it's because those pitchers have such good control that they can keep placing the ball further and further on the corner of the strike zone. And then they are able to work inside and outside the edge until the outside edge of the strike zone gets wider because of the umpire's perception of where the pitches go. Maddux and Glavine in a sense have earned bigger strike zones because of their skill, and not just because of their reputation.
One thing that did surprise me is how open umpires were to technological improvements in the game. Replay review of home runs was welcomed because the umpires know how difficult some parks were for making those calls. It's likely that in 2009, umpires will err on the side of calling a ball in play rather than a home run because it is simpler to remedy that call with replay rather than the other way around.
The final chapter of the book includes interviews with umpires who have made some of the most controversial calls in recent history: Larry Barnett (who didn't call interference on Ed Armbrister in the 1975 World Series, despite Carlton Fisk's protestations), Doug Eddings (of the 2005 ALCS call involving A.J. Pierzynski and Josh Paul and the dropped third strike), Richie Garcia (of Jeffrey Maier fame), Tim McClelland (who was the umpire for the George Brett Pine Tar Game and The Did Matt Holliday Touch The Plate Game), and Don Denkinger (1985 World Series Game 6, bottom of the 9th).
Each umpire gets a chance to explain what they did and didn't see or what they did or didn't do. Denkinger freely admits blowing the call on Jorge Orta, but explains how it came about. But that will likely not satisfy Cardinals fans. Some of them still want blood 24 years after the fact.
Weber wants fans to have a greater appreciation for the work that umpires do. The umpires are far from a perfect lot. They are profane. They are sexist (the few female umpires who have been in the minors were treated horribly). They aren't there to make the fans or players happy. They are at games to keep them under control. It's a job that not many people have the ability or temperament for. But those that do it, do care about doing their jobs well. Nevertheless, I predict plenty more complaining about umpires this year from just about everybody. It's one of baseball's constants.
From the benches, bleak with people, there went up a muffled roar,
Like the beating of the storm waves on a worn and distant shore.
"Kill him! Kill the umpire!" shouted someone in the stands,
And it's likely they'd have killed him had not Casey raised his hand.
- From "Casey at the Bat" by Ernest Lawrence Thayer, 1888
Bob Timmermann, formerly of The Griddle, is a senior librarian for the Los Angeles Public Library and runs One Through Forty-Two or Forty-Three.
| Designated Hitter | March 25, 2009 |
A Long Time Ago In A Galaxy Far Away. . .
[Editor's note: John Brattain, a writer for The Hardball Times, Baseball Digest Daily, and his own blog Ground Rule Trouble, and a sincere friend of Baseball Analysts, passed away on Monday due to complications from heart surgery. John, who is survived by his wife Kelly and two daughters, was 43 years old. Known as "The Bones McCoy of THT" at the Baseball Think Factory, his signature line was "Best Regards, John." In sympathy and as a tribute to John and his family, we present his guest column — a terrific piece about Robert Lee "Indian Bob" Johnson — from December 22, 2005. Best Regards, John. - Your Pals at Baseball Analysts.]
One of the great oddities in baseball is how we perceive players. If a player does one or two things spectacularly well, he ultimately ends up being better regarded than players who do a lot of things well. Of recent vintage was 1998 and 1999 when home run behemoths Mark McGwire and Sammy Sosa got all the ink over players like Barry Bonds and Ken Griffey Jr. Earlier in the decade in Canada RBI man Joe Carter had a higher profile than Larry Walker. Or, if you wish to go back to the 1970's and 1980's, you'll find more casual fans have heard of Dave Kingman over Dwight Evans.
For that matter, don't you find it odd that Tim Salmon never went to an All-Star Game? Not one.
Bill James said in his book Whatever Happened To The Hall of Fame--The Politics Of Glory that players who do one or two things well tend to be overrated while those who do a lot of things well tend to be underrated.
Today we're going to talk about an historically underrated player. He didn't have one ability that defined him but didn't have a single hole in his game: he could hit, hit with power, run, field and throw. Baseball-Reference has tests that involve Black Ink and Gray Ink. Black Ink describes how often a player led the league in some statistical category; Gray Ink describes how many times he finished top ten in the league. This player has two points of black ink but 161 points of gray ink.
In other words, he was never the best, but consistently among the best.
We're talking about Robert Lee "Indian Bob" Johnson.
Johnson was born in Oklahoma in 1906, and his family soon moved to Tacoma, Washington. He left home in 1922 at age 15 and began his baseball career with the Los Angeles Fire Department team. Because Johnson was part Cherokee, he was subjected to the nickname "Indian Bob," just as other players of Native American ancestry had similar epithets foisted upon them in this era.
Johnson was soon playing semi-professional ball. When his brother, Roy Johnson, became a professional, he felt buoyed. He said, "When Roy became a regular with San Francisco in 1927 I knew I could make the grade in fast company. I had played ball with Roy and felt I was as good as he was."
However, Johnson failed trials with San Francisco, Hollywood, and Los Angeles. He did not play professionally until Wichita of the Western League signed him in 1929. Johnson played in 145 games at two levels and batted .262 with 21 HR while slugging .503. After again hitting 21 HR (in just over 500 AB) the following season in Portland, he went to spring training with the Philadelphia A's but didn't make the roster due to his inability to hit the curveball. Over the next two seasons in the minors, Johnson batted a combined .334 with 51 HR while slugging .567 and showing both patience at the plate and a powerful throwing arm in the outfield.
Opportunity knocked in 1933 as Connie Mack sold off veteran Al Simmons to the White Sox leaving Johnson and Lou Finney to battle for the leftfield job in spring training. Johnson won the job and had an excellent freshman season at age 27...
 AVG/ OBP/ SLG  Runs 2B 3B HR RBI OPS  RCAA
.290/.387/.505  103  44  4 21  93  134   37
...and was generally considered the league's finest rookie.
Johnson would quickly prove that 1934 was no fluke. On June 16th, the A's and White Sox played a twin bill. After losing the opener 9-7, the A's come back to win game two 7-6. Johnson went 6-for-6 with two home runs (both off Whit Wyatt), a double, and three singles. Four days later, he hit his 20th round tripper of the season against the Browns giving him the league lead (he finish fourth). He also enjoyed a 26-game hitting streak. After two fine seasons, Johnson was beginning to get recognition as he was named the starting left fielder of the American League All Star team in 1935. Johnson also finished fourth in the loop in home runs for the third time in his first three seasons and enjoyed his first 100 run/100 RBI season (he had topped 100 runs in both 1933 and 1934).
Despite turning 30 in 1936, Johnson kept right on raking and showed a little extra speed on the base paths, hitting a career high 14 triples. In both 1936 and 1937, he ripped 25 HR driving in 100 runs despite not getting 500 AB in '37; of interest, on August 29 he again victimized the White Sox in a doubleheader as the A's set a new AL record in the opener of a twin bill by scoring 12 runs in the opening frame, six of which were driven in by Johnson. After four years in the majors, other aspects of Johnson were becoming known around the league. Johnson was a bit of a practical joker, and it was in 1937 when Yankees' HOF second baseman Tony Lazzeri pulled a prank on him, knowing he would probably appreciate the joke.
Lazzeri doctored a ball over the course of two weeks by pounding it with a bat, soaking it in soapy water, and rubbing it extensively with dirt and finally coating it with white shoe polish to make it look like new. Bill James described it as a ball that was "as dead as Abe Lincoln." It was so heavy and lifeless that it would plop down harmlessly once struck with a bat.
Lazzeri sprang his joke on September 29 long after the Yanks had clinched the pennant. During an inning in which Johnson was due to bat, he ran out to second base with the gag ball in his pocket. When Johnson stepped into the batter's box, he trotted out to the mound and switched balls with Yankee southpaw Kemp Wicker. Wicker grooved Lazzeri's "mushball" down the pipe and Johnson took a mighty cut and hit it on the screws. However, rather than hitting a prodigious moonshot, the ball plopped harmlessly foul behind the plate while a perplexed Johnson stood there wondering just what the hell happened while the other players and the crowd burst into laughter.
Johnson continued to get better as he aged as he put together his best two seasons at 32 and 33, topping 110 runs/RBI both years while batting at least .300/.400/.500. On June 12, 1938, Johnson was a one-man wrecking crew against the St. Louis Browns, hitting three bombs (and a single) and driving in all eight runs.
1938 and 1939
 AVG/ OBP/ SLG  Runs  2B 3B HR RBI OPS  RCAA
.325/.422/.553  229   57 18 53 127  146   95
Johnson was also developing the reputation of being an athletic fielder. He lead the AL in assists twice (in The New Bill James Historical Baseball Abstract, the best outfield arm of the 1940's is said to be either Johnson or Dom DiMaggio and he was also 4th all-time in outfield assists per 1000 innings) and also filled in occasionally at second and third base (poorly it should be added). He was named to the AL All-Star team both years.
Johnson finally began to show the effects of age during his age 34 and 35 seasons and started to lose some bat speed. Connie Mack even felt the need to give his star slugger time off from covering the expansive left field pasture at Shibe Park, playing him 28 games at first base in 1941. He still had power and a sharp batting eye and remained a potent RBI man, topping 100 RBI in both 1940 and 1941--the latter his seventh straight season over the century mark.
Johnson's power started to wane in 1942 as he suffered through his worst season statistically to that point in time, failing to hit 20 HR or 90 RBI for the first time in his career. However, part of this was attributable to the fall of offense across the board due largely to players enlisting in the military for WWII. His OBP and SLG marks were still good for top 10 finishes in the Junior Circuit and good for fifth in MVP voting. After continually clashing with Mack over pay, the manager finally said goodbye, sending him to the Washington Senators for third sacker Bob Estalella and Jimmy Pofahl. Baseball Almanac notes that this was the only time in baseball history where a player who led his team in RBI for seven straight years was traded.
Johnson lasted one year with the Senators where age and huge Griffith Stadium all but neutered his power as he slugged a career low .400, and for the first and only time in his career he failed to hit at least 10 home runs (7). He was sold to the Boston Red Sox by Griffith who later regretted the move. The diluted war-time talent in the majors coupled with Fenway Park's hospitable climate for right-handed hitters allowed Johnson to finish out his major league career in style. In a season which either spoke highly of Johnson's ability at age 38 or spoke poorly of the level of war-time talent left in the majors by 1944--*cough* Browns win the pennant...Browns win the pennant *cough*--Johnson enjoyed his finest statistical season (including hitting for the cycle on July 6):
 AVG/ OBP/ SLG  Runs  2B 3B HR RBI OPS  RCAA
.324/.431/.528   106  40  8 17 106  174   61
Still, a lot of other fine players also played through the war years including HOFers Paul Waner, Chuck Klein, and Joe Medwick and didn't play as well as Johnson. Further, he was able to play 142 games in left field and enjoyed his first season on a team .500 or better since his rookie year as the Red Sox finished 77-77. For his efforts he was named to his seventh All Star team and finished 10th in MVP voting. As World War Two dragged on to 1945, Johnson was able to enjoy one last moment in the major league sun. He played 140 games in left field and provided the Red Sox with 82 runs created (AL left fielders averaged 67 RC in 1945), which earned him his eighth and final All Star nod. With the war over, Johnson pushing 40, and the return of Ted Williams, the Red Sox and Johnson parted company and he continued his career with the Milwaukee Brewers in the American Association.
Despite his advanced athletic age, Johnson managed to hit .270 with 13 HR and a .456 SLG in 94 games. He moved on to Seattle of the Pacific Coast League for the next two years, batting .292 with 35 doubles, 12 HR and a .441 SLG in 487 AB. Johnson, now 44, went home to play for and manage the Tacoma Tigers in the Western International League where he wielded a potent bat, hitting .326 with 13 doubles, five homers and a .463 SLG in 218 AB. He didn't play in 1950 but resurfaced briefly in Tijuana the following year at age 46. Johnson batted .217 in 21 games, then hung up his spikes for good.
So how do we measure Johnson's career? He probably missed being a Hall of Famer by a whisker. Johnson was hurt perceptually due to playing on second-division teams never reaching the World Series or even coming particularly close to one. He was also overshadowed by all-time great outfielders like Joe DiMaggio and Williams. Further, he finished his career during the second World War. Also working against him was his consistently high level of play; his OPS never going higher than 174 or dropping below 125 and always provided above-average offense for his position. He never had an eye-popping, jaw-dropping season that nets players MVP awards. He is also perceived by many to be the equivalent of the Phillies fine outfielder of the 1940's and 1950's, Del Ennis.
In short, he was invisible.
However, when we examine his record, he fits right in with four contemporary outfielders who are in the Hall of Fame and three of whom--like Johnson--finished their careers during WWII: Earl Averill, Klein, Medwick, and Paul Waner.
Player              AVG   OBP   SLG Runs   HR  RBI  OPS  RCAA*
Bob Johnson        .296  .393  .506 1239  288 1283   138  413
Earl Averill       .318  .395  .533 1224  238 1164   133  391
Chuck Klein        .320  .379  .543 1168  300 1201   137  409
Paul Waner         .333  .404  .473 1190  139  957   134  588**
Joe Medwick        .324  .362  .505 1198  205 1383   134  368
Del Ennis          .284  .340  .472  985  288 1284   117  145
* Runs Created Above Average is a counting stat
**Waner's career length is the longest of the six players
As mentioned, a lot of folks dismiss Johnson's achievements because of a superficial statistical similarity to Del Ennis. I threw Ennis in here to show that he's not at all comparable to the above group. His HR/RBI totals are similar but he's last in AVG/OBP/SLG, runs, OPS and RCAA. The difference between Johnson and Ennis' respective levels are about the same as Rusty Greer (120 OPS /149 RCAA) and Chipper Jones (141 OPS /429 RCAA); nobody suggests that Greer and Jones are similar as hitters. In the chart above, we can see how close Johnson's level of play was to Hall of Fame quality. His eight All Star selections reflects the high regard contemporaries viewed Johnson. After Al Simmons was sold to the White Sox, Johnson all but became the Athletics offense. During his ten years with the A's, the team created 7612 runs. Johnson was responsible for 1162 (15.26%). The roster over that ten years were -420 RCAA while Johnson had 317 RCAA.
Although never topping statistical lists, Johnson was consistently among the leaders. From the period 1930-50, Johnson was tied for second in doubles (396), eighth in triples (95), third in home runs (288), third in runs (1239), second in RBI (1283), sixth in OBP (.393), sixth in SLG (.506), and fifth in OPS (.899). Here are the top ten finishers in RCAA (totals accumulated before 1930 and after 1950 are not counted):
1.    Ted Williams                908
2.    Joe DiMaggio                695
3.    Babe Ruth                   460
4.    Bob Johnson                 413
5.    Charlie Keller              394
6.    Earl Averill                356
7.    Tommy Henrich               274
8.    Jeff Heath                  261
9.    Al Simmons                  250
10.   Roy Cullenbine              215
Johnson's RCAA is 73rd all time. When you consider that, along with being a fine fielder with a terrific throwing arm, you begin to appreciate the complete package that was Robert Lee "Indian Bob" Johnson. Truly an All Star in the fullest sense of the word and an unappreciated talent. When you look back at some of the superb players to grace the diamond in the 1930's and 1940's, don't forget about the man that patrolled left field at Shibe Park for a decade.
John Brattain writes for The Hardball Times and his work has been featured at About.com, MLBtalk, Yankees.com, Replacement Level Yankee Weblog, TOTK.com, Bootleg Sports, and Baseball Prospectus.
[Additional reader comments and retorts at Baseball Primer.]
| Designated Hitter | March 19, 2009 |
Unicycles and Delusion
One option would be to stay away from the games, to stop caring altogether. Another would be to wallow in the hangover of 99 losses and declare all decisions a disaster before they are even conceived, let alone executed. The more radical among you might prefer simply to enjoy a fine day at the ballpark and the respite it brings from more mundane concerns.
Losing sucks, but it beats going to work.
Enough with the pep talk. What's actually happening with the Padres?
There is a theory, backed by data, that Petco Park significantly benefits pitchers. There is another theory that every theory breaks at some point. Well, maybe; I just made that up. The important point is that the current staff is going to crank every faucet in the house at the same time and see if the pipes hold. But it won't be a one-time test; it'll be a way of life.
If you like offense, you go to Coors Field. If you like pitching, you go to Petco Park. If you can't figure out what the heck you like, try watching the Padres this year. Ask yourself exciting philosophical questions such as, "How bad can a pitcher be and still derive benefits from that ballpark?" Perhaps the environment -- when inhabited by the likes of Cha Seung Baek, Kevin Correia, and Josh Geer -- will collapse. It could be that both Petco Park and the rotation will be annihilated when they collide. I'm not saying it's likely, but you have been warned.
Silk Print Shirts and Bowlers
On the bright side, Jake Peavy and Chris Young are still here for now. Peavy is very outspoken and Young is very tall. If baseball doesn't work out for them, they would make a great comedy team. I have visions of Peavy cracking wise and Young playing the straight man. Maybe they could solve murder cases together and have a boss who can't abide by Peavy's behavior but who can't afford to part with him either. Peavy would wear silk print shirts and Young would don a bowler. Wackiness would ensue, probably over some minute misunderstanding.
Meanwhile, the bullpen is going to get a lot of work. That is thrilling if your name is Chris Britton or Mark Worrell, and you've always wanted to pitch in the big leagues. It is thrilling also if you are a fan. I am obligated here to mention that an old definition of "thrill" is "To perforate by a pointed instrument; to bore; to transfix; to drill."
I didn't say it would be fun. I said it would be thrilling.
Amusingly, and a point that is missed by many, the strength of this team will continue to be the offense. It will be disguised by Petco Park, of course, but Brian Giles will get on base, Adrian Gonzalez will mash, and Chase Headley will have worked through his awkward phase -- at the plate, at least; defense is a different story. Pray for everyone's health when the ball is hit his way. It may not help, but at least you'll feel proactive.
Like a Slow Corey Patterson
Kevin Kouzmanoff puts another theory to the test. Seven men have struck out 130 times or more in a season while drawing 25 walks or fewer (arbitrary points, but you get the idea):
Bo Jackson, 1988, age 25: .246/.287/.472, 25 BB, 146 SO
Cory Snyder, 1989, age 23: .215/.251/.360, 23 BB, 134 SO
Alfonso Soriano, 2002, age 23: .300/.332/.547, 23 BB, 157 SO
Corey Patterson, 2002, age 22: .253/.284/.392, 19 BB, 142 SO
Jeff Francouer, 2006, age 22: .260/.293/.449, 23 BB, 132 SO
Kevin Kouzmanoff, 2008, age 26: .260/.299/.433, 23 BB, 139 SO
Carlos Gomez, 2008, age 22: .258/.296/.360, 25 BB, 142 SO
We can learn two things from this: First, do not name your kid Cor(e)y. Second, it's easier to get away with these things if you have football in your hip pocket as a backup plan. Sorry, did I say hip? My bad.
Oh, you were looking for a useful lesson. Okay, here's one: If you are not Alfonso Soriano, don't attempt this strategy.
The stupid part is I actually think Kouzmanoff can hit. But that's just from watching him; the numbers make my head explode. It's like the tired old saw, "I need that like I need a slow Corey Patterson." And if that isn't a tired old saw, it should be.
Irresistably Immovable
The shenanigans aren't limited to on-field activities either. Matt Vasgersian hopped in his El Camino of the Imagination (with apologies to Carl Sagan and anyone who lives in Missouri) and schlepped off to Jersey to do the MLB Network thing.
Ownership is changing hands as we speak. John Moores, who once rescued San Diego from Roseanne Barr's former boss, is now being rescued by Manny Ramirez's former agent. As they say, the dreams in which I'm dying are the best I've ever had.
Payroll isn't expected to change. Neither is fan cynicism or disinterest. Weather will continue to be numbingly benign, and most of us will have our health. One hundred losses is a possibility, as is a World Championship. Other possibilities include, but are not limited to:
- Completing a triathlon
- Winning the lottery
- Flying to the moon
- Getting trapped in an oil painting
Be ready. Lack of preparation is not an excuse.
Still, I find the irresistible/immovable nature of this year's pitching staff at Petco Park... irresistible. Hey, we all have our perversions -- some are more interesting than others.
I want to see how far a Geer fastball will travel in that ballpark. I want to watch Headley ride around on his unicycle in left field. I want to bask in the glow of my own delusion.
I want to hang out and enjoy the games, no matter how hard anyone tries to kill my buzz with their so-called "reality." Is that so much to ask? Well, is it?
Geoff Young covers the San Diego Padres at Ducksnorts, and is a regular contributor to Baseball Daily Digest and Hardball Times. He has written three books about the Padres, the most recent being the Ducksnorts 2009 Baseball Annual, published in March 2009. Geoff lives in San Diego with his wife and two dogs.
| Designated Hitter | February 19, 2009 |
Groundballers
Last week, we looked at how we can interpret groundball averages and what they tell us about the defensive overshift. Now, we'd like to examine some of the more interesting points in our dataset. Of all left-handed batters with at least 200 grounders since 2002, who had the most success with the worm-burner?
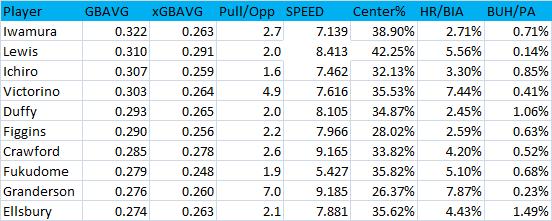
The chart is sorted by groundball average, which for lefties averages out around .225-.230. It is followed by expected groundball average based on pull-to-opposite-field-groundball ratio, speed score, percentage of groundballs to center field, homers per ball in air, and bunts per plate appearance.
Fred Lewis is quite the ballplayer. He has one of the top speed scores in our sample, and according to Pizza Cutter’s speed scores, he was one of the top 35 fastest players in the game last year. But he makes the most of his abilities. Not only can he leg out grounders, but by advanced metrics, he’s an above average left-fielder and baserunner. He stretches hits into triples and is willing to draw a walk to boot. Just wanted to make that observation before we get to...
Land of the Rising GBAVG
Ever notice that all four current Japanese Major League regular position players bat left handed? Though Ichiro Suzuki, Akinori Iwamura, Hideki Matsui, and Kosuke Fukudome all slugged at least 95 points higher in Japan than they have in America, there is one department in which they presumably haven’t suffered since coming overseas. All four players have a strong propensity to reach base via the groundball. Iwamura, Ichiro, and Fukudome all show up on the top 10 list, while Matsui checks in with a .246 groundball average, impressive considering his affliction going the other way. Calculating the difference between their groundball average, and their “expected” groundball average, all four come up in the 20 most “lucky” hitters. However, we wouldn’t attribute their success to luck at all. Ichiro is famous for his unique swing, in which he opens his bottom half and basically is halfway down the line by the time he makes contact. Could this be a method that is taught in Japan? If so, it would probably give someone a much better chance than other lefties of reaching base on grounders. Looking at cherry-picked at-bats, we can say that Iwamura, Matsui, and Fukudome all at times follow similar approaches.
We can estimate that without this skill, over the observed years, Iwamura would have a .260 batting average instead of .280, while Ichiro would be a .310 hitter instead of .330, Matsui .285 instead of .295 and Fukudome .245 instead of .255. This is a remarkable ability. It would be difficult to quantify, but perhaps teams can start timing how long it takes for a batter to get to first following contact. While Matsui has yet to bunt in his career, Ichiro, Iwamura, and Fukudome all get hits on over half their bunt attempts. Perhaps in Japan they emphasize getting down the line, and perhaps in America they should start looking into that. (Cough, Manny, Cough.)
The players we've looked at so far all make the most of their speed and groundball opportunities. But who doesn't? Without further ado...
The Willie Mays Hayes All-Stars
“You gotta stop swingin’ for the fences though, Hayes. All you’re gonna do is give yourself a hernia. With your speed you should be hittin’ the ball on the ground, leggin’ ‘em out. Every time I see you hit one in the air, you owe me twenty pushups.” --Lou Brown (Major League)
Disclaimer: It would be quite a rare instance to find a player who would actually benefit from hitting more grounders than flyballs. We suggest referencing The Hardball Times Baseball Annuals to find specific run values for players' different batted ball types. These are simply players who do a great job reaching base on grounders but fail to do so often.
Chone Figgins: From the right side, it’s acceptable that he doesn't hit many groundballs. Batting righty, he has hit only .230 on grounders over the last six years, while he is also more likely go earn a hit when he gets underneath the ball from that side of the plate than when he does so from the left side. Meanwhile, Figgins not only bats a robust .290 on grounders from his left side but is also very successful bunter. So when Figgins swings for the fences with his career .100 ISO from the left-handed box, know he might be better off legging out grounders.
Iwamura: Aki may have been a 30 homerun a year hitter in Japan, but not anymore, as he is twice as likely to have his groundballs go for hits than his fly balls. His homerun per flyball ratio has decreased to 3.7% this year, and the average true distance of his homeruns has gone down nearly ten feet as well, according to hit tracker. But he’s still a monster when he puts the ball into the turf, except he does so at only a league average rate.
Mark Bellhorn is the final player on this list, and oddly, another 2b/3b combo. Bellhorn may never get another cup of coffee, so it is likely too late for him to change his approach. But it warrants mentioning that he's always been underappreciated in his career due to his strong secondary skills, and he's been able to compile a nice groundball average despite a low groundball percentage.
Curtis Granderson and Brian Roberts could also be on this list, except that they're able to hit however they please and remain successful. Both players hit balls in the air almost twice as often as on the ground, though they hold solid career GB averages in the .265-.275 range. But Roberts consistently hits for decent power, and while Granderson has been excellent at reaching base on ground balls all four full years of his Major League career, he has done a good job of decreasing his groundball percentage as his power has increased--perhaps a conscious decision. Take a look at these graphs:
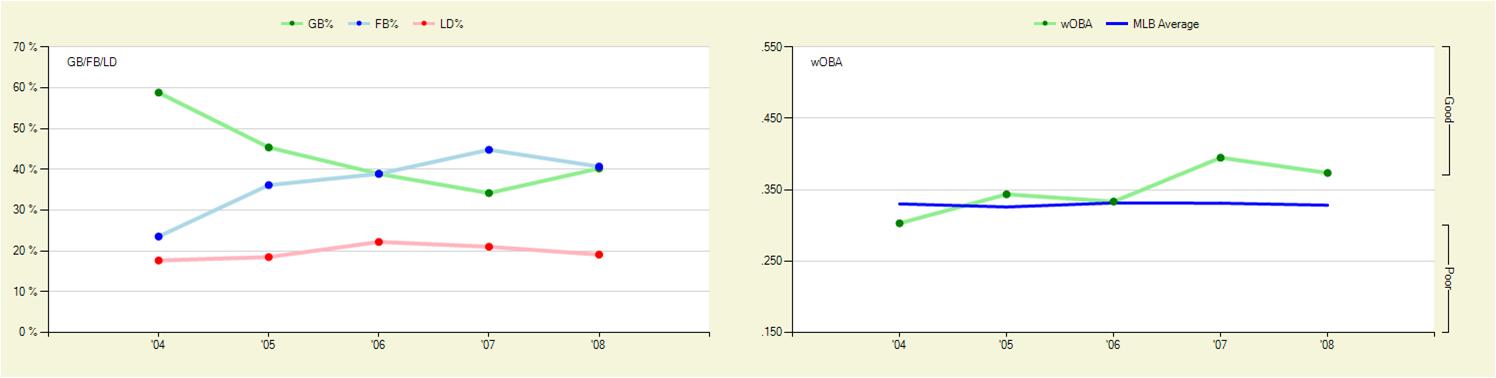
Follow the green lines. As his groundball percentage decreases, his production as measured by wOBA has increased. Though he hit .305 on grounders this year, putting the ball on the ground actually hurt his overall line it appears. He's a better hitter when hitting fewer groundballs, or he hits fewer groundballs to be a better hitter. Either way, he's done a great job improving at the plate
Taking a quick look at righties who weren’t in our dataset: Over the last three years, the only player to have popped up 20% of his fly balls was Eric Byrnes, with a 25.2 infield flyball percentage. As one of the faster players in the game, he could probably use to hit a few more grounders, and he has hit .296 on them since 2002. Carlos Gomez has a similar batted ball profile to that of Byrnes, except without the same type of pop, so he'll either want to develop some muscle or stop racking up 140 strikeouts with a .360 SLG when he might be better off at times pounding the ball into the ground and beating out the throw.
On the reverse end, grounders have been death to Mark Sweeney, Casey Kotchman, and Russ Adams, to the tune of a sub-.200 average, yet they still hit more balls on the ground than in the air.
That's it for our findings on batted ball data. Big thanks to FanGraphs and BillJamesOnline for making this type of data available. And we'd also like to express our deepest gratitude to Rich Lederer for hosting our research.
Leanne Brotsky, David Estabrook, Jeremy Greenhouse, Kimberly Miner, and Steven Smith assisted in writing this article. We would also like to thank Evan Chiachiaro and Dan Rathman, and Anthony Doina who participated in Baseball Analysis at Tufts’ research committee. Any questions can be directed to TuftsBAT@gmail.com.
| Designated Hitter | February 12, 2009 |
BABIP: Progressing and Regressing Groundball Out Rates
A couple of weeks ago, Rich Lederer asked what variables account for extraordinarily low groundball out rates. So, using a similar method to that which Peter Bendix and Chris Dutton used to find expected BABIP, we dug deeper and ran a regression to find expected average on groundballs.
Intuitively, one would think that faster players with the ability to find holes in the infield have the best success rates on groundballs. As Lederer pointed out, defensive alignments and batter handedness are also variables that will affect groundball average. While infield shifts are difficult to quantify, we still attempted some statistical approaches to analyze their effects. And to account for handedness, we limited our sample to only left-handers or switch-hitters batting lefty. Our sample included 206 players with at least 200 total ground balls since 2002. We then ran a linear regression to find the factors that influence a batter's groundball average.
Five variables were significant at a one percent level in our regression—a ratio of pulled groundballs to opposite field groundballs, the percentage of grounders hit to center field, a speed score developed by Bill James, bunt hits per plate appearance, and homers per ball in air. The R-squared is .4648. Here is the regression output, if you're into that sort of stuff.
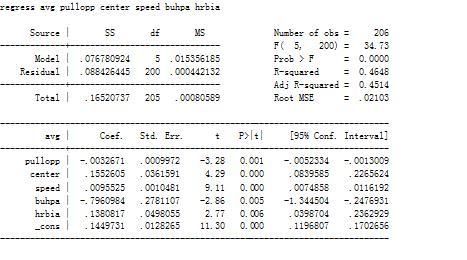
The location of groundballs along with the batter’s speed seem to have the most influence on groundball hit rate, confirming our suspicions. Hitting the ball the other way forces a longer throw, and busting it down the line on grounders is probably the most advantageous way a player can utilize his speed. Velocity of groundballs was difficult to account for. Line drive percentage and grounded into double play percentage, which are likely tied with the hardness of a groundball hit, proved insignificant. Many of you might know the split in batted ball hit average is about .715 on liners, .235 on grounders, and .140 on fly balls. Now, we can break that down further with this data. Lefties hit for a lower average on grounders than righties by about 10-15 points. Opposite field grounders and grounders up the middle from lefties go for hits on average about 30% of the time, while pulled grounders go for hits only 15-20% of the time. Interestingly, hitting homeruns has a negative impact on pulled and total groundball average, but is one of the most significant positively correlated variables that go into opposite field average. One guess is that power hitters tend to hit weaker groundballs to the right side when they roll over their wrists. Or perhaps they pull the ball into a shift, which seems to be supplied only to power hitters due to a likely managerial bias. But when these homerun hitters do hit opposite field groundballs, however rarely, they are apparently more likely to go for hits than opposite field grounders from slash hitters.
One of the main reasons we calculated our expected average value was to examine the exaggerated infield shift more closely. In our sample, we came up with nearly 20 players who we believed to have been “overshifted,” a defensive alignment in which the shortstop plays on the second-base side of the bag and the second-baseman goes to short right field. The shift was originally introduced as a way to get Ted Williams out, and it was brought back in vogue to foil Barry Bonds. By comparing a player’s expected average with his actual average, and using several more basic methods, we were able to draw conclusions about the use of the shift. An average significantly greater than the corresponding expected average indicates that our regression model does not account for something affecting the hitter – maybe a defensive shift.
The players whose expected groundball average most exceeded actual groundball average were Barry Bonds, Rafael Palmeiro, Mark Teixeira, Adam Dunn, and Jack Cust. Their averages all fell at least 20 points below their expected averages, while Jack Cust’s came up almost 30 points short. With this information, we looked at their traditional BABIPs with men on base and nobody on base as a loose measure to determine when these batters are being shifted, and when they’re not. We should note that the average BABIP with men on is slightly higher than with nobody on, and for pull-hitting lefties, there will be an even greater difference as the first baseman will often have to hold on a runner, opening up the hole between first and second base. Bonds, Palmeiro, and Cust all gained at least 30 extra points of BABIP with men on, and Bonds had a .265 BABIP with nobody on and .338 with men on. Dunn showed little split, while we could not isolate Teixeira’s situational left-handed at-bats from his right-handed at-bats. All of these players pull their groundballs at least six times as much as they hit grounders to the opposite field, and they all have slow speed scores, making them prime candidates to be victims of the shift.
Other players who get shifted and who have averages below their expected averages include: Prince Fielder, Justin Morneau, Mike Jacobs, and Jason Giambi. Giambi’s BABIP has been an astounding 95 points higher with men on than with nobody on.
What was almost as interesting was the list of shifted players whose average exceeds their expected average – potentially meaning the shift is not effective against them. David Ortiz, Carlos Pena, and Travis Hafner all fit into this category. There was no noticeable difference between skill sets of these player and the first group, so some other factors must explain this difference. Perhaps this second group includes hitters who are better at locating their hits against the shift. Ortiz does have a split of 45 points between his BABIP with men on vs. nobody on, so we won’t discount the impact of the shift on him.
Within this group of shifted batters, there were some other noteworthy discoveries. Ryan Howard has an incredibly high pull-to-opposite-field-groundball ratio of 11.875—the largest in our sample—yet his average and expected average were about equal, as both values fell within the .200-.205 range. Given his dramatic pull/opp ratio, we have little doubt that the shift has affected him, so we dug deeper to find the answer. Looking at the MLB.com provided hitting charts, and checking the locations of his groundball outs, there is a cluster of outs in short right field over the last two years, but not prior, meaning the decision to shift him might have been recent. Indeed, in 2005-2006, Howard hit .237 on grounders, and then when the shift came into play regularly in 2007-2008, he hit only .175 on grounders. Also notable were Hafner's and Morneau’s extremely low pull/opp ratios, which were 3.98 and 2.99 respectively. According to this statistic, neither player would be an obvious candidate for the shift – yet both are shifted, and as said earlier, it would appear that the shift is detrimental to Morneau. However, the 3-4 defense applied to Hafner never made much sense, as he has rather moderate pull-to-opposite-field-groundball and groundball-to-flyball ratios.
Finally, we looked for any left-handed batters with high pull percentages, who would therefore be good candidates for the defensive shift. Nate McLouth had a pull/opp ratio of 10.208, but his speed statistic is quite high, explaining why teams probably choose not to shift him. If you’re fielding balls in short right field, you won’t get a fast player out. Nick Swisher’s pull/opp ratio 10.92 yet teams do not shift him. Russell Branyan and David Dellucci are also strong candidates for a shift, but none of these players follow the hulking power hitter profile, so managers don’t think twice about creative ways to get them out.
We ran a logistic regression using a value of one if we had evidence that the player had been shifted and zero if not. It turns out that homerun-per-flyball and groundball-to-flyball ratios have been the most significant factors in determining what players get shifted. Bonds’ expected shift score was one, meaning that he is truly the prototype of shifted players. Pull percentage and intentional walks per plate appearance were also significant at a five percent level, but we believe that opposite field groundball rate should be taken into account as well. Evacuating that side of the infield against a hitter who hits any significant amount of opposite field groundballs is simply giving away hits, no matter how many pulled grounders get taken away. There is a clear managerial bias to shift power hitters, while not taking enough into account batted ball location.
Our study is not perfect. We found no good way to quantify the shift, which would allow us to distinguish between players who receive a full shift and those who receive a partial one, or those who are shifted all the time and those for whom only some teams put on the defensive shift. Nevertheless, our study shows some interesting results. By comparing expected ground ball and actual averages, we believe that the shift had the most significant impact on Bonds, Palmeiro, and Cust, and that it had a surprisingly little impact on batters like Ortiz and Pena. In addition, we suggest that Swisher might be a good candidate to shift, and we suggest that managers make decisions based on evidence rather than player reputation. These are only basic observations, yet they shed some light on the hard-to-quantify defensive shift.
Leanne Brotsky, David Estabrook, Jeremy Greenhouse, Kimberly Miner, and Steven Smith assisted in writing this article. We would also like to thank Evan Chiachiaro and Dan Rathman, and Anthony Doina who participated in Baseball Analysis at Tufts’ research committee. Any questions can be directed to TuftsBAT@gmail.com.
| Designated Hitter | February 05, 2009 |
2009 Projections with Hit Tracker
Oh, no, not another projection system! Why would someone want to join the logjam of current systems? In no particular order, we have ZiPS, CHONE, Oliver, Marcel, Bill James, PECOTA and no doubt some others I haven’t stumbled across (sorry). All of these systems are designed to tell us how MLB players will perform next season, but none of them can convincingly claim to be more accurate than all the rest. When I look at any particular player’s projections in the various systems, I see a lot of similarity, which makes me suspect there must be some degree of groupthink going on. I believe there is some potential to improve performance forecasting by doing something different.
In the following paragraphs, I will outline a system for forecasting using Hit Tracker, an aerodynamic model for flying baseballs that is well-known for providing accurate home run measurements. I can guarantee that the Hit Tracker system will be different. Better? I won’t be able to say for sure until the 2009 season is over.
Background: How We Forecast Now
Why is it so difficult to forecast a player’s performance accurately? One huge reason is that every one of the current systems for performance projection starts from a set of data — the player’s prior year’s "box score stats" — that is positively riddled with statistical noise (chief among these uncontrolled noise factors are the dramatic differences in ballpark configurations and playing conditions across the 2,430 games played in 30 different parks over the course of six months).
Let’s consider another familiar form of forecasting: weather. In the 19th century, after the invention of the telegraph, weathermen began to form their predictions by first learning the weather "upwind," and then adjusting those measurements to come up with a forecast. "How hot will it be tomorrow? Well, it was 85 degrees today in the state where our weather seems to be coming from, so we’ll start with 85 and then adjust it up or down according to our experience. It’s usually a little hotter there than it gets here, so let’s say 82 degrees…" They didn’t call them "city factors" back then, but they could have.
After computers became available in the mid-20th century, weathermen became meteorologists, and the process of forecasting weather has continued to become more involved and mathematical as the years have gone by. Contemporary meteorologists now monitor a much larger array of parameters, and they feed these lower-order parameters into elaborate computer-based models to arrive at predictions for the higher-order outcomes like temperature, or winds, or precipitation. Thanks to more accurate measurements, and more detailed models, weather forecasts are dramatically more accurate today than those of even only 10 years ago.
In my opinion, baseball forecasting systems resemble the "19th century weatherman" system described above: to forecast something, measure something (well, in baseball we should say "count" something) that has happened already, then adjust this number to predict what hasn’t happened yet. So, to predict a player’s home runs, for example, the starting point is always his prior year’s total for home runs (or perhaps a weighted total from several seasons). From this starting point, various adjustments are applied to arrive at a final projection. Never mind where those home runs were hit, or how far they flew, or how much help or hindrance the weather may have provided them. Just count and adjust.
Starting from last year’s total assigns an equal value to what may in reality be very different events. For example, Jeremy Hermida hit two radically dissimilar fly balls last year, each of which cleared the home run fence: first, a windblown 321 foot homer in San Francisco on Aug. 20th, and second, a 443 foot rocket in Miami on July 19th. In a game context, they count the same, but when we are trying to measure the likelihood of future home runs, we should acknowledge that the outcome of one of those fly balls (the short one) was entirely dependent on its ballpark and weather context, while for the other fly ball, the ballpark and weather were irrelevant to the outcome. The short fly ball could only have become a home run in a park with a very shallow RF fence like AT&T Park, and only with the help of a tail wind. The long one would have been a homer in every park major league baseball has ever been played in, in any wind short of a hurricane blowing towards home plate.
Any system that cannot recognize the difference between two events such as these Hermida home runs cannot hope to consistently generate highly accurate predictions. I don’t mean this as a criticism of anyone who has created a projection system, don’t get me wrong. But I do believe that those systems have reached the limit of their capabilities, with average errors of around 60-70 points of OPS, and any further refinement of these models will probably just chase the statistical noise around in circles.
Something Different
How can we get away from the practice of predicting future outcomes by using prior outcomes? I believe that the key is to consider the lower-level processes that lead to the final result of any particular batted ball. Some of these are the landing point of the hit, how hard the ball was hit, and the physical environment that the ball was hit in. For those batted balls where the physical environment is crucial (i.e. long fly balls), we need to measure the trajectory of the ball, the fence dimensions of the park, and the weather. For the rest of the batted balls, where the physical environment isn’t very important to the final result, we don’t need to.
In Hit Tracker, I have developed a method for analyzing the trajectory of long fly balls and projecting them into each of the 30 MLB ballparks for the purpose of generating a performance forecast. It is my hope that this system will yield more accurate performance forecasts.
How It Works: Steps in the Hit Tracker Forecasting Method
- Observe all long fly balls hit by a player in the past 1-3 years.
- A long fly ball is defined as any ball the player hit that might have approached or cleared the fence, if hit in any of the 30 MLB ballparks in any reasonable weather conditions.
- This very liberal standard is applied to ensure that all the long fly balls are captured. Having a few not-so-deep flies in the data set won’t cause any problems, because if a particular ball turns out to be a flyout in every park, this is equivalent to not including that ball in the analysis.
- Analyze each long fly ball in its actual weather conditions, to determine its launch characteristics (Speed Off Bat, Horizontal and Vertical Launch Angles, Spin).
- Note each long fly ball’s original result (2B, 3B, HR, Flyout, etc.).
- Project each long fly ball into each of the 30 MLB ballparks, in the average weather conditions for that ballpark (calculated over a 5-year period).
- Note the hypothetical result of each projected fly ball in each ballpark.
- Balls that fly far enough to clear the fence are judged to be home runs.
- Balls that hit the fence more than 8 feet above field level are judged to be extra base hits.
- All other balls are considered to be "catchable," and are analyzed further using a range model.
- The range model uses standard assumed initial positions of outfielders, a distance vs. time model for an average outfielder, the actual landing point of the ball and the time of flight of the ball to determine if the ball would have been caught.
- An empirical method was used on approximately 1,000 actual fly balls to determine the 50/50 likelihood boundary between outs and hits, in terms of time and distance from the closest outfielder. This boundary is then used as the evaluation criteria for catchable balls: balls inside the range circle of any outfielder for a given time of flight are flyouts, and balls outside it are extra base hits.
- For each ballpark, count the net hits and bases for the long fly ball data set:
- For each ball that was originally a hit, but projected as an out, give a -1 for hits and –X for bases (e.g. for a ball that was originally a short home run to RF in Yankee Stadium, but which projects to be caught in Fenway Park, give -1 hit and -4 bases.)
- For each ball that was originally an out, but projected as a hit, give +1 for hits and +X for bases (e.g. for a ball that was originally a flyout to LF at Yankee Stadium, but which projects to hit the Green Monster in Fenway Park more than 8 feet up, give +1 hit and (usually) +2 bases.)
- For each ball that was originally a hit, but which projects to be another sort of hit, give ± X bases (e.g. for a home run to RCF in Shea Stadium that projects to be an extra base hit in Citi Field, give -2 or -1 bases, depending on the speed of the runner, the location of the hit and the time of flight.)
- Apply the net adjustments to hits and bases for all the long flies to the player’s actual stats for the season in question. Calculate OBP/SLG with the adjustments. This becomes the player’s projection for that ballpark.
- For projections based on multiple years of long fly balls, apply appropriate weighting factors (e.g. 3-2-1) to the projections for each ballpark.
- Using the MLB schedule for the season of the projection, create a projection for the player as a member of each team by multiplying their performance averages in each ballpark by a weighting factor proportional to the number of games each team plays in each park.
Case Study: Manny Ramirez
To further illustrate the method, I am going to highlight some of the findings from the Hit Tracker Analysis of Manny Ramirez over the years 2006-08, and his forecast for 2009.
First and foremost, I hope Manny Ramirez re-signs with the Los Angeles Dodgers for 2009, because Dodger Stadium is an absolutely perfect place for him to hit. I am not saying it is perfect for everyone; in fact, Dodger Stadium is a difficult place to hit for average or below average hitters, because its fences are deep in the corners where lesser hitters typically place their home runs. I am saying that Dodger Stadium is perfect for Manny. Manny’s swing, particularly his phenomenal power to center and right-center field, is ideally suited for the dimensions and environmental conditions of Dodger Stadium. I described the unique layout of Dodger Stadium (deep corners, shallow alleys and center field) in detail in my article, "Hit Tracker 2008," which was published in the 2009 Hardball Times Annual earlier this off-season.
At the opposite extreme, Manny’s home from 2000 to the 2008 trade deadline, Fenway Park, has robbed him of a great number of home runs over the years, perhaps as many as 50, as well as many other extra-base hits. Fenway’s very deep right-center and right fields have turned many of Manny’s towering opposite field drives into outs, and its 37-foot high Green Monster has turned many of his blistering drives to left and left-center field into doubles (or even singles).
A popular image exists of the Green Monster adding lots of extra-base hits to a hitter’s total by turning shallow fly balls into wall-scraping doubles, but this hasn’t been the case for Manny: in the three seasons 2006-08, Manny only hit 6 doubles at Fenway that would have been outs at Dodger Stadium. Over the same period, Manny hit 23 flyouts, 5 doubles and 1 triple at Fenway that would have been home runs at Dodger Stadium.
In the first 4 months of 2008, Manny encountered a particularly bad run of luck with his deep fly balls; despite racking up 20 home runs during that time, Manny could have gotten a lot more. Here is a list of Manny’s deep fly balls for the Boston Red Sox in 2008 that were not actually home runs, but which would have been home runs on an average day in Dodger Stadium. Where the weather negatively impacted his fly ball to a significant degree, this is listed as well:
- April 2, 2008 at Oakland, 407 ft. flyout to deep CF, lost 11 ft. of distance from wind and temperature.
- April 5, 2008 at Toronto, 387 ft. double to LCF.
- April 8, 2008 at Boston, 395 ft. triple to RCF, lost 25 ft.
- April 11, 2008 at Boston, 361 ft. flyout to RF, lost 7 ft.
- April 17, 2008 at New York Yankees, 395 ft. flyout to CF, lost 3 ft.
- April 24, 2008 at Boston (7th inning), 383 ft. double to RCF
- April 24, 2008 at Boston (9th inning), 402 ft. flyout to CF
- May 5, 2008 at Detroit (2nd inning), 415 ft. double to RCF
- May 5, 2008 at Detroit (3rd inning), 416 ft. flyout to CF
- May 6, 2008 at Detroit, 404 ft. flyout to LCF
- May 7, 2008 at Detroit, 402 ft. flyout to CF
- May 18, 2008 at Boston, 368 ft. flyout to RF, lost 9 feet
- May 19, 2008 at Boston, 386 ft flyout to CF, lost 11 feet
- May 23, 2008 at Oakland, 356 ft. flyout to RF, lost 6 feet
- June 4, 2008 at Boston, 364 ft. flyout to RF, lost 18 feet
- July 9, 2008 at Boston, 429 ft double to LCF off top of Monster
- July 19, 2008 at LA Angels, 378 ft double off RF wall
- July 27, 2008 at Boston, 410 ft flyout to RCF triangle
- July 30, 2008 at Boston, 367 ft flyout to LCF, lost 11 ft
Now, to be fair we have to look at the good luck Manny encountered during that same time frame. Here’s the list of Manny’s deep fly balls for the Boston Red Sox in 2008 that were actually home runs, but which would have not have been home runs on an average day in Dodger Stadium (there are 4):
- May 12, 2008 at Minnesota, 354 ft home run to RF
- May 27, 2008 at Seattle, 361 ft home run to RF
- June 1, 2008 at Baltimore, 382 ft home run to RF, got +23 ft help
- July 8, 2008 at Boston, 384 ft home run to LF, got +32 ft help
That’s a net of 15 balls hit by Manny in the first 4 months of 2008 that had the power to fly out of Dodger Stadium, but which didn’t make it out where Manny actually hit them. Watching the video of these hits, the disbelief and disgust on Manny’s face was apparent after several of his blasts came up short due to deep fences, cold/windy weather or a combination of the two. Once he was traded to LA, those balls started making it out at a much higher rate: Manny connected for 9 home runs in only 80 at-bats in Dodger Stadium in 2008.
Forecast: Manny Ramirez 2009
Manny’s forecast for 2009 is based on analysis of all 248 long fly balls he hit during the 2006, 2007 and 2008 seasons. In 143 games in 2009, Manny should continue to perform extremely well in a Dodger uniform: the Hit Tracker forecast projects him to post the following numbers:
Los Angeles Dodgers: .430 OBP, .641 SLG, 1.071 OPS and 36 home runs (including 21 at Dodger Stadium).
As of the posting of this article, Manny is still a free agent, so here are forecasts for some other teams Manny might sign with:
San Francisco: .428 OBP, .618 SLG, 1.047 OPS, 32 home runs.
NY Mets: .417 OBP, .566 SLG, .983 OPS, 26 home runs.
More Forecasts
Here are the Hit Tracker forecasts for several other MLB players. Some of the projections are based on three years of data (2006-08), while some are based only on one year of data (2008). The three-year forecasts are expected to be more accurate.
Forecasts Based on 2006-08 Data
Jason Bay, Boston Red Sox
Boston: .368 OBP, .501 SLG, OPS .869, 27 HR’s
Adam Dunn, free agent
LA Dodgers: .394 OBP, .587 SLG, .981 OPS, 47 HR’s
Washington: .389 OBP, .555 SLG, .944 OPS, 43 HR’s
NY Mets: .382 OBP, .506 SLG, .888 OPS, 35 HR’s
Atlanta: .387 OBP, .543 SLG, .930 OPS, 41 HR’s
Boston: .392 OBP, .549 SLG, .941 OPS, 39 HR’s
Forecasts Based on 2008 Data Only
Mark Teixeira, New York Yankees
New York Yankees: .420 OBP, .588 SLG, 1.008 OPS, 32 HR’s
Matt Holliday, Oakland Athletics
Oakland: .418 OBP, .563 SLG, .981 OPS, 28 HR’s
San Francisco: .426 OBP, .593 SLG, 1.019 OPS, 32 HR’s
Boston: .420 OBP, .557 SLG, .977 OPS, 25 HR’s
New York Yankees: .422 OBP, .584 SLG, 1.006 OPS, 32 HR’s
New York Mets: .417 OBP, .546 SLG, .963 OPS, 24 HR’s
Nate McLouth, Pittsburgh Pirates
Pittsburgh: .348 OBP, .484 SLG, .833 OPS, 29 HR’s
Validation
In an attempt to validate the Hit Tracker forecasting method, I analyzed the 2007 long fly balls of three players who changed teams during the 2007-08 off-season: Torii Hunter, Aaron Rowand and Jim Edmonds. Using this data, I projected their 2008 results as a member of the teams they ended up with, and compared to their actual performances in 2008.
Torii Hunter
HT Projection as Los Angeles Angel: .325 OBP, .485 SLG, .810 OPS, 25 HR’s
Actual as Los Angeles Angel: .344 OBP, .466 SLG, .810 OPS, 21 HR’s
Slightly off on the home runs, but overall a very good projection.
Aaron Rowand
HT Projection as San Francisco Giant: .373 OBP, .507 SLG, .880 OPS, 25 HR’s
Actual as San Francisco Giant: .339 OBP, .410 SLG, .749 OPS, 13 HR’s
This is terrible, but there is an explanation: on June 6th, Rowand sustained a right quadriceps injury that hindered him the rest of the year. His actual production splits are as follows:
Through June 6th: .396 OBP, .526 SLG, .922 OPS, 23 HR’s (pro-rated for a full year)
After June 6th: .303 OBP, .338 SLG, .641 OPS, 9 HR’s (pro-rated for a full year)
The HT projection matched the pre-injury Rowand reasonably well, considering the small sample size of about 1/3 of a season. Since the forecast was based on a relatively injury-free 2007 season, this is a fair comparison to make, I think. By the way, if anyone ever comes up with a way to predict the performance of a player who plays hurt through the final 96 of his 152 games, do me a favor: a) tell me what the stock market is going to do in the next year, b) wait a couple days, c) tell the world. In a year, I’ll be rich, and you’ll be famous!
Jim Edmonds
HT Projection as SD/CHC: .346 OBP, .488 SLG, .834 OPS, 18 HR’s
Actual as SD/CHC: .343 OBP, .479 SLG, .822 OPS, 20 HR’s
This is another good projection. Edmonds hit a lot of deep fly balls to left-center field in 2007 that were caught in his home park, Busch Stadium. That tendency carried over to the following season, but it didn’t help him in San Diego, where he started the year. However, after a May trade to the Cubs, Edmonds found a place where that swing worked well. Left-center field is the most favorable spot in Wrigley Field for home runs, and Edmonds took advantage, hitting 6 of his 11 Wrigley home runs into the bleachers in front of Waveland Ave. On the road he picked his spots well also, hitting 7 of his 9 away homers to left and left-center field. A projection that either didn’t factor in Edmonds’ home park, or which couldn’t discern his tendency to hit the other way with power, would be at a disadvantage when trying to accurately forecast Jim Edmonds.
More Thoughts About Forecasting
Here are some possible adjustments I considered, but decided not to include in the Hit Tracker system:
BABIP Adjustment
Regressing a player’s numbers towards the league average BABIP is a common tactic in projection systems. Instead of leaving alone all the non-long fly balls, I considered trying to adjust these hits according to the hitter’s BABIP, e.g. taking away an appropriate number of hits from the projection if the player showed an unusually favorable BABIP during the prior season(s).
My objection to this method is that I don’t feel that I can be certain that a player’s unusually high (or low) BABIP was due to luck instead of due to some underlying real factor. I don’t want to assume that a player’s BABIP should be a certain value, and regress back towards that value, because I don’t feel confident enough that I can pinpoint what that value should be for each individual player. I definitely don’t want to regress all hitters towards a common BABIP. In any event, the use of three years of data to generate projections should minimize any possibility of a player’s wildly aberrant BABIP ruining his projection.
Age Adjustment
Adjusting a projection for a player’s age is another common tactic which has some merit when one’s objective is to be correct "on average," for a large group of players. However, I feel uncomfortable applying an aging correction factor "across the board," without any regard for a player’s particular situation. Perhaps on average hitters lose a small amount of their power each year, but I don’t feel like I can say for which hitters that is true, and for which hitters that is not true, so I have chosen to leave out an aging factor.
I freely admit that an ideal forecasting system of the future will include some method for predicting the effects of aging on future performance, and that I am leaving it out. In the future I hope to be able to incorporate predictive aging into the HT model in terms of lower-level parameters such as speed off bat, or the direction of hits, rather than a crude adjustment of the final results. Such changes in hitters’ spray patterns can readily be detected (a good example is Jim Edmonds, whose long fly balls have decreased in distance and shifted from RF towards LF for the past several seasons.)
Modeling aging in this more detailed manner should also allow for situations where a decline in raw hitting performance does not manifest in a decline in results, such as a power hitter who loses a bit of distance on his fly balls, but still clears the fence with room to spare. I don’t want to paint that hitter, or any hitter for that matter, with the broad brush of "aging means the numbers get smaller"…
Overall "Regression to the Mean"
Some systems regress all of a player’s box score stats towards a selected value, typically a mean value for a subset of the population such as the AL, NL or all of MLB. The purpose of doing so is to account for the possibility that, due to limited sample size, a player has fortuitously outperformed or underperformed their true talent level. The league mean values are used because it is believed that it is impossible to accurately pinpoint a player’s true talent level.
It is certainly true that in any large sample of players, there will be some players that significantly outperform their true talent, some who significantly underperform, and some who perform roughly at their true talent level. In a system where box score outcomes are the only form of data, it makes sense to regress the outcomes to the mean: even though such a system might make some strange predictions (a career high 3 homers in 2009 for Juan Pierre, who has hit one ball out of the park in his last 1,097 at bats?), overall it will perform better than it could without applying such regression.
However, the Hit Tracker system accounts for variation from true talent level in a different way: by including all long flies instead of just homers, the luck factor for ballparks and weather is removed. By including multiple years of data, the sample size becomes even bigger, further decreasing the need to compensate via some form of regression to the mean. With these methods in use, I don’t feel it is appropriate to also add 75 or 80 at-bats from Gabe Gross to the reigning NL MVP’s numbers from 2008 before trying to predict how Prince Albert will do next year.
Advantages of the Hit Tracker System
- The Hit Tracker system goes a long way towards removing statistical noise from the projection. Most good or bad luck a player may have had because they hit a particular ball in a large or small park, in favorable or unfavorable weather, will be removed.
- Analyzing all long fly balls increases the sample size for evaluating power potential, which is one of the most important variables in performance projection. This method makes it possible to detect unlucky trends (Adam Dunn hit 16 balls more than 400 feet that were not home runs in 2008), or lucky trends (9 of Mark DeRosa’s 21 homers in 2008 were blown over the fence by the wind.)
- Team-specific projections are created, but without the use of the extremely blunt instrument known as Park Factors. Because park-based projections are used, the fit of a player’s spray profile to a park’s dimensions and weather is included, and is crucial. The frequency of visits to other parks is also included, capturing the importance of the unbalanced schedule and the vagaries of the interleague schedule.
- Hit Tracker projections are based entirely on what a player does, rather than what an average player does. Since the HT method is focused on making an accurate projection for a single player (and not an entire league), it does not use across the board regression to the mean. Regression to the mean compensates for variables that are missing from a model: Hit Tracker measures those variables instead.
Disadvantages
- The HT method is time-consuming. The observation data required for this method is not for sale, and the analysis can only be done by me.
- The HT method requires video of all batted balls for the player in question. If any hits are not available, the accuracy of the forecast may be reduced proportionally to the percentage of missing balls.
- Because the method depends on analysis of long fly balls, there is a limited ability to evaluate rookies.
Between now and the beginning of the 2009 season, I hope to post some more forecasts for other players, or perhaps expand some of the one-year forecasts listed above to three years. After the 2009 season we’ll have a chance to see how well this method did. I’m hoping that Hit Tracker will be able to bring the process of making projections forward to where weather forecasting was in the 1970’s: occasionally way off, more often on the money, but still far short of perfection (which is forever out of reach). Then we’ll figure out what the next step is…
Greg Rybarczyk is the creator of Hit Tracker, an aerodynamic model and method for recreating the trajectory of batted baseballs. With Hit Tracker, Greg has analyzed more than 15,000 MLB home runs over the past 3 seasons; a multitude of data on hitters, pitchers, ballparks and more can be found at hittrackeronline.com. While not tracking hits, Greg works as a reliability engineer, and he lives in the Portland, OR area with his wife and two children. Feel free to contact Greg at grybar@hittrackeronline.com.
| Designated Hitter | January 29, 2009 |
A Curt Look at a Hall of Fame Career
"I'd like to think I did well. I'd like to think that, if I had a must-win game, the guys I played with would want me to have the ball. But no, I don't think I deserve to be in the Hall of Fame." – Curt Schilling, January 29 on WEEI AM 850's "The Big Show"
Last week, the always present and oft self-promoting Curt Schilling showed some rare humility over the Boston radio waves and downplayed his chances at one day ending up in baseball's Hall of Fame. Now some will believe that Schilling only understated his case in order for talking heads (and typing hands) to do what I'm doing right now: make a pitch on Schilling's behalf. Even so, because of his polarizing personality among teammates, fans and the baseball writers, Schilling — unfairly or not — may need all the help he can get.
Given the fact that he's fallen short of all those "important" Hall of Fame benchmarks (300 wins, a trophy case full of Cy Young Awards, a Baseball-Reference page listing dozens upon dozens of All-Star appearances, a Wikipedia page featuring quotes on how feared Schilling was on the mound, etc.), the forty-two year old righty looks like a marginal candidate to earn a bronze bust in Cooperstown. All that said, I'm going to state a strong case for Schilling's enshrinement. I mean, "hey man, even though I'm part of the 'younger people on the Internet,' I saw Schilling play his entire career and I always thought he was a Hall of Famer."
The easiest place to start is to look at Schilling's career performance compared to his peers:
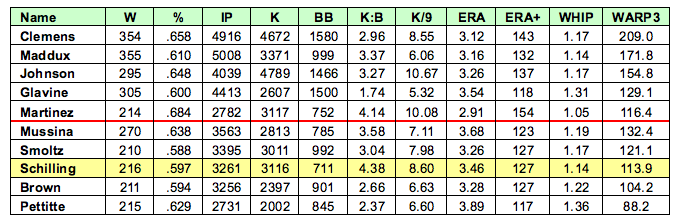
The names listed above are arguably the top ten pitchers during Schilling's career, spanning from 1988 to 2007. There's no question the top five pitchers are no-brainer Hall of Famers (say what you will about the ongoing Roger Clemens saga, but The Rocket is as much an "inner-circle" Hall of Famer as he is a jerk.) After the first five Schilling contemporaries, the numbers start getting blurred but one thing that is clear is that Schilling was one of the best among the next group anyway you slice it. However, before we are so quick to label him "sixth or seventh or eighth best" during his career, let's look a little closer at Schilling's numbers versus the top tier.
Schilling became a full-time starter in 1992 after arriving in Philadelphia – how'd Jason Grimsley work out for ya, Houston? – and was a mainstay in the big league rotations until injuries hit in 2005, forcing him to make 20 appearances out of Boston's bullpen. Even so, he still started 66 games his last three seasons (2005-2007). If we take the top-tier hurlers from the chart above and look strictly at their numbers from 1992 to 2007, Schilling's case for the Hall becomes that much stronger:
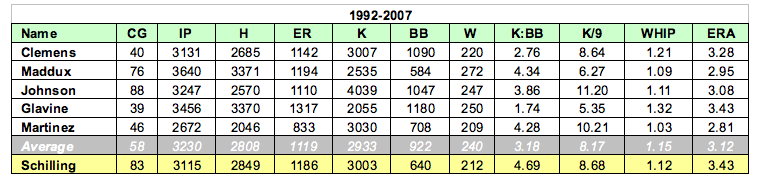
During that stretch, Schilling was second in complete games, first in K:BB and third in K/9. Schilling betters the group's average in complete games, strikeouts, walks allowed, K:BB, K/9 and WHIP. By the way, if you didn't know, Schilling's K:BB ratio (4.38) ranks first all-time since 1900. Sure, it's just one stat off the back of a baseball card, but c'mon people…Schilling was a great pitcher, one of the very best in all of baseball for sixteen years — a period which includes at least five Hall of Famers.
One could also look at some Bill Jamesian Hall of Fame metrics, like the Black Ink test, the Gray Ink test, Hall of Fame Standards and Hall of Fame Monitor and Schilling once again stacks up favorably.
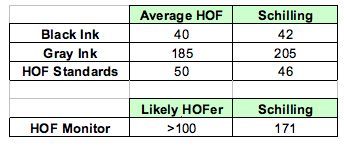
The lack of shiny hardware will be an easy thing for many to knock Schilling on, but he did have three second-place finishes in Cy Young Award voting — 2001 and 2002 in the NL and 2004 in the AL. Below are Schilling's three runner-up seasons…seasons good enough to win almost any other year:
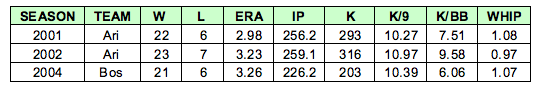
I mean, really, is it fair to hold it against Schilling that Randy Johnson (2002) and Johan Santana (2004) were unanimous winners those years? And if awards are your bag, then don't overlook his NLCS MVP from 1993, his World Series co-MVP from 2001 and his back-to-back Pitcher of the Year awards by The Sporting News in 2001 and 2002. If feel-good stories are also your kind of thing, throw in his 1995 Lou Gehrig Memorial Award (best exemplifies character and integrity both on and off the field), his 2001 Roberto Clemente Award (selected for character and charitable contributions to his community) and his 2001 Hutch Award (best exemplifies the fighting spirit and competitive desire to win.) Fluff? Yes, but all part of the package, baby.
Finally, it'd be foolish not to touch on Schilling's postseason record. Everyone remembers Game 6 of the 2004 American League Championship Series, fewer people can recall how dominant he was in Game 7 of the 2001 World Series, and unfortunately not enough people recall how important Schilling's Game 5 start in the 1993 World Series was to the Phillies. But three amazing postseason starts does a Hall of Fame career not make. To truly appreciate Schilling's big game dominance, you have to look at his entire playoff career totals:
Need I say more?
Hmm…let's review. Lots of strikeouts to go along with very solid numbers across the board, unfairly not enough All-Star appearances or Cy Young Awards to please the over-the-hill (or is it under-the-bridge?) Baseball Writers Association of America, an outstanding postseason record, possibly abrasive personality…Geez, does that at all sound familiar? (Oh, give me a break…I'm a Lederer for cryin' out loud!)
The case is pretty clear and the statistics don't lie. So Curt, the next time you want to go on record about your unworthy-for-the-Hall career, put a sock in it, bloody or otherwise.
Joe Lederer is the Assistant General Manager of Riverwalk Golf Club in San Diego. Besides working on his PGA Class A membership, Joe spends way too much time cooking and reading Nietzsche and not enough time working on his short game. Joe gets his baseball writing chops from his mother.
| Designated Hitter | January 22, 2009 |
Baseball's Hall of Fallacies
It's been well documented that Jon Heyman has a prejudice against, in his words, "younger people on the Internet who never saw [Bert Blyleven] play." This bigotry in and of itself is sad, but it also is a prime example of one of the most effective logical fallacies: the Ad Hominem. Essentially, as a rebuttal to an argument, one attempts to discredit the person or group of people who present the argument, without discrediting the argument.
The power of this faulty reasoning lies in its ability to change the course of the discussion. Politicians love this fallacy because it allows them to place people who disagree with their policies into negative categories. For example, one might state that proponents of gun control are elitist or out-of-touch. "It's easy," one might argue, "to be for gun control when you live in an exclusive, gated-community and can afford a fancy alarm system." "But wait," the proponent of gun control responds, "I grew up on a farm and live in a ground level apartment in a rough area of town." At this point, they have lost the argument because the debate has changed from the possible benefits or consequences of gun control, to defending one's own character.
We have seen this happen in many of the responses to Heyman's comments: "I'm 70, I saw Blyleven and yes, I use the Internet" or "those stories [Heyman] broke are really not very interesting…" These types of responses which either defend one's own character or attack Heyman's only indulge a discussion that is completely irrelevant to the merits of Blyleven's Hall of Fame candidacy. Sadly, this fallacy is often quite successful to that end.
The Ad Hominem rears its ugly head in many forms. The Circumstantial Ad Hominem is when one argues that a person only supports something because it is in their best interest to do so. One might argue that Pitcher A thinks Blyleven belongs in the Hall only because they have similar stats to Blyleven, and thus it will help their own candidacy. Again, this does not address the underlying arguments that Pitcher A may be making. One's own personal interest is irrelevant (or circumstantial) to those arguments.
The Ad Hominem Tu Quoque discredits an argument by pointing out a person's hypocrisy. For example: "Your statement that Blyleven doesn't belong because of his winning percentage is not valid because you voted for Nolan Ryan who had a lower winning percentage." The fact that someone is a hypocrite does not make their argument invalid. In this case, attention is directed away from why winning percentage is a lousy litmus test for the Hall of Fame.
Another similar fallacy is False Dilemma, which is a distortion of the logical truth P or ~P: either P is true or it is false. With False Dilemma someone will argue P or Q, as if there is some causal link between the two. An example of this fallacy is subtly used by Heyman: people either do not think Blyleven is Hall worthy (P) or they never saw him pitch (Q). The purpose of this fallacious argument is really to stop the opposing voices: either you agree with statement A or you are [fill in any insulting, degrading characterization – in Heyman's case he uses ignorance]. Now the stage has been set so that before anyone disagreeing with Statement A speaks up, they are perceived in a negative way or thought of as sympathizers to a negative group. Often, the discussion will skip right to the insulting characterization as in the following exchange: "I disagree with gun control." "Oh, so you're a hick." Notice that the following fallacious statement is implied here, but never actually stated: either you support gun control or you are a hick. Now the argument can move to a discussion of a person's character without ever having to address the reasons why the person disagrees with gun control.
Another common fallacy used in Hall of Fame discussions is the Relativist Fallacy: stating that something is true in certain situations but not others. With Blyleven, we often hear that he isn't Hall worthy because of his low career winning percentage. When it is pointed out that he has a higher winning percentage than Nolan Ryan, the Relativist Fallacy follows: that doesn't apply to Ryan because Ryan got to 300 wins.
My point with all of this is not to further the Blyleven arguments, Rich and Sully have already done a tremendous job of that. My purpose is to point out that it is extremely difficult to engage in ANY Hall of Fame discussion without running headfirst into a logical fallacy. Take the common argument against Blyleven or for Rice: "he just didn’t feel like a Hall of Famer," or "he was one of the most feared hitters of his time." Both of these arguments are the logical fallacy Appeal to Emotion, whereby emotion is used as evidence of fact. Perhaps it really felt that way to some people at the time but feelings are not facts and often run counter to reality (as statistical analysis has shown with Jim Rice).
Consider the argument that, if Jim Rice goes into the Hall of Fame, then dozens of other similar players also have to be considered and presumably, these dozens of other players are not Hall worthy. This fallacy is known as Appeal to Consequences of a Belief. The consequences of Jim Rice going into the Hall of Fame are not evidence that he does not belong. Furthermore, let's assume that BBWAA got it wrong with Rice and he does not belong. That does not mean that the BBWAA now has to get it wrong with the dozens of similar players that do not belong.
I wondered at the fact that Appeal to Emotion, Appeal to Consequences and Relativist Fallacy are so often considered good evidence of Hall of Fame candidacy. I then went to the Hall of Fame website and looked up the BBWAA rules for election. Any player who played for at least 10 years is eligible to be voted on. However, this is the only guidance given with regards to voting: "voting shall be based upon the player's record, playing ability, integrity, sportsmanship, character, and contributions to the team(s) on which the player played." It also goes on to state there are no automatic elections for outstanding achievements.
Essentially, there are no base standards for Hall of Fame induction. The election system itself is based on the logical fallacy Appeal to Belief: if a certain percentage of a group believe something to be true, then it must be true. Therefore, if 75% of the BBWAA believe someone is a Hall of Famer, they are a Hall of Famer. It is amazing to me that the previous sentence is both a fact and a logical fallacy.
In some ways, it's disheartening to look at the Hall of Fame in this light. It seems that, when talking about the Hall of Fame, all logical arguments reach a dead end. Lacking any concrete standards, all Hall of Fame discussions are eventually reduced to irrational arguments. Furthermore, because there is no logical basis for Hall of Fame entry, examining those who are already in the Hall offers no help. In fact, relying on the current members would also be a logical fallacy: Biased Sample, whereby conclusions are drawn from a sample that is unreliable.
So how can we change the course of the dialogue surrounding the Hall of Fame? I believe that first and foremost we need a logical basis from which to begin. It's time that we reevaluate what it actually means to be a Hall of Famer. A set of minimum, objective standards would help to mute much of the illogical cacophony out there today. While I would leave the actual standards up to someone more qualified than I; it should probably start somewhere with ERA+, OPS+ and win shares: stats that can be used across the many different eras of baseball. Certainly, the standards will be hard to agree upon in the first place and will probably be heavily criticized and even outright rejected by the BBWAA (if not completely ignored). However, without a logical foundation to the Hall, all emotional and irrational arguments will continue to be relied upon and Jon Heyman's gut feeling will have more influence than statistical analysis.
Heyman is not alone in his hostility toward a growing demand for more concrete and quantifiable measures of greatness. But his comments underscore that there has been a real shift in the way baseball is being viewed. No longer are fantastical, unquantifiable and largely indefensible beliefs (such as Derek Jeter being a Gold-Glove caliber shortstop) acceptable to a growing number of baseball fans. Whether or not this change originated with "younger people on the Internet" is irrelevant. The fact is that the current method of evaluation is based upon flawed logic and is being met with discontent. Any attempt to marginalize that discontent should consistently be met with the very thing it cannot handle: more sound, logical thinking.
Conor Gallagher is a paralegal in Chicago, IL. He is also an aspiring winemaker with dreams of moving to California this summer. His passion for baseball and baseball statistics in particular began at the age of eight or so when his father taught him how to keep box scores and they would play APBA together.
| Designated Hitter | December 18, 2008 |
Jim Rice, the Hall of Fame, and the Numbers
Of all the personal testimonials honoring Jim Rice, my favorite is that of the much-beloved late commissioner of baseball, Bart Giamatti, who once wrote that Rice was “the Hammer of God sent to scourge the Yankees.”[1] That alone, in the minds of many baseball fans (outside of New York), should be enough to let Rice through the gates of the game’s Valhalla, Cooperstown’s Hall of Fame.
But, alas, Jim has stuck out 14 times with the Baseball Writers Association of America, and a debate rages over whether this final time will be the charm. Of course, even if he fails – or, rather, if the writers who vote on such matters fail him – his case will be shuffled off to the Veteran’s Committee where he may yet attain immortality. However, opinion across the land seems to be that there is something slightly dodgy and even undignified about entering the Hall in this manner, as though one has come through an inadvertently unlatched back door.
A lot the debate over Rice’s fate has been carried on at the level of “I saw him hit a home run against the [fill in a team name here] when I was [fill in an age under 10 here] and it was the most awesome sight I ever witnessed. [Therefore he should go to the Hall.]” We also see fierce, dramatic but intensely subjective judgments of the stature Rice had when he played. Pitchers, it is said by some, feared him, perhaps more than any other batter in baseball at that time.
SABR members and their intellectual brethren have debated Rice’s qualifications at a somewhat more sophisticated level (mostly), examining Rice’s statistics and awards while comparing his record to those of others who have (and haven’t) had their images inscribed on Cooperstown plaques. Consider, for instance, the claim that Rice was feared by opposing pitchers. Perhaps so, but then what are we to make of the fact that he never received more than 10 intentional base on balls in any one season? By this measure of “feared hitter,” Rice falls behind not only contemporaries Dale Murphy, Garry Templeton, Dave Winfield, and Dave Parker, but also Ted Simmons and Warren Cromartie (each of whom had two or three seasons with 20 or more IBB. With 77 career IBB, Rice is tied for 179th all time, along with players such as Jerry Grote, Ken Henderson, Claudell Washington, and Rice’s one-time teammate Fred Lynn.
In 16 seasons, Rice had a batting average of .298 with 2452 hits and 382 HR – each just a little short of the lifetime statistics that (used to?) assure one a ticket to the Hall. Still, Rice was an All-Star eight times and an MVP once (and he finished 3rd in MVP voting two other times, once in his rookie year, in which he lost to fellow rookie teammate Lynn). If the basic statistics fail to provide a clear answer, one can bring in second-generation statistics to help elucidate matters. For instance, Rice’s OBP was.352 and his SLG was .502, for an OPS of .854. This is just ahead of Hall-of-Famers Eddie Collins and Billy Williams, but behind non-Hall-of-Famers such as Reggie Smith and Jack Clark. So there is nothing decisive here for Rice’s case either. He remains precariously balanced on the cusp of greatness, like a star that is visible in the night sky only if you look slightly to one side of it.
The real statheads among us indulge in even more exotic stuff, like Bill James’ quantitative estimates of similarity among players.[2] Perhaps not surprisingly, Rice scores most similar to another legendary “tough case” for the Hall: Orlando Cepeda. In 17 seasons, Cepeda had 2351 hits (101 fewer than Rice), 379 HR (3 fewer), a .297 career BA (.001 lower), and a .849 career OPS (.005 lower). He was an All-Star 7 times (one fewer), a Rookie of the Year (one more), and an MVP once (tied). Rice fans will note that their man was just slightly better in nearly every case, and that Cepeda ultimately made it into the Hall. But Cepeda hit in an era of tougher pitching (lgOPS of .724 vs. .744 in Rice’s era) and, as a result, Cepeda has a slightly higher park-adjusted league-normalized *OPS+ (133 vs. Rice 128). Again, nothing decisive here. Let us move on. James has also developed some estimates of the likelihood of players entering the Hall. Naturally, Rice is low on one (HoF Standard = 44, where the avg. HoFer scores about 50) and high on the other (HoF Monitor = 144.5, where 100 represents a likely HoFer).
And so, finally, we come to James’ most recent, most influential, and perhaps most complicated estimate of player value: win shares. I won’t go into the calculations here (you can find it on the internet if you are interested), but win shares is supposed to tell us how many additional wins a given player was responsible for with his bat, his fielding, and (if applicable) his pitching. It is well-tested and well-known. It has its quirks, to be sure, but it is generally accepted to do a good job at measuring player performance.
How many win shares did Jim Rice have over the course of his career? 282. How good is that? It is tied with Boog Powell, the one-time MVP, mostly-Oriole LF-1B of the 1960s and 1970s. Powell is not, it should be noted, in the Hall. Fred Lynn is two win shares below Rice. He is not in the Hall. Minnie Minoso and Sal Bando are one win share ahead of Rice. They are not in the Hall. Amos Otis and Toby Harrah are a little further ahead (+4 and +5, respectively). George Sisler is 10 ahead and Dale Murphy (another notoriously tough HoF case) is 12 ahead, tied with Shoeless Joe Jackson. Then Cesar Cedeno (+14), Frank Howard (+15), Home Run Baker (+19), Ken Singleton (+20), Bobby Bonds (+20), Harold Baines (+25), and finally Orlando Cepeda at 310 win shares, a full 28 ahead of Rice.[3] At last, we have some solid evidence that Rice’s career contribution was, in cold reality, just a little below that usually needed to make it into the Hall; that perhaps his presence in Boston made him more visible nationally than Cepeda, who labored mostly in San Francisco and Atlanta (where he worked in the shadows of Willie Mays and Hank Aaron), but not actually quite as good a player.
A number of people have made exactly this case in the debate currently swirling around the vote for the 2009 Hall of Fame induction class. Of course, the win shares numbers are just evidence. They do not constitute definitive “proof.” One can continue to debate, among other things, the relative weaknesses of the various measures used, the importance of “peak” years, and a variety of “intangibles” that are not captured by any of the numbers. Fair enough. But this is how this sort of debate productively proceeds – from impressions, to statistics, to comparative statistics, to better comparative statistics, and so on. For instance, on 14 December 2008, David Kaiser posted an analysis of this kind to the SABR-L list, using win shares (among various other measures) to answer a number of questions about whether Rice should be in the Hall of Fame. Kaiser concluded:
The answers to this quiz are interesting because they show Rice as an almost classic case of a player writers tend to overrate: coming up with the Red Sox in one of their glory eras, he put up some spectacular home run and RBI numbers in his first few years and had one truly fantastic season. As a result he did quite well in MVP voting and was picked for a lot of All-Star games but his actual value was only once (1978) as large as it seemed, his secondary numbers were very poor, and he faded out quickly.
But then comes along Gabriel Schechter, a Research Associate at the National Baseball Hall of Fame & Museum, who wrote in a posting to the SABR-L list on 15 December 2008:
I simply want to register a strong protest over David [Kaiser]'s use of win shares as the primary tool of his analysis…. Rice played in the 1970s and 1980s, so how is it fitting to apply a sabermetrical measure that wasn't even created until 2001? Aren't those questions supposed to reflect how the player was regarded AT THE TIME he was playing? To say that Fred Lynn or Carlton Fisk had more win shares than Rice in a given season and equate that with considering Lynn or Fisk as more highly regarded than Rice is ridiculous.
And so we come to the real point of this column, which was not, it may surprise you to learn, to contribute to the Jim Rice HoF debate but, rather, to discuss the justice of using modern statistical tools (like win shares) to decide historical questions (like whether Jim Rice was so great a ballplayer that he belongs in the Hall of Fame).
I do not know Mr. Schechter’s views of statistical analysis generally. There are some fans (and players and managers) who believe they see plainly with their eyes (and with their memories), and that statistics, with all their fussy formulas, only confuse the issue. Without further ado, I commend to them the cognitive psychological work of people such as Paul Meehl, Gerd Gigerenzer, and Nobel prize-winner Daniel Kahneman to disabuse them of their misapprehension. I will assume that Mr. Schechter, instead, is only objecting to the casting back of modern statistics into historical eras. I suspect, however, that he has confused two superficially similar, though, in point of fact, quite distinct complaints. The one, to which many object, has to do with creating leader boards and records for statistics that did not exist when a particular season was played. So, for instance, claiming that Three-Finger Brown led the NL in saves four years running, from 1908-1911 (5, 7, 7, 13), seems a little silly not just because there was no such statistic for Brown to lead the league in then, but also because the conception of the relief pitcher as a kind of “specialist” with a particular “function” (such as “saving”) was not yet in place in Brown’s time. It is a little like claiming that Hannibal had more “tanks” than the Romans on account of his use of elephants. I have some sympathy with this objection.
However, that is not what is going on when Mr. Kaiser (and others) use win shares to analyze the performance of players past. First of all, there is nothing that goes into computing win shares that would have been foreign to Rice or his cohort: hits, at bats, bases on balls, total bases, outs, etc. Mr. James has just stirred a little differently a pot of wholly familiar ingredients. Second, the point of doing this kind of analysis is not (only) to create a retrospective leader board, but rather to use quantitative methods to analyze Rice’s performance relative to his peers (and to others throughout the history of major league baseball). With a modicum of judiciousness, there is nothing in the least ridiculous about this process. Indeed, we do it all the time.
To wit, which of these historical questions are ridiculous? How many people lived in the city of Rome in 44 bc? What proportion of them were slaves? What was the average life expectancy? What were the leading causes of death? Among the land owners? Among slaves? Across genders? All of them require quantitative answers. All of them were questions that went unasked (and unanswered) by the Romans themselves. That does not make them historically illegitimate. Consider more questions of the same type: What proportion of the US population spoke English as a mother tongue in 1776? What proportion of the American population approved of Abraham’s Lincoln’s actions in 1863? Would Woodrow Wilson have won the 1912 presidential election if either William Howard Taft or Theodore Roosevelt had dropped out of the race?
The people of these eras did not have either the data or the methods (or both) to answer such questions definitively, but certainly there is nothing to prevent us from using the methods we have since developed on the data that we still have from those times to develop answers that are in some ways better than the ones people of the time in question could have generated (for instance, computers make it possible for us to manipulate huge masses of data that would have been impracticable, if not strictly impossible, prior to their invention).
Far from being illegitimate, a statistic like win shares is precisely the kind of evidence to which members of the BBWAA should attend more fully when deciding questions like whether Jim Rice was as good a player as the others who are now in the Hall. It allows us to separate dispassionate consideration of the merits of the case from contentious but ultimately irrelevant stories of who thrilled us when we were young. Isn’t that exactly why the BBWAA waits five years after a player retires before considering his case for entering the Hall – to let passions cool and allow the facts to rise to the surface?
-----
Notes:
[1] Giamatti, A. Bartlett (1998). "The Green Fields of the Mind." In A Great and Glorious Game: Baseball Writings of A. Bartlett Giamatti. Algonquin. Available on-line at: http://mason.gmu.edu/~rmatz/giamatti.html.
[2] The source I used was baseball-reference.com.
[3] I have only picked a few familiar names between Rice and Cepeda. In fact there were 56 players separating the two on the all-time win shares list, as of 2002. (Players like Frank Thomas have since passed Cepeda. Others have, no doubt, crept between them from below Rice in the intervening years.)
Christopher D. Green teaches statistics in the Department of Psychology at York University in Toronto. His academic research is mostly concerned with the history of psychology.
| Designated Hitter | December 04, 2008 |
Baseball's Bear Market? Why 'Caution' is the Keyword This Winter
Free agents are just waiting for that first shoe to drop. Once one mega-contract is signed, others will surely follow. Or at least, that's the optimistic tone agents are trying to set, amidst all sorts of negative indicators.
The New York Times ran a piece last week that noted how slowly the free agent market was moving, relative to the past five offseasons. The obvious assumption is that the economy is forcing teams to be more cautious, and that the players could be in for a rough winter.
I touched on this a bit on Squawking Baseball on Monday. The Times' data, in itself, isn't overly convincing; the sample sizes are too small to have any real meaning, and these types of dead periods happen at some point in every offseason. But with that said, this is the behavior we would expect in this type of economic atmosphere.
To see how this dynamic plays out, it's important to consider how teams value players to begin with. If you remember back to Econ 101, companies will hire employees up until the point when marginal revenue equals marginal cost. So if the A's project that Rafael Furcal will bring them $15 million in additional revenue next season, they should be willing to pay him up to $15 million. This number is his marginal revenue product (MRP).
Sounds simple enough, but a player's MRP is tied to many different factors. The most obvious, of course, is the player's production. In our hypothetical, the A's could project that Furcal is worth five additional wins, and each of those wins is worth $3 million, making his MRP $15 million.
But what if the A's, worried about the economic climate, decided to do a whole new set of revenue forecasts for 2009, and found that ticket sales were likely to take a huge hit? Or that demand for playoff tickets (should the team get that far) would be much lighter than normal, resulting in lower prices? All of a sudden, the rewards of winning 5 more games and possibly reaching the playoffs are much smaller. This, in turn, means that Furcal's marginal value to the team is much less, so his MRP (or the salary the team would have been willing to pay him) goes down as well.
It's unlikely that MLB, as a whole, will see a decline in revenue next year (I've actually been very bullish on this front). But there is obviously a tremendous amount of uncertainty, which generally (and rightfully) should lead individual teams to set very conservative revenue projections, and therefore very conservative budgets.
Bud Selig has gone out of his way to make sure the owners and general managers realize all of this. During the last recession, which began in 2001, baseball revenues stagnated. The teams, used to double-digit growth, kept adding on expenses accordingly. The result was almost disastrous, with the Devil Rays and Tigers reportedly almost missing payroll.
Scott Boras has a different take, of course, citing teams' record profits and large cash positions. "I always look at baseball revenues, and in the last seven years they have gone from $3 billion to $6.5 billion," he said. "If baseball revenues drop off, that's something we'll look at, but if there is a drop-off, it is not going to be dramatic."
He continues, ""You can't say just because one sector is bad, all others are as well. Baseball is doing very, very well."
In a lot of ways, he's right. But it's also his job to be optimistic, and he's not taking into account the most fundamental aspect of the market: budgets are set based on next year's projections, not last year's performance. And there will be a tremendous amount of uncertainty, if not overt negativity, priced into teams' budgets.
That uncertainty lies in several areas of each team's operations. Taking a closer look, we can break it down by the major sources of revenue. Depending on the team's market, competitiveness, and brand loyalty, certain factors will be more pressing than others (i.e. the Pirates should be very concerned about almost all of them, while the Yankees just need to sell their last luxury suite):
1) Season ticket sales. This should be a pretty tough market for season tickets, relative to years past. The financial crisis hit in mid-September, and the economic news isn't likely to get better before Opening Day. That means teams will be facing constant headwinds, as consumers will be less likely to spend on expensive, discretionary goods such as season ticket packages. Teams will probably have to rely more on corporations, which will be much harder in certain places than others (think Detroit).
2) Individual game tickets / gameday-related sales (concessions, parking, etc.). These are linked, obviously, since the more tickets a team sells, the more concessions they will sell, as well. Teams often have a tipping point during the season, where fans either come in droves because the team is competitive, or stay away because the team is out of the race. In a good economy, a bad team may still be able to draw fans in August and September, since consumers have cash to spend. But in this current atmosphere, bad teams could set multi-year lows in attendance.
3) Luxury suite sales. Most of these should be sold by now. For those still left, it will no doubt be a tough atmosphere. But the supply is so small, teams should still be able to sell out, even if they have to lower prices a bit. This won't be a tremendous hit for a team's overall revenue intake.
4) Corporate sponsorships. Corporate sales vary tremendously, team to team. Some may have most of their inventory locked up in long term deals. Others may have several partners up for renewal, which isn't the best situation to be in right now (especially if one of those partners is General Motors). For those that have inventory available, most new deals are closed between January and Opening Day. There may have to be discounts in order, but, much like with luxury suites, most teams shouldn't see a huge year-over-year decline.
5) National media contracts. These are fixed for next season.
6) Local media contracts. Like the national media contracts, most (if not all) teams are already set with their local media contracts. Teams that own their RSN, or sell their own radio advertising, may see some declines. But cable, especially, is a pretty good place to be right now, since the networks are paid subscriber fees by the operators.
7) Merchandise. This is squarely in the consumer realm, so that's not good. If there's any way to efficiently boost merchandise sales in 2009, it's to do it virally through MLB.com. I've often advocated taking down MLB.com's pay-walls, opening up the video vault that sits in downtown Manhattan, and building an incredible online content collection. This would make MLB.com an even better destination site than it is today, and in the process create tons of new advertising inventory that MLB could either sell, or use to push its own products.
8) Revenue sharing. Imagine trying to set a budget for next year, when much of your income relies on the performance of others. For a big market team, this means possibly writing a larger check, even in the face of declining revenues. For a small market team, it means having no control over a huge chunk of earnings. Of all the unknowns going into 2009, this may be the biggest one.
Given all that, it's no wonder general managers are being cautious. In the past, when they could count on year-over-year growth, long-term contracts weren't quite as risky. Derek Lowe's four-year, $36 million deal seemed terribly expensive in January of '05. But after four years of massive industry-wide expansion, it looks downright cheap. (Don't think Paul DePodesta thought about that back then?)
On the flipside, long-term contracts that were signed in the late '90s and early '00s were considered albatrosses by 2003. When Alex Rodriguez was traded to the Yankees, few could have imagined that he would even consider opting out (let alone get an even bigger deal) just four years later.
In good times, multi-year deals are calculated risks. In bad times, they're fireable offenses. No GM wants to be stuck with bad contracts and a shrinking budget.
So what are the likely results? The teams with some breathing room, like the Yankees and Red Sox, will keep taking calculated risks. The top tier of players (CC Sabathia, Mark Teixeira) should get very nice deals. But the great majority of the small- and mid-market teams will be extremely conservative, and that will bring down overall demand (and salaries) for the rest of the players on the market.
In particular, look for long-term deals to be shorter than most people are expecting. No GM wants to be collared with bad contracts in this environment, and the smart ones (of which there are more now than ever before) will be extremely careful.
In all, not such a rosy outlook. But it's really more of a call for conservatism by Selig (and Paul Volcker, apparently), reminding teams of the legitimate pain many of them went through during the previous downturn. Given the magnitude of this recession compared to the last one, expect the teams to heed the advice.
Shawn Hoffman writes about business and baseball at Squawking Baseball. In real life, he is a principal in web startup Veritocracy.
| Designated Hitter | November 20, 2008 |
Manny Syndrome
Manuel Aristides Ramirez was all of 15 months old on Aug. 23, 1973, when Jan Erik Olsson walked into Kreditbanken, a Stockholm bank on Normalmstorg square, shot a member of the Swedish police and took four people hostage.
The hostage crisis continued for five days as Olsson and his alleged accomplice, Clark Olofsson, negotiated with police and even the Swedish prime minister. During the ordeal, the four hostages were said to express more fear of the police than their captors. A criminologist working with police noted the attitude and coined a phrase that provided Olsson and Olofsson some measure of infamy long after the robbery was forgotten: “Stockholm syndrome.”
The aforementioned Ramirez left the Boston Red Sox – all but forced his departure, if reports are to be believed – at the end of July, nearly four months ago. Yet stories continue to leak about the tumultuous final month between Ramirez and the team that paid him handsomely for nearly eight years, and none of them portrays the clearly mercurial slugger as the nice guy.
On the field, the situation seems to have turned out as well for everyone as could be expected: the Red Sox received a left fielder that essentially replaced Ramirez’s pre-trade production, the Los Angeles Dodgers got an otherworldly performance from Ramirez that pushed them into the playoffs, and Ramirez and his agent, Scott Boras, will make a killing in free agency.
Everyone wins but me.
I don’t need your pity – at least not anymore. As a Red Sox fan, I’ve seen two world championships and witnessed more playoff appearances since 2002 than in the previous 13 years combined. Dealing with the drama of Manny Ramirez was easily worth those rings.
But it’s becoming clearer that for much of the seven-plus years Ramirez was in Boston, we as fans were Manny’s hostages. He pouted, lied to the press (and consequently to us), showed up late – or not at all – to All-Star Games and managerial meetings alike, refused to pinch hit when asked or even refused to play.
He did this before the current ownership bought the team in 2001. He did it during the 2002 transition year before Theo Epstein was named general manager. And he did it nearly every season since Epstein took the reins in 2003. The incidents all became part of “Manny being Manny.”
And while the Red Sox made some efforts to rid themselves of his shtick – placing him on waivers and nearly engineering his trade to the baseball wilderness of Texas being the most notorious – we as fans never seemed to fully believe the import of these stories.
Moreso than even David Ortiz, Manny Ramirez was the face of the Red Sox, and we were happy with this scenario. At least I certainly was. Heck, there’s an orange-and-white feline with an attitude that stalks my house and answers – when he feels like it – to “Manny.”
How did we let this man fool us so?
The evidence was there, even before 2008, that Ramirez cared little for the Red Sox and their fans, none at all for Boston and its culture. When John Henry met Ramirez in 2002, the first thing he heard was a trade request. When Grady Little, a man whose surname speaks to his accomplishments in a Red Sox uniform, benched Ramirez for refusing to pinch hit during a ninth-inning rally in 2003, Henry and Larry Lucchino were approached a second time about a trade.
It all happened again in 2005, and it seemed the fans had enough. Ramirez was booed at the plate that July, as his trade demands and lollygagging to first reached team-distraction proportions. But when the trade deadline expired – a three-team deal having fallen through – Ramirez seemed to renew himself to Boston, receiving a standing ovation in his first at-bat back and telling anyone who would listen that he wanted to win another World Series with the Red Sox.
Frustration turned to rejoicing, and we took Ramirez at his word. When he sat the final month of the lost 2006 season and stories began to crop up alleging he had quit on the team, I rejected these rumors. No proof, I said. No evidence.
Things seemed rosier than ever after the second championship in 2007. Ramirez began talking to the press again after his tremendous ALDS walk-off home run off Francisco Rodriguez, he began reading “The Secret,” he told the sportswriters he wanted to stay in Boston, and he expressed ambivalence about when or whether the Sox picked up his two options after the season.
With Ramirez still productive, his $20 million options no longer seemed excessive. It seemed impossible to imagine a future without the suddenly happy, suddenly affordable Manny Ramirez. He still had his moments, but there were those other moments, too – the mid-double-play high-five with a fan, the trips into the Green Monster. They were goofy. They weren’t always appreciated, but they were the kind of antics that make the game fun, that make you believe some guys aren’t out there thinking only about the money.
Perhaps that was why it was so easy for some of us to accept the mythos of Manny being Manny. The talented hitter who wanted to do nothing more than hit. Not an idiot – I always rejected that slur – but simply happy and secure in his own world. One could understand why he didn’t like the microscope of Boston, and his brilliance with the bat couldn’t help but smooth over the rough patches over the years.
Then he hired Scott Boras.
I don’t know whether Boras put Ramirez up to the things he did once the 2008 season began. For that matter, I don’t even know what exactly Ramirez did and what he’s merely suspected of doing. All I know is what’s been said, but that it fits closely with what we know has actually occurred.
We know Ramirez shoved traveling secretary Jack McCormick. We know he got into an in-game dugout scuffle with fan- and organization-favorite Kevin Youkilis. We know he suddenly demanded the Red Sox pick up his first option, and that he considered any sign of caution or prudence on Boston’s part to be disrespectful.
I watched these goings-on with dismay. What happened? Ramirez was having the as-expected rebound season from his subpar 2007. It shouldn’t have surprised me that he changed his mind, but it did nonetheless. For some reason, I kept hoping that this time he meant it. This time would be different. This time Ramirez cared. Turns out it wasn’t. Turns out he didn’t.
July was the worst yet. He sat in back-to-back games against the Yankees, complaining of a sore knee. When the Red Sox sent him to get an MRI, he couldn’t remember which one was sore. When he pinch-hit against Mariano Rivera on what was supposed to be a day off, he never swung the bat in taking three straight strikes.
It might have been the most controversial single plate appearance of 2008 in Red Sox Nation. Was Ramirez fooled by three devastating cutters from a Hall-of-Fame pitcher – two of which were borderline strikes? Or was he making a statement about his intentions if the Red Sox failed to trade him by the July 31 deadline? The maddening thing is we’ll never know. Again, I found myself defending Ramirez.
But the end was coming. Apparently, the Red Sox threatened a suspension – a threat made more believable by Boras’ inability to deny it. He made comments too ridiculous to laugh off, alleging the Red Sox lied to their players, telling the press he was “tired” of the team. He wanted out. He was clearly doing everything possible to ensure that would happen.
At the time, I wrote:
I may be tired of him. I may not love him anymore. I don't think I even particularly like him after the events of this weekend. But he's still our Manny. For better or worse, he's wearing the laundry, and that means we root for him. Just like we'd root for Barry Bonds or Alex Rodriguez if they wound up in red and white.No matter how tired Ramirez is of the Red Sox, or the Sox of him, they need each other if they want to play baseball this October. And that means we need him, too.
That was three days before Ramirez was sent to LA in a three-way trade with the Pirates for Jason Bay. The Red Sox turned around their flatlining season and played baseball in October after all. Ramirez got what he wanted. The Red Sox, after their seemingly annual attempts to be rid of him, finally got what they wanted.
So why do I feel so unhappy?
Much ink has been spilled, many megabytes filled about the Manny Ramirez saga – his time in Boston, the trade that sent him west, his resurgence at Chavez Ravine. I have no interest in further repeating the many words said on the matter, many by his own teammates. I can only offer one fan’s perspective – one that renders me incapable of seeing things in the stark rhetoric many have employed to vilify Ramirez or, alternately, the Red Sox organization.
It seems clear that Ramirez through his actions was the aggressor here, for reasons perhaps only he knows. Yet it’s difficult to harbor resentment for what certainly appears to be a clear case of a player attempting to hold a team hostage – and receiving all that he demanded.
He gave us so much, after all. Ask any group of Red Sox fans for their favorite Manny moments, and you’re not likely to leave any time soon. There’s the simple magnitude of the numbers he posted – statistics that likely will ensure his induction into the Hall of Fame with a “B” on his cap. There’s the two rings, the World Series MVP, his place as half the greatest 3/4 combination of our generation.
Others may be able to push all that aside and demonize the slugger, dismiss his time in Boston and turn away without glancing back as he heads toward mega dollars this offseason. I cannot. He was our Manny. We were his hostages.
Paul Anthony is a native Connecticutian transplanted to Texas, where he covers politics for a daily newspaper. His (unpaid) night job is as a co-blogger at YFSF, which has provided a peaceful coexistence for Red Sox and Yankee fans since 2003. While there, he has compiled a list of the Top 50 individual Red Sox seasons of all time.
| Designated Hitter | October 02, 2008 |
NLDS Preview: Los Angeles Dodgers vs. Chicago Cubs
I'm Rob McMillin, author of the Dodgers and Angels blog 6-4-2, and a long-time reader of Rich's The Baseball Analysts through several homes. Patrick Sullivan asked me to do a review of the Dodgers and Cubs in preparation for their upcoming National League Division Series, and so here I am.
The long-term regular-season matchup for the Dodgers versus the Cubs is remarkably even — as of the end of 2007, it was 1,009 wins and 1,007 losses for the Dodgers. But change that to the Los Angeles era, and it becomes much more lopsided, as the Dodgers won the all-time series 343-281. The 84-win 2008 Dodgers are 2-5 against the Cubs this year, but that record may prove fairly useless for predictive purposes when it comes down to the postseason.
While the main reason for this is the Dodgers' acquisition of Manny Ramirez, there are other mitigating factors in play. Along with David Mick of Another Cubs Blog, we'll take a look at both teams head-to-head and review the teams position-by-position. As always, rate stats are indicated as AVG/OBP/SLG (batting average/on-base percentage/slugging average).
SCHEDULE
Game 1: Wed., Oct. 1, 6:30 PM ET on TBS - LAD (Derek Lowe) @ CHC (Ryan Dempster)
Game 2: Thu., Oct. 2, 9:30 PM ET on TBS - LAD (Chad Billingsley) @ CHC (Carlos Zambrano)
Game 3: Sat., Oct. 4, 10 PM ET on TBS - CHC (Rich Harden) @ LAD (Hiroki Kuroda)
Game 4*: Sun., Oct. 5, TBD on TBS - CHC (Ted Lilly) @ LAD (TBD)
Game 5*: Tue., Oct 7, TBD on TBS - LAD (TBD) @ CHC (Ryan Dempster)
* if necessary
RECORDS
         HOME      ROAD     TOTAL
LAD     48-33     36-45     84-78
CHC     55-26     42-38     97-64
Head-to-head results: CHC, 5-2
OFFENSE
        RUNS   AVG   OBP   SLG   OPS   OPS+
LAD     700   .264  .333  .399  .732    95
CHC     855   .278  .354  .443  .797   109
PITCHING AND DEFENSE
        RUNS   AVG   OBP   SLG   OPS   ERA+
LAD     648   .251  .315  .376  .691   120
CHC     671   .242  .316  .395  .711   117
Position-By-Position Breakdown
Catcher
Russell Martin's (.280/.385/.396, 650 PA, 13 HR) numbers have descended considerably from his astonishing 2007 campaign (.293/.374/.469); perhaps not coincidentally, some of this is due to his league-leading 149 games caught, a figure he shares with Jason Kendall of the Brewers. Breaking it down by innings caught, Kendall takes the lead outright with 1,328.1, while Martin is almost a hundred outs behind him at 1,238. Defensively, Martin has slipped some, as his throwing mechanics seem to have gone haywire, recording 11 errors. It's not at Gary Bennett levels, but it's something to pay attention to. Having watched both fairly extensively, they're both capable of calling good games, and in neither case should their inability to throw out base-stealers (both are hovering around the 25% mark) be held against them.
Geovany Soto (.285/.364/.504, 563 PA, 23 HR) won the 2008 job behind the plate with his stellar performance in September of 2007. He's among the best catchers offensively and he's above average defensively. He missed the last few games the Cubs played because of a hand injury, which is something that has been recurring to Soto in 2008. The Cubs say he's ready to go for Game 1. Soto is most likely going to win Rookie of the Year in the NL, but what's more impressive is that among Cubs position players, nobody has been more productive.
Rob says: Soto has the edge mainly because of his offensive game.
David says: Edge goes to the Cubs.
First Base
A lot of James Loney's (.280/.385/.396, 651 PA, 13 HR) value is tied up in his high batting average, and as he was unable to keep up his insane batting average on balls in play from 2007 (when he hit .350), and sure enough as it fell to .284, so did his average, and more ominously, his slugging percentage. Loney's weakness is his inability to hit lefties consistently, with a .249/.303/.361 line that has led to a late-season experiment using Nomar Garciaparra in a platoon role at first. This will only arise as an issue with the only lefty Cubs starter, Ted Lilly, but the difference — a small-sample-sized .339/.424/.643 — makes him a potent force.
Derrek Lee (.291/.361/.462, 698 PA, 20 HR) got off to a great start in April. He had a horrid May and the rest of the months were disappointing for Lee, the Cubs and their fans. He's essentially been a .750ish OPS hitter since April. Overall his numbers were still solid, but his defense is overrated (+1.1 runs) and his offensive skills are in decline. Lee's still capable of getting hot and if he could get hot like he was in April for these playoffs, an already outstanding offense becomes that much better.
Rob says: Cubs have the edge thanks to Lee's sizeable offensive prowess. It should be noted, however, that Lee hit eight home runs in April and hasn't hit more than two in a single month since May.
Dave says: Dodgers. Lee is a better offensive player than Loney, but Loney is about 13 runs better on defense. (ed note, nice call, Dave!)
Second Base
"What," Cubs fans might be asking, "is Blake DeWitt (.264/.344/.383, 421 PA, 9 HR) doing at second?" Well, they could be pardoned for their confusion; earlier in the year, he was the Dodgers' starting third baseman, but as the season progressed and his hitting didn't, he eventually earned a return trip to AAA Las Vegas. Nevertheless, he still finished 2008 atop the Dodgers' leaderboard for innings at third, but once the Dodgers traded for Casey Blake and realized that Jeff Kent is too fragile to stay on the field anymore, they moved DeWitt to second and recalled him to play there in the Show.
Mike Fontenot (305/.395/.514, 284 PA, 9 HR) was probably the best role player in all of baseball this season. He's limited in that he can only play 2nd base, but he's had a very good defensive year and his offense has helped the Cubs when they need extra production the most. Fontenot won't play much against lefties (only 21 ABs in 2008), but the Dodgers have four righties starting in the series. His .398 wOBA was the highest on a team that led the league in runs scored.
Rob says: This is a clear win for the Cubs with the caveat that this matchup really shows the limitation of position-by-position analysis.
Dave says: Edge to the Cubs here.
Third Base
There is no doubt that Casey Blake (.251/.313/.460, 233 PA, 10 HR w/ Dodgers) marks an offensive improvement over DeWitt (at least at this point in their respective careers), but whether it was worth giving up catching prospect Carlos Santana for a two-month rental remains to be seen. The further away from July he's gotten, the worse his offense has become (.220/.297/.415 in September).
Aramis Ramirez (.289/.380/.518, 645 PA, 27 HR) has more big hits since he joined the Cubs in 2003 than I can remember. On top of that, over the last 5 years he's been one of the best 3rd basemen year in and year out. In 2008 he improved his plate discipline and set a career high OBP of .380. The defense is above average as well. If the game is on the line, the Cubs want Aramis Ramirez at the plate.
Rob says: Another win for the Cubs, one which ends up quite large once you consider the gap between recent performance (Ramirez is hitting .342/.386/.566 in September).
Dave says: Cubs
Shortstop
This is probably the most perplexing move the Dodgers have made to date; Rafael Furcal (.357/.439/.573, 164 PA, 5 HR) returned to service very late from a lower back injury that knocked him out most of the season (his last regular season game was May 5). With only days to go in the regular season, no rehab stint in the minors available to tune him up, there's no reason to believe he'll be effective against live pitching. He was insanely hot to start the season, as his 2008 numbers suggest, but he's the Dodgers' biggest question mark. It will be interesting to see what Joe Torre does with him if he can't hit, especially considering the Dodgers' options most of the year have been the not-ready-for-prime-time Chin-Lung Hu and Royals castoff Angel Berroa.
Ryan Theriot (.307/.387/.359, 661 PA, 1 HR) is playing out of position. He's one of the worst defensive shortstops in the game (-9.7 runs). Lou still isn't asking for my advice so he's stuck at the position. Theriot did hit .300 this season and much more importantly, he posted an OBP of .387. Much like last year, Theriot faded down the stretch (.686 OPS in August, .660 OPS in September). Despite that, Theriot enters the NLDS 11 for his last 19 with 6 walks in that span.
Rob says: If Furcal is healthy, a huge if, he provides the Dodgers a win, but we won't know what Furcal we're getting until the postseason opens.
Ryan says: Dodgers. If Furcal doesn't play much then the edge goes to the Cubs.
Left Field
The Cubs have a very good offensive left fielder in Soriano who nevertheless is still far behind Manny Ramirez (.396/.489/.743, 229 PA, 17 HR); Manny has been simply otherworldly with the Dodgers. While nobody thinks Manny will continue this hot (almost half his home runs have been hit in the two months since coming to LA), it's more than enough to make up for his defensive lapses in left, something both players are prone to.
Alfonso Soriano (.280/.344/.532, 503 PA, 29 HR) had had a disappointing year defensively. He had been so very good since he moved to LF in 2006, but the combination of age and leg injuries seems to have caught up with him. Soriano led the team in home runs despite missing about 50 games. I think he's the one offensive player the Cubs have who is capable of carrying the rest of the team. If Soriano doesn't hit in the postseason (and let's be honest, he hasn't done much of that in his career), the starters will have to be at the top of their game.
Rob says: The Dodgers win handily here.
Dave says: Dodgers. It's not even close. As good as Soriano is, he isn't Manny.
Center Field
Matt Kemp's (.290/.340/.459, 657 PA, 18 HR) conversion to center was belated but necessary thanks to the acquisition of noodle-armed Juan Pierre and the collapsing Andruw Jones. Kemp logged much of his time in right prior to his conversion, but his bat (so far) plays better in center field. Kemp isn't a dancing bear defensively, but neither is he among the league's elite.
Jim Edmonds (.235/.343/.479, 298 PA, 19 HR) was picked up in May after an awful start with the Padres. As a longtime Cardinal, no Cubs fan wanted to root for Edmonds, but he made it remarkably easy to. It's as if he reverted back to the prime of his career. His .394 wOBA is 2nd on the team and his .568 slugging was the highest. My biggest concern at the time of the signing was his defense. Nobody could have predicted the offense and it turns out nobody could have predicted how well he'd play CF either. His .931 RZR was the highest since before 2004. His 45 OOZ were equal to 2005 in nearly 530 fewer innings.
Rob says: This is a slight edge to the Dodgers who don't have to give up average to get power, especially since the Dodgers won't be sending a lefty to the mound in the series.
Dave says: Cubs
Right Field
Andre Ethier (.305/.375/.510, 596 PA, 20 HR) has become a solid presence in the Dodger outfield this year, hitting for decent power and average, especially so in August (.292/.346/.615) and September (.462/.557/.692). Opinions differ wildly over whether Ethier has taken a step forward on a permanent basis, but he's been hitting out of his mind lately. Even before that, Ethier emerged as one of the team's top two hitters all year.
Mark DeRosa (.285/.376/.481, 593 PA, 21 HR) had a career year in 2008. He took over RF for the struggling Fukudome in early September with Fontenot moving to 2nd against righties. DeRosa isn't your typical RF. He's an infielder by trade, but in his big league career he's proven he can play just about anywhere. He adds above average defense in RF as well. He posted a .382 wOBA in 2008 and like so many of the other Cubs, his OBP was very good (.376).
Rob says: This represents a substantial win for the Dodgers, whether Piniella starts DeRosa or Fukudome.
Dave says: Cubs. Like 1st base, defense is the deciding factor here. Ethier and DeRosa have had similar years offensively (.382 wOBA for DeRosa, .385 wOBA for Ehtier), but DeRosa is 15.8 runs better defensively. Just after I finished writing this, I noticed that DeRosa's left calf may still be too sore for him to play RF, which means Fukudome would play RF with either DeRosa or Fontenot at 2nd. If that's the case, edge to the Dodgers.
Bench
After a futile dalliance with Gary Bennett earlier in the season, the Dodgers settled on Danny Ardoin as their reserve catcher.
Angel Berroa may get a start at short if Rafael Furcal doesn't feel up to it or is showing he's obviously not ready to play. Nomar Garciaparra and Jeff Kent will provide right-handed power off the bench unless Ted Lilly is starting. Pablo Ozuna will almost certainly be relegated to the role of late-innings defensive replacement for Casey Blake, and the od pinch-running job.
Both teams are carrying only one reserve outfielder. In the Dodgers' case, Juan Pierre is likely to be a designated pinch-runner; his starting days were all but over in the regular season, and it's hard to imagine Joe Torre using him for anything else. Felix Pie doesn't seem likely to get much playing time after he played himself out of the outfield. This is a wash, not that it much matters.
Reed Johnson has been the other half of the CF platoon and since the Dodgers are throwing righties at the Cubs, he won't get much playing time. Like Edmonds, he was picked up after his former team released him and the 2 of them have combined to put together a very good season for the Cubs in CF. Johnson can hit lefties rather well, doesn't field as well as some may think, but has had a real good season for the Cubs.
Kosuke Fukudome lost his starting job sometime in late August or early September after months of struggling to hit the ball. He won't be asked to do that much in the playoffs and he'll get a chance to be a defensive replacement. His defense is matched by only a few in all of baseball. He is spectacular on with the glove. Just can't hit.
Others: Ronny Cedeno (INF), Henry Blanco (C). Felix Pie (CF), Daryle Ward (1B/RF)
Rob says: Too close to call.
Dave says: I'll call it even because in that few plate appearances, literally anything is possible.
Starting Rotation
Derek Lowe 14-11, 3.24 ERA, 211 IP, 136 ERA+
Chad Billingsley 16-10, 3.14 ERA, 200.2 IP, 141 ERA+
Hiroki Kuroda 9-10, 3.73 ERA, 183.1 IP, 119 ERA+
Derek Lowe had early trouble but has come on strong in the second half with a 2.38 ERA. His key is getting outs on the ground with his heavy sinker; if he's giving up line drives, something's wrong with his game. Chad Billingsley is the staff's real ace, and many expect this NLDS will be his coming-out party; he hasn't attracted a lot of national attention because of a fairly slow start. He's whiffing about a batter an inning, while walking less than half that (201/80 K/BB). Like Forrest Gump's box of chocolates, you never know what you'll get from Hiroki Kuroda, seven scoreless innings or seven runs in the first. That overstates things, though, as Kuroda has been about what the Dodgers had expected despite some injury problems in midseason.
Ryan Dempster 17-6, 2.96 ERA, 206.2 IP, 152 ERA+
Carlos Zambrano 14-6, 3.91 ERA, 206.2 IP, 115 ERA+
Rich Harden 5-1, 1.77 ERA, 71 IP, 254 ERA+
Ted Lilly 17-9, 4.09 ERA, 204.2 IP, 110 ERA+
Ryan Dempster was closing games for the Cubs the last 3 years and now he's starting Game 1 in the playoffs. He's earned it. In only one start this year did Dempster allow more than 4 earned runs. He allowed 4 in only 5 starts. 22 times he's allowed 2 or fewer runs. He posted a 2.96 ERA this year, which stunned just about everybody. He's been the best starter the Cubs have had from start to finish.
Carlos Zambrano has had a couple of injuries in the 2nd half. They say neither is serious, but you never know. His first half was tremendous and he appeared to be more consistent than I had ever seen him. Then the 2nd half started and he was also consistent. Consistently not very good. Despite the no-hitter, Zambrano could just never get settled back down after coming back from injury.
Rich Harden has been unbelievable as a Cub. In 71 innings, he's allowed only 4.94 hits per 9 and has struck out 11.28 per 9. His ERA is 1.77. I'm still getting familiarized by Rich Harden, but from what I can gather, if he can take the mound, odds are your team is going to win the ballgame. In 9 of his 12 starts with the Cubs he allowed 1 or 0 runs. He allowed 2 runs twice and in the other start he allowed 4 runs.
Ted Lilly is coming off 4 consecutive wins giving him a career high 17. Lilly got off to a terrible start posting a 6.46 ERA in April. He posted a 3.33 ERA after the break and held hitters to a .223 batting average. Ted has had severe reverse splits in 2008. From 2005-2007 righties posted a .756 OPS and lefties a .712 OPS against Lilly. That's typical. But in 2008, lefties have hit him for a .928 OPS and righties only a .673 OPS. He's developed a cutter this year that he uses on right handed hitters and it has worked very well. He's not throwing the big over the top hook as often so that may be why the lefties are hitting him better. Maybe it's just sample size.
Rob says: Despite a formidable rotation on both sides, the Cubs have a slight advantage because Dempster and Harden are perhaps a bit better than Lowe and Kuroda, and also because they won't be asking their starters to work a three-man rotation.
Dave says: Dodgers. They have the advantage in Games 1, 2 and 5 if necessary. I don't think it's a huge edge by any means. I think Lowe and Dempster are quite similar and their numbers are comparable. Billingsley has a big advantage over Zambrano, Harden has a big advantage over Kuroda, Lilly has a good advantage over Maddux and then we're back to the Game 1 starters for Game 5. Fairly close, but overall edge to the Dodgers.
Bullpen
Joe Beimel 5-1, 2.02 ERA, 49 IP, 219 ERA+
Jonathan Broxton 3-5, 3.13 ERA, 69 IP, 141 ERA+
Clayton Kershaw 5-5, 4.26 ERA, 107.2 IP, 104 ERA+
Greg Maddux 2-4 5.09 ERA, 40.2 IP, 87 ERA+
James McDonald 0-0, 0.00 ERA, 6 IP
Chan-Ho Park 4-4, 3.40 ERA, 95.1 IP, 130 ERA+
Scott Proctor 2-0, 6.05 ERA, 38.7 IP, 73 ERA+ Takashi Saito 4-4, 2.49 ERA, 47 IP, 178 ERA+
Cory Wade 2-1, 2.27 ERA, 71.1 IP, 195 ERA+
The Dodgers have a far superior bullpen to the Cubs in general, but there are holes on both sides that are likely somewhat illusory. The Dodgers won't see Jason Marquis or Bobby Howry except in a blowout, and similarly, the Cubs won't see Greg Maddux or Scott Proctor, and possibly Chan-Ho Park. The two teams are actually closer than you might think, because Takashi Saito, the Dodgers' former closer, hasn't been quite the same since returning from a midseason injury that forced the Dodgers to give an extended look to Jonathan Broxton in the ninth. Neither team's closer is a sure thing, as their ERAs attest, but they have been good all year.
The Dodgers use Park in middle relief, though he has been decreasingly effective as the season has worn on. Despite underwhelming stuff, Cory Wade has quietly assembled an excellent season, and will likely see substantial work. The Dodgers' late decision to add James McDonald to the postseason roster could mean they intend to use him anywhere, but I include him here; like Wade, he doesn't have the best stuff, but the late callup from AA has managed to suppress offense in small samples. The Dodgers will likely call on Joe Beimel to face lefties, where he has generally been very useful.
Neal Cotts 0-2, 4.29 ERA, 35.2 IP, 105 ERA+
Bobby Howry 7-5, 5.35 ERA, 70.2 IP, 84 ERA+
Carlos Marmol 2-4, 2.68 ERA, 87.1 IP, 168 ERA+
Jason Marquis 11-9, 4.53 ERA, 167 IP, 100 ERA+
Sean Marshall 3-5, 3.86 ERA, 65.1 IP, 117 ERA+
Jeff Samardzija 1-0, 2.28 ERA, 27.2 IP, 198 ERA+
Kerry Wood 5-4, 3.26 ERA, 66.1 IP, 139 ERA+
Kerry Wood took over for Ryan Dempster as the team's closer this year. He's done a pretty good job. He's been spotty at times. 3.31 ERA, 6 blown saves, but he's allowed a measly .638 OPS. He's converted 10 of his last 11 saves.
Carlos Marmol is good at sports. That's something we'll occasionally say around my parts after Marmol has just made a few hitters look silly. He's allowed a .135 batting average against. A .507 OPS. He's allowed 4.12 hits per 9. He walks his fair share of batters and is prone to giving up the long ball. He went through a really tough stretch in June that saw his ERA balloon from 1.75 up to 3.61 prior to the All-Star break. Since then it's been only 1.29.
Bob Howry has had a pretty bad season after several stellar years as a closer and a set-up man. To give you an idea how bad it's been for Howry this year, the month of September was his most promising month. He only made 9 appearances as Lou was kind of afraid to keep giving him the ball, but 7 of those were scoreless ones in a row. Unfortunately, they were bookended by an outing on September 2nd in which he didn't record an out and allowed 4 earned runs. On the final day the season he gave up a couple runs. So in Bob's most consistent month he still managed to have an ERA of 8.10.
Neal Cotts is the Cubs LOOGY. Lefties have hit .269/.329/.522 against him this year in 67 at-bats. This has been an issue lately for the Cubs and it likely will be one at some point in the NLDS.
OTHERS: Jeff Samardzija (7th inning, groundballs, wide receiver), Sean Marshall (long/middle relief, LOOGY), Jason Marquis (long/middle relief)
Rob says: The Dodgers have a far superior bullpen to the Cubs in general, but there are holes on both sides that are likely somewhat illusory. The Dodgers won't see Jason Marquis or Bobby Howry except in a blowout, and similarly, the Cubs won't see Greg Maddux or Scott Proctor, and possibly Chan-Ho Park. The two teams are actually closer than you might think, because Takashi Saito, the Dodgers' former closer, hasn't been quite the same since returning from a midseason injury that forced the Dodgers to give an extended look to Jonathan Broxton in the ninth. Neither team's closer is a sure thing.
Dave says: Dodgers. They beat the Cubs at pretty much every spot in the bullpen.
Prediction
Rob says: (ed note: He abstained.)
Dave says: I feel that based on what I've written above I should say I think this will go down to the 5th game. But I don't think it will. I think the Cubs win this series in no more than 4 games. I'll go with Cubs in 4 because Bill James' log5 method gives the Cubs the highest odds of winning it in 4 at 22.5%. I think the Dodgers offense is improved with Manny, but it's still not equal to the Cubs lineup. The Cubs have a rather large edge offensively, as well as defensively, that I think the Cubs advance to the NLCS.
| Designated Hitter | September 30, 2008 |
Why the Angels Won't Win the World Series
(And the Cubs Will Win it All)
(And the Cubs Will Win it All)
As Angels fans across Southern California settle in for a long and exciting playoff run, they’re justifiably hopeful that this year will match their success of 2002 when they won a World Championship. The Halos won 100 games this season, have the best record in baseball, and enjoy home field advantage throughout the playoffs. They acquired Torii Hunter and Mark Teixeira to augment an already potent lineup featuring Vlad Guerrero. Their starting rotation is arguably the best among the playoff participants, while their bullpen sports the all-time single season saves leader in Frankie Rodriguez. The Angels should be the favorites to at least make it to the World Series. Unfortunately, the odds are not in their favor. My opinion is not based on injuries, pitching matchups, rally monkeys, curses, or anything of that nature. It’s based on cold, hard historical data. Reviewing the playoff and World Series results since the current wildcard format began in 1995 reveals some surprising results that would make Gene Autry roll over in his grave.
Consider these facts:
- The team with the better record has won only 49% of all playoff series since 1995 (43 of 88).
- In 2001, Lou Piniella’s Seattle Mariners won 116 games and failed to reach the World Series.
- 12 other teams have won 100 games since 1995 and failed to play in the Fall Classic, including the Braves four times.
- 5 more 100-win teams played in the World Series and 4 of them lost.
- From 1995-2007, only the 1998 Yankees became World Series champs with the best record in baseball (Boston tied for the best record last year).
- A wildcard team has made it to the World Series 9 times in the last 13 years, claiming 4 world championships including 3 of the last 6.
- In 2006, the Cardinals won the World Series with only 83 regular season wins.
Basically, it appears that anything can happen in the postseason…and usually does. So, let’s break down the Angels’ chances one series at a time. Admittedly, some of the sample sizes used below are not very large, but the data reinforces just how unpredictable baseball has been in the wildcard era.
Division Series – Angels vs. Red Sox
In a format where the #1 seed plays the #4 seed, one would expect the top seed to breeze through this round, when in fact quite the opposite is true. Perhaps it’s because the wildcard winner might be more “battle tested” and have more momentum going into the playoffs due to a hotly contested race against multiple foes, whereas, the top seed typically wraps up a playoff berth much earlier and coasts into the playoffs with less competitive edge. Possibly it’s due to overconfidence by the higher seed, or less pressure on the underdog, or the inherent riskiness of a short series. Or maybe it’s just pure blind luck. Whatever the reason, it’s not good for the Angels. The probability of the Angels advancing out of the first round is at most 45%.
On the other hand, the Cubs can thank their division rival Brewers for a stroke of good fortune. If the Brewers had lost the wildcard race to the Mets, the Cubs would have faced the wildcard team in this round just like the Angels. Instead, they will play the #3 seeded Dodgers. Historically the #1 seed wins a 1 vs. 3 matchup a whopping 85% of the time (11 of 13). So the Cubs dodge a bullet and their likelihood of advancing out of the first round is 85%.
League Championship Series
If the Angels get past their first series, things look better for them in the LCS. Interestingly, the results during the modern format (1995 to present) nearly match historical results for the LCS dating back to 1985 when MLB changed from the best of 5 games to 7 games. From 1985 to 2007, the team with the better record won 24 of 42 best of 7 LCS’s, or 57%, with identical records occurring twice. The probability of the Angels winning the ALCS (if they make it that far) is therefore estimated at 56% while the Cubs also would have a 56% chance in the NLCS.
World Series
This is another stunner. The reason for this phenomenon could be a case of low sample size or because of overconfidence by the favored team or any other number of human factors, but the recent data is completely counter-intuitive. Nonetheless, it’s bad news for the Angels since they have the best record of all the playoff teams. On the bright side, the AL has won 5 of the last 13 Fall Classics. Also, since 1903 the historical chance of winning the World Series with a better record than one’s opponent is a more realistic 53% with a much larger sample size (54 of 101). Weighting these 3 factors equally, I estimate the Angels’ chances of winning the World Series if they get that far to be around 51%. The Cubs have a better record then everybody except the Angels and they had the same record as the Rays, but they’re in the National League so their chances are a little less at 46%.
Prediction
If the Angels have a 45% chance of winning their first round, 56% of winning the second round and 51% chance of winning the final round, then the estimated likelihood that they win it all is only 13% (.45 x .56 x .51). This is only a tad higher than if all 8 playoff teams had an equal shot at the championship which would be 12.5%. Unfortunately, that’s the way the recent history has worked out. Using the same basic methodology, here are the handicaps for all 8 teams.
Cubs fans rejoice! Disregard the last 100 years! The Cubs have the best shot of winning it all this year according to recent playoff data; albeit their odds are only slightly better than 1 in 5 so don’t rejoice just yet. The wildcard Brewers are next at 1 in 6, while their first round opponents, the Phillies have only a 6% chance. This is primarily because the #2 seed has won a paltry 31% of the time (4 of 13) in first round matchups with the wildcard team. Once again, it’s a very small sample size, so it should all be taken with a grain of salt. In the AL, the wildcard Red Sox and whoever comes out of the AL Central have the best chances of becoming world champs but their odds aren’t even 1 in 6. The Cinderella Rays with the second best record in baseball are the underdogs in the AL with only a 10% chance. Meanwhile, the team with the best record in baseball, the Angels, has only the 5th best chance of winning the World Series!
This methodology can also be used to predict the possibility of cross town rivals meeting in the World Series. There are two such possibilities this year. Citizens of the Windy City are dreaming of an all-Chicago World Series. First, the White Sox need to qualify for the playoffs (still TBD as I’m writing this), but if they do, the likelihood of the Cubs playing the South Siders in the Fall Classic is 13%. Sorry Los Angelenos, but the chance of your ultimate baseball scenario known as a “Freeway Series” in Los Angeles is much lower at only 4%.
Summary and Conclusion
Many people call the baseball playoffs a “crapshoot” including Braves skipper Bobby Cox. A’s GM Billy Beane was quoted in Moneyball as saying: “My (expletive) doesn’t work in the playoffs. My job is to get us to the playoffs. What happens after that is (expletive) luck.” The historical data presented in this article absolutely supports those sentiments. Considering that 51% of all playoff series are won by the lesser team indicates that it might as well be a coin flip. The MLB playoffs are indeed a crapshoot. Good luck to the Angels, the Cubs and all the playoff teams…with emphasis on LUCK.
Ross Roley is a lifelong baseball fan, a baseball analysis hobbyist, and former Professor of Mathematics at the U.S. Air Force Academy. He is partially responsible for instant replay in the major leagues this year having highlighted the issue here on Baseball Analysts early in the 2006 season.
| Designated Hitter | August 21, 2008 |
The World of Catcher's Interference
"X - reached first on catcher's interference"
The line above has often been used in baseball box scores to denote one of baseball's orphaned statistics: catcher's interference. It is an event that happens just infrequently enough for people not to care about it, but important enough that the official scorer has to report all instances of it in the totals of a game. The play doesn't count as an at bat for the batter, but the batter doesn't get credited in his on-base percentage for reaching base safely. But a batter who came up just once in a game and reached base on catcher's interference would keep a hitting streak going. A batter reaching base on catcher's interference who comes around to score is an unearned run, but batters who reach after him are usually earned runs.
For reasons I've never figured out, I felt that it was one of my missions in life to keep track of this play on my blog, The Griddle. I note the last instance of it on the sidebar and ask people to let me know when the play occurs, which invariably happens when I'm away from a computer, out of town, or busy with some other mundane task, like eating.
The baseball rule that spells out catcher's interference is Rule 6.08(c):
The batter becomes a runner and is entitled to first base without liability to be put out (provided he advances to and touches first base) when:The catcher or any fielder interferes with him. If a play follows the interference, the manager of the offense may advise the plate umpire that he elects to decline the interference penalty and accept the play. Such election shall be made immediately at the end of the play. However, if the batter reaches first base on a hit, an error, a base on balls, a hit batsman, or otherwise, and all other runners advance at least one base, the play proceeds without reference to the interference.
All that boils down to is that if the catcher's mitt touches the batter's bat before he completes his swing, catcher's interference is called. And when it happens, nobody, except for the batter, catcher, and umpire really knew what is happening. The umpire calls time and the batter is told to go down to first and everyone sort of scratches their head for a while trying to figure out what happened. Eventually "Error 2" will flash on the scoreboard and then everyone will be puzzled and look around. On TV, the announcers will look at replays and try to figure out what happened. And, after a few minutes, the befuddlement ends and the game goes on. (In theory, any fielder could interfere with the batter's swing and get called for interference, but such an instance hasn't turned up.)
Why does the play happen? I've never gotten a good answer from watching it happen, but I think (and this is highly speculative) that most catcher's interference plays happen on breaking balls. And they often happen when the batter makes a very late swing or the pitch comes in to a location that the catcher isn't expecting. So you end up with the combination of a weird swing and the catcher trying to grab a pitch in an unexpected location. This puts the bat and glove on a collision course of sorts.
Pitchers, who tend to have very poor swings at the plate, seem to get a disproportionate number of catcher's interference calls. Baseball-reference.com lists 64 instances of a pitcher getting on base via catcher's interference since 1956. Chris Short accounted for 11 of them and he was also the last AL pitcher to reach base on catcher's interference, back when he was playing for the Brewers in 1973.
According to David Nemec's book "The Rules of Baseball," catcher's interference wasn't put in the rulebook until 1899. Prior to that time, catchers would occasionally try to disrupt a batter's swing by tipping the bat with his glove. Connie Mack claimed that he pioneered this strategy, but that's likely because he lived a long time and nobody was going to argue with him. However, it didn't happen too often because catchers tended to stand well behind (anywhere from 10 to 25 feet) behind the batter because they didn't have much protective equipment and valued keeping their hands, heads, and ... um ... manhood ... intact. Catchers would only move in closer if there were runners on (to prevent stolen bases) or there were two strikes on the batter (catching the third strike cleanly is one of baseball's oldest rules.)
I asked Phil Birnbaum to go through Retrosheet's data to find out how often catcher's interference had been called in the years that data is available (1956-2007). And Phil even made a graph. And after studying the graph, I believe that you really can't tell much about it.
The number of instances of catcher's interference has gone up in recent years, which I think can be attributed to the increase in the number of games and better protective equipment for catchers that let them set up closer to the batter, even if it's by a couple of inches. However, the number of occurrences isn't exactly staggering, although it does happen more frequently than a complete game shutout now.
Baseball's all-time catcher's interference king is Pete Rose, who reached on catcher's interference 29 times in his career. His first one came on August 8, 1963 when Clay Dalrymple of the Phillies was nailed for it. Rose's final catcher's interference came over 22 years later on September 19, 1985 when Larry Owen of the Braves was called for it during a 9-run ninth inning by the Reds.
The single season record is held by Roberto Kelly, who got eight catcher's interference calls while playing for the Yankees in 1992. Kelly's knack for reaching first on catcher's interference earned him a trip to Cincinnati the next season in a trade that netted the Yankees Paul O'Neill.
Dale Berra of the Pirates holds the National League record for catcher’s interferences in 1983 with seven. Berra never had another CI call the rest of his career. Although Retrosheet doesn't have complete data on Dale's dad, Yogi, it appears likely that the gene for reaching on catcher's interference wasn't passed down from father to son, as Yogi has none in his stats.
Five times a player has reached on catcher's interference twice in one game. Pat Corrales did it twice for the Reds in 1965 (August 15 and September 29). The others were Ben Geraghty of the Phillies back on April 26, 1936 and also two Mariners: Dan Meyer on May 3, 1977 and Bob Stinson on July 24, 1979.
Catcher's interference has turned up in the postseason seven times, five times in the World Series. Roger Peckinpaugh of Washington was the first player to get one and it happened in the first inning of Game 7 and Peckinpaugh picked up an RBI as the bases were loaded. Rose had one in Game 1 of the 1970 World Series. George Hendrick had the last one in the World Series in Game 3 of the 1982 World Series. Richie Hebner of the Pirates (Game 3 in 1974) and Mike Scioscia of the Dodgers (Game 5 in 1985) have the only LCS catcher's interferences.
The leader among active players in catcher's interference calls is Darin Erstad of the Astros with 13. Craig Counsell of the Brewers is engaged in a neck and neck battle with Erstad with 12 CI calls. Erstad is the only player I've ever seen reach on CI in person, back on July 19, 1998 when Chris Hoiles of the Orioles knicked Erstad's bat. Or at least that's what I believe happened as I recall also that I had to stare into the sun most of the game, so pretty much anything that happened at home plate was just a rumor to me.
Edwin Encarnacion of the Reds could be the next big thing in the world of catcher's interference, picking up eight early in his career. However, Encarnacion hasn't had a single call this year and he could be losing momentum in his quest to go after Rose's record.
In Boston, since the Curse of the Bambino has been lifted, it's now time to talk about the Curse of Darren Lewis. Lewis reached first on catcher's interference back on September 13, 1998 courtesy of Tigers catcher Paul Bako. And no Red Sox player has reached on catcher's interference since then, the longest current drought for any franchise in the majors. How much longer will the people of Boston have to suffer? (My book proposal about this has gone nowhere which shows that there is a limit in the publishing world to the number of Red Sox-themed books there can be.)
There have been just nine catcher's interference calls so far in 2008. Three of them have come from Lyle Overbay who had never had one prior to this year. Carl Crawford has had two. Other players who have had one haven't fared well. Claudio Vargas of the Mets found himself taken off the Mets 40-man roster and is now playing in AAA New Orleans. Travis Hafner has been hurt most of the year. Guillermo Quiroz of the Orioles has hit .202 as a backup catcher. Milton Bradley has had a solid year, although he seemed to be getting more and more mysterious injuries after his catcher's interference on June 28.
For many players, they can have long careers and never once have a catcher's interference. Hank Aaron, Willie Mays, Cal Ripken, and Brooks Robinson are four notable players with long careers who never had an entry in the catcher's interference column on their ledger.
Frank Robinson received one catcher's interference in his long career and that came back on April 27, 1963 in Houston. John Bateman of the Colts interfered with Robinson in the seventh inning. Robinson must have been a little upset as he went and stole second and scored on an RBI single from John Edwards for the only run of the game.
There is only one documented case I know of when a game ended on catcher's interference. That was back on August 1, 1971 when the Dodgers were hosting the Reds. In the 11th inning of a 4-4 tie the Dodgers had the bases loaded with two outs and Willie Crawford up against Cincinnati reliever Joe Gibbon.
Manny Mota was on third for the Dodgers and either thinking that Gibbon wasn't paying attention to him or Crawford had no chance to get a hit against Gibbon, Mota tried a steal of home. Reds catcher Johnny Bench jumped out from behind the plate and stood in the base path to tag Mota.
This brought into play the seldom used Rule 7.07, to wit:
If, with a runner on third base and trying to score by means of a squeeze play or a steal, the catcher or any other fielder steps on, or in front of home base without possession of the ball, or touches the batter or his bat, the pitcher shall be charged with a balk, the batter shall be awarded first base on the interference and the ball is dead.
Home plate umpire Harry Wendelstedt called catcher's interference on Bench and a balk on Gibbon and Mota came home with the winning run. Rule 7.07 is peculiar because it imposes two different penalties for one act: catcher's interference, which allows the batter to reach first and the runners move up if forced, and a balk, which allows all the runners to move up one base. So how did Mota score? Did he score on catcher's interference or on a balk?
I discussed the play with Dave Smith of Retrosheet two years ago at the SABR Convention in St. Louis. And we agreed that the play had to be catcher's interference first because Crawford was awarded an RBI on the play, which he wouldn't have received for a balk.
So what have all these words taught people about catcher's interference? Likely very little. Catcher's interference is just a small freak play in the larger scheme of baseball. But it happens and you have to count it to make your box score balance. It's a loose end that you have to watch out for. You can take solace that I'm paying attention so you don't have to.
Bob Timmermann is a librarian who lives in South Pasadena, CA. He is a member of the Society for American Baseball Research. He writes about variety of baseball-themed topics at The Griddle. Some of them are even important.
| Designated Hitter | August 18, 2008 |
Waiting is the Hardest Part
Tom Petty has a song that proclaims “The waiting is the hardest part.” I think it is beyond safe to say the Tampa Bay Rays know the saying and perhaps the song quite well.
The long wait on Major League Baseball to grant the area a team, then the first season, then for the aging slugger obsession to fade out. Then for a rebuilding process that never really happened, and then finally waiting for a change in ownership. The latter happened in November 2005, but, until this year, it was more waiting, although this was different; this was reshuffling assets, this had direction and purpose.
Mainstays like Aubrey Huff, Julio Lugo, Danys Baez and Toby Hall were shipped out within a season without big-named replacements, leaving some fans wondering how much this new regime actually cared about winning. Sure, the days of Brian Meadows closing and Tomas Perez playing shortstop are terrifying in their realness, but all along the prophecy of B.J. Upton and Delmon Young soon taking over helped to soothe our qualms.
They took chances on players who others were tired of waiting on. Greg Norton, Ty Wigginton, Carlos Pena, Hee Seop Choi, Al Reyes, and the list goes on of former top prospects or useful parts that were casted aside from bigger organizations. Not too many players were willing to play in Tampa at any costs, and especially not at the price the Rays offered.
Although winning is finally here, the residuals from the waiting game are stamped all over this team with 18 of the 25 players currently on the active roster (no Carl Crawford or Evan Longoria) being acquired by Andrew Friedman. Many of the success stories from this year arise from foresight and the willingness to withhold temperamental judgments. Despite the public’s rage at not acquiring big names or making “statement moves” Friedman and company decided they wouldn’t back down.
There’s Grant Balfour, the fiery Australian with one pitch that he uses 89% of the time. Acquired in a trade, which is a common theme for this roster, Balfour worked through control issues in triple-A Durham following his designation for assignment in March. Upon his return, he looks less the guy who walked 7.30 per nine last year and more like a 13 strikeout per nine relief monster that has a 3.57 K/BB ratio.
On most nights Balfour is blazing his fastball to Dioner Navarro, the emotionally tested catcher who the Rays chose not to replace this past off-season despite a .641 OPS. Navarro was more than a tad bit unlucky last season with 17% of his batted balls being line drives that resulted in only a .253 BABIP. Navarro was named to the American League all-star team this season, his second full season since Friedman acquired Navarro, Jae Weong Seo, and Justin Ruggiano for Toby Hall and Mark Hendrickson in mid-2006.
Joey Gathright and Fernando Cortez were dealt for J.P. Howell who had such a contrast in AAA and MLB statistics that most were labeling him a quadruple-A player. Thankfully Howell’s absurdly high BABIP regressed while Howell has been getting more grounders and solidifying himself as one of the go-to relievers for Joe Maddon.
Of course Maddon himself is a symbol of the patience exhibited by this franchise. A team looking to make a statement to the fan base that losing isn’t acceptable could’ve easily declined Maddon’s dual options for this season and next. After all Maddon guided teams had finished with the worst record in the league both of the past two seasons, but the Rays persisted that Maddon was indeed the man to lead this team through its transition.
The Rays are now looking at perhaps the most rewarding of waiting projects with Rocco Baldelli. He will probably never reach Josh Hamilton status, but Baldelli was one of the original Rays golden children. As a 21 year old rookie he amazingly broke into a Lou Piniella starting lineup and didn’t perform too bad. Yet as we all know Baldelli’s body has nearly derailed his once great potential down to just shy of 130 games since 2005.
Before this year waiting is all the Rays and their fans ever really had. When Troy Percival signed with the Rays for less money part of his reasoning was feeling as if this team had a legitimate playoff shot; most took this as sugar coating his desire to be a closer. Cliff Floyd would follow not too long after using some of the same key words. Ace Scott Kazmir made the boldest of statements in spring training by stating this team would definitely compete for a playoff position. Most rolled their eyes and said “We’ll see.”
Seeing is believing, patience is a virtue, and the Rays are in first place in late August.
R.J. Anderson is Senior Editor of DRaysBay and Beyond the Boxscore.
| Designated Hitter | August 04, 2008 |
The Cubs, MLB, and a Cuban Missile Crisis
Before we get started, don’t let the title fool you; this isn’t about that abysmal Cubs team that went 59-103 with El Tappe, Lou Klein, and Charlie Metro at the helm. And no, the world is not on the precipice like those days in 1962 when Kennedy and Khrushchev took the world to the brink of nuclear war. But, there is an arms race going on with this story, although not of the pitching variety.
The sale of the Chicago Cubs from Sam Zell, the new owner of the Tribune Company, is nearing its final stages, and with it, history will be made. The sale of the Lovable Losers, Wrigley Field, and a 25 percent stake in ComcastSports Chicago will be bringing in well over $1 billion, thus surpassing the Red Sox sale in 2002 and setting the bar for other storied franchises that might come up for grabs, as well as push the needle up on all other clubs – big or small – if and when they hit the market. Somewhere, Harry Caray is saying, “Holy Cow!”
Five approved bidders that have reached the second round in the process each have submitted bids around that jaw-dropping $1 billion. Those bidders include Thomas Ricketts, whose father Joe founded the TD Ameritrade brokerage, Michael Tokarz, chairman of MVC Capital Inc., Sports Properties Acquisitions Corp., who has Henry Aaron and Jack Kemp as public representatives, but is headed by Andrew Murstein, a New York taxi company magnate, and fueled by a $200 million shares sale this past January, a group headed up by Hersch Klaff, a real estate investor, and Mark Cuban, owner of the Dallas Mavericks, and Chairman of HDNet, an HDTV cable network.
In a striking turn of events, the bidder deemed to be a near lock for the package, Madison Dearborn Partners CEO, John Canning, Jr. is sitting on the outside looking in after offering up an initial bid of approximately $800 million, a figure that while large, came in a cool $200 million below where those that made the cut landed. Canning, a minority owner of the Brewers, and a close friend of Bud Selig, fits MLB’s personal profile better than the best Armani suit, but at the end of the day, the Cubs sale is in such rarified air, at least in terms of the sale price, that Canning’s pull with the MLB brass simply couldn’t keep up dollar signs.
And, while Canning may seem to be out of the running, there is certainly the possibility that he could pull together more capital and get right back in the mix. The question on MLB’s mind is, will he? This is, after all, the Cubs, a club that has been successful while being the Kings of Futility. There are brands in baseball, but short of the Yankees, Red Sox, and possibly the Dodgers, is there a name that resonates across America as well? MLB needs -- nearly demands – an owner like Canning. Because, sitting on the doorstep and knocking hard is the antithesis of what an MLB owner is like today.
Mark Cuban, a man whose exceptional worth (reportedly $2.8 billion) was gained through new technology, selling Broadcast.com to Yahoo! and in the process became a billionaire. And while those Armani suits describe Canning, Cuban is one who seems to see the black turtleneck and jeans ala Steve Jobs as being “dressed up.” He’s a jeans and tees guy, something that most anyone with a pulse would have a hard time seeing the vast majority of the ownership brethren ever wearing.
Cuban, the NBA Mavericks owner, has been the one driving the arms race forward in the Cubs sale. A man that seems so driven to gain access to the Cubs that he reportedly has offered an initial bid of $1.3 billion, thus making it clear: you want to play hardball, bring your wallet.
With Canning out (for the moment; maybe longer), Cuban becomes the wild card, and in some ways, the prohibitive favorite. Here’s why.
Sam Zell, while wishing to retain a minority share of the Cubs, really has no interest in the baseball holdings tied to Tribune. Zell’s main motivation to keep that minority share is for tax dodge purposes. Earlier this year, when there was talk of the typical glacial process associated with an MLB sale, Zell said on CNBC’s Squawk Box, “Excuse me for being sarcastic, but the idea of a debate occurring over what I should do with my asset leaves me somewhat questioning the integrity of the debate. There’s a lot of people who would like to buy the Cubs and would like to buy the Cubs under their terms and conditions and, unfortunately, they have to deal with me.”
In other words, a rigged deal where a lower bid is accepted by the MLB owners could have consequences; possibly of the legal variety. With Zell having a $650 million debt payment obligation due in December and approximately $250 million in medium-term notes due in 2008, he’s in need of the highest offer, and can you blame him? Going back to that 2002 sale of the Boston Red Sox, many will recall that Charles Dolan offered up $40 million more than the winning bid submitted by John Henry, Tom Werner, and Larry Lucchino. $40 million might be one thing. If Cuban throws, say, $100 million more at the Cubs than the other bidders, MLB will be hard pressed not to accept.
But, here’s the real thing that could possibly scare the owners: It isn’t that Cuban is a wild card. It isn’t that he doesn’t dress the part. Cuban could wind up being brilliant.
The Cubs are an underutilized brand. Wrigley hasn’t been fully tapped. Cuban took the Mavericks, in a city where the Dallas Cowboys are somewhere short of religion, and made them a player in the NBA. After purchasing the Mavericks in 2000 for $200 million, Forbes valued them at $461 million, the sixth highest rated valued franchise in the NBA. What if Cuban decides to do the same with the Cubs? How do you think Jerry Reinsdorf would feel about that?
The fact that the club that would be impacted the most by a Cuban winning bid is also owned by a man that knows Cuban through the NBA smacks of the ironic. Reinsdorf, who owns the White Sox, also owns the Chicago Bulls. How did Jerry vote on Cuban coming to the NBA? He said no. Where does Jerry sit in order of the ownership brethren? He’s as close to Bud Selig as one can get. Cuban getting through the door will not be easy, but not impossible. He’s been on record as saying he’s opposed to guaranteed contracts in the NBA. Imagine if he put his weight behind that concept in MLB?
As I wrote in late May (Thwart A Cash Heavy Deal By Cuban? Try A Marriage) the one real shot that MLB has to thwart this cash heavy Cuban missile crisis is to pull together bidders in an attempt to get the profile, and the money together. Then, Zell wins, and MLB wins. This was done with the sale of the Washington Nationals where real estate developer Ted Lerner was married up with Stan Kasten, who to date is still the only executive to hold the position of president across three major league sports franchises at the same time (Braves, Thrashers, Hawks). Sports Properties Acquisitions Corp could be that player. Henry Aaron and Jack Kemp certainly would be more stately than a man that has sang Take Me Out to the Ballgame, and racked up over $1 million in league fines through the NBA.
The difficulty, of course, isn’t the “stateliness”, it’s the money. With the credit markets taking a massive hit, pulling together capital is not exactly easy these days. Bud will be working the phones overtime to try and get the players together.
The one thing known in this deal is expect the unknown. Over, and over, and over I wrote how the deal was wired for John Canning, and Cuban was simply the Bombay Sapphire in the mix – a pawn being used to gin up the price. With Canning looking like he’s out of the mix, anything seems possible. But, let’s dream a bit. Let’s say that a year from now, it is Mark Cuban that wins the bidding, and is the owner of the Cubs and Wrigley Field. Isn’t it safe to say that the league will be more colorful for it? That Cuban would bring a competitive element? That in bringing his wallet to the table, he increased the value of all MLB clubs? Look for the next set of bids to occur in September, and the finalized deal announced shortly after the World Series. It seems then, and only then, will we know who will own the Cubs, and whether Mark Cuban is sitting at the table.
Maury Brown is the Founder and President of the Business of Sports Network, which includes The Biz of Baseball, The Biz of Football, The Biz of Basketball and The Biz of Hockey. He is contributor to Baseball Prospectus, and is available as a freelance writer.
Brown's full bio is here. He looks forward to your comments via email and can be contacted through the Business of Sports Network.
| Designated Hitter | July 31, 2008 |
Dee-Fense . . . Dee-Fense . . .
Last year, Justin Inaz popularized a new fielding stat, based on the freely available data from the Hardball Times. This year I decided to set up a spreadsheet (one that can automatically update!) and keep track of fielding performance, using Justin’s process. While there are plenty of advanced fielding metrics out there, such as MGL’s Ultimate Zone Rating, David Pinto’s Probabilistic Model of Range, and John Dewan’s Plus/Minus, I figured, if anything, it wouldn’t hurt to have one more. It may not get as detailed as those listed above, but it’s pretty good and it’s available all the time (and for free).
The Methodology
The Hardball Times provides us with some great information to evaluate fielding performance. On their fielding stats page, they report, for each and every player, the number of balls hit into the player’s zone, the number of plays made on balls in their zone, and the number of plays made on balls hit outside of their zone. With these three numbers in hand, we can get a pretty solid grasp of a player’s fielding performance. But, before we get to that, we’ve got a few definitions to get out of the way:
Now, how do we go about turning three numbers into a decent fielding metric? Well, let’s take a look at Mariners’ shortstop Yuniesky Betancourt, as an example. He’s had 244 balls hit into his zone, and of those 244 chances, he’s turned 200 of them into outs. The average shortstop turns about 83% of balls in zone into outs, so we would expect the average SS to make about 203 plays, if they had 244 chances. Betancourt is about -3 compared to average.
How do we handle out of zone performance? Betancourt’s made just 17 out of zone plays so far in 2008. The average shortstop makes about .13 out of zone plays per in zone chance*, so we’d expect the average SS to have about 32 out of zone plays, given Yuni’s in zone chances. This puts Betancourt at -15 on OOZ balls and about -18 plays overall.
*One major assumption is being taken here. That is that the number of in zone chances a player gets also reflects the number of out of zone chances he’ll have. Since we don’t know exactly how many OOZ chances anyone actually has, we have to estimate this number somehow. Some people believe innings or total balls in play or something else would be a better proxy, but I’m using in zone chances here.
We now have Betancourt at -18 plays, but we’re not quite done yet. It’s a lot easier to work in terms of runs because that’s generally how we measure things in baseball, so we have to make one final conversion. Using the numbers derived from Chris Dial, we can turn plays into runs, simply by multiplying plays by .753 for shortstops (it varies by position as saving a play in, say, the outfield, is, on average, more valuable than saving a play in the infield). Betancourt now ends up at about -13 runs, or the second-worst MLB shortstop, ahead of only Bobby Crosby (-14.6).
That is essentially what you do, with every player, at every position (of course, Excel makes that a little bit easier, or at least it’s supposed to, if you know what you’re doing).
The Good and the Bad
There are a number of reasons why this metric (stat, translation, conversion, whatever you want to call it) is pretty darn good, and there are also, of course, many limitations.
Positives:
- It’s based on play-by-play data. It doesn’t try to estimate opportunities based on regular fielding stats. Rather, the folks at Baseball Info Solutions use video analysis of each play to derive the numbers. It’s a big step up over Range Factor and some of the other non-pbp metrics.
- It counts both in zone and out of zone performance, and it also keeps them separated (so you don’t get problems like this). I see a lot of people looking at RZR (plays/BIZ) and maybe trying to eyeball OOZ performance. Well, now you don’t have to do that. They’re both combined so you can get a picture of a fielder’s total contribution (at least in the range aspect of fielding).
- It’s available for free and we can update it when we want. Some of the more detailed metrics are often not updated until the end of the year, or are behind a paywall, or aren’t displayed at all for various reasons. Well, this may not be the most detailed -- more on that later -- but, thanks to the folks at The Hardball Times, it’s always there for us!
Negatives:
- There aren’t a lot of adjustments, like you’ll see in, say, something like Ultimate Zone Rating. For example, there isn’t an adjustment for the speed of the ball. A scorching grounder to the shortstop is going to look just like a routine ground ball, as long as they’re both in the shortstop’s zone, by this metric. Also, there are no park adjustments, and that could be a problem, especially in the outfield.
- A ball is either determined to be in the fielder’s zone or out of it. We all know that all balls hit into a fielder’s zone are not created equal. If one player gets a bunch of balls on the fringe of his zone one year, it could make him look worse than he really is, though we expect stuff like that to even out as we get more and more data.
- As mentioned above, we don’t know exactly how many opportunities a fielder has out of his zone. We can make as estimate, but there could certainly be problems with it.
- It certainly does not include every aspect of fielding; rather it concentrates on the range aspect. For instance, things like pop ups and double plays aren’t included for infielders, throwing arms aren’t included for outfielders, and scooping bad throws out of the dirt isn’t considered for first basement.
I think that, if we keep the limitations in mind, this can be a very useful number to look at. Of course, we can’t get carried away with two-thirds of a season’s stats, both because of the limitations mentioned above, and because of the relatively small amount of data we’re working with. With that said, let’s take a look at the best and worst teams and individual fielders so far in 2008.
Teams
Below are all 30 teams listed, in order of runs saved above average (through Monday, July 28):
STL     45.1
ATL     39.4
CHN     35.7
OAK     35.1
SD      31.0
HOU     28.3
PHI     28.0
LAN     27.5
MIL     22.4
TOR     18.5
LAA     15.4
NYN     10.3
TB       9.0
SF       4.7
CHA     -2.8
SEA     -5.5
COL     -6.1
BOS     -7.3
DET     -7.6
ARI     -8.6
WAS    -10.8
CLE    -12.9
BAL    -17.0
CIN    -19.2
PIT    -24.3
TEX    -26.4
FLA    -38.1
NYA    -48.9
MIN    -49.2
KC     -58.4
The Cardinals come out on top, at about 45 runs above average. The Cards are led by a great infield trio of Adam Kennedy ( 14.9), Albert Pujols ( 11.5), and Cezar Izturis ( 10.2). The Braves are also anchored by three great infielders in Yunel Escobar ( 17.4), Chipper Jones ( 16.5), and Mark Teixeira ( 10.6). The Cubs are led by rookie right fielder Kosuke Fukudome ( 15.5). Other standouts include Derrek Lee ( 7.2) and Mike Fontenot ( 6.8).
The Royals find themselves trailing the majors, at 58 runs below average. They have eight players that are at least 5 runs below average or worse. Minnesota’s been hurt badly by their infield defense: Justin Morneau (first, -10.7), Alexi Casilla (second, -6.1), Brendan Harris (short, -5.6), and Mike Lamb (third, -12.6). The Yankees can thank most of their poor rating to Bobby Abreu, who trails the majors at 27.5 runs below average.
Best and Worst Fielders
The subtitle there is a bit of a misnomer, as you’d like to have more than one year of data to truly determine the best and worst fielders. But here are the top 20 fielders so far in 2008, ranked in order of runs saved above average (these aren’t per 150 innings or anything, by the way – this is the player’s total so far):
Utley, Phi      25.0
Rolen, Tor      23.8
Beltre, Sea     21.8
Ellis, Oak      18.3
Hardy, Mil      17.5
Escobar, Atl    17.4
Giles, SD       16.9
Jones, Atl      16.5
Fukudome, Chi   15.5
Hannahan, Oak   14.9
Kennedy, Stl    14.9
Berkman, Hou    13.9
Winn, SF        13.2
Anderson, CHA   13.1
Votto, Cin      12.9
Rios, Tor       12.7
Gutierrez, Cle  11.5
Pujols, Stl     11.5
Helton, Col     11.3
Figgins, LAA    11.1
And how about the trailers:
Abreu, NYA      -27.5
Wells, Tor      -21.9
Jacobs, Fla     -17.9
Encarnacion,Cin -15.9
Hawpe, Col      -15.5
McLouth, Pit    -15.3
Griffey Jr, Cin -15.1
Mora, Bal       -14.8
Blake, Cle      -14.6
Crosby, Oak     -14.6
Ramirez, Bos    -14.1
Betancourt, Sea -13.3
Ordonez, Det    -13.3
Lamb, Min       -12.6
Easley, NYN     -12.5
Hermida, Fla    -12.5
Quentin, CHA    -12.1
Cantu, Tor      -12.1
Castillo, NYM   -12.0
Kinsler, Tex    -11.8
Figuring you might be interested in, oh, say, the 800 some players in between the top and bottom 20, here’s the full spreadsheet.
There you’ve got ratings at every position, positional averages in some of the key stats, and team totals again. Feel free to use it however you’d like, of course, and let me know if you have any questions. And let me know if I’ve messed anything up, be it in the spreadsheet or in any of my rambling above. I am by no means any type of expert on fielding analysis, but I find it fascinating, and I hope you do too.
Myron Logan writes about the Padres and baseball at Friar Forecast.
| Designated Hitter | July 14, 2008 |
They Were All-Stars – Believe It or Not!
With baseball's annual All-Star Game just around the corner, many fans are thinking about great names of the past and present. Each midseason contest includes a heavy dose of talented young players, perennial stars and future Hall of Famers.
Does that mean every All-Star is a big name with a glittering stat sheet? Not exactly.
The rules of All-Star selection - at least one representative from each team, no matter how inept (insert the 1939 Browns, '42 Phillies, '52 Pirates, '62 Mets and 2003 Tigers here) - plus last-minute replacements for injured players means a few journeymen sneak into All-Star status. In some cases, a first-half hot streak turns a mediocre player into the baseball equivalent of Cinderella, and the humble roster filler gets an invitation to the All-Star ball.
So who are some of the least deserving honorees? Here are the accidential All-Stars.
Bobo Newsom's 20-16 record for the hapless 1938 Browns (59-95) looks good enough for All-Star consideration, but it came with a 5.08 ERA that was 29 points above the American League average of 4.79. Newsom's 226 strikeouts and 192 walks were second in the AL.
Max West's 1940 numbers - a .261 average with 7 home runs and 72 RBI in 524 at-bats - are hardly the stuff of legend. Despite that, the Boston Bees (the name of the Braves from 1936 to 1941) outfielder made a big impact on that year's 4-0 victory for the National League. West hit a three-run homer in his only All-Star plate appearance. He left the game in the second inning after bruising his hip while crashing into the wall during an unsuccessful attempt to catch a Luke Appling double.
Phillies pitcher Cy Blanton was selected in 1941. He finished the season at 6-13 with a 4.51 ERA for the perennial cellar dwellers. The Philadelphia A's also offered little to choose from during that time. Catcher Hal Wagner hit .236 in 288 ABs with 1 HR and 30 RBI in 1942 but still made the All-Star roster.
Eddie Miller was a slick fielder, so it wasn't his .209 average that turned the Reds shortstop into a 1944 All-Star. Miller's 357 putouts, 544 assists and .971 fielding percentage led the league. Miller sat the game out due to injury, and he was replaced by Pirates infielder Frank Zak. How did the slap-hitting backup (just four extra-base hits in 160 ABs) become an All-Star? The game was played at Forbes Filed, and having a hometown player meant the National League needed to find one less train ticket in a time of scarcity and rationing.
Browns pitcher Jack Kramer made the squad in 1947. He finished the season 11-16 with a 4.97 ERA. While that might be decent by the lowly standard of the Brownies, it definitely wasn't All-Star quality. Tigers hurler Ted Gray was 10-7 in 1950, but a 4.40 ERA was nothing to brag about.
White Sox righty Randy Gumpert had his 15 minutes of All-Star fame in 1951 despite a 9-8, 4.32 record. Reds second baseman Grady Hatton was a slick fielder, but he hit just .212 in 430 ABs.
Browns shortstop Billy Hunter pinch-ran in the 1953 game. The rookie hit .219 (also his career average) with 1 HR and 37 RBI in 567 ABs during the franchise's final season in St. Louis. Teammate Satchel Paige joined Hunter and pitched in relief just days after his 47th birthday. On the NL side, lefty Murry Dickson finished 10-19 with a 4.53 ERA for the 50-104 Pirates.
Dick Stigman sat on the bench in both 1961 All-Star Games, as two July exhibitions were played each year from 1958 to 1962. The Indians lefty finished the season 5-11 with nine saves and a 4.51 ERA. Red Sox reliever Mike Fornieles (9-8, 4.68, 15 saves) gave up a run in a third of an inning in Game 1.
Senators catcher Don Leppert didn't appear in the 1963 contest. His stats for the season include 211 ABs, 6 HR, 24 RBI and a .237 average. Defensive and pitch-calling skills can put a poor-hitting catcher on the All-Star roster, and Andy Etchebarren pulled off that feat two years in a row. The Orioles reciever hit .221 with career highs in HR (11) and RBI (50) in 1966. Etchebarren followed with a .215, 7, 35 stat line in 1967. He did nothing more than warm up pitchers as an All-Star.
Slim pickings from expansion teams led to the inclusion a pair of journeyman catchers on the 1969 rosters. Chris Cannizzaro of the Padres (4 HR, 33 RBI, .220) and Royals backstop Ellie Rodriguez (2 HR, 20 RBI, .236 in 267 ABs) made the trip to RFK Stadium in Washington, but neither player appeared in the game.
Rangers first baseman Jim Spencer was known as a slick fielder (.999 fielding percentage and just one error in 1973), but his 4 HR, 43 RBI and .267 average are hardly the norm for a heavy-hitting position. Spencer went 0 for 1 as pinch-hitter in the '73 summer classic.
Angels infielder Dave Chalk hit .252 with 5 HR and 31 RBI in 465 AB in 1975, but that didn't keep him off the All-Star roster. Just nine doubles and three triples further illustrates Chalk's lack of punch. It wasn't defense that turned Chalk into an All-Star. He led AL shortstops in errors (29, .938 fielding percentage) despite playing just 99 games at the position. Chalk was more dependable at third base, and he repeated as an All-Star in 1976 at that position.
Steve Swisher lived up to his name with a .216 lifetime average. A solid defensive catcher, he represented the Cubs in 1976, but didn't appear in the game. Swisher's .236 average with 5 HR and 43 RBI in 377 AB was the high point of his career. Swisher's son Nick has made a reputation for himself as a slugging OF/1B for the A's and White Sox.
Dick Ruthven made two NL All-Star squads with less than impressive numbers. The right-hander was 14-17 with a 4.20 ERA for the Braves in 1976. Ruthven led the NL in losses that year.
A 12-7 record in strike-shortened 1981 looks good, but it was accompanied by a 5.14 ERA. Ironically, Ruthven wasn't an All-Star during his best season - a 17-10, 3.55 performance for the Phillies in 1980.
Biff Pocoroba is known by those who like unusual baseball names. The Braves catcher hit .242 with 6 HR and 34 RBI in 289 AB when he made his only All-Star team in 1978.
Ongoing expansion led to more eligible players and fewer desperation picks. The usual problem in recent years had been a lack of roster spots for every deserving candidate, something that usually wasn't an issue when the major leagues had just 16 teams.
Rangers pitcher Roger Pavlik was a 1994 All-Star. The 15-8 record looks fine, but the 5.19 ERA is another story. Paul Byrd's 4.60 ERA was paired with a 15-11 record for the Phillies in 1999. The control specialist gave up an unusually high (for him) 70 walks in 199.2 IP.
Rays closer Lance Carter had a strong first half in 2003 before fading after the All-Star Game. He finished the season with a 7-5 record, 26 saves and a 4.33 ERA.
Former Brewers closer Derrick Turnbow was cruising along with an ERA in the 3.00 range when he was named to the NL squad in 2006. That number rose to the 4.50 level by the time the All-Star Game was played. Bad turned to horrendous in the second half. When he wasn't giving up walks, Turnbow was getting hit hard. One of baseball's best closers in 2005, Turnbow ended 2006 with a 4-9 record, 24 saves and a 6.87 ERA, and he has never recaptured the magic of a few years ago.
The lesson? Being an All-Star is a great honor, but it says nothing about a player's long-term prospects.
| Designated Hitter | July 11, 2008 |
Great Moments in Frivolity, Part II
Yesterday we looked at March's monkeyshines and April's assininity. Today we wrap up with May, June, and July. What? July's not over yet? No worries. I'm sure no one will do anything stupid or noteworthy for the rest of the month.
May
Multiple news outlets profile the Royals' dynamic duo of Zach Greinke and Brian Bannister. They make for a great story. One guy is a much better story, however. I mean, when you consider all of the adversity he has overcome and the affliction with which he has struggled, man, you just get misty. I'm talking, of course, about Brian Bannister and his ability to hold a job without possessing a Major League fastball.
Sticking with the Royals, on May 2nd, reliever John Bale, frustrated at yet another poor performance, breaks his hand after punching a door. At the time he has a 7.63 ERA, which means that he was probably doing his team a favor by putting himself on the DL. Inspired, the Giants put pictures of one of the guys Barry Zito's ex-girlfriends hooked up with on every door in the clubhouse, hoping for a similar miracle.
Paul DePodesta, the Padres Special Assistant for Baseball Operations, starts his own blog. Team President Sandy Alderson is generally supportive, but hopes that DePodesta is strongly considered for the Mariners' vacant GM position so that he can get the use of his basement back.
Hall of Famer-elect Rich Gossage rants about how it takes three pitchers today to do the job that he and his bullpen brethren did back in the dark ages of the 1970s and 80s. Juan Marichal, Bob Gibson, and Sandy Koufax roll their eyes. Cy Young, Pud Galvin, and Tim Keefe inquire from beyond about what, exactly, a "bullpen" is.
Giants' GM Brian Sabean announces that he thinks his team can yet contend in 2008, lauding his players for overcoming all of the "challenges" and "question marks" they faced coming out of spring training. Sabean fails to mention, however, that all of the challenges and question marks were the result of his own failure to draft and develop a position player during virtually his entire tenure as General Manager.
Jon Lester throws a no-hitter against the Royals. Unfortunately, this is the only Red Sox game in weeks not featured on ESPN, so no one outside of Kansas City or New England gets to see it.
It is revealed that Roger Clemens routinely dispenses pitching advice to Joba Chamberlain via text message. While some express concern, cooler heads prevail when it's pointed out that Chamberlain is 22 years-old, and as such is much too old to hold Clemens' interest for long.
Officials from the State of Maryland hold a ceremony renaming a portion of I-395 outside of Camden Yards "Cal Ripken Way." Best thing about it: it's a very durable road, and thus resurfacing will not be necessary until 2024.
June
There's a lot of talk about Chase Utley for MVP. It rages throughout most of the month, but eventually subsides when someone points out that he's not even the best-hitting second baseman in the NL East whose last name starts with the letter "U".
Joba Chamberlain makes his much anticipated debut as a starting pitcher. He only lasts three innings. The short outing has nothing to do with his lack of effectiveness, however. Rather, there are so many reporters assembled for the game that the Yankees' media relations people thought it would be a good idea to make Chamberlain available for interviews beginning in the bottom of the fourth.
To hype the All-Star Game, Major League Baseball creates the "Statues on Parade" promotion, in which replicas of Lady Liberty are painted with the logos of all 30 Major League teams and placed in strategic locations around New York City. Many clever wags make jokes at what might happen to a statue painted with a Red Sox logo sitting on a street corner in the Bronx. No one seems to worry, however, about plastering the racist image of Chief Wahoo over one of our nation's greatest symbols of liberty.
Ozzie Guillen goes on an expletive-laced tirade following a bad White Sox loss, going so far as to call out Sox GM Kenny Williams, who fires back at Ozzie the following day. A few days later, Mariners manager John McLaren goes on a tirade of his own, and he is immediately defended and supported by Mariners' management as "having a right to be upset." Weeks later, McLaren is fired and Ozzie has the White Sox in first place. The lesson here: chemistry is overrated.
The Rangers and Indians play a midweek, four-game series in which 78 runs were scored, all of the games exceeded three hours in length – in fact three of the four pushed four hours – and sloppy play prevailed. Box scores documenting these crimes against baseball humanity are sent to the International Court of Justice in the Hague for further investigation, and a Truth and Reconciliation Committee is formed. Experts believe that the mental wounds inflicted by this atrocity of a series can one day heal, but it will take time.
Geddy Lee, the lead singer and bassist for Canadian progressive rock band Rush, makes one of the largest ever single donations of memorabilia to the Negro Leagues Baseball Museum. After he leaves, the entire staff of the Negro Leagues Baseball Museum runs to the nearest computer to try and figure out just who the hell Geddy Lee is.
In a USA Today story, experts are quoted as saying that, in order to limit arm and shoulder injuries, an 11- or 12-year-old pitcher should be limited to 85 pitches in one outing, players 10 or younger should be limited to 75 pitches, and 22 year-old New York Yankees' pitchers from Nebraska should be limited to 65.
In the latest of what seems to be a never-ending string of embarrassing stories about Roger Clemens, the New York tabloids report that, in addition to steroids, Clemens used Viagra as a performance enhancer. While many have alleged that "roid rage" was the cause of the tension between Clemens and Mike Piazza during the 2000 World Series, these new revelations shed a whole new light on things.
The Sporting News, the one-time Baseball Bible that has since fallen into near-obscurity, relaunches. Middle-aged men all over America are overjoyed that they will soon again be receiving week-old box scores in the mail every Tuesday afternoon.
David Ortiz becomes a U.S. citizen. Due to a series of complex treaties, however, it is still the case that any children he and his wife have during the baseball season will be subjects of Red Sox Nation.
The Mets fire Willie Randolph one day into a west coast road trip. Many commentators take issue with the late-night timing of the termination. Underreported is the fact that the Mets refuse to give their former manager a plane ticket back home. Randolph is last seen near the ride board at the UCLA student union.
The Yankees announce plans to put a Hard Rock Café in New Yankee Stadium. In explaining the reasons behind the move, Hank Steinbrenner says "we wanted the quality of the food we serve to the fans at New Yankee Stadium to reflect the quality of play they can expect to see on the field. It made perfect sense, therefore, to go with the overpriced and overrated fare of the Hard Rock Café!"
Good News: Cito Gaston is rehired as manager of the Toronto Blue Jays. Bad news: Paul Molitor, Roberto Alomar, and John Olerud are nowhere to be seen.
Bad news: Major shoulder surgery likely puts an end to Curt Schilling's baseball career. Worse news: major shoulder surgery likely marks the beginning of Curt Schilling's television career.
A story out of San Diego reveals that the Padres are looking to dump Greg Maddux. This story appears mere days after the Padres sign Brett Tomko. While Padres management continues to try and identify the reasons for the team's considerable struggles, experts note that doing things like keeping guys like Brett Tomko and dumping guys like Greg Maddux may be part of the problem.
July
It is announced that a Bon Jovi concert will be held in Central Park in connection with the All-Star Game. In related news, it is announced that the first 10,000 fans in Yankee Stadium on the night of the game will receive Swatch Watches, Cabbage Patch Kids, and jelly shoes.
C.C. Sabathia is traded to the Brewers. Extra beer, bratwurst, and large pants are immediately dispatched via convoy to Milwaukee.
In a reaction to the Sabathia trade, the Cubs pick up Rich Harden, and the Cardinals rush Mark Mulder back into the rotation. The Astros, Pirates, and Reds stand by slackjawed, unaware that teams can actually be buyers at the trade deadline.
Alex Rodriguez's marriage falls apart amid allegations of infidelity with Madonna and drunken dalliances with strippers. A-Rod is understandably confused by the fallout in the tabloids. For years he has been criticized for not being Mickey Mantle, and the moment he finally does something the Mick would do, he's attacked for it.
The wrecking balls come to Tiger Stadium. I wish I had a joke for this one, but I just don't.
Enjoy the All-Star Break. I think we all need it.
Craig Calcaterra is an attorney from Columbus, Ohio. When he's not defending the innocent and preserving democracy, he writes the baseball blog ShysterBall.
| Designated Hitter | July 10, 2008 |
Great Moments in Frivolity, Part I
On Monday, Rich took a look back at the important business of the 2008 season to date: who's winning, who's losing, and why. Unimportant business is important too, however, so over the next two days I’ll be providing a rundown of the ephemeral, the trivial, and the pathetic events of the season's first half. Today: March and April.
March
Following a poorly-played spring training game, Royals' manager Trey Hillman delivers a verbal reprimand of his entire team on the field in front of over 5,000 fans at Surprise Stadium. Sources in the crowd report that Hillman was particularly displeased with the way that the Royals lollygagged the ball around the infield, lollygagged their way down to first, and lollygagged in and out of the dugout. This, according to pitching coach Bob McClure, made the Royals "lollygaggers."
Billy Crystal signed with the Yankees and faced Pirates' pitcher Paul Maholm in his only at bat. He struck out, but looked pretty good doing it, especially for a sixty year-old man. Since it was a one-day contract, the Yankees released him that afternoon. Brian Cashman regrets the decision, however, after watching Robinson Cano post a .151/.211/.236 line in April.
Tensions flare between the Yankees and Rays after a hard slide which broke the wrist of New York's backup catcher Francisco Cervelli leads to a spiking/beanball war. This marks the last point of the season in which the Yankees would compete with Tampa Bay in any meaningful way.
In the greatest display of labor solidarity since the 1994-95 strike, the Boston Red Sox announce that they're boycotting their season-opening series against the A's in Tokyo unless coaches and staff are given a promised $40,000 bonus. Reporters, bloggers, and the professionally outraged are deeply disappointed when the strike ends approximately seventeen minutes after it begins.
Miguel Cabrera and the Tigers agree to an eight-year, $153M extension. When asked to comment, Tigers' GM Dave Dombrowski notes that such a large and long deal may be foolish when talking about a slow first basemen or DH, but it's an absolute steal for a third baseman.
An advance copy of Vindicated, Jose Canseco's new book is released, and once again Canseco is trashed as a liar and sleazeball. Among the crazy, outlandish things claimed by Canseco this time is the allegation that Alex Rodriguez was known to make advances towards women who were not his wife. How dare he besmirch the integrity and fidelity of a class act like Alex Rodriguez in such a fashion!
Spring training ends with a series in the Los Angeles Coliseum, and the regular season begins with a series in the Tokyo Dome. Ah, tradition!
April
Moises Alou admits to Associated Press columnist Jim Litke that he wouldn't have caught that foul ball in Game 5 of the 2003 NLCS even if Steve Bartman hadn't reached for it. He later recants and returns to claiming that Bartman interfered. Somewhere Steve Bartman is living under an assumed name and not finding any of this funny in the least.
Bill Buckner makes an emotional return to Fenway Park, where he is greeted warmly twenty-two years after his famous misplay in the 1986 World Series. This is not to be mistaken with the emotional return he made to Fenway Park as a player in 1990, where he was greeted warmly four years after his famous misplay in the 1986 World Series. It should likewise not later be mistaken with the emotional return he will make to Fenway Park in 2016, thirty years after his famous misplay in the 1986 World Series.
Miguel Cabrera is moved from third base to first base. When asked for comment, Tigers' GM Dave Dombrowski notes that such a move makes perfect sense given the contract extension to which the Tigers signed Cabrera a month before. Such a large and long deal would be foolish when talking about a player at an injury-susceptible position like third, Dombrowski says, but it's an absolute steal for a guy at a safe position like first base.
A book reveals that Mickey Mantle had an affair with Doris Day during the filming of "That Touch of Mink" back in 1962. Day denied the reports at the time, but Mantle's wife fled to Paris to be with pop singer Frankie Avalon and then immediately filed divorce papers. The whole thing was splashed all over the New York tabloids.
Former Blue Jays' third baseman Ed Sprague admits that, over the course of his Major League Career, he took amphetamines and Androstenedione and once hit a home run with a corked bat. As a result, Game 2 of the 1992 World Series is retroactively awarded to the Atlanta Braves. The teams are currently scheduled to meet at the end of the 2008 season to play a deciding Game 7. Jack Morris is set to start for the Jays, assuming someone can wake him up from his afternoon nap.
A Red Sox fan/construction worker at New Yankee Stadium secretly buries a David Ortiz jersey in concrete in an effort to jinx the Yankees. Someone talks, however, and his plan is disrupted. The jersey is removed, but not before an excavation subcontract is put out for bid and awarded, raising the price of the stadium an additional 296 million dollars.
The University of Central Florida's Institute for Diversity and Ethics in Sports releases its annual report on diversity in baseball. Its findings: that the percentage of Blacks in baseball is lower than it has ever been. This is similar to the study's findings for the previous two decades, and will continue to be the case until generations of interbreeding renders the entire human race a sort of tannish color. When that happens, The University of Central Florida's Institute for Diversity and Ethics in Sports will issue a report noting that the percentage of non-tan players in baseball is lower than it ever has been.
CC Sabathia goes 0-3 with a 13.50 ERA in his first four starts, rendering him an untradable pariah.
The Tampa Bay Rays sign Evan Longoria to a multi-year, multi-million dollar extension after six days of Major League service time. Realizing that they missed the window to obtain that kind of contract security, old timers Cole Hamels and Prince Fielder take factory jobs to make ends meet.
Elijah Dukes completes his community service for misdemeanor drug charges by cleaning out cages at a zoo. His lawyer is immediately disbarred for failing to argue at Dukes' sentencing hearing that playing for the Washington Nationals was already more than enough punishment.
In what is just one of many skeletons released from Roger Clemens's closet as a result of his defamation lawsuit against Brian McNamee, it is revealed that the Rocket had a longstanding affair with country singer Mindy McCready that began when she was still a teenager. Meanwhile, the eighty some-odd guys named in the Mitchell Report who didn't make a federal case out of it go on with their mostly rich, mostly happy, and mostly uneventful lives.
On April 29th, the Rays meet the Orioles in a battle for first place in the AL East. I don’t have a joke for that one as over two months later, I’m still trying to process it.
Craig Calcaterra is an attorney from Columbus, Ohio. When he's not defending the innocent and preserving democracy, he writes the baseball blog ShysterBall.
| Designated Hitter | June 26, 2008 |
An Ode to Baseball Cards
Twenty observations, anecdotes, half-truths, non-sequiturs, and sweet, sweet memories of a childhood spent with cardboard.
(Or, one item for every penny a pack cost 30 years ago.)
1. Your favorite set is most likely the one from your first year of collecting or following baseball. For me, it’s the simple, elegant 1978 Topps set, though I was later fond of the overproduced and now utterly worthless ’87 Topps set - you know, the ones with the fake wood paneling that were apparently designed with your dad’s old station wagon in mind. I have a good buddy who insists the blindingly gaudy ’76 Topps set was the best ever produced. Then again, it was his first year of collecting, and he happens to be color blind. Looking at those cards too long is probably what did it.
2. A rare card in your collection allows you to dare to dream of untold riches . . . at least temporarily. I could not have been the only 11-year-old in 1981 who discovered he owned the allegedly scarce ‘‘Craig’’ Nettles Fleer card, immediately got dollar signs in his eyes, and began plotting to buy a new 10-speed, cards by the case, a Cheryl Ladd poster, perhaps a red Lamborghini, and whatever else it is that 11-year-olds desire. (FYI: The Nettles wasn’t so rare after all; it now goes for $2 on eBay. I still haven’t got a Lamborghini, or for that matter, a decent bike.)
3. Other than perhaps a photographic archive at Cooperstown, cards serve as the premier visual history of the sport. And we’re not just talking about classics such as Mays in ’52, The Mick in ’56, or Koufax in ’66. Baseball cards also remind you, for instance, that Barry Bonds once had Kenny Lofton’s physique, a
muttonchopped Ozzie Smith actually made the Padres’ McDonald’s-inspired uniform look somewhat cool, and Oscar Gamble’s ’fro set a hair-raising standard never to be duplicated except possibly on the dance floor of Studio 54 in the summer of '77.
4. In the ’70s, Topps’s graphic artists and air-brushers were hired only after they failed the Tippy the Turtle test for the Art Instruction Institute: Did Greg Minton really look this? Was Mike Paxton actually one-dimensional? And did Andy Etchebarren seriously have a monobrow covering his entire forehead?(Wait . . . he did? That’s not airbrushed? The poor man.)
5. Other than having their own page on baseballreference.com, nothing validates an obscure player’s career more than appearing on his own card. Tom Newell, a personal favorite whose entire big-league life consisted of two relief appearances with the ’87 Phillies, appeared on two major-league cards. Not a bad ratio.
6. Rated Rookies often proved second-rate, and Future Stars more than occasionally turned out to be future insurance salesmen. One example of this phenoms-and-flops phenomenon is the ’87 Donruss set, which rated the top rookies to be Greg Maddux, Mark McGwire, Bo Jackson, Rafael Palmeiro . . . followed in the Donruss lineup by Pat Dodson, Bruce Fields, Ken Gerhart, and Jim Lindeman. But when you’re batting close to .500 in anything, I suppose you’re doing okay.
7. And who am I to judge anyway, for in my occasional attempts at investing in rookies, I proved comically inept at forecasting a player’s future. In a related note, if you know someone who wants a block of 100 1989 Topps Sil Campusano cards, I’m easy to reach. Heck, I’ll even throw in 50 1986 Topps Andres Thomases. But I’m keeping the 25 1986 Otis Nixons.
8. A childhood addiction does not lead to a life of crime: When I was in fourth grade, I got busted sneaking off school grounds at lunch to go to the neighborhood store and buy a hot dog and a few packs of . . . baseball cards. (What, you thought I’d say Virginia Slims?) Instead of confessing, I went with the tried-and-true ‘‘it must have been another kid that looks like me’’ defense, and when that Rusty Hardin-caliber argument crashed and burned, I lied and said I had the okay from my parents to do it. My masterstroke: A forged permission slip scribbled in broken cursive saying something like, ‘‘My sun Chad has permishin to by hot dogs at lunch so you can leave him alone now so he can go by hotdogs at lunch. And baseball cards also. Now leave him a lone. Thanks, Chad’s mom.’’ Needless to say, my scam soon ended with a tearful confession in the principal’s office. My parents’ punishment was both cruel and ironic: They took away my baseball cards for something like a month.
9. The Cal Ripken Jr. rookie card was never my most cherished from the 1982 Topps Traded set. Why? Because on his lone big-league card, an obscure (47 career at-bats) Mariners outfielder named Steve Stroughter appears to be proudly showing off a lovely lime-green booger in his nostril. That’s why. And no, some of us never do outgrow adolescent humor.
10. Growing up on the mean streets of Bath, Maine, I never saw anyone riding their bicycles with baseball cards in the spokes. And if I did, I’d have shoved the ungrateful little punks off their banana-seated Huffys and rescued all the Garry Templetons, Oscar Zamoras, and Felix Millans as if they were my own cardboard children. Because that’s how I rolled, yo.
11. Ken Griffey Jr.’s 1989 Upper Deck rookie card is a legitimately iconic card, as Darren Rovell explained so well in a Slate.com article last month, but not necessarily for the right reasons. The advent of Upper Deck, with its attractive, high-end cards, signaled the official transition from a hobby to a business, driving away countless collectors such as, well, me. I hate to sound like one of those ‘‘Back in my day . . . ’’ grumpy geezers, but it simply became too much for the mind (and wallet) to keep up with all the complicated and expensive Topps Chrome, SPx, Fleer Flair, and SP Authentics sets the companies relentlessly cranked out. And for the life of me I will never understand why a splinter or a swatch from a game-used bat or jersey is so appealing. I guess I’m just old.
12. It’s always a kick to see current managers the way they were as players, 30 or so years and 30 or so pounds ago: You know, back when Terry Francona had a mane, Lou Piniella didn’t yet have rabies, and Joe Torre looked . . . pretty much the same, actually, albeit with fewer nose hairs.
13. Those two cards you needed to complete your set would forever elude you, no matter how many packs you bought. Someday I will get you, Kiko Garcia and Gene Pentz! (Raises fist, shakes it furiously at the sky.) Someday, I will get you! (All right, probably not.)
14. The snot-nosed neighborhood kid who refused to trade you his doubles of Garcia and Pentz when he knew your desperation is now the same jerk-store refugee who just offered you Chien-Ming Wang and Phil Hughes for Brandon Webb and Edinson Volquez in your Rotisserie baseball league. Dude, you really need better friends.
15. The infamous 1989 Fleer Bill Ripken error card was all different kinds of awesome. Me, I always wondered what it said on the rest of his bats.
16. If you close your eyes right now, you can still smell the pink rectangle of gum/cement that came in Topps packs through the ’70s. Sure, the thing tasted about as good as a Jorge Orta card, and with less nutritional value, but to my 8-year-old self, it was a slice of creative genius. It was gum! With baseball cards! Why, of course I chewed it, every single stick from every single pack. In a related note, I’m pretty sure I’ve single-handedly paid for my dentist’s ski getaway in Aspen.
17. Dental reconstruction wasn’t the only downside to the so-called gum. Inevitably, that coveted Rickey Henderson rookie card would end up damaged by the gum’s sticky, chalky residue, while your 328th Mario Mendoza would escape unscathed. Sometimes there is no justice.
18. Like the game itself, they enhanced your bond with your dad. There were few things that brought me more joy as an 8-year-old then when my father would return from a trip to the store with two packs of ’78 Topps, and I still remember him sitting on the floor with me in my bedroom and helping me sort my cards so that traded players were with their new teams. Maybe I’m overly sentimental — okay, I am overly sentimental — but the memory is my version of Ray Kinsella’s catch with his dad.
19. . . . and someday, they will enhance my bond with my own children. Though my collecting nowadays consists of an occasional convenience store impulse purchase — the usual adult responsibilities, the advent of the $4.99 pack, and the realization that it was maybe a little odd for a grown man to hoard pictures of other grown men halted that habit — my tens of thousands of cards are tidily tucked away in the attic and my home office, waiting to be rediscovered by my young children a few years from now. Hopefully, they’ll never notice that Gene Pentz and Kiko Garcia are nowhere to be found.
20. ‘‘The Great American Baseball Card Flipping, Trading, and Bubble Gum Book’’ is a literary classic and should be taught in all high schools throughout the United States and certain parts of Canada. If you enjoyed reading this anywhere close to as much as I enjoyed writing it — and bless your cardboard-lovin’ soul if you did — then I guarantee you will treasure this nostalgic look at cards of the ’50s and ’60s, written with delightful wit by Brendan C. Boyd and Fred C. Harris. I’d love to read a sequel featuring cards of the ’70s and ’80s but it’s hard to imagine it would do the original justice.
Chad Finn is a sports copy editor at The Boston Globe and the founder and sole writer of Boston.com’s Touching All The Bases, a blog that takes a passionate but irreverent look at Boston sports. He lives in Wells, Maine, with his wife Jennifer, their children Leah and Alex, and a cat named after Otis Nixon.
| Designated Hitter | June 12, 2008 |
Mariners Foibles
As I write this, the Seattle Mariners have the worst record in baseball at 24-42. They stand 16 1/2 games behind the first place Angels and, worse, they stand a staggering nine games behind the third place Texas Rangers. The team will have to play inspired baseball for the rest of the season to just avoid finishing in last place, and suffice it to say, this isn't how the front office saw the 2008 season going.
"It's a completely demoralizing position we're in right now, based on the completely legitimate (preseason) expectations" was the line recently offered up by General Manager Bill Bavasi after last week's sweep at the hand of an Angels roster missing Vladimir Guerrero and Chone Figgins in a series where John Lackey didn't take the mound. Even with the reality of lousiness staring them in the face, the executives in charge of compiling this roster are unwilling to admit that this team was assembled poorly. It wasn't just a bad move here or an underperforming player there, but a long series of poor decisions that have led to this abysmal season. In fact, the foundations for this failure were laid years ago. Let's look at where this disaster started.
October 27, 2003
Coming off a 93 win season that saw the team fade down the stretch and fail to make the playoffs, Pat Gillick resigned as GM and was replaced by Bill Bavasi, but the basic plan for that offseason was laid before Gillick ever stepped aside. Central to that plan was the decision to decline an offer of arbitration to Mike Cameron, who badly wanted to stay in Seattle. Cameron was vastly underappreciated by the organization due to his contact problems and their failure to understand just how valuable his glove was in center field. Two weeks later, they announced the signing of Raul Ibanez to play left field, shifting Randy Winn to cover center in Cameron's absence. At the time, they noted the defensive downgrade but explained that it would be more than offset by the offensive improvement. Ibanez has hit well since returning to Seattle, but his defense in left field can only be described as atrocious and is one of the most glaring issues that has sunk the 2008 team to the bottom of the A.L. West. The seeds of the Ibanez-as-LF disaster were planted on the day that the team decided to jettison Cameron and make a conscious decision to sacrifice defense while chasing minor offensive improvements.
January 8, 2004
The Mariners organization has long been infatuated with player personalities and their effects on team chemistry, often making headscratching decisions based not on on-field ability but instead on thier preconceived notions of leadership and how the game is supposed to be played. That move is typified in the decision to literally give Carlos Guillen to the Tigers, as the organization had grown weary of his late-night drinking and his perceived negative influence on Freddy Garcia. They decided that they would rather go with Rich Aurilia as their shortstop - a guy who more fit their mold of how players should approach the game than Guillen. Aurilia was a gigantic bust and was released four months later, while Guillen has gone on to become one of the American League's best infielders ever since. It was impossible to see Guillen's breakout coming at the time, but the logic used - choosing to field a worse baseball team in order to have better people on it - has haunted the organization repeatedly over the years.
December 15, 2004
After a disastrous 2003 season, the organization was determined to make a big splash and find some new offensive stars to build around, using their financial advantage over the rest of the division to rebuild through free agency. They coveted Carlos Delgado's left-handed power, but after a long dance with him over contract terms, they got tired of waiting and threw $52 million at Plan B - Richie Sexson. Heading into his age 30 season and coming off a major injury while possessing classic old player skills, making a long term commitment to a player with Sexson's profile looked remarkably foolish at the time, and the concerns we raised about guaranteeing an aging Sexson big money have proven true with time. He's simply aged very poorly and is not a major league quality starting first baseman anymore, but the Mariners owe him $15.5 million for the 2008 season. Instead of looking at an aging veteran heading for decline and finding a younger, cheaper alternative, the organization focused on intangibles such as Sexson's intimidating power and ability to be an RBI man. Unwilling to admit that they had missed the boat on how he was going to age, Mariners fans instead got to watch his career end mercilessly during both the '07 and '08 seasons, while Sexson became the embodiment of everything wrong with this team.
December 22, 2005
If there's one glaring flaw the front office of the Mariners has, it's a total inability to evaluate pitching talent. They come from a bent that is entirely seduced by results and cares nothing about the process or the context that those results were produced in. Nowhere is this more obvious than when the Mariners gave Jarrod Washburn a 4-year, $37.5 million deal to leave the Angels and join their starting rotation. Washburn was coming off a 2005 season where he posted an obviously flukey 3.20 ERA, built entirely on a house of runner-stranding cards. His league high left-on-base percentage predictably regressed to the mean, and he went right back to being the #5 starter that he's been for years. Instead of being a solidifying force in the rotation, Washburn has given the M's 445 innings with a 4.72 ERA in a terrific pitcher's park since signing. Despite having to watch him implode in 2008, the M's are on the hook for another $10 million in salary in 2009, and they'd be lucky to give Washburn away at this point. Thanks to a pitching analysis based on results, the organization continues to just wildly misunderstand how to predict future run prevention, and this is most obvious with the Washburn contract. By the way, the next best offer Washburn had on the table was 2 years at a total of $14 million.
January 4, 2006
Faced with a strong desire for some "left handed sock," the M's focused on a list of low-cost, one-year options to fill the hole at Designated Hitter. Completely ignoring the entire concept of replacement level, the M's disregarded every player on the planet that wasn't a proven veteran with a long track record of success, essentially ensuring they were going to get a washed-up old timer on his last legs. That guy turned out to be Carl Everett, and his could-see-it-coming-a-mile-away failure both doomed the offense and led to an even more heinous transaction, when the Mariners shipped Asdrubal Cabrera and Shin-Soo Choo to Cleveland in separate deals to acquire the DH platoon of Ben Broussard and Eduardo Perez. Neither of the new acquisitions did much to help an offense that was in disrepair, and the careless giving away of talented youngsters in search of proven veterans depleted the farm system of guys who could have helped the team down the line. When asked directly why the team chose Everett over free talent guys such as Carlos Pena, Bavasi replied that "we know Everett can hit 5th or 6th in the line-up, and Pena just hasn't proven that he can do that yet". Good call, Bill.
December 7, 2006
In another transaction that was bad enough on its own and unbelievably horrible based on the future events it led to, we have the inexplicable Rafael Soriano for Horacio Ramirez trade. The M's were tired of Soriano's lack of durability and believed that his elbow was a ticking time bomb, so they set out to trade him at the winter meetings that year. They settled on a left-handed National Leaguer with a NL fastball because "he'd won some games before" and the Braves were willing to make him available. Ramirez was a complete disaster, giving the Mariners 100 innings of below replacement level performance before getting released. To replace Soriano, the Mariners then converted 2006 #1 draft pick Brandon Morrow into a relief pitcher, believing that they needed a new power arm to replace the one they just lost. Two years later and Morrow is still stuck in the bullpen, losing precious development time and not being able to be viewed as a potential option for the rotation. Because Morrow wasn't considered starter material, the Mariners blew $48 million on tub-of-goo Carlos Silva and then spent a first round pick on Josh Fields in the 2008 draft in order to have a new power reliever in the organization to allow them to move Morrow back to the rotation eventually. By trading Soriano, the M's not only got back a horrible pitcher, but they also opened several holes on the roster that they then spent precious valuable resources trying to fill.
December 18, 2006
Finally, the cherry on top of this amazing series of bad roster moves. Determined to not let Everett go down as the worst designated hitter in organizational history, the M's made the decision to fill their DH role for 2007 with a broken down middle infielder who had the power of an eight-year-old girl. The Nationals simply wanted to move Jose Vidro, who didn't fit in a league where defense was required, and somehow convinced the Mariners to pick up $12 million of the remaining $18 million left on Vidro's contract. The rationale given was that a move to DH would somehow restore the 32-year-old's power and, besides, they really needed a #2 hitter who didn't strike out, despite the fact that they had a team full of guys whose best skill was contact and lacked power. Not surprisingly, Vidro's power never returned, and he's posted a .289/.350/.376 line since coming over in the trade from Washington. Only in Seattle would that be acceptable as a performance from a designated hitter completely incapable of playing the field or running the bases, but somehow, that's what the organization decided they wanted. Vidro's presence on the roster not only kept the remains of Ibanez comically chasing fly balls in the outfield, but it also has forced them to keep top prospect Jeff Clement languishing in Tacoma while he destroys Pacific Coast League pitching. Hilariously, Vidro's 2008 performance has been so terrible (.215/.260/.323) that most fans are amazed he hasn't been released yet, but John McLaren's lineup construction veers so far from reality that he's spent the last two weeks alternating between the 3rd and 4th spots in the batting order. Seriously, Vidro, he of the .583 OPS, spent several games hitting cleanup for the Mariners recently. I wish I was kidding.
Through it all, the Mariners front office has demonstrated a staggering lack of ability to evaluate and project major league talent. They have repeatedly misunderstood what makes a winning team and made brutally bad choices that are compounded by even worse decisions trying to fix the problems created by the first act of ignorance. Through it all, they've doggedly maintained that their ways are effective and will work despite mountains of evidence to the contrary. Team President Chuck Armstrong, talking about the season and the job status of the front office on May 25th, uttered the following quotes:
"In my 23 years, I have never ever seen anything like this," Armstrong said "We saw it the other way in 2001. I mean, you have to ask yourself, 'How did the Mariners win 116 games that season with that roster, compared to this roster?' This is just as inexplicable the other way."
"Their positions are secure," Armstrong said "They are not to be blamed for what's going on."
"We have given no thought to making any changes in managerial personnel," Armstrong said. "Same for the GM. Listen, he's part of the solution, not the problem."
What's worse than abject failure? How about rooting for an organization that can't even recognize the problem from the solution? The Mariners executives are so rooted in their ways, so dogmatic in their wrongheadedness, that there is seemingly no light at the end of this long tunnel that we call being a Mariner fan. $117 million dollars in payroll has bought them a roster on pace to lose 104 games, and through it all, they won't admit responsibility. It's inexplicable, after all. What else is there to be said?
David Cameron, along with Derek Zumsteg, authors the ussmariner.com blog that covers the Seattle organization in more depth than they care to admit. He also writes daily for fangraphs.com as he looks to remember what it's like to enjoy watching baseball again.
| Designated Hitter | May 15, 2008 |
Just How Good Is Chipper Jones?
Whose career has been more productive – Ken Griffey or Chipper Jones?
Ken Griffey Jr. is about to hit his 600th home run. He has had a tremendous career and is a walk-in Hall of Famer. Griffey’s career has been lauded as one of the best ever. Rightfully so – Griffey is a terrific player, and has been most of his career. It will be great for him to reach 600 home runs and join a very small group.
Griffey is in the last year or so of his career. After the various PED scandals, Griffey is often anointed as the clean one from the era, and so he’ll get to be the face of “the best player” for the 1990s and 2000s. Mostly because he is much more popular than Alex Rodriguez.
Griffey has also been a centerfielder with the hitting career of a first baseman. The hitting he’s provided at his position only serves to maximize his value. He has always had a big defensive reputation, although many analyses have shown him to be just okay in his early career and downright awful in center late in his career. He’s been moved to right field, which helps his defense, but also increases the “requirement” on his batting performance at a time when his production is waning. Griffey’s bat has still been good coming into 2008, around average and above replacement level.
What does this have to do with Chipper Jones? Chipper is hitting a ton to open 2008, and even though it is just mid-May, articles have cropped up about the possibility of him hitting .400 for the season. Now, that is silly enough in its own right. The good news is it puts the spotlight on Chipper and gotten people to consider the quality of his career.
Chipper Jones is a great third baseman. He’s always been a top tier hitter and a solid fielder. While Chipper’s prowess with the bat is never questioned, his rank among great third basemen has. The problem is traditional metrics have shown Chipper to be a poor fielder. His Range Factor (Assists plus putouts per game) has routinely been below league norms. In the face of a significant groundball pitching staff with Greg Maddux and Tom Glavine, and lots of left-handed pitcher innings, Chipper “should” have seen many more chances than league average. To be converting fewer outs than league average could only mean he is a poor defensive third baseman. Chipper being moved off third base in 2002 to a weak fielder position in left field demonstrated that even the Braves recognized Chipper’s shortcomings.
Traditional metrics are wrong. Chipper’s defensive play is one of the most misunderstood performances in baseball. Chipper’s defense has been below average exactly twice in his thirteen-year career. He’s averaged about +4 defensive runs per season. For his career, he’s about 50 runs above average defensively.
What does this have to do with Ken Griffey? Griffey is going to be considered one of the greatest centerfielders ever to play. He’s going to be mentioned alongside Mantle, Mays, Cobb, Speaker. Chipper may or may not end up being mentioned alongside Schmidt, Mathews and Brett. He could end up being mentioned with Brooks Robinson and Pie Traynor, or worse, Ron Santo.
Ken Griffey is playing his 20th season, and he’s had a great career. He has accumulated over 1000 VORP (Value Over Replacement Player from Baseball Prospectus) in runs. Griffey hasn’t been great overall with the glove, and he averages just -4 runs, plenty of that coming from his last few years in center. For Griffey’s career, which has seen its decline phase, he has 1017 VORP runs and -79 defensive runs saved. He will head to the HoF with approximately 938 runs to his credit, as he’s unlikely to improve either of those marks significantly.
Chipper Jones is headed toward summer hitting over .400. Well over .400. He has 888 VORP runs and 52 defensive runs saved. He’s got quite a few more runs to pile up this season, and will play several more seasons. Chipper already has 940 runs. In Chipper’s decline phase, his defense may regress, but he’s going to pile up many more offensive runs.
So what is a good VORP over twenty years? Griffey is number four in total VORP over the last 20 years, behind Bonds and Frank Thomas and ARod. Everyone over 800 VORP is a future hall of famer, with the exception of Rafael Palmiero. The top players:
Barry Bonds
Frank Thomas
Ken Griffey Jr.
Jeff Bagwell
Alex Rodriguez
Edgar Martinez
Gary Sheffield
Rafael Palmeiro
Roberto Alomar
Craig Biggio
Manny Ramirez
Mike Piazza
Ken Griffey Jr., rightfully, will be recognized as one of the greatest players of this, or any generation, and will forever be lauded as one of the finest players ever – possibly inner circle. Chipper Jones has been every bit as good and so many people are unaware of what they are watching. Chipper isn’t just good, and he isn’t just great. Chipper is an all-time great RIGHT NOW. Hopefully he can chase .400 long enough so everyone remembers him that way.
============
Chris is a pharmaceutical research manager, which is good, because as a Mets fan, he knows where to find the anti-depressants. Turn-ons: Mets, defensive analysis, vodka. Turn-offs: The F'N Cardinals, feel-good stories, any form of adjusted Range Factor. His writings can be found at Baseball Think Factory. Consider yourselves warned.
(Ed. Note: For another exemplary Chris Dial work, have a look at this piece over at BTF on advanced defensive metrics.)
| Designated Hitter | May 11, 2008 |
A Mother's Trip Down Memory Lane
I'm Rich's mother and agreed to "do" this story for Mother's Day. He and his son Joe are flying home today after spending a week on the east coast, attending games at Fenway Park, Yankee Stadium, and Shea Stadium, as well as visiting Cooperstown for a couple of days.
My credentials – I probably should say credential – are having been married to a sportswriter for thirty years. There were definitely some perks.
Receiving four season tickets to the Dodgers games during the eleven years (1958-68) George covered them for the Long Beach Press-Telegram. These tickets probably had a lot to do with our immense popularity at that time.
Rubbing elbows with the players. Unlike today's multi-millionaire players, the athletes in the sixties were very approachable. We carpooled back and forth to and from the airport with the likes of Gino Cimoli and Stan Williams; played bridge with the Roebucks and Ginger Drysdale. Drove to spring training games in Phoenix with Jeri Roseboro, bought flatware from one of the Sherry brothers during the off-season (can't remember which one), received an etched-glass invitation to Frank Tanana’s wedding (didn’t go, can’t imagine now why not), were guests of the Drysdales at their Hidden Hills home and traded recipes with Pat Reiser (as in Mrs. Pete).
Receiving a color television set for Christmas from the Dodgers after they won the World Series in 1959! We were the only ones in our large circle of friends (remember the season tickets?) to own one and we certainly were popular the following week during the Rose parade! Think that would be a conflict of interest today? The Dodgers even handed out meal money to the writers before every trip. In cash!
Accompanying George on a road trip. That was an event! I flew on the "Kay O" Dodger plane with the team. As an interesting aside, the plane landed to refuel on a distant tarmac in Grand Island, Nebraska. I loudly shared (shouted?) that I was born in Grand Island, Nebraska. Some wag loudly proclaimed, "Nobody was born in Grand Island, Nebraska!" The trip included stops in St Louis, New York, Philadelphia and San Francisco. The World's Fair was taking place near Shea Stadium, and I was able to view Michelangelo's Pieta from a moving sidewalk before going to a game. Highlight! One day, after a game in New York, Maury Wills took George and me on a tour of Greenwich Village. We stopped in several bars where he was well known and in the last one he was invited to play Banjo with the small jazz band. Incredible!
Richard has written about the two pair of shoes, complete with pitching toes that Sandy Koufax gave to our left-handed pitching teenager, Tom, when he retired. Only one shoe has survived. And the priceless souvenir that is the official scorer's (George) score card, framed along with Walter Alston's lineup card that hung in the dugout of Sandy Koufax's perfect game. Cooperstown wants that, but we are hanging on to it!
It seemed like George was on the road so much during those years – six weeks each spring in Vero Beach and every road trip during the season – that we jokingly referred to him as "Uncle Daddy." But those were wonderful times, the memories of which we will treasure forever. Happy Mother's Day to me and all the other baseball wives and widows!
| Designated Hitter | April 24, 2008 |
Pitchers Can Be Clutch, Too!
While there's usually much chatter about clutch batting and whether it exists or doesn't exist, it seems as though clutch pitching doesn't get nearly as much attention as it should. If you believe batters step it up a notch when the game is on the line, it'd be only natural that pitchers also know when the game is on the line and would try a little harder in those situations, too.
There are lots of stats to measure how "lucky" a pitcher is, such as batting average on balls in play and left on base percentage. There's also ERA estimators such as FIP, which take into account walks, strikeouts, and home runs and then estimate what a pitcher's ERA should have been. But the problem is, none of these stats take into account how important a situation is in a game and that's where Leverage Index comes in to play.
Leverage Index measures the importance of a particular situation based on the game state (inning, score, runners, outs) of a game. It ranges from 0 to 10.9, with 1 being an average situation and 10.9 being the most important situation possible.
So let's look at which players have had the most and least success in high-leverage situations (LI of 2 or more) the past six years by looking at the difference in FIP between high-leverage situations and all other situations. I chose FIP because ERA doesn't really work for starting pitchers when looking at high-leverage situations and FIP is a better measure of a pitcher's overall skill. To qualify for this study, pitchers must have pitched a minimum of 50 high-leverage innings.
The "Clutch" Starters:
Name	        (other LI)(high LI)     Dif
Brad Penny          4.02      2.78      1.24
Jake Peavy          3.67      2.44      1.23
Chris Carpenter     3.72      2.75      0.97
Jeff Suppan         4.81      3.92      0.88
Jason Marquis       5.21      4.47      0.74
Dontrelle Willis    4.13      3.41      0.73
Jason Johnson       4.69      4.03      0.66
Victor Zambrano     5.30      4.64      0.66
Mike Maroth         5.13      4.48      0.65
Matt Morris         4.36      3.72      0.64
Topping the list is Brad Penny, followed by 2007 Cy Young winner Jake Peavy and then 2005 Cy Young winner Chris Carpenter. These three pitchers over the past five years have done exceptionally well in high-leverage situations. The real difference maker for Peavy is that he's allowed just a single home run in over 69 high-leverage innings.
The "Un-Clutch" Starters:
Name	        (other LI)(high LI)     Dif
Odalis Perez        4.17      5.76     -1.59
Jeff Weaver         4.43      5.93     -1.50
Kyle Lohse          4.66      5.86     -1.19
John Lackey         3.79      4.87     -1.08
Jason Schmidt       3.41      4.42     -1.01
Roy Oswalt          3.34      4.27     -0.93
Jose Contreras      4.46      5.37     -0.90
Jamie Moyer         4.73      5.56     -0.83
Tim Wakefield       4.61      5.39     -0.78
Johan Santana       3.17      3.94     -0.77
I can't say I'm incredibly surprised to see Jeff Weaver near the top of this list, but it's definitely interesting to see the likes of John Lackey, Roy Oswalt, and Johan Santana as "un-clutch." In high-leverage situations Santana has a slightly increased BB/9 and HR/9, Oswalt's K/9 drops nearly 2 points with a slight increase in BB/9, and Lackey's K/9, BB/9, and HR/9 all head about half a point in the wrong direction.
Time to check in on the relievers:
The "Clutch" Relievers:
Name	           (low LI) (high LI)    Dif
Joaquin Benoit        4.60      3.62     0.97
Jason Frasor          4.15      3.22     0.93
Francisco Rodriguez   3.21      2.29     0.93
Jonathan Papelbon     3.06      2.20     0.86
Ryan Madson           4.49      3.78     0.71
J.C. Romero           4.51      3.96     0.55
Chad Bradford         3.67      3.13     0.54
Kyle Farnsworth       4.11      3.60     0.51
Eric Gagne            2.22      1.73     0.49
Todd Jones            4.08      3.60     0.49
I must admit Eric Gagne's FIP in high-leverage situations is rather ridiculous; however, I should note this does not include his 2008 stats. In high-leverage situations, Jon Papelbon strikes out over 1 more batter per 9 innings and walks 1 less per 9 while K-Rod lowers his HR/9 by a considerable amount.
The "Un-Clutch" Relievers:
Name	           (low LI) (high LI)    Dif
Jason Isringhausen    2.97      4.78    -1.80
Justin Speier         3.97      5.56    -1.59
Keith Foulke          3.49      5.03    -1.54
Guillermo Mota        3.70      4.98    -1.28
Jesus Colome          4.65      5.76    -1.11
Jorge Julio           4.40      5.39    -0.99
Fernando Rodney       3.83      4.80    -0.98
Alan Embree           3.50      4.44    -0.95
Billy Wagner          2.60      3.52    -0.93
Cliff Politte         4.36      5.21    -0.85
It's a little surprising to see that Jason Isringhausen who has 212 saves since 2002 is not that great when it counts. In high-leverage situations he walks 3 more batters per 9 innings. Wow. And Keith Foulke appears to have a home run problem in those tight spots along with Billy Wagner.
It's always fun to look back and see who has been clutch, but are the same pitchers clutch every year? Unfortunately not. There's pretty much no correlation from year-to-year when it comes to how pitchers do in high-leverage situations compared to how they do in non-high-leverage situations.
So it looks like the same rule that applies to batters also applies to pitchers: you can tell who has been clutch, but you can't predict who will be clutch.
David Appelman is the creator of FanGraphs.com.
| Designated Hitter | April 03, 2008 |
Real Fans Love the DH
What do the following have in common? Sandy Koufax, Lefty Grove and Dazzy Vance. Right, they were all truly awful hitters. What about these three? Harmon Killebrew, Ralph Kiner and Hank Greenberg? Right again. They were all mediocre to poor fielders.
Somehow all six managed to get elected to the Hall of Fame.
Let's try another quiz. What connects Wes Ferrell, Don Newcombe and Bucky Walters? Well done, they are among the best-hitting pitchers in history. On the other hand, the similarity among Paul Blair, Roy McMillan and Jerry Grote is that they are among the best fielders at critical defensive positions. Except, in this case, none of the six is in the Hall of Fame with the only one receiving any support being Ferrell.
We can consider the issue another way. Suppose two shortstops are competing for a roster spot. Shortstop A is a brilliant fielder but barely adequate with the bat. Shortstop B is a decent enough fielder and a star with the bat. Is it conceivable a team might choose B over A? On the other hand, Pitcher A is a decent hurler with a great bat while B is a brilliant pitcher with no bat at all. Is there any chance that the team would select A over B for the rotation?
In other words (assuming we answer the questions the same way), while we ascribe practically no value to a pitcher's hitting and never evaluate their effectiveness based on their bats, we insist that they should come to the plate to do that which we do not value. We rhapsodize over a game where the pitcher is a "complete" player, but only care about it when arguing theoretically. In practice, it plays no part in our choices.
There are three categories of reasons why I consider the Designated Hitter the superior form of baseball and the non-DH game as fundamentally dishonest. One concerns baseball strategy. A second has to do with the nature of the game and the third rests on the evolution of the game.
Contrary to commonly accepted belief, the DH increases strategic choices and eliminates one of the more egregious sins of baseball managers. For all the sentiment about how important it is for managers to decide when to use a pinch hitter or make the double switch, that is a vastly overrated strategic decision. In almost every case, the choice is made for the manager; every fan pretty much knows when the manager has to pinch hit in a game. The exceptions are rare. And while not quite so dramatic, the decision to pinch hit for a weak hitting defensive shortstop or center fielder remains in the DH game. As for the double switch, I am genuinely amused by the stress put on the complexity of this move, as if an AL manager moving to the NL needs hours of special courses to understand and utilize the concept.
The same holds for the sacrifice bunt. In most cases, its use is pre-determined by the situation, and we all know exactly when it will happen. The few variations from this standard practice hardly alter the predictability of it in the vast majority of cases. And, of course, there is also the abomination of the one-out sacrifice bunt. Can you imagine it ever being used except in the case of the pitcher at bat? It is the baseball equivalent of the quarterback taking a knee at the end of the game. Its purpose is not to score but to avoid losing. In fact, watching pitchers run to first base or come to bat with no intention of swinging or simply to swing wildly 3 times so as to avoid getting hurt or tired violates the competitive nature of baseball. I know there are exceptions, which is the point. They are exceptions. In most cases, the pitcher's spot is where the pitcher can relax a bit, where there really is no competition. The focus on the eighth-place batter getting on base so as to clear the pitcher's spot from the next inning when you really are trying to score demonstrates the fundamental dishonesty of pitchers coming to the plate.
The above discussion leads us to the real strategies. With the pitcher due up, the #8 hitter will rarely try to steal. The possibilities of hit and run or run and hit are virtually eliminated. The effort of the baserunner to distract the pitcher is pretty much discarded and is even less likely if the pitcher gets on base. With a DH, every spot in the lineup becomes part of the offense and all the strategies remain at the manager's disposal. There is far more suspense and far more interest generated in every at bat. Every at bat is competitive and none can be thrown away. It is honest baseball.
The very nature of baseball demands that pitchers not come to bat. It is incompatible with their function on the field, which is fundamentally different from every other position. Our very language, describing people as players OR pitchers, reflects the basic understanding of this fact. Is there any other position where it is conceivable to call someone with a line of .173/.193/.208 or .194/.234/.287 a good hitter for his position? But that is what we say of Greg Maddux and Warren Spahn, the perpetrators of those rate stats. True, there are outliers, some pitchers even serving occasionally as pinch hitters. Red Ruffing (.269/.306/.389) was one of the truly great hitting pitchers. He slugged 36 home runs or one for every 54 ABs. That is about as good as it gets outside of Wes Ferrell. Don Drysdale sometimes pinch hit, although his career line was only .186/.228/.295. He did, however, hit 29 home runs or one every 40 ABs. Great hitting pitchers are still lousy hitters.
But there is an elephant in the room. George Herman Ruth, the ultimate outlier. He hit and pitched brilliantly and simultaneously. And he demonstrates my point. Even the Babe could not keep it up. In fact, as his hitting prowess developed, he increasingly cut back on his appearances as a pitcher. In his last year in Boston, he pitched just 133.3 innings and had his least impressive results. Once in New York, he gave up pitching altogether, appearing in just 5 more games during his career in rather undistinguished fashion. Had he been able to combine strong pitching with great hitting, it would have made sense to have him do both, appearing as the #3 hitter as a pitcher while playing outfield the other days, but that was never tried once in NY. There may be other reasons for not maximizing his effectiveness as both hitter and pitcher, I suppose, but I think it most likely that it could not be done. In recent years, there have been some efforts to combine the two functions as with Brooks Kieschnick with middling results.
The fact remains that the pitcher's function is so specialized and unique, requires such concentration on particular skills, that it is not reasonable to expect them to divide their attention by focusing on batting to the extent they can become adept at it. I know many pride themselves on working on their hitting and on particular skills like bunting but, no matter the pride, it has to remain a minor component of their efforts. And even more than ever before, such minimal attention to hitting cannot lead to a really usable skill in the majors, the rare (apparent) exception like Micah Owings aside.
Which leads us to the evolution of the game. At its inception, pitching was a different creature from what it has become. The pitcher was in many ways the least important team member at the start, limited to pitching underhand and having to place the ball where the batter wanted. In the early history of the game, specialization was less developed, players moving from position to position regularly, including pitchers. It made sense for the pitcher to hit as he was no different from the other players. In fact, even the greatest stars like Ed Delahanty and Honus Wagner were expected to play infield and outfield. The tradition of specialization evolved, and I wouldn't be surprised if some early 20th century commentators can be found who decried the modern ballplayer who lacked the completeness of earlier stars by playing just one position.
This specialization was particularly spectacular in the case of pitchers. The skills they increasingly needed to succeed precluded them from developing their offensive capabilities. Even the greatest pitchers – Cy Young, Christy Mathewson, Walter Johnson and Mordecai Brown – were terrible hitters. Partly this was because they did it so much less than before, although the great 19th century pitchers were awful hitters, too. Over the years, pitchers got fewer and fewer ABs, fewer opportunities to practice the skill on the field of play. Old Hoss Radbourne got to bat over 300 times in three separate seasons. Mathewson's high was 133 ABs, Tom Seaver's 95, and Maddux never topped 91. Relief pitchers, of course, nearly never come to bat.
We need to recognize that asking pitchers to hit eliminates the essence of the game which is fair competition. We remember the occasions when pitchers get a bit hit or contribute with the bat because it is so rare, and that is not a legitimate argument because what we should want is for every AB to provide the reasonable possibility of real competition. We do not justify a situation because of accidents. We get sentimental about the tradition of baseball in which pitchers hit, but we have to recognize that the game has changed and the urgency of correcting a mistake from the start, including placing pitchers in the lineup, should be corrected to reflect its increasing absurdity.
Were we starting fresh to create the game in 2008, it would make sense to separate the pitcher from all other players. There is no reason to keep it because the people who developed the game in the 1800s made the mistake to include them.
Bob Rittner is a retired history teacher. He plays softball to maintain the illusion of youth and shuffleboard as a hedge against that illusion being smashed.
| Designated Hitter | February 28, 2008 |
Facing the Facts on Clemens
A lot has changed since I started writing my first book, “Facing Clemens.” What was meant to be a fairly cut and dry baseball book about what it’s like for a hitter to try and ply their craft against the Rocket over the course of his career has obviously turned into much, much more. That being said, I still maintain the book has relevance. Regardless of where you stand on the current news surrounding Roger Clemens, the challenge of trying to hit him hasn’t changed. Perhaps his career has been forever tainted, but that doesn’t mean he wasn’t one of the toughest pitchers of all-time for a hitter to try to make a living off of.
The numbers, of course, more than back it up. He finished the 2007 season – now certainly his last – eighth on the all-time list in wins. Only one pitcher whose career was after 1940 is ahead of him: Warren Spahn. You’ve seen the other victory numbers. He’s first all-time on the active list and he reached 350 wins with the second fewest losses in the game’s history, behind only the guy who’s name is on the pitching award.
Now, before all the sabermetricians click elsewhere or write me off as an old fogey who knows nothing, I’ll go further. Wins, of course, can be misleading because they are so often not within a pitcher’s control. Clemens is second all-time in strikeouts and his name can be found on career leaderboards in a host of categories from things that show off his longevity, like games started or innings pitched, to his dominance, like shutouts, or to “new-fangled” stats like adjusted ERA+, which measures a pitcher’s ERA against the league average with ballpark effects taken into account (he’s ninth all-time, in case you were curious). Something like that helps bridge the generational divide for a “greatest pitcher of all time debate.” When stacked against his contemporaries, it almost isn’t fair. He leads just about every active career statistical list.
Then, of course, there’s the hardware and honors. With the seven Cy Youngs, the MVP Award, the 11 All-Star appearances, the World Series rings and total appearances, he’s off the charts on the Black Ink and Gray Ink Tests. The scores, 100 (fifth all-time) and 314 (eighth), speak for themselves. So does his Hall of Fame Monitor mark (336, second only behind Walter Johnson) and the Hall of Fame Standards Test score (73, eighth all-time behind Grover Cleveland Alexander). Now these numbers may be a bit meaningless now in terms of Hall of Fame chances, but it does give a more complete picture of just how dominant this guy was for 24 years.
In trying to determine who would be the best subjects for the book, I dug deeply into the numbers behind Clemens’ career (a quick thanks to the folks at retrosheet.org is essential at this point). I was quick to find who had faced Clemens the most (Cal Ripken Jr.), who had had some level of prolonged success against the Rocket (Ken Griffey Jr., especially in their AL days) and who really hadn’t had any luck at all (Torii Hunter and his 0-for-28).
Of course, numbers in baseball are like layers of an onion. Once you start peeling, you find more. How many realized that in Roger Clemens’ two 20-strikeout games, 10 years apart, he walked a grand total of zero? That’s right, no walks and 40 strikeouts over 18 innings (As an aside, I also learned Clemens wasn’t supposed to pitch against the Mariners that fateful night in 1986. He was slated to go the game prior, but it had been rained out.).
In researching for the Ripken chapter, I discovered that the Hall of Fame Oriole never once struck out more than 100 times in a season. In fact, the only two times he was over 90 were the first two seasons of his career when he was redefining what a shortstop could and should be. He struck out a grand total of 1305 times in 11,551 at-bats, or once every 8.85 AB. He whiffed 17 times in 109 at-bats against Clemens for a 6.41 per AB average.
A lot of fuss was made about the controversial time, in 1998, about how Clemens was scuffling in the first half, then “miraculously” turned it around in the second. Clemens had a 3.55 ERA in that first half and 120 strikeouts in 119 IP. I’m not saying this exonerates the man, but that first-half figure alone would have put him right near the top 10 for the year in ERA. The league ERA, by the way, was 4.61. Even in 1996, his last with the Red Sox when he was supposedly finished, he was sixth in the league with a 3.63 ERA while topping the league in K/9 and overall strikeouts.
Where does that leave us now in trying to figure out his legacy? It’s an extremely difficult question to answer. I’m not one who usually does everything by numbers – one of the things I appreciated about doing this book is how the stats were backed up by experiences, recollections from actual human beings. But sometimes, numbers can be the most impartial.
So let's say we completely believe the Mitchell Report and the ensuing testimony and Clemens started taking performance enhancers in 1998. Let's take a look at his career at that point. He had won four Cy Young Awards and gone to seven All-Star Games (I’m counting the 1998 Midsummer Classic because he earned that one pre-injections, according to the report). He’d earned five ERA titles, an MVP Award, gone to a World Series and led the league in those dreaded wins three times. He also took home four strikeout crowns and a pitching Triple Crown in 1997.
He had 213 wins at the end of the 1997 season. He had a 2.97 ERA. There wasn’t a league average ERA during that span under 4.00. Is that enough for a Hall of Fame career? Maybe not quite – though the Sandy Koufax argument could be made – but it’s not far off.
Even the biggest detractors of Clemens wouldn’t argue that he would’ve had to hang ‘em up in 1998 if it weren’t for Brian McNamee. The odds of him pitching another nine years are slim, but an argument could be made that he would’ve been done by, say, 2003, the year he “retired” for the first time in the World Series against the Marlins. Go ahead and take away the Cy Youngs in 1998 and 2001, if you must. Truth be told, his Yankee numbers aren’t all that overwhelming and his ERA, at best, hovered around where that 1998 first-half figure was. You have to figure he falls into about 13 wins per year as a Yankee, rough estimate. That’s another 65 victories to bring him to 278, all the previous hardware and a career ERA probably not too far off from his current mark of 3.12 (Again, league average in his career: 4.46).
What’s my point in all of this? To be honest, I’m still not sure. Like many fans, albeit one with a vested interest, I’m trying to figure all of this out. I’ve been covering the game long enough for nothing to shock me one way or the other. One thing is certain: Clemens’ image is forever tarnished, regardless of what happens in the future. I can’t foresee the Baseball Writers Association of America voting him into the Hall of Fame any time soon, assuming he actually is retired.
What I would ask is for those voters, as well as fans trying to make up their minds as well, to take a closer look at the numbers, even deeper than I’ve delved here. I think you might find, beneath the scandal, the congressional hearings, the “he said, he said” of the past few months, there’s still a pretty damn good pitcher under all of it, warts and all, who made it extremely difficult for hitters for a really long time.
Jonathan Mayo is a senior writer for MLB.com. He joined Major League Baseball’s official website in April 1999 and has covered three World Series, seven All-Star Games, the Opening Series in Japan and Puerto Rico, the Caribbean World Series in Mexico, and the College World Series in Omaha, Nebraska. More recently, Jonathan has focused his efforts on covering minor league baseball, the baseball draft, the Arizona Fall League, and baseball’s winter meetings. You can learn more about him and his first book on his website.
| Designated Hitter | February 15, 2008 |
My Son-in-Law the Ballplayer
The list actually started back when I arranged for Derek Jeter to take my then-4-year-old daughter to her senior prom.
List? What list?
Okay, I guess a bit of backtracking is probably in order here, yes?
I first met Jeter when he was a Yankees minor league prospect. Over the course of his breakthrough 1994 season, when he fast-tracked from Class A Tampa to Double-A Albany to Triple-A Columbus, and his 1995 campaign at Columbus before he made it to the big leagues, I got to know not only Jeter but his family as well, his parents and sister and grandmother and aunt.
There was no doubt in my mind he was going to be a mega-superstar. He had all the tools but beyond that he had poise, he was smart, he was sweet and to top it all off he looked like one of those statues of a Greek or Roman god you see in the first chapters of the Art History 101 books.
I was the minor league editor at USA Today's Baseball Weekly at the time and at the end of 1994, we (okay I) named him our Minor League Player of the Year.
We'd never had a minor league player on the cover of the paper, and though I left prior to the 2006 season I don't believe that with the exception of Michael Jordan there has ever been a minor leaguer on the cover of the publication to this day, in its 17 years of its existence. But it looked for awhile like that might change.
We had a portrait of him in Yankee pinstripes (though he had yet to make his major league debut), with those sea-green eyes and that half smile which, as I wrote to open the feature, "makes the Mona Lisa look like she’s on the verge of a nervous breakdown." And as luck would have it, we didn't have any other major player features running that week so until the last minute, it appeared that Derek Jeter would become the first minor leaguer to grace the cover of Baseball Weekly.
Until, that is, about a day before we went to press, when a power-that-be decided that we couldn't possibly put a no-name minor leaguer on the cover because no one would know who "that Jeter guy" was. So instead it was hastily replaced by a stock action picture of Frank Thomas which had absolutely no connection whatsoever to anything in the paper. (Oh and just for the record, in case you're wondering, no, that power that be was NOT Paul White, who has always been as big a proponent of getting minor leaguers their due as I was).
Imagine what a collector's item that paper would be now had it been the first national cover of Derek Jeter, two years before he took New York by storm and won the American League Rookie of the Year award.
So anyway, before I digress too much (oops, too late!) … fast-forward to the end of 1995. Jeter has been called up to the big leagues but is obviously nowhere near the superstar status that he will reach in a year or so.
I get a phone call from a former colleague who now worked for a luxury car dealership in the New York area, a company that apparently worked with the Yankees when it came to leasing cars for their players. They were looking for a personal reference for the new kid and remembered that I knew him. Could I tell them a little bit about him?
I am not kidding. They were asking ME for a personal reference for Derek Jeter. And this is what I told them:
"The best way I can describe Derek Jeter is that this is the guy you want to show up at your front door the night of your daughter's senior prom."
And that became the genesis for my "Players You'd Want to Take Your Daughter To The Prom" list. Which eventually morphed into the "Players You'd Want Your Daughter To Marry" list, which was more elite.
It's something I've bandied about with co-workers, with front office executives, even with other players (about half of whom say "I'd NEVER let my daughter marry a baseball player").
Maybe it's a girl thing, but my husband totally doesn't get it. He is convinced that my "Players I'd Want My Daughter To Marry" list is really just a euphemism for a "Players I'd Want to Date If I Were 25 Years Younger And Single And Didn't Work in Baseball Where It Would Be Totally Unprofessional Not To Mention A Conflict Of Interest" list.
Totally not true. This list is totally about character. In short, it's all about heart (cue the chorus of "Damn Yankees" or the 1969 New York Mets on the Ed Sullivan Show).
And yes, you skeptics, there are players who fit the bill. And for the sake of brevity (obviously not my strong point) I am going to narrow this down to my top three on my "Current Major Leaguers I'd Want My Daughter To Marry If She Were Older And They Weren't Already Happily Married" list.
Disclaimer: I have been covering baseball for almost 20 years now. And despite the sometimes prevailing thought by the general public that most professional baseball players are complete asses, the truth is my list of Complete Asses That I Would Rather Chew On Tinfoil Than Ever Let Breathe The Same Air As My Daughter list is much shorter than the other one (maybe I'll do that for next year's DH).
With that in mind, I worry about hurting the feelings of some great guys I've gotten to know over the years. But I don't think any of them would argue the three I'm writing about: Dave Roberts, Sean Casey and Kevin Millar.
The trio may corner the Major League market on niceness, kindness and heart. All three go above and beyond when it comes to being active in their communities and charitable foundations, and not just for show and not just when the cameras are clicking.
Dave Roberts, outfielder for the San Francisco Giants, is not only one of the nicest guys in baseball, he is quite simply one of the nicest people I've ever met, period.
Originally drafted out of UCLA by the Tigers back in 1994, he's been the proverbial journeyman, with the Giants being his seventh organization. But it was in his very brief tenure with the Boston Red Sox that "Doc" reached that nirvana of baseball immortality.
It's the ninth inning of Game 4 of the 2004 ALCS against the Yankees, the Sox trailing 4-3 and an inning away from elimination. Roberts, who was in to pinch run, ironically, for Millar, steals second against Mariano Rivera. The Sox rally, Roberts scores the tying run and, well, you know the rest. And as I watched the game from a hotel room in Arizona, on the road for Arizona Fall League, I knew that Roberts had just ensured himself fame forever and a head full of cheap champagne.
And all I could think was "this couldn't happen to a nicer guy."
Born in Okinawa, Japan, Roberts enjoys dual citizenship as the son of an American-born Marine dad and a Japanese mom, and has always been a proud ambassador for all of his cultural roots. As a member of the 1999 Team USA squad that earned the United States the berth in the 2000 Summer Olympics where they won their last gold medal, he was both a team leader and its leadoff-hitting sparkplug.
It's funny that there is this "connect" among the three guys on my list. On the one hand, Roberts and Millar were teammates on that historic world champion 2004 Boston Red Sox team.
But one of my favorite Roberts stories is one that Sean Casey himself told me. When Roberts was traded by Detroit to the Cleveland Indians in June 1998 for outfielder Geronimo Berroa, he joined the Double-A Akron Aeros. The guy who lost the most playing time with the acquisition of Roberts was outfielder Mark Budzinski, a teammate of Casey's at the University of Richmond and one of his best friends.
Casey, himself originally an Indians prospect, had been traded the previous off-season to Cincinnati but stayed in close touch with Budzinski. When he commiserated with his friend on his decreased playing time, he told me later, Budzinski's response was something along the lines of: "The thing is, Dave Roberts is such a great guy I can't even get upset about losing time to him."
It is the newly inked Boston Red Sox first baseman Casey himself, though, who is most widely acknowledged to be, officially, the Friendliest Guy In Baseball. A recent poll in Sports Illustrated, conducted among Major Leaguers themselves, saw a whopping 46 percent of the respondents name Casey (let the record show that Roberts ranked fourth and Millar sixth so I am not alone in my opinion here).
I had the great good fortune of first getting to know him well before he made it to the big leagues, back when I covered the Indians' first winter development program in Cleveland in January 1996, just a few months after he was drafted. From the "small world" department, one of his best friends from college happened to live in my town, just down the block from my own daughter's best friend.
It says something about how friendly he was that this fact would even come up, no less the tidbit I learned about his having worked making bagels at the local Stop N Shop when he was playing Cape Cod League baseball.
It was easy to see how Casey had earned the nickname "The Mayor" for his incredible natural chatty ease with everyone he meets, not just the players who pass through his first base watch over the course of a game. And it certainly didn't surprise me to learn that then-farm director Mark Shapiro literally cried two years later when his team dealt Casey to Cincinnati for pitcher Dave Burba.
Now, I realize that Millar may seem to be the "one of these things is not like the others" name on this list to the uninitiated. I mean, this is Rally Karaoke Guy whose 18-year-old self got down and dirty to "Born In The U.S.A." on a nightly basis on the Fenway Park scoreboard. The guy who made taking ceremonial shots of Jack Daniels before a big game a team tradition. A guy known for his bizarre facial hair, his passion for Harley Davidson motorcycles and tattoos.
Is this really the kind of guy I'd want my daughter to marry?
Bet your ass it is.
If Dave Roberts is the nicest guy in baseball and Sean Casey is the friendliest, then it is Kevin Millar who has the game's biggest heart.
A non-drafted free agent who made his way to the big leagues through the independent Northern League and by all accounts Against All Odds (which he has tattooed on his arm), he brings his unbridled passion and enthusiasm and love for the game to every aspect of his life. And to other people's lives as well.
Back in 1997, when he was earning Eastern League MVP honors with the Double-A Portland Sea Dogs, Millar got to know a young fan named Morgan Grant and her family who hailed from nearby Pownal, Maine.
Morgan was terminally ill with brain cancer, but she and her family rarely missed a Sea Dogs game and not surprisingly it wasn't long before the scrappy Millar was her favorite player. The two forged a friendship over that summer that resulted in his helping to grant one of her last wishes – to come with her family to visit him that winter in southern California.
When Morgan was too weak to change out of her pajamas, Millar simply got into his own jammies and the families had a pajama party. It was there in California that Morgan took a turn for the worse and passed away, having spent her final days with the people she loved the most.
How can you not love a guy like this?
By the way, you may have noticed that Derek Jeter isn't on the list. I honestly think that there comes a level of superstardom where a guy is automatically eliminated from the list. Because truthfully I wouldn't want my daughter to be married to someone with whom she couldn't even go out to Outback without causing a small public riot.
So Derek, you're off the hook. But in case you were wondering, Dana's senior prom is May 2. Time flies, doesn't it? I realize you probably can't make it, but if you feel like sending a corsage, you know where to find her.
Lisa Winston writes for MiLB.com, where you can read about any Minor League player she would ever consider getting for her roto team.
| Designated Hitter | January 31, 2008 |
The Yellow Hammer
[Editor's note: Russ McQueen and my brother Tom were All-CIF pitchers on the Lakewood High School team that won the California Interscholastic Federation championship at Anaheim Stadium in 1970. Russ played on four consecutive NCAA championship teams at USC. He was named the College World Series MVP in 1972 when he pitched 14 shutout innings in relief while chalking up three of USC's five wins and saving a fourth. A 1970s CWS All-Decade selection, McQueen tossed a no-hitter vs. Cal to mark the opening of Dedeaux Field on 3/30/74. Russ was drafted by the California Angels in June 1974 and pitched three years in the club's minor league system.]
As I recently read some of Rich's articles, I was taken back to the Lakewood High baseball field one dreary, overcast, fall Saturday morning.
Seated in the third base dugout, I tried to stay as close to manager, scout and former Dodger pitcher Ed Roebuck as possible, to catch whatever he might say to help me comprehend the game of baseball. He might even ask me to get loose and pitch an inning or two; that is, if he ran out of pitchers or happened to remember I had thrown batting practice the last several Saturdays.
There was nothing unusual about seeing new faces, arms and bats at "The Lake" on a Saturday morning. After all, it was a scout league where minor leaguers and some college guys would show up for some work. A few of us high school guys came out in case... well, just in case.
A new fellow came by that morning with a big equipment bag and exchanged quick hellos and howaryas up and down the line. He meant nothing to me, and I figured him for another lower minor leaguer looking for some work. Mr. Roebuck caught his eye and offered, "Get loose and work a couple innings if you want to."
"If you want to?"
I thought no more about it, other than to spend an inning or so quietly lamenting the fact that I'd now have to wait at least two more innings to have any hope of hearing those words myself.
Then something happened.
The new guy took the mound and things changed. An air of expectancy took hold, and the place got quiet. Sounds were reduced only to those necessary. It felt like a premonition of something terrible, or terribly great, like right before a big fish takes your lure and you know in your gut he's about to hit.
The first batter took his stance. Fast ball, strike one called. Not bad, right down at the knees and on the inside corner. With considerable zip. Not the one he wanted to hit, I thought. But then the new guy threw something I had never seen before. It was gorgeous, and it was terrible, and I wasn't sure I had seen it correctly. Fast like a heater, but in front of the plate it made a wicked dive, down and a little bit away from the batter, who buckled at the knees. Strike two called. Hearts beat faster – I know mine did.
"Throw it again," I prayed.
He did, only this time the batter mustered up a feeble excuse for a swing and made his retreat back to the bench, where he joined other mortals to watch the continuing carnage.
Five more up, five more down. One guy grounded out, but everyone else fell to that monstrous, terrifying curve ball.
I've seen the Grand Canyon and the Grand Tetons. I've walked into Yankee Stadium and Fenway Park and Wrigley Field on a Sunday afternoon. I've been to dozens of countries all over the world and seen it all. But I have never seen anything more riveting than that curve ball on that one cool, gray Saturday morning.
I have always remembered that awesome pitch as a big hammer the new guy swung and pounded batters with. It certainly went way beyond any fair deal I ever witnessed. To say "he threw a curve" was to understate the terror of the act. However ordinary the new guy looked to begin with, to me he had become substantially taller, heavier, and more dangerous.
For a moment there was no one sitting between me and Mr. Roebuck. "That's some kind of a curve ball," I managed, trying to make it sound as casual as I could so Mr. Roebuck wouldn't think I was overly impressed.
"Son, that's a pure yellow hammer," replied Roebuck. "And that is Bert Blyleven."
Russ McQueen, a CPA with PricewaterhouseCoopers LLP, is married to his wife Betty (thirty-two years) and has three sons, including Matt, first baseman for the Biola University Eagles.
| Designated Hitter | January 24, 2008 |
I'm OK, You're OK
I think the most productive discussion is the one where, after spirited debate, each person argues in favor of his opponent's case. And the least productive is when each person comes away convinced he is right and has demolished his opponent's arguments.
I would like to spin off from the Mark Armour In Defense of the Hall of Fame thread to consider the differences between traditional baseball writers and the contemporary analytical community. The distinction is not always stark; I always considered Leonard Koppett an analyst, and I enjoyed reading Arthur Daley, Roger Angell and others who brought the game to life for me and often provided a sense of intimacy with the players. Often, they brought to the issues facing the game an intellectual perspective that stimulated thinking on subjects like expansion or the DH rule or the Curt Flood case.
And often they were fine writers whose humor and ability to delineate the character of particular people expressed the mood of the game and enhanced the joy of watching and thinking about it. I still alternately laugh and tear up reading Larry Ritter's "The Glory of Their Times" even while cringing at some of the cliches from Lefty O'Doul and others. Periodically I listen to excerpts on tape from some of Ritter's interviews, and hearing Sam Crawford describe Rube Waddell or barnstorming in the mid-west, or Hans Lobert discussing Honus Wagner's kindness to the rookie or Fred Snodgrass defending himself and Fred Merkle from the criticism both have endured makes the game real and vibrant. I really think it is required reading (or listening) for any baseball fan.
But in my mind, with rare exceptions, these were not really analysts. They were writing about the game as literary figures, creating plots and climaxes and denouements and using all the approved techniques of novelists. What mattered was the story. Baseball was the arena in which to exhibit character and moral principles. And stories were built around those issues. Players rose to the occasion or choked, were heroes or goats, overcame all sorts of obstacles and odds or failed to deliver for their teammates and fans.
The stories were exciting and sometimes even had whispers of truth in them, but they had nothing to do with what was really happening because most of what really happens is mundane and not terribly exciting. The job of these writers was to extract the drama from the details and to make the story as interesting as possible.
After a time, certain themes (often reflecting virtues like sacrificing for the team or out-thinking the opposition) became fixed orthodoxy, elevating strategies like sacrifice bunts and moving runners over and the psychology of winning to the status of gospel or leitmotifs in most story lines. I have sometimes speculated that in the first decades of the 20th century when the sport was considered disreputable by many and the province of hooligans, in an effort to make baseball more respectable, books and articles by Christy Mathewson (or his ghostwriter) and others focused on the "inside game," the intellectual components of baseball, and praised the cleverness and psychological maneuverings of manager John McGraw. The effect was not simply to make baseball a more intellectually and morally respectable game, but it simultaneously established the basic principles that hardened into "the Book."
I was satisfied with this sort of baseball writing and raised my son with my recollections of baseball in the 1950s and discussions of columns in the mainstream newspapers and books of the 1970s. When he was a teenager, he returned the favor by introducing me to Bill James. And in my mid-40s, I became dissatisfied. Of course, James was interested in the stories and anecdotes. (In fact, I was sometimes irritated when I expected a hard analysis of some player's ranking in his Abstract only to be treated instead to some tangent about Dick Williams socializing with Sal Bando.) But alongside were questions and a serious attempt to find some way to answer them. I did not always follow the math, but I did understand the logic, and it was exciting. I still read the columns but they were not enough. The columns were about human interest and could have been on any subject. James and company were about baseball specifically.
In a way, the sabermetricians have created a problem for the traditional columnists. The early journalists always used stats, but they were rarely the key to any argument, and they generally were rather simple and commonly understood. They were the details that lent depth to a story, like descriptions of scenery and characters' physical traits in a novel. The journalists' audience, training and medium are not conducive to detailed statistical analysis. When Murray Chass mocks VORP and the like, I think he is actually making a valid point (I am really biting my tongue now) in the context of what would be acceptable in a mass circulation newspaper.
Of course elements of sabermetrics can and should be incorporated into the columns, and the movement has earned the right to be respected by columnists. Some have and do, and even those who ignore or resist progressive statistical analysis are clearly influenced by it, at least on the margins. OBP has almost gained the status of BA, albeit not quite, even among traditionalists. But to ask them to accept its approach as authoritative or to defer to its judgments is futile. They can include OBP, even ERA+ or OPS+ in their assessments, but their style precludes the charts and graphs and more detailed statistics. You don't ask Tolstoy to include a chart of the nationalities of prisoners in "War and Peace."
And the reason is not that they are wrong. It is that the two groups are engaged in different purposes. And while it is easy for sabermetricians to apply the approach of traditionalists to liven up their writings, it is not so easy for traditionalists to incorporate statistical models and arguments in theirs. So there is frustration on both sides.
When a traditional columnist writes an article defending a position, sabermetricians attack using all the tools at their disposal, and sometimes with sarcasm and nastiness. If the columnist dismisses their arguments, they pile on. But it is even worse if he tries to meet them on their own grounds. Without the expertise, his statistical arguments appear juvenile and then the attacks often turn vicious and personal. A successful career journalist, out of his depth in this kind of debate, finds himself the object of mockery, and with the internet, there is now a public forum for the ridicule. The problem is there is no common ground. The traditional journalist is not wrong; he simply has a different purpose, and to critique him is like arguing with Shakespeare that Hamlet should have compromised with Claudius or brought him before a board of inquiry.
When an issue like the Hall of Fame elections arises, the problem is magnified because for statistically minded analysts there are objective criteria from which to begin the discussion. But to many traditionalists, the key word in the discussion is "Fame" as in who do people know, who had an impact on the story.
Jack Morris exemplified qualities that suggest he is a Hall of Fame character; Bert Blyleven did not. Jim Rice dominated because that is the story line, and for anyone who lived in his era, it makes perfect sense. It does not matter to those who are now voting if the statistics belie the claim.* When I watched a Yankee game and Rice came to the plate, I was scared. I was not as worried when Dwight Evans was at bat. I may have been wrong, but Rice felt like a star and Evans a supporting player. To say the journalists are wrong does nothing to advance the discussion because these players are first and foremost literary figures to them. You and I may know that Watson and Crick were far greater men than Alexander the Great and Napoleon, but in the pantheon of human heroes, you can bet Alexander will get in first, and nobody is going to identify Crick as Crick the Great.
I do think there can and ought to be dialogue between the "schools of thought," but I think it requires mutual respect for and recognition of the divergent approaches. The dichotomy is probably not as dramatic as I have suggested, but I do think it would help if in debating points each side tries first to ascertain where there is common ground so they can talk to each other rather than at each other.
*I am reminded of reading that the Medieval books about the Lives of the Saints were almost entirely fictitious as narratives of events. Their truth was in the morals of the stories, the standards of behavior and faith the saints represented. So a particular saint may not even have existed, but the virtue of courage or charity he exemplified did exist and was true.
Robert Rittner is a retired high school history teacher from Westchester county, NY, now living in Clearwater, Florida. He has been a baseball fan since 1951, moving to Florida in part because of the opportunity to watch baseball regularly. He is also starting to hit a little better in his softball league.
[Additional reader comments and retorts at Baseball Primer Newsblog.]
| Designated Hitter | January 10, 2008 |
In Defense of the Hall of Fame
[Editor's Note: As always, the views expressed in this article are those of the author and do not necessarily reflect the official policy or position of Baseball Analysts and/or its writers.]
Over the holidays, I spent a lot of time poring over issues of The Sporting News from the 1960s. Typically distracted by stories that have nothing to do with my task, I came across many discussions about who should be in the Hall of Fame. This was 45 years ago, so the articles were about guys like Sam Rice, George Kelly, Elmer Flick, or Jim Bottomley, written by Shirley Povich, Fred Lieb, Lee Allen, or Taylor Spink, with testimony from Branch Rickey, Joe McCarthy, or Casey Stengel, old men who knew a thing or two about talent. There were stories like this every off-season, largely anecdotal, well-written, and fascinating. My reading has been like a refresher course in early 20th century baseball.
What was missing from these newspapers were all of the “No” votes. Back in the day, a writer would pull out his typewriter to support some old ballplayer, but there were no stories about why someone was overrated or unqualified. Had baseball blogs existed in 1962, some modern expert could have lectured Povich about Sam Rice’s WARP score, or blasted Rickey for his silly misevaluation of George Kelly. But we missed out on all of that good fun, and eventually all these guys, and others like them, got in.
The argument for George Kelly, as I recall it, went something like this: starred on offense and defense for the only National League team ever to win four consecutive pennants (still true), won multiple HR and RBI titles, credited by John McGraw with getting more important hits than any man who ever played for him, and had a cool nickname (“Highpockets”). Using the standards of the time, that’s a decent argument. Not perfect, insufficient even, but not a bad resume. Kelly was a fine player.
There are very few people around anymore who think George Kelly should be in the Hall of Fame (Bill James has suggested he is the worst player in the Hall), though there are also few people around who know anything about him—what teams he played for, his impact on those teams, what his great manager thought of him, how he played the game. All we know about him, or think we know about him, is how good his statistics were. Not good enough, apparently.
I am not suggesting that George Kelly “deserves” his plaque—whatever that means. Rather, I am saying that the man and his accomplishments and his stories have been buried by the avalanche of his Hall of Fame case. The memories and opinions of Fred Lieb and Branch Rickey have been replaced with … what exactly? Is there anyone out there that has anything to say about any of these players besides their statistics? Forget George Kelly, does anyone have any colorful stories about Bert Blyleven or Andre Dawson to help me get through the winter? Even Joe Posnanski, one of our best bloggers, has felt a need to serve up endless “How Good Was He?” columns this winter. Say it ain’t so, Joe.
Having read dozens of Hall of Fame arguments on the web in the past few weeks, by good people, some of them my friends, I find several problems with them in the main. Walking timidly into the lion’s den, let me summarize.
Recently there has been some debate on various internet sites, including this one, about who deserves to vote in Hall of Fame elections. Let me tell you what I think. If I were in charge of the process, I would require that all voters understand what the Hall of Fame actually is before gaining the privilege. I would make every voter take a history test. There are 200 members of the Hall of Fame who were chosen based on their play in the major leagues, and I would expect each of the voters to understand (at the very least) the careers and qualifications of all of those men—the highlights, great moments, opinions of contemporaries.
Does this mean that the correct 200 players are in the Hall of Fame? No, of course not. Does this mean that 200 is the right size? No. However, I suggest that whatever standards you come up should be “reasonably” consistent with the current membership list. If you want to say that the voters overvalue the players of the 1930s, or that 3B is underrepresented, or there are not enough Yankees, you must do so while not dynamiting a 70-year-old institution. You want to ignore the bottom 10% of the Hall, we can live with that.
Jay Jaffe, a fine writer and analyst over at Baseball Prospectus, invented a measure called JAWS (which uses WARP as its basis) and compares new candidates to the JAWS score of the average HOF player at his position. Actually, if I have this right, he first removes the worst inductee at each position (and four pitchers) and then uses the average of the rest. This process might suggest that Jay believes that half of the Hall of Fame is unqualified, or at least suspect. My bright friend Rob Neyer uses Win Shares, but has a similarly strict standard, recently writing, "I believe that if a player is among the best dozen or so at his position, he belongs in the Hall of Fame; or, alternatively, that if he's better than half the players at his position already in the Hall, he belongs in the Hall of Fame." When considering that there are about 18 HOFers per position now, and that there are several non-inductees that Rob supports, he is implying that about 40% of the current members are unqualified.
I mention Jay and Rob because they are two of the more talented and visible writers on this subject, and I suspect most people reading this agree with them on this issue. With all due respect, and writing as a product of the same general community of thought, I have a different view.
Look, I am down with the idea that the Hall of Fame contains several questionable players. (Not bad players—there are no players even remotely “bad” in the Hall of Fame.) But, I am sorry, if you want to impose standards that 40% or 50% of the current Hall does not reach, then, in my opinion, you should not get to vote. You are ignoring what the Hall of Fame actually is. You can’t wave away 40% of the Hall and claim to be interested in helping. And there are no “tiers” in the Hall of Fame either—every member is honored equally.
Parenthetically, if every voter was like Rob and Jay, and only voted on, for example, the best 12 players at each position, the actual HOF bar would be even higher than that. All voters are not going to agree on who these 12 guys are, and you need 75% of the vote. The effective standard becomes that 75% of the voters have to put you in the top 12. Which I suspect would leave you with something like 8 guys per position. We will reach the point where we only elect superstars and relief pitchers. Oh look, here we are.
Another problem with the analytical arguments is that they are so … strident. The current message from the stat community to the Hall of Fame and its voters goes something like this: “Your institution is riddled with poor selections, and most of the current voting writers are morons. P.S. Please find enclosed my application to join your fine group.” It’s a bit like saying, “I don’t like your wife, but if you have me over for dinner I can give her a few tips on her attitude.”
Every time some poor writer released their Hall of Fame ballot last month, unless it had the “right” guys on it, the voter was deemed not smart enough, unthinking. I don’t really want to quote examples because I am in enough trouble already, but, trust me, if you voted for Jack Morris you were mocked. (Sure, Morris had more Win Shares and the same WARP as Rich Gossage, and no GM in their right mind would prefer Gossage to Morris, even before considering Morris’s epic post-season performances. Apparently “relief pitcher” is a separate position now. Coming soon: the top 12 “seventh-place hitters”. But I digress…)
Jim Rice received 72% of the vote on Tuesday, an overwhelming consensus of support, 12% more than Franklin Roosevelt’s 1936 landslide over Alf Landon. Are these 72% all just not smart enough? Four hundred journalists, many of whom saw Rice play hundreds of time, just need to think this through properly? How did we all get so confident? I submit, sheepishly, that perhaps it is we who need to open our minds.
Me? Sure, I have argued for all the “smart” guys—Ron Santo and Bert Blyleven and Tim Raines—at cocktail parties. Even Tony Oliva, which is a big hit, believe me. But I suggest we all could use a little humility. The idea that we can confidently separate Dale Murphy and Andre Dawson statistically is nuts—who you prefer is basically a matter of taste. Defense, adjusting for eras, quality of competition, integration, position, post-season play, intangibles? If you are approached by someone who claims to have unraveled these issues statistically—I strongly urge you to run.
My final problem with all of the analytical Hall of Fame arguments: there are too many of them, and they all say the same thing. Once you have decided to use Win Shares, or WARP, or JAWS, there is really no need for a lengthy explanation. If you want to explain the internals of Win Shares and make the case for why you are using it as opposed to something else, go right ahead. But once you have defined the parameters of the debate on your terms, there is nowhere to go unless you typed some of the numbers incorrectly. The reason people come up with a different answer is that you confidently co-opted the question.
The only way one can add to the conversation is to supply some sort of color or nuance—a description of performances in big games, quotes from opponents or managers, a great World Series catch, your own personal memories. Does this matter? I suggest it matters in one sense at least: without it, you don’t really have an article that hasn’t been written before. Are you all really going to write the same Jim Rice stories again next year?
When I was about 12 years old, I received a little book for Christmas about the Hall of Fame, written by Ken Smith (who was the librarian at the Hall for many years), containing biographies of all of the current members. It was not great literature by any means, but I must have read that paperback three or four times, and it played its small part in my baseball education. Reading about Hugh Duffy and Tommy McCarthy got me curious about the great Boston Beaneater teams of the 1890s, just as Frankie Frisch and Dizzy Dean brought me to the Gas House Gang, and Eddie Collins and Frank Baker to the powerhouse Athletics teams of the early 1910s. Although the book focused on the players, it was the great teams that made the stories interesting. The teams, it seemed to me, were what baseball history was really all about.
I think we all agree that if George Kelly had played for the Phillies in the 1920s instead of the Giants, he would not be in the Hall of Fame. (He would actually be more respected than he is, since instead of being a “joke Hall of Famer” he would be an “unappreciated star”.) However, he *did* play for the Giants, and this seems wholly relevant to the conversation. John McGraw somehow won ten pennants with Christy Mathewson (who was only around for five of them) and a bunch of players like George Kelly—great defenders who could hit a little. The only NL team ever to win four straight flags, the 1921-24 Giants, had four Hall of Famers: Frankie Frisch, George Kelly, Ross Youngs, and the shortstop (Dave Bancroft, giving way to Travis Jackson), all but Frisch considered “mistakes” by today’s experts. How many Hall of Famers should be on this great team? It is consistent with the purpose of the Hall of Fame, in my view, to honor baseball’s champions.
If you begin with the premise that the 200 guys in the Hall of Fame should be the 200 statistically-best careers in history, a premise all analysts have rallied around, then George Kelly does not have a case. If you modify this premise, if you believe that being on this great Giants team gets him extra points, that the word of John McGraw carries additional weight, that first base defense was more important at that time and place than it is today, that career length is less important to you, we start inching along and suddenly his case seems less ridiculous. This is not a case I would make, but this is the case that the people who lived and watched those teams made about George Kelly. If the guy who John McGraw thought was the best player on a four-time champion—if this is the worst guy in the place, how bad can it really be?
Don’t worry, I am not asking for your support for George Kelly, although I do suggest you pause at his plaque the next time you are in that great museum in Cooperstown. He’s got a nice story. Jack Morris and Jim Rice have nice stories too, and the smart people advocating their candidacies are worth a listen.
Mark Armour writes baseball from his home in Corvallis, Oregon. He was the co-author, with Dan Levitt, of the award-winning book Paths to Glory, the editor of Rain Check: Baseball in the Pacific Northwest, and the director of SABR's Baseball Biography Project. His next large project is the life of Joe Cronin. He can be reached at markarmour@comcast.net.
| Designated Hitter | January 06, 2008 |
Friends
It's nice to have friends, especially friends one makes during the course of business. It's even nicer if those new friends are celebrities. Take Mike Wallace, for example. At 89, Mr. Wallace has made a lot of celebrity friends during the 40 years he has been a reporter for CBS's "60 Minutes." Not friends like Yassir Arafat, maybe, but friends like George Steinbrenner, the owner of the New York Yankees, of whom Mr. Wallace says, "I like Steinbrenner, he likes me, we became good friends." It was through his friendship with Steinbrenner that Mr. Wallace made friends with one of Steinbrenner's celebrity hirelings, Roger Clemens, of whom Mr. Wallace says, "He became my friend. He trusts me." Which is no doubt why, when Mr. Clemens' name appeared prominently in the Mitchell Report, he turned to Mr. Wallace to help clear his name from accusations by his former trainer, Brian McNamee, that Clemens took steroids and Human Growth Hormone in his late 30s and 40s to enhance his pitching career.
Tonight on "60 Minutes," Mr. Clemens will sit for an interview with Mr. Wallace, because, Mr. Wallace says, "He trusts me." Hopefully, Mr. Wallace can be, as he says, "objective." Tomorrow, according to Rusty Hardin, Mr. Clemens' lawyer, Clemens will submit to questions from a host of reporters, the first time he will speak off-the-cuff so to speak, to a roomful of reporters, some of whom may not be his friends. Previously, Mr. Clemens has denied Mr. McNamee's allegations that he injected Mr. Clemens with steroids and HGH through press releases emitted by his lawyer and his agent, and through a staged video in which Mr. Clemens denies McNamee's allegations directly to a camera.
I had a chance to become friends with Mr. Clemens in 2001, when I interviewed him for a profile in the New York Times Sunday magazine. But, alas, our friendship did not take. Despite the fact that I, like Mr. Wallace, felt I too had been objective in my profile, Mr. Clemens did not concur. In fact, he called me up after the story appeared and berated me over the telephone. When I asked him what he didn't like about the story, he said, "I didn't read it." I responded, "Then how do you know you don't like it?" He said he was told by his "friend," and the co-author of one of Mr. Clemens' books, Peter Gammons, the ESPN-TV analyst, that he should hate it. In fact, Mr. Clemens hated my profile so fervently that he had me banned from the Yankees' clubhouse during the years he remained with the team.
I would later learn that one of the many things Mr. Clemens hated about my profile of him was my description of his fawning relationship at the time with his friend Mr. McNamee, who lived in the pool house of Mr. Clemens' Houston estate. On the first day I interviewed Mr. Clemens in Houston I had dinner with him and Mr. McNamee at the most exclusive steak house in Houston. The bill was for over $400, which I paid. Mr. Clemens said, "I’ll get you tomorrow." The next day he bought me a taco at a Mexican Restaurant. But the point of my profile of Mr. Clemens was less about his parsimoniousness than it was his strange relationship with Mr. McNamee. During the dinner at the steakhouse Mr. Clemens asked Mr. McNamee for his permission to have a steak (McNamee nodded) and a baked potato (McNamee nodded again, but added a caveat, "Only dry."). The same scenario played itself out at the Mexican Restaurant. Clemens pointed to an item on the menu and Mr. McNamee either nodded, or shook his head, no.
During the three days I followed Mr. Clemens around Houston, he seemed like a child beholden to the whims of the sour, suspicious, and taciturn McNamee. It seemed as if Mr. Clemens would not do anything to his body, or ingest anything into it that Mr. McNamee hadn't approved. I found it strange that, at 38, Mr. Clemens still had to have someone dictate his diet and workout regimen down to the minutest detail at this late stage of his illustrious career. In fact, Mr. Clemens' devotion to Mr. McNamee's diet and workout routine seemed almost like a spiritual quest that must not be impeded. When Mr. Clemens and Mr. McNamee went on a long run one day and they came across another runner, lying on the ground, in the throes of a heart attack, they called for help. When Mr. Clemens related that story to me, he ended it by saying, "We were having a good run, too."
I also found it strange that, at 38, Clemens had the energy of a teenager. Clemens' workouts lasted 10 hours a day with only breaks for lunch and dinner. They began at 9 a.m. under McNamee's watchful eyes, with light weight-lifting for an hour, then an hour run, then a trip into Clemens' own personal gym, where he did a few hours of calisthenics, wind sprints, and throwing before going to lunch. After lunch, Clemens and McNamee went to an exclusive Houston men's gym (Clemens told me that President Bush worked out there), where Clemens pedaled a stationary bike for an hour and then performed a heavy weight-lifting routine for another hour. Then after dinner at home, Clemens worked out again until 9 or 10 in the evening.
Just watching Clemens work out over a day exhausted me. I wondered where he found the energy to sustain such a maniacal pace when I, at a similar age 20 years before, had been unable to work out for more than a few hours a day without being drained. At the time I interviewed Clemens, I was training for an amateur body building contest and, like Clemens, I adhered to a strict diet and a strenuous weight-lifting and calisthenics routine. But nothing I did at 41 compared to the 10 hours-a-day routine McNamee put Clemens through.
This brings me by a circuitous route to Tom Seaver, the Hall of Fame pitcher from the 1960s to the 1980s. Now Seaver and I were friends. Not the best of friends. Not intimate friends. Just friends. In the early 70s we lived only a few miles from each other in Connecticut. On the weekends we played one-on-one basketball games against each other at the Greenwich YMCA. They were rough, no-holds-barred games marked by a lot of uncalled fouls, bruises, and bloody noses. I always let Seaver win those games; after all, he was Tom Seaver, but he denies this.
Whenever Seaver pitched badly I'd call him every so often to give him advice.
"Tom, you're throwing too many breaking balls."
"You really think so?"
"Absolutely."
"What the hell do you know?"
Seaver and I had a lot in common. We were both big men in our playing days. Six-one, 200 pounds. We were both pitchers. Bonus babies. Tom signed with the Mets for a $50,000 bonus and I signed with the then Milwaukee Braves in 1959 for a $50,000 bonus. We both threw hard. I threw harder than Seaver, of course, but he will never admit that. He had better control than I did (at least I will admit that). And a longer career. His lasted 20 years. In the major leagues. Mine lasted three years, in the minor leagues. And then out. Back home, at 21, lugging bricks and mortar up a rickety scaffold for a Lithuanian mason.
Over the 40 years of our friendship, I still call Seaver every now and then, mostly to remind him that I threw harder than him. His response is always the same, "In your dreams." My response is always the same. "But I did, Tom, I did!" Then he will say, "Yeah, and between us we won 311 major league games." I say, "Precisely!"
Like Clemens today, Seaver in his day was considered the most dominating pitcher of modern times. He did win 311 games over a 20-year career, and would have won another 50 or so if he had pitched into his mid-40s like Clemens has. But he didn't. He lost his fastball at 38, pitched without it for several more seasons with varying results, and retired. During his career, Seaver, too, was famous for his strict diet and strenuous workout routine. In fact, he was one of the first baseball players to begin lifting weights to enhance his performance. It had been considered taboo, particularly for pitchers, likely to make them feel too muscle-bound and inflexible.
I visited Seaver once at his home in Greenwich, Conn., in the dead of a cold winter. Seaver lives in Calistoga, Calif., today. Seaver took me down into his basement where he had set up a net to catch baseballs. There, with a bucket of balls beside him, and his breath billowing in front of him, Seaver grunted and sweated for 30 minutes as he pitched baseballs into that net.
I was so impressed with his diligence that I asked him why he bothered to throw on such a cold, January day. He gave me a little sideways look as if I'd asked the stupidest question, and said, "Because it's my day to throw."
After the Mitchell Report on the use of performance-enhancing drugs was published, I checked the records of Seaver and Clemens. In his first 12 seasons with the Boston Red Sox, Clemens posted a 192-111 record. In his first 12 years with the Mets, and the Cincinnati Reds, Seaver posted a 219-117 record. Over Seaver's last eight years with the Reds, Red Sox, and Chicago White Sox, he posted a 92-78 record. Over Clemens' last 11 years with the Toronto Blue Jays, Yankees and Houston Astros and then the Yankees again, he posted a 162-73 record, a winning percentage appreciably better than in his younger years.
While Seaver struggled with that declining fastball in the latter stage of his career, Clemens kept throwing hard. Seaver's decline in those final seasons was the normal drop-off for a pitcher who had relied on an exceptional fastball for a good part of his success. Clemens' improved record in his later years was an anomaly for a fastball pitcher. (Knuckleball pitchers like Phil Niekro, and junk ball pitchers like Jamie Moyer have pitched successfully into their 40s because they rely on finesse, not strength.)
A fastball pitcher still throwing in the mid-90s after the age of 40, as Clemens did, is a true rarity, except if his name is Nolan Ryan, who was blessed by God. It goes against the laws of nature, although I suspect that a case can be made that Clemens' incredible late career success could be attributed to the strict diet and fabled workout routine of his former trainer and friend, now his adversary, Brian McNamee. Which I also suspect is the case Clemens will make to his friend, Mr. Wallace, when Mr. Wallace interviews him tonight on "60 Minutes."
Pat Jordan, author of "A False Spring," and "A Nice Tuesday," is a freelance writer. His latest book, "The Best Sports Writing of Pat Jordan" (Persea Books), which features profiles of both Roger Clemens ("Roger Clemens Refuses to Grow Up") and Tom Seaver ("The Best of Friends"), will be released next month.
| Designated Hitter | November 29, 2007 |
An Analysis of Terry Ryan's Talent Acquisition as General Manager of the Minnesota Twins
In modern baseball the general manager is ultimately responsible for the talent level in an organization, most importantly at the major league level. Given the relationship between winning teams and better players, general managers have historically been evaluated based on team success. While a pragmatic measure, it has two notable drawbacks. First, it ignores all the extenuating circumstances that go into a team's gain and loss of players: general managers operate under different financial constraints; they initially join clubs with far different levels of talent, and have different levels of autonomy to shape the scouting personnel, minor league operations, and the major league on-field staff. Second, simply using team success as a yardstick is a very coarse measure that limits our ability to understand the strengths and weaknesses of a general manager. What were his specific successes and failures that led to his club's record?
With the recent resignation of Terry Ryan as the Minnesota Twins general manager, I thought it might be interesting to take an objective look at some aspects of the position that can be measured. Using the Retrosheet transactions database maintained by Tom Ruane, I evaluated all the moves made by the Twins after Ryan's hiring in September, 1994 through the end of 2005. Obviously this type of analysis assigns the ultimate responsibility for all transactions--rightly or wrongly--to the general manager. For a number of reasons I did not include an analysis of the draft. For most types of transactions one can compare value received to value surrendered. To evaluate the productivity of the amateur draft and the farm system, however, one needs to calculate the productivity of other franchises to use as a baseline--this is a study for another time.
To evaluate the general manager this analysis reviews the value of players lost via free agency (Fg), release (R), the expansion draft (X), waivers (W) and trades (T), and players acquired via amateur free agency (Fa), free agency (F), waivers (W) and trades (T). Unfortunately this is not quite as straight forward as it might be: for example players who become free agents and are subsequently re-signed; in the database these players are shown as both lost via free agency and gained through free agency. The net effect is zero, but it increases the total volume of talent coming and going: for instance, Brad Radke's re-signing after the 2004 season. Another example is players who come and go before they become established major leaguers. As an illustration of this issue, Casey Blake was claimed on waivers, lost on waivers, reclaimed on waivers, and subsequently released before he achieved any significant major league playing time. While it makes sense to account for them this way--each transaction needs to be evaluated on its own merits--these multiple moves can make the talent velocity appear greater than it might otherwise be.
Of course one also needs some way to value the players involved in the transactions in order to assess them. Win Shares is a metric created by Bill James that works well for this purpose. Using a complex set of formulas, it allocates team wins to individual players. The method allocates three win shares for each win; for example, 300 win shares will be allocated to the players on a 100 win team. As a benchmark, a 30 win share season is typically MVP caliber, and 20 win shares is an all-star season. For each player involved in a transaction, I calculated the win shares he would earn over the balance of his career. For players still active, win shares are calculated through the 2006 season (obviously, some of these players will significantly increase their career totals).
So, what does Ryan's scorecard look like? The table below summarizes the cumulative win shares surrendered and gained in all the Twins transactions from the fall of 1994 through the end of 2005.
Win Shares from Twins Transactions, Fall 1994 - 2005
Type    Type Description            From Min   To Min
-----------------------------------------------------
Fg      Free Agency Granted              430        -
R       Released                         251        -
X       Expansion Draft                   93        -
Fa      Amateur Free Agent Signing         -      111
F       Free Agent Signing                 -      656
W       Waiver Pick                       60      154
T       Trade                            807      922
-----------------------------------------------------
        Total                           1641	   1842
Despite working under relatively tight financial constraints for most of his tenure, Ryan lost surprisingly little talent to free agency. No player with more than 50 win shares remaining left the major league roster as a free agent. Only Travis Lee, one of four amateur draftees declared free agents because they were not tendered a contract within the mandatory 15-day period, produced more than 50 win shares over the remainder of his career.
Surprisingly, Ryan's two most significant personnel blunders resulted from releasing two players with significant major league ability, and both came after the 2002 season. In October he released Casey Blake, who would go on to become a valuable contributor with the Indians. More significantly, in December Ryan compounded his error by releasing David Ortiz, who became a perennial MVP contender. Both could have played important roles on the Twins competitive teams from 2003 through 2006.
The Twins did not really lose any significant players through waivers (although technically they lost and then regained Blake over a three-week period). The loss of Damian Miller to the Diamondbacks in the expansion draft proved surprisingly costly. Miller went on to a number of seasons as a quality major league catcher.
Given his financial constraints, is not surprising that Ryan never really exploited the free agent market. Over his tenure he signed only one major league free agent, Kenny Rogers, with over 50 win shares remaining. Some of his most worthwhile signings included re-signing his own declining veterans on a short-term basis, such as Radke and Shannon Stewart, and finding useful role players at a reasonable price, such as Mike Redmond.
Minnesota has not kept up a sufficient Latin American presence. In the mid-1990s the Twins landed two players who would develop into useful major leaguers--Luis Rivas and Juan Rincon--but have signed none of consequence since. Ryan's staff did smartly pluck Bobby Kielty from the U.S. amateur ranks. The Twins have neither lost nor claimed any significant players on waivers except for Blake, as noted previously.
Ryan distinguished himself most clearly in his ability to make quality trades. His worst trade, in terms of value differential, was the swap of Todd Walker to Colorado for two players with less than two win shares remaining in their careers. In Ryan's defense, with this transaction the Twins also received cash. On the other hand, his regime can be credited with several outstanding deals. The swap of A.J. Pierzynski and cash for Francisco Liriano, Boof Bonser, and Joe Nathan has been widely hailed, but a number of others were also highly productive. He acquired Johan Santana for Jared Camp in a trade of Rule 5 draft picks. Ryan landed Eric Milton and Cristian Guzman for Chuck Knoblauch--although Knoblauch's unexpectedly quick falloff makes this trade appear more prescient than it probably was. Trading Dave Hollins for David Ortiz was also a great move, unfortunately later vitiated by the latter's release.
A general manager's job entails more than talent acquisition, and sometimes a team is in a position where the key decisions involve sorting out the talent (including possibly surrendering more talent than one receives) to alleviate an abundance at one position and a dearth at another. But the luxury of rearranging one's talent first requires building a solid talent base. Ryan consistently surrendered less talent than he received as he built the team that captured four division championships between 2002 and 2006.
Appendix
The table below summarizes all Minnesota Twin transactions of at least 10 win shares between the fall of 1994 when Terry Ryan became the GM and the end of 2005. The table should be moderately self-explanatory, but a couple of comments may be in order for trades. The "TransID" column ties the players to a particular transaction, so that all players identified with the same TransID were part of the same trade. A few transactions identified as a trade show only one player; in these instances the other players involved did not make the major leagues.
Min Twins Transactions (>10 WS), Fall 1994 - 2005
DateID TransID Type Player Team From Min To Min 19960619 22943 Fg Lee, Travis 72.8 19961004 33661 Fg Reboulet, Jeff 26.6 19981029 39348 Fg Steinbach, Terry 11.9 19981221 26718 Fg Meares, Pat 13.2 19991007 8367 Fg Cordova, Marty 23.1 19991015 12658 Fg Fiore, Tony 10.1 20011008 26077 Fg McCracken, Quinton 19.6 20011019 6461 Fg Carrasco, Hector 19.5 20011105 20603 Fg Jones, Todd 35.6 20031026 15777 Fg Guardado, Eddie 17.5 20031026 39476 Fg Stewart, Shannon 30.1 20031027 17104 Fg Hawkins, LaTroy 20.6 20031028 14799 Fg Gomez, Chris 16.2 20031029 35073 Fg Rogers, Kenny 46.9 20041028 3435 Fg Blanco, Henry 11.3 20041028 33228 Fg Radke, Brad 21.5 20041101 21947 Fg Koskie, Corey 16.5 20051028 20511 Fg Jones, Jacque 16.9 19950713 39482 R Stewart, Scott 15.3 19960401 13631 R Fultz, Aaron 18.9 19970516 30220 R Olson, Gregg 21.5 19981003 34439 R Ritchie, Todd 32.8 20001220 23436 R Lincoln, Mike 13.5 20021014 3412 R Blake, Casey 48.1 20021216 30458 R Ortiz, David 101.4 19971118 27370 X Miller, Damian ARI 92.5 19951009 34458 Fa Rivas, Luis 24.7 19961104 34373 Fa Rincon, Juan 35.6 19990216 21343 Fa Kielty, Bobby 50.3 19950613 39481 F Stewart, Scott 15.3 19951205 27848 F Molitor, Paul 40.7 19951208 28907 F Myers, Greg 24.0 19951211 302 F Aguilera, Rick 31.2 19960102 18388 F Hollins, Dave 23.8 19960129 21020 F Kelly, Roberto 24.6 19961205 39347 F Steinbach, Terry 28.6 19961212 40617 F Tewksbury, Bob 16.8 19961218 40139 F Swindell, Greg 29.0 19961220 30219 F Olson, Gregg 21.5 19970124 7751 F Colbrunn, Greg 27.8 19971216 28221 F Morgan, Mike 13.6 19971223 14199 F Gates, Brent 12.0 19980114 27003 F Merced, Orlando 18.3 19990104 39349 F Steinbach, Terry 11.9 19990127 43376 F Wells, Bob 24.3 19990603 12657 F Fiore, Tony 10.1 20000401 27793 F Mohr, Dustan 31.2 20001219 32882 F Prince, Tom 12.1 20010330 6460 F Carrasco, Hector 23.9 20010413 26076 F McCracken, Quinton 19.7 20010530 12661 F Fiore, Tony 10.1 20030109 14798 F Gomez, Chris 18.5 20030317 35072 F Rogers, Kenny 57.6 20031207 39477 F Stewart, Shannon 30.1 20031218 3434 F Blanco, Henry 16.7 20040108 13638 F Fultz, Aaron 14.9 20041123 6724 F Castro, Juan 13.1 20041124 33691 F Redmond, Mike 12.9 20041207 33229 F Radke, Brad 21.5 19941104 34714 W Robertson, Rich PIT 15.0 19980403 6456 W Carrasco, Hector ARI 31.7 20000523 3409 W Blake, Casey TOR 48.4 20010921 3410 W Blake, Casey BAL 48.2 20011012 3411 W Blake, Casey BAL 48.2 20031120 15803 W Guerrier, Matt PIT 10.7 20041014 13639 W Fultz, Aaron PHI 12.0 19950608 49355 T Courtright, John CIN 0.0 19950608 49355 T McCarty, David CIN 18.0 19950706 49364 T Rodriguez, Frank BOS 21.2 19950706 49364 T Aguilera, Rick BOS 31.2 19950707 49365 T Klingenbeck, Scott BAL 0.0 19950707 49365 T Erickson, Scott BAL 54.0 19950731 49386 T Coomer, Ron LAN 53.1 19950731 49386 T Hansell, Greg LAN 6.3 19950731 49386 T Parra, Jose LAN 5.3 19950731 49386 T Guthrie, Mark LAN 25.9 19950731 49386 T Tapani, Kevin LAN 49.4 19950919 49365 T Bartee, Kimera BAL 2.9 19951030 49386 T Latham, Chris LAN 3.8 19960826 49492 T Mahomes, Pat BOS 14.3 19960829 49496 T Hollins, Dave SEA 23.8 19960913 49496 T Ortiz, David SEA 137.7 19961211 49520 T Walbeck, Matt DET 18.9 19961217 49492 T Looney, Brian BOS 0.0 19970814 49587 T Colbrunn, Greg ATL 27.8 19970820 49591 T Kelly, Roberto SEA 15.4 19970905 49597 T Myers, Greg ATL 17.6 19971009 49591 T Mays, Joe SEA 44.7 19971212 49630 T Becker, Rich NYN 0.0 19971212 49630 T Ochoa, Alex NYN 30.3 19980206 49642 T Knoblauch, Chuck NYA 69.7 19980206 49642 T Buchanan, Brian NYA 9.8 19980206 49642 T Guzman, Cristian NYA 79.7 19980206 49642 T Milton, Eric NYA 68.4 19980206 49642 T Mota, Danny NYA 0.0 19980731 49693 T Barnes, John BOS 0.0 19980731 49693 T Kinney, Matt BOS 7.3 19980731 49693 T Merced, Orlando BOS 18.3 19980731 49693 T Swindell, Greg BOS 19.3 19980825 49709 T Morgan, Mike CHN 13.6 19981103 49709 T Downs, Scott CHN 11.6 19981214 49735 T Ochoa, Alex MIL 27.5 19990521 49771 T Lohse, Kyle CHN 41.5 19990521 49771 T Ryan, Jason CHN 1.9 19990521 49771 T Aguilera, Rick CHN 4.3 19990521 49771 T Downs, Scott CHN 11.6 19991213 49836 T Santana, Johan FLO 101.1 20000715 49891 T Sears, Todd COL 1.9 20000715 49891 T Huskey, Butch COL 0.0 20000715 49891 T Walker, Todd COL 74.5 20000909 49936 T Ford, Lew BOS 41.6 20000909 49936 T Carrasco, Hector BOS 23.9 20010328 49973 T Frias, Hanley ARI 0.0 20010328 49973 T Moeller, Chad ARI 16.4 20010728 50015 T Jones, Todd DET 35.6 20010728 50015 T Redman, Mark DET 40.6 20010730 50017 T Lawton, Matt NYN 48.9 20010730 50017 T Reed, Rick NYN 18.7 20020712 50111 T Buchanan, Brian SDN 8.8 20020712 50111 T Bartlett, Jason SDN 18.5 20021115 50142 T Kinney, Matt MIL 5.1 20021115 50142 T Valentin, Javier MIL 21.4 20030716 50199 T Kielty, Bobby TOR 27.3 20030716 50199 T Stewart, Shannon TOR 39.0 20031114 50237 T Pierzynski, A.J. SFN 38.6 20031114 50237 T Nathan, Joe SFN 47.1 20031114 50237 T Liriano, Francisco SFN 16.3 20031114 50237 T Bonser, Boof SFN 6.5 20031203 50245 T Milton, Eric PHI 13.5 20031203 50245 T Punto, Nick PHI 21.6 20031203 50245 T Silva, Carlos PHI 31.0 20031215 50254 T Mohr, Dustan SFN 14.2 20031215 50199 T Gassner, Dave TOR 0.1 20040731 50322 T Mientkiewicz, Doug BOS 13.3 20051202 50425 T Castillo, Luis FLO 17.2 20051202 50425 T Bowyer, Travis FLO 0.0
Dan Levitt's forthcoming biography of New York Yankee general manager Ed Barrow is scheduled for release in the spring of 2008 from the University of Nebraska Press. He co-authored (with Mark Armour) the award-winning book Paths to Glory: How Great Baseball Teams Got That Way. Dan has also published numerous baseball related articles and short biographies.
| Designated Hitter | November 14, 2007 |
Baseball Trading Economics 101
As we enter the off-season with few marquee free agents on the market, the talk around baseball will start to revolve around potential trades. Fans, sportswriters and even real life GM's will start thinking about what they would be willing to offer other teams to get them to part with their stars. As George Costanza once mused, "I think I got it. How 'bout this? How 'bout this? We trade Jim Leyritz and Bernie Williams, for Barry Bonds, huh? Whadda ya think? That way you have Griffey and Bonds, in the same outfield! Now you got a team!" Unfortunately, a significant number of fans, sportswriters (and even the occasional GM) don't understand the basic rules that govern (or at least, should govern) trade value in baseball. So before the Mets go trading Jose Reyes and Mike Pelfrey for Johan Santana and Jason Bartlett, it is time to learn about the concept of lease equity.
Lease equity is, in a word (OK two), the easiest way to understand the trade market and assure that your team isn't selling its future for a short-term rental (yes, I am thinking of you, Houston Astros, for trading Jason Hirsh, Taylor Buchholz and Willy Taveras for Jason Jennings). The concept is simple, every player under contract has a certain value, in dollars, which is a function of the length they are under control and the amount of money they are owed. To figure out lease equity, you simply determine the difference between the relevant term of a player's contract and what that player would receive (or you, as the GM, would be willing to pay the player) as a free agent on the open market. So, if a player has a two-year contract for $10 million, but would likely get a two year contract for $15 million, that player has a lease equity value of $5 million. Significantly, lease equity value need not be positive. An albatross of a contract has negative value and, accordingly is only moveable as part of a salary dump. Indeed, a star can have negative lease equity value, as evidenced by the unwillingness of any team to pick up Manny Ramirez's contract a couple of years ago when he was left on waivers.
Under this scenario, it is clear that the most valuable commodity is a young star player locked up for multiple years. Indeed, a superstar at $15 million can have the same lease equity value as a replacement player at league minimum. Which brings me to an important concept, lease equity is not the same as quality. Having a team with lots of valuable commodities doesn't mean you will have success. Just ask the Florida Marlins, who have some great inexpensive players and not much success to show for it. Conversely, a team full of pricey veterans, think the Yankees, can be a powerhouse without a lot of contributions from its players with the most lease equity. A market priced Bobby Abreu or A-Rod added more to the Yankees success than guys like Joba, Hughes, Cabrera or Cano. What having a player with a positive lease equity value does is twofold: a GM can use that "saved" money elsewhere to improve his team within his budget or, alternatively, he can trade that value for other players who may have more value (as a player) or are a better fit for his team.
There are some other concepts that need to be understood, before we start figuring out how lease equity affects trade scenarios. The first concept is that control (i.e., the lease) is the key to value. Even if an arbitration eligible player does not have a contract for the next year, as long as his estimated value is higher than his probable salary (likely based on the arbitration rules), that player has positive lease equity value. The trick, of course, is estimating his salary and his likely free agent value.
The second issue to note is that lease equity value is market based. Unless a free agent takes a home town discount (which is rare because when a player signs an early extension, he is not really providing a discount but trading upside for security, just ask Chris Carpenter and the Cardinals), a free agent's lease equity is zero at the time he is signed. If the market determines that Gary Matthews or Juan Pierre is worth $50 million for 5 years, that is the market for a mediocre center fielder, irrespective if it is a "good" deal. The market is "right," because it constrains what a GM can do with his money or the lease equity value of the players he controls, the two primary assets that a GM has in building a team. Other signings also provide a good jumping off point for determining the values of players who are years from the market, like a Grady Sizemore (worth a lot more annually than Pierre or Matthews) or Lastings Milledge (probably fairly comparable).
The third issue to consider affects the way that "likely salary" is estimated. At this point, it's not unreasonable to assume that, if he hits the market a year from now, Johan Santana will command a six year $150 million contract. But $25 million a year is not the right number to plug in to determine his value in a trade right now. Santana is under contract for one year now at $13.25 million. If he went on the market and sought only a one year contract, he may well receive $30 million or higher. The reason for this is simple. As a one-year bet, the team takes a much smaller risk in terms of injury and future performance than with a long-term contract. Thus, a team would pay more, per year, for a shorter contract. After that, the player is still presumably available at market rate and the team can evaluate its needs then. Also, draft pick compensation if he leaves is also of some value. In other words, for evaluating trades, the shorter the remaining contract, the higher the assumption that needs to be made with respect to the per year annual salary.
The fourth issue to keep in mind is that, for prospects and young players, it may be hard to make a good estimate of future performance and reasonable minds may, and usually will, differ. That is how some players become busts and some trades for prospects go down as the worst in history. But just because it's hard, it doesn't mean it's impossible. The ability to project prospects is a cottage industry these days. Additionally, prospects are almost never likely to have negative lease equity value because if they fail, they will never cost much, and the option value of them being major league contributors can be estimated. Recognizing diamonds in the rough (think Terry Ryan getting Francisco Liriano as a throw-in for Pierzynski), is thus incredibly valuable to a team.
The fifth issue to note is that lease equity value in a contract may differ from team to team. When a player signs a free agent contract, the team that has the most need and willingness to meet that price makes the payment, thus establishing the value at the top. Based on market conditions, competitiveness and other factors, lease equity value in a trade can differ from one team to the next. The Mets might pay $35 million for one year of Santana, the Dodgers $30 million and the Royals $15 million. Those numbers factor into any offer that is made. Because lease value is subjective, each GM can determine it for his team separately.
The sixth issue to keep in mind is that lease equity value is a blunt instrument. Because we never know what a player will get on the open market (think of the collective reaction to Gil Meche's contract), the best we can do is estimate within a couple of million dollars. This may sound real rough, but when you factor in real numbers, you can see that it does not prevent appropriate consideration of trades. Also, because it is an art more than a science, there is no need to discount back the dollars in a salary or for determining equity value.
So What Is Santana Worth
Now comes the fun part, let's talk trade and value.
If the Twins decide they can't re-sign Santana this Winter, he will probably be the best player traded this Winter. As noted, he is set to make $13.25 million, at which point he will be a free agent and then may be acquired for "only" money at the market rate. For argument's sake, I am willing to say that if Santana was looking for only a one-year deal this offseason, he may fetch over $30 million. So let's assign a lease equity value to him, optimistically, at $20 million. Now, here in New York, no doubt based on his subpar September there are already beat writers and some fans talking about including Jose Reyes in a trade for Santana. Reyes is signed, including options, for the next four years (including an $11 million option in 2011) for $29.5 million. If Reyes were to be a free agent, for the four years covering his age 25-28 years, I think he likely would get $19-20 million per year, if not more, leaving him a lease equity value at around $45-50 million, far more valuable than a single year of Santana. (Note that I assume fairly high values for young players. This is because, unlike most free agents, if they were to sign today, a GM would be able to buy the peak years, whereas for most free agents, they are already at or past their peak.) It is also hard to see how the Yankees could give up the likes of Phil Hughes and Joba Chamberlain, or the Dodgers to part with Kershaw, Billingsley and Loney for one year of Santana. Of course, trades are made in a market, and if the Dodgers are offering multiple players with high lease values like Kershaw, Billingsley and Loney, then the Yankees better offer a more valuable group if they expect to complete the trade.
But Santana is not the most valuable pitcher likely to be the subject of off-season rumors. Dan Haren is under control for the next three years (including options) for $16.25 million. Considering Barry Zito's contract, three years of Haren is probably a safe bet to cost $60 million. That $45 million or so in value is, at minimum, a sign to any thinking GM that, before pulling the trigger on the winning bid for the Santana sweepstakes, he should see if Billy Beane will take that package for Haren. The other A's pitchers likely to be the subject of rumor, Harden (under control for 2 years at $11.5 million) or Joe Blanton (three years of ML service, so three years of control subject to arbitration eligibility) will be much better deals for the budget-minded trader. Indeed, Harden, with his injury history, probably wouldn't get much more than two years at $15 million total (although he could outperform that significantly), indicating that he is not nearly as valuable to most teams. If Beane gets offered Milledge or Clayton Kershaw for him, he should probably jump at it.
Concluding Thoughts
Long gone are the days when, because of the reserve clause, a GM would make a trade based on the pure baseball talent of the players at issue. Today, dollars are the primary mover of trades, whether it is in a salary dump or a trade of a bargain player that will soon become unaffordable as a free agent. Whether consciously or unconsciously, lease equity value appears to inform the thoughts of most GMs making trades. Even rich teams, like the Mets and Yankees, have recently refrained from doing whatever possible to bring in top talent, instead recognizing that young, under-control players are the coin of the realm in today's baseball market. Remarkably, most journalists and fans don't think this way, as is clear when they talk about what it will take to get Santana. But GMs know they have budgets and that they can't just give away young cheap talent in exchange for market rate stars and expect to succeed in the long run. As long as a GM is mindful of the value he controls and the market for players, he will be able to get the most out of his resources. And, next time you hear that it the Twins are "demanding" Grady Sizemore for Santana, calmly know that Mark Shapiro and the Indians, if they have any sense, are not going to bite.
Doug Baumstein is a New York City lawyer and Mets fan.
| Designated Hitter | November 09, 2007 |
Runner’s Reluctance - Part Two
In Part One of this two-part series we explored the reluctance of runners and coaches to take risks on the basepaths, discovering that 97% of those attempting to advance on centerfielders were successful in 2006 while the break-even point is significantly lower than the actual success rate for every conceivable situation. I concluded in that article that runners and coaches were incredibly risk averse. In this article I will attempt to quantify the lost opportunity associated with this conservative strategy.
The numbers from 2006 tell us that less than half (47%) of baserunners attempted to advance on balls hit to centerfield while 97% were successful. From that existing state, let’s imagine that 3rd base coaches start sending runners more frequently in an attempt to take more chances and score more runs. One can easily surmise that the success rate would steadily go down as more runners take the chance. In Economics, this is referred to as the Law of Diminishing Returns. Let’s assume that for each additional 1% of attempts (which rounds to 75 runners), the success rate drops by 1%. So the first 75 guys succeed at a 96% rate, the next 75 at 95% and so forth. The chart below graphically frames the problem under discussion. It shows what this notional curve would look like (in green) compared to a break-even level of 71% (red). Also included in the graph is a purple line showing what would happen if every additional runner were thrown out and another line in blue showing what would happen if the rest of the attempts were at the break-even rate of 71%.
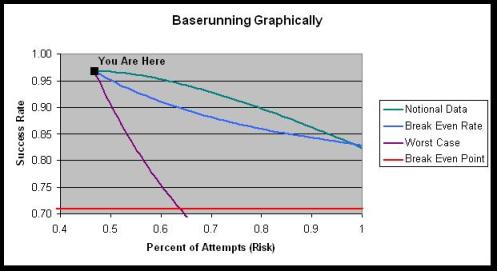
Notice how 17% more baserunners would have to take the risk and all of them get gunned out before the overall success rate equals the break-even point of 71% (where the purple and red lines intersect). Obviously it wouldn’t be advisable to send 17% more guys knowing they would all get thrown out. In fact, it wouldn’t be advisable to send any runners who had a 0% chance of success. Instead, a coach should theoretically send anyone whose chance of success is better than the break-even rate of 71%. So any curve above the blue line would result in a positive number of runs scored.
To estimate the number of additional runs that could be scored if runners and coaches were more aggressive, we examine the notional data more closely. Going back to the Expected Run table introduced last time, the weighted average of outcomes where a runner is successful in trying for the extra base comes out to .29 additional runs for the remainder of an inning (the reward), while failures cost .71 runs on average (the risk). Coincidentally, .71 and .29 add to 1.00 and the break-even rate happens to be the same as the risk, i.e. .71. Using these values for risk and reward, the table below calculates the net runs scored by each set of 75 attempted baserunners.
Notional Data – If Runners Were More Aggressive
Runners     Success    Number       Successes    Failures      Net Runs
            Rate       Thrown Out   (*.29)       (*-.71)
---------------------------------------------------------------------------
75          0.96        3           20.9         -2.1          18.8
75          0.95        4           20.6         -2.8          17.8
75          0.94        5           20.3         -3.6          16.7
75          0.93        5           20.3         -3.6          16.7
75          0.92        6           20.0         -4.3          15.7
75          0.91        7           19.7         -5.0          14.7
75          0.90        8           19.4         -5.7          13.7
75          0.89        8           19.4         -5.7          13.7
75          0.88        9           19.1         -6.4          12.7
75          0.87       10           18.9         -7.1          11.8
75          0.86       11           18.6         -7.8          10.8
75          0.85       11           18.6         -7.8          10.8
75          0.84       12           18.3         -8.5           9.8
75          0.83       13           18.0         -9.2           8.8
75          0.82       14           17.7         -9.9           7.8
75          0.81       14           17.7         -9.9           7.8
75          0.80       15           17.4        -10.7           6.7
75          0.79       16           17.1        -11.4           5.7
75          0.78       17           16.8        -12.1           4.7
75          0.77       17           16.8        -12.1           4.7
75          0.76       18           16.5        -12.8           3.7
75          0.75       19           16.2        -13.5           2.7
75          0.74       20           16.0        -14.2           1.8
75          0.73       20           16.0        -14.2           1.8
75          0.72       21           15.7        -14.9           0.8
Totals
1875        0.84       303         456.0       -215.3         240.7
Notice the Law of Diminishing Returns in action in the far right column, with fewer and fewer net runs scored as the success rate goes down. The table also reinforces my earlier statement that the optimal strategy is for a 3rd base coach to send anyone with a chance of success greater than .71. After that, the net runs scored is a negative value and the tactic becomes counter-productive.
The value in the lower right of 240.7 represents an estimate of the additional runs all 30 major league teams would’ve scored in 2006 (using the notional set of data) if they all used an optimal baserunning strategy for balls hit to centerfield with runners on base. This comes out to 8 runs per team, which is not a lot. However, including balls hit to left and rightfield, the estimate grows to 26 runs per team (14% more balls are hit to left and right than to center). If one makes the assumption that runners are equally reluctant to try for an extra base with no baserunners in front of them (i.e. stretching singles into doubles, etc.), the estimate grows to 50 runs per team since approximately 47% of baserunning opportunities occur with nobody on base.
I concede that it’s quite a stretch to assume runners are reluctant to stretch hits at the same rate as they are in advancing on hits. Unfortunately, Retrosheet data doesn’t lend itself to the kind of analysis required to test that assumption. Regardless, one can safely say that “runner’s reluctance” could easily cost the average team 30-40 runs a year. This is significant. Using Bill James’ Pythagorean Theorem for run differential, it equates to 3-4 extra wins per season. Any team would love to have 3 or 4 extra wins. All it apparently takes is more aggressive baserunning.
At this point, it’s important to dispel a myth. The optimal strategy is not one where the actual results are equal to the break-even rate. Nothing could be farther from the truth. Viewing the table of notional data above, the optimal strategy has a success rate of .84, not the break-even value of .71. Including the initial 2006 data (97% success rate on 3500 attempts), the total success rate for an optimal strategy is somewhere around 92%. So the optimal strategy occurs neither where the red and purple lines intersect in the graphical chart above, nor where the blue and green lines intersect. Rather, the optimal strategy occurs where the slope of the blue line becomes parallel with the slope of the green line, which occurs about when the blue line crosses the 92% success rate for our notional data.
One could argue that this estimated optimal success rate of 92% is not so far removed from the actual success rate of 97%, and maybe runners and coaches aren’t wasting so many opportunities after all. I considered this possibility and rejected it because of the likelihood of miscalculations by the coach/runner along with calculated decisions to be more risk averse or accept more risk depending on the game situation. Allow me to illustrate with an example.
Suppose a 3rd base coach is faced with a series of baserunning decisions where the runners have a chance of success listed in the table below. The optimal strategy would look like this if the break-even rate is 71%.
The Optimal Strategy
Player     Chance of Success   Decision
Player A   100%                Send
Player B   90%                 Send
Player C   80%                 Send
Player D   70%                 Hold
Player E   60%                 Hold
Player F   50%                 Hold
Player G   40%                 Hold
Player H   30%                 Hold
Player I   20%                 Hold
Player J   10%                 Hold
Player K   0%                  Hold
The expected success rate for the data above with optimal decisions would be 90% (the average of 80%, 90% and 100%). However, sometimes the coach sends a runner when he shouldn’t, or holds a runner that he should send just because humans make mistakes. Similarly, late in a game when trailing by multiple runs, teams will play station-to-station baseball and take no risks at all. Likewise, trailing by one run, a team might take additional risks to try and score that tying run. Considering these factors, the actual results may look like this.
Possible Results with Mistakes and Risk Adjustments
Player     Chance of Success   Decision
Player A   100%                Send
Player B   90%                 Hold – Risk
Player C   80%                 Hold – Mistake
Player D   70%                 Hold
Player E   60%                 Send – Mistake
Player F   50%                 Send – Risk
Player G   40%                 Hold
Player H   30%                 Hold
Player I   20%                 Hold
Player J   10%                 Hold
Player K   0%                  Hold
Notice how the expected success rate under these conditions becomes 70% (the average of 50%, 60% and 100%). So even though the optimal strategy has a 90% success rate, the actual success rate could be considerably lower because of miscalculations and risk adjustments. That’s why I still believe the actual MLB success rate of 97% is an indication of extreme “runner’s reluctance” given that the break-even rate is 71%.
So far, this notional analysis has looked at all centerfield running situations from 2006 in aggregate. In reality there is a theoretical curve similar to the one above for every situation – every baserunner, every batting order, every ballpark, every pitcher, every defense, every inning, every out, every score, every…well you get the picture. There are literally millions of ways to slice a finite set of data.
Astute readers will recognize that the notional data used in this analysis is merely, well notional. The truth is that nobody knows what the actual curve looks like. For all we know, the curve has a steep drop-off similar to the worst case curve. The notional data was based on the assumption that each additional 1% of baserunners experienced a 1% lower success rate. If the rate was doubled and each 1% of baserunners resulted in a 2% lower success rate, the estimate of lost opportunity would essentially be cut in half. If, however, the success rate dropped at a slower rate, say half as quickly as the notional data, the run estimate would be twice as large. Although the shape of the curve and the magnitude of the lost opportunity may be mere estimates, we can be reasonably sure that there are some additional runs to be squeezed out of baserunning considering the large difference between a 97% actual success rate and the 71% break-even rate.
Now it’s up to MLB teams to use this information to their benefit. I would like to see them start sending more runners in an intelligent way. Third base coaches should have the break-even rates in their back pocket and refer to them in between pitches in anticipation of possible baserunning decisions. Teams should spend some off-season time doing video analysis of their ballplayers to determine success probabilities for each player in various situations. Likewise, teams should thoroughly scout opposing outfielders’ arm strength and accuracy to estimate probability adjustments depending on who fields the ball and where it’s fielded.
For decades, baseball has analyzed and timed the stolen base attempt to the nth degree - from the pitcher’s time to the plate, the catcher’s time to release, to the length of lead by the runner and number of steps and time to 2nd base. I’m not aware of any similar effort for other baserunning situations. With MLB victories worth million of dollars, now is the time to start putting emphasis on this long-neglected area, and correct the problem known as “runner’s reluctance.”
Ross Roley is a lifelong baseball fan, a baseball analysis hobbyist, and former Professor of Mathematics at the U.S. Air Force Academy.
| Designated Hitter | November 08, 2007 |
Runner’s Reluctance - Part One
Sometimes I think most baseball strategy has been figured out thanks to sabermetricians like you and me. Then I discover that a major facet of the game is being mismanaged at a shocking rate.
Let me explain. I recently undertook a study to analyze the importance of outfield arms, starting with centerfielders. I used Andruw Jones as a case study to determine how many baserunners he’s able to prevent from advancing compared to the average centerfielder. What I learned was that Jones, generally regarded as having one of the best outfield arms in baseball, only prevented 9 runners from advancing in 247 chances last year compared to the average centerfielder. Why so low? Is it because Jones doesn’t have such a feared arm after all? Certainly not. Instead it appears baserunners are incredibly reluctant to advance on anybody; basically only taking the risk when it’s a sure thing. Here’s how I came to that conclusion.
Using Retrosheet data from 2006, the success rate of runners attempting to advance on a ball hit to centerfield with less than two outs is seen in the following table.
Less Than 2 Outs        Chances   Attempted    Out       Success
                                  Advance      Trying    Rate
----------------------------------------------------------------
1st to 3rd on single    1079      305          6         .98
2nd to home on single   1039      700          22        .97
1st to home on double   469       243          13        .95
1st to 2nd on flyball   1385      23           2         .91
2nd to 3rd on flyball   1008      360          11        .97
3rd to home on flyball  689       599          15        .97
Total                   5669      2230         69        .97
Notice how 61% of baserunners don’t even try for the extra base with less than 2 outs. Of those who challenge the outfielder, only 3% get thrown out, and only 1% of all baserunners facing the decision of whether or not to advance get gunned down. That’s what I meant when I said they take the risk only when it’s a sure thing.
Here’s the same chart with 2 outs.
Less Than 2 Outs        Chances   Attempted    Out       Success
                                  Advance      Trying    Rate
----------------------------------------------------------------
1st to 3rd on single    699       262          3        .99
2nd to home on single   813       784          33       .96
1st to home on double   304       225          8        .96
Total                   1816      1271         44       .97
So with two outs and the runners moving on contact, and in a situation where one would expect to see additional risks taken because of the greater possibility of stranding runners, the success rate is the same at 97%.
There are three possible explanations for the high overall success rate. One is the possibility that runners and coaches are extremely reluctant to try and advance for fear of getting thrown out and the shame that comes with it. Certainly, being thrown out can be a rally killer, but a 1% failure rate is almost like taking no risk at all.
Another explanation is the extreme difficulty in throwing a runner out from centerfield. Consider all the unlikely things that must happen for a runner to be thrown out. First the defender must field the ball cleanly, then hit the cutoff man with a strong throw, or throw a strike from the outfield to the base in question. If cutoff, the infielder then needs to turn and throw a strike, usually from the outfield grass, without first looking. If all these things go right, there’s still a chance the ball might hit the baserunner. If not, the fielder needs to catch it cleanly, often on a hop, position himself properly and apply the tag. A play at the plate brings additional challenges. A ball thrown from centerfield frequently hits the pitcher’s mound knocking it offline or slowing it down, while the catcher must try and block the plate and brace himself for a collision while still making the catch and applying the tag.
The final possibility is that centerfielders as a whole don’t possess exceptionally strong throwing arms. Rightfielders tend to have the strongest arms because of the need to make the long throw to third base. Also, the prototypical centerfielder is slender and swift, hardly the type of ballplayer known for a cannon arm (yes, I’m referring to you Juan Pierre and Coco Crisp). Ichiro is the exception that makes the rule although he was a rightfielder for his entire MLB career until late in 2006.
Of the three possible explanations for a 97% success rate, the second and third go hand in hand connoting a degree of difficulty that is undeniable. But, given the difficulty of the task, wouldn’t baserunners be more inclined to take the risk? Which brings us back to explanation #1 – there must be a decided reluctance among runners and coaches to try for the extra base.
How reluctant are they and what is the right amount to run? For that we turn to a methodology frequently used to analyze the value of the stolen base. It’s based on the Run Expectancy table here, i.e. the number of runs one can expect for the remainder of an inning given the number of runners on base and the number of outs. From the table, one can calculate the break-even point for various strategies. For instance, if staying put on a base is expected to yield 1.2 runs for the remainder of an inning, and going for the extra base increases the yield to 1.4 runs, but the result of getting thrown out would decrease the expectancy to 1.0 runs, then the risk is equal to the reward and the break-even point is a 50% success rate.
Using that methodology, the generally accepted break-even point for stealing second base is between 67% and 75% as described in this Baseball Analysts article earlier in the season. This type of analysis is common for stolen bases and bunts, but to my knowledge has never been published for runners trying to advance on batted balls - until now.
The graph below shows all the possible scenarios and break-even points for 0 outs and 1 out compared to the actual success rate for each situation.
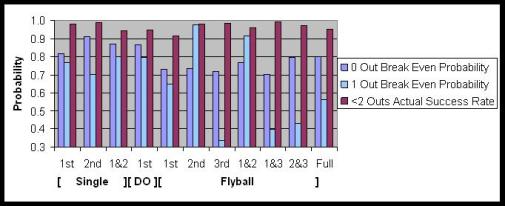
Notice how the break-even points are usually lower with one out than with no outs. This implies that runners should take more risks later in the inning, which makes sense because the more outs there are, the greater chance of a runner getting stranded on the bases. The exception appears to be when a runner is trying for 3rd on a flyball. In that situation, he should be more cautious with one out than with no outs.
Also, the break-even point can be wildly different depending on the number of outs. For instance, with a runner on 3rd and nobody out, the break-even point on a flyball to centerfield is .72 (the flyball being the first out), whereas with one out (two outs after the flyball is caught) the break-even point is a miniscule .34. The break-even analysis indicates that coaches should send guys from 3rd almost every time on a flyball to center with one out. Even if they’re thrown out 65% of the time, the net result will be positive. Basically the risk of sending a dead duck to the plate is worth it compared to relying on the next batter to knock the run in. And yet, the actual success rate in that situation is an incredible 98%! The chart visually depicts that in every situation the actual success rate far exceeds what one would expect using break-even analysis.
Clearly the run environment has a lot to do with break-even points. This includes the ballpark, the stinginess of the pitcher and defense, the score of the game, and the ability of the upcoming batters to drive runs in. Runners should be more cautious with big boppers hitting behind them, while they should be more aggressive toward the bottom of the batting order. Dan Levitt has a good discussion of run environments in his analysis of bunting here. For the sake of simplicity, this analysis ignores the run environment and looks at the situation as a whole, based on a season’s worth of data.
It’s somewhat ironic how the prototypical batting order has the speedy guys up front who would naturally be more aggressive baserunners, followed by the run producers who create a run environment where the speedy guys should be less risky on the bases. I guess I subscribe to the theory that those with the highest OBP should bat in the #1 and #2 spots regardless of how fast they are. But, that’s another topic for another day. Now back to the issue at hand.
With two outs, the chart is simpler because of the absence of runners advancing on flyballs, and looks like this:
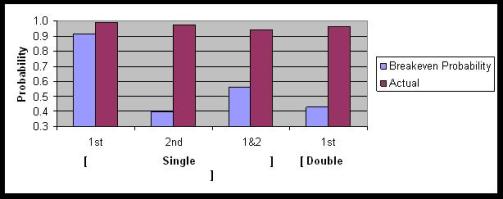
When trying to score with 2 outs, the break-even probability is between .40 and .55 depending on the situation, while the actual success rate is well north of .90! Once again, the chart indicates that the actual success rate is significantly higher than the break-even value for every situation. This data reinforces my previous verdict that runners/coaches are phenomenally risk averse when it comes to taking the extra base.
For as long as I can remember, baseball announcers were always warning fans that it’s a mortal sin for ballplayers to make the first or third out at 3rd base. The data above tests that claim and supports half of the general tenet. With two outs, the highest break-even mark is at 92% when a runner tries for 3rd on a single. Similarly, the first graph showed us that runners trying to advance to 3rd on a flyball caught for the second out have break-even rates of 97% with a runner on 2nd and 92% with runners on 1st and 2nd. So it’s clear that making the final out at 3rd with two outs is not recommended. However, with nobody out, the story is different. Runners trying to advance to 3rd have a break even rate of 81%, but runners trying to score have break-even rates of 91% or 87% depending on the situation. So it appears that the greater sin is getting thrown out at home with nobody out, not at 3rd.
Although my analysis was conducted using only balls hit to centerfield, the results appear to be similar for hits to left and rightfield. According to Dan Fox in his 3-part series on baserunning here, the total success rate from 2000-2004 is .94 for balls hit to leftfield and .96 for balls hit to right not counting runners advancing on flyball outs. It should also be noted that the break-even numbers are conservative estimates. The actual break-even value is lower than indicated because the analysis ignores the possibility of trailing runners advancing on a throw, or of a throwing error allowing a runner to take an extra base. Finally, the analysis doesn’t look at singles stretched into doubles, doubles into triples, or triples into inside-the-park homers because the Retrosheet information doesn’t lend itself to that level of detail. Assuming similar reluctance and success rates, one can extrapolate the information to conclude that the total impact of runner’s reluctance is significantly higher than any estimate based only on baserunners trying to advance.
In conclusion, this is what we know so far:
1. Runners and coaches are extremely reluctant to go for the extra base on centerfielders
2. This “runner’s reluctance” applies not only to balls hit to centerfield as studied here, but to left and rightfield as well
3. Break-even analysis indicates that actual success rates are universally higher than break-even rates
4. In general, runners should take more risks as the number of outs increase
5. Runners should be the most cautious when trying for 3rd with two outs, or when trying for home with zero outs (not 3rd as the old adage states)
6. With two outs, runners should try for home even if the failure rate is greater than 50%.
What we don’t know is the impact of runner’s reluctance relative to runs scored and wins. For that you’ll have come back tomorrow for Part Two of the analysis.
Ross Roley is a lifelong baseball fan, a baseball analysis hobbyist, and former Professor of Mathematics at the U.S. Air Force Academy.
| Designated Hitter | October 25, 2007 |
My No-Longer Lovable Red Sox
As the Boston Red Sox get ready to play another World Series, for the first time in several decades their players will do so without the added burden of overcoming someone else’s history. While the 2004 Red Sox likely had the support of most fans around the country, this support has largely evaporated in the intervening three years. In fact, a growing number of people now find the team and its fans tiresome and insufferable. How could this have happened? Do we really deserve this scorn?
I first started following the Red Sox in earnest in 1968, known in New England as “The Year After,” very much in the glow of The Impossible Dream. I was seven years old and a fourth generation rooter of the Old Towne Team. I recall listening to the radio with my great-grandfather in the early 1970s, talking about the long-ago days when the team won pennants regularly. I did not choose to become a Red Sox fan, any more than I chose my brown hair, blue eyes, or allergies. Sure, maybe I took to the game more than the rest of the family did, preferring the Game of the Week over a trip to the beach, but it wasn’t like I picked which team I was going to root for. I am sure if I had grown up in a family of Yankee fans I would today be self-absorbed and have an enlarged sense of entitlement. (I kid, I kid.)
Although I did not choose my team, and though my team always lost at the end, the Red Sox were something I wore with pride. I grew up in southeastern Connecticut, where Red Sox fans held a majority position among many dissenters. The Red Sox did not win, but they were good enough so that every year you could construct a plausible case for how they could win. (I know, because I would write up the case, longhand, with tables and charts, in a spiral notebook. “Luis Alvarado will take over at 3B and capture the rookie of the year award, Sonny Siebert will win 18 games, Jerry Moses will club 18 home runs …”). The Red Sox did not finish below .500 until I was out of college. They generally ended up finishing 2nd or 3rd, just good enough so that winning next year seemed possible. I considered myself lucky. I got to root for Tony Conigliaro and Reggie Smith and Luis Tiant, and they won more games than they lost every year. How great was that? I listened to most of their games on the radio, and (by the age of 10) kept score.
This seemed perfectly normal, though perhaps a bit excessive. I was a Red Sox fan, and we were the smartest and best fans in baseball. I knew this because the announcers on the Game of the Week said it, and the national magazine writers wrote it. We never left the game early, knew all the strategy and rules, and cheered good plays by opposing players. Roger Angell, who wrote baseball essays for the New Yorker, regularly mused about Boston’s beautiful ballpark and faithful fans. Even though I only went to a game or two a year, it seemed they were speaking or writing about me. When I became an adult and moved near Boston, I began going to more games and keeping score at the ballpark, proudly sitting amongst my fellow smart and faithful fans. It seemed we were better looking than other fans, too.
The near-misses and disappointments began to pile up, surely. The year-end setbacks of 1972, 1977 and 1978 each hurt in its own way, and the 1974 collapse was a particularly tough blow. But the fun always, always, outweighed the grief. The 1975 World Series is remembered just as much for the great performance of the Red Sox as it is for the champion Reds, the seven-game defeat celebrated more than mourned. After the Series, I wrote a thesis on baseball for my sophomore English class, which was well received by my baseball-loving teacher. When I went away to college in upstate New York in 1978, I was among a lot of Yankees and Mets fans, but I never thought, “Gosh, you guys are lucky that you got to experience a World Championship.” I watched the Bucky Dent Game a few weeks later, in a dormitory lounge surrounded by Yankee hats. I am sure I was hassled about this, but it was (mostly) good-natured. Your team was your team, and I could still talk baseball until 3:00 in the morning with Yankees and Mets fans.
After the brutal loss in the 1986 World Series, the worm began to turn on Red Sox loyalists. For the first time, stories began to appear that we were not only loyal and smart, but also “long suffering” and “wallowing in misery.” (Who, me?) In 1990, Boston Globe columnist Dan Shaughnessy wrote the book The Curse of the Bambino, which described the history of the Red Sox as a torturous trail of tears, and their fans as cynical brooding people whose identities relied on the pain caused by their team. In Shaughnessy’s world, Red Sox Nation (a term he coined) would crumble to dust if the Red Sox ever won the World Series. And he blamed all of it, especially the 71-year championship drought, on a “curse” placed when the Red Sox sold Babe Ruth to the Yankees. Although most of the premises of the book were nonsense, it sold very well, has been the basis for an HBO documentary, and is still in print 17 years later.
Had the term “Red Sox Nation” been in vogue in 1975, it would have been used to describe a loyal, friendly, intelligent group of fans. There was no wallowing that I was aware of. I recently re-watched the 1975 World Series, and the announcers never mentioned any suffering. The Red Sox were a proud and storied franchise who had not won in 57 years—many teams (the Cubs, the White Sox, and the Phillies) had gone longer, and the great Reds in the opposite dugout had waited 35 years themselves. I believe that the fans Shaughnessy described in his book (“Oh, woe is me”) did not exist in appreciable numbers until he created them. With The Curse, it began to dawn on a segment of Red Sox fans that, by golly, we have suffered. Blaming it all on a curse, or on the sale of Ruth, seemed therapeutic, and more satisfying than passing it all off as a bunch of bad juju.
I moved away from the city in 1993, going clear to the other side of the country. When I told my mother I was moving West, she was mainly amazed that I could leave the Red Sox. In some ways, I have not left them at all, though I have been to Fenway Park less than 10 times since moving. Within a few years I began hearing from friends back in Boston that Red Sox fans had become intolerable. Naturally, I came to their (our?) defense. “You are imagining this,” I told them. “Dan Shaughnessy does not speak for us, stop reading his column.” The good-natured rivalry between the Red Sox and Yankees, I was told, had become truly hateful. “Yankees Suck” (or “Jeter Swallows”) T-shirts were being worn by children. Keep score? Nah, they were too busy screaming obscenities about the opposing players.
In 2000, Glenn Stout and Richard Johnson wrote Red Sox Century, an impressive history of the team’s first 100 years. Stout and Johnson rightly ridicule the “curse”, bringing the Red Sox fan back to his or her rightful place of dignity. Instead, they roast the team for 82 years of incompetence and bigotry, in essence claiming the team has not deserved its loyal fans. The problem with the team had not been the sale of Ruth at all. In fact, using tortured and fanciful reasoning, the Ruth sale was proper and defensible, and the ensuing deals which created the first Yankees dynasty were smart trades that just happened to not work out. The holes in their theory are too plentiful for an article of this size, but the book has many things to recommend it, and gives many unknown stories and players their due.
Although a more impressive piece of research than Curse of the Bambino, its tone was unsatisfying in a different way. Tom Yawkey was not the loveable old coot from my youth—he was a racist. For that matter, so were Eddie Collins, Joe Cronin and Mike Higgins. The Red Sox should have had Jackie Robinson and Willie Mays, but instead we got Don Buddin and Tommy Umphlett. The authors concluded that the team did not win because they were not good enough to win, and they did not deserve to win.
This is not right either. The Red Sox had lost four World Series in Game 7. Obviously they were good enough to win any of those games, as they had beaten their opponent three times in the Series already. And although it is true that the team was the last to integrate, this sad fact still makes them only marginally more onerous than the team who was second-to-last, or seventh-to-last. When it comes to race, there was a lot of shame to go around in the America of the 1950s, and I am not willing to lay it all on Tom Yawkey.
What was most unsatisfying is that neither book captures all of the fun I have had following the Red Sox. Shaughnessy presented me as living a life of agony, and Stout as wasting my time on a bunch of bigots and losers. In fact, I have enjoyed nearly every minute of it. There are plenty of things about the world that get me aggravated. Following baseball, rooting for the Red Sox, is basically a hell of a lot of fun. My memories of sitting in the stands with my grandfather, or listening to the radio at our cabin in Maine, are not marred by what might have happened in 1949. There was no wallowing.
So in 2004, you may have heard, the Red Sox finally won the World Series. For those who wondered what would happen when this blessed event finally occurred, the answer was: Unconstrained Joy. The biggest celebration in the history of the city. And not just in Boston. The team’s triumph was a great national baseball story.
And now? If the team was ever the “lovable loser,” those days are long gone. The Red Sox have the second highest payroll in the game, which makes its fans’ continued complaints about the Yankees higher payroll seem a bit tacky to the followers of the other 28 teams. Many Red Sox fans who were quick to defend their team’s “choker” label now happily pin the label on the Yankees instead, while reveling in their own team’s show of grit and character. The breaks of 1978 (Lou Piniella’s miracle stab in the playoff game) were just bad luck, while those of 2004 (Tony Clark’s double bouncing into the stands) were forgotten in the rush to make fun of the Yankees.
But that’s not right either. Reading those last sentences over, I see that I am also guilty of painting the picture with too fine of a brush. If there is a Red Sox Nation, it is very fractious and complicated. There is no unanimity of opinion or attitude about the team or anything else. At the end of the day, I should only speak for myself.
“It is foolish and childish, on the face of it, to affiliate ourselves with anything so insignificant and patently contrived … as a professional sports team,” Roger Angell once wrote. That was 32 years ago, and since then I have taken on a career, a home and a family, and put away (most) childish things. Not all of them. It was the “business of caring,” Angell concluded, that justifies the affiliation. It does not so much matter what one cared about, he wrote, as long as one could retain this feeling in their soul. “Naiveté—the infantile and ignoble joy that sends a grown man or woman to dancing and shouting with joy in the middle of the night over the haphazardous flight of a distant ball—seems a small price to pay for such a gift.”
As a fan of the Boston Red Sox, I submit that the team is no more, and no less, worthy of my caring than they were five years ago, or thirty years ago. The winning has changed the labels applied to me, but the new labels are no more accurate than the old labels. Winning is fun, don’t get me wrong. But I had fun in 1969, when we finished a gentleman’s third. Maybe it was even more fun—I was eight years old, after all. But in thinking it over, I admit that I miss the days when Red Sox fans were admired and thought to be the smartest guy in the room. Maybe we weren’t, but I liked hearing it.
But really, I just want to be treated like any other fan. I know faithful Indians followers, smart Pirates nuts, proud Phillies loyalists, and, yes, kind Yankees fans. My wish is that they all experience the occasional championship banner, but also that they enjoy the journey every year. But none of them, and certainly not I, can represent a Nation, or be made to pay for the sins of their team.
Mark Armour writes baseball from his home in Corvallis, Oregon. He was the co-author, with Dan Levitt, of the award-winning book Paths to Glory, the editor of Rain Check: Baseball in the Pacific Northwest, and the director of SABR's Baseball Biography Project. His next large project is the life of Joe Cronin.
| Designated Hitter | September 13, 2007 |
Stealthy and Wise
Across Major League Baseball thus far in the 2007 season (through September 11), 74.5% of all stolen base attempts have been successful. This success rate is significantly higher than it has ever been since outs caught stealing began to be regularly recorded as a category of event. The league-wide stolen base success rate has been inching up in recent years but this season that success rate has taken a significantly new additional leap forward.
Adding up all stolen bases and stolen base attempts from 1957 through 2006, one finds that over that fifty-year period 66.6% of all stolen base attempts were successful. Before 2004, only in 1987 (70.1%) and 1995-96 (70.0% and 70.7%) did the overall MLB rate poke up briefly and slightly over the 70% threshold and in each case settled right back down within a year or two to the range of about 68% or so.
Over the past few seasons, however, the SB success rate has been rising a little bit each year, from 68.2% in 2002 to 69.4% in 2003, 70.2% in 2004, 70.6% in 2005 and then last season, 2006, the rate inched up again to its highest level of the past 50 years, 71.4%. And now, in 2007, instead of seeing any regression to a mean or any continued small increments of increase, we seem to be seeing a major acceleration of the recent increase in the SB success rate, from 71.4% in 2006 to 74.5% to date in 2007.
It is possible, perhaps, that in the last few weeks of the 2007 season a huge drop in SB success rates across MLB will bring the complete full-season number back within the expected historical range. But I can't think of a reason why stolen base success rates should drop significantly in late season games. Most likely the final 2007 numbers will look pretty much like the current rate between 74% and 75%, a result like nothing seen in the last 50 years.
What's happening here? I was curious to see whether the number of stolen bases has remained the same and just outs caught stealing have declined, suggesting players are getting faster or catchers slower, or alternatively whether stolen base attempts overall have declined, suggesting that teams are becoming more selective in their attempts and declining to run at all in lower percentage circumstances where they might have tried to steal previously. In general, the trend appears to be the latter – more selectivity.
Over the 1960s, teams averaged about .67 stolen base attempts (SBAs) by each team per game. In the 1970s that went up dramatically to about .96 SBAs per game. In the 1980s, attempts went up even a bit more, to about 1.1 SBAs a game. In the 1990s, attempts remained about 1.1 SBAs a game. But in the current decade of the 2000s, attempts have dropped dramatically to about .81 per game, and dropped to as low as .75 a game in 2005.
This drop in stolen base attempts presumably reflects a strategic reaction to the explosion of home runs in the late 1990s, which reduced the reward vs. risk ratio of stolen base attempts: the more likely it is that batter at the plate will hit a home run, the less rational it is for the runner on base to take the risk of trying to steal. But in the last couple of years, and especially in 2007, teams have seemed to learn that they had maybe grown a little too cautious, that if they exercise due care they can still take some extra steals without getting caught much more. Stolen base attempts have gone from .75 per game in 2005 to .80 in both 2006 and again so far this season. What has differed this season from last year is that of those .80 attempts per game in 2006, .57 represented successful steals and the other .23 were outs caught stealing, while this year .60 have been successful and only .20 have been outs caught stealing. With the most dramatic of the home run onslaught years apparently now behind us, teams seem to be intelligently readjusting their strategies to maximize stolen base attempt value – avoiding overly aggressive and risky attempts but not leaving high quality base advancement opportunities unused. The result is a rate of success on stolen base attempts that is unprecedented in the recorded history of such rates.
Are there differences in the stolen base success tendencies between the NL and AL? Both leagues are experiencing historically high success rates this season, the NL a bit higher than the AL, 75.4% in the NL to 73.6% in the AL, but the trend applies to both. The small edge in success rate for the NL matches the average edge the NL has had over the AL in success rates over the preceding 50 years, which has been about 1.6%. From 1957 through 2006, NL teams were successful stealing bases 67.4% of the time, compared to 65.8% of the time for AL teams, so both leagues in 2007 are ahead of their 50-year average success rate to an almost identical, and in each case very substantial, degree.
One other question that might be asked is whether the recent high level of stolen base success rates reflects a decision by teams to choose catchers more skilled on offense and less skilled at cutting down runners than in the past. Beginning in 1993 (coincidentally or not, the year of the most recent addition of major league expansion franchises), offensive performance by catchers, as well as by major league hitters generally, increased rather dramatically. Overall OPS in the majors in 1992 was .700, which had been about normal for many years – overall OPS had not been above .748 in any season since the 1930s. Then suddenly major league OPS jumped, first to .736 in 1993 and then to .763 in 1994, and has not been below .748 in any season since then. Catchers' hitting has followed along. After plodding along for years in the range of the .660s to the .680s, OPS by major league catchers jumped in 1993 to .714 and then to .727 in 1994, and has been below .700 only once (2002) since 1993.
Catchers as a group generally end up with an OPS in the range of 96% to 97% of overall league OPS, and that has been no different in the high offense, post-1993 years than it was before that. Over the full 50 years from 1957 to 2006, catcher OPS was 96.6% of major league OPS; from 1993 to 2006 that percentage was 96.5%. In 2007, catcher OPS is .712, actually a little bit lower than it has been on average since 1993 (.724). The increase in stolen base success percentage that is the topic of this article has occurred in just the last three or four years, and especially 2007. There is no indication that this increase is associated with any similarly recent jump in catcher offense, either an absolute jump or a jump relative to overall league offense.
For years prior to 2007, the underlying data on stolen bases, caught stealings, games played and league and catcher offense used in this article comes from Lee Sinins' marvelous Complete Baseball Encyclopedia database. I copied the relevant data into Excel and then added the appropriate formulas to get annual success rates and attempts per game rates. For 2007, I used the SB, CS and G data from the absolutely essential baseball-reference.com. For those interested, here's the stolen base success rate (SB/(SB+CS)) that I found for each year 1957-2007 and the stolen base attempts (SBA) per team per game ((SB+CS)/Games Started) for each year:
 	     SB 	        SBA Per Team
Year      Success Rate      Per Game
1957	    57.9%	            0.54
1958	    58.9%	            0.51
1959	    62.8%	            0.55
1960	    62.8%	            0.59
1961	    63.6%	            0.58
1962	    65.8%	            0.63
1963	    61.8%	            0.62
1964	    62.1%	            0.58
1965	    64.8%	            0.69
1966	    61.1%	            0.74
1967	    59.4%	            0.71
1968	    61.9%	            0.75
1969	    62.3%	            0.76
1970	    63.9%	            0.77
1971	    62.9%	            0.72
1972	    62.1%	            0.78
1973	    62.6%	            0.84
1974	    64.3%	            1.00
1975	    64.8%	            1.01
1976	    66.4%	            1.19
1977	    62.9%	            1.14
1978	    65.0%	            1.10
1979	    65.1%	            1.09
1980	    67.2%	            1.16
1981	    64.8%	            1.12
1982	    66.3%	            1.14
1983	    67.3%	            1.17
1984	    66.7%	            1.08
1985	    68.4%	            1.08
1986	    67.2%	            1.17
1987	    70.1%	            1.21
1988	    69.9%	            1.12
1989	    68.4%	            1.08
1990	    68.5%	            1.14
1991	    66.6%	            1.11
1992	    67.1%	            1.16
1993	    66.3%	            1.08
1994	    68.6%	            1.03
1995	    70.0%	            1.04
1996	    70.7%	            1.01
1997	    67.9%	            1.08
1998	    68.6%	            0.98
1999	    69.3%	            1.02
2000	    68.8%	            0.87
2001	    68.8%	            0.93
2002	    68.2%	            0.83
2003	    69.4%	            0.76
2004	    70.2%	            0.76
2005	    70.6%	            0.75
2006	    71.4%	            0.80
2007¹	    74.5%	            0.80
¹ through 9/11/07
Bruce Regal is a New York attorney, with an avocational interest in baseball. He maintains Metaforian, a blog devoted to the New York Mets and Baseball.
| Designated Hitter | August 08, 2007 |
Roid Monster (Or, How I Learned to Stop Worrying and Tolerate 756)
Let’s say you’re a PR director for a major-league baseball team. And you want to design your dream player, the guy who’ll look just perfect on the cover of a media guide or during a photo op at the hospital ward.
You want him to be a fun player – someone who plays with glee. You’d also want him to be a battler, maybe the type of guy who had to overcome a rough upbringing, or some physical deficit. He’d be selfless – kind to coaches and teammates, never showboating or yapping off. He’d be gritty, clutch, someone who always rises to the occasion and leaves it all on the field. And lastly, you’d want to make him… well, not white necessarily – that’s not essential these days – but someone who’s not about race, someone who makes his race a non-issue. What you’d end up with is someone who plays with a mix of joy and humility. You’d end up with Kirby Puckett, or Sean Casey, David Ortiz, Stan Musial.
What you would not want – the last thing in the world you’d want – is Barry Bonds. In fact, you could take just about every positive PR attribute I mentioned above, turn it on its head, and you’d have Barry Bonds. He’s not a team player. He comes from a privileged baseball background. He’s self-important and swaggering. He’s irritable. He badmouths his superiors. He plays the race card. He even, for a long time anyway, had a rep as a choke artist (think 1991 NLCS and his turkey-wing throw to try to get Sid Bream). And as for giving it 110% in the Gas House style of, say, Craig Biggio – well, let’s just say Bonds has thrown a lot of spotless uniforms onto the postgame laundry pile.
That Bonds is MLB Enemy #1 is not news. Hell, Rick Reilly owes at least half his weekly shtick to Bonds bashing, and every hack sportswriter (this includes you, Curt Schilling) has had a field day portraying Bonds, as Bill Maher once said, “like he’s the BTK Killer.”
Here’s the thing, though. I basically agree with those sportswriters. Sure, their methods are cheap, their thinking knee-jerk, but, like them, I absolutely loathe Barry Bonds. I hate how he adores his home runs and sometimes turns doubles off-the-wall into long singles. I hate how he comes across like every jock asshole you knew in high school. I hate how he paraded his son Nikolai before the media during spring training, 2005 – the kid was barely a teenager, clearly dying inside, but Bonds insisted on using him as a prop for his persecution complex, instructing photographers to take pictures of him “so you guys can see the pain you’re causing my family.”
But more than anything else about Bonds, I hate his voice. You don’t expect it from a guy of his stature. You expect something commanding, stentorian. Instead it comes out gentle and sedated. Or, more accurately, it comes out synthetic, as if he shared a soul with HAL 9000. It’s so out of character with everything else you know about the man that it creeps me out. It’s always reminding us, as Jeff Pearlman put it, that Bonds is “completely, undeniably 100% full of shit… Nothing he says holds any meaning.”
So yes, I hate Bonds. But truth be told, I don’t hate that he’s the new home run king. And I think it’s a complete waste of time to get exercised about 756. How come? Well, I can think of five reasons:
(1) No one has any idea how much Bonds has been helped by steroids.
Well, let me rephrase that: some people have some idea how much Bonds has been helped by steroids. But unfortunately they don’t form a consensus, and each of them would admit that he’s more or less playing Pin the Tail on the Donkey. Nate Silver estimated that steroids give position players 10 extra points of AVG, OBP, and SLG. J.C. Bradbury found that the benefits are negligible. Others – notably Patrick Hruby, who reckoned that about a hundred of Bonds’ homers can be chalked up to steroid use – fall more in line with popular thinking.
Even with these studies, we’re still left with a quagmire. How many other players were using steroids during Bonds’ home run spree? How much of an advantage was he getting? More to the point, how many pitchers were juiced up over the last ten years? (Oddly enough, Bonds hit #755 off of Clay Hensley, who, unlike Bonds, has actually failed a drug test.)
And did steroids make Bonds more durable or less durable as he got older? Sure, the evidence shows that Bonds hit more homers after age 35 than anyone in history, but evidence also shows that steroid use can lead to soft-tissue deterioration, tendon damage (particularly triceps tendon injuries, the kind that caused Bonds to miss 7 weeks in 1999), as well as the type of back and knee problems that have plagued Bonds the last few years. When you look at the shortened careers of known or alleged steroid users like Mark McGwire, Sammy Sosa, and Jason Giambi, you wonder if steroids gave Bonds a boost when it came to breaking short-term records, like the single-season home run record, but had mixed results when it came to toppling career records, like Aaron’s 755.
Of course, we’ll never know. And that’s precisely the point. Until we have good, solid data – as opposed to armchair theorizing – regarding the effects of steroid use on ballplayers, then I think it’s best to extend a bit of graciousness (the kind, incidentally, that often seems missing from Bonds himself) and give him the benefit of the doubt. Because the bottom line remains that Bonds was a great ballplayer – the best of our generation – before he supposedly began taking “the clear,” and he’s been a great ballplayer, one of the very best in the league, even after he presumably stopped using steroids. That’s no small feat for a man well into his 40’s.
And if nothing else, we can say that Bonds is truly the greatest steroids hitter in major league history. I know, I know, that’s a stupid statement, satisfying to no one… but then again, as Chuck Klosterman pointed out rather amusingly, the Beatles took performance-enhancing drugs (how else do you think they came up with side two of “Revolver”?), and no one holds it against them.
(2) Bonds is a product of his era, just as Aaron and Ruth were products of theirs.
A few weeks ago, baseball’s éminence grise, Bill James, was asked if players using performance-enhancing drugs should be treated differently by history. He replied:
I look at it this way. There's a rule in basketball against traveling but the NBA has pretty much stopped enforcing it. Well, they still call traveling but they will allow you to take about five steps without dribbling as you are running toward the basket. There was no "decision" not to enforce this rule; they just kind of lost track of it. They started not calling one step and progressed to not calling two steps, not calling three steps, and eventually they just kind of lost track of the rule. Should the players who took advantage of this failure to enforce the rule be banned from the NBA Hall of Fame? After all, aren't they cheating? They're not obeying the rules. Julius Erving, out. The Hall of Fame doesn't need cheaters like you. Kobe, Michael, get out. If you don't play by the rules the way Elgin Baylor did, you're not deserving.Or it is, rather, the responsibility of the LEAGUE to enforce the rule? It seems to me that it might be the responsibility of the league to enforce the rule rather than the responsibility of the media to punish those who didn't obey the rule that wasn't being enforced. I won't name any players, but there are a whole bunch of superstars who are now or are going to be involved in the PED accusations. We CAN'T start picking and choosing who we honor on that basis. It's hypocritical, and it's impractical. And it diminishes the game.
I think James’ analogy breaks down at some point. After all, lax traveling calls in the NBA are presumably applied equally to players of each era, whereas steroid-users gain an advantage over not just players from other eras, but against players in their own era, i.e., the ones not using PED’s. What’s more, in basketball, traveling is out in the open, so to speak. We can watch TV, judge who travels, who doesn’t, and make our historical adjustments accordingly. That’s not the case for baseball players who are hiding their drug use.
Nonetheless, I think James’ general point holds: that is, that Bonds is a product of a systemic set of values, a culture. It’s the same point Jesse Jackson made recently, when he told the Chicago Sun-Times, "My question is, if 400 guys tested positive, do you put asterisks by all their names? Do you put asterisks by [spitballer] Gaylord Perry's name? Do you put asterisks by guys who had the ultimate enhancement [by] denying others a chance to compete?" (Hat tip: Studes, for the link)
I forwarded these comments to a friend last week, and he emailed me back: “if pre-1947 ball was not ‘all it could be’ because of the color line (a theory I think everyone with a brain would agree with), and post-1980s ball is ‘tainted’ because some used steroids, does that mean we've only had 40-45 years of undisputed competition?” I wrote back that, in fact, every era has been tainted in some way, with statistics constantly subject to some distortion or other. One era might not allow people of color, another might be tainted by steroids or amphetamines, another by the height of the mound, another by the system of selecting and promoting players from foreign countries, another by primitive approaches to heath and recovery, another by using too much plate armor, another by weird strategies and shibboleths, like the one that says it’s unmanly to swing from the heels or take a walk now and again. Some of these are probably a stretch, but I really think people are naïve if they don’t think that every record carries with it some kind of implied asterisk.
At first blush this sounds like the biggest bummer of all time. Does this mean that we can’t trust any of our numbers? Does it mean that the subject of Bonds vs. Aaron will never be settled? This goes against the very grain of sports, the thing that most distinguishes it from our everyday lives – i.e., the fact that sports has clear-cut winners and losers. The closest analogy I can think of for Bonds’ home run chase is the 2003-2004 college football season, when USC and LSU split the national championship. Actually, a better analogy might be the 2000 presidential race, when I thought Bush won, you thought it was Gore, and all of us were both right and wrong. In this way 756 is a sign of our times, in which there are no longer any truths, only perspectives, opinions, fragments, and the kind of anti-foundational stuff that gave night tremors to Nietzsche, Foucault, et al.
And yet… and yet… Isn’t that, at least in part, what makes baseball so entertaining? Yes, baseball’s numbers are tainted – but imagine if the opposite were true. Imagine if every number were set in stone, static and inarguable. What a drag that would be! How much more fun to share a beer with a buddy and argue, say, how many home runs Ted Williams would’ve hit had he not been drafted. Or what would have happened to Jose Cruz if he hadn’t played in the Astrodome. Or if Johnny Beazley had been born after the advent of Tommy John surgery. Yes, we want baseball to be obvious and dependable, but it seems we are at least equally charmed by the game’s elusiveness. I find that rather encouraging.
(3) Bonds’ home run crown isn’t as bad for Hank Aaron as you might think.
I’m sure by now you’ve all seen footage of Bud Selig reacting to Bonds’ record-tying 755th career home run. He basically made an ass of himself, I thought – standing up only after he was prodded, putting his hands in his pockets, showing all the enthusiasm of an 8-year-old boy forced to sit through Sunday service. As Joe Sheehan pointed out, Selig’s enmity for Bonds stems from his reverence for the man he’s replacing atop the leaderboard, Hank Aaron. (Sheehan doesn’t offer any evidence for this connection, but it certainly rings true.)
Selig isn’t alone in sizing up Bonds vs. Aaron. To root for one, it seems, is to root against the other, just as folks back in 1974 tended to take sides for either Ruth or Aaron, but not both. If this is the case today, then surely Aaron is winning. In fact, the last few weeks have seen an outpouring of love letters to The Hammer, most notably a Sports Illustrated magazine cover, with the inside story declaring him “The People’s King.” (Incidentally, that’s as many SI covers as Bonds landed for the entire four-year period 2000-2003. I know Bonds notoriously froze out the magazine after they published a 1993 story about him entitled, “I’m Barry Bonds, and You’re Not,” but geez… Bonds was in the midst of the greatest hitting binge in major-league history and that’s all he got? One cover?)
Anyway, the point is that Aaron has been enjoying a renaissance lately, one that wouldn’t be possible without his purported nemesis, Mr. Bonds. The irony is that Hank Aaron was not especially beloved in his day, and I’m not just talking about the racist yokels who mailed him death threats in 1974 (the ones who caused Aaron’s mother to mistake the celebratory fireworks after her son’s 715th home run for sniper shots, of all things). I’m talking about good, respectable baseball folks who had nothing in particular against the Hammer, but never embraced him the way they embraced, say, Roy Campanella, or Willie Mays. Next to them Aaron seemed charmless and remote. And it was all too easy for people to mistake Aaron’s quiet reserve for something more sinister: laziness – surely a byproduct of the casual racial stereotypes of that time. (His first manager, Charlie Grimm, once asked about Aaron, “why doesn’t he sleep on his own time like everybody else?”)
But the years have been good to Aaron. Unlike DiMaggio, a beloved star who became a depressing figure in his final days (when we heard stories about his friendlessness, or the way he disowned his only son, leaving him to live in a junkyard trailer in northern California), and unlike Mark McGwire, who until recently was treated like a national savior, Aaron has only grown more likable with time. (Ironically enough, if Aaron played today, he’d probably be dogged by steroid rumors – look what a twig he was when he first came into the bigs, then look at the beefy guy who experienced a career high in home runs at age 37.)
The great sportswriter Jim Murray once wrote about Aaron, “He underplays like a British actor. Willie [Mays] attacks the game. Aaron just gets it to cooperate with him.” This whole flap about Bonds and steroids might be yet another way in which Hank just got the game to come to him.
(4) Bonds’ record will be broken anyway.
I read somewhere recently that DiMaggio’s 56-game hitting streak is so improbable, so statistically preposterous, that you’d have to replay the entire history of baseball something like eight times before it’s likely to happen again. Like Cy Young's 511 wins or Nap Lajoie's .426 single-season average, we probably won’t live long enough to see anyone match it.
Barry Bonds’ mark for career homers is not one of those records. Nate Silver wrote an article recently in which he gave Alex Rodriguez a 28% chance of hitting 800 jacks, and a 10% chance of hitting 900. Of course, that still means A-Rod will most likely fall short of the record. But he’s just one guy. What if you matched Bonds against the field?
Suddenly the record looks much iffier. If you use Bill James’ Favorite Toy (which, admittedly, is much less sophisticated than the PECOTA system Silver used), you’d find that Bonds is projected to hit 787 lifetimes bombs when all is said and done. Sounds reasonable. Here are his closest competitors, the active players with a non-zero chance of hitting 788:
A-Rod           32.3%
Pujols          21.3
Andruw Jones    14.7
Adam Dunn        8.5
Ryan Howard      1.4
Combine their chances and you get a 41% chance that none of them will hit 788, ergo, a 59% chance that at least one of them will.
And that’s just the names above. For as long as baseball is still around, players will have a crack at the record. Maybe one of those guys above will break it. Or maybe it’s some newbie, like Justin Upton. Or Justin Upton's child. Or grandchild. After all, Bonds was only nine years old when Aaron surpassed Ruth.
The bottom line: until someone enters Sadaharu Oh territory – 868 lifetime home runs – then I think the home run mark will remain very breakable.
(5) Admit it – you love that Bonds broke the record.
Sally Jenkins, who writes for the Washington Post, suggested recently that, when the moment came for Bonds to break the record, he should have laid down his bat and walked away from baseball, preserving the game’s dignity and turning himself into the greatest folk hero of all time.
Whatever. As I said earlier, I hate Bonds, but I like hating Bonds. He’s the perfect villain – our Voldemort, our Dr. Evil, our Galactus, Devourer of Worlds. I think it’s perfectly appropriate that he’s on top.
One thing that’s always irked me (and I’ve harped on this before, both here and here) is the idea that baseball should be a beacon of moral values, or that ballplayers should be “role models.” Honestly, what kind of idiot looks to a guy who wears cleats and hits baseballs as an exemplar of virtue? I like ballplayers because they’re entertaining. The game offers a rich panoply of characters, both good (Jim Eisenreich, Larry Walker) and bad (A.J. Pierzynski, Carl Everett), and we’d all be a little poorer without them. The truth is, Bonds’ home run chase is one of baseball’s all-time great stories, breathtaking and absurd at the same time.
Because I’ve talked a lot about steroids, I’ll close with my favorite quote on the subject, from one of baseball’s most breathtaking and absurd characters, Rickey Henderson. A reporter once asked him if Ken Caminiti’s estimate that 50% of big-league players were taking steroids was accurate. His response? “Well, Rickey’s not one of them, so that’s 49% right there.”
So let’s tip our caps to Barry Bonds, the best of that 49% – and really, let’s be honest, the best of the other 51% too.
Brian Gunn is a screenwriter living in Los Angeles who formerly headed up the baseball website Redbird Nation.
| Designated Hitter | May 24, 2007 |
The Value of the Stolen Base: A Comparison of MLB and NCAA Division I Baseball
Over the years there has been a great deal of debate amongst baseball insiders and fans over the value of the stolen base. Some, such as longtime Baltimore Orioles manager Earl Weaver, have argued that the stolen base is rarely worth the risk. Others, however, view the stolen base as a valuable means of applying pressure to the opposing team's defense. The question is: Which side is right?
Most past research on the stolen base seems to side with Weaver. Using data from Major League Baseball, researchers have found that stealing at less than a 75% success rate is detrimental to success. Joe Sheehan explains in Baseball Prospectus Basics: Stolen Bases and How to Use Them that when considering stolen bases, one must consider both the cost and the benefit. Therefore, the break-even point for successful base-stealing is so high because outs are more valuable than bases in nearly every instance. For example, the Run Expectancy Matrix created by Baseball Prospectus reveals that a runner on first base with no one out is worth approximately 0.864 runs. A successful steal of second base would raise that figure to 1.173. However, a failed stolen base attempt drops that number to 0.270. In this example, the loss is nearly two times the gain.
In the same article, Sheehan also suggests that the secondary effects of base-stealing, such as putting pressure on the opposing pitcher and defense, do not exist. In fact, he goes as far as to suggest that a runner at first base is more disruptive to the defense than a runner at second base, simply because the first baseman must hold the runner on and the middle infielders are forced to cheat toward second base to have a chance at a double play.
While these findings have been consistently replicated and are generally accepted by Sabermetricians and others when talking about professional baseball, there has been little or no research conducted examining the stolen base at other levels of play. As a Division I college baseball coach, this leads me to wonder: Is the stolen base a more valuable offensive weapon in college baseball than it is at the professional level?
The numbers seem to indicate that the stolen base is more a part of the college game than it is the professional game, even to the casual fan who has taken a few minutes to compare player and team statistics from both levels. For example, in 2006, the Los Angeles Angels led all of Major League Baseball in stolen bases with .91 stolen bases per game. That same season, the average Division I college baseball team stole 1.2 bases per game, with the national leader averaging slightly more than three stolen bases per game.
A deeper analysis of both college and professional statistics is even more revealing. A series of multiple linear regression models were created using data from both NCAA Division I and Major League Baseball. The models used both stolen bases per game and caught stealing per game to predict runs scored, while controlling for base-stealing opportunities. The results were interesting. The first set of regression models, examining the relationship between stolen bases per game and runs scored, revealed that in college baseball, runs per game increased by .295 with each stolen base per game. However, in Major League Baseball, runs per game actually decreased by .208 with each stolen base per game. While it seems strange that a successful stolen base attempt would result in fewer runs scored, it is likely explained by the fact that teams stealing more bases generally do so to compensate for a lack of offensive firepower (i.e. power hitting). Therefore, it is not the stolen base itself that is costing the team runs but the team's overall style of play. The second set of regression models, analyzing the relationship between caught stealing per game and runs scored, indicated that in college baseball, runs per game decreased by .304 with each unsuccessful stolen base attempt per game. In Major League Baseball, the cost of a failed stolen base attempt was even more severe at .845 runs per game.
So what do these findings actually tell us? In the most simplistic sense, they indicate that the stolen base is indeed a more valuable offensive weapon in college baseball than it is in Major League Baseball for two reasons: 1) The reward for a successful stolen base attempt is greater; 2) The cost of an unsuccessful stolen base attempt is less significant. Therefore, because they have more to gain and less to lose, it makes sense for college teams to utilize the stolen base more liberally. However, the fact that college baseball teams attempt considerably more stolen bases per game than do big league teams seems to suggest that many college coaches are already aware of this more favorable "risk/reward" ratio.
That being said, it is also important to acknowledge and understand the limitations of these findings. The biggest weakness of this study is the inability to examine specific situations. Therefore, while the above findings provide information about the big picture, they offer little or no guidance relative to specific in-game strategy decisions. In other words, there are a multitude of factors (i.e. the ability of the base runner, the opponent, the game situation, etc.) that were not considered in this study but are extremely influential in the outcome of any base-stealing attempt. As a result, coaches must remember that the actual "risk/reward" ratio changes with the situation. Below is a more detailed look at factors that must be considered before attempting a stolen base.
The Base Runner
The speed and base-running ability of the runner are extremely important when deciding whether or not to steal a base. It makes the most sense to run when the base runner is fast and has good instincts.
The Hitter
The ability of the hitter at the plate is extremely important. It makes the most sense to attempt a stolen base when the hitter at the plate is a double play threat and/or when the hitter has little chance of driving a runner in from first base.
The Pitcher/Catcher
The ability of the pitcher and catcher to stop the running game is also important. A pitcher that is slow to the plate is much easier to run on than one who is quick. Similarly, a poor throwing catcher is easier to run on than one who throws well.
The Game Situation
Research has repeatedly shown that in the majority of Major League Baseball games, the winning team scores more runs in one inning than the losing team does in the entire game. This revelation backs up Earl Weaver's advice to play for the big inning, especially early in games. Therefore, one-run strategies, such as the stolen base, make the most sense in situations where one run is of great importance (i.e. late in games or in low-scoring games).
Michael Current is an assistant baseball coach at Illinois State University. He graduated from Blackburn College with a degree in Communication and recently completed his master's degree in Sport Management at Illinois State University. Last summer, Current served as an assistant coach with the Yarmouth-Dennis Red Sox in the prestegious Cape Cod League, where his team won the league championship.
Dr. Chad D. McEvoy is an Assistant Professor of Sport Management in the School of Kinesiology and Recreation at Illinois State University, where he is the coordinator of the sport management program. Dr. McEvoy has published articles in journals including Sport Management Review, Sport Marketing Quarterly, International Journal of Sport Management and Marketing, and Sport Management and Related Topics.
| Designated Hitter | May 17, 2007 |
Sinister Thefts
In a recent broadcast, Joe Morgan mentioned that a base-runner who is able to read the pitcher can find it easier to steal off a left-handed pitcher because lefties are slower to the plate then righties.
If this is so, then it ought to show up in the results. To start, I went to retrosheet.org to look at some splits. What were Joe Morgan's totals? He is listed as stealing 520 bases in 645 attempts vs. RHP (80.6%); and 167 out of 204 vs. LHP (81.9%). Next, I estimated the number of opportunities as singles plus walks - certainly not a perfect measure, as pitching changes sometimes occur (I suspect that this is a small effect) and often 2b is occupied (perhaps a larger effect, though it ought not differ by more than a few percent between LHP and RHP), but it should offer a decent approximation.
Pro-rating per estimated opportunity (Eopps), Morgan's totals were:
vs RHP: .213 SB and .051 CS
vs LHP: .149 SB and .033 CS
If Morgan found lefties easier to steal on, it seems odd that he'd steal only 2/3 as frequently against LHP. His success rate suggests that he might have been able to read LHP well enough to only go when he had a good chance of success, but the fact that he ran less often is in conflict with a general "easier to steal" claim.
Let's start by trying to set some context. What patterns do base-stealers have? I'll look at the frequency (attempts divided by estimated opportunities) and stolen-base percentages for all players. The graph shows the frequency of attempts vs. the success rate starting in 1951, the first year that both leagues counted caught stealing (CS). (Data from baseball databank)
For example, in 1951, the SB frequency was .0582, and the SB pct. was .589; in 1952, the frequency was .0576 (nearly the same), but the SB pct. dropped to .551, causing the path plotted to plummet nearly straight down. The SB pct. then increased fairly steadily through the 1950s, reaching a new equilibirum in the .60-.66 range. At that point, the frequency began to rise rapidly as Luis Aparicio and Maury Wills experienced success, moving the path to the right. With Lou Brock's record-breaking performance in 1974, the frequency rose beyond .100, and the greater emphasis on the cerebral aspects popularized by folks like Brock and Morgan led to a new rise in the SB pct., which passed .667 for the first time in 1980. By this time, Tim Raines and Rickey Henderson were entering the picture, and steal attempts reached a new equilibrium in the .112-.127 range, while SB pct. gradually improved from .65-.67 in 1975-84 to .67-.70 in 1985-1994. As the new offense-friendly parks entered the league and the home run explosion started, the frequency began to drop, while success rates continued to rise, reaching .700 in 1995. In six of the last seven years, the frequency of steal attempts has been in the .081-.090 range, while SB pct. has risen each of the last four seasons (from .682 in 2002 to .694, .702, .706, and .714), making it appear that we are in the middle of a new transition.
|
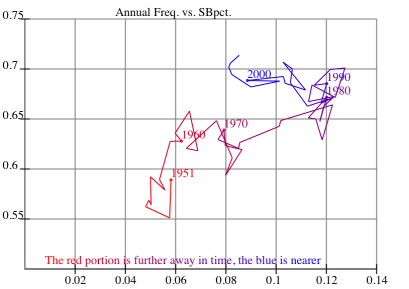 |
Plotting the SB vs. left / SB vs. right paths on the same graph produces a tangled web. So instead, let's look at the differences, R - L, for both frequency and success rate. This is still rather tangled, but it does seem to show that the difference between LHP and RHP has diminished in recent years. In 1962, the RHP frequency was .073, the LHP frequency .049, making a difference of .024 in the frequencies. Despite stealing less often against LHP, the difference in SB pct. against LHP (.618) and RHP (.657) was one of the lower totals of that era. The difference in frequencies stayed in the .020-.030 range until the late '80s, when the frequency of attempts vs. LHP began to rise, topping out in 1992 at .1224 vs. RHP and .1221 vs. LHP, a difference in frequency of only .0003, the left most point plotted on the freq. vs. pct. graph below. The frequency differences seemed to have stabilized around .010, much lower than the differences seen 20-30 years ago. During this time, the difference in SB pct. appears to have decreased as well. Thirty years ago, differences like those of 1977 were typical, the SB pct. vs. RHP was .647, vs.LHP it was .578, a difference of .069. SB pct. differences were generally in the .060-.080 range then. But in the last twenty or so years, the difference in SB pct. has been in the .040-.080 range, with the 2006 difference of .058 (.728 vs. RHP and .760 vs. LHP) representing a typical difference in success rates. Overall, success rates have increased in the last 50 years, but sucess rates against LHP have increased even more than success rates against RHP. The LHP advantage in holding base runners appears to have decreased, runners are stealing against them at frequencies and success rates that are closer to those of RHP than they were a generation ago.
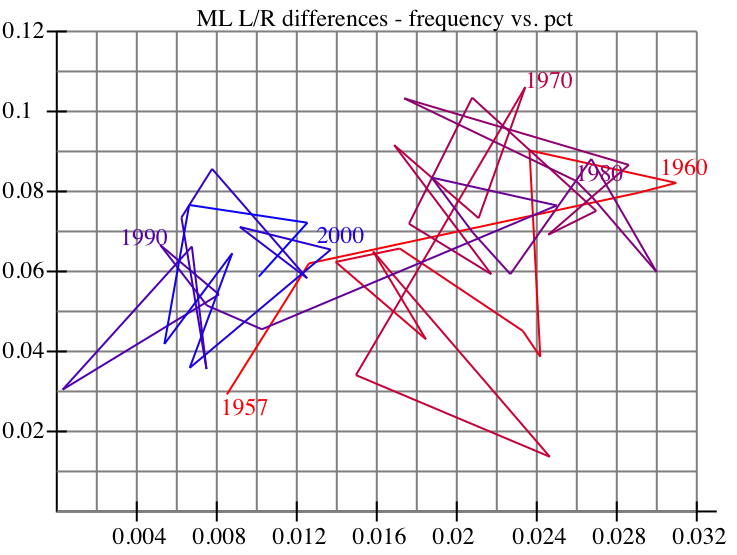 |
|
As base-stealing became more frequent, the increase against RHP was greater than the increase against LHP, then the RHP frequency leveled off. Both have receded in recent years. |
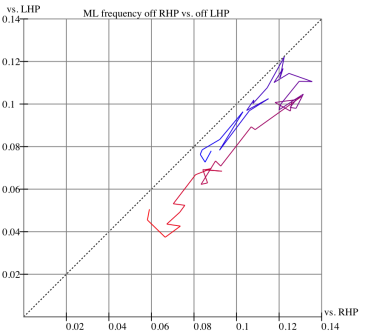 |
A related question pops up regarding the interplay between experience and aging. As players get more experience, many presumably learn ways to improve their success rate, but they also slow down. So next, we'll take a look at the Freq/Pct graph based on the players' age as of July 1.
Young players steal more frequently, through age 25, and then gradually taper off. The sucess rates are pretty consistent, except for a drop during the initial increase in frequency, and a rise during the rare steals by older players. It's not clear to me whether this is due to player experience, or a bias in created by removing the lesser players.
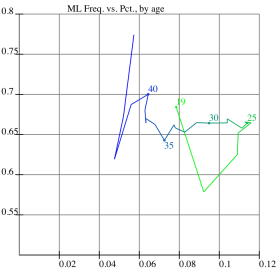 |
| The younger (greener) players are represented by green, the older by blue. |
Do these same trends hold for the leading base-stealers? To consider this, I took a look at the players who stole at least 300 bases in the retrosheet years (1957-1998, 2000-2006). There were 26 of these. A look at their aging patterns shows that it is similar to those of the general base-runner, except that the base-stealers stayed near their peak rate for several more years than the average player. As the base-stealers aged, their relative frequency of attempts versus LHP seems to increase, but their success rate drops. This makes it unlikely that more experienced base-stealers are picking up extra cues against LHP.
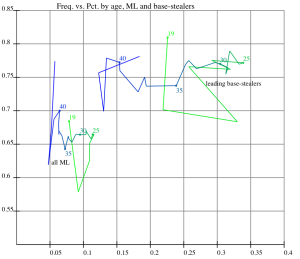 |
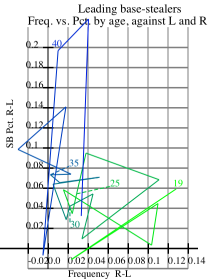
|
Here are the rates for the 26 base stealers, their average, and the overall major league average for 1957-98, 2000-06.
| Name | R Freq | R Pct. | L Freq | L Pct. | Freq. ratio L/R |
| Alomar | .207 | .813 | .173 | .763 | 0.84 |
| Aparicio | .240 | .790 | .208 | .751 | 0.87 |
| BarBonds | .168 | .796 | .170 | .745 | 1.01 |
| BobBonds | .323 | .752 | .237 | .659 | 0.73 |
| Brock | .413 | .767 | .416 | .721 | 1.01 |
| Butler | .286 | .718 | .230 | .599 | 0.80 |
| Campaneris | .340 | .776 | .380 | .748 | 1.12 |
| Cedeno | .382 | .765 | .291 | .724 | 0.76 |
| Coleman | .544 | .801 | .652 | .826 | 1.20 |
| DeShields | .335 | .780 | .312 | .725 | 0.93 |
| Grissom | .254 | .806 | .278 | .744 | 1.10 |
| Harper | .286 | .771 | .252 | .793 | 0.88 |
| Henderson | .405 | .835 | .399 | .755 | 0.98 |
| LeFlore | .477 | .796 | .370 | .682 | 0.77 |
| Lofton | .319 | .799 | .248 | .787 | 0.78 |
| Lopes | .367 | .851 | .230 | .753 | 0.63 |
| Molitor | .170 | .813 | .215 | .756 | 1.26 |
| Moreno | .495 | .747 | .499 | .672 | 1.01 |
| Morgan | .264 | .806 | .182 | .819 | 0.69 |
| Nixon | .445 | .790 | .447 | .718 | 1.00 |
| Raines | .327 | .879 | .230 | .738 | 0.70 |
| Sax | .300 | .728 | .274 | .678 | 0.91 |
| OSmith | .250 | .813 | .218 | .756 | 0.87 |
| Wills | .320 | .740 | .357 | .732 | 1.11 |
| Wilson | .425 | .853 | .251 | .760 | 0.59 |
| Young | .322 | .764 | .298 | .667 | 0.92 |
| Avg. | .317 | .794 | .287 | .737 | 0.90 |
| ML Avg. | .103 | .682 | .088 | .617 | 0.85 |
Most of the leading base-stealers stole more frequently and more successfully against RHP. But several ran more often against LHP, and Joe Morgan, Tommy Harper and Vince Coleman had a higher SB pct. against LHP. The leading stealers relative frequency of attempts was a little higher, 90% as frequently as against RHP, while the general population attempted steals only 85% as often against LHP, but the difference in success rates was nearly identical, 6.7% vs. 6.5%. This is consistent with LHP being tougher to run on in general. But are there LHP who are easier to run on than RHP?
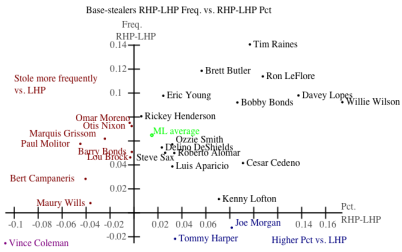
To look at base-stealing from the "who's pitching?" perspective, I went through the Retrosheet team rosters, which conveniently include pitchers' SB/CS/PO data in the fielding data (for example, for the 1975 Red Sox). Breaking these into left- and right-handed pitchers gave the following totals:
Hand   Est.Opps     SB      CS   Pickoff     Freq.   SB Pct.
RHP     1284662   89828   41938    6437     .1026     .682
LHP      533131   28812   17894    6151     .0876     .617
Other than a slight increase in Freq. and SB pct. for pitchers near 40, the aging patterns graphs were pretty flat.
Next, I considered pitchers with at least 1000 estimated opportunities. There were 400 RHP and 177 LHP. These RHP saw stolen-bases attempted at a rate of .1037, while the LHP were at .0884, rates nearly identical to those of all pitchers. The SB pct. were slightly lower against these pitchers, .660 vs. RHP and .592 vs. LHP. Are there left-handed pitchers that are among the easiest pitchers to steal on? The answer... very few. The graph here shows these 577 pitchers, plotting frequency vs. SB pct. The extremes are represented by Dwight Gooden whose frequency was .205 and SB pct. was .780. The highest SB pct. was against Mark Clear at .872, with runners going at a frequency of .174. The least-run-on pitcher was Whitey Ford, with a frequency of .025, one steal attempt for every 40 estimated opportunities, and a SB pct. of .385. The lowest opponents SB pct. was turned in by Billy Pierce at .341. Pierce's frequency was also low, at .031. Most of the hard-to-steal-on pitchers are left-handed, most of the easy-to-steal-on pitchers are right-handed.
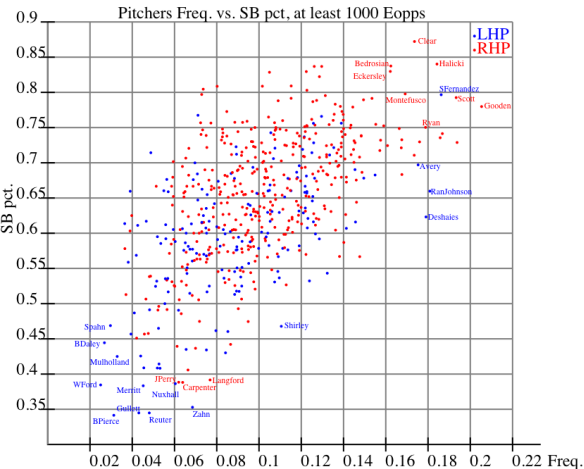
What about Morgan's statement that LHP are slower to the plate? If so, perhaps most base-stealers aren't reading the pitcher well enough to take advantage of the slower delivery. Until Retrovideo comes along, we won't be able to answer this definitively, but now that several World Series broadcasts are available on DVD, maybe we can start to study the question directly. Conveniently enough, one of the DVDs available is the 1975 World Series. Watching the Series, I discovered that the broadcasters said that Morgan claimed to be able to read the Red Sox pitchers, and that he wouldn't get caught stealing again - he wasn't. During game seven, the claim was made that Morgan had picked up something in Bill Lee's delivery and had passed the information on to Dave Concepcion and Ken Griffey. But when they got to first, there were three pitches on which they were heading back to first when the pitch was delivered - not exactly a great jump to get. On the other hand, when Morgan stole second during the game, he started for second base less than a tenth of a second after Lee began his delivery home, allowing Morgan to steal second standing up. That's a very quick jump. There's the anecdotal evidence. How long do the pitchers take to deliver the pitch? I looked at all games in the 1975 World Series, and portions of games 5 and 6 in the 1986 World Series.
To measure the time to the plate, I took the time from when the pitcher first started stepping toward home until the time the pitcher released the ball. I timed pitchers who were working from the stretch and found that most take about the same amount of time in the stretch whether or not there is a runner on first with second open. Without doing a detailed study, I found only two exceptions in the few games that I looked at: Firstly, with Joe Morgan on first with second base open, Luis Tiant knocked nearly a quarter of a second off his delivery time. Secondly, in the 1986 World Series, Roger Clemens dropped about a tenth of a second off his delivery time with a runner on first and second open, relative to his other pitches from the stretch.
The graph below shows the delivery times that I recorded for pitchers pitching from the stretch in the 1975 World Series and the 1986 World Series (games 5 and 6). Again, pitchers who throw with their right wing are in the red state, and those who throw with their left wing are in the blue state. The bars represent two standard deviations on the estimation of the mean time.
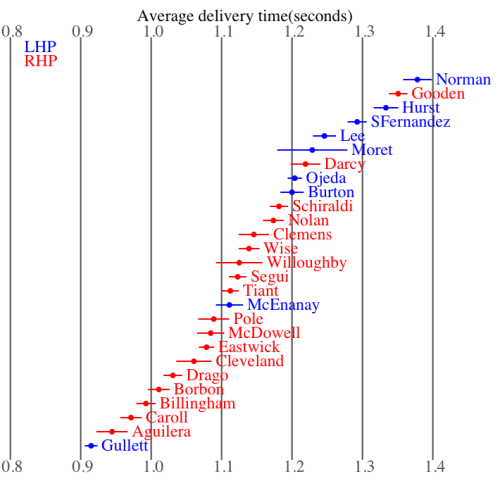
The average of the mean delivery times for the 18 RHP was 1.10 seconds, for the 9 LHP, 1.21 seconds. Some of the extremes here are notable. Dwight Gooden has the highest attempt frequency during the past 50 years as well as the season with the most opponents stolen bases, 60 in 1990. The second highest single season total is 56 by Gooden in 1988 and Floyd Youmans in 1986. Sid Fernandez was the easiest LHP to run on in the last 50 years, with both the highest frequency of attempts and highest SB pct. among all LHP with at least 1000 estimated opportunities. Don Gullett is tied for the second lowest opponent SB pct (at least 1000 estimated opps) behind Billy Pierce's .341 (for 1957-1964). Gullett and Kirk Rueter were at .345. (Rueter's 1999 data is not available.) Gullett's delivery times may be related to his low steal rate. More study is needed. Out of curiousity, I checked to see how a young Joe Morgan ran against a young Don Gullett. Morgan was on first base three times with second open, and did not attempt to steal.
In summary, what did I find?
- Left-handed pitchers are more difficult to steal on.
- Some base-stealers appear to have been able to steal as well or better against LHP than against RHP.
- LHP appear to take more time to pitch from the stretch than RHP
John Rickert teaches mathematics at the Rose-Hulman Institute of Technology, and joined the Society for American Baseball Research in 1983 after reading John Davenport's Baseball Graphics and Bill James' Baseball Abstracts.
| Designated Hitter | May 10, 2007 |
How Sabermetrics Helps Build a Better Ballgame
It's been several months since Murray Chass woke up one morning and decided to devote the last six paragraphs of his column to criticizing Baseball Prospectus. As I replied at that time, what most took be aback about his column was its assertion that sabermetrics "threatens to undermine most fans' enjoyment of baseball."
Naturally, I think quite the opposite is true. Here are seven ways in which sabermetrics has helped to improve the fan's experience:
1. Enhancing the Quality of Play.
There has been a great deal of debate about just how much the quality of play has improved in baseball over time. What nobody debates, however, is that the quality of play has in fact improved substantially. There are a great number of reasons for this, first and most importantly because the size of Major League Baseball's potential player pool has tended to grow more quickly than the number of teams in the league.
A small part of the improvement in quality, however, might be the result of the sabermetric movement. In a forthcoming essay for It Ain't over 'til It's over: The Baseball Prospectus Pennant Race Book, I developed something called the Efficiency Index, which operates by comparing the performances of the best backups in the league to the worst regulars in the league. The idea is that if the best backups in the league are much better than the worst regulars, then the league is doing an inefficient job of distributing talent, presumably because of great disparities in wealth, scouting acumen, or aptitude for talent evaluation.
The Efficiency Index has improved over time, particularly with the widespread introduction of the farm system in the 1950s. There has been a smaller but perceptible rise, however, within the past 5-10 years, and particularly within the last 2-3 years, which coincides with the widespread introduction of sabermetrics into the thought processes of major league front offices. There is no longer any reason to Free Erubiel Durazo!, or Frank Catalanotto, or Kevin Youkilis, or Chad Bradford. Those guys are getting a chance to play, and they're helping to resolve asymmetries in the talent distribution process.
This takes for granted, of course, that fans would rather see Kevin Youkilis play baseball than say J.T. Snow, which is almost certainly the case if he's donning the uniform of your favorite team, but perhaps less so if we're coming at this from the standpoint of pure aesthetics. That is really just the tip of the iceberg, however. Consider: would the Red Sox have matched Daisuke Matsuzaka's price if not for the work of people like Clay Davenport, who helped us to understand the high quality of baseball in Japan? Would Jake Peavy be the best pitcher in the National League, or would he have been a victim of high pitch counts? Would Curtis Granderson be patrolling center field for the Tigers, or would he have been written off because he came from a tiny college program in a northern state, doomed to see his skills and desire atrophy in the lower minors? Even if you think the answer to these questions is "well, probably," baseball is replete with examples of potentially great players whose skill sets slipped through the cracks, and not all of those guys were Jack Cust types.
2. Democratizing the Media
Don't get me wrong. I'd have a tough choice deciding between ESPN and the other 400-odd channels in my cable lineup, provided that some allowance could be made for The Sopranos. But there's developed an increasingly blurry line between the people who cover the baseball industry, and the people who profit from it.
At the one extreme, you have the obvious potential conflicts of interest. The Tribune covers the Cubs while also owning the ballclub. I believe The Trib generally does a good job of managing these conflicts, but - full disclosure - I have been a frequent guest on WGN Radio. At the other extreme, you have the more vaguely insidious conflicts, such as Buster Olney blogging about "fantasy sleepers" when he clearly has no interest in the subject. And there's nobody much left to police the conflicts of interest, because if you don't have a relationship with the leagues themselves, you probably have relationships with the major media players (full disclosure #2: "you" includes Baseball Prospectus).
What we do have, however, is the blogosphere. The blogosphere has generally not been interested in covering the meta-issues of the sports media - there's no mediamatters.org for sports, unless you want to count Fire Joe Morgan. But it does an absolutely superlative [corrected] job of covering baseball itself. At the risk of being self-aggrandizing in an Al-Gore-Invented-the-Internet kind of way, I believe a great deal of that has to do with the lower barriers to entry that sabermetrics helps to facilitate, in terms of its tendency to allow objective knowledge about the game to go forth and multiply. The very thing that Murray Chass seems to fear is the very thing that makes him less important. Baseball fans can still read Murray Chass if they want - but they can also read Rob Neyer or Tangotiger or Rich Lederer. Once you realize that the arrangement of the Yankees' locker room has less to do with their success or failure than simple things like how often Johnny Damon gets on base, you're armed to debate about them without having to tip your hat to insider knowledge.
3. Leveling the Playing Field
One of the great myths of Moneyball is that sabermetrics is something that's the domain of small-market clubs; as the Red Sox have shown, there is little intrinsic connection between a team's financial and analytical dispositions. Nevertheless, having a core competency for statistical analysis provides another dimension along which a team can compete. Since statistical analysis is relatively cheap to execute, this has tended to lessen the intrinsic advantage of large-market clubs, which in turn provides "hope and faith" to a larger number of fans. As a corollary, the analytical approach represents another potential strategy that teams can gravitate toward, which increases the genetic diversity of the sport.
4. Opening up the Owner's Box (and the General Manager's Office)
Fans have always debated about the game's greatest players. But as difficult as it can be to determine whether Hanley Ramirez or Jose Reyes is the better player, it is even more difficult to determine whether Billy Beane or Terry Ryan is the better general manager, or corporate ownership is better than having a megalomaniac like George Steinbrenner. Sabermetrics, particularly when it pursues angles related to economics, empowers us to discuss the game off the field to a more profound extent. As a result, while the sport itself has a six-month season, baseball fans have grown accustomed to enjoying a twelve-month news cycle, and the Hot Stove League can approach the pennant races in excitement. It is no coincidence that the Baseball Prospectus website gets more traffic in March than it does in April, and more in November than it does in July.
5. Enlivening the History Books
The birth of the National League now predates that of the oldest living person, so there's nobody on earth who can claim to have seen every Hall of Famer play. If you look at the vigorous debate at places like the BBTF Hall of Merit, however, you wouldn't know the difference. Sabermetrics provides perspective, and that perspective can just as easily be applied to the past as to the present. Baseball has the richest history of any major sport, and while sabermetrics owes a great debt to that history - it helps to have 130+ years of observations to work with when you're developing a statistical model - that history owes an increasing debt to sabermetrics.
6. Now Geeks Can Play, Too
Each year, Baseball Prospectus takes internship applications and asks the candidates to submit short writing samples; it's likely that more than half of these writing samples will contain some reference to Theo Epstein. Most of us are not natural athletes, and although sabermetrics has probably not penetrated the industry to the point where the ex-jock/old boy's network culture has been irrevocably changed, it certainly opens up a career in the industry to a wider array of people than might have had access in the past. Keeping those sorts of dreams alive has to help with the sport's audience. And while relatively few of us will be fortunate enough to have a career in the industry itself, we're all able to experience the next best thing in the form of fantasy baseball, which has a mutually reinforcing relationship with sabermetrics.
7. Knowledge is Power
I don't want to sound like Richard Dawkins debunking the Santa Claus myth, but I believe there is inherent good in the pursuit of objective knowledge. Sabermetrics can occasionally demystify certain constructs that it might be pleasant to believe - like the existence of the Clutch Hitter, baseball's answer to Santa Claus - but is that necessarily a bad thing? And sabermetrics tends to spark new questions as well as resolve old ones. Perhaps the Clutch Hitter has been relegated to the status of the Loch Ness Monster, (or perhaps he hasn't), but sabermetrics has provoked us to look at things like player development and the relationship between pitching and defense in entirely different ways, just to name a couple.
What ultimately bothered me about Mr. Chass' article was its anti-intellectualism. Perhaps Chass would prefer that all knowledge about the game be disseminated by the Old Gray Lady on her stone tablets - "Thou Shalt Not Make the First Out at Third Base" / "Thou Shalt Not Worship False Statistics" - but the rest of us are having a lot of fun with this stuff, and we're building a better ballgame in the process.
Nate Silver is the Executive Vice President of Prospectus Entertainment Ventures; inventor of PECOTA, the BP projection system; and writes "Lies Damned Lies," a column about modern statistical analysis. He lives in Chicago.
| Designated Hitter | May 03, 2007 |
Was the 1990s Home Run Production Out of Line?
In the last five years, baseball fans have read and heard a lot of commentary from politicians and the media about what a travesty the home run totals have been since the mid-1990s. The average fan, having heard this mantra so much, has come to believe it is true. But is it?
In order to examine this question, we need a way to compare eras. Raw counting totals will not suffice. The method employed here is a "home run production rate." It is calculated not by dividing homers by at bats, similar to batting average, but by calculating how many circuit drives were hit per 500 plate appearances. The 500 plate appearance standard was chosen because the official minimum performance standard for individual batting championships as listed in rule 10.22(a) [in the 2007 edition of the rules] is 3.1 plate appearances times the number of games scheduled for each team. Thus, in the 162-game schedule, 502 plate appearances is the minimum, but that was rounded here to 500 for simplicity. The home run production rate will generate numbers that can be compared to other numbers that have some context for the reader, such as a 30-homer season by a batter.
Figure 1 shows a graph of the home run production rate for all major league players each year since 1919. One can easily see a gradual increase from 1919 to the present. The numbers in the charts do not represent the total homers hit in the major leagues for any one season but rather the home run production rate (homers per 500 plate appearances).
Figure 1 - Home Run Production Rate (1919-2006)
The fact that the home run production rate in the major leagues has increased steadily from 1919 to the present should not come as a surprise to many people. Many factors have affected the production rate, including rules changes, equipment changes and even some events outside of baseball. For a complete discussion of Figure 1, please read Home Run: The Definitive History of Baseball's Ultimate Weapon, from which the figure is taken.
Figure 2 adds a trend line to Figure 1 and this trend line shows the steady increase in home run production from 1919 through 2006. The movement of the rate line around the trend line documents the pendulum effect of the production through the years. The home run rate topped 10 for the first time in 1950 when it reached 10.7 homers per 500 plate appearances. It dipped below 10 in the next two seasons, but from 1953 through 1966 the production rate was above 10 each season. This time period is the bubble above the trend line about half way through the chart from left to right.
Figure 2 - Home Run Production Rate with Trend Line (1919-2006)
In 1994, the production rate reached 13.8 homers per 500 plate appearances, only the second time in history that the rate climbed above 13.0. From 1994 through the present, the production rate has been above the trend line with the exception of 2005. The highest point in the chart is 2000 when the production rate reached 15.0. However, it is evident from looking at Figure 2 that the period from 1950 through 1966 is further above the trend than is the period starting in 1994. Both periods follow time frames when the home run production rate was well below the trend line, further accentuating the explosion of homers in the following era.
As a side note about the last 13 years, Figure 3 shows the home run production rate from 1994 through 2006. The rate has held fairly steady through the period and, contrary to pronouncements by the commissioner, the production rate has not dropped in the years since Major League Baseball instituted its drug testing policy. This is clearly shown by Figure 3 as the rate has held steady since 2001, slowly undulating around the 14.0 per 500 plate appearance line.
Figure 3 - Home Run Production Rate (1994-2006)
Another series of negative comments made in the last few years concerns the number of players joining the 500 Home Run Club. From August 5, 1999 through June 20, 2004, five players joined the club: Mark McGwire (1999), Barry Bonds (2001), Sammy Sosa (2003), Rafael Palmeiro (2003) and Ken Griffey, Jr. (2004). That is five sluggers in about five years. Let's compare the period from September 13, 1965 through September 13, 1971. In those six years, seven players joined the 500 Home Run Club: Willie Mays (1965), Mickey Mantle (1967), Eddie Mathews (1967), Hank Aaron (1968), Ernie Banks (1970), Harmon Killebrew (1971) and Frank Robinson (1971). Thus, more players (seven) joined the club in six years during the late 1960s than the five who joined in the first part of the 21st century. These 12 sluggers are the players primarily responsible for the surge in the home run rate in the 1950s and the 1990s. Four hitters are poised to join the club in 2007: Frank Thomas, Alex Rodriguez, Jim Thome and Manny Ramirez.
It is clear that the production rate of the late 1990s is closer to the trend line than was the rate during the 1950s. Perhaps the emotional statements at the beginning of the twenty-first century are overblown and misleading, since they are not based on factual evidence but rather on conjecture, and are more inflammatory than informative.
SABR member David Vincent, the "Sultan of Swat Stats," is the recognized authority on the history of the home run. He is the author of Home Run: The Definitive History of Baseball's Ultimate Weapon, published by Potomac Books, Inc.
| Designated Hitter | April 19, 2007 |
More Fun With Enhanced Gameday
Enhanced Gameday is back for the 2007 season. The information presented in the XML files remain very similar from last year's playoffs, with a couple of additions. Two fields have been added: (1) break length, which is used to quantify the break of a pitch in a different way than the vector sum that was used in the playoffs and (2) break angle, which is used to indicate how the ball appears to the hitter as it approaches the plate. I'm still trying to figure those fields out and incorporate them into my analysis. Although the enhanced system is currently running in only eight stadiums, there are still a bunch of interesting things to study.
One thing I didn't have time to include in my first article was a look at how consistent pitchers are from start to start, in terms of movement on their pitches, their release point and pitch location. Ideally, I could look at many starts from a pitcher and find common features for good outings and bad ones. However, the season is only two weeks old, so I don't have more than a couple of starts from most pitchers, but two starts is better than no starts.
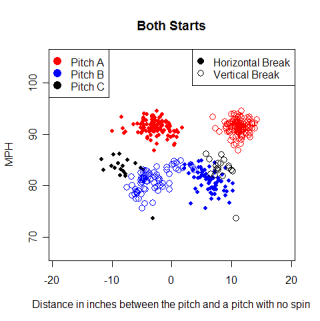 When a pitcher has an unusually good (or bad) outing, occasionally the reason given is that his pitches were "on" (or "off") that day. Part of a pitch being "on" is locating it for a strike, but the movement of a pitch is also important. The adjoining graph shows all the pitches that John Lackey made over his first two starts this season, colored by pitch type. Each pitch thrown is represented by two points. The solid circle is the break in the horizontal direction and the hollow circle is the vertical break. Looking quickly at the graph, you can tell that he threw pitches 'A' and 'B' much more than pitch 'C.' You can also see the different basic movement for each pitch. Pitch 'A' and 'C' both had the same relative movement, breaking 10 units vertically and less than 0 units horizontally.
Lackey's first two starts this season were good. On April 2, he pitched 5.0 innings, allowing four hits and giving up an unearned run. He also walked four batters and struck out five. On April 7, he went 7.0 innings and allowed seven hits and one run, while striking out six and not walking anyone. One thing I noticed from these graphs was that the movement on his fastball was very consistent in both starts. The vertical break was virtually identical, while the horizontal break was very close as well. Pitch 'C' was not as consistent however. He threw more of pitch 'C' in his first start than in his second one, and the horizontal break was also bigger by several units in the first start. The patterns of the clusters for pitch 'B' changed as well. I'm not sure what to make of the differences for pitch 'B,' but the biggest difference between Lackey's two starts was his ability to avoid walks in his second start, so maybe it impacted that somehow.
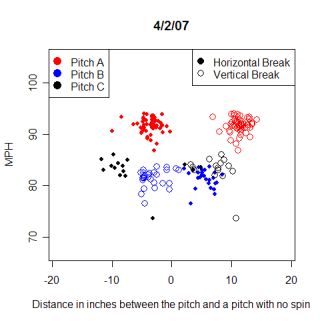
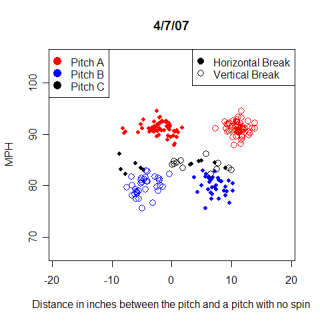
I'm also interested in how consistent the release point of a pitcher is. A visual of Lackey's release point for his two starts, colored by start, is presented below. This graph is a close-up of the release point graphs from my previous article, and shows how consistent a Major League pitcher can be with his release point. In his second start, he threw all but three pitches from a roughly 4.2x5.9" window. However, in his first start, the window was roughly 4.2x10.1". I haven't looked in-depth at other pitcher's release points over different starts, but releasing every pitch from an area the size of an index card would seem to be pretty consistent for a release point. My first thought on seeing the difference in release points was that it could have caused Lackey's wildness in his first start. However, of the 26 pitches in the first start that were thrown outside the smaller window, 12 were strikes and 11 were balls, with three put into play, so the difference in release point doesn't seem to impact balls and strikes.
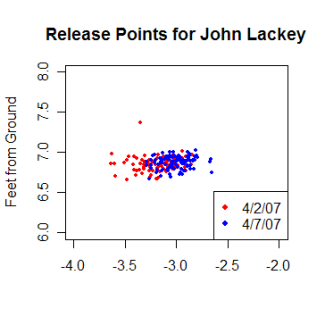
I read another analysis on release points at Lookout Landing, which measured the release point of Felix Hernandez as 1.6x3". I have release point data from Hernandez' season opening start versus the A's, so I can measure his release point too. Here's a visual of Hernandez' release points (below left), which shows he released his pitches in a roughly 11.3x7.1" box. While I found Hernandez to have a bigger release point window, I'd still say that releasing every pitch from a window the size of a piece of paper is consistent. The study from Lookout Landing only looked at when Hernandez threw a fastball and a curve, but even when I just look at fastballs, I still get an 8.6x5.6" window.
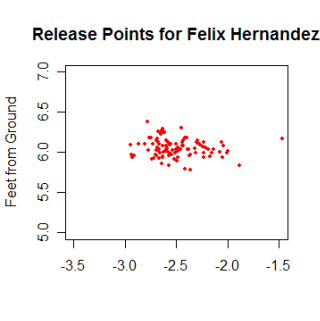
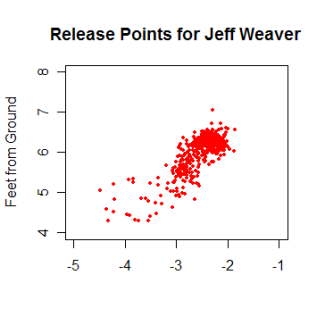
Regarding release points, being consistent isn't necessarily a good thing. Consistent mechanics would seem to lead to a consistent release point, but pitching machines have totally consistent release points and are designed to get hit hard by batters. Having a little variety is definitely a good thing, as it keeps the hitter guessing and prevents him from always looking for the pitch in a specific spot. Jeff Weaver might not be the best example of a good pitcher, but he has a release point that looks like the blast pattern of a shotgun. His release points from the 2006 playoffs are shown in the above graph on the right. Weaver had a successful run during the playoffs, so I would be interested in comparing this to his release points during a similar run of failure.
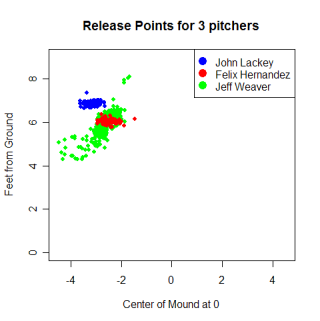
The consistency of pitch location is another feature of a pitcher's start that I want to analyze. The following two graphs illustrate the location of all of Lackey's pitches in his two starts, colored by the speed of the pitch. Both graphs are from the perspective of the catcher, and show the same basic pattern for pitches outside the strike zone. In both starts, he primarily threw pitches outside the strike zone to two places, what would be up and in for right-handed batters and low and away for right-handed batters. I imagine that these results suggest patterns that Lackey has with setting up hitters and how his pitches break. There are green dots, pitches that were 80-84 mph, in the lower right of each graph, while his fastball, which was in the 90-95 mph range, was never thrown below the strike zone. Both graphs also show a lack of pitches thrown at the top of the strike zone as well as inside to a lefty. These patterns could be chance events, but they also could be real decisions that Lackey made during his start. I would suspect that the handedness of the batter impacts the pitch selection and location, but Lackey hasn't thrown enough pitches to lefties to notice any change.
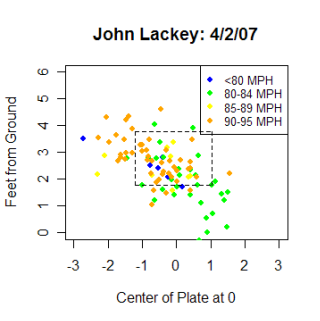
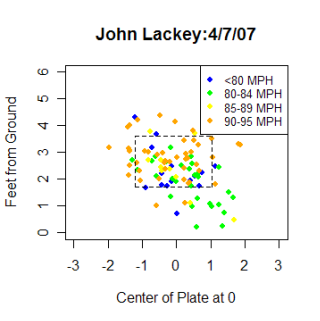
These next two graphs are more for fun than anything else right now. They are the same as the two above, except that they quantify the pitch density in different areas. The strike zone is the red square in the middle, and the numbers show the percentage of pitches thrown in each region of the strike zone by Lackey for that start. These graphs reinforce what the above graphs show, but are pretty cool to look at. With more data, the patterns in these graphs will become more statistically meaningful and could even be expanded to show BABIP for pitches in different sections of the strike zone.
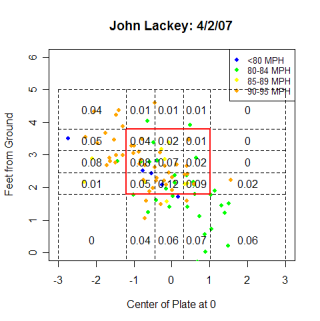
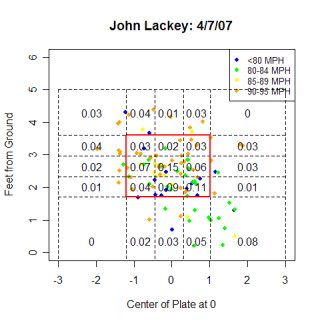
Joe P. Sheehan played baseball at Oberlin College and graduated in May 2006.
| Designated Hitter | April 12, 2007 |
An Ode to Sport
My problem began about ten or twelve years ago, while doing research for a story on Luis Tiant. Employing SABR's invaluable Baseball Index, I learned that Tiant had been profiled in the September 1968 issue of Sport. Being in no particular hurry, I spent a few weeks tracking down a used magazine supplier, forked out five or ten dollars, and soon got a big envelope in the mail.
When this issue was on the newsstands I was just entering the third grade; nonetheless, my baseball obsession was in full bloom. I might have seen this magazine in someone's house, admired the beautiful picture of Don Drysdale in mid-motion on the cover, and perhaps flipped through its pages. Years later, the excellent Tiant story ("The Most Popular Indian") helped me write the story I needed to write.
As an added bonus, I got the rest of the issue, which included profiles of Drysdale, Alex Johnson, and Ron Reed, and several stories on the current pitching domination, including one by pitcher-author Jim Brosnan. The Johnson profile (Earl Lawson's "A. J. of the Reds") was a fascinating early-career look at a troubled personality, and kindled an interest that led to my own story later on. Baseball articles carried the day, but there were a few football items (Lance Rentzel!), and stories centered around golf and billiards as well. And what sports magazine would be complete without the inevitable article on Jay Silvester ("A Discus Champ's Secrets")? The dense issue contained 16 features and several columns. This all cost 50 cents in 1968.
In the Sport Special, an acclaimed monthly feature, John Devaney wrote 6000 words (!) on Frank Howard, taking us through his childhood, his years in high school and at Ohio State, his days with the Dodgers, his current life with the Senators on and off the field, talks with various batting coaches about his evolution as a hitter, and insight from teammates, rival pitchers and managers, his family, and Howard himself. A fascinating story, wonderfully told.
Oh, and the pictures. From its very early days in the late 1940s, Sport always included several full page color photographs, very unusual even twenty years into its run, and they often found themselves carefully removed and placed in scrapbooks or on bedroom walls. The Luis Tiant photo is like one you would see on a baseball card of the era, a posed shot from the waist up on a sunny spring day, frankly as beautiful a picture I have ever seen of this well-photographed man, and I have seen plenty. If you are buying an old copy of Sport, know that there are plenty of issues out there with the pictures razor-bladed out.
So that, for me, was the start. A short time later, my Vern Stephens research led me to a couple of issues of Sport from the late 1940s. August 1949 was tough to find, as it included an outstanding Jackie Robinson cover story by Tom Meany, "Jackie's One of the Gang," and collectors love Robinson. The Stephens story (by Al Hirshberg) was the Sport Special, and provided a bountiful supply of first-hand perspective that I was looking for. Again, though, I spent just as much time with the rest of the magazine, especially a lengthy Grantland Rice piece called "What Makes A Young Ballplayer Great?" that profiled Larry Doby, Billy Goodman, Mike Garcia, and several others. Dan Parker's story on Yogi Berra ("He's a 'Character'") included a full-color shirtless shot of the young and (please forgive me) extremely buff Yankee backstop.
Although at first I had legitimate (ahem) research needs that required I track down these old magazines, I eventually learned to liberalize my rationale. If the September 1968 issue was so helpful, I wondered what treasures July would hold. Plenty, it turned out. That one included stories on Henry Aaron ("neglected superstar"), Hector Torres (former star of the Little League World Series, now an infielder with the Astros), the come-backing Tommy Davis, and Tony Conigliaro ("Don't Feel Sorry for Me," discussing his retirement from the game due to his eye injury). The AL managers participated in an exclusive poll to rank the players in the league at each position, one through ten. The best centerfielders, in order: Paul Blair, Reggie Smith, Joe Pepitone. That is worth knowing. The typically epic Sport Special explored the day-to-day life of the St. Louis Cardinals. And on and on.
Ebay has not only made buying easier, the free market has driven prices lower. Cutting to the chase, I now have more than 250 issues, including a complete run from 1956 to 1973, with magazines still showing up when I get a hankering for an early birthday present or two. Just today, in fact, I received the March 1954 issue with a gorgeous photo of Casey Stengel ("Man of the Year") staring at me. After reading it, I place it in its own plastic sleeve affixed with a sticker detailing the baseball articles contained within, and update my own spreadsheet catalog. If I want to read more on Alex Johnson - and who doesn't? - I can check out October 1969 or October 1970. Dave Johnson? July 1966. Lou Johnson? March 1966. Walter Johnson? November 1961.
Sport debuted in September 1946, its cover featuring Joe DiMaggio and four-year-old Joe Jr. sitting atop the Yankee dugout, its inside pages including the work of Grantland Rice, Tom Meany, and Jack Sher, a good start that would be bested many times. The book had four editors during its first thirty years: Ernest Heyn, Ed Fitzgerald, Al Silverman, and Dick Schaap, the latter three cutting their teeth as Sport writers for many years before taking over. Each editor had at his disposal a virtual Who's Who of the greatest sportswriters of the time, or of any time. In the June 1956 issue, pulling one out at random, Roger Kahn wrote a 10,000 word Sport Special on Willie Mays, and was joined in the issue by Red Smith, Al Silverman, Ed Linn, Frank Graham, and Frank Graham, Jr.
These men were not newspaper guys who were tossing off a story to Sport to get extra money. Many fine writers, including Kahn, Linn, Silverman, Schaap, Al Hirschberg, Arnold Hano, Lenny Shecter, and Al Stump, at times made their primary living writing as freelance feature writers, mainly for Sport and occasionally for general interest magazines like Saturday Evening Post or Look. Many of these articles, especially the Sport Specials, would take several weeks or months to put together.
Sport did not shy away from the biggest issues of the day. Furman Bisher wrote "What About The Negro Athlete In The South?" in May 1956, and the magazine regularly covered the uneasy integration of our country's fields and courts. Bill Veeck wrote several stories about various baseball ills and how to fix them, before and after his two wonderful books covering some of the same ground. Howard Cosell wrote a column for many years before he became a TV star. So did Joe Garagiola. Allan Roth contributed regular statistical pieces, decades ahead of his time. There were notes, letters, cartoons, a monthly quiz, book reviews, fashion profiles.
Better yet, there was a long-running monthly feature called "Campus Queen" highlighting a buxom young co-ed with a picture and a paragraph or two about her likes and dislikes. What else do you need? OK, fine, in September 1957 Gussie Moran, more or less the Anna Kournikova of the 1940s, contributed "Baseball's Ten Handsomest Men," a full-length feature with a full page color photo of the author with Jerry Coleman. The other nine, since you are dying to know, just got head shots: Bob Friend, Eddie Mathews ("the Tyrone Power of baseball"), Jimmie Piersall ("great depth in his face"), Gino Cimoli, Gus Bell, Bobby Avila ("he makes you think of moonlit nights south of the border," Vinegar Bend Mizell, Ray Boone, and Robin Roberts. My vote: Gussie, in a walk.
Most Sport articles focused on people, either strict profiles or stories that brought the reader closer to the lives of the performers. In the early years, baseball, boxing, and college football made up the bulk of the magazine, with professional football and basketball coming along later. There were usually two or three baseball stories in the winter, and six to ten in the summer months. By the late 1970s the magazine had fewer stories, and baseball's prominence in the magazine had dampened considerably. In December 1973 Sport published its first baseball-free issue.
I subscribed to Sport through my teen years in the 1970s, my first venture into a lifetime of magazine reading. Alas, during this period Sport gradually became less focused on telling stories and profiling people, and more interested in flash and glamour - part of a natural literary degradation that leads ultimately to ESPN The Magazine. Granted, the classic July 1977 Jan Stephenson cover was well received, but the magazine was no longer must-reading, and certainly holds little value to a researcher today. Sport hung around another couple of decades, finally expiring in 2000 without anyone much noticing.
We are supposed to believe that this kind of thing is inevitable, that a monthly sports magazine can not keep up with this new fast-paced world we live in. This view is unsatisfying. Sure the internet has a lot of high quality baseball writing if you know where to look, but the kind of story Sport specialized in has vanished. An internet writer can replace a newspaper columnist well enough, because the latter's press credentials afford little advantage when discussing whether a manager should be fired, or who belongs in the Hall of Fame, or the latest steroid scandal. But real feature reporting, writing 8,000 words with quotes from 20 players, managers, family members and friends, is not so easily done from the comfort of an office. No one is doing it any more because it is too hard. Sport delivered high-quality stories like this for 30 years.
There have been at least four Sport anthologies, and I suppose I could satisfy some of my hankering by just reading those. Al Silverman's "The Best of Sport, 1946-1971" (Viking, 1971) is over 600 pages of small print, and is packed with great writers and great writing. But really, the 46 articles contained there, many of them several thousand words long, add up to about three or four issues worth. More to the point, it is not a magazine.
As you can likely tell, I like magazines - I like holding them, looking at the pictures, skipping articles, returning to them later. I read them on airplanes, on hotel beds, in tents, at the beach, but mostly these days in my big green chair. Although I now get most of my news (baseball and otherwise) from the internet, I get my real cultural insight from the New Yorker and Atlantic Monthly. But what I wouldn't do for the return of Sport, 12 issues a year.
Mark Armour is a software developer and baseball writer in Corvallis, Oregon. Among other projects, he is working on a biography of Joe Cronin.
| Designated Hitter | April 05, 2007 |
Estimating Baseball's All-Time Worm Burners
We at the Hardball Times like to track a lot of new age stats. Line drives, zone rating, groundball percentage - all those numbers allow us to evaluate today's players more accurately and with a breadth of information at our disposal.
But often, it's tough to understand what those numbers really mean because they have only become available over the past few years. So Derek Lowe allows groundballs on two-thirds of all balls in play, but what does that really mean? Is he the greatest groundball pitcher of all-time, or have there been better worm burners?
Unfortunately, due to lack of data, this is not a question we can answer directly. But I think I have come up with a method to do so indirectly.
My first step was to run a regression using regular statistics that are available throughout history and groundball percentage, which we have for the past few years. Three variables turned out to be highly significant:
- Batting Average on Balls in Play. Groundballs become hits at a higher rate than fly balls, and so groundball pitchers allow more hits on balls in play.
- Home Runs. Kind of an obvious one; home runs come on fly balls, so pitchers who allow a lot of home runs also generally allow many fly balls.
- Strikeouts. Strikeouts are negatively correlated with groundballs. Frankly, I am a bit skeptical of this association because it seems to unfairly label very high-strikeout pitchers like Randy Johnson or Pedro Martinez as fly ball pitchers, but it does make a lot of sense. Strikeout pitchers generally pitch up in the zone, resulting in a lot more whiffs, but also more fly balls.
The correlation between predicted groundball percentage and actual was very good, with an "r" of .47. With a weighted average of just 371 batters faced in the sample, what that means is that after four-to-five seasons, the correlation should be around .9, or almost perfect.
Again, I should point out that model is slightly biased towards pitchers who strikeout a lot of hitters, but beyond that, it is very solid. Among those for whom we do have data, the guys at the top of the predicted career groundball percentage list are indeed groundball pitchers, and the guys at the bottom indeed do allow a lot of fly balls.
So now for the fun: Who are the greatest groundball pitchers of all-time? To determine this, I first adjusted each statistic that goes into the predicted groundball formula for the league average. Because batters faced data is shoddy for the first 45 years of professional baseball, I only used data from 1916 on, so 19th and early-20th century guys are excluded. Actually, that's probably for the best, because I'm not sure how well the formula I devised would hold up in that time period.
In the chart that follows, I have listed two statistics: "Index," which is sort of like ERA+, except for groundballs, and "SD+," which measures how many standard deviations above average the player was for his career. I figure that the slightly more math-inclined may appreciate "SD+" a bit more than "Index."
First   Last        Debut   Index    SD+
Rube    Foster      1913    1.14     4.01
Doug    Sisk        1982    1.12     3.38
Ed      Klepfer     1911    1.12     3.36
Aaron   Cook        2002    1.10     2.96
Pat     Clements    1985    1.09     2.59
Dale    Murray      1974    1.09     2.50
Greg    Minton      1975    1.08     2.45
Benny   Frey        1929    1.08     2.41
Frank   Linzy       1963    1.08     2.39
George  Cunningham  1916    1.08     2.37
(Minimum 1,000 batted balls between 1916-2005.)
Ladies and gentlemen, Rube Foster is your winner! He allowed 14% more groundballs than the league average pitcher during his career (well, excluding its first three years, which actually means we're looking at just two years of data). In over 300 innings in 1916-17, Foster did not allow a home run, though admittedly, his team, the Boston Red Sox, allowed just 22 over those two years.
We actually do have some data for Doug Sisk, and it turns out that between 1980 and 1997, he was the fourth-most extreme groundball pitcher in baseball. That's a pretty big feather in our system's cap!
On the Ultimate Mets Database website, one commenter had this to say about Sisk: "The only man I know that would load the bases with no one on and one out just to throw a double play grounder." Reminds me of Derek Lowe...
We also have actual groundball data for Aaron Cook. Last year, Cook was third in the National League in groundball percentage; had he qualified, he would have been third in 2005 as well.
Let's now turn to the pitchers who have allowed the fewest groundballs in baseball history, on a percentage basis:
First   Last        Debut   Index    SD+
Jack    Coombs      1906    0.87    -3.69
Bill    Caudill     1979    0.88    -3.60
Wayne   LaMaster    1937    0.88    -3.56
Al      Jurisich    1944    0.88    -3.48
Allan   Russell     1915    0.88    -3.47
Armando Benitez     1994    0.88    -3.35
Herb    Score       1955    0.89    -3.22
Troy    Percival    1995    0.89    -3.19
Luis    DeLeon      1981    0.89    -3.18
Oliver  Perez       2002    0.89    -3.18
(Minimum 1,000 batted balls between 1916-2005.)
Most of Jack Coombs' career came in years before our database starts, but in 1916-17, when Foster allowed a grand total of zero home runs, in fewer innings, Coombs allowed 10. Given that he played in a park that was neutral for home runs, Coombs seems like a pretty safe choice to be a fly ball pitcher.
For the guys for whom we have data, Perez posted a 30.1% groundball percentage last season, while Benitez allowed groundballs on 32.2% of all balls hit off him. Had they qualified, Perez and Benitez would have placed second and third from the bottom in groundball percentage last year, respectively.
If you're interested in seeing more new age statistics extended into the past, you can click here to download a spreadsheet with estimated groundball rates for all pitchers with 1,000 batted balls allowed between 1916 and 2005.
David Gassko is a writer for The Hardball Times and Heater Magazine. He welcomes comments via email.
| Designated Hitter | March 29, 2007 |
Enhanced Gameday
MLB.com's Gameday application is a blessing for people trying to follow out of market games. It's easy to use and clearly presents play-by-play information about the game. That's why I was excited when Enhanced Gameday debuted during the 2006 playoffs. Enhanced Gameday keeps the basic aspects of Gameday and adds detailed Type/Location/Velocity information about each pitch. I'm not entirely sure how the application works, but the basic idea is that high-speed cameras and motion-capture software track every pitch and determine various data points for each pitch.
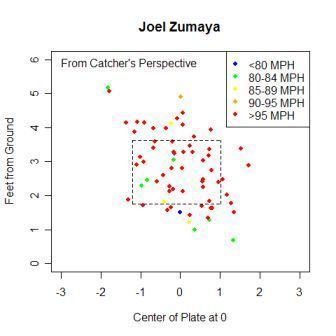 If you're motivated to sift through the XML, you can do tons of neat things with this data. Joel Zumaya was my motivation to sift through the XML. Like many other people during the playoffs, I was captivated by Zumaya's ability to throw baseballs harder than anyone I had ever seen. According to Gameday, there were 23 pitches thrown faster than 100 MPH in the playoffs, and Zumaya threw 15 of them. (Amazingly, Justin Verlander threw the other eight.) The Guitar Hero's fastest pitch left his hand at almost 105 MPH and his average velocity during the playoffs was 96.6 MPH.
Obviously Zumaya can throw hard, but where were those pitches going? This graph shows where he threw all of his pitches, with each pitch colored by speed, along with an estimated strike-zone. The angle for this graph is from the catcher's perspective, similar to here. From this graph you can clearly see Zumaya's reliance on his fastball and that he struggled to consistently throw it for strikes.
Zumaya appeared to have a one pitch plan when he was attacking hitters, but what about someone who can't just rely on speed to retire hitters? How did Kenny Rogers go after batters? Here are velocity graphs for Rogers, split up by batter handedness. Rogers threw 87 pitches to left-handed batters and 162 to righties. He appeared to pound the outside part of the plate when facing both types of hitters and seemed focused on not coming inside and over the plate to righties. He also threw different off-speed pitches on the outside part of the plate, depending on the handedness of the batter. Lefties got a slower off-speed pitch, which consistently missed the strike-zone, as if he were tantalizing the hitter to chase a ball. Righties faced an off-speed pitch that was closer to the strike-zone. While these graphs are interesting, they aren't showing anything new.
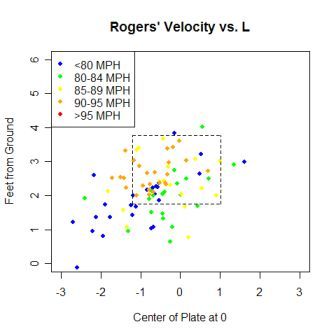
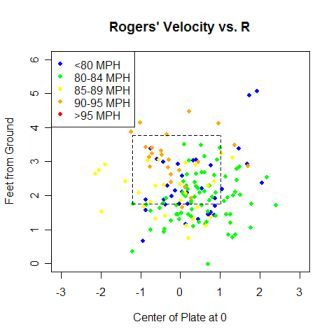
Information pinpointing the release points of pitchers is also included in the XML files. To my knowledge, accurate information regarding release points has never been available to the public. This graph shows the release point for Barry Zito, compared with all other pitchers who appeared in the 2006 playoffs. Zito's bizarre BABIP patterns have been discussed at Inside the Book and Catfish Stew. Perhaps one reason for these weird splits is Zito's release point, which is closer to that of a right-hander than a left-hander. Chad Bradford's inclusion on the graph emphasizes how different he is from a "normal" pitcher. Even Cla Meredith, who has the second lowest release point, is more than two feet higher than Bradford.
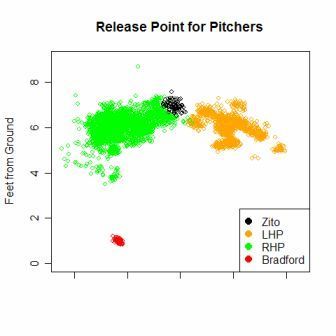
Here are the release points for four individual pitchers. Besides Zito, another interesting thing on this graph is the two distinct release points for Mike Mussina. Rogers and Chris Carpenter both had pitches where they changed their release point, but Mussina appears to have two deliberate release points. The release points for Mussina changed depending on the type of pitch that he threw.
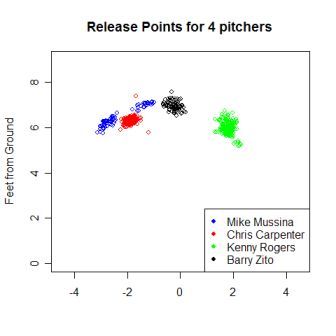
In order to classify what pitches Mussina threw, you need the horizontal and vertical "break" values given for every pitch. According to the Enhanced Gameday blog, break is defined as "the measurement of the distance between the location of the actual pitch thrown over the plate, and the calculated location of a ball thrown by the pitcher in the same way, with no spin." No measurement scale is given, but every pitch has a "fingerprint" consisting of its speed and two breaks, which identifies how the pitch spun through the air en-route to home plate. These fingerprints can be used to identify pitch types. Not every fastball will be exactly 89 MPH, with exact breaks, but all fastballs from a pitcher are going to have similar speeds and breaks, which are different compared to the speed and breaks for a curveball from that pitcher.
This graph shows the horizontal and vertical breaks vs. speed. The blue dots show the horizontal break for every pitch, while the red dots represent the vertical break. Each pitch has two dots, and from the graph, you can pick out clusters of Mussina's pitches.
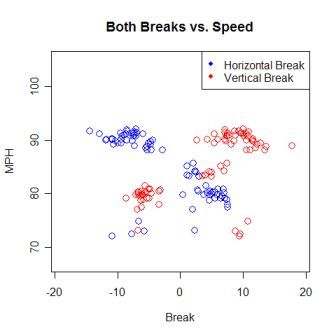
Here's the same graph, but with each type of pitch colored differently. Mussina has four pitches, two of which, B and C, he threw exclusively from his higher arm slot. The second graph is a close up of Mussina's release points, colored by the pitch type.
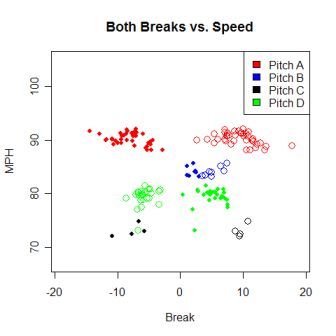
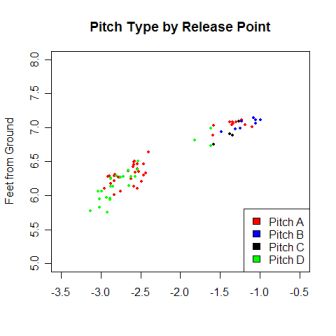
Once the pitches are classified, you can examine the "stuff" of a pitcher, and how he uses each pitch. I only have data for 75 pitches from Mussina, so I'm going to use Kenny Rogers again. I have data about 249 pitches for Rogers and he threw four types of pitches, shown in the graph.
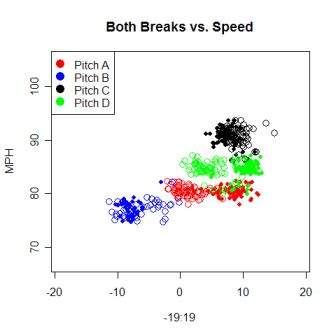 Rogers threw pitch A 68 times, and was able to have the batter swing and miss 11 times (16%), the highest percent of any of his pitches. Granted this is too small a sample to really mean anything, but pitch A could be Rogers' strikeout pitch. With a full season of data, you could establish not only which pitcher is the best at creating swings and misses (or ground balls or poorly hit balls or whatever), but which pitch they are using to get those results.
The biggest problem with the data currently is that it is incomplete. For whatever reason, Gameday didn't have data for every playoff game, either missing the game completely or just missing certain innings in the game. The recording of data did get more reliable as the playoffs progressed. Hopefully that is fixed for the 2007 season.
The other problem is that there is only one month worth of data. There just isn't enough information from this trial run to make any definitive statements. Mussina made only one start in the playoffs, so the dual release points could have just been a coincidence. Barry Zito could have been struggling with his delivery in his starts, so his release point might actually resemble that of a typical lefthander. This analysis is just scratching the surface of what Gameday has to offer. With more than a month of data, you could better visualize how pitchers approach left-handed hitters compared to right-handed hitters, see which pitcher has the most movement on his pitches, see which pitch is the hardest to make contact with or hit hard or hit in the air, and possibly even expand the analysis to hitters as well.
Here's the link to the XML from Kenny Rogers' start vs. the Yankees in the ALDS. The web directory is organized intuitively, and with a little poking around, you can find the XML files for any playoff game. There's a lot more information contained in these XML files that I didn't use in any of the graphs in this article because I wasn't able to figure out what it meant. If you have any ideas about what parts of this information may mean, I'd love to hear from you.
Joe P. Sheehan graduated from Oberlin College last May. A 22-year-old Red Sox fan, Joe would like to work for a MLB team. He played baseball at Oberlin and has followed the game for as long as he can remember. He is not to be confused with the Joe Sheehan of Baseball Prospectus.
| Designated Hitter | March 22, 2007 |
When Titans Clash
On May 28, 1968, the Giants and Cardinals squared off on a Tuesday evening in St. Louis, with a future Hall of Famer starting for each club: Bob Gibson for the Cardinals and Gaylord Perry for the Giants. Despite the early-season date, this matchup could have been considered key: the Giants were sitting atop the NL standings by a single game, with the Cardinals right behind them. The Giants had finished in second place three years running and were looking to take the pennant, for a change. The Cardinals were coming off a World Series Championship in 1967 and looking to repeat.
Gibson, of course, had his epic year in 1968, posting an ERA of 1.12 while throwing an amazing 13 shutouts. The tall right-hander was probably the most impressive figure on the field that day, but let's not forget about the Giants' elder statesman, a guy by the name of Willie Mays. Mays, at the age of 37, had a fine season himself in that Year of the Pitcher, finishing 3rd or 4th in the NL in OBP, SLG, OPS and OPS+. He was also selected to the All-Star team and won a Gold Glove. He was still a force to be reckoned with, let there be no doubt about that.
The game was tied at 1-1 in the seventh inning, when Mays strode to the plate to face Gibson. Gibson had retired the first 15 Giants he faced, including Mays on a groundout and called strikeout. A home run by Giants catcher Dick Dietz had tied it in the sixth inning, though, and now there was a runner on first and nobody out. This was a classic confrontation: two future Hall of Famers, the power pitcher versus the slugger. They say good pitching beats good hitting, but not this time: Mays deposited a Gibson fastball into the bleachers, giving the Giants a 3-1 lead, which ended up being the final score.
So, this time Mays got the better of Gibson, but aren't you curious about how these two immortals fared against each other over the course of their careers? Well, thanks to Retrosheet, we know what happened in Mays v. Gibson. Not to mention Aaron against Koufax, Schmidt versus Seaver, and all the greats who faced off during the Retrosheet years.
I looked at the results of all batter/pitcher matchups for all players who were voted into the Hall of Fame by the BBWAA since 1972. This puts us squarely in the Retrosheet era, which goes back to 1957 (Retrosheet also has data for NL games of 1954). For players who played most of their careers in one league, there are enough plate appearances in individual matchups to make this exercise interesting. For example, Hank Aaron batted against Don Drysdale 246 times in his career. If I require at least 50 PAs, I find 174 Hall-of-Fame batter/pitcher pairs. Let's have a look at a few of those, shall we?
Willie versus Hoot
We know that Mays got the best of Gibson in the game described above. But what happened when these two Inner-Circle Hall of Famers faced off during the rest of their careers? The Retrosheet period covers all of Bob Gibson's big league career (1959-1975). So, (except for a possible missing game here and there), we have a record of all the Gibson-Mays matchups: from their first encounter on September 7, 1959, when the rookie Gibson sent the superstar Mays down on strikes; to their final meeting in August 1971 with Gibson again getting the best of Mays, who flied out to center field.
Here's the career line for these two Titans:
Mays vs. Gibson, career
+------+------+------+------+------+------+-------+-------+-------+-------+
| AB   | H    | HR   | RBI  | SO   | BB   | AVG   | OBP   | SLG   | OPS   |
+------+------+------+------+------+------+-------+-------+-------+-------+
|   92 |   18 |    3 |    9 |   30 |   17 | 0.196 | 0.321 | 0.304 | 0.625 |
+------+------+------+------+------+------+-------+-------+-------+-------+
Looks like Gibson really had Willie's number over the years. This was Mays' worse performance against the Hall of Fame pitchers in my sample. It's not Gibson's best performance though: he held Tony Perez to just 7 hits and 2 walks with 28 strikeouts in 64 plate appearances. That translates to line of .121/.141/.190 for the Hall of Fame first baseman. Owie!
Tom Terrific faces Michael Jack
Tom Seaver is five years older than Mike Schmidt and the Hall of Fame pitcher reached the big leagues five years before the greatest third baseman who ever lived. Still, their time in the National League together lasted 12 seasons and they faced off many times. Things did not start off well for Schmidt against Seaver. In their first game together, on September 4, 1973, the established star Seaver struck out the rookie Schmidt three times. When the two squared off again nine days later, Schmidt's woes with Seaver continued: in five trips to the plate, he only managed a sacrifice bunt. Schmidt whiffed his other four trips to the plate.
Things did not improve all that much over the years, as Seaver handled the Phillies third baseman fairly easily over their career meetings:
Schmidt vs. Seaver, career
+------+------+------+------+------+------+-------+-------+-------+-------+
| AB   | H    | HR   | RBI  | SO   | BB   | AVG   | OBP   | SLG   | OPS   |
+------+------+------+------+------+------+-------+-------+-------+-------+
|   85 |   16 |    2 |    5 |   35 |   15 | 0.188 | 0.301 | 0.294 | 0.605 |
+------+------+------+------+------+------+-------+-------+-------+-------+
Does this mean that the old saw is true, that good pitching really does beat good hitting? Before making any hasty pronouncements, let's look at our next Hall of Fame couple.
Johnny Bench vs. Steve Carlton
On September 15, 1967, nineteen-year-old Johnny Bench singled off Steve Carlton, a youngster himself at 22 years, despite pitching in his third major league season. Lefty did not let that first meeting rattle him, though, and he retired the young Reds catcher 15 of the next 17 times they met. But Bench would turn things around against Carlton and had a pretty good game against the southpaw on July 26, 1970, when he hit three home runs off the four-time Cy Young Award winner.
Bench continued his successful ways against Carlton, ending up with this very nice line against the first ballot Hall-of-Famer:
Bench vs. Carlton, career
+------+------+------+------+------+------+-------+-------+-------+-------+
| AB   | H    | HR   | RBI  | SO   | BB   | AVG   | OBP   | SLG   | OPS   |
+------+------+------+------+------+------+-------+-------+-------+-------+
|  124 |   37 |   12 |   30 |   20 |   26 | 0.298 | 0.412 | 0.645 | 1.057 |
+------+------+------+------+------+------+-------+-------+-------+-------+
Willie, again, vs. Spahnie
Everybody knows how Willie Mays struggled when he was first called up to the big leagues. Mays was destroying Triple-A pitching in Minneapolis, as his .477 batting average attests, when he was called to New York. He struggled at the start, though, going 0 for his first eleven at bats and 1-for-27. I knew about Willie's initial struggles at the plate early in my life because whenever I was down about my (it must be admitted) feeble Little League hitting, my dad would remind me about Willie's 1-for-27 at the start of his career.
What Dad never mentioned, though, was that the hit was a home run, and off a future Hall-of-Famer, to boot. Warren Spahn remembers the blow in Vincent Fay's The Only Game in Town.
Willie Mays got his first base hit off me. Willie Mays got his first home run off me. Same pitch. So I realized before the rest of the league that he was going to be a good hitter. And over the years I think Willie hit more home runs off me than anybody.Mays ended up with a pretty nice line against Spahn:
Mays vs. Spahn, career
+------+------+------+------+------+------+-------+-------+-------+-------+
| AB   | H    | HR   | RBI  | SO   | BB   | AVG   | OBP   | SLG   | OPS   |
+------+------+------+------+------+------+-------+-------+-------+-------+
|  158 |   43 |   13 |   32 |   12 |   15 | 0.272 | 0.328 | 0.551 | 0.878 |
+------+------+------+------+------+------+-------+-------+-------+-------+
Not as good as his career numbers (.302/.384/.557), but not bad considering the opposing pitcher. Of course, the main period of overlap (1957-1965) falls more in Mays' prime than in Spahn's. By the way, those 13 home runs are the second most by anybody in my sample. Hank Aaron hit 17 home runs off Don Drysdale, although it took him 218 plate appearances to do so. I'll have more on Hammerin' Hank in a bit.
Ernie Banks vs. Sandy Koufax
Both Banks and Koufax had ups and downs in their great careers and I was curious to see how they matched up. Koufax, as everybody knows, was plagued by wildness for roughly the first half of his career, but became one of history's best pitchers in the period 1961-1966. He retired at age 30 while still at the top of his game. Ernie Banks, one of the few players in history to win back-to-back MVP awards, did that in 1958-1959, when Koufax was still a league-average pitcher. Mr. Cub's decline phase started around 1962 or so (he moved from shortstop to first base that year), just when Koufax was becoming the best pitcher in the game.
Their first meeting (as recorded by Retrosheet) occurred on April 30, 1957, when the 21-year-old left-hander, pitching in relief, faced the Cubs slugger in the ninth inning with a runner on first, one out and the Dodgers down by a run. Banks went down on strikes and Koufax ended up throwing two innings of scoreless relief, allowing the Dodgers to come back and win the game in 10 innings. The winning blow? A home run by shortstop(!) Don Zimmer.
Another memorable matchup between these two first ballot Hall-Of-Famers occured on September 9, 1965. Koufax faced Banks three times that game and each time he struck out the Cubs first baseman. Ron Santo also had a tough time against Sandy that day, as did Billy Williams and all the rest of the Chicago hitters, none of whom reached base against the Dodger pitcher. This was, of course, Koufax's celebrated perfect game.
Overall Koufax dominated Banks in their matchups:
Banks vs. Koufax, career
+------+------+------+------+------+------+-------+-------+-------+-------+
| AB   | H    | HR   | RBI  | SO   | BB   | AVG   | OBP   | SLG   | OPS   |
+------+------+------+------+------+------+-------+-------+-------+-------+
|  127 |   21 |    7 |   18 |   31 |   10 | 0.165 | 0.226 | 0.362 | 0.588 |
+------+------+------+------+------+------+-------+-------+-------+-------+
Best Performances
I think the best performance by a hitter in these HoF batter-pitcher matchups has to go to Hank Aaron against Koufax:
Aaron vs. Koufax, career
+------+------+------+------+------+------+-------+-------+-------+-------+
| AB   | H    | HR   | RBI  | SO   | BB   | AVG   | OBP   | SLG   | OPS   |
+------+------+------+------+------+------+-------+-------+-------+-------+
|  113 |   42 |    7 |   16 |   12 |   13 | 0.372 | 0.437 | 0.664 | 1.100 |
+------+------+------+------+------+------+-------+-------+-------+-------+
To me, this is an amazing batting line, considering the lower run scoring environments typical when Aaron and Koufax were facing each other. Of course, the most impressive thing about Aaron's line is the quality of the opposing pitcher, Sandy Koufax.
My award for the best pitching performance in a HoF matchup goes to Catfish Hunter versus Frank Robinson.
Frank Robinson vs. Catfish Hunter, career
+------+------+------+------+------+------+-------+-------+-------+-------+
| AB   | H    | HR   | RBI  | SO   | BB   | AVG   | OBP   | SLG   | OPS   |
+------+------+------+------+------+------+-------+-------+-------+-------+
|   98 |   15 |    2 |    7 |   17 |   10 | 0.153 | 0.231 | 0.265 | 0.497 |
+------+------+------+------+------+------+-------+-------+-------+-------+
Hunter was elected to the Hall of Fame in 1987 (his third year on the ballot) and many consider him to be a marginal candidate at best. I don't want to get into that discussion here, but rather just note that he really handled first ballot HoFer Frank Robinson pretty easily, didn't he? The amazing thing about the above line is the number of home runs. Robinson hit 586 home runs in his career and Hunter seemingly surrendered as many (the actual number is 374). Yet, incredibly, Hunter surrended just two round trippers to Robinson in over a hundred plate appearances. And he didn't give up much else either, as you can see from the line above.
Good pitching beats good hitting?
I didn't really set out to answer this question, but after looking at these Hall-of-Fame matchups, I think I have to agree with Casey Stengel, who said, "Good pitching beats good hitting, and vice versa."
John Walsh is a regular contributor to the Hardball Times. He welcomes comments via email.
| Designated Hitter | March 15, 2007 |
Quantifying Coachers, Part II
"The main quality a great third base coach must have is a fast runner." - Rocky Bridges, California Angels coach
"It's frustrating. Your job is not to get in the way of a rally." - Rich Donnelly, Dodgers third base coach after Game 1 of the 2006 NLDS
Most readers will remember what was perhaps the strangest play of the 2006 postseason and for Dodger fans that memory is not a happy one. With runners on first and second and nobody out in the top of the second inning, Dodgers rookie Russell Martin took an inside out cut at a 2-1 fastball from the Mets John Maine and drove it deep to right field. Jeff Kent, the runner on second, apparently didn't see the ball immediately and got an extremely poor jump while J.D. Drew at first base read that the ball was over the head of right fielder Shawn Green and began motoring for second. With Kent finally underway and Drew close on his heels, Green played the ball perfectly off the wall on one hop, relayed to Jose Valentin who threw a one-hopper to Paul Lo Duca just in time to nip a diving Kent at the plate. In the meantime, Drew had not slowed at all and upon turning around a surprised Lo Duca was able to put down the tag as Drew also attempted a head first slide. The result was a double play which proved huge in a 6-5 Mets win.
After the game Dodgers third base coach Rich Donnelly noted that he didn't want to send Kent but saw that with Drew close behind, he'd likely end up with two runners on third and at that point he was hoping for a botched throw. And for some reason, perhaps their proximity or his attention focused on the lead runner, Donnelly did not or was unable to give the stop sign to Drew.
As you'll recall, in part I we laid the groundwork for measuring the contribution of third base coaches (or "coachers" as they were originally termed in the 1870s) in the dimension of waving runners around. This time we'll revisit that framework to make an adjustment for team quality and then attempt to answer the question of whether there is a repeatable skill involved in this aspect of the game.
Contextual Matters?
We left off with the question of whether it is really fair to assign all of a team's baserunning (even the subset of plays discussed in part I) to the third base coach's influence? Keep in mind that failing to advance as frequently as the average runner in various situations, as well as getting thrown out, will both depress EqHAR with the latter being much more costly than the former. Even so, it could be the case that Joey Cora of the White Sox was saddled with extremely slow runners who didn't advance as often as they should or runners who don't take direction very well and run through his signs or even who simply don't hustle. And Dino Ebel of the Angels may be, and in fact is, blessed with a Chone Figgins who regularly scoots home on singles and doubles and never gets caught (Figgins was not thrown out in 56 opportunities and recorded the highest individual EqHAR at 4.93 in 2006).
Because this metric is dependant on the personnel a coach has to work with, an additional step is warranted that acknowledges that dependency. This step involves comparing the opportunities that coaches can be said to have some control over with ones that they do not. If a team is populated with poor baserunners who have trouble advancing or regularly get thrown out in situations where the coach is a spectator, one might argue that those opportunities should serve as the baseline with which we judge the coach. Table 2 shows the results of this recalculation by including the "non-coach" EqHAR opportunities and then including a final column that is the ratio of the Rate for opportunities the coach has influence over to the Rate for the opportunities for which they do not.
Table 2: Third Base Coaches in 2006 Ordered by Ratio
                            Coach         Non-Coach
Team   Name                 Opp   Rate    Opp     OA  EqHAR   Rate  Ratio
TBA    Tom Foley            163   1.15    313     12   -6.6   0.80   1.44
PHI    Bill Dancy           262   1.15    329      5   -1.2   0.96   1.20
BAL    Tom Trebelhorn       296   1.01    400      8   -6.1   0.84   1.20
SFN    Gene Glynn           220   0.95    346      6   -4.7   0.84   1.13
CLE    Jeff Datz            274   0.99    400      7   -3.4   0.91   1.09
SDN    Glenn Hoffman        231   1.00    348      7   -3.2   0.91   1.09
TOR    Brian Butterfield    237   0.99    387      9   -2.9   0.92   1.08
NYN    Manny Acta           228   1.05    293      4   -0.6   0.98   1.07
MIL    Dale Sveum           214   1.01    329     11   -1.7   0.95   1.06
ANA    Dino Ebel            238   1.19    373      9    5.2   1.13   1.06
CHA    Joey Cora            234   0.86    404      9   -7.5   0.81   1.05
COL    Mike Gallego         247   1.03    359     12   -0.8   0.98   1.05
OAK    Ron Washington       245   0.89    372     10   -6.0   0.85   1.04
WAS    Tony Beasley         239   1.03    314      9   -0.3   0.99   1.04
KCA    Luis Silverio        237   1.04    400     13    0.7   1.02   1.02
BOS    DeMarlo Hale         248   0.86    424      8   -7.6   0.85   1.01
SEA    Carlos Garcia        226   0.97    377     13   -0.2   1.00   0.97
SLN    Jose Oquendo         230   0.98    375      9    1.0   1.03   0.95
ARI    Carlos Tosca         275   1.01    332      5    2.0   1.07   0.95
DET    Gene Lamont          240   1.10    362      3    5.5   1.16   0.95
NYA    Larry Bowa           289   0.93    410      3   -0.2   1.00   0.94
PIT    Jeff Cox             230   0.98    399      2    1.8   1.04   0.93
LAN    Rich Donnelly        260   0.90    370     10   -1.0   0.97   0.92
CIN    Mark Berry           217   0.98    315      4    2.4   1.08   0.91
HOU    Doug Mansolino       214   1.11    344      1    7.6   1.23   0.91
TEX    Steve Smith          234   0.95    410      9    2.5   1.06   0.90
ATL    Fredi Gonzalez       231   0.94    362      6    2.5   1.06   0.89
MIN    Scott Ullger         222   1.01    452      8    6.6   1.14   0.88
FLO    Bobby Meacham        199   1.05    359      5    8.3   1.24   0.84
CHN    Chris Speier         199   0.94    350      3    7.2   1.22   0.77
Under this second measure Cora moves from 30th to 11th by virtue of his team racking up a very poor EqHAR of -7.5 and rate of 0.81 in opportunities that Cora had little or no influence over. When comparing the 0.81 rate in his coach-influenced opportunities to 0.86, Cora comes out at 1.05 thereby slightly outperforming his team.
In Table 2 Washington and Gonzalez both look a little better while Speier and Florida's Bobby Meacham fall by virtue of their respective teams performing quite well in non-coach opportunities at 1.24 for the Marlins and 1.22 for the Cubs. And what of the Angels Ebel who came out on top in Table 1 in part I? He slides to 10th since the Angels recorded a very respectable 1.13 rate in non-coach opportunities while Tom Foley of the Devil Rays takes the top spot since his team performed so poorly in other opportunities (-6.6, 0.80) and so well when he was likely involved (5.3, 1.15).
This metric can be expanded to encompass multiple seasons and therefore a larger view. Table 3 shows these metrics for each of the 74 third base coaches employed from the beginning of the 2000 season through 2006.
Table 3: All Third Base Coaches 2000-2006
Name                     Opp     OA  EqHAR   Rate    Opp     OA  EqHAR   Rate  Ratio
Billy Hatcher            387      6    5.1   1.06    573     21  -12.3   0.78   1.35
Bill Dancy               527     15    3.4   1.04    737     17  -11.3   0.84   1.23
Michael Cubbage          494     12    4.7   1.05    706     15  -11.1   0.85   1.23
Lance Parish             189      5    0.9   1.02    243      8   -3.7   0.84   1.22
Cookie Rojas             221      5   -0.2   1.00    268      9   -4.6   0.83   1.20
Terry Bevington          439     12   -3.4   0.96    544     11   -9.2   0.82   1.17
Bobby Floyd              173      5   -2.7   0.93    316      8   -6.0   0.81   1.15
Jack Lind                211      2    4.7   1.10    273     10   -0.9   0.96   1.14
Tom Foley               1056     20   14.0   1.07   1609     43   -8.5   0.95   1.13
Dave  Myers              986     16    7.7   1.04   1463     35  -10.7   0.92   1.12
Al Pedrique              223      2    5.3   1.11    308      4   -0.3   0.99   1.12
Juan Samuel              626     11    7.3   1.05    976     23   -3.9   0.95   1.11
Wendell Kim              624     20  -14.7   0.88    980     34  -19.5   0.80   1.10
Jeff Datz                274      5   -0.7   0.99    400      7   -3.4   0.91   1.09
John Russell             672     19   -1.5   0.99   1096     24  -10.0   0.91   1.09
Mike Cubbage             244      7   -1.3   0.97    310      8   -2.8   0.91   1.08
Jim Riggleamn            270      7   -2.0   0.96    308     11   -3.5   0.90   1.07
Tom Trebelhorn          1323     32    6.6   1.03   2101     51   -5.9   0.97   1.06
Gene Lamont             1103     28    1.8   1.01   1730     49   -9.2   0.95   1.06
Eddie Rodriquez          475     11   -5.9   0.94    614     16   -6.7   0.89   1.06
Dino Ebel                238      3   10.3   1.19    373      9    5.2   1.13   1.06
Joey Cora                234      9   -7.7   0.86    404      9   -7.5   0.81   1.05
Joel Skinner            1087     27   15.5   1.07   1650     41    2.6   1.01   1.05
Ozzie Guillen            345     10    1.3   1.01    632     19   -2.1   0.97   1.05
John Vukovich           1130     33   -7.4   0.97   1491     41  -11.4   0.93   1.04
Tony Beasley             239      6    1.5   1.03    314      9   -0.3   0.99   1.04
Brian Butterfield       1195     24    6.1   1.03   1827     45   -1.9   0.99   1.04
Tim Flannery             683     18    6.5   1.05    710     20    0.7   1.01   1.04
Manny Acta              1032     17   15.3   1.07   1495     37    4.3   1.03   1.04
Ron Oester               407     11   -1.0   0.99    571     20   -2.4   0.96   1.03
Willie Randolph          976     20    7.4   1.04   1189     33    1.2   1.01   1.03
Ron Washington          1730     45    2.0   1.00   2272     40   -5.0   0.97   1.03
Carlos Tosca             712     13    0.6   1.00    969     17   -1.2   0.99   1.02
Dale Sveum               789     18  -20.9   0.87   1201     26  -18.6   0.85   1.01
Gene Glynn              1594     40  -20.0   0.94   2198     40  -15.1   0.93   1.01
Gary Pettis              379     14   -3.1   0.96    509     14   -2.5   0.95   1.01
DeMarlo Hale             248      5   -7.6   0.86    424      8   -7.6   0.85   1.01
Sonny Jackson            601     20  -16.6   0.86    896     24  -11.8   0.86   1.00
Al Newman                889     24    1.5   1.01   1384     28    1.1   1.01   1.00
Bryan Little             264      4    7.5   1.14    298      5    4.6   1.14   1.00
Luis Silverio            449      9    5.7   1.06    787     19    4.6   1.06   1.00
Mike Gallego             488      8    1.3   1.01    728     19    1.5   1.02   0.99
Dave Huppert             240      4   -0.7   0.99    318      7   -0.2   1.00   0.99
Pete MacKanin            201      5    0.4   1.01    228      8    0.5   1.02   0.99
Steve Smith             1082     21    1.7   1.01   1697     34    6.0   1.03   0.98
Doug Mansolino           867     18    7.6   1.05   1260     20    9.6   1.07   0.97
Jose Oquendo            1616     33   25.9   1.08   2267     49   23.1   1.11   0.97
Carlos Garcia            226      6   -1.5   0.97    377     13   -0.2   1.00   0.97
Tim Raines               204      9    2.9   1.06    335      7    3.2   1.10   0.97
Rob Picciolo             704     11    3.9   1.03   1163     24    6.7   1.07   0.97
Jerry Narron             494      8    7.7   1.06    611     12    6.5   1.10   0.97
Glenn Hoffman           1541     42  -13.5   0.95   2019     47   -2.8   0.99   0.96
Sandy Alomar             487     11   11.7   1.11    683     15   12.6   1.16   0.96
Fredi Gonzalez          1249     25    3.7   1.02   2005     32   14.0   1.06   0.95
Rich Donnelly           1594     48   -4.8   0.99   2176     52    7.4   1.04   0.95
Gary Allenson            366     18  -12.7   0.81    510     19   -8.0   0.85   0.95
Rafael Santana           408      8    0.7   1.01    717     12    6.0   1.08   0.94
Tim Foli                 387     13   -1.2   0.99    502     15    2.9   1.05   0.94
Ned Yost                 590     21   -8.4   0.93    797     24    0.0   1.00   0.93
Jeff Cox                 847     23  -10.1   0.94   1384     22    1.2   1.01   0.93
Ron Roenicke            1538     40    2.9   1.01   1977     34   18.2   1.10   0.92
Ron Gardenhire           511     16   -0.4   1.00    479     13    4.3   1.09   0.92
John Mizerock            478     10   -1.0   0.99    790     13    6.4   1.08   0.91
Jeff Newman              207      4    2.7   1.07    359      3    6.1   1.17   0.91
Trent Jewett             354     10    2.5   1.04    454     10    6.2   1.14   0.91
Larry Bowa               495     10   -8.6   0.91    699      9    2.1   1.03   0.89
Mark Berry               684     18  -10.9   0.92    911     17    3.1   1.03   0.89
Scott Ullger             222      3    0.5   1.01    452      8    6.6   1.14   0.88
Rich Dauer               710     20    0.2   1.00    861     16   12.7   1.15   0.87
Matt Galante             592     19   -8.8   0.93    853     26    7.3   1.08   0.87
Luis Sojo                558     16   -6.3   0.94    718     12    5.8   1.09   0.86
John Sterns              206     10   -7.0   0.85    253     10   -0.4   0.98   0.86
Bobby Meacham            199      4    2.3   1.05    359      5    8.3   1.24   0.84
Chris Speier             860     22   -4.7   0.98   1158     15   24.0   1.22   0.80
Sam Perlozzo             254      5   -4.0   0.92    275      3    6.3   1.22   0.75
Here Billy Hatcher takes the top spot through his work as the Devil Rays third base coach in 2000-2001. Although his rate statistics for the two seasons (1.01, 1.10) were certainly above average, his team in non-coach opportunities registered rates of just 0.75 and 0.82. Speier, as the third base coach for the Brewers in 2000, Diamond Backs in 2001, and the Cubs in 2005-2006 had 22 runners nabbed in 860 opportunities for an EqHAR of -4.7 and rate of 0.98 while otherwise his team was thrown out 15 times and had a rate of 1.22 pushing him to the bottom of the list.
From an absolute perspective Dale Sveum registered the lowest EqHAR at -20.9 during his time with the Red Sox in 2004-2005 and Brewers in 2006 while Gary Allenson with Milwaukee in 2001-2002 had the lowest absolute rate at 0.81. In both cases, however, the poor performance of their teams buoyed their ratings. Cardinals third base coach Jose Oquendo had the highest absolute EqHAR of 25.9 in his seven years with Tony LaRussa while Ebel recorded the highest rate at 1.19 in his single season with the Angels. These absolute numbers indicate that over the course of seven seasons the range in terms of EqHAR is around 55 runs.
In answer to the first question we posed in part I, the act of waving runners around is quantifiable, albeit imperfectly with the limitations already discussed. The quantification in the above analysis passes the test of reasonableness and takes the following form. Third base coaches in the absolute sense seem at most to be able to contribute to just over one additional win or one loss (Sveum with the 2005 Red Sox recorded an EqHAR of -12.6 and Jerry Narron with the Rangers in 2000 was at +10.9) in the course of a season over what would be expected. Over the course of seven seasons that contribution grows to around two and half wins indicating there is a large degree of variability in play. However, judging a coach by that absolute metric is not necessarily equitable since it doesn't take into consideration the personnel the coach is working with. To correct for this a ratio that uses a baseline can be calculated and when that ratio is converted to runs, the range becomes -1.5 to +1.5 wins per season and -3 to +3 wins over the course of seven seasons.
Persisting the Wave
While we've answered the first question in the affirmative, does the difference we see between third base coaches in a single season indicate that there is a disparity in skill between these coaches?
The standard way performance analysts have approached a question like this is to perform year to year comparisons in an effort to see if the effect being measured persists. As it turns out, roughly two-thirds of third base coaches remain in the role the following season with a high of 24 in being retained from during the winter 2003-2004. Using the ratio calculated in the previous section, a correlation coefficient (denoted as r where a value of -1 indicates a perfectly negative linear correlation and a value of 1 indicates a perfectly linear one) can be calculated for each pair of seasons as shown in Table 4.
Table 4: Year to Year Correlations in Ratio for Third Base Coaches
Year Pair   Coaches      r
2000-2001     19      0.34
2001-2002     20     -0.16
2002-2003     21     -0.10
2003-2004     24     -0.09
2004-2005     21     -0.02
2005-2006     19      0.31
From an overall perspective those 124 pairs can be graphed as shown in Figure 1.
As you can see from the graph in Figure 1 the data doesn't trend in any direction and in fact the correlation coefficient across all pairs of years is just .04. A value so close to zero is evidence that there is in fact no correlation. In other words, knowing a third base coach's ratio in one season gives you no information about what their ratio will be in the next. Further, the data is almost perfectly normally distributed which is additional evidence that there is little or no skill component evident in the data. This can then be interpreted as meaning that there is no discernable third base coaching skill that carries over from year to year and that therefore the answer to our second question is "no."
There may be several reasons for this negative result. Reminiscent of the ongoing debate over clutch hitting, the skill this metric is trying to measure may be much more subtle than the metric can deliver. Instead of a coach being "responsible" for up to +1.5 wins per season, his actual contribution to those wins may be a fractional part of that value and hence the variability component in the numbers we use for correlation swamps the skill component to a large degree. So there may indeed be a skill involved in waving runners around, but that skill is for all intents and purposes unimportant in the big scheme of things. The obvious dependence on his personnel would seem to support this.
Additionally, perhaps the metric is poorly designed and may not capture the skill at all though it exists. It could even be the case that there really is no skill involved in holding and sending runners (or if you prefer, there is no skill difference between coaches at the major league level) and the differential results we see can be chalked up to a combination of personnel (try as we might to disentangle it or due to turnover of the roster) and simple luck driven by anything and everything from the opponents defense to the weather.
Our quest for knowledge about the game is just as often informed by studies that show no effect as those that confirm our intuition. As for the influence of third base coaches in determining when to send and when to hold runners, the most we can say from this study (assuming our metric is relevant) is that if there is a skill involved, it is hard to measure and although the judgment exercised on the field can often make the difference in individual plays, it doesn't manifest itself on the larger scale of seasons.
Dan Fox is an author for Baseball Prospectus where he writes the weekly Schrodinger's Bat column. He also writes about baseball and other topics on his blog Dan Agonistes.
Neal Williams is the president of the Rocky Mountain chapter of the Society for American Baseball Research.
| Designated Hitter | March 14, 2007 |
Quantifying Coachers, Part I
"The employment of one of the side who are in to watch the movements of the field and advice the runner accordingly is a quaint device of American acuteness." - quote from an English newspaper during an 1874 tour by American ballplayers as recorded in Sporting News, February 25, 1909
As that quote attests, the idea of on-field coaches has a long history in baseball. Peter Morris, in his excellent book A Game of Inches: The Stories Behind the Innovations that Shaped Baseball Volume I, The Game on the Field, informs us that base coaches (or "coachers" as they called the name deriving from the likeness to a stagecoach driver) were apparently common since rules were in place by 1872 which specified that a baserunner's teammates had to keep a distance of at least 15 feet.
Unlike today, however, it seems the primary job of the coaches was to "disconcert the opposing players - generally the pitcher - not to 'coach' or assist the base-runner" as Sporting News put it in 1893. As a result, the primary qualifications for a coach of that time was a megaphone like voice (yes megaphones were tried in college games in the early 1900s but fortunately never found a foothold in professional baseball) and a cruel disposition. In fact, it was the abusiveness of coachers like Charles Comiskey and Bill Gleason, who would stand on either side of the catcher commenting on everything from his skill as a catcher to his breeding and personal habits, which precipitated a move to first ban coaching altogether but then to restrict coaches to boxes down the line beginning in 1886. In addition to their primary job as unsettlers of the opposition, third base coaches would also attempt to get opposing fielders to mistake them for a runners, a ploy was which was severely hampered following the 1886 rule change.
Be that as it may coaching did eventually come to be taken more seriously with Arlie Latham the first full time coach hired by the Cincinnati Reds in 1900. And Latham was apparently performing the modern function since in July of that season Sporting Life reported that "Manager [Bob] Allen says he is delighted with the coaching of Latham. He says the baserunning of the team has improved 100% after the veteran got on the lines". As is true for advances in other fields Cincinnati's experiment proved to be an early, if successful, trial balloon and it would another decade before the idea took hold. In between there were still calls to ban coaching leading non other than Henry Chadwick in 1904 to denounce coaching as it had "degenerated into a dirty-ball method of annoying the pitcher". Other innovations in the game including increased managerial strategy and signaling finally drove the need to move beyond the "old school of clowns" as Christy Matthewson famously said of this earlier period in Pitching in a Pinch. Not surprisingly it was John McGraw who hired Latham and Duke Farrell as full-time coaches in 1909. By 1912 Sporting Life noted that Latham "does get a percentage of runs across - runs that might not otherwise be made". From there it was generally recognized that coaches paid dividends and although for some time there was apparently a subset of coaches who seemed more preoccupied with rattling the opposition, coaching as a profession gained strength and was here to stay by the early 1920s. Their duties have expanded over time as well. As just one example the first base coach now routinely times the pitcher's delivery to the plate relaying that information to the runner.
 |
It's now been almost 100 years since full time coaches were employed and their performance is routinely scrutinized although not very often quantified. The question then (first suggested to Dan by Rich Lederer of all people) from an analyst's viewpoint is two-fold. First, is the job of coaching quantifiable? In other words, can we create a metric or metrics that measure the success and failure of this component in a reasonable way? And second, if it is measurable, can some coaches be said to be more skilled at this half of their job than their peers? In this article and the one to follow we'll take a crack at answering both questions for third base coaches related to their secondary job (relaying signs being the primary) of directing traffic on the bases.
Quantifying the Wave
In the summer of 2006 in a series of six articles published on the Baseball Prospectus web site one of us (Dan) endeavored to more formally quantify baserunning by developing a series of metrics measured in terms of runs. Those metrics are:
When totaled, these give us a fairly complete picture of the contribution made by a player on the bases beyond what would have been expected given their opportunities. And therein lies the rub. The methodology that underlies these metrics isn't a simple totaling of the number of bases gained in these situations but rather an application of changes in the expected number of runs across several dimensions including the base/out situation (the Run Expectancy matrix), handedness of the batter, and the position of the fielder who fielded the ball.
By calculating how often runners typically advance in a whole host of scenarios (for example with a runner on second and nobody out a runner will advance from second to third 43% of the time when the ball is fielded by the shortstop but 97% of the time when handled by the second baseman) and translating those percentages to runs using the Run Expectancy matrix we can credit or debit a runner for each and every opportunity they have on the bases.
Totaling the credit assigned to each opportunity (and not crediting the runner for advancing the minimum number of bases) for players allows us to assign a number of theoretical runs above and beyond what a typical player would have contributed given the same opportunities. Yes, theoretical since these metrics, being based on models like the RE matrix, don't actually measure the precise number of runs contributed by a runner but rather can be thought of as an accounting of the decisions made by runners and coaches, that put their teams in more or less advantageous situations throughout the course of a season. That accounting is performed in terms of runs. As mentioned above we then adjust for park effects where necessary. For example the spacious Coors Field outfield allows for easier advancement than the smaller Fenway Park.
Already many of you can see where this is going. EqHAR, by measuring runner advancement on hits, may be an appropriate methodology to apply to third base coaches since it measures an aspect of the game in which third base coaches are directly involved. Looking more closely, EqHAR is composed of three basic scenarios.
A third base coach may be active in each of these scenarios but as will be obvious it typically depends on where the ball is hit. When a batter singles or doubles with a runner on first base, the runner typically makes his own decision about whether to advance if the ball is hit to left field or within his field of view in center field. On the other hand he'll usually pick up his third base coach if the ball lands in right field. Likewise when on second base ball hit to the outfield typically results in the runner typically taking matters into his own hands only if the ball is hit to left, but rely on the coach if the ball is hit to center or right. By using these general rules as a guide the analysis can be restricted in this sense to plays that fall only into these categories but also include scenarios when multiple baserunners are on base.
One might argue that these categories are either too restrictive or not restrictive enough and we have sympathy with both arguments.
For example, with the runner on first on a single fielded by the centerfielder there are certainly occasions when the runner picks up the coach. Conversely, with a runner on second and the batter singling to left there are definitely times when the runner knows the ball will be difficult to handle or is running with the pitch and so heads home without consulting the coach. This analysis will not include those events. And these events of course do not include runners attempting to advance on ground ball and fly ball outs nor does it include runners attempting to stretch doubles into triples or triples into inside the park homeruns. The thought was to error on the side of caution and include only those events where it seems the third base coach would be most likely to have influence. Further, these scenarios will include times when runners run right through the stop sign given by their frantic coach only to get thrown out. Through no fault of his own, the coach will be still be debited for plays like these.
Surely this is far from a perfect system but given the granularity of the play by play data available and absent video inspection of each play, this seems like a reasonable approach for a first pass at creating this kind of metric.
The primary advantage to using the methodology described above as opposed to simply counting the number of runners that were thrown out on each coach's watch is that this system also gives appropriate credit when a runner advances successfully. The system also takes into consideration how difficult the advancement event was and gives more credit when a runner takes a base in a higher reward situation. While keeping runners from getting thrown out is clearly a major component of the job, knowing when to take risks based on game situation is a secondary component and one that this metric captures.
Given the above caveats we ran the EqHAR framework for third base coaches for 2006 with the following results.
Table 1: Third Base Coaches 2006 Ordered by Rate
Team   Name                 Opp     OA  EqHAR   Rate
ANA    Dino Ebel            238      3   10.3   1.19
PHI    Bill Dancy           262      5    7.8   1.15
HOU    Doug Mansolino       214      1    5.6   1.11
TBA    Tom Foley            163      1    5.3   1.15
DET    Gene Lamont          240      5    5.0   1.10
FLO    Bobby Meacham        199      4    2.3   1.05
NYN    Manny Acta           228      3    2.3   1.05
KCA    Luis Silverio        237      4    2.0   1.04
WAS    Tony Beasley         239      6    1.5   1.03
COL    Mike Gallego         247      3    1.5   1.03
ARI    Carlos Tosca         275      6    0.5   1.01
MIN    Scott Ullger         222      3    0.5   1.01
BAL    Tom Trebelhorn       296      3    0.3   1.01
MIL    Dale Sveum           214      5    0.3   1.01
SDN    Glenn Hoffman        231      4   -0.2   1.00
TOR    Brian Butterfield    237      6   -0.4   0.99
CLE    Jeff Datz            274      5   -0.7   0.99
CIN    Mark Berry           217      5   -0.8   0.98
SLN    Jose Oquendo         230      5   -1.1   0.98
PIT    Jeff Cox             230      3   -1.2   0.98
SEA    Carlos Garcia        226      6   -1.5   0.97
SFN    Gene Glynn           220      3   -2.2   0.95
TEX    Steve Smith          234      5   -2.5   0.95
CHN    Chris Speier         199      6   -2.9   0.94
ATL    Fredi Gonzalez       231      6   -3.3   0.94
NYA    Larry Bowa           289      5   -4.1   0.93
OAK    Ron Washington       245      7   -4.9   0.89
LAN    Rich Donnelly        260      9   -6.0   0.90
BOS    DeMarlo Hale         248      5   -7.6   0.86
CHA    Joey Cora            234      9   -7.7   0.86
This table includes the number of hit advancement opportunities (Opp), the number of times runners were thrown out advancing (OA), the EqHAR for those opportunities, and a Rate statistic that is the ratio of EqHAR to the expected number of advancement runs given both the quantity and the quality of opportunities along the axes mentioned above. This is important since you'll notice that while Baltimore and Tom Trebelhorn had 296 opportunities, Tom Foley in Tampa Bay had just 163 and all other things being equal, more opportunities means a higher EqHAR.
It should be noted that the coach was assigned all plays for the 2006 season for his team since there is no easily accessible record of when a third base coach was not on the field for his team. For example, although Chris Speier took a several day leave of absence beginning July 20th after being arrested for DUI earlier that week, the opportunities during that time are credited to Speier. Through this analysis the coaches were assigned opportunities based on their team's media guides for the respective seasons.
So under this measure Dino Ebel of the Angels played a part in helping his runners to the tune of just over 10 additional theoretical runs (the second highest of any single season from 2000 through 2006) while Joey Cora was complicit in costing the White Sox the equivalent of almost 8 runs. Intuitively, this range seems to be within the bounds of believability. Interestingly, newly minted managers Ron Washington (-4.9) and Fredi Gonzalez (-3.3) don't come out very well although Manny Acta (+2.3) does.
But is this really a fair gauge of a third base coach's influence? We'll answer that question along with the two we started this article tomorrow.
Dan Fox is an author for Baseball Prospectus where he writes the weekly Schrodinger's Bat column. He also writes about baseball and other topics on his blog Dan Agonistes.
Neal Williams is the president of the Rocky Mountain chapter of the Society for American Baseball Research.
References
Schrodinger's Bat: Hit the Ground Running
Schrodinger's Bat: An Air of Advancement
Schrodinger's Bat: Advancing in Context
Schrodinger's Bat: Using The House Advantage
Schrodinger's Bat: The Running Man
Schrodinger's Bat: The Whole, the Sum, and the Parts
| Designated Hitter | March 01, 2007 |
The Bull Durham Rant
How often do you find yourself quoting great lines from baseball movies during the course of a typical day?
I do it all the time.
For instance, when a family outing is canceled on account of the weather:
"Sometimes you win, sometimes you lose, sometimes it rains."
At a barbecue when the cook is serving me a burger:
"Pick me out a winner, Bobby."
The Jesus people try to hand me literature on my way to SI's Midtown offices:
"Jesus, I like him very much, but he no help with curveball."
One of our writers gets contentious about an edit:
"Don't think, it can only hurt the ballclub."
Upon the delivery of some decidedly untoward news:
"Say it ain't so."
Hearing a banal remark:
"They don't call him the best color man in the game for nothing."
Using my American Express card:
"Don't steal home without it."
Dragging at work and it's not even lunchtime yet:
"Go the distance."
My daughter doesn't want to go to school:
"You'll play Jackson! You'll play!"
Baseball fans are lucky in that we have the widest array of excellent films with rich dialogue to choose from compared to the other sports. Hoops fans have, what, Hoosiers and Hoop Dreams? He Got Game? Does Teen Wolf count? Football has come on in recent years with Remember The Titans and Friday Night Lights, but the pigskin, as well-suited as it is to the tube, falls flat on the silver screen when compared to the horsehide. (Bang the Drum Slowly wins over Brian's Song, and Bad News Bears rocks The Longest Yard.)
Perhaps my single favorite moment from any of the baseball classics is the Crash Davis rant to Annie Savoy in Bull Durham. Just as the sexual tension between the two is about to boil over, Crash's words leave her more vulnerable than she ever thought possible:
"I believe in the soul, the cock, the pussy, the small of a woman's back, the hanging curve ball, high fiber, good scotch, long foreplay, show tunes, and that the novels of Susan Sontag are self-indulgent, overrated crap. I believe that Lee Harvey Oswald acted alone, I believe that there oughtta be a constitutional amendment outlawing Astro-turf and the designated hitter, I believe in the 'sweet spot,' voting every election, soft core pornography, chocolate chip cookies, opening your presents on Christmas morning rather than Christmas eve, and I believe in long, slow, deep, soft, wet kisses that last for seven days."
Let's take a closer look at Crash's speech, phrase by phrase:
The small doesn't do much for me. I'm more of a nape guy myself. And belly buttons. Definitely belly buttons.
Because the alternative is no fun.
Overrated. Do you want to spend all day on the can?
Just gimme a brewski.
From what I hear, most ballplayers would disagree. (As would most people belonging to the Phylum Marrydus Boredasallhellus.)
Horribly addictive. Better to stay away.
Can't say I ever came across her during the course of my public school education.
Costner should know better. He was in JFK.
Astro-Turf is five minutes ago. Hello, Field-Turf!. As for the DH, it's grown on me over the years. There is something to be said for a manager having to make the call on pulling his starting pitcher regardless of when the ninth spot is due up next. The same goes for the use of bench players; managers can't just automatically go to them when a double-switch is needed.
It's only the best sound in the world.
I try. I really do.
Isn't it nice to leave something to the imagination?
My weakness.
I prefer eve but my wife has final say on the matter and she's with Crash.
Seven days? It'll have to be during the offseason.
I think, deep down, everybody should have their own Bull Durham rant, a coat of arms for where you stand on divisive issues of your day. Here's mine:
"I believe the Reds should be the first team to play on Opening Day, that Opening Day should be a national holiday and that every MLB team should indeed play on said day. I believe radio is the perfect medium for baseball and love nothing more than a day at the park or the beach with the call of the game humming softly in the background. I believe the game is fine the way it is and tinkering with the rules only makes it worse. I believe I didn't know my head from my ass when I was pulling for the Mets in the '86 Series. I believe I agreed with this guy when he said, "In my day, ballplayers were for shit." I believe RUSH, not Bert Blyleven, is the biggest Hall of Fame snub of all time (sorry, Rich). I believe the last thing MLB needs is a salary cap, that college teams should be provided wooden bats and college football should never institute a playoff. I believe the media need to report the truth about the steroids era without getting on a soap box in the process. I believe Babe Ruth was right when he said, 'The only real game -- I think -- in the world is baseball.'"
Jacob Luft is a baseball editor/writer for SI.com.
| Designated Hitter | February 15, 2007 |
Everything I Know About Baseball I Learned From Strat-O-Matic
All right, so that title there is a modest exaggeration. Truth be told, my first introduction to baseball came in my eighth summer, when a Rodent Napoleon named Don Zimmer mismanaged the '78 Red Sox into infamy. Despite that cruel indoctrination, baseball's grip on me was secure, and it wasn't long before a certain simple but fundamentally sound board game helped me adore the game even more.
So it was that before fantasy baseball became a national pastime unto itself . . . before Rob Neyer was even a twinkle in Bill James's Texas Instrument . . . before the advent of Baseball Prospectus and On-Base Plus Slugging and Value Over Replacement Player and so many other modern numerical and analytical enhancements to the ol' ballgame, Strat-O-Matic taught me the value of statistics beyond the basics listed in the Sunday sports section.
I learned about the value of WHIP, K-Rate and the lies-and-damn-lies nature of a pitcher's won-lost record from Nolan Ryan in 1987. In games played in the National League, Ryan pitched 211.7 innings, allowing just 154 hits, walking 87, and striking out 270. Dazzling numbers by any measure, yet his won-lost record for the offensively limp Astros was a wretched 8-16. But in games played at my family's kitchen table, Ryan, armed with one hellacious Strat card and a considerably more supportive offense, rolled to a 24-5 record and struck out 349. (I know this because I still keep my stat book tucked away in the desk in my home office. And somewhere, my wife mutters: "Nerd.")
I learned that home runs per at-bat could foreshadow a power hitter's potential, thanks to a large (and largely anonymous) Toronto Blue Jay who clubbed 14 homers in 175 at-bats in '87. When Cecil Fielder, after a rejuvenating detour to Japan, returned stateside and promptly walloped his way to cult-hero status, blasting 51 homers for the 1990 Tigers, I considered it little more than a case of life imitating Strat. After all, he had totaled 44 homers in our league three years previous.
I learned about the tremendous value of bases on balls and on-base percentage to an offense from . . . well, my dad, who as a Strat manager played Earl Weaver to my tragicomically inept Maury Wills. Some of my earliest memories are of dad playing the game with my uncle, and after incessant pleading, badgering and whining on my part, I was permitted to make my Strat debut at age 10. Let's just say I might have been rushed to the majors. When dad and the dice would conspire to deal me a particularly galling loss, I could throw a hissy fit that would make Kevin Brown blush. Let the record show I never took a Louisville Slugger to the light fixtures, however, and a few stints of solitary confinement in my bedroom taught me to handle defeat with the appropriate grace.
Now, I assume my recollections of Strat heroes past aren't terribly different from yours. It seems to me that just about every baseball-mad kid of any pre-PlayStation generation dabbled in one baseball board game or another, be it Strat, APBA, Ethan Allen (the game with the spinning dial mom got you from the Sears catalogue), or perhaps some homemade concoction made from, say, Topps baseball stickers, index cards, and dice. But for the uninitiated, I should explain how Strat is played. I'll spare you the complexities and stick with the fundamentals: Each batter has an individual card composed of three columns (numbered 1 through 3), with 12 numbers representing potential outcomes in each column. Each pitcher has a card with columns numbered 4 through 6. You roll three dice - one of which determines the column and the other two combining to determine the number within that column. So, say, 1-7 would be a home run on Jim Rice 1978 card for example, or 4-11 might be a grounder to short on Luis Tiant's card. Basestealers earned ratings from AAA (think Rickey Henderson in '82) down to E (think Steve Balboni since birth), while fielders were graded from 1 (think Ozzie Smith in his backflipping heyday) to a 4 (think Butch Hobson in his 44-error breakdown for the '78 Red Sox). To this day, I catch myself judging defensive players by the Strat system. Alex Gonzalez? The Reds shortstop is a 1 for sure. Derek Jeter? Ask me, he's a 3. Okay, maybe a 2.
The Strat formula is as flawless as David Wells's delivery. In fact, the game is so user-friendly that it achieved significance in pop culture, and occasionally, the ratings would become a source of humor within a big-league clubhouse. Steve Wulf, the esteemed sports writer, confirmed Strat Geek, and ironically, one of the forefathers of rotisserie baseball, wrote a stellar feature for ESPN the Magazine a few years back on Strat creator Hal Richman. Wulf relayed the story of how several Phillies fans once berated the leather-challenged Gregg Jefferies by hollering, "You're a 5, Jefferies. You're a 5!" As Jefferies looked on quizzically, Phillies center fielder Doug Glanville convulsed in laughter. Turns out Glanville was an avid Strat player.
Given a proper introduction to the game, who wouldn't be? It was just. . . fun, for reasons both statistical and sentimental. The anticipation of sorting through each season's new cards, discovering whose defensive ratings went up or down and which sluggers had the coveted 1-7 and 1-8 home run numbers, was the closest thing I knew to Christmas morning. And there was much satisfaction to be found in the whims of the dice, for while the game was remarkably accurate in replicating the players' real-life accomplishments (or failures, Mario Mendoza), there were always a fortunate few mediocrities that always seemed to get the benefit of the roll.
You could be excused for having long since forgotten Terry Harper, a nondescript reserve outfielder for Atlanta in the mid-'80s. But I fondly remember him as someone whose good outfield glove, decent speed, and adequate home run rate inexplicably translated to Strat superstardom. A good friend and fellow boyhood Strat junkie reverentially speaks of a season played three decades ago, when a second baseman named Rodney "Cool Breeze" Scott, he of exactly zero home runs the previous season, inexplicably began going deep like he was a BALCO client. And marginal big-leaguers who put up distorted numbers in a small sample size were fair game in our game, which occasionally meant the less-than-legendary likes of Broderick Perkins (.370 in 100 at-bats for the '80 Padres) would achieve the stardom in our world that eluded them in real life.
Our greatest delight, however, was the annual rookie draft. One summer dad and I played a grueling 130 games per team in our 12-team, All-Star format; in other distracted years, we played as few as 25 or 30 games per team. But it would have taken an act of Congress - or of my mom, I suppose - for us to miss our yearly draft. That was the Event, capital E. I did more draft prep than Mel Kiper Jr., often at the expense of a homework assignment or three. The diligence wasn't always rewarded. My old man still needles me about the time I snapped up a young Red Sox outfielder named Todd Benzinger with the No. 1 overall selection. Benzinger was a player of some promise, though I'm not sure he would have gone No. 1 overall in his own family. In retrospect, I may have overestimated his skills for the fact that he once genially tossed my cousin his hat after minor-league game. I'm presuming Theo Epstein isn't so easily coerced.
For all of these indulgent flashbacks and anecdotes, though, the truest value I found in the game was both personal and palpable: it brought me closer to my dad. In darker times for my family, when maybe I didn't see him as much as I'd have liked and my teen angst prevented me from telling him so, the game always seemed to be there as a catalyst for repairing our bond. It is not an exaggeration to say the game made my young life easier.
Dad and I retired unceremoniously from Strat a dozen years or so ago, in part because my first real job and real responsibility took me to another state, in part because the old man was finally hooked by the lure of fantasy sports, but mostly because I was wary of immediately revealing the female-repelling depths of my baseball dorkdom to my girlfriend, who would someday become my wife. You might say one true love was swapped straight up for another. But damned if Strat is not still part of my fiber as a fan today. When a player submits a transcendent statistical season, I'm still in the pleasant habit of pondering what his Strat card might look like. McGwire in '98, Pedro in '00, Bonds in '01 . . . man, those must have been cards to behold.
I'd never dare suggest an imaginary game could properly replicate the nostalgia of an idyllic summer Sunday spent at, say, Chavez Ravine. But sitting at kitchen table with dad, hoping Ryan or Fielder or - god bless them - Terry Harper or Broderick Perkins have just a little bit more magic in the cards. . . well, those fictional baseball memories are tucked away neatly in my mental scrapbook, right there alongside the cherished recollections of the real thing.
I have a little boy of my own now, six months old, a genuine bonus baby. This won't come as breaking news to my wife - she long ago realized the truth, yet stays the course in spite of it all - but I'm already daydreaming of the day when I can share with my son the baseball lessons my dad, and a certain board game, taught me. One roll of the dice at a time.
Chad Finn is the founder of Touching All The Bases, a blog that takes an irreverent but passionate look at Boston sports. In real life, he is a sports copy editor at The Boston Globe. He lives in Wells, Maine, with his wife Jennifer, their children Leah and Alex, and a cat named after Otis Nixon.
[Additional reader comments and retorts at Baseball Think Factory.]
| Designated Hitter | February 08, 2007 |
Two Decades of Bringing the Crazy
This April will mark the 20th anniversary of my descent into madness, I mean, my foray into that wild and crazy world of rotisserie baseball.
I write this column with some trepidation. Because, frankly, I know full well that there are few things more boring than listening to someone else talk about their rotisserie league team. So I promise right off the bat that this will not be a litany of recollections like "and then I traded Joe Schlabotnik for Pedro Martinez and Albert Pujols."
It was spring training 1987 when a sportswriter friend of mine happened to mention that the fledgling National League-only Rotisserie League being started up by the commissioner of his AL league was short one team and did I know anyone who might be interested in giving it a shot.
I'd recently read an article about the phenomenon, had been intrigued, and had nothing to do that following Sunday so I said, "what the hell." If I'd known then what I know now. . .well, I suspect I still would have done it.
I spent the next few nights copying down the names and 1986 stats for pretty much every single player on a National League roster that had not yet been sent down from spring training into one of those accounting ledger books. This was, of course, way before the days when you could download all of this from the internet. In fact, I think it may have been before the days of the internet.
When Draft Day (MUST be capitalized) dawned, I was stoked. I was geeked. And I had to buy Cincinnati Reds phenom shortstop Barry Larkin.
To some, there's nothing like the smell of napalm in the morning. To me, there's nothing like the smell of Bobby Valentine's restaurant in Norwalk, Connecticut, at 1 p.m. on the first Sunday of the regular season. That first sip of a pungent Bloody Mary, the first (and probably only) bite of a barely-nibbled cheeseburger (I was too nervous to eat because I might get burger juice on my intricately-written stat sheets).
I was ready to be savvy, to be wary, to take my time and not jump into any stupid purchases. Which is why I spent $41, the highest salary in that year's draft, on the very first player whose name was brought up, Darryl Strawberry (full disclosure: the Dinner Table rules I mention below were not yet in effect).
Oh right, Barry Larkin. I bought him for $22, and on our first break ran to the restaurant payphone (remember those?) to call my husband and share the good news. Before I had gotten a word out, he said "Oh God, please tell me you didn't get Barry Larkin!" Turns out he had injured his knee probably at the exact same moment the auctioneer was saying "Sold for $22!"
Because I apparently had nothing better to do with my free time (this was pre-motherhood), I am going to make a really embarrassing confession here. I actually made a poster of my team by scrounging up baseball cards of all of my players and displayed them on a big piece of black oaktag. Well, all of them except Pittsburgh Pirates pitcher Bob Patterson.
I couldn't find a card of him and had no idea what he looked like (remember, pre-internet) so I drew a cartoon of what I thought he would look like, in a generic "Topps Woody" card format. And it actually turned out to look a lot like him.
I'm told, though, that what I thought was a complete descent into lunacy was mild in comparison to some people. . .at least I don't scour eBay to complete an entire lineup of bobblehead dolls of all of my players.
20 years of keeping this league intact has not come easy. Our original commissioner was just crazy enough to run not just our National League-only circuit but also a brother American League one, and finally he'd just had enough.
Rather than opening up the commissionership to a vote by the remaining members, he simply handed it over to a league member nicknamed "The Pitbull." In a nutshell: the majority of the league money mysteriously disappeared. (Doesn't it figure that it would have been the year I won???)
No surprise, the league came close to disbanding before some stupid schmuck (who will remain unnamed but is writing this column) took over the commissionership to save the league. "The Pitbull" actually thought he should be allowed to remain in the league as an active team. Fortunately, cooler heads prevailed.
The league went through its share of growing pains in other ways, most notably geographic. Initially made up of team owners local to the Westchester-Connecticut area, members started moving and yet the league still remained intact.
The Bobby Valentine draft era ended when the restaurant staff decided to give our regular space to a Little League party, and we were stuck crowded in a back corner, three or four teams to a table. Well, you can imagine the dilemma that caused, since it meant the enemy could see your super-secret draft notes.
After that, the drafts moved to different owners' conference rooms, with beautiful views of the New York skylines and comfy office chairs, but no Bloody Mary's. I draft much better with Bloody Mary's. Or at least I think I do.
And finally, when that blasted internet thing finally got going thanks to Al Gore, we made the big leap to online drafts.
Thanks to that latter technological advancement, we currently have league members stretching from Las Vegas to Kansas City to Washington D.C. to the entire northeast corridor. Finding a draft time that spans three time zones is sometimes a little tricky, but so far it's managed to work out okay.
The worst thing about online drafts, though, is the elimination of what I call "the 'who?' factor."
To me, always the Minor League/sleeper prospect fan, a draft was not a success for me if I didn't bring up at least one player's name where the response was a resounding "who???"
Of course, I don't think the possibility of a "who factor" exists anymore, not with the existence of at least ONE ABSOLUTELY STELLAR WEBSITE WHERE YOU CAN FIND ANYTHING YOU NEED TO KNOW ABOUT ANY MINOR LEAGUE PROSPECT SO THERE ARE NO SECRETS ANYMORE (gratuitous plug).
One of my concerns, once I started writing baseball on a full-time basis, was that eventually I might get totally burnt out and not enjoy "roto" as my hobby anymore. And in fact I did drop out of the league for a few years.
But I rejoined the league last year, when the owners kicked out a delinquent owner (as in payment, not as in sending him to juvie hall). I took over his team and spent the 2006 season rebuilding with - what else? - rookies.
I guess that everyone has certain little "draft idiosyncrasies" . . . you know which guys are going to pay big bucks for Mets, or Dodgers, or whoever their favorite teams are. I, for some strange reason, have a reputation for overpaying for rookies. My eternal motto has been "Wait 'til next year!"
I also have one important rule I abide by: The Dinner Table Rule. Being a sportswriter, I have the advantage (or disadvantage) of actually knowing a lot of the players I'm bidding on. And frankly, I will not bid on a guy I think is a jerk. My rule is if I wouldn't want to share a dinner table with him, I do not want him on my team. On the other hand, there are certain players who will always have a place on my team or at my dinner table.
For example, not only do I always try to get Eric Young, this year I also picked up Eric Young Jr. in our ultra/minor league phase. (I think I may be the first person in the league's 20-year history to have a father-son pair on my team).
Hey, I didn't name my team Puff Mommy for nothing.
By the way, did I mention that I traded for Anibal Sanchez, Homer Bailey, Stephen Drew and Jarrod Saltalamacchia, for a handful of high-priced injury-prone veterans?
I think I may change the name of my team to: This IS next year!
Lisa Winston writes for MiLB.com, where you can read about any Minor League player she would ever consider getting for her roto team.
| Designated Hitter | January 18, 2007 |
The Greeks, Bill James and the Beauty of Baseball Stats
You've heard of Pythagoras, right? If you're a fan of baseball stats, you might associate Pythagoras with Bill James's Pythagorean Formula, RS^2/(RS^2+RA^2), which calculates a team's expected winning percentage. It's a sublime formula, really. It captures critical information in a simple way and expresses the relationship between runs scored, runs allowed and winning just so.
If you're not a baseball analyst, you probably associate Pythagoras with right triangles, as in A^2+B^2=C^2, where C is the length of the hypotenuse. It's another beautiful formula. From what I've read, Pythagoras didn't exactly invent it, but he did popularize it. Still, it wasn't Pythagoras's greatest contribution to mankind.
Pythagoras actually invented the musical scale we use today. If you place your finger exactly halfway up a guitar string, the note of the string is an octave higher. Put your finger on a spot two-fifths the length of the string, and you get a perfect fifth note. It's said that Pythagoras discovered this, and he found that the simplest ratios of string length created the most harmonious notes.
Reportedly, this was a huge revelation to the Greek. He felt that he had discovered a fundamental Truth, something that uncovered the deepest meanings of the universe. In a way, he had.
Pythagoras had discovered the power and beauty of ratios. He became convinced that mathematical ratios were the foundation of all beauty in the universe. He conceived of the music of the spheres, in which all planets orbit the earth in a circle, set in a specific ratio from the earth, which emits its own tone throughout the universe.
Pythagoras took his findings seriously. He developed a following - a cult, really - that believed that universal truths could be found in numbers. His disciples considered him a kind of god and followed him loyally.
I don't know anyone who thinks of Bill James as a kind of god, but there are many of us who feel that our eyes were opened by his Abstracts. He didn't just discuss baseball and its numbers, he uncovered the beauty in its numbers. Take that Pythagorean Formula...
James found that you can reasonably predict a team's performance by its runs scored and allowed. He also found that the relationship is geometric; Runs aren't just doubled in the formula, they're squared.
The power of two is everywhere in life. E=MC squared, after all. When you move closer to a light, cutting the distance in half, the light doesn't become twice as bright. The brightness is squared. When you double the sides of a square, its size doesn't just double, it's squared.
So when Bill James discovered that the nature of runs to winning is squared, it seemed as though something essential and fundamental had been discovered. And he didn't stop there.
Take any league in modern baseball history and multiply its On-Base Percentage by its total bases. Know what you'll usually get? A number that is very, very close to the total number of runs scored in that league. I mean, how amazing is that?
League  Year     OBP    TB       OBP*TB   Runs    Diff    %Diff
NL      1968    .300    18,737    5621    5577      44      1%
NL      1954    .335    17,106    5731    5624     107      2%
NL      1925    .348    17,751    6177    6195     -18      0%
AL      1997    .340    33,495   11388   11164     224      2%
AL      1977    .330    31,307   10331   10247      84      1%
AL      1959    .323    16,118    5206    5391    -185     -3%
I don't know if Bill James is the person who discovered this relationship but, like Pythagoras and his theorem, he will forever be associated with it because it was the basis of the very first Runs Created formula: A+B/C, where A is times on base, B is total bases and C is plate appearances.
Once again, James had found a simple formula and ratio, multiplicative in nature, that expressed the fundamental nature of baseball.
Of course, James created other metrics, too. He created Game Scores, Defensive Efficiency Record, Secondary Average and Isolated Power. He developed points systems for Hall of Fame and award eligibility. He created his own ways to project player careers (the Brock system), major league performance from minor league performance (MLE's) and the Favorite Toy.
James's findings were simple and beautiful. They were something new in the baseball firmament and they created a new kind of baseball fan, a bit like Pythagoras's cult. But, as with Pythagoras, questions began to undermine the beauty of the numbers.
One of Pythagoras's followers, an unfortunate man named Hippasus, discovered that some numbers are irrational. That is, the digits of some numbers continue infinitely like Pi (3.14159...) or the square root of two (1.41421...). Hippasus developed a proof showing that irrational numbers exist. Pythagoras considered this sacrilege, and reportedly had him drowned.
But the truth couldn't be held back, and the logic of Hippasus's finding was eventually recognized. Thousands of years later, a guy named Copernicus came along and established, once and for all, that the planets don't revolve around earth. They revolve around the sun. Pythagoras's music of the spheres doesn't really exist at all.
Pythagoras's math wasn't wrong, really. The trouble was that, for all of its beauty, it wasn't fundamentally sound enough to take future mathematicians where they needed to go. Newton and Einstein could never have conceived of calculus and relativity (relatively) if they had stuck to Pythagoras's mathematical ideals. Sometimes, progress requires a revision of the fundamentals.
Early in his career, Bill James really wasn't interested in creating the most precise statistics. He was interested in the framework, in the insights that would lead to revolutionary thinking about baseball and its players. So he didn't include counting stats like stolen bases and sacrifice hits in Runs Created. Like Pythagoras, he was most interested in the beauty and insight.
As time moved on, however, he became more interested in accuracy, and his formulas became more complex. He eventually added stolen bases, situational hitting and lots of other things to Runs Created. In fact, the current Runs Created formula is virtually unrecognizable compared to its original version, even though it still follows the A+B/C format.
The Pythagorean Formula has changed too. James recognized that squaring runs scored and allowed wasn't quite accurate enough, and changed the formula's factor to 1.83. I remember my disappointment when he did that, thinking that Pythagoras wouldn't approve.
Subsequent researchers have gone further, and found that the correct factor is dependent on the overall run environment. In other words, the impact of runs scored and allowed changes according to the average number of runs scored in each league each year.
Just think how Pythagoras would have responded to that.
Many years ago, Pete Palmer built his own runs estimator formula called Linear Weights, in which each offensive event (singles, home runs, walks, outs, etc.) is weighted by a specific amount. James didn't like Linear Weights. He once criticized Palmer's system because the weights of each event were computed after the end of the year (and he also doesn't like stats that use averages as a baseline).
However, Tangotiger showed, in a persuasive article called "How Runs are Really Created" a few years ago, that context really does matter. You can't really know the impact of each type of batting event unless you know how many times every event occurred.
In fact, Tango went one step further and showed that the format of James's original Runs Created formula wasn't quite right. He advocates the use of a formula developed by David Smyth called Base Runs. And if you take some time to think about it, you have to agree with him.
When you look at things in more detail, sometimes the fundamental structures that have gotten you so far have to change. That's what Hippasus meant to Pythagoras, and that's what has happened to James's original formulas, too.
Baseball writers like Rich and me aren't really researchers. We're communicators. We want to reach out to fans who are curious about the game of baseball and describe to them how the "inner game" of baseball statistics works. We are truly following in the footsteps of James, who is a fantastic writer, and we want to express the same joy at the beauty of baseball stats.
On the other hand, hardcore researchers are finding new ways of describing the game's statistics, and we want to share that with general baseball fans too. So we're in a curious bind. We want to continue to talk about the music of the spheres, but we also want to acknowledge the Copernican solar system.
At Baseball Graphs and the Hardball Times, I've helped keep Bill James's Win Shares in the public's eye. At the same time, however, I've conducted my own research and tried to improve his system. Some researchers have told me that trying to correct Win Shares isn't possible, that the framework is too flawed. But there is much I like about Win Shares, so I soldier on.
In the end, my quest may be quixotic, but as long as I help a few fans see a bit more in the numbers, and help a few researchers get a little more visibility for their efforts, I'll be happy. At least, hopefully, no one will try to drown me.
Dave Studeman is a writer at the Hardball Times, and also the manager of the Baseball Graphs website.
| Designated Hitter | January 11, 2007 |
Humm Baby!
Roger Craig retired at the age of 62, following the 1992 season. He completed a career that had spanned 43 years of nearly continuous employment in professional baseball. Craig isn't in the Hall of Fame, and doesn't deserve to be, but his achievements as a player, coach, and manager were many, and his range of experience - success, failure, and just plain adventure - ranks among the more fascinating in the long history of the sport.
Roger Lee Craig was an impressive physical specimen: 6-foot-4, 190 pounds, a right-handed pitcher with big broad shoulders and long, slim legs. He was born in Durham, North Carolina, on February 17th, 1930. Like so many other players through the decades, Craig lied about his age, passing himself off as having been born on that date in 1931. A one-year difference may not seem like much, but the ruse may well have succeeded in gaining Craig opportunities on several rosters.
Most careers include ups and downs, but few have such roller-coaster peaks and valleys as Craig's. Five years after signing off the North Carolina State campus with Branch Rickey's Brooklyn organization, as a major league rookie Craig found distinct success as a key contributor to the pennant and World Series triumph of the fabled "Boys of Summer" 1955 Dodgers. Yet before he reached the majors, Craig had so fiercely struggled with his control that twice he'd been demoted to lower classifications. In one season he walked 173 minor league batters, and in another 175.
After establishing himself as an effective major leaguer in 1955-56, Craig regressed so badly that he was sent back to the minors in 1958, where he endured a hideous 5-17 campaign. But the next year Craig would not only be recalled to the majors in mid-season, but would deliver a tremendous performance, sparking the now-Los Angeles Dodgers to a second-half drive to another pennant and World Series championship. The team sprinted to the 1959 finish, winning 17 of their final 22, and it was Craig anchoring the kick with four victories and a September ERA of 1.01. On the season's final regular season game, Craig delivered a complete-game 7-1 triumph, clinching a first-place tie.
But two seasons later Craig slumped terribly, his ERA ballooning to 6.15, as he was pummeled for 22 home runs in 113 innings. The Dodgers then allowed him to be picked up in the National League's first-ever expansion draft, and thus began the episode for which Craig is probably best-known: he was the ace pitcher for the famously hapless New York Mets of 1962-63. Deployed in a thankless workhorse role, in two seasons Craig appeared in 88 games for the Mets, 64 of them starts, and 469 innings. Despite pitching reasonably well under these brutal conditions - his ERA+ over that span was 92 - Craig was supported so pitifully that his won-lost record was 15-46. That two-season defeat total was the highest recorded by any major league pitcher since the early 1930s, and will almost certainly never be approached again.
Over the 90-day span from May 4 to August 4 of 1963, Craig lost 18 straight decisions, tying the most ever in the National League. With his record standing at 2-20, in an attempt to change his luck Craig switched his uniform number from 38 to 13. On August 9, with two outs and the bases loaded in the bottom of the ninth in a 3-3 tie against the Cubs, Mets' third baseman Jim Hickman hit a high, lazy fly. Cubs' left fielder Billy Williams settled under it, but the descending ball grazed the overhanging Polo Grounds second-deck scoreboard, fewer than 300 feet from home plate: a grand slam! Craig's streak was over. In the post-game clubhouse celebration, Hickman was quoted: "I think he kissed me."
Following that season Craig was traded to the St. Louis Cardinals. In late July of 1964 the Cards were below .500, in seventh place, before roaring down the stretch to capture their first pennant in nearly two decades. In that fall's memorable World Series victory over the dynastic Yankees, Craig was a particular hero, as described by St. Louis shortstop Dick Groat in Danny Peary's We Played the Game:
Game Four was the key game. We had to win it, but Sadecki fell behind 3-0 in the first inning. [Manager Johnny] Keane brought in Roger Craig with men on first and second. He had the best pickoff move in the league besides Elroy Face. And we picked off Mantle at second. That may have been the biggest play of the Series because it prevented them from scoring again. Craig and Ron Taylor shut out the Yankees on two hits for 8 2/3 innings. And in the top of the fifth, Ken Boyer hit a grand slam homer off Al Downing, which was enough for us to win 4-3. That was the turning point in the Series.
Craig's playing career finally reached its end in 1966, and the following year his old organization, the Dodgers, hired him as a scout. Then in 1968 Craig landed his first managerial job, for the Dodgers' Texas League farm club in Albuquerque.
From 1969 through 1977 Craig served as a major league pitching coach, for the Padres and Astros, as well as a stint as a minor league pitching instructor for the Dodgers. Among the pitchers who blossomed under Craig's tutelage in this period were Dave Roberts, Clay Kirby, Fred Norman, and Joe Niekro. In 1978-79 Craig managed the San Diego Padres; in their first season under his guidance the Padres achieved their first-ever winning record.
Then Craig became the pitching coach for the Detroit Tigers. In his playing days Craig's best pitch was the slider, but in Detroit his teaching of the split-finger fastball to Jack Morris gained Craig particular renown as something of a split-finger guru. In the 1984-85 off-season Mike Scott of the Astros sought out Craig and learned the split-finger from him; Scott's career would utterly turn around. Particularly in Scott's case, the split-finger, which became the emblematic pitch of the 1980s, was widely suspected to be something more of a spit-finger - as in foreign substance, that is.
In September of 1985 Al Rosen, newly installed as the General Manager of the San Francisco Giants, hired Craig as his field manager. The once-proud Giants had been encountering hard times: the 1985 club that Craig took over in the season's final couple of weeks lost 100 games for the only time in franchise history, going all the way back to 1883. Craig undertook bold action in 1986, installing as regulars first baseman Will Clark and second baseman Robby Thompson, even though neither had any experience as high as triple-A. The young team was completely revitalized, surging to first place before eventually finishing third. Craig's positive, good-humored spirit was infectious, and with his all-purpose catch phrase, "Humm Baby!" he became an enormously popular figure in the Bay Area.
In 1987 Craig's Giants won their first division championship since 1971, and in 1989 they captured their first pennant since 1962. Craig's managerial style made audacious use of the squeeze play and featured some highly questionable baserunning aggressiveness: for instance, Clark in 1987 was thrown out 17 times in 22 steal attempts. Nevertheless Craig's teams were loose yet focused, and disciplined on defense. Player after player thrived under Craig's firm-but-warm leadership. Among those who achieved career-best performance while playing for Craig were Clark, Kevin Mitchell, and Candy Maldonado, along with pitchers young and old: Jeff Brantley, Mike Krukow, Kelly Downs, Don Robinson, and his most prominent San Francisco split-finger pupil, the wickedly effective Scott Garrelts.
One of Craig's teammates from his Brooklyn days, Randy Jackson, described him this way:
On the road, I ran around with my roommate, Roger Craig ... Roger was probably my favorite roommate. He was a smart, funny guy.
Through the twists and turns of his long career, Craig maintained that sort of popularity. Few figures in the sport were more respected, and few enjoyed careers as interesting as his.
Hall of Famers who were teammates of Roger Craig:
Sparky Anderson, Richie Ashburn, Lou Brock, Jim Bunning, Roy Campanella, Don Drysdale, Bob Gibson, Ferguson Jenkins, Sandy Koufax, Tommy Lasorda, Tony Perez, Pee Wee Reese, Frank Robinson, Jackie Robinson, and Duke Snider.
Additional All-Stars who were teammates of Roger Craig:
Dick Allen, Gus Bell, Ken Boyer, Ralph Branca, Jackie Brandt, Bob Buhl, Lew Burdette, Johnny Callison, Chris Cannizzaro, Leo Cardenas, Gino Cimoli, Mike Cuellar, Ray Culp, Tommy Davis, Willie Davis, Johnny Edwards, Sammy Ellis, Don Elston, Carl Erskine, Ron Fairly, Dick Farrell, Curt Flood, Carl Furillo, Jim Gentile, Jim Gilliam, Dick Groat, Tommy Harper, Tommy Helms, Bill Henry, Ray Herbert, Jim Hickman, Don Hoak, Gil Hodges, Tommy Holmes, Frank Howard, Ron Hunt, Grant Jackson, Larry Jackson, Randy Jackson, Julian Javier, Joey Jay, Cleon Jones, Darold Knowles, Ed Kranepool, Harvey Kuenn, Clem Labine, Norm Larker, Billy Loes, Sal Maglie, Jim Maloney, Felix Mantilla, Lee May, Tim McCarver, Billy McCool, Dale Mitchell, Wilmer Mizell, Wally Moon, Walt Moryn, Charlie Neal, Don Newcombe, Irv Noren, Joe Nuxhall, Jim O’Toole, Jimmy Piersall, Vada Pinson, Johnny Podres, Rip Repulski, Cookie Rojas, Pete Rose, John Roseboro, Bobby Shantz, Chris Short, Curt Simmons, Bob Skinner, Tony Taylor, Frank Thomas, Bill White, Stan Williams, Maury Wills, Rick Wise, Gene Woodling, and Don Zimmer.
Hall of Famers who managed Roger Craig:
Walt Alston and Casey Stengel.
Hall of Famers who were coached and/or managed by Roger Craig:
Steve Carlton, Gary Carter, Rollie Fingers, Gaylord Perry, Ozzie Smith, and Dave Winfield.
Additional All-Stars who were coached and/or managed by Roger Craig:
Kevin Bass, Steve Bedrosian, Jack Billingham, Vida Blue, Jeff Brantley, Bob Brenly, Chris Brown, John Burkett, Brett Butler, Will Clark, Royce Clayton, Chili Davis, Mark Davis, Ron Davis, Larry Dierker, Pat Dobson, Dave Dravecky, Mark Fidrych, Ken Forsch, Phil Garner, Scott Garrelts, Rich Gossage, Billy Grabarkewitz, Atlee Hammaker, Mike Hargrove, Dave Henderson, George Hendrick, Tommy Herr, John Hiller, Randy Jones, Terry Kennedy, Bob Knepper, Mike Krukow, Mike LaCoss, Jeffrey Leonard, Mickey Lolich, Aurelio Lopez, Willie McGee, Greg Minton, Kevin Mitchell, Jack Morris, Terry Mulholland, Joe Niekro, Matt Nokes, Claude Osteen, Dan Petry, Dan Quisenberry, Mike Remlinger, Rick Reuschel, J.R. Richard, Dave Righetti, Lary Sorensen, Chris Speier, Gene Tenace, Robby Thompson, Manny Trillo, Matt Williams, Don Wilson, and Joel Youngblood.
Steve Treder is a staff writer for The Hardball Times, has presented papers to the Cooperstown Symposium on Baseball and American Culture, and had numerous articles published in Nine: A Journal of Baseball History and Culture. A lifelong San Francisco Giants' fan, he is Vice President for Strategic Development for Western Management Group, a compensation consulting firm headquartered in Los Gatos, California.
| Designated Hitter | January 04, 2007 |
Baseball Immortality: It's in the Bags
It was essentially a foregone conclusion that Jeff Bagwell would retire after the 2006 season, and he left the game on the field with little fanfare outside of Houston. The last memories of Jeff Bagwell as a player come from his first and only appearance in the grand stage of the World Series in October 2005, with his Astros falling to the Chicago White Sox in just four games, although that certainly is not the legacy he left behind.
During the course of his 15 seasons on the field for the Astros, Jeff Bagwell was one of the most consistent and productive baseball players in either league, and finished his career as one of the top first basemen in history. Sixteen years ago, few would have predicted anything resembling baseball immortality for the man who would become known simply as "Bags."
Jeff Bagwell was born on May 27, 1968; this is the same birthday as fellow first base slugger, Frank Thomas. After attending Xavier High School in Middletown, CT, Bagwell attended the University of Hartford before he was drafted by the Boston Red Sox in the fourth round of the 1989 amateur draft. Bagwell had grown up a Red Sox fan, idolizing Hall of Famer Carl Yastrzemski, and was now a member of the same organization.
In 1989, Bagwell spent most of his season with Winter Haven of the Florida State League. He would hit .310/.384/.419 there while only striking out around 10 percent of the time. He would follow that up with a more impressive stint at New Britain of the Eastern League in 1990: Bagwell hit .333/.422/.457 with 34 doubles and 7 triples, but only 4 homeruns.
The problem was that the Red Sox were seemingly set at third base, Bagwell's position at the time. Future Hall of Famer Wade Boggs was the current third baseman, and the Red Sox had Scott Cooper - who would finish his career with a paltry OPS+ of 89 - waiting in the wings at third base. Lou Gorman, General Manager of the Boston Red Sox at the time, dealt Jeff Bagwell to the Houston Astros in exchange for relief pitcher Larry Andersen. The Red Sox would go on to win the division title, and Bagwell would put together a Hall of Fame caliber career for the 'stros. That trade has been lambasted so universally that it was given its own chapter in Rob Neyer's Big Book of Baseball Blunders:
In the Stats 1991 Major League Handbook - published shortly after the 1990 season - Bill James published projections for 413 major league hitters...But there was another set of projections: fifteen minor-leaguers included under the heading, "These Guys Can Play Too And Might Get A Shot." And among those fifteen minor leaguers was Jeff Bagwell, with a .318 batting average. Better than Tony Gwynn's...the underlying causes of the nonprediction were simple: the Eastern League was a pitcher's league, and New Britain's Willow Brook Park was a pitcher's ballpark. Bagwell was twenty-two in 1990, and he'd batted .333 with thirty-four doubles (tops in the league) and seventy-three walks (fourth in the league). Gorman simply didn't know how good Bagwell was.
Bagwell would appear in only seven more minor league games from this point forward, and those were all for rehab stints. Gorman had dealt Bagwell for a variety of reasons: he would need to switch to first base, he wasn't expected to develop homerun power, and the Sox needed the help badly in the bullpen. Well, Bagwell turned into a Gold Glove first baseman and hit 449 homeruns, but never did develop that secondary pitch that would have made him a valuable mop-up guy out of the pen.
Bagwell's first major league season went very well, with Bags bringing home the Jackie Robinson Award at year's end after hitting .294/.387/.437 in one of the toughest home parks for a hitter in the history of the game - Clay Davenport's translations spit out an equivalent line of .316/.414/.509, to put his production into context. It was not particularly close either, with Bagwell taking all but one first place vote. The following year, Bagwell would hit .273/.368/.444 and be worth 10.4 Wins Above Replacement. Before he even developed the power that he was later known for, Bagwell had already put together a 10-win season; not to continue to beat a thoroughly flogged and quite dead horse, Larry Andersen was only worth 7.9 WARP1 from 1990 Boston to the end of his career with Philadelphia in 1994.
In 1993 Bagwell put together what should have been another 10-win season, but fell just short of that mark as a result of playing in only 142 games. He did manage to hit .320/.388/.516 though, thanks in part to a .342 batting average on balls in play. This was exceptional for the Astrodome, and would only improve the following season, the best of Jeff Bagwell's career.
1994 was cut short for Jeff Bagwell because of a broken hand suffered on a hit-by-pitch as well as the player strike. By season's end, though, Bagwell had posted an OPS of 1.201 by hitting .368/.451/.750. Bags walked 65 times while striking out just as often, hit 39 homeruns in 400 at-bats, finished with 73 extra-base hits, posted the best defensive season of his career according to Rate while winning a Gold Glove, and even stole 15 bases at a 79 percent success rate. Measured by OPS+, Bagwell's season was 113 percent above the average, good for the 24th best mark of all-time, and one point and rank ahead of his birthday mate, Frank Thomas, whose loftiest mark came in 1994 as well. Both players took home the Most Valuable Player award at the end of the year with Bagwell becoming just the fourth player in history to do so unanimously. Bags also won the Silver Slugger Award for first base as well while making the first of three All-Star appearances. Incredibly, most of this production came at home: Bagwell hit .373/.459/.816 in the Astrodome, and "only" .362/.443/.683 on the road. His Davenport Translated line was .370/.464/.792; that's the kind of line that would force Babe Ruth to buy you a beer or two.
In 1995, Bagwell's season was cut short by a broken hand for the third consecutive year. He was vulnerable to inside pitches because of his unique stance; he began in a wide-open, crouched stance - almost like he was sitting in an imaginary chair - and would explode upwards into his swing. He began to wear protective padding on his batting gloves to shield his hands, and did not succumb to a broken hand again. I once wore Jeff Bagwell's batting gloves at the All-Star Fanfest from the 1999 All-Star Game in Boston, and I can vouch for how heavily padded they were. With his now-protected hands, Bagwell was able to post the second-best season of his career in 1996, putting together a 12-win season that was all bat, finishing with a 179 OPS+.
Bagwell's peak offensive years were from 1994-1999, with Equivalent Averages of .385, .318, .355, .342, .335, and .343. According to Jay Jaffe's JAWS system, which leverages career and peak WARP into one number to help determine Cooperstown worthiness, Bagwell's peak WARP score is third best all-time among first basemen, behind only Lou Gehrig and Cap Anson. He was very good-to-excellent from 2000 to 2004, but not quite as dominant as his peak. The Astros signed him to a five-year extension in 2001 that would prove ill-fated, as Bags' arthritic shoulder began to bother him to the point of missing significant chunks of time in the fourth year of the deal.
During the 2004 season, Bagwell was able to exorcise the playoff demons that haunted the Astros' Killer B's from their first playoff trip in 1997 up through 2001. He hit .318/.400/.682 in the National League Division Series against the Braves and .259/.355/.333 against the Cardinals in the National League Championship Series, vast improvements on his career playoff line of .174/.344/.174 prior to that year. The lack of timely playoff hits had plagued the Astros' most productive hitters every year they failed to win a playoff series, although the sample sizes were small and the circumstances usually beyond their control.
Bagwell also had some interesting streaks in his career: from 1996 to 2001, he hit 30 homeruns, drove in 100 runs and scored 100 runs. From 1996 to 2002, he walked at least 100 times, and had six seasons with over a .300 batting average, much to Lou Gorman's chagrin. Bagwell also managed to steal 202 bases over his career while only getting caught 78 times (72 percent success). In 1997, he became the first player at first base to record over 30 homeruns and 30 steals in the same season, a feat he duplicated in 1999. As previously mentioned, Bagwell was a fine defensive first baseman, with 127 Fielding Runs Above Average to his credit, as well as a Gold Glove in 1994.
He would play his last game in front of the hometown Astros fans at Minute Maid Park, coming to bat as a pinch hitter who did not reach base; an anticlimactic ending for an incredible player in his first trip to the World Series. With the end of his career, eyes now turn towards his Hall of Fame credentials. Some may question the validity of his statistics because of the era he played in, and others may take his numbers at face value with nary a mention of performance enhancing drugs in his history. Statistically, Bagwell is a shoo-in [corrected], with his Hall of Fame Monitor score of 149.5 where the average Hall of Famer is 100, and his Hall of Fame Standard score of 59.0 where the average Hall of Famer is a 50, as well as his JAWS score of 106.4, third all-time among first basemen. Whether or not he actually makes it is another story entirely, as he finished with 2,314 hits and 449 homers, relatively low totals for Hall of Fame first basemen, or so the belief goes among more traditionally minded baseball fans.
Jeff Bagwell could be a victim of his success in other areas; Bill James has said that players who do very well in many aspects of the game are often overlooked in favor of those who excel greatly in just one area, and Bagwell was an extremely well-rounded player, especially for a first baseman. Here's hoping from one of his fans that history smiles kindly upon him and remembers the man for what he contributed in all facets of the game, rather than a lack of 3,000 hits or 500 homeruns or some such nonsense.
Marc Normandin is a communication major at Merrimack College in Massachusetts, and currently writes a weekly column for Baseball Prospectus. He also contributes to the digital magazine HEATER, writes occasional guest columns at Mets Geek, and posts analysis at his blog Beyond the Box Score.
| Designated Hitter | December 07, 2006 |
Expanding the Strike Zone
About a year ago, I wrote an article entitled Pitchers, Pitch by Pitch. Using pitch location data from Baseball Info Solutions, I looked at how often individual pitchers get batters to chase pitches outside the strike zone, or in other words, swing at pitches they shouldn't be swinging at. I called this stat Outside Swing Percentage or OSwing, for short.
To recap: OSwing correlated with a pitcher's strikeout-to-walk ratio and just for fun, let's look at the starting pitchers and relievers who had the highest OSwing the past two seasons.
Name                     2005    Name                   2006
Brad Radke             31.76%    John Smoltz          33.00%
Johan Santana          30.21%    C.C. Sabathia        31.47%
Curt Schilling         29.60%    Jeremy Bonderman     31.01%
Felix Hernandez        28.43%    Roger Clemens        30.88%
John Smoltz            27.53%    Curt Schilling       30.76%
Odalis Perez           27.47%    Johan Santana        30.72%
Jon Lieber             26.44%    Jake Peavy           30.61%
Rich Harden            26.00%    Roy Halladay         29.55%
Andy Pettite           25.97%    Odalis Perez         29.16%
Paul Wilson            25.33%    Aaron Harang         28.91%
Name                     2005    Name                   2006
Brad Lidge             32.41%    Cla Meredith         37.88%
Rudy Seanez            30.93%    Patrick Neshek       35.92%
Mike Wuertz            28.67%    Mariano Rivera       34.13%
Derrick Turnbow        28.40%    Mike Wuertz          32.57%
Jonathan Papelbon      28.27%    J.J. Putz            32.18%
Julio Santana          28.01%    Brian Sikorski       32.00%
Bobby Jenks            27.68%    Francisco Rodriguez  31.65%
Kyle Snyder            27.06%    Dennys Reyes         31.56%
Tyler Walker           26.71%    Scott Proctor        31.54%
Eddie Guardado         26.69%    Ramon Ramirez        31.31%
All in all, some fairly prestigious lists, especially the 2006 list of starting pitchers, but OSwing is hardly a "magic bullet stat" since there are some players on these lists I'm sure you're scratching your head at. Let's take a step back for a moment and think about the relationship between batters and pitchers.
Ideally, a pitcher is going to try and get ahead in the count and when this happens the pitcher has effectively "expanded the strike zone" since the batter is now on the defensive and will be more prone to chase pitches outside the strike zone. Conversely, when a pitcher is behind in the count, a batter will be less prone to chasing bad pitches. Looking at OSwing by count this becomes fairly evident.
Count         OSwing         ZRatio
0-0           11.33%           1.15
0-1           22.54%           0.83
0-2           31.57%           0.51
1-0           18.61%           1.31
1-1           26.78%           1.05
1-2           37.37%           0.70
2-0           16.38%           1.61
2-1           28.58%           1.41
2-2           41.40%           0.98
3-0            2.69%           1.73
3-1           23.37%           1.67
3-2           44.86%           1.57
Furthermore, if you look at the ratio of balls thrown in the strike zone to those outside the strike zone (ZRatio), you can see that when a pitcher is ahead in the count, he's much less likely to pitch in the strike zone. So, is how often a pitcher gets a batter to chase a ball outside the strike zone merely a matter of his skill at managing the count?
Not exactly. While the two are hardly mutually exclusive, some pitchers do seem to be able to make batters chase pitches outside the strike zone more than others in the various counts. Here are the 15 starting pitchers who get ahead in the count the most and their OSwing above (or below) the MLB average when ahead in the count.
Starter              OSwing(Above Average)         Ahead%
Johan Santana                      22.89%          33.91%
Curt Schilling                     19.34%          33.74%
John Smoltz                        27.29%          33.55%
Mike Mussina                       -4.35%          33.27%
Roy Oswalt                          6.43%          33.21%
Elizardo Ramirez                   -1.56%          32.84%
C.C. Sabathia                      37.21%          32.81%
Brad Radke                          4.99%          32.35%
Paul Byrd                           3.93%          31.97%
Jon Lieber                          1.01%          31.68%
Francisco Liriano                  20.35%          31.37%
Randy Johnson                      19.13%          30.73%
Pedro Martinez                      3.40%          30.72%
John Lackey                        17.62%          30.64%
Cliff Lee                           1.93%          30.55%
As you can see, many of the top pitchers in baseball get ahead in the count, but they don't always have the same success getting batters to swing at their pitches outside the strike zone. Let's have a look at the relievers:
Starter              OSwing(Above Average)         Ahead%
Patrick Neshek                     30.22%          39.82%
Rafael Betancourt                  -1.81%          39.64%
Chad Bradford                      -3.44%          36.69%
Jose Valverde                     -12.64%          36.26%
Mike Timlin                         9.34%          35.78%
Trever Miller                      14.74%          34.99%
J.J. Putz                          18.50%          34.93%
B.J. Ryan                          10.92%          34.92%
Todd Jones                          8.87%          34.75%
Justin Duchscherer                  5.01%          34.62%
Rafael Soriano                     25.02%          34.49%
Mariano Rivera                     30.22%          33.73%
Matt Capps                          4.88%          33.60%
Jonathan Papelbon                  22.20%          32.78%
Cla Meredith                       71.75%          32.78%
Once again, pretty much the same deal with the relievers. It's worth noting that Cla Meredith's 71.75% above average OSwing was by far the highest in baseball when ahead in the count. Batters swung at just over half the pitches he threw out of the strike zone.
Just looking at these two lists, I'd venture to say that the pitchers who more often than not get ahead in the count, and those who were also able to get batters to chase pitches more than the MLB average would probably be the most dominant pitchers in baseball. Let's look at one final list where the pitchers are at least 15% above the MLB average in OSwing and percent ahead in the count.
Name            OSwing(Above AVG) Ahead%(Above AVG)  ERA      K9    BB9
Patrick Neshek            30.22%          46.24%    2.18   12.89   1.45
J.J. Putz                 18.50%          28.26%    2.29   11.94   1.49
Rafael Soriano            25.02%          26.65%    2.25    9.75   3.15
Johan Santana             22.89%          24.54%    2.77    9.43   1.81
Curt Schilling            19.34%          23.92%    3.97    8.07   1.23
Mariano Rivera            30.22%          23.88%    1.80    6.60   1.32
John Smoltz               27.29%          23.22%    3.49    8.18   2.13
C.C. Sabathia             37.21%          20.48%    3.22    8.03   2.05
Jonathan Papelbon         22.20%          20.38%    0.92    9.87   1.71
Cla Meredith              71.75%          20.37%    1.06    6.57   1.06
Matt Thornton             15.10%          18.31%    3.33    8.16   3.50
Scott Proctor             25.63%          17.25%    3.51    7.82   2.90
Bill Bray                 29.43%          17.08%    4.08    6.92   3.19
Brian Sikorski            27.47%          16.14%    5.02   10.05   1.85
Alan Embree               36.32%          15.81%    3.26    9.11   2.57
Joe Nathan                20.58%          15.48%    1.58   12.51   2.10
Francisco Liriano         20.35%          15.20%    2.15   10.71   2.38
Brandon League            23.21%          15.09%    2.53    6.11   1.89
A pitcher's ability to expand the strike zone is something that is widely talked about, but rarely quantified. What I find most fascinating about all this is that by using location data, it should be possible to see exactly how far and where the strike zone expands/contracts for individual pitchers and batters depending on the count. It sounds like the type of information that could really make a difference in statistical scouting reports. But that's another project for another day.
David Appelman is the creator of FanGraphs.com. You can contact him via e-mail.
| Designated Hitter | December 01, 2006 |
The Worst Minor League Defenders
When a prospect gets a reputation as a bad fielder, his chances of future success go down, fast. An infielder like Joel Guzman could be permanently moved to a less defensively-demanding position such as first base or a corner outfield spot. A poor outfielder such as Jack Cust becomes viewed as a DH, relegating him, in all likelihood, to DHing in Triple-A.
Some of those reputations are deserved; others aren't. However, the point is only that bad defenders in the minors are easy to overvalue: if, say, Elvis Andrus's future is in left field, his future isn't as bright as it is if he proves he can make the grade at shortstop.
It isn't yet clear how minor league defensive numbers translate to their equivalents at the big-league level, but it seems like a safe bet that the overall quality of defense goes up. Thus, a player who is below average in the minor leagues isn't likely to contribute with the glove when he earns a promotion to the show - that is, if he stays at that position at all.
Yesterday, we looked at the best minor league fielding performances of 2006. Today, let's turn to those guys whose gloves may keep them from advancing, or whose performance may send them spilling down the wrong side of the defensive spectrum. As I pointed out yesterday, these numbers aren't a final judgment on each player's defensive skill - they are simply a good estimation of how well he performed this past season. Young players can still improve, and lady luck can reverse itself.
The lists are generated by the same method as the "Best of" lists in yesterday's article. IP is the number of innings played at the position (there's a minimum of 600 for inclusion), PAA is the number of plays above an average fielder at that position in that league, and PAA/150 is plays above average per 150 games. Of course, for the worst fielders, PAA and PAA/150 will be negative. Once again, the numbers aren't adjusted for park, league, or level.
Second Base
Player            Level   Org      IP      PAA    PAA/150
Edgar V Gonzalez  AA/AAA  Flo      697.3   -36     -70
Hector Pellot     A       Nym      803.3   -38     -64
Micah Furtado     A+      Tex      629.3   -29     -63
Felix Molina      AA      Min      852     -31     -49
Corey Wimberly    A+      Col      682.3   -23     -47
Isaac Omura       A       Oak      632     -20     -44
Nate Spears       A+      Chc      711     -23     -44
Dan Dement        AA      Was     1064.7   -34     -43
William Bergolla  AAA     Cin      820.3   -25     -42
Jeff Natale       A/A+    Bos      741     -23     -42
Few of the names at the top of this list have much of a future with their bats, so these fielding numbers may be the final nails in each coffin. Bergolla's defensive skills will probably keep him from having much value in a utility role, and Natale's - as has been predicted since he was drafted - will surely lead to a move away from second base. The notable prospects who are significantly below average are Kevin Melillo of the A's, Martin Prado of the Braves, and Hernan Iribarren of the Brewers.
Third Base
Player            Level   Org      IP      PAA    PAA/150
Koby Clemens      A       Hou      705     -28     -54
Chase Headley     A+      Sdp     1099     -32     -40
Bryan Bass        A+/AA   Bal     1000.3   -28     -38
Brian Snyder      A+/AA   Oak      846.3   -23     -37
Ryan Braun        A+/AA   Mil     1008.7   -27     -36
Ryan Barthelemy   A+      St.      638.7   -16     -34
M. Vechionacci    A/A+    Nyy     1112.3   -28     -34
Matthew Brown     AA      Laa     1123.3   -27     -33
Josh Fields       AAA     Chw      973.3   -24     -33
Mike Kinkade      AAA     Flo      615     -13     -31
Again, these numbers match up with conventional scouting analyses in a couple of big-name cases. Braun is a good bet for an eventual move to the outfield; Fields has already begun working on a possible transition. Braun's stats over the course of the year make a case for either the volatility of defensive stats or the difference between Single-A and Double-A. He was slightly above average in his half season in the Florida State League, but in fewer than 60 games at Double-A, he was 28 plays below average. Other prospects on the wrong side of average are Eric Campbell (-27 PAA/150) and Matt Tuiasosopo (-21).
Shortstop
Player            Level   Org      IP      PAA    PAA/150
Diory Hernandez   Rk/A+   Atl      664     -33     -67
Sergio Santos     AAA     Tor     1116     -53     -65
Matt Smith        A       Tex     1039     -47     -62
Ian Desmond       A+      Was      768.3   -31     -56
Eduardo Nunez     A/A+    Nyy      831.3   -34     -55
Alcides Escobar   A+      Mil      689     -27     -55
Chris Nelson      A       Col      951.7   -35     -50
Jeffrey Dominguez A/A+    Sea      868.3   -31     -48
Chris McConnell   Rk/A    Kan      967.3   -31     -43
Matt Maniscalco   AA      Tam      887.3   -27     -41
Elvis Andrus      A       Atl      894     -26     -39
When the Blue Jays traded Orlando Hudson and Miguel Batista for Troy Glaus and Sergio Santos, they couldn't have made a much more lopsided deal, at least so far as defensive performance is concerned. In addition to Alcides Escobar, there are a number of fielders whose gloves have gotten raves but did not score well with Range: Erick Aybar and Chin-Lung Hu are a bit below average, Asdrubal Cabrera came out at -36 PAA/150, and Ben Zobrist ended up at -30.
Center Field
Player            Level   Org      IP      PAA    PAA/150
Jerry Gil         AA/AAA  Ari      800     -36     -61
Kevin Mahar       AA      Tex      609     -22     -49
Juan Senreiso     A+      Kan      825.3   -25     -41
Clay Timpner      AA/AAA  Sfg     1079.7   -31     -39
Joe Holden        SS/A    Nym      841.7   -24     -38
Trevor Crowe      A+/AA   Cle      722.7   -20     -37
Austin Jackson    A       Nyy     1089     -28     -35
Jeff Salazar      AAA     Col      712.3   -18     -35
David Murphy      AA/AAA  Bos      891.3   -23     -35
Austin Jackson    A       Nyy     1097     -28     -34
Matt Kemp and Reggie Willits both scored just below average in this metric, but other than those two, there aren't a lot of discrepancies between conventional scouting wisdom and this year's center field numbers. Fernando Martinez made 7 fewer plays than average in just over 600 innings, but his future is probably in a corner. The only surprise on this list is that a center fielder could conceivably be bad enough to cost his team more than two wins with the glove - and keep getting starts in center.
Left Field/Right Field
Player            Level   Org      IP      PAA    PAA/150
Mitch Jones       AAA     Nyy      735     -30     -55
Shin-Soo Choo     AAA     Sea      681.7   -27     -53
Brian Mc Fall     A+      Kan      920.7   -36     -53
Daniel Carte      A       Col      954.7   -34     -48
Ryan Harvey       A+      Chc      998.7   -34     -46
Delwyn Young      AAA     Lad     1088.3   -37     -46
Brian Pettway     A       Tor      872.7   -29     -45
Xavier Paul       A+      Lad      993.3   -33     -45
Garrett Guzman    A+/AA   Min      905.7   -30     -45
Sergio Pedroza    A       Lad      760.3   -25     -44
Some of these players may well bounce back to be average, or slightly below-average defenders, but it's worth noting that these ten outfielders - plus Sergio Pedroza, Chris Lubanski, and a few others - were all worse with the glove than Jack Cust. More shocking than that is that Lubanski saw 225 innings in center field. I use the verb "saw" because it appears that's all he did: in that time, he was 17 plays below average, resulting in -104 PAA/150, a performance so bad I don't have an adjective for it. Other familiar names within spitting distance of the Cust line: Jeffrey Corsaletti, Ryan Patterson (who also, inexplicably, saw 141 innings in center, with Lubanski-like results), Nolan Reimold, and Billy Butler.
By Way of Conclusion...
If you're interested to see more, these numbers are now available for every 2006 minor league player at MinorLeagueSplits.com. In another year or two, with additional full seasons of play-by-play data, it will be easier to make confident claims about the defensive skill of minor leaguers. It also may be possible to analyze the effects of position switches, so when all of these players become corner outfielders, we can predict whether they'll give Chris Lubanski - or even Jack Cust - a run for his money.
| Designated Hitter | November 30, 2006 |
The Best Minor League Defenders
Prospect analysis has always been one of the most contentious issues in the "stats vs. scouts" debates. However, for all the breakthroughs in statistical techniques, analysts have almost always had to rely on scouting to assign a value to the defensive contribution of a young player.
No longer. Through its website, Minor League Baseball has made available a play-by-play log of every game played in the affiliated minors, complete with some batted-ball information. A person with enough time, desire, and misdirected energy can track every ball that was pitched, hit, or caught by a bush leaguer in 2006.
For pitching and hitting, there's MinorLeagueSplits.com. We can turn our attention, then, to fielding. Using a statistic called Range, I came up with plus/minus ratings for every 2B, 3B, SS, and OF in the minors. (For more information on how Range is calculated, here's David Gassko's introduction to his creation.)
I haven't yet calculated the run values of plays at various positions for each league, but you can estimate them if you wish. A single is worth about half a run, so if you figure every extra play that an infielder makes saves a single, divide the number of plays by 2 and you've got runs above average. (Odds are the infielder--particularly if he's a third basemen--saved a few doubles too, so actual runs saved is somewhat higher.) Outfielders save more runs per play; a higher percentage of the plays they make would otherwise turn into doubles and triples, which are worth about 0.72 and 1.04 runs, respectively.
Before looking at some of the best fielding performances in the minors, I feel obligated to spend a couple of paragraphs hedging. Note I used the word "performance." There's plenty of luck in just about every baseball stat, and that goes double for defensive stats. A good fielding performance means that a defender made more plays than you'd expect him to. It doesn't mean he's the next Adam Everett (though he could be!), or that he'll even be above average next year, just that he had a great year.
Another lacking--and this is something I'm working on--is that all of these stats are relative to league average. It seems like a reasonable assumption that an "average" shortstop in Triple-A is much better than his "average" counterpart in Single-A. Along the same lines, an average fielder in Triple-A would be below average in the majors. Many players improve in their first few years in organized ball, and more importantly, those who aren't good enough either get cut or move to a less demanding position.
Finally, these numbers aren't park-adjusted. With only one complete year of data to go on, defensive park factors would be almost as unreliable as the numbers they would adjust. Keep that in mind when you see some of the staggeringly high play totals for corner outfielders.
What follows is a top-ten list for the minor leagues at every position I've done so far. Each list shows the number of innings played at the position (IP), the number of plays made above average (PAA), and the number of plays above average per 150 games (PAA/150). The cutoff for inclusion is 600 innings played at that position; in most cases, the stats you see reflect the player's entire season, regardless of whether they were promoted or traded at some point. With all of that out of the way, let's see some numbers!
Second Base
Player            Level   Org      IP      PAA    PAA/150
Mario Holmann     A/A+    Nyy      727.7    49      91
Brian Cleveland   A+/AA   Flo      674      33      66
Fernando Cortez   AAA     Kan/Tam  699.3    29      56
Joshua Johnson    A       Kan      865.7    35      55
Eric Patterson    AA/AAA  Chc     1147      41      48
Drew Sutton       A+      Hou     1016.7    36      48
Luis Cruz         AA      Sdp      701      24      46
Jayson Nix        AAA     Col      867.7    29      44
Brooks Badeaux    AA/AAA  Bal      649.3    21      44
James Guerrero    A       Flo      608.3    19      41
After Eric Patterson and maybe Jayson Nix, this is not a list of attention-getting names. Indeed, there aren't a whole lot of big-name 2B prospects in the minors; many future second basemen still consider themselves shortstops. That said, Dodger farmhands Blake Dewitt and Tony Abreu both look solid: each are in the top 20 of all minor leaguers, with 20 and 22 PAA/150, respectively.
Third Base
Player            Level   Org      IP      PAA    PAA/150
Jonathan Malo     SS/A+   Nym      707.7    37      71
Edward Lucas      A+      Kan     1036.7    46      59
Patrick Cottrell  A+      Tam      898      37      55
Kevin Kouzmanoff  AA/AAA  Cle      633.7    24      51
Brennan King      AAA     Phi      821.7    30      49
Vince Rooi        A+      Pit      929.7    34      49
Ian Stewart       AA      Col     1006.3    34      46
Phillip Cuadrado  A       Col      743.3    25      45
Nick Petrucci     A       Cle      752.3    24      44
Pat Osborn        AA      Cle      614.3    20      43
Even after trading Kevin Kouzmanoff, the Indians are stacked. Five more spots down the list is Andy Marte at 36 PAA/150. However, in the neighborhood are also some names that may lead you to question how valuable an above-average AAA defender is: Earl Snyder, Mike Hessman, and Fernando Tatis are among the top 30, above 20 PAA/150. Either Snyder and Hessman have gotten bad raps that relegate them to the Quad-A all-star team, or the difference between MLB-quality and AAA-quality hot corner defense is huge.
Shortstop
Player            Level   Org      IP      PAA    PAA/150
Ramiro Pena       A+/AA   Nyy      673.3    36      72
Kevin Hooper      AAA     Det      669.7    35      71
Agustin Septimo   A       Flo      631      33      70
Jonathan Diaz     SS      Tor      625      32      70
Agustin Septimo   A       Flo      644.3    32      67
Leonardo Acosta   Rk/A    Chw      693.7    32      62
Brent Lillibridge A       Pit      624.3    28      60
Brian Bixler      A+      Pit      623.7    27      57
Andy Cannizaro    AAA     Nyy      879.3    36      55
Oswaldo Navarro   AA      Sea      694.3    26      50
Jesus Gonzalez    A       Tor      796.7    28      48
Meet your future utilitymen. If any of these guys can consistently play shortstop at this level, there ought to be a roster spot for them someday. (Though Andy Cannizaro might be best off finding a new organization.) Of the big-time SS prospects in the minors, Reid Brignac, Brandon Wood, and Dustin Pedroia had the best defensive seasons in 2006, each in the neighborhood of 10 PAA/150. On the basis of their performance this year, Troy Tulowitzki, Erick Aybar, Chin-lung Hu, Stephen Drew, and (surprise) B.J. Upton will need to improve substantially to play a decent big-league shortstop.
Center Field
Player            Level   Org      IP      PAA    PAA/150
Jacoby Ellsbury   A+/AA   Bos      914      44      65
Justin Upton      A       Ari      918.3    32      47
Brent Johnson     A+      Sea      847.3    28      45
Dustin Majewski   A+/AA   Tor      856      28      44
Tony Gwynn Jr.    AAA     Mil      812.7    26      44
Antoan Richardson A       Sfg     1000.7    29      39
Chris Amador      A+/AA   Chw      805.7    23      39
Sam Fuld          A+      Chc      734      21      38
Yordany Ramirez   A+      Sdp      638.7    17      37
Matt Young        A+      Atl      747      20      36
I can't wait to work out MLB equivalents for these; if Ellsbury's true talent level is even half of his 2006 PAA/150, he could be one of the best defensive centerfielders in baseball right now. It's tough to get quite so excited about Justin Upton just yet, but Diamondbacks fans who would like to see him stick in center have to be encouraged by his ranking here. Just out of the top 10 is another major prospect, Carlos Gomez of the Mets, who put together 32 PAA/150.
Other prospects who seem to deserve their reputations are Chris Young (28 PAA/150), Michael Bourn (26), Cameron Maybin (21), Felix Pie (19), Adam Jones (18), and Fernando Perez (16).
Left Field/Right Field
Player            Level   Org      IP      PAA    PAA/150
Tim Battle        A/A+    Nyy      899.3    56      84
Drew Anderson     AA/AAA  Mil      953.7    55      78
Quentin Davis     A       Atl      736.3    42      77
Charlton Jimerson AAA     Hou      685.7    34      67
Jonel Pacheco     A       Nym      889.3    33      50
Travis Buck       A+/AA   Oak      749.7    27      49
Leyson Septimo    A       Ari     1111.3    38      46
Brian Gordon      AAA     Hou      672      22      44
Cody Strait       A+      Cin     1144.7    37      44
Doug Clark        AAA     Oak      750.3    23      41
Since so many minor leaguers bounce around the outfield, especially when they switch teams, there are lot more qualifying corner outfielders if I put the innings totals together. As I mentioned above, some of these numbers are ridiculously high for corner guys--do you really think Tim Battle was worth 3 or 4 wins with the glove? It's always possible: in 233 innings in center, Battle racked up another 12 plays above average.
Of the familiar names who had good defensive seasons, Adam Lind sticks out; there seem to be plenty of questions about his glovework, but he put up 28 PAA/150 in 2006. Also respectable were Nelson Cruz (38, good for a spot in the top 20), Luke Scott (22), and Hunter Pence (18).
By Way of Conclusion...
There's a lot of work left to be done to know just how much these numbers mean, but if nothing else, it's nice to have some statistical corroboration for some common scouting reports. It will probably take another season or two of data to come up with accurate park adjustments and comparisons between each level and the major leagues. For now, we can already spot some potentially undervalued players, and raise our eyebrows at the raves granted to others. Standing at the edge of a new frontier is always exciting, even if you can see nothing but clouds.
Jeff Sackmann is a weekly columnist for The Hardball Times and the creator of MinorLeagueSplits.com, the only source for comprehensive split and situational stats for every active Minor Leaguer. He is a long-time Brewers fan and blogs about them at BrewCrewBall.com. He also contributes to the fantasy magazine Heater and the football site PackerBackerBlog.com. Jeff lives in New York City, where he earns his keep helping people get into business school.
| Designated Hitter | November 13, 2006 |
Van Lingle Mungo
"Pray for Sain" proclaimed the headlines following the recent passing of the former Boston Braves righthander. Johnny Sain died on November 7, 2006, at a nursing home located in the Chicago suburb of Downers Grove. He was 89.
Although most famous by his inclusion in a poem about the 1948 Boston Braves' pitching rotation alongside portsider Warren Spahn, Sain's career made him a veritable Forrest Gump in baseball history. On April 15, 1947, he became the first to face Jackie Robinson in a major league contest. A year later, he defeated the legendary Bob Feller in the opening game of the World Series. Although the Indians triumphed in 1948, Sain won three World Championships as a member of the New York Yankees. He served his country as a Navy test pilot in the Second World War. As a pitching coach, Sain oversaw the emergence of Minnesota's Jim Kaat, Detroit's Mickey Lolich, and Chicago's Wilbur Wood. The M&M Boys. McLain's record of 31-and-6. Ted Turner's experiment in the dugout. Sain, a native of Havana, Arkansas, saw 'em all.
With Sain's passing, there are only six living members of the original 38-man roster to be immortalized in Dave Frishberg's novelty hit "Van Lingle Mungo."
According to Brendan Boyd and Fred Harris, authors of "The Great American Baseball Card Flipping, Trading, and Bubble Gum Book," Van Lingle Mungo is perhaps the only major league player best known as a song title, "...with the possible exception of Blue Moon Odom and Sonny Siebert." Mungo, a fireballer and strikeout artist born in Pageland, South Carolina in 1911, pitched for the Brooklyn Dodgers and the New York Giants from 1931 to 1945. Mungo averaged 16 wins from 1932 to 1936 pitching for the perennial second division dwelling Dodgers.
"Mungo and I got along just fine," reported Casey Stengel, his manager on the Dodgers. "I won't stand for no nonesense, and then I duck." Frustrated that an inept supporting cast prevented him from achieving a win-loss percentage to match his latent, he frequently allowed his wildness and his mercurial temper to get the better of him. Mungo led the senior circuit with 238 strikeouts, but his career began to unravel after sustaining an arm injury in 1937. Over the next four seasons, the righthander yielded nine wins and one bizarre spring training injury, prompting his release from Brooklyn in 1941. Purchased by the Giants a year later, Mungo amassed a comeback as a junkballer, posting a 14-7 record in his finale season of 1945. Tommy Lasorda, although a lefthander, earned the childhood nickname of 'Mungo' to his resemblance to Van Lingle on the pitcher's mound.
Nearly a quarter century later had passed. In 1969, Van Lingle Mungo's notoriety on a baseball diamond was about to be eclipsed by his celebrity in sheet music. Jazz pianist Dave Frishberg was about to pen his first vocal album. The 36-year-old's resume already boasted accompaniments for Carmen McRae, Gene Krupa, Al Cohn, and Zoot Sims. After two series of lyrics were rejected by record companies, he turned his lonely eyes to his childhood passion of baseball. After buying an original edition copy of the MacMillan Baseball Encyclopedia, Frishberg sorted through the pages when he glanced across Mungo's name. Inspired, he began to compose lyrics to a song consisting almost exclusively of the names of baseball players from his youth. Only 'big' and 'and,' as in "Big Johnny Mize and Barney McCosky," elude the pages of Big Mac or Total Baseball. The result was an accidental hit single, which for Frishberg, became his signature tune for decades.
As homage to his own youth, Frishberg's composition was designed to create a sense of nostalgia in the listener. "Van Lingle Mungo" harkens back to a time when ordinary men became superheroes for the youth of America simply by assuming a baseball uniform. It was an age when legendary voices of radio transmitted their colossal achievements on the diamond while baseball cards provided them with a human face. Perhaps a listener will remember an achievement, a footnote, or a personal connection:
- Heinie Majeski: An original member of the modern Baltimore Orioles
- Johnny Gee: Before Randy, no baseball player was taller than him
- Eddie Joost: He was the last manager in Philadelphia Athletics history
- Johnny Pesky: He was a neighbour of my cousins in Swampscott
- Thornton Lee: He surrendered a home run to Ted, as did his son Don
The song opens with a mellifluous instrumental on the piano, evoking the pastoral imagery of Rockwellian America - possibly of an autumn day in Frishberg's native Minnesota. As Frishberg begins to sing the names of the players, the mind is transferred to the beaches of Copacabana or Ipanema. The softly sung recital on a bossa nova background would blend in splendidly with a soundtrack of hits by Sergio Mendes or Astrud Gilberto. Some listeners even assumed that the lyrics to "Van Lingle Mungo" were written in Portuguese!
Mungo and Frishberg met on the Dick Cavett Show in 1969. Backstage, according to Frishberg, "[Mungo] asked me when he would see some remuneration for the song. When he heard my explanation about how there was unlikely to be any remuneration for anyone connected with the song, least of all him, he was genuinely downcast. 'But it's my name,' he said. I told him, 'The only way you can get even is to go home and write a song called 'Dave Frishberg.''"
Each of the players in "Van Lingle Mungo" tells his own story. Five of the players made their way onto bronze plaques in Cooperstown. Besides Mize, the Hall of Famers include Brooklyn catching legend Roy Campanella, 300 game winner Early Wynn, his Cleveland manager Lou Boudreau, and Reds catcher Ernie Lombardi. Two other players, George McQuinn and Sigmund Jakucki, represented the St. Louis Browns in their only World Series appearance in 1944. The Brownies lost to the crosstown Cardinals, featuring Augie Bergamo, Harry Brecheen, and Whitey Kurowski (Howard Pollet was serving in the military at the time). There was the Dutch Master, Johnny Vander Meer, who pitched two consecutive no-hitters in 1938. And there was Frank Crosetti, a Yankees infielder and coach who earned the most World Series rings in baseball history. Eddie Waitkus was shot in a hotel room by a deranged fan after he was traded from the Cubs. Included among his Chicago teammates were Phil Cavaretta, Augie Galan, Stan Hack, and Claude Passeau. There were All-Stars (Frank Gustine) and Daffiness Boys (Frenchy Bordagaray). Batting champs (Ferris Fain) and Losing Pitchers (Hugh Mulcahy). Fathers (Pinky May and Hal Trosky) and grandfathers (Bob Estalella) of future big leaguers. All were immortalized by Frishberg in "Van Lingle Mungo."
"Van Lingle Mungo" was one of Danny Gardella's favourite songs. The Giants' outfielder canted a few stanzas during a 1997 interview with Douglas and Jeffrey Lyons for their trivia book, "Out of Left Field." Gardella was even depicted on the cover conducting unusual calisthenics involving a baseball bat and the defiance of gravity. After two seasons for the Gothams, he was one of several players who jumped to the Mexican League in 1946. Gardella drew a five-year suspension from baseball, prompting a lawsuit challenging the sport's antitrust exemption. A Federal appellate court ruled in his favour, prompting the Lords of the Realm to settle with him rather than obliterate the only legal monopoly in the United States.
As cited early, only six players named by Frishberg remain living today. Like Harry Brecheen, Max Lanier pitched for the Cardinals in the 1944 World Series, and like Danny Gardella, he was suspended for defecting to Mexico two years later. Now 91 years old, the father of infielder Hal Lanier lives in Dunnellon, Florida. Eddie Joost and Phil Cavaretta both celebrated their 90th birthdays in 2006. Joost, who worked as a sporting goods representative after hanging up his spikes, lives in Santa Rosa, California. Cavaretta managed both Chicago teams and later served the Mets as a batting instructor. He lives in Villa Rica, Georgia. Johnny Pesky is 87 and still works for the Red Sox. John Antonelli, at 76, is the youngest of the living players. He is retired from the tire business and still lives in the Rochester area.
As for Dave Frishberg, his career as a singer-songwriter blossomed after "Van Lingle Mungo." In addition to performing his own tunes, including "Dodger Blue," he has written songs for Rosemary Clooney, Michael Feinstein, Diana Krall, and Mel Torme. Frishberg, a member of the Society for American Baseball Research, calls Portland, Oregon home - as does 84-year-old ex-Dodger and fiddler Eddie Basinski. Mungo died in 1985, and along with his demise probably sealed the fate of the song "Dave Frishberg."
To paraphrase Toronto music historian Roger Ashby, that is the story behind the hit "Van Lingle Mungo."
BIBLIOGRAPHY
1. Baseball Library.
2. Baseball-Reference.com.
3. Atteberry, Phillip D. "A Conversation with Dave Frishberg," in The Mississippi Rag. Minneapolis: April 1996.
4. Boyd, Brendan C, and Fred C. Harris. The Great American Baseball Card Flipping, Trading, and Bubble Gum Book. New York: Little, Brown & Co., 1973.
5. Canter, Andrea. "Getting Some Fun Out of Life: Back in St. Paul with David Frishberg," in Jazz Police: March 13, 2006.
6. Fusselle, Warner. "Baseball's Greatest Hits." Santa Monica, CA: Rhino Records, 1989.
7. Lasorda, Tommy, and David Fisher. The Artful Dodger. New York: William Morrow, 1985.
Lyons, Jeffrey and Douglas B. Out of Left Field. New York: Times Books, 1998.
8. Marazzi, Rich, and Len Fiorito. Aaron to Zuverink. New York: Avon Books, 1984.
9. Pave, Marvin. "Johnny Sain, 89, Star Pitcher in Rhyme About '48 Braves," in The Boston Globe: November 9, 2006.
Maxwell Kates tried his hand at radio broadcasting and standup comedy before deciding to become an accountant. He has lectured on baseball at York University, Seneca College, and at the 2006 SABR Convention in Seattle. His work has appeared in The National Pastime, Elysian Fields Quarterly, and on the Canadian Broadcasting Corporation. An Ottawa native now living in Toronto, he is a member of the Society for American Baseball Research. He also serves as director of marketing for that organization's Hanlan's Point Chapter.
| Designated Hitter | November 02, 2006 |
Generalities in Pitch Location
How often have you heard a player attribute his success to "throwing more pitches inside," or heard a manager say a pitcher was "hitting his spots?" Pretty much everyone talks about pitch location, but how often is it actually quantified? Thankfully, our pals over at Baseball Info Solutions tracked the x-y coordinates of nearly all 1.5 million pitches thrown the past two seasons. Let's start by looking at the average major league pitch locations broken down by batter/pitcher handedness.
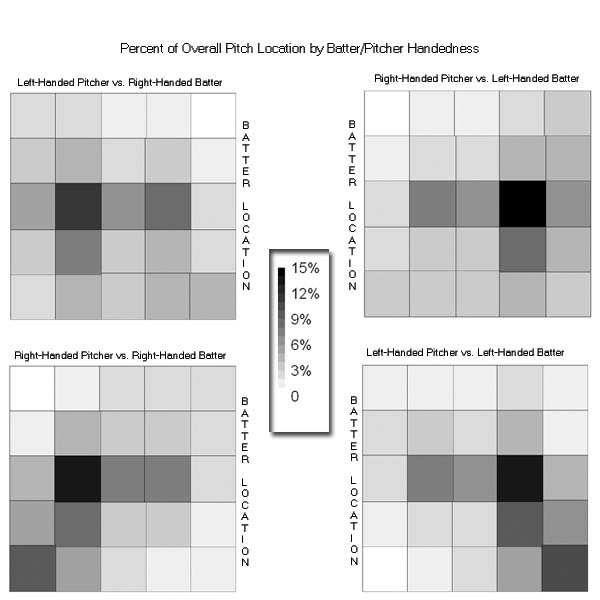
Excluding pitches outside the strike zone, about 14% of the pitches are thrown to the inside third of the plate, while about 25% of the pitches are thrown to the outside third of the plate. If you include the pitches outside the strike zone, 30% are thrown "inside" while over 50% are thrown "outside."
Then of course you can break down the strike zone by upper and lower thirds. Once again, excluding pitches from outside the strike zone, 10% are thrown to the upper-third, while 15% are thrown to the lower-third. Including the pitches outside the strike zone, 24% are thrown to the "high" and 40% are thrown "low."
While the league averages are good to know, each player will have his own pitching style. Let's see if we can learn anything about how a pitcher performs by where he throws the ball. Let's take a look at three things for each pair of pitch locations.
- Do pitchers tend to throw the ball to the same location year after year?
- Which pitchers throw the ball to a particular location the most?
- What does throwing to that location generally mean for pitchers?
For the purpose of this study, the strike zone coordinates has been mirrored for left-handed batters in order to lump inner or outer pitches into a single metric.
The Inner and Outer Pitch
First of all, the ability or choice to throw strikes on the inner or outer third of the plate is something that an individual pitcher will tend to repeat from year to year.
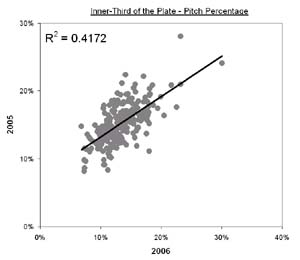
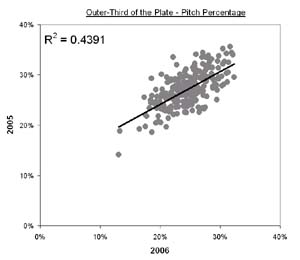
So who are the starting pitchers that use the inside-third or outside-third of the plate the most?
Starter            Inside-%      Starter         Outside-%
Randy Johnson        21.69%      Greg Maddux        32.11%
Jon Lester           20.59%      Mike Mussina       31.18%
Matt Clement         20.49%      Rodrigo Lopez      31.05%
Johan Santana        19.46%      Eric Milton        30.61%
Francisco Liriano    18.77%      Kyle Lohse         30.43%
Andy Pettitte        18.73%      Brad Radke         30.43%
Cliff Lee            18.60%      Kevin Millwood     30.24%
Tim Wakefield        18.17%      Roger Clemens      29.79%
Mark Buehrle         18.12%      Livan Hernandez    29.71%
C.C. Sabathia        18.02%      Brett Myers        29.55%
It's a pretty interesting group of starters who have the highest percentage of pitches over inner-third of the plate. Most of them are left-handers with Clement and Wakefield being the exceptions. Obviously Johan Santana and Francisco Liriano are considered two of the best pitchers in baseball and interestingly Chris Carpenter, a right-hander, was one shy of making the top ten.
The starters with the highest outside pitch percentage are all right-handers with Eric Milton being the lone exception. Jeff Francis and David Wells are also a few of the left-handers who really utilize the outer-third of the plate.
Let's move on to the relievers:
Reliever           Inside-%      Reliever        Outside-%
Mariano Rivera       30.07%      Scott Cassidy      34.43%
Chad Bradford        24.34%      Brian Sweeney      33.00%
Billy Wagner         23.20%      Bob Howry          32.32%
Todd Jones           23.20%      Justin Speier      31.89%
Matt Thornton        22.58%      Brandon Lyon       31.64%
Darren Oliver        22.00%      Joe Beimel         31.64%
Brad Thompson        19.95%      Brian Meadows      31.63%
Mike Gonzalez        19.83%      Chris Britton      31.58%
Hong Chih Kuo        19.21%      Rafael Betancourt  31.40%
Matt Capps           18.44%      Takashi Saito      31.33%
There's definitely more of a mix of right-handed and left-handed pitchers from the inner-third list of relievers, most notably Mariano Rivera who uses that portion of the plate more than any other pitcher in baseball. Jonathan Papelbon was also a few spots shy of making the list.
The top 10 relievers who utilize the outer-third of the plate are all right-handed pitchers with the exception of Joe Beimel. Most of these pitchers had solid years, with Cassidy and Saito being the real bright spots.
Unfortunately, how a pitcher utilizes the inside or outside third of the plate doesn't really correlate well with anything. This was somewhat of a surprise to me, especially since the horizontal location of pitches is frequently addressed by many pitchers and scouts.
The Upper and Lower Pitch
Just like the inner and outer pitch locations, the percentage of pitches thrown to the upper/lower third of the strike zone also correlate well from year to year.
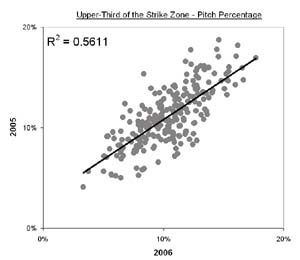
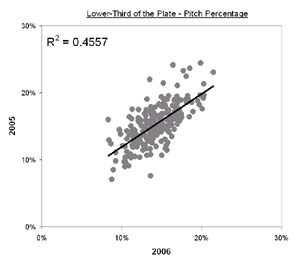
Let's see which starting pitchers utilize these sections of the strike zone the most:
Starter             Upper-%      Starter           Lower-%
Scott Baker          18.42%      Brandon Webb       21.47%
Matt Cain            16.03%      Jake Westbrook     20.34%
Chris Young          15.47%      Mark Mulder        20.26%
Brad Penny           15.44%      Mike Maroth        20.22%
Rich Hill            15.41%      John Thomson       19.84%
Johan Santana        15.39%      Josh Fogg          19.72%
Jarrod Washburn      15.29%      Zach Duke          19.55%
Ben Sheets           15.22%      Jamie Moyer        18.76%
Kevin Millwood       14.59%      Roy Halladay       18.53%
Boof Bonser          14.18%      James Shields      18.50%
The starters who throw to the upper-third of the strike zone are mostly fly-ball pitchers, with a few exceptions like Millwood and Penny. While the players who throw to the lower-third of the strike zone are mostly groundball pitchers. In fact, Webb, Halladay and Mulder are three of the most extreme groundball pitchers around, not to mention Derek Lowe, another extreme groundball pitcher, just missed the cut.
Here are the relievers:
Reliever              Top-%      Reliever          Lower-%
Jonathan Papelbon    20.29%      Chad Bradford      20.20%
Rafael Soriano       18.42%      Todd Williams      19.87%
Rafael Betancourt    17.68%      Rick Bauer         19.35%
Alan Embree          16.65%      Joe Beimel         19.11%
Todd Jones           16.55%      Jorge Julio        18.94%
Joaquin Benoit       16.19%      Salomon Torres     18.48%
J.J. Putz            16.07%      B.J. Ryan          18.33%
Mike Timlin          15.98%      Scott Downs        17.74%
Mike Gonzalez        15.78%      Josh Hancock       17.67%
Julio Mateo          15.29%      Chad Paronto       17.43%
The relievers who throw to the upper third of the strike zone the most make up a fairly impressive list of pitchers; most notably Papelbon, Putz, and Soriano with the others being not too shabby. The relievers who utilize the lower-third of the strike zone are for the most part, groundball pitchers except for the best of them, B.J. Ryan.
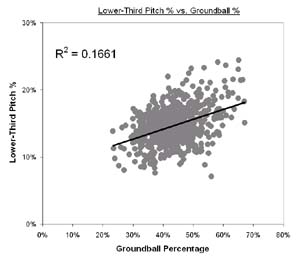
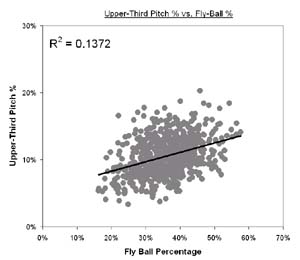
Unlike the lack of correlation the inside/outside third of the plate showed with any mainstream stats, the upper/lower third of the strike zone showed some correlation with groundball and fly-ball percentages.
The Center of the Plate
Last but not least is the middle of the plate, a spot where pitchers should not be throwing the ball all that often. Batters easily do the most damage with pitches right over the heart of the plate.
Unlike the inside/outside/upper/lower thirds of strike zone, pitchers do not throw the ball to this location with the same consistency from year to year. Instead of listing which player threw it over the center of the plate most often and least often; I'll cut right to the chase.
Since throwing the ball in the center of the strike zone, on an aggregate level, is where batters do the most damage, I thought there might be a decent correlation with either batting average on balls in play (BABIP) or perhaps home runs. This is not the case.
There are plenty of players who throw the ball over the center of the plate more frequently than others and quite simply get away with it for reasons that can't be put under a general rule of thumb.
Conclusions
Besides the correlation that the upper/lower thirds of the plate had with groundball and fly-ball percentage, there's really not a lot of assumptions you can make about a player by where he pitches the ball on aggregate.
It's interesting to know that Mariano Rivera throws the most pitches over the inside-third of the plate, or that Brandon Webb throws the most balls in the lower-third of the strike zone, but that by itself is really just trivia.
There's a lot to be learned from pitch location and it's going to take some complex modeling to fully interpret it along with pitch-type and velocity. But as far as generalities go with pitch location? There pretty much aren't any.
David Appelman is the creator of FanGraphs.com. You can contact him via e-mail.
| Designated Hitter | October 26, 2006 |
The Ballad of Danny Ray Herrera
And so it begins.
On Monday, Baseball America published its 2006 Minor League Position Rankings, ushering in Prospect Lists Season around the web. Like the first bus loading senior citizens for a foliage tour through the Champlain Valley, or a group of coeds dressing up like naughty nurses for a fraternity Halloween party, it's a certain sign that fall is now officially upon us. And while most of the ensuing focus and discussion will rightly fall on the prospects who make such lists, I'd like to turn your attention to one player who almost surely will not.
Daniel Ray Herrera was drafted out of the University of New Mexico by the Texas Rangers in the 45th round (Pick #1345) of this year's draft. He grew up in Odessa, TX and attended Permian High, the school made famous by "Friday Night Lights." (Unfortunately for Herrera, he didn't attend at the same time as Minka Kelly). Wait a second. Where was I now? Ah, yes. . .
Herrera stands a wee 5'7", so he won't be selling any jeans. And a fastball that tops out at 86 MPH won't cause radar guns to make sweet love to him. But something happened to Herrera's game during his final college season, when all he did was get guys out:
YEAR    CL       IP     ERA    BB    SO    BAA
2004    FR     72.67   5.33    24    51   .308
2005    SO     93.00   6.20    33    67   .310
2006    JR    128.33   2.24    29   104   .238
As impressive as that junior year appears to the naked eye, it's worth analyzing in even greater detail.
Consider the following:
Herrera pitched in the college equivalent of (a pre-2006) Coors Field, with a three-year Park Factor of 159 (which means his home field has yielded an average of 59% more runs than a neutral park over the past three seasons). Last season, he pitched in stadiums with a Total Park Factor of 139.6. Yet, his ERA over 128 IP was 2.24, the third-lowest of all draft-eligible college pitchers last year with more than 100 innings pitched.
Moving to the world of Defense-Independent Pitching Stats, Herrera's DIPS ERA creeps up to 3.28, a general function of the relatively large number of hits he allowed in the thin mountain air. But still. Adjusting his DIPS ERA for the full effects of the level of competition against whom he pitched and the parks in which he threw, dropped his fully-adjusted ERA back down to 2.20.
But that's not all.
Prior to June's draft, scouts most often cited five players as the most pronounced college groundball pitchers. With this in mind, I went back before the draft and hand-calculated the Ground Outs/Air Outs (not all batted ball data is publicly-available at the college level) for each, to see how Herrera compared:
                                       GO/AO
Danny Ray Herrera (LHP, New Mexico)    2.86
Derrick Lutz (RHP, George Washington)  2.23
Jason Godin (RHP, Old Dominion)        1.95
Brett Sinkbeil (RHP, Missouri State)   1.86
Jared Hughes (RHP, Long Beach State)   1.60
Dallas Buck (RHP, Oregon State)        N/A
Fine, you're probably saying. Big deal. The kid had one good year in college. He induced a lot of ground balls, threw strikes, and got a reasonable number of whiffs while pitching in a hitter-friendly ballpark. But he's short and doesn't throw especially hard, remember? Surely, the minor leagues would have exposed him for what he really is, right?
Let's take a look.
After breezing through the AZL for nine innings, Herrera got the call up to the Class A-Advanced Bakersfield Blaze of the California League and headed to the bullpen. Over the course of 54.3 IP, here's how he fared:
                       Herrera        Lg. Avg.
OPS Against             .518            .764
BABIP                   .293            .333
WHIP                    0.94            1.47
BB/9                    1.99            3.58
K/9                    10.10            7.62
HR/9                    0.00            0.81
GB%                     70.7%           45.7%
In other words, Herrera once again disproved the doubters.
Now, none of this is to say that Herrera is certain to maintain these levels of performance as he continues his march towards the major leagues. As with the majority of prospects at his age and level of development, the odds are most certainly against him.
But here's to hoping that next season we might all begin to recognize him for the things he has already accomplished, rather than continually dismissing him for the things he might someday not.
THANKS: Boyd Nation's site is an incredible resource for all things college baseball. His passion for the Land of Aluminum Bats is obvious. Jeff Sackmann revolutionized the way the general public, even hacks like me, could analyze the minor leagues. If Bill James and Jessica Alba ever bore a child, and their child came out as a minor league baseball website, it would probably look something like minorleaguesplits.com.
Kent Bonham is a consultant in Washington, DC. He can be reached here.
| Designated Hitter | October 19, 2006 |
Two Baseball Poems
WIFFLE BALL
(for Chris Tillman)
I pitch and then
your memory rises high above the house to bounce
upon the roof, careen across the shingles
and then begin to roll back down to earth.
I dash beyond the porch
on backyard, left field grass to warning track
beneath the eaves and overhang
calculating hit to carom to catch
last moment stride to blind belief
see it all bounce off the gutter once
reach up and try to hold it
but it falls beyond my grasp
then lies there still, a ground-rule double.
Your ghost man lopes toward second base
but turns, pulls up then kicks the bag
and stays there. You laugh
and then, too late, I kneel
and grab the ball. It is
empty, white, weighs almost nothing.
One side is cracked, and full of holes.
*******
BEFORE THE FALL
This slow start this spring
could mean there are holes, dead spots
in the order, weakness
up the middle, and at each corner
Age. Some of us
are in the wrong position
and with each stretch
the muscles pop and tear.
There is no defense
no great depth on which we can depend.
Our speed is suspect
and power, at best, sporadic.
From the cellar the sky is far away
and possibly false, the mound so high
who can help from falling awkward off?
The arms and hands have no control
and the eye wanders, unfocused
anywhere but home.
Each day we greet the earth, but circle
back between the lines
Alone. The night brings
no relief but tomorrow
and the place where we stand
printed on paper
black and white.
Help is at least a year away
and we are closer to hell than that.
We are stepping in for the last time
going out across the fields.
It is a long season
and we are out of our league.
What can we do
but keep playing, playing
look to the sky, to the sun, a white blur
and pray that the rain comes, that summer is wrong?
Among other things, Glenn Stout majored in softball and poetry at Bard College. His poem "Notes Toward an Obituary in the St. Louis Sporting News" was recently published in the inaugural edition of 108 Magazine. He is the author or editor of more than sixty books and lives in Vermont.
| Designated Hitter | October 13, 2006 |
Replacing the Wild Card: The "Challenge Round"
There seems to be a pretty general consensus among sabermetric folks that baseball's current system of post-season eligibility and play is seriously flawed. Rich Lederer's post here the other day is one indication, an on-going discussion in the SABR-L listserv is another, and sabermetric hero Billy Beane's famous characterization of the playoffs as a "crapshoot" is a third, but the concerns are hardly new.
Wild card contenders compete with one another based on overall record, but play very different schedules. Small divisions produce frequent runaway champions and many meaningless post-clinching games. First place over 162 games often means little when the wild card awaits a competitive runner-up. Worst of all, an eight-team tournament of seven short series means it has become very unlikely that the best team will actually be crowned World Series champion. Even a team good enough to have a 60% chance of winning a random game against any other playoff team has only a small chance of winning three consecutive short series to be named champion.
The recent, rather nonsensical agonizing over whether Joe Torre should be fired because of three losses after the Yankees finished with the best record in baseball is a symptom of the getting-close-to-random nature of the current post-season system (Joe received too much credit for the four World Series wins and now receives too much blame for the absence of them since). Baseball should have a way to maintain or even increase interest in late regular season baseball, while also giving better teams (better as shown by the large sample of games that is the regular season) a stronger chance of actually winning a World Series. As you might guess, I have a suggestion.
The first step is to return to the four-division structure that prevailed from 1969 to 1993. More teams per division will produce more variation in results year to year (check the AL East standings over the last few years and then look up "ossification" in the dictionary), and more chances of close battles for first place. But of course MLB is never going to return to a world where only four division winners are eligible to play post-season games. The reduction in the number of teams playing meaningful late season games would be too significant to ever get wide approval among the owners. So we need an alternative.
I propose that instead of going directly to a four-team tournament, each of the four divisions first have a "Challenge Round" in which the second place team in each division would have an opportunity to catch the first place team in a series of head-to-head games. In effect, the regular season would be extended for up to another 6 games between the first and second place teams, until one or the other clinches the division. If they end up tied at the end of 6 games, they play a seventh game in the form of a one-game playoff. To provide a few examples of how this system would work, suppose divisions ended as they did in 2006. In a Challenge Round, Anaheim (second place, four games behind) would play Oakland needing six wins in seven games; Minnesota (first place) and Detroit (one game behind) would play, with the Tigers needing four wins in six games; and LA and San Diego (who tied for first) would play a full best of seven game Challenge Round series.
What if the first place team finishes the regular season schedule more than six games in front of the second place team? In that case, the second place team in the Challenge Round would have the opportunity to play the first place team however many games it would take to catch up to first place, but would have to win every game until it caught up - any one loss would end the series in favor of the first place team. If the second place finisher somehow managed to win all the consecutive games needed to tie, a one-game playoff would follow. So again using 2006 finishes as an example, the Red Sox would play the Yankees needing 11 straight wins, and the Phils would play the Mets needing 13 straight wins - though remember, with larger divisions these sorts of runaways become less likely.
Such a Challenge Round used in each of four divisions every year would have all the advantages of the wild card system but would avoid many of its disadvantages:
- As today, eight teams would participate in post-season play.
- All teams that are within striking distance of second place in each of four divisions remain in contention for the post-season late into September.
- But teams are only competing for post-season spots against teams in their own division, who will presumably be playing very similar schedules. No more unfair competition between wild card competitors coming out of weaker and stronger divisions.
- No more meaningless late season post-clinching games for first place, because every extra game of margin ahead of second place will increase a first-place team's chances of Challenge Round success. And similarly, no meaningless post-wild card-clinching games - even after clinching second, a team will know that every game closer to first it can get by the end of 162 games, the better a shot it will have in the Challenge Round.
- And maybe most important of all, the four winners of the Challenge Round, the four teams who get to the National and American League Championship Series, will have earned that participation based on their actual, cumulative achievement over a full 162+ games, a much more realistic method of evaluating the teams most deserving that position than the current, nearly random, Division Series battles. In short: less "crapshoot," more deserving winners. And all without compromising the desire of the owners for lots of potential post-season spots that many teams can shoot for, and lots of lucrative post-season games.
The Challenge Round idea would be an unusual approach to organizing post-season play in American professional sports. But baseball is an unusual game in many respects and the proliferation of playoff-eligible teams and very inclusive tournaments decided by a long sequence of short-series elimination rounds, even if they have proven relatively popular in basketball, hockey and football, do not seem likely to reflect a healthy long-term approach for baseball. A tournament that over time appears to be producing champions that seem almost randomly selected will eventually lose the respect of its fans.
The precise details of the Challenge Round concept are certainly subject to tweaking - there is nothing magical for example about the length of the Challenge Round I've suggested, and it could just as easily be set for a different number of games. Nor have I tried to tackle the issue of what sort of regular season schedule four divisions with thirty teams might use - perhaps a topic for a future article. But I hope the basic concept is food for thought on an important baseball issue.
Bruce Regal is a lawyer in New York. His posts and articles on baseball appear on the Mets fan forum site Amazinz.com.
| Designated Hitter | September 28, 2006 |
Barry & Ty: Kindred Spirits
Barry Bonds hit his 734th career home run last week, a shot that lifted him over Hank Aaron as the National League's all-time home run king. Should he play another season, Aaron's all-time, Major League record would be well within his grasp.
If there is a Bonds home run that will be remembered this year, however, it will be #715, the clout that eclipsed the career mark of Babe Ruth. Indeed, Bonds's performance over the last half decade has challenged Ruth's historical status as the game's ultimate offensive force. Who was the better player? More dominant over his peers? Is Bonds's achievement even legitimate, given his alleged use of performance enhancing drugs? Is he worthy of baseball's Hall of Fame? How do we square the records of the recent "steroid era," a time of expanded biceps and shrunken ballparks, with previous periods in the game's history when the schedule was shorter, there were fewer teams, a dead ball, and--as Bonds has often pointed out--African-Americans were excluded from play?
It's certainly fun to compare players across eras; baseball's record book all but begs us to do so. But statistics, however sophisticated, can only tell us so much. Numbers mean little without context, and in this case, by themselves, they fail to properly illuminate Bonds's proper place in history. Read more deeply into baseball's history books and you'll find that, however intriguing a comparison of the two might be, Babe Ruth is probably not the best marker for Barry Bonds. It's more enlightening to think of him in relation to another controversial player who was similarly considered by his contemporaries to be the greatest ever to don a pair of spikes: Ty Cobb.
Certainly, their personalities bear some striking similarities. Look back over the nearly century-and-a-half history of professional baseball, and you'll have trouble finding two figures more reviled than Ty Cobb and Barry Bonds. Fans, journalists, teammates--their friends are few, their enemies many. Here, for example, is what Davy Jones, who played alongside Cobb in the Detroit outfield of the 1910s, told oral historian Lawrence Ritter about the Georgia Peach: "He had such a rotten disposition that it was damn hard to be his friend....He antagonized so many people that hardly anyone would speak to him, even among his own teammates....He was one of the greatest players who ever lived, and yet he had so few friends. I always felt sorry for him." And here's what David Justice--hardly a flamethrower--had to say to reporter Howard Bryant on the general feeling about Bonds in Major League clubhouses: "Nobody could stand him. But you know what? He was the truth on the baseball field."
Jerky clubhouse behavior is really the least of their transgressions. Cobb's racism is well documented; only his ability on the field kept him from prosecution over a series of vicious assaults on African-Americans. He womanized, drank to excess, and almost certainly gambled on baseball--the ultimate betrayal of the game. Similarly, in their bestselling exposé, Game of Shadows, Mark Feinaru-Wada and Lance Williams describe Bonds as a philanderer prone to domestic violence, a tax cheat, and a serial abuser of performance enhancing drugs. Jeff Pearlman, who conducted more than five hundred interviews in writing his own Bonds biography, Love Me, Hate Me, declares, quite simply, that Bonds is "evil." Ouch.
What it is that drives a man to such anti-social behavior is, to a large degree, unknowable. But it's probably not coincidental that both Cobb and Bonds have expressed a deeply felt sense of personal injustice, and that race, in each case, was a key component in the development of that feeling. Cobb, born in rural Georgia in 1886, was a product of the Jim Crow South, and carried with him the prejudices born of that place and time. "He always figured everyone was ganging up against him," said another Detroit teammate, Wahoo Sam Crawford. "He came up from the South, you know, and he was still fighting the Civil War. As far as he was concerned, we were all damned Yankees before he even met us." Bonds, by contrast, has made no secret of his belief that the career and his own relationship with his father, Bobby Bonds, was compromised by baseball's white establishment. Bonds's comments on the game's history reveal a lingering reservoir of bitterness over the difficult experience of professional African-American ballplayers.
Where the careers of Cobb and Bonds most obviously coincide is in their undoing: both men were undone by a Brobdingnagian hero of the long ball who returned the sport to prominence after a period of controversial decline.
For Cobb, that player was Babe Ruth. When Ruth set the single-season home run mark of 29, in 1919, Cobb was still in the prime of his career--he hit .384 that year, at the age of 32. From that time to his retirement, after the 1928 season, he never hit below .323, and in 1922 he hit .401 (it was his third time over the threshold). But for all his accomplishment, his performance was eclipsed by that of Ruth, who was bashing homer after homer out of American League ballparks, drawing in fans with his long clouts and great charm, in the process repairing the damage done by the ugly Black Sox scandal, which had come out in 1920. America loved Babe, but Ty Cobb most assuredly did not. He did not like Babe personally--he called him a "baboon," among other racist pejoratives; and he did not like Ruth's style of play. "The home run could wreck baseball," said Cobb. "It throws out a lot of the strategy and makes it fence ball." Whether the home run wrecked baseball is a matter of opinion. But there was little argument that Cobb's "scientific" style of play, of using speed and smarts to get ahead, had been superannuated. By 1951, according to Cobb anyway, it was gone. That year, just two decades after his retirement, he penned an essay for Life magazine titled: "They Don't Play Baseball Anymore." Gone with scientific ball was Cobb's reputation as the game's preeminent player. Perhaps a few old timers still considered him baseball's all-time king; but for most fans Babe Ruth had assumed that position.
Bonds, at the beginning of his career, was as close to a model practitioner of Cobb's scientific style as any modern ballplayer. He did everything well: hit for average, get on base, steal, defend. He hit for power, but not at the expense of his other talents. By his age 33 season, in 1998, he already had 3 MVP awards, and was a virtual lock for the Hall of Fame. But if we are to believe the accounts of Feinaru-Wada and Pearlman, he remained unsatisfied; not with his own accomplishments, but with their perception by the public at large. If 1998 was a magical season for baseball, it was thanks to the home run contest between Mark McGwire and Sammy Sosa--and not for Bonds's own typically brilliant campaign. Bonds naturally thought himself more gifted than McGwire, and the idea that he should exist in his shadow was hardly acceptable. And so, we are told, Bonds turned to performance enhancing drugs. An injury-plagued year followed, but after that, a new, more powerful Bonds--a Bonds that could challenge the records of Ruth--was born. In 2001 he hit 73 home runs.
Cobb never had access to the pharmaceutical tools available to the modern ballplayer--not that he would have used them. In lieu of the syringe, he used the press to argue for his baseball pre-eminence. Ten years after the appearance of that Life article and shortly before his death, Cobb published My Life in Baseball: The True Record. Three decades later, his ghostwriter, Al Stumpf, came out with a truer and far less flattering record, Cobb, later transformed into the film starring Tommy Lee Jones.
What, one wonders, will Barry Bonds be writing in twenty years?
Mark Lamster is the author of Spalding's World Tour: The Epic Adventure That Took Baseball Around the Globe - And Made It America's Game.
| Designated Hitter | September 21, 2006 |
The NL West: A Bad Joke, or Marginally Funny?
As was the case in 2005, the NL West has been the punch line to many jokes this season -- despite the fact that, through games of Monday, September 18, the combined winning percentage in the division was a very respectable .498. It's not the stellar .523 mark of the AL West, but neither is it the NL Central's dismal .464. Stick the NL West's worst team, the Rockies, into the Central and three teams are looking up at them.
That combined .498 winning percentage is also a huge improvement over last year's .459. In fact, no other division in baseball has seen as big a jump from 2005 to 2006 as the NL West:
            2006   2005     Dif
AL East     .497   .507   -.010
AL Central  .521   .496   +.025
AL West     .523   .511   +.012
NL East     .507   .525   -.018
NL Central  .464   .503   -.039
NL West     .498   .459   +.039
Although the NL West clearly was the weakest division in baseball a year ago, it has yielded that title to the NL Central. What's interesting is that the improvement in the West hasn't been limited to just one or two teams. With 12-13 games remaining, two of the teams already have more wins in 2006 than they did in 2005, and the remaining three are within reach. The Padres need to win 5 of their final 13 to break last year's total, while the Giants need to go just 2-11, so there's a pretty solid chance that four teams in the division will have performed better this season than last. It's not even that much of a stretch to imagine Arizona winning 7 of its final 13 games to join the others.
Okay, so I've painted a pretty picture. But let's not confuse "improved" with "great"; the division stunk last year, so even an improvement only gets us so far. It gets us about as far as not being able to use the NL West as the punch line anymore, which is a start at least.
How Did They Do It?
So, how were all these teams able to upgrade themselves from "slightly lousy" to "mediocre, give or take a little" in the span of a year? Interestingly, each has gone about it a different way.
The Padres, who were ridiculed for winning the division in 2005, basically overhauled their roster to make it more athletic, particularly in the outfield (hello, Mike Cameron), and to strengthen the pitching staff (the club leads the NL with a 3.94 ERA this year after finishing seventh at 4.13 last season). They also made a couple key acquisitions, chief among them the deal that brought Adrian Gonzalez, Chris Young, and Terrmel Sledge from Texas for Akinori Otsuka and Adam Eaton, and the now-infamous Doug "Hooray, I Can Catch a Knuckleball" Mirabelli for Josh Bard, Cla Meredith, and cash swap with the Boston Red Sox.
The Diamondbacks, Dodgers, and Rockies all have committed to rebuilding from within. The early returns have been very encouraging for each, with youngsters such as Conor Jackson, Stephen Drew, Andre Ethier, Russell Martin, Jonathan Broxton, Chad Billingsley, Matt Holliday, Garrett Atkins, Brad Hawpe, and Jeff Francis establishing themselves as solid contributors.
The Giants are another animal altogether, and it's a bit puzzling that they've done as well as they have. Barry Bonds is a shadow of his former self, and beyond Jason Schmidt, the pitching staff looked pretty suspect coming into the season. But Ray Durham has had a career year, and Moises Alou has been solid when healthy. Perhaps most significantly, right-hander Matt Cain has emerged as a rising force. Put those together and somehow San Francisco has managed to stay close to the pack for much of the season.
Individual Performances
We've established that the NL West as a whole is stronger now than it was in 2005, and we've identified some general ways in which each of its inhabitants has contributed to that effort. Next we'll highlight a few key individual performances within the division. Actually, we'll do better than that; we'll build a divisional "All-Star" team and compare the best at each position in the NL West to others around the league:
C: Mike Piazza (.278/.338/.503), Russell Martin (.286/.355/.442). The Padres brought in Piazza as a free agent from New York, which had assumed that the veteran backstop was finished. Seems Piazza had other ideas, as he has been one of the most productive catchers in baseball this season -- among full-time starters in the NL, only Atlanta's Brian McCann and Chicago's Michael Barrett have posted better numbers; then again, neither of them has Josh Bard to pick up the slack on days off. Martin took an entirely different route, starting the year at Triple-A Las Vegas as the Dodgers' #4 prospect (according to Baseball America) before being recalled May 5 to replace the injured Dioner Navarro. Martin, who attended the same Montreal high school as teammate Eric Gagne, never relinquished the job, and Navarro ended up in Tampa Bay.
1B: Adrian Gonzalez (.296/.351/.492), Nomar Garciaparra (.305/.371/.507). First base is one of the weakest positions in the division. You won't find anyone here to compare with Albert Pujols, Ryan Howard, Nick Johnson, Carlos Delgado, or even Adam LaRoche. The best among the lot is probably Gonzalez, who wasn't expected to break camp with the big club. But Ryan Klesko's bad shoulder secured the former #1 overall pick's spot on the roster, and after his first full season, Gonzalez looks not only like a legitimate middle-of-the-order threat, but also a perennial Gold Glove candidate. Garciaparra has enjoyed a fine resurgence in his hometown of Los Angeles, playing more games this season than in the previous two combined. The downside is that he's still managed to miss a fair amount of time due to injury.
2B: Ray Durham (.296/.364/.540), Orlando Hudson (.292/.359/.468). Although he no longer is a running threat, Durham has taken the rest of his offensive game to unprecedented levels. His play at second base this season is one of the main reasons the Giants have remained in the hunt for so long. He's pretty much right there with Chase Utley and Dan Uggla at the top of this position in the NL. As for Hudson, his addition to the Diamondbacks has provided them with a solid overall offensive attack and a brilliant defender at the keystone corner.
3B: Garrett Atkins (.324/.399/.542), Chad Tracy (.276/.335/.436). In his second season, Atkins has taken his game to a new level. Already a solid contributor at the plate, Atkins has raised his batting average more than 30 points this year while increasing his walk rate and nearly doubling his homers. That's not quite enough to get him into Miguel Cabrera territory, but he can comfortably brush elbows with the likes of Chipper Jones, David Wright, Scott Rolen, and Aramis Ramirez -- no shame in that. Tracy is listed as Atkins' backup by default, as third base has been a very weak position in the division this year.
SS: Rafael Furcal (.297/.364/.439), Omar Vizquel (.303/.368/.401). Furcal's numbers look nice enough out of context, but when you realize what a slow start he got off to, they look even better. Since the All-Star break he's hitting .339/.392/.565, which means the Dodgers have been getting middle-of-the-order production from their leadoff hitter for the past couple of months and change. As for Vizquel, all I can say is that 39-year-old shortstops aren't supposed to be this good. In fact, they're not supposed to exist. I find myself having to rethink him as a Hall of Famer. Both of these guys are among the best at their position in the NL this year, although everyone will be looking up at Jose Reyes and Hanley Ramirez soon enough.
LF: Matt Holliday (.332/.386/.575), Barry Bonds (.262/.456/.532). Like Atkins, Holliday stepped his game up in a big way this season. He still doesn't draw walks, but when you hit .330 with 40+ doubles and 25-30 homers, who cares? Although Holliday benefits greatly from Coors Field (1108 OPS at home vs 828 on the road), he's not a zero away from it. He's been as good as any left fielder in the NL this year, including Jason Bay, Alfonso Soriano, Pat Burrell, and Adam Dunn. As for Bonds, it's pretty amazing that even hurt and presumably clean, he's still producing at a very high rate. Honorable mention goes to Andre Ethier.
CF: Mike Cameron (.266/.354/.477), Eric Byrnes (.270/.319/.489). Cameron has injected power and speed into a lineup that had little of either before his arrival. He's also improved the entire outfield defense in San Diego by allowing Dave Roberts to move to his natural left field and reducing the amount of ground Brian Giles has to cover in right. He's no Carlos Beltran (who is?), but Cameron and Andruw Jones head the second-tier at this position. Byrnes, meantime, quietly has put up a strong campaign for the Diamondbacks. Honorable mention goes to Kenny Lofton.
RF: J.D. Drew (.276/.385/.474), Brad Hawpe (.285/.375/.489). Hey, finally a position where the NL West really shines. These two guys have posted nearly identical numbers in radically different environments. The weird part is that Drew is hitting .290/.415/.522 at Dodger Stadium and .263/.356/.428 away from it, while Hawpe is hitting just .277/.369/.423 at Coors Field and .292/.381/.548 on the road. This was kind of a down year for right fielders in the NL overall. Jacque Jones and Jeff Francouer lead the pack in homers. Yuck.
SP: Brandon Webb (16-6, 2.92 ERA), Jason Jennings (8-12, 3.61 ERA). Okay, Webb is a no-brainer since he's a serious candidate for the Cy Young Award this year. He's right there with Chris Carpenter and Roy Oswalt at the top among NL starters. As for Jennings, his record isn't great but he gets extra credit for posting a 3.16 ERA over 13 starts at Coors Field. Honorable mentions go to Jason Schmidt, Chris Young, and Derek Lowe.
RP: Trevor Hoffman (0-2, 39 SV, 2.09 ERA), Takashi Saito (5-2, 7 HLD, 19 SV, 2.28 ERA). Hoffman has had a few hiccups, as you might expect from a 38-year-old with a mid-80s fastball, but he continues marching toward history with trademark efficiency. Saito was brought in from Japan to support Eric Gagne, but when Gagne went down and others faltered, Saito stepped in and took control. The right-hander has been lights out most of the year and has helped bring credibility to a previously suspect Dodgers bullpen. Billy Wagner probably has had a better year than Hoffman and Saito among NL relievers, but that's about it. Honorable mentions go to Cla Meredith and Jonathan Broxton.
Conclusion
The NL West hasn't been great in 2006, but it has been much stronger than it was a year ago. Sadly for those who tell them, the jokes that are still making the rounds no longer apply. Substitute NL Central, and the jokes might work. They won't necessarily be funny, but at least they'll be more accurate, and that counts for something.
Geoff Young is the author of Ducksnorts, a blog focused on the San Diego Padres, as well as Knuckle Curve, a general baseball blog. He lives in San Diego with his wife and two dogs, and enjoys eating Thai food, playing his guitar, and going for long walks around Petco Park.
| Designated Hitter | September 14, 2006 |
Remembering the Ryan Express
"God gave Nolan the ability to throw a baseball faster than anybody else."
--Phil Garner, former Astros teammate
The recent rant from Joe Morgan regarding radar gun readings while watching Detroit Tigers rookie fireballer Joel Zumaya placed a spotlight on measuring the speed of fastballs and recognizing the fastest of the fastest. It's a debate for the ages, covering legends Walter Johnson, Bob Feller and Nolan Ryan and continuing to a seeming glut of would-be fastball kings in the game today.
"Who throws the fastest?" and "How fast does he throw?" are questions that undoubtedly date to the origins of the game. Baseball Almanac put together an interesting chronicle of "The Fastest Pitcher in Baseball History." The article details a variety of tests to measure fastballs over the years, with Johnson's recorded at 134 feet per second or 91.36 miles per hour. Feller's 98.6 mph entry was achieved using a speeding motorcycle. But Rapid Robert claimed to have been clocked as high as 107.9 in a 1946 demonstration.
One of the most famous of the fastball documentation events was Nolan Ryan's official "clocking" at 100.9 MPH in 1974. As the oldest son of George Lederer, the California Angels Director of Public Relations and Promotions, I had an opportunity to play a small role in the event.
As the summer of 1974 wore on, the Angels fell ever deeper into the American League West cellar. Attendance figures were taking a similar dive, as weeknight crowds often fell short of 10,000. What's a team to do beyond the scheduled bat nights and ball nights?
In this case, the attention was focused on their 27-year-old budding superstar, Nolan Ryan.
Acquired from the New York Mets in December 1971, Ryan quickly became known as a strikeout king, recording 329 in 1972 and breaking Sandy Koufax's major league record with 383 in 1973.
"He threw the ball harder than any pitcher I ever saw, including Sandy Koufax."
--Frank Robinson, fellow Hall of Famer and Angels teammate in 1973-74
Interest in the Ryan phenomenon was increasing and his fastball was quickly becoming legendary. Players generally agreed that Ryan's fastball was the fastest of active pitchers. With that acclaim, the natural questions were "How fast is fast?" and "How does Ryan's fastball compare to the legendary fastballs from bygone eras?" Measuring the speed of a Ryan fastball would be the only solution.
At the virtual dawn of what we now recognize as an era of tremendous technological advances, the answer was found just five miles from the then Anaheim Stadium. Dad discovered a team of scientists at Rockwell International -- a part of the aerospace industry that defined much of the Southern California landscape in the post-World War II era -- had developed a sophisticated but untested device that had the potential to accurately measure the speed of a Nolan Ryan fastball.
In August, as the quest to make an official clocking of Ryan's fastball was developing behind the scenes, Ryan was adding to his legend on the field. Following a 30-day period in July when he totaled 57 2/3 innings, Ryan began an incredible streak on August 7 in a game against the White Sox in Chicago. He entered the ninth inning seeking to throw his third career no-hitter but lost it and the game as the Sox managed three hits to produce two runs and a 2-1 victory. His 13-strikeout performance was followed by games with strikeout totals of 19, 9 and 19 -- 60 strikeouts over a stretch of four starts.
"He's faster than instant coffee."
--Hall of Famer Reggie Jackson (13-for-62 with 22 SO vs. Ryan)
Meanwhile, on an asphalt parking lot at the Rockwell International facility in Anaheim, the Rockwell engineers sought to test their device in a dry run before taking it to the stadium for an upcoming Ryan outing.
My father arranged for Angels catcher Charlie Sands, a disabled list victim for much of August, to assist in the test by catching a 22-year-old lefthander whose fastball would be the subject of the trial procedure. I was that lefthander. Although I had enjoyed success as a pitcher -- my high school career ended by winning the Southern California large schools championship and I played a summer for the Anchorage Glacier Pilots, a collegiate league team that included future major leaguers Randy Jones, Craig Swan, Jim Crawford and Bruce Bochte -- I was two years removed from my last competitive season.
Following a sufficient warm up on the moundless parking lot, the engineers announced that they were having trouble getting a reading. They explained that they didn't expect to have any trouble getting a reading on pitches that were at least 85 miles per hour. Upon hearing that, Sands could barely suppress his laughter. I clearly remember the incredulity in his voice as he said, "If this guy could throw 85 miles per hour, he wouldn't be out here pitching in the parking lot." So much for that career.
Attention for the project then turned to conducting the test during an upcoming home start for Ryan. If successful, an official clocking would be announced and turned into a promotional opportunity for a subsequent start at the Big A.
The experiment on August 20 vs. the Detroit Tigers worked and the plan was on to promote the official timing of Ryan's fastball at his next home start on Saturday, September 7 against the Chicago White Sox. To hype the interest, Dad developed a contest for fans to guess the results. Los Angeles Times columnist John Hall wrote the following in his September 6, 1974 column:
"We created a monster," groaned George Lederer of the Angels. He is the club promotion director in charge of the celebrated Nolan Ryan test and contest . . . The fireballing right-hander's speed will be measured Saturday night at home against the Chisox . . . Prizes are up for people guessing the right m.p.h. and number of pitches Ryan will make.Entries approach the 6,000 mark. Three secretaries have worked around the clock the past week checking the estimates . . . The Angels have heard from 250 communities in California as well as 20 other states, including New York, Minnesota and Connecticut.
Low guess is 48 m.p.h. . . . High 147.3 . . . One entry estimated only six pitches. Another said 358 (Ryan's average is 150 and he's made as many as 245 in nine innings) . . . "We never realized how much attention this would attract," sighed Lederer.
Dan Hafner's account in the L.A. Times on September 2 provides an excellent preview of the big night:
A device called a coherent infrared radar, developed by Rockwell International, will measure the velocity of Ryan's fastball. Other devices have clocked nine other major league fireballers and the fastest of the nine was Bob Feller, at 98.6 m.p.h. in 1946. The Cleveland star was 27, Ryan's age now.But the comparison will be exact. Rockwell International calls its device the most sophisticated ever used to measure the speed of a thrown baseball.
The machine will operate from the press box, making use of a phenomenon called the Doppler frequency shift.
The infrared beam from a low-power transmitter is aimed at a spot 9 or 10 feet in front of home plate. Because infrared wave lengths are 20 times longer than those of visible light waves, the beam cannot be seen.
As the ball crosses the beam, the waves are compressed by the motion of the ball and reflected back to the equipment. The returning waves have less spacing between them than when they were transmitted. The device measures that difference to determine the ball's speed.
There's no guarantee that Ryan's fastest pitch will be timed. The narrower the beam, the more accurate the measurement, so the beam will be narrowed to the width of home plate. Ryan, who is sometimes wild, may miss it with his best throw.
An interesting side note: Having played my bit part, I recall that the Rockwell device was described behind the scenes as using a "laser beam" as the primary technology. The relatively new and not-yet-understood laser technology created a public relations dilemma. Because it was feared the public may be frightened by an announced use of lasers, the decision was made to use an alternate name. Hence "coherent infrared radar" was a cover for what may have actually been coherent laser radar. Thankfully, there were no reports of severed limbs among the spectators.
On September 7, pitching against the Chicago White Sox, Ryan recorded the 18th of his 22 victories, and registered a fastball officially clocked at 100.8 mph. (See the highest inning-by-inning readings on the stadium scoreboard.) In Robert Goldman's book "Once They Were Angels," he describes the event as follows:
Notwithstanding the Angels' mediocre play, Ryan continued to break records and grab headlines. Much as Bo Belinsky had done a decade prior, Ryan was keeping the national spotlight on the Angels despite their losing ways. To capitalize on Ryan's growing reputation, Angels publicity director George Lederer arranged a scientific test to be conducted by Rockwell International to discover, once and for all, the true speed of "the Ryan Express." Unlike today's radar guns, the Rockwell machine was precisely calibrated to give an accurate, consistent reading. During a night game against the White Sox on September 7, 1974, an eighth-inning pitch (editor's note: it was actually a ninth-inning pitch) to Bee Bee Richard was clocked at 100.8 miles per hour, eclipsing Bob Feller's unofficial mark of 98.6. The Rockwell test naturally enhanced the Ryan mystique. If players didn't already have enough to worry about when facing the Angels ace, they now had to deal with the scientifically proven fact that they were facing the hardest-throwing pitcher in the history of Major League baseball.
Hafner's game account in the L.A. Times included:
Ryan and his batterymate, Tom Egan, felt that all the fanfare, the publicity and pre-game activity was largely responsible for the big pitcher losing his concentration and failing to come up with the velocity he expected."I've caught him when he threw harder than he did tonight," said Egan. "He didn't have his real stuff. All that activity took away from his concentration."
Ryan, who threw 159 pitches, did perk up in the seventh and eighth innings when he registered five strikeouts, but some of his fastest pitches in those innings were not recorded. The White Sox swung at them, but they weren't in the strike zone, the area that fell within the scope of the Rockwell International machine.
Following Ryan's next start on September 11, Dan Hafner quoted Ryan: "I had better than average speed tonight. Better than when they tested me. At least, I felt like it out there."
"Those were the best pitches I ever heard."
--Mickey Stanley (7-for-35 with 8 SO vs. Ryan)
So much fuss about one 100 mph fastball. Now, 30 years later, radar guns are recording speeds on virtually every pitch thrown in major league games. The Bill James Baseball Handbook 2006 reports that in 2005 23 pitchers threw a combined 135 pitches at 100+ mph. Baseball Almanac has a 100 MPH Club listing "In Order of Fastest Observed Speed." Two radar gun readings of 103 mph top the list -- by Mark Wohlers from a 1995 spring training game and by Joel Zumaya on July 4, 2006. The list does not include Zumaya's 103 mph reading thrown during the Joe Morgan rant on September 3, 2006. Little Joe adamantly questioned the reliability of radar guns.
The scientific precision of the Rockwell measurement creates a strong argument for officially recognizing the Ryan Express as the king of all fastballs. Despite all the fanfare of the 100.8 mph fastball to Bee Bee Richard on September 7, 1974, Nolan Ryan is officially recognized as holding the Guinness World Record at 100.9 mph for one pitch in the August 20 game against Detroit when the Rockwell engineers discreetly tested their system.
Contrary to his skepticism of Joel Zumaya's radar readings, perhaps Joe Morgan could be counted on to support his contemporary, Nolan Ryan. "I know a 100.9 mile per hour fastball when I see one and that was a 100.9 mile per hour fastball."
Tom Lederer is a former pitcher whose fastball was seen and not heard. His "On the Road With the Dodgers" guest column can be found here.
| Designated Hitter | September 07, 2006 |
The Great Leap Forward
[Editor's note: This article was conceived a couple of weeks ago without knowledge that a similar article by Jim Baker was on the horizon at ESPN or the use of the same title would appear in Kevin Goldstein's Future Shock column yesterday at Baseball Prospectus.]
"Five-Year Plans lead not to pennants but only to new Five-Year Plans."
Bill Veeck
It's early September and the Tigers, Dodgers and even the Reds are in the midst of a pennant race. Granted, the Reds are puffing along like Homer Simpson chasing a donut across the kitchen floor, but they're within sniffing distance of something special, as are the Tigers and Dodgers.
Surprised?
Well, you should be. These improvements came much quicker than the pundits predicted. And with a division championship and perhaps a league championship - or even to dream BIG, a World Series Championship - comes entrance into a select club, a club full of legendary teams, forgotten teams, teams loaded with stars and some not so loaded. The one thing that ties all these teams together is that they were able to take the "Great Leap Forward" (GLF) in one season and traverse the terrain from losers to winners and in the process stun the baseball establishment. To gain entrance to this list a team must jump from a sub-.500 season to the championship of their respective league or division the next season.
In the past 99 non-interrupted seasons, 47 teams have achieved the feat, at least one in every decade. Of the 47 teams, some have climbed from the bottom of the standings, and still others have just leaped the short span that separated them from being a winning team. The advent of divisional play increased the number of teams who achieved the feat. Twenty eight of the 47 have occurred since 1969, and six of these teams have won it all. [corrected version]
So let's visit a few of them.
New Digs
YEAR  PLACE   W    L   PCT    GB
1958  7th     71   83  .461   21
1959  1st     88   68  .564   +2
"Naturally your ball club is always changing, and that's going to determine how you play your game."
Walter Alston
In the fall of 1957, the Dodgers announced they were heading west. Further shock was absorbed in Dodgerland when catcher Roy Campanella wrecked his car in January 1958, ending his career and paralyzing him for life. The move was marred with a major problem; the Pacific Coast League Park, Wrigley Field only held 21,000, not large enough for Walter O'Malley's taste. The team cut a deal to play in the Los Angeles Coliseum, a park that could hold 90K, but was flawed by a ridiculous distance of only 250 feet to left field (where a 40 foot screen was placed in hopes of legitimizing the field.) The centerfield fence was 425 feet away, and the right field line was 301 feet. Walter Alston said that all of Ebbets Field could be placed on the grass of the Coliseum, which despite its largeness was ill suited for the dimensions of a baseball diamond.
Aside from being in a transition year on the roster, Alston declared that the park was affecting the team's psyche and that the loss of Campanella denied the team of a key right-handed power hitter to exploit the short LF fence. Also affected was Don Drysdale, who shied away from his strength (pitching inside) to avoid the wall. This approach bloated Drysdale's early-season ERA, which didn't drop under 5.00 until August. Meanwhile, the rest of the team went south as well, and after 100 games the Dodgers sat at 46-54 and the locals were burning effigies of Alston in Ventura.
By season's end, it was the worst finish by a Dodger team since 1944.
Prior to the 1959 season the Dodgers attempted to take the field's quirks head on, first they redesigned the right field dimensions and targeted a hitter to attack the short LF wall. The man the Dodgers obtained was left-handed, opposite-field hitter Wally Moon. Moon's inside-out swing exploited the short distance to left, and his 14 HR's at the Coliseum led the team as did his robust .297/.397/.557 home. The league as a whole was weak that season and the Dodgers' 88 wins were the lowest for a champion since the Cubs won 89 in 1938. As with many turnarounds, the pitching was a major reason for success. The home ERA dropped 0.75 and the road 0.61. The man who carried the team on his back was Don Drysdale who logged 270 innings and a 2.97 home ERA. The age of Dodger pitching dominance essentially began that season. To wit, since 1959, the Dodgers team ERA is 0.42 above the league average, .031 above the next best team (Cardinals).
Amazing...
YEAR  PLACE   W     L    PCT    GB
1968  9th     73    89  .451    24
1969  1st    100    62  .617    +8
"The greatest mystery of the marvelous season is how 25 men playing an uncomplicated game with a bat and a ball can make a whole city happy."
Paul J. Montgomery: New York Times
In 1969, the GLF became mathematically more likely to occur when baseball went to 4 separate divisions. That season, the Braves jumped from a dead even .500 team to the NL West title. The Twins jumped from under .500 to the AL West championship. But no one saw the Mets winning it all, and to this day it is one of the greatest stories in the game.
But how'd they do it?
To start, they improved their hitting. 1968 was the year of the pitcher, but in New York the Mets were redefining inadequate with the stick. The Mets' .596 OPS ranks as second worst in the expansion era and 18th since 1900. The following season saw an increase in 44 hitting Win Shares for the Mets as Art Shamsky had a career year and Tommie Agee raised his OPS an impressive .244 points. The pair teamed with Cleon Jones to help the Mets lift their team OPS to .662.
                       ERA     IP      RSAA
Tom Seaver             2.21    273.1    40
Jerry Koosman          2.28    241      33
The Mets' real team strength was pitching, and they were able to boast of two aces (Tom Seaver & Jerry Koosman). With these aces and a strong bullpen, the Mets were one of two NL teams to have a team ERA below 3.00 that season. The team's pitching prowess was never more apparent then in the late months of the season when a 2.32 August ERA and a 2.15 September ERA propelled them past Chicago. The Cubs, who had led the Mets by 5 games early in September and trailed them by 8 games 1 month later, provided the yin of failure to the Mets yang of success; the Cubs' collapse was as amazing as the Mets rise from the ashes.
Feeling Lucky?
YEAR    PLACE   W    L    PCT   GB
1986    6th     71   91  .438   21
1987    1st     85   77  .525   +2
"The best you can hope for is to contend every year, play good baseball and put people in the stands. If you catch a break or two, and win a pennant every four or five years then that's pretty damn good."
Whitey Herzog
In 1987, the Cardinals experienced their first GLF. However, in the postseason they met their match in a team that was also experiencing a magic GLF year - the Minnesota Twins. (The Twins Franchise boasts five of the 35 GLF's in baseball history and three of the eight World Series wins). The Twins, who had finished last in the AL West in 1986, won the World Series in 1987 with the lowest winning percentage (.525) of any World Series champ ever. For the season, they raised their team OPS .003 points and dropped the team ERA down a mere .008 points. Good for only 11th in the league in team ERA and 8th in runs scored, The Twins were not a club that many should have been scared of, but instead a lucky team that took advantage of small things like having played out their schedule with the A's by early August and a timely late season surge in team ERA that helped hold off the Royals from achieving their very own GLF.
More a result of a weak division and timely pitching, the Twins GLF is perhaps more a miracle than the 1914 Braves achievement, more amazing then the 1969 Mets rise, and more shocking than "The shot heard 'round the world" way back in 1951. In 1991, the Twins performed the feat again when they matched up against the Braves (the team to jump the furthest in GLF history from a .401 winning % to a .580) Again, the Twins surprised the game when their pitching brought another championship.
Nasty
YEAR    PLACE   W    L    PCT   GB
1989    5th     75   87  .463   17
1990    1st     91   71  .562   +5
"We came back home 6 and 0 after sweeping the Astros and the Braves, and I remember standing in front of 55,000 screaming maniacs in Cincinnati and that made it even sweeter."
Joe Oliver
Prior to the divisional play the GLF was often an oddball event, one that was usually marked by outside forces, such as a war or rival league competition. Often the GLF is achieved by the emergence of a new manager. Twenty of the 47 of the GLF teams have had first- or second-year skippers, and 11 of the 47 were able to win the World Series, making their GLF an even sweeter ascent. The 1990 Reds are an example of a team that wallowed in turmoil one year and were reenergized by new blood, and were able to not only make the GLF, but also win it all. [corrected version]
On August 21, 1989, Pete Rose managed his last game for the Reds. Earlier that season, a rash of injuries (including an arm injury to Barry Larkin in a throwing contest at the All-Star game) further challenged the Reds, who were already immersed in a media circus that was following the Rose gambling investigation. The Reds quickly fell into the bottom of the division. By the end of August, Reds fans had seen enough of Scotti Madison, Jeff Richardson and Todd Benzinger, and they wouldn't be seeing much of Rose anymore. The gloom over the franchise was heavy, and change was needed. By early November, the Reds had a new General Manager (Bob Quinn) and a new manager (Lou Piniella). 1990 started askew for the Reds, since they started the season on the road for the first time since 1966. They also started the season in first place and didn't relinquish it for the rest of the season.
How'd they do it?
Staying healthy was the first trick. Adding players like Hal Morris, Glenn Braggs and Billy Hatcher helped as the season progressed. But the real key was pitching, a part of the game that isn't typically a strength in the Ohio River Valley. However, in 1990 the Reds pulled off one of their best pitching years in the post war era. Key to this transformation was an excellent relief ERA of 2.91, highlighted by Rob Dibble's 1.74 ERA and the now famous other "Nasty Boys."
                                ERA      IP       GS
1    Rob Dibble                 1.74     98        0
2    Randy Myers                2.08     86.2      0
3    Norm Charlton              2.74    154.1     16
The trio, along with rotation ace Jose Rijo, guided the Reds to the National League title, never leaving first place despite going 57-59 over the final 117 games of the season. Achieving this and the eventual World Series sweep was a tonic that the city needed, as it helped wash away the reality of Pete Rose's suspension and subsequent jail time. More importantly, it renewed the fans that were still shell shocked from the 1989 season.
The 2006 season brought new managers to the Reds, Tigers and Dodgers. The Dodgers and the Reds also brought in new GM's, men who obviously were not afraid to make moves to fix the problems they saw. Despite the weakened National League, the change of culture and a marked increase in team pitching has helped the Reds (until recently), while the Dodgers have found more offense and defense in their acquisitions and many of them have fueled their second-half surge. In Detroit, the infusion of young and veteran pitching plus the steady hand of Jim Leyland has been the key to the Tigers' run at the GLF. With one month left, all three of these franchises can be proud of what they have accomplished. But none will be totally satisfied unless they can finish the season on top. This would clearly place them in the family of those who have made the Great Leap Forward.
Note: Here is a complete listing of the GLF Teams since 1900.
Brian Erts is a Multimedia Developer, who lives in Portland, Oregon. He was introduced to the game by Ernie Harwell and known to try and mock Dick McAuliffe's stance back in the day. Enticed by Pete Rose's hairstyle, he jumped leagues and has been a Reds fan for the past 30 years. A member of SABR, he writes as much as his brain allows at Baseball Minutia, where you're likely to find more stuff about baseball that will probably never help you get a job.
| Designated Hitter | September 01, 2006 |
Parity and the National League
I tend to think of parity in terms of the NFL. The definition I remember was that any team could beat any other team on a given Sunday. A more mathematical way of stating it would be all the teams have the same intrinsic winning percentage.
(Now, they don't have to be .500 clubs. The NL teams had a losing record to the AL in interleague play this year, indicating they all may be slightly less than .500 teams. But as long as they have about the same winning percentage, it works out the same. So for the purposes of this article, we'll assume parity exists when all teams have an intrinsic winning percentage of .500.)
What is an intrinsic winning percentage? It's the performance we'd expect from a team over a very large number of games. That is, if teams could play enough games to smooth out luck, the intrinsic winning percentage is the result we expect to see.
Now sometimes what looks like parity isn't. Here's a trivial example. Suppose all the teams in the NL played four games, and each team was 2-2. While that certainly looks like parity, it likely isn't. The binomial distribution tells us that after four games in a league in parity, we're most likely to get one team 4-0, four teams 3-1, six teams 2-2, four teams 1-3 and one team 0-4. Sixteen teams at 2-2 is a low probability event in a league in parity (.0004). So we can test for parity by looking at the distribution of wins in the league. So do we have a parity situation in the NL right now?
The average team in the NL has played about 132 games. If each team had the same intrinsic winning percentage, we'd expect there to be 13 teams with between 59 and 73 wins. In fact, there are 12 such teams in the NL. That's pretty close.
Another way of testing for parity is through simulations. There is such a simulator at Baseball Musings. Keep clicking enter, and you'll see very close wild card races, similar to what's going on now.
So we have two separate tests, each indicating that the National League is close to parity. Now, the Mets are really good and the Pirates and Cubs really bad, but otherwise the model holds. It's Pete Rozelle's dream.
Now, is this a good thing? On the pro side of the argument, lots of teams are in the race and that should keep more fans interested. People like to watch winners. If there's a high probability your team is going to lose on a regular basis, there's less of a chance of you going to the park (see Kansas City and Tampa Bay).
The downside is the quality of play, since there are no great teams. There's a certain artistry in watching a top flight club. I remember in the early 70's watching the Yankees play the Oakland A's. Oakland was a great team, winning three World Series in a row. The Yankees were getting better, but not the team they would become at the end of the decade. The A's came to town and dispatched New York easily. On defense, on offense, on the mound, the Athletics showed they were better. Teams could watch them play and learn how to go about playing baseball. They hit mistakes, they fielded cleanly, they made good pitches. They were winners and they knew it. Outside of the Mets this season, I don't think there's another National League team like that.
There's another kind of parity, one that we saw from the beginning of free agency to the end of the CBS TV contract and the strike. For lack of a better term, I'll call it revenue parity. The money from National TV was enough to even out the disparity in local revenue at that time. It was parity of opportunity vs. parity of outcome, if you will. All the teams had enough money to build a winner, and from 1978 to 1992 a different team won the World Series every year. The teams weren't evenly match, but the resources were.
This is the parity I prefer, where great teams are created, teams that others can strive to beat. Lousy teams come into being as well, teams from whose mistakes others can learn. It's tough to appreciate greatness without the corresponding failure. With revenue sharing and new National TV contracts, I hope we're getting there again.
David Pinto is the author of Baseball Musings. David worked for STATS, Inc. for eleven years, ten as the lead researcher for Baseball Tonight on ESPN. He's also hosted Baseball Tonight online at ESPN.com and is a former employee of Baseball Info Solutions.
| Designated Hitter | August 24, 2006 |
Game Ball
You hear it all the time: Baseball is about fathers and sons. No Game of the Week broadcast is complete without a couple of little boys eating ice cream in the stands, a doting father no doubt nearby. Rarely does a Hall of Fame induction speech end without thanking dad for throwing all that BP and coaching all those Little League teams.
Hollywood buys into this line of thinking, too. Field of Dreams wasn't so much a baseball movie as it was about repairing a relationship between a father and son. (The filmmakers didn't even bother to make Shoeless Joe a left-handed hitter, so unconcerned they were about the facts.) Remember the closing scene of The Natural? It was Roy Hobbs playing catch with his son. Hobbs' career, dilatory as it was in any case, was ruined by that old bullet wound and he didn't even get to play in the Series, but everything is OK because now he's playing catch with his kid, a strapping young man who doesn't mind the fact that he had a deadbeat dad all these years.
Meanwhile, as a father of one little girl and with another bambina on the way, I'm left to wonder: What about fathers and daughters? Has fate conspired to keep me from forging the same bond with my daughters that dads everywhere enjoy when they play catch with their sons, picturing the day he will be suiting up in Yankee pinstripes or Red Sox stirrups? Are we not entitled to our own little slice of baseball Americana?
For myself and fathers like me, "Double-X" isn't just a nickname for Jimmie Foxx. It's a chromosomal pairing that means we won't be tying our offsprings' right hands behind their backs to force them to throw lefty, which for boys would ensure them of unending riches as they follow the path laid down by Jesse Orosco, the patron saint of LOOGYs. Diamonds of the lustrous variety are a girl's best friend, but baseball diamonds are for men only, even though only a precious few will ever don a major league uniform.
So does this mean I should give up on transferring my baseball passion to my children? Should I stand idly by as their bedrooms fill up with Barbies and other such dress-up dolls?
To Hell with that.
I'm raising my girls as what they are -- the sons I never had. Some kids watch cartoons on Saturday mornings. Hannah, my 3-year-old, settles for Baseball Tonight reruns. She knows how to spot a home run, though I'm guessing it will take some time for her to appreciate the beauty of the RBI groundout -- let's hear it for the National League, baby! If she learns how to read before her classmates, it may have a lot to do with her endless hours of exposure to the ESPNews ticker. Her bedtime is 9 p.m., but there is a standing rule that she can stay up late as long as the time is spent watching baseball, or "game ball," as she calls it, with her daddy. When I come back from the road, I bring back a plush mascot of the home team of whatever stadium I was just visiting, and I never leave Cooperstown without finding a suitable piece of Rockford Peaches paraphernalia.
Ballet classes are in order, yes, but so is T-ball and Little League. With any luck, she'll be the biggest tomboy this side of Tatum O'Neal (aka Amanda Whurlizer from Bad News Bears). She'll take the mound with her hair pulled up in a hat, hiding behind youthful androgyny to save the boys from the embarrassment of getting struck out by a girl.
So far I think my strategy is working. Invariably I come home late from a ballgame and miss her bedtime, and when I do she grills me the next day about going to the game ball without her. (On a related note, she also got upset with her parents when, upon seeing our wedding album for the first time, she realized that she had not been invited to the ceremony, which took place four years before she was born.)
Earlier this summer I decided it was time to take her to her first big league game, and we booked a weekend trip to Philly for the occasion. But as soon as we got to Citizens Bank Park for a Braves-Phillies tilt, a wicked thunderstorm pounded us for the better part of three hours. The rain dampened her clothes but not her enthusiasm for her first ballgame. She had the same wondrous stare that we all did upon first setting eyes on a big league field. Though the players were all safely ensconced in the clubhouse doubtlessly playing cards or dominoes, Hannah wouldn't take her eyes off what must have seemed to her as unending acres of perfectly green -- albeit soaked and partially tarped -- grass. (We don't get much of the green stuff living in Hoboken, N.J., across the river from New York City, after all.)
We waited out the delay until the game was called. As we filed out of the stadium along with the remaining crowd, Hannah's disappointment was palpable. Among the three of us, she took the rainout the hardest. I wouldn't be surprised if she took it harder than most anybody in the stadium that day. For the first time I harbored hope that she really is interested in game ball beyond an excuse to stay up late or veg out on the couch with me. Maybe she sees it as an easy way to connect with her seamhead of a father, who would love nothing more than to make baseball a lifetime connection with the first of his beloved daughters.
Jacob Luft is a baseball editor/writer for SI.com.
| Designated Hitter | August 17, 2006 |
Pete's Sake
Seven years ago, our family roster was a lot different. We had no kids yet. Grandma Flo was still around, as was Uncle Bernie. So was Pete.
The Rangers were coming off two playoff seasons in three years, and were 10 weeks away from making it three of four. Pudge and Juando and Raffy and Aaron Sele were the heart of that 1999 team, Rusty and Mark McLemore and John Wetteland its soul.
And now all seven of them are gone, each in a different place.
Sort of.
Not really.
They're not really gone.
Right now, that's how I feel about my father-in-law. He's gone. But not really.
Pete passed away a couple weeks ago, following a courageous, challenging battle with cancer. He died peacefully, with his daughters at his side. He spent his final days with his children and his grandchildren, the equivalent for Pete, whose love of baseball was certainly strong enough to earn my admiration very early on, of a sellout crowd.
I'd known Pete for 16 years. In that time, he redefined himself (though I knew him only one way) with the type of courage, character, and heart that his Astros showed last summer, when they defied the odds and reached the playoffs. Last fall brought the franchise's first World Series, and Pete's, too. Days after his first cancer surgery, he was in the ballpark, experiencing the Fall Classic at Minute Maid Park. I'm no Astros fan, but you would have never guessed that last October, judging by the number of playoff emails Pete and I traded, sometimes pitch-by-pitch.
Before long, Craig Biggio will be gone, as will Roger Clemens and Jeff Bagwell.
Sort of.
But not really.
Pete would have congratulated me on the Carlos Lee trade, less because he liked it for Texas than because it got Lee out of the NL Central. And he'd have brushed off the impact of Francisco Cordero joining the Brewers pen with a comment about how Lance and Aubrey will eat Coco up.
There were the intermittent jabs about Jerry and Jimmy and the "Cowgirls," and an occasional discussion about Willie or Buffett or Clapton or Cash, or some new food preparation he was particularly proud of, but it usually came back to baseball. We had lots and lots of baseball talks. Not the surface, water-cooler kind, but philosophy and critique and debates that would have made you think we were talking politics or religion . . . which, to my way of thinking, we sorta were.
Among the things that struck me most about Pete was not only the strength and character of his friends, formidable to be sure, but more so the strength and character of Pete's friendships. It's inspirational, and maybe the most important lesson he leaves behind, at least for me.
I already miss Pete, but there's a level of comfort in knowing his discomfort has passed.
And I take additional comfort in the fact, one that I'm completely certain of, that while this baseball analogy is clunky and forced, maybe even crass, I know a few people will understand, and maybe even appreciate it. Pete is one of them.
It will be Pete's and my corny, awkward, clichéd baseball exchange to share. It's not the first, and I don't think it will be the last. He may be pushing a new crawfish recipe on Cash, or working the Times crossword with J.R. Richard, but whenever there's a big baseball moment, in Arlington or Houston, I know he's dropping everything, and getting ready to weigh in.
Jamey Newberg, author of www.NewbergReport.com as well as seven annual Bound Editions of the Newberg Report, is a lawyer at the Dallas firm of Vial, Hamilton, Koch & Knox, maintaining a practice specializing in general civil litigation, school law, sports law, and insurance coverage. He earned his undergraduate degree, his law degree, and two "Thanks, but no thanks" pats on the back from Coach Gus after trying to walk onto the University of Texas baseball team in 1987 and 1989.
| Designated Hitter | August 11, 2006 |
The Shifting Swings of A-Rod and Andruw: Part 2
I started posting these comparisons of Major League hitters on my blog, and they usually show how a player's swing has changed or how player A might be better off if he could swing like player B, but with the opportunity to write a guest article here, I wanted to take a different approach. Coincidentally, after JC Bradbury of Sabernomics kindly posted a link of my Jeff Francoeur analysis, he (Bradbury) emailed me a question about Andruw Jones. It became clear that Jones' adjustment affected his swing in a way contrary to what can be seen in A-Rod's, so now we can not only look at the impact of an adjustment on one player, but we can see how a general concept applies in a specific way to completely different hitters.
Analyzing Andruw
What happened to Andruw Jones after 2004?
This article went straight to the source to find out:
Thus, Andruw began widening his stance in September last year. It was a stance that had provided him much success in the Minors and one that he abandoned early in his career..."When I got to the big leagues, I wish that thing wouldn't have gotten in my mind to change my stance."
With the widening of his stance, this was the new look at the beginning of Jones' swing:

The result was a significant increase in power output, most notably an increase of 22 home runs, that produced the 2005 NL Home Run leader:

Before you start thinking that all players will have similar success if they just widen their stances, we have to take a look at cause and effect. We have a cause (changed stance) and a result (more HRs, fewer Ks) and now we'll try to identify the effect of the changed stance on the swing.
Here is a look at Jones' full swing:

The clip shows a 2004 swing on the left and 2005 swing on the right, synchronized to contact. Each swing from its corresponding year is the same swing shown from different angles - front and side. The pitch is similar speed, similar location and the result is the same - home run to right-center. (I want to make a small editorial note, in that the side shot from 2004 appeared choppy, as it was missing some frames. The view from the front matched up well, so I added duplicate frames in the 2004 side view to fill in for the missing frames to match up to the front view. Each duplicate frame on the 2004 side view is noted with an asterisk* and there are no duplicate frames in the sections of the clip that will be used below.)
The segment of A-Rod's swing that I stated to be the most significant was his move into footplant and the same holds true for Jones:

Due the different camera in a different stadium, I left the number measurements off of this one. If you do want to see them, click here, but after spending time explaining what to look for in A-Rod's swing, seeing a difference becomes clearer here.
First thing I thought when I saw the difference in Jones' stance was that he would have less lateral movement forward (weight shift) since his feet are spread out so much more to begin with. This does not appear to be the case, however, when looking at this video. The overall forward movement of the hips shown in the full swing above is actually very similar, as it is in the segment of his movement into footplant. Spreading his stance did not necessarily cut down Jones' lateral movement, but what it did do is allow him to use his hips much more effectively. If Jones' wider stance did not have much impact on his actual movement forward, how does it help him use his hips better?

We see in the side view that his weight and upper body are distributed more toward his front leg which will provide a more stable base (as described in part 1). The description of spinning hips in part 1 also asserted that good movement into the front leg will help keep the front hip from "pulling off" (remember the pen example?). Judging by the stripe on his pant leg in the front view, this is the case for Jones. I do not imagine that Jones hit 22 more HRs because he had became significantly stronger over the off season, but he did figure out a way to get more out of what he already had. Strength is relatively useless if it is not applied through an efficient swing.
We now have an idea about the new position he was in that enabled him to hit with more power, but there has to be a reason why his position in 2005 is better than 2004. This is another area where the front view is helpful because it shows Jones with a little more flex in the knees and more loading in the area of his hips and upper legs. If you want to get a feel for it, stand straight up with your feet directly under you. You can stand there all day because your muscles are basically doing nothing. Now spread your feet out and squat slightly and there will be much more tension created by active muscles that are now working to support your stance. When you do a squat in the gym, this is why it is much more difficult to get up from the bottom of the squat than it is to just stand straight up with the bar across your shoulders. It's the difference between your muscles being eccentrically stretched/loaded as opposed to doing nothing.
So if A-Rod's weight shift and Jones' stance are the major visible changes in their swings, how is that related? The answer is in the effect the change has on their swings - how the change enables (or disables) them to maximize their swing efficiency. With A-Rod's more upright stance, a leg kick allows him to first load the hips and the weight shift is an indicator that his hips are being loaded until it is time to unload the swing. For Jones, a wider stance is what gets the hips loaded. This is the general effect we're trying to identify that is caused by individually specific adjustments which result in a more productive hitter.
Slowing things down with video and making different comparisons can be very useful. Then again, the information is only as good as what you are able to do with it. Go tell A-Rod he needs to shift his hips 6 more units forward like he did in '05 and please record his response because I would love to hear it. I did not play in the big leagues, but I played enough to know that a hitter does not want to hear all that analysis much less think about it. To quote Manny Ramirez, "the more you think, the slower your bat gets." A hitter wants to hear something insanely simple like "spread your stance a little more" and then he will think about all of the home runs that it will help him hit.
A coach does not have to avoid showing this type of video and analysis to a player, but the player just has to understand what is going on. Which cause will create what effect to produce what result? Things like weight shift, leg kick and stance can be merely cosmetic in that they are all things that can change - more like a band-aid than a cure. A band-aid is useless if it does not help heal the wound. The real significance for A-Rod's and Jones' adjustments has much less to do with how far they are moving forward or how wide their stance is and much more to do with how those things allow them to initiate the swing. A-Rod and Jones can change their stance, stride, or anything else they want as long as they are prepared to launch their swings like they did in 2005. Once this is established, the right phrase or thought can bridge the gap between graphic details and actual on-field adjustments that produce major league results.
Jeff Albert is owner and operator of swingtraining.net, which is a site dedicated to baseball training and analysis. The focus is not only to identify potential areas of improvement for players, but also to simplify sometimes detailed and complex concepts so the player can do less of the thinking and more of the doing. Jeff draws from his own experience of pursuing a professional playing career, as well as working with players ranging from Little League to elite college softball to minor league levels.
| Designated Hitter | August 10, 2006 |
The Shifting Swings of A-Rod and Andruw: Part 1
It might be different in New York, but from here in Atlanta, it seems as though the media criticism of Alex Rodriguez has tapered off. Apparently, all is well now that the Yankees have returned to their rightful position at the top of the AL East. So with everything that was said about A-Rod's not being able to handle the pressure and intense scrutiny, he should be fine now that he's just left alone to play, right? Although the degree of denigration may have cooled down, it appears as though his bat has still yet to heat up.
While I do not doubt the increased pressures and expectations that come with playing in New York, I can not help but think that maybe something rather than mental struggles is plaguing A-Rod. Every major leaguer faces pressure every day - fighting for their jobs, living up to giant contracts, and of course winning games. Toss in the fact that A-Rod is just one year removed from an MVP season and there you have a number of reasons why I am quite skeptical that he all of a sudden had a mental collapse.
Since I had not heard much detail about any kind of physical changes relating to A-Rod's swing, I put together an initial analysis where I was able to measure and actually quantify some changes from just a year ago. What I intend to do here is provide an excerpt from that video analysis in order to simply and narrow in on what appears to be the culprit to A-Rod's "off" season. Then, in part 2, we will take a contrasting look at Andruw Jones to see how he made the opposite adjustment, which turned him into the National League's home run champ in 2005.
Analyzing A-Rod
When a player has a big leg kick, weight shift, or any kind of exaggerated motion, those things are usually more difficult to maintain and changes are more easily noticeable. What I first noticed about A-Rod while watching on TV was a more pronounced lean backward on his follow-through and what appeared to be less of a weight shift forward. I have been watching A-Rod's swing a lot since he was in Texas and I will first show this shot of him just to provide a frame of reference. This shot was from spring training in Texas and I believe resulted in a HR:

This is the link to the full shot of A-Rod in '05 and '06 if you wish to compare, but for the purposes of this article, let's move on to the significance of what can be seen in the comparison of his swing from 2005 to 2006.
The most challenging part of doing this analysis is drawing conclusions and tying in the observations from the video to what implications they might have for a player on the field. Here is what I believe to be the most significant segment in the clip of A-Rod:

To quickly summarize the video clip: left side is from 2005, right side is 2006. Both swings result in HRs that are hit off of fastballs. Both shots come from Yankee Stadium and the angle is virtually identical. The numbers highlighted in black are provided by the coordinates (think X,Y axis from math class) in my video program and measure the center of his hips (I used the belt loop to the right of center as a reference point).
After measuring at the beginning and ending position, the video shows that the center of A-Rod's hips has moved 6 less units in 2006. Why is this important?
In a picture, this is why:

The difference is the position they get to at footplant, which is most commonly the time when a player "launches" his swing (bat begins significant move to the ball). Formerly, A-Rod had been able to use his weight shift to establish his weight against his front leg, preparing him to produce a more efficient and consistent swing. The actual rotation of his hips remains relatively unchanged, but the reduction of his weight shift in 2006 has allowed more of a spinning or opening type of hip rotation that is enabled since he has not moved himself into his solidly planted front leg as seen in 2005. In simplest terms, A-Rod's former weight shift established a more solid base for the swing. In theory, what this should translate to is more power and consistently from his '05 swing.
Follow along with a quick example to illustrate the difference in hip rotation: with a pen on a piece of paper, mark the position of the pen's tip and also the center of the pen. Now place your finger on the center of the pen and spin it around so your pen is moving around in a circle. Return it to the original position, but this time place your finger almost all the way toward the tip. When you hold the pen here and turn it, the back end of the pen should turn up close to being in line with the original marking you made for the tip of the pen. You didn't change the way you held the pen, only the point from which it was rotated around. This is similar to what is happening in this clip of A-Rod.
Here is what it looks like in the swing:

I used the red lines to mark the starting position of the front hip on each side and measured again just after contact when the position of the hips could be clearly seen again. In 2005, A-Rod's hips end up in line with the original position of his front hip, whereas there is a clear space between the original and ending position (yellow line) of A-Rod's hips in 2006...kind of like the pen example.
Usually in my articles I try to provide some kind of instructional value and make generalized comments based on the specific video examples. In this case, the 'spinning' rotation of A-Rod in 2006 would generally be characterized by symptoms of pulled ground balls produced by a player who looks like he is "pulling off the ball." On the contrary, a player who swings like the '05 A-Rod would typically have more ability to hit the ball with more power to all fields because he is able to rotate aggressively without pulling off the ball.
With that in mind, I looked for some kind of insight into what was actually happening on the field. I was noticing that just about all of the video I have of A-Rods HRs this year shows him pulling the ball, so I decided to look at his spray charts from the past few years. Of course there are many factors that contribute to a player's production on the field, but I found these more than interesting:

What jumped off the page to me was the difference in the spray of home runs. I count 14 of 26 (54%) from dead center to right field in 2005 versus 3 of 11 (27%) in 2006. If you go back and look at '04 when he also "struggled," the same thing happens - opposite field HRs disappear.
A-Rod's spray chart from 2005 is the only one since he has been a Yankee to resemble the absolute shotgun spray of HRs he had been blasting in Texas:

Is it the stadium? Is it the media? A-Rod might be the only one who can answer those questions. Dealing with a changing environment may be tough enough as it is, but it only gets tougher when you're trying to do it with a less effective swing. I can not bring myself to believe that A-Rod all of a sudden can't hang in NY or deal with his surroundings, especially coming off his best offensive season. What is much easier to believe is that his swing has slipped a bit, but with a few adjustments, he can get back to being his usual MVP self.
Jeff Albert is owner and operator of swingtraining.net, which is a site dedicated to baseball training and analysis. The focus is not only to identify potential areas of improvement for players, but also to simplify sometimes detailed and complex concepts so the player can do less of the thinking and more of the doing. Jeff draws from his own experience of pursuing a professional playing career, as well as working with players ranging from Little League to elite college softball to minor league levels.
[Additional reader comments and retorts at Baseball Primer.]
| Designated Hitter | August 03, 2006 |
Death, Taxes, and Major League Waivers
MLB's rules are complex and convoluted, but they're not hard. I've heard various people in front offices referred to as "rules experts" or - my favorite "waivers experts." The rule on waivers (Rule 9) runs nine pages, a large part of which revolve around resolving the order of claims. We're not talking Finnegan's Wake here; anyone with the rules and perhaps a pen and paper can figure these out pretty quickly. The problem is that the rules aren't very public, and as a result, members of the media and the average fan are all at a disadvantage when it comes to some of the more esoteric rules or to baseball's inconsistent nomenclature.
Here are a few rules that seem to cause a lot of confusion with my best efforts at explaining them.
Waivers
I'll never forget something I saw this spring on a message board I won't name, when Chris Snow of the Boston Globe (and now director of hockey operations for the Minnesota Wild) reported that Hee Seop Choi couldn't be sent to the minors without clearing waivers. Because most fans weren't familiar with the rule in question, the immediate assumption was that Snow was wrong. And one poster in particular ripped Snow, saying it was just "sloppy reporting" and then saying how every beat writer should learn the transaction rules.
Except, of course, Snow was right. How odd that the professional should know what he was talking about.
There is a rule rarely invoked in baseball that creates a situation where a player who has options remaining still has to clear waivers to be sent on an optional assignment. If the assignment is to begin at least three full calendar years from the date of the player's first appearance on a 25-man roster, then the player can not be sent on an optional assignment without first clearing major league waivers. These waivers are revocable, and players usually clear those waivers without incident.
There are three kinds of waivers in MLB:
- Unconditional release waivers. These are self-explanatory. A player on release waivers can be claimed for $1, and the claiming team assumes the player's contract. The player does have the right to refuse this claim and become a free agent.
- Outright or special waivers. The name changes depending on the time of year, but the effect is the same. These are the waivers you use to kick a player off of your 40-man roster. They're also the waivers to use when you wish to send a player who is out of options to the minors (thereby also removing him from your 40-man). These waivers are irrevocable, meaning that if you place a player on outright waivers and he is claimed, you can not pull the player back off waivers.
- Major league waivers. These are the waivers in question during August. Between 4 pm on July 31st and the end of the season, players must clear major league waivers to be assigned to another major league club. These waivers are revocable, and they are also the waivers required for players in Choi's situation, who have options remaining but are more than three calendar years removed from their debuts on major league rosters. Although these waivers are revocable, if a player on major league waivers is claimed and the waiver request is revoked, a subsequent major league waiver request in the same waiver period will be irrevocable.
So, as of the day that this article first appeared, any player who first appeared on a 25-man roster prior to August 3rd, 2003, must now clear major league waivers to be optioned to the minors.
Service time
Some bullet points on service time...
- One year of major league service is defined as 172 days of service, but a major league season actually runs around 183 days. A player can only accrue 172 days of service during a season, but he doesn't have to be on a roster from wire to wire to get that many days. This means that a team that wishes to hold a player in the minors long enough to push his free agency date back by one season must wait at least eleven days (and probably about two weeks, just to be safe) before recalling him.
- Days spent on optional assignments shorter than ten days don't count against your service time. If you're sent down on Friday and are recalled on Monday, you get Saturday and Sunday's days of service as well.
- The cutoff for "super-two" status (referring to players with between two and three years of service who are eligible for salary arbitration) is not fixed; all players with at least 2 years and 0 days of service but no more than 2 years and 171 days (2.171) of service are ranked in descending order by total service time, and the top 16% are granted super-two status. The cutoff is usually somewhere between 2.130 and 2.135; to the best of my knowledge, it's never been below 2.120, so a player recalled after June 5th or so is in the clear.
When an option isn't an option
If a player is sent out on one or more optional assignments during the course of a season, but the total number of days spent on those assignments is fewer than twenty, then he's not charged with an option. So there.
The fourth option
Everyone knows that a player who is added to a 40-man roster for the first time may be sent out on optional assignment in up to three years, which are commonly referred to as "option years" or just "options." But once in a while, a player ends up receiving a fourth option year. Here's the text from the MLB rulebook:
"Contracts of Major League players who, prior to commencement of the current season, have been credited with less than five seasons in professional baseball ... shall be eligible for a fourth optional assignment, without waivers, during that season. For purposes of this Rule 11(c), 90 days or more on the Active List during a championship season shall constitute a 'season of service.' ... [if] a player is placed on the disabled list after the player has been credited with 60 or more days of service in any particular season, the Disabled List time shall be counted to the player's credit."
So what are we saying here?
- A player who is currently entering his fourth or fifth pro season and already has been optioned in three separate years gets a fourth option. Delmon Young has been optioned in three years (2004, 2005, 2006) and he'll get a fourth option in 2007, which he's doing his best to earn.
- A player who has missed one or more seasons to injury - meaning an entire season, or enough time to accrue fewer than 90 days on an active roster - may get a fourth option if, exclusive of those injury-shortened years, he has fewer than five full seasons in pro ball. A season in which he's on an active roster for 60 days or more and then gets hurt still counts as a full season, but a season in which he's hurt and then comes back and gets 60-89 days of service after the injury does not.
- Seasons spent entirely in short-season leagues (the New-York Penn, Northwest, Pioneer, Appalachian, Gulf Coast, and Arizona Rookie Leagues, as well as the Dominican and Venezuelan Summer Leagues) don't count as seasons for the purposes of a fourth option.
As you might imagine, more players are eligible for fourth options than you might have realized, but they often don't come to light because the players are low-profile or because they're kicked off of 40-man rosters before the fourth option comes into play.
Prior outrights
The first time a player is placed on outright/special waivers, he must accept the outright assignment if he clears. All subsequent times, however, he has the right to reject the outright assignment and become a free agent, or he may accept the outright assignment but become a free agent at the end of the season (unless he's back on a 40-man roster at that time).
In addition, a player with at least three years of major league service may also reject an outright assignment at that moment or at the end of the season, regardless of whether he has a prior outright. Players receive these rights under Article XX of the Basic Agreement, and are sometimes referred to as Article XX free agents within the industry, although they're more often lumped in with minor league free agents in the press because the time of their free agency is similar.
As you can see, MLB's roster rules aren't difficult, just complex. I think MLB could do a better job of explaining the rules to fans, since there's a huge appetite for information on rosters, waivers, and service time, but I hope this has at least cleared up a few of the more common quirks in the system.
Keith Law is the senior baseball analyst for Scouts Inc. Before joining ESPN, Law served as special assistant to the general manager of the Toronto Blue Jays and was a writer for Baseball Prospectus. His writes for ESPN.com and for ESPNdeportes.com, and he has appeared on ESPNews' The Hot List and the Pulse, ESPN's Outside the Lines, and on ESPNRadio.
| Designated Hitter | July 27, 2006 |
Tales of Torre Tales
This is perhaps the only baseball story you will ever read that starts out with a snake.
Texas left-hander Kameron Loe has a pet boa constrictor named Angel. It's seven feet long and he brings it to Ameriquest Field on occasion and lets it slither around the infield grass.
The Yankees were in town on May 5 and there was this huge snake, sunning itself in foul territory as the Yankee beat writers set up in the press box.
I'm new to the Yankees this season, having spent the previous four seasons in sports journalism purgatory with the Mets. After covering the Machiavellian Bobby Valentine, somnambulant Art Howe and the inexplicably angry Willie Randolph, I had found Joe Torre to be a refreshing change.
I didn't know him well after a few months but he seemed like a reasonable, intelligent person who didn't mind dealing with the media. On some days he even seemed to enjoy it.
Most impressive was his archive of anecdotes. Name a player or ask a question about a certain play in a game and Torre had a story to tell. Most refer back to his days as a player with the Braves and Cardinals. Or when he managed the Mets.
In spring training, he had the group of us in stitches telling a story about Atlanta's traveling secretary, who happened to be a dwarf. When he checked the team into a hotel, Clete Boyer used to give him a boost so he could talk to the clerk at the front desk.
But snakes? Now there seemed a challenge.
"Think Joe has a story about snakes?" I asked Sam Borden from The Daily News as we watched this Angel in the infield.
"Oh, sure," he said. "I'll ask him."
When we finished with our baseball questions before the game, Sam told Torre about Loe's pet and asked him what he thought about snakes.
Twenty-nine other managers would have looked at Sam and said "what the hell are you asking me about snakes for?" Randolph, I'm quite sure, would have rolled his eyes and complained about having been asked such a question.
Joe smiled and launched into a story about the time he went on a USO Tour of Vietnam and somebody draped a snake around his neck and had him pose for a photograph.
"Damned thing nearly choked me to death," he said.
Everybody laughed.
Once having had a snake around your neck doesn't make you a good manager. But being able to tell that story does.
I get e-mails and comments on my blog every day questioning the moves Torre makes. How he handles his bullpen. His love of veteran players over better-suited reserves. His abuse of catcher Jorge Posada. If you ask some Yankee fans, he's an idiot and they can prove it. The four titles were the result of a high payroll, they contend. The Yankees have won in spite of him.
If you ask me, they just don't get it.
Baseball is nine months of work. You report to spring training in February and the best teams finish up in October. Being able to crunch the numbers is great. But being able to take pressure off your players and create an atmosphere where people enjoy coming to the park is more important. In New York, it's paramount.
Torre has an almost singular talent of saying the right thing at the right time. When Randy Johnson was struggling in the spring, the manager lowered expectations, deflecting some of the heat away from Johnson. The Big Unit has since rebounded.
In early May, when Alex Rodriguez was briefly dropped to fifth in the batting order, Torre sold it as a clerical error that ended up working out. It saved Rodriguez from several rounds of questions about a slump he was enduring at the time. He went on to be the American League player of the month.
When Bernie Williams was ejected from a game for the first time in his career, Torre came back with a story about the time he was once ejected while standing on third base.
He and Nick Colosi got into it over a comment Torre had made in the papers about the umpires. "I finally told him to f--- off," Torre said. "Son of a bitch threw me out, too."
Made what Bernie did seem not so bad.
There are 10 reporters who travel with the Yankees: Eight from newspapers, one from MLB.com and another from WFAN radio. All are pretty sharp. If motivated, we could make trouble and plenty of times, we do just that.
Every paper also has a platoon of columnists and sidebar writers. Throw in the local television stations, floaters from suburban papers and national writers and a typical home game can attract a few hundred of us.
But Torre has learned how to make the media madness work for him. He anticipates the questions, defuses the controversies and lessens the pain for his players.
A computer can predict for you how often Player X will get a hit against a certain left-handed pitcher with two runners on base. But it can't tell you how the same player will perform after reading for three days what a stiff he is and should be traded.
How do you put a value on that? I don't know. But there is great value in it, especially in a market like New York.
Torre has his quirks. Unless it is pouring rain, his pre-game meeting with the media is held in the dugout. Be it roasting hot or cold enough to chatter your teeth, Torre does his media duties from the dugout.
A few minutes into the interview, as if on cue, one of the clubhouse attendants brings him a cup of green tea. If it's a warm day, it's iced tea.
The session is an egalitarian affair. No matter who you are, you're allowed to worm your way through the crowd and ask a question. From Mike Lupica to stargazing fan-boys from weekly papers, Torre takes on all comers.
But Torre has no time for ESPN. He believes they hammered too much on Roger Clemens for throwing the piece of bat at Mike Piazza during the 2000 World Series. So he doesn't yuck it up with Chris Berman or pop up on SportsCenter. He growls a few words when one of their reporters asks a question, then invariably makes some kind of remark when they walk away.
He also doesn't much like questions about how he uses his bullpen, unless it's from a beat writer. One of the backup writers from the New York Times questioned his use of Mariano Rivera in the ninth inning of a tied game a few weeks ago and Torre's response was "You been around much?"
Torre glared at the guy as he answered and kept glaring through the next question, which was asked by somebody else about another subject.
Dom Amore of the Hartford Courant has been around Torre a while and warned me in spring training about not acting too familiar with him. Torre likes writers, like players, to pay their dues. Show up and act like you know the deal and he'll freeze you out.
You won't get called by your first name for four or five seasons. He's not going to pretend he knows you until he actually does. There's no phony sentiment, which some managers try. It invariably fails. Reporters are trained to sniff out phonies.
Torre, in many ways, is a 1950s man transported to modern times. He likes the horses, Frank Sinatra, a good cigar and a nice drink with a big dinner. You'll find the Daily Racing Form open on his desk before you will Baseball America.
For a man who has his assistant answer his e-mail because he's not much for computers, Torre understands the media machine better than any consultant you can find. He knows the value of admitting to bad news and moving on, making it a one-day story instead of three or four.
The attraction of the Yankees is their popularity. Denying that would be foolish, so embrace it. Invite everybody to the dugout to ask his or her questions and control the story instead of letting it control you.
Even if two wise guys decide to see what you have to say about snakes.
Peter Abraham covers the Yankees for The Journal News of White Plains, N.Y. He has been with the paper since 1999. Before that, he covered another memorable coach, Jim Calhoun at the University of Connecticut.
| Designated Hitter | July 20, 2006 |
Let 'er Rip II
On July 4, Tony La Russa said this to a beat writer from the St. Louis Post-Dispatch:
I disagree with a lot of fans, some experts, whatever. There are times when taking a strike is a good baseball play. There are times when getting deep in a count is a good baseball play. But more often, aggressiveness with the first good strike you see gives you a better chance to be productive offensively. If you give a quality (pitcher) strike one, it's tougher to have a good at-bat.
It wasn't the first time we've heard that from Tony; he gave Buzz Bissinger much the same opinion in 3 Nights in August. It's a little bit jarring, because La Russa's offenses are generally patient and disciplined; they run up good walk totals and have high OBPs, characteristics that seem incompatible with a philosophy that seems to favor hacking at the first ball that catches a piece of the plate.
But is La Russa right? Will an offense get better results if the hitters just let 'er rip? I examined that question last year, looking at 2004 National League data. My study focused on the first pitch of the at-bat -- the 0-0 delivery, which Craig Burley described a couple years ago at The Hardball Times as "the predominant count in baseball." Of course it is: For every plate appearance, there's an 0-0 pitch. And it's a strike about 60 percent of the time.
What a hitter does with that strike goes a long way toward determining the outcome of his at-bat.
The 2004 data seemed to show that La Russa is generally correct: if the first pitch is a strike, the batter is best served to swing. I repeated the study this year, using 2005 data, and got nearly identical results. Take a look:
| 2004 | 2005 | |||||||
|---|---|---|---|---|---|---|---|---|
| when batter . . . | avg | obp | slg | rc/27 | avg | obp | slg | rc/27 |
| takes strike on 0-0 | .233 | .275 | .353 | 3.4 | .237 | .271 | .357 | 3.4 |
| swings on 0-0 | .270 | .300 | .439 | 4.9 | .269 | .296 | .440 | 4.8 |
Keep in mind that the "swings on 0-0" section of this table includes at-bats where the batter swings and either misses or fouls the pitch off, resulting in an 0-1 count -- the functional equivalent of a called strike. Such is the result more than half of the time; the first-pitch hacker puts the ball into play on only about 45 percent of his swings.
It's in part for that reason that the conventional wisdom these days favors deep counts and abhors early-resolving at-bats -- the line of thought La Russa was reacting to in his quote to the Post. The reasoning goes something like this: the more pitches you see, the better your odds of drawing a walk or getting a mistake to exploit, hence the better the chances of getting on base or driving the ball for an extra-base hit. But the numbers in this table indicate the exact opposite -- if the 0-0 pitch is a strike, your odds of reaching base or driving the ball are better if you swing.
This would seem to be the proper time to repeat my disclaimer from last year:
I'm not suggesting that hitters should swing at any 0-0 offering that comes within a foot of the strike zone; these are macro figures which mask all sorts of micro situations in which it might make sense to take a strike. If the pitcher breaks one off on the corner or puts a sinker in at the knees and you can't do much with the pitch, might as well take. And if the pitcher is struggling with his control, maybe it's not a bad idea to see if he can follow up strike one with strike two. But it is a bad idea simply to take a first-pitch strike on principle. La Russa's instincts are correct: you ultimately score more runs if you attack the first strike you see.
The Cardinals as a team tend to reflect La Russa's philosophy; in both 2004 and 2005 they ranked among the league's most aggressive 1st-pitch teams, swinging at more than 50 percent of 1st-pitch strikes. But tendencies vary widely from roster to roster. For instance:
| 0-0 strikes | swings | swing % | |
|---|---|---|---|
| Cubs | 3,499 | 1,877 | 54 |
| Mets | 3,471 | 1,517 | 44 |
| Florida | 3,474 | 1,331 | 38 |
These three teams saw a nearly identical number of 1st-pitch strikes in 2005 -- about 21 a game. The Cubs swung at 11 of 'em, the Mets only 9, the Marlins just 8.
How did it affect their overall scoring? In this case, not much; the trio finished 7th through 9th in NL scoring last year. Indeed, the strong correlation between 1st-pitch aggression and high run totals that I found in 2004 did not recur in 2005. Whereas the 8 most aggressive teams from 2004 scored, on average, 104 runs more than the least aggressive teams, in 2005 it was a total wash:
Run scoring was dead even (an average of 721 runs per team) on both sides of the median for 1st-pitch swing frequency.
The same variation in 1st-pitch aggression did not apply to pitching staffs. Opponents' swing frequency fell within a narrow range (43 to 49 percent) for 15 of the 16 teams; the Milwaukee Brewers, for some reason, threw particularly juicy strikes on 0-0 and induced a 52 percent swing rate. Opposing hitters' aggression seemed to work to the Brewers' advantage: They allowed the third-lowest OPS in the league when throwing a strike on 0-0. But the correspondence did not hold leaguewide; we can't say that pitching staffs that "induced" more swings on 0-0 got better results. Indeed, it's not clear how you would replicate that tendency over time; the discretion lies entirely with the batter.
One final note: in 3 Nights, Bissinger claims that La Russa specifically wants his guys swinging away in RBI situations. Turns out that Tony is far from alone in that regard. I broke out the 1st-pitch data for RISP situations and found that all 16 teams swung at 1st-pitch strikes more often in those situations than otherwise. Leaguewide, the frequency increased by about 9 percent -- from 44 percent in non-RISP situations to 53 percent with RISP. That only makes sense: With runners in scoring position, there may be a reward for simply putting the ball in play; you can move a guy up or knock him in with a groundout or a flyball. A strikeout, conversely, gets you nowhere -- so big-league batters, as a group, alter their approach accordingly, expanding their swing zones from the beginning of the at-bat.
There's no universal formula here; as La Russa himself says, "There are times when getting deep in a count is a good baseball play." But there are also times -- lots of them -- when a guy's got to just take his hacks. Times, in fact, when it's the smart play.
Larry Borowsky writes about the Saint Louis Cardinals at Viva El Birdos, one of the blogs in the Sportsblog Nation family.
| Designated Hitter | July 13, 2006 |
Empirical Analysis of Bunting
Baseball analysts have been near universal in their condemnation of the overuse of the sacrifice bunt. While acknowledging it as the correct strategy in a small number of cases, most feel that any gain in moving players around the bases is more than offset by giving up an out, the "clock" in baseball. Much of this disparagement of the sacrifice bunt derives from analysis based on expected runs tables (ERT). In this essay, I will introduce more detailed and targeted expected runs tables along with an empirical comparison with what happens when teams actually bunt.
In their seminal book, The Hidden Game of Baseball, John Thorn and Pete Palmer popularized the ERT. Although introduced in concept a number of years earlier, it was Palmer's baseball credentials, the authors' lucid highlighting of its numerous applications, and the book's popularity that led to the ERT gaining a more widespread usage. Essentially, an expected runs table provides the average runs scored over the remainder of the half-inning (i.e. the batting team) from any of the 24 possible base/out states (i.e. the number runners on base and outs).
By necessity, the original expected runs tables were mainly derived from computer simulation of baseball games. The more recent availability of game data through Retrosheet, however, allows for the ERT to be calculated from actual play-by-play information. The overall expected runs table derived from this play-by-play data (for the years 1977 through 1992) is shown in table 1. Because the designated hitter materially impacts scoring, separate tables are necessary for each league. As a technical note, although I refer to these tables as expected runs tables to conform to common terminology, they technically reflect averages. That is, the tables represent the total runs scored over the remainder of the half-inning starting from a particular base/out situation divided by the number of such situations.
TABLE 1 - Expected Run Table (1977-1992)
AL         0        1        2      NL        0        1        2
-----------------------------------------------------------------
---     .498     .266     .099     ---     .455     .239     .090
x--     .877     .522     .224     x--     .820     .490     .210
-x-    1.147     .693     .330     -x-    1.054     .650     .314
xx-    1.504     .922     .446     xx-    1.402     .863     .407
--x    1.373     .967     .385     --x    1.285     .907     .358
x-x    1.758    1.187     .507     x-x    1.650    1.123     .466
-xx    2.009    1.410     .592     -xx    1.864    1.320     .566
xxx    2.345    1.568     .775     xxx    2.188    1.487     .715
Where, for example, "xx-" means runners on first and second, third base empty. Thus if a team has runners on first and second with no outs, on average they will score 1.504 runs over the remainder of the half-inning; with one out, .922; and with two outs, .446.
Because it is always the first event of an inning, the no runners/no outs state (the top left corner) reflects the average number of runs that a team scores in an inning. As table 1 indicates, on average over the 16 year period, the AL scored .043 runs per inning more than the NL (almost entirely due to the DH). This translates to about 4/10 of a run per game.
One fairly common application of the ERT is the evaluation of various in-game strategies, such as the sacrifice bunt. For example, if an AL team has a runner on first base with no outs, the team can be expected to score .877 runs before the end of the inning. If the batter successfully executes a sacrifice, the team would find itself with a runner on second and one out. Based on the table, the expected runs in this latter situation is .693. In other words, according to the ERT executing a successful sacrifice bunt actually lowers the run expectation over the remainder of the inning by .184 runs (.877-.693), while a failed sacrifice lowers the expected runs by .255 (i.e. to a runner on first, one out).
In large part because of these expected runs tables, most baseball analysts have concluded that except in very rare instances, the sacrifice bunt is a poor strategic decision, and that managers use the bunt much more often than optimal. In fact, overuse of the bunt is one of the main criticisms baseball analysts level at the conventional baseball wisdom.
Of course there are many caveats that apply to conclusions based on an ERT. Most important, the table reflects an overall average; in many situations the actual run expectation may differ significantly than that identified by the table. For example, with a pitcher coming up, the expected runs are almost surely less than reflected in the table. On the other hand, with the heart of the order due up, the run expectation may materially exceed that indicated by the table.
Furthermore, late in games teams may be playing for one run, and increasing the overall run expectation may be secondary to simply scoring one run. To examine this topic, one really needs run probability tables to evaluate the probability of scoring at least one run in the various base-out situations. In this essay, I will use run probability tables as well as the ERT to evaluate bunting.
Recently several baseball researchers have further dug into the advisability of the sacrifice bunt by evaluating run potential based on a detailed probabilistic model of a specific sequence of batters and all possible outcomes. This research is valuable and suggests that bunting may not always be such a flawed strategy. But like the original expected runs tables, they are based on modeling outcomes, not on the outcomes themselves. With the availability of the Retrosheet files which include play-by-play data from games, one can begin to evaluate bunting strategies, not only from probabilistic models but from the results themselves.
A key drawback of the above expected runs tables is that they represent only overall league averages. Using the Retrosheet play-by-play output, though, allows for more finely parsing the data. As noted above, one of the problems with the overall ERT is that it takes no account of the ability of the hitter or the actual string of batters following him. One proxy for the quality of the batter and the following hitters is the batting order.
As readers of this essay likely know, the typical batting order follows rather orthodox principles. The leadoff hitter is usually good at getting on base and has some speed. The second place hitter has good "bat control", i.e. the ability to bunt or hit to the right side so as to move the runner along. A team often places its best overall hitter third, and its top power hitter in the cleanup position. The best remaining hitter with power typical hits fifth. The specific positioning of the remaining four hitters often depends on specific player abilities and managing philosophies, but very generally, these final four hitters typically bat in descending order of ability with the pitcher batting ninth in the National League.
By subdividing the data by lineup position, one can evaluate expected runs based on subsets that have different run potentials due to the average ability of the batter and immediately following sequence of hitters. Table 2 shows the expected runs based on lineup position for each league. For example, what does the expected runs table look like if the cleanup hitter is at bat? In other words, the ERT in table 2 reflects the expected runs over the remainder of the inning from each of the 24 base-out situations broken down by the nine lineup positions. To keep the data as pure as possible to reflect lineup position, appearances by pinch hitters in the identified lineup position are not included.
TABLE 2 - ERT by Lineup Position
AL					NL
  1	    0	    1	   2		  1	    0	    1	   2
---	 .553	 .291	.100		---	 .542	 .294	.102
x--	 .951	 .567	.210		x--	 .911	 .530	.213
-x-	1.263	 .753	.323		-x-	1.130	 .720	.342
xx-	1.614	 .966	.428		xx-	1.526	 .868	.418
--x	1.395	 .976	.399		--x	1.319	1.003	.399
x-x	1.840	1.242	.527		x-x	1.786	1.107	.506
-xx	2.182	1.456	.623		-xx	1.978	1.336	.621
xxx	2.365	1.621	.773		xxx	2.081	1.480	.722
  2	   0	    1	   2		  2	    0	    1	   2
---	 .543	 .297	.113		---	 .530	 .286	.104
x--	 .966	 .576	.253		x--	 .977	 .611	.251
-x-	1.214	 .752	.346		-x-	1.180	 .723	.333
xx-	1.599	1.028	.453		xx-	1.583	 .979	.450
--x	1.435	1.012	.432		--x	1.368	 .971	.394
x-x	1.865	1.286	.531		x-x	1.778	1.211	.523
-xx	2.100	1.487	.609		-xx	2.068	1.375	.570
xxx	2.434	1.685	.822		xxx	2.398	1.473	.732
  3	    0	    1	   2		  3	    0	    1	   2
---	 .536	 .305	.117		---	 .517	 .297	.118
x--	 .945	 .581	.268		x--	 .928	 .582	.278
-x-	1.192	 .740	.385		-x-	1.129	 .735	.395
xx-	1.609	1.002	.522		xx-	1.607	1.007	.518
--x	1.422	1.017	.400		--x	1.337	 .993	.401
x-x	1.820	1.249	.574		x-x	1.831	1.266	.562
-xx	2.052	1.534	.674		-xx	2.031	1.518	.715
xxx	2.468	1.699	.867		xxx	2.402	1.720	.817
  4	    0	    1	   2		  4	    0	    1	   2
---	 .488	 .293	.118		---	 .442	 .274	.115
x--	 .885	 .567	.252		x--	 .849	 .553	.261
-x-	1.160	 .711	.343		-x-	1.098	 .719	.350
xx-	1.501	 .962	.488		xx-	1.488	 .961	.532
--x	1.318	 .972	.412		--x	1.308	 .958	.390
x-x	1.816	1.230	.530		x-x	1.741	1.247	.559
-xx	1.950	1.445	.644		-xx	1.864	1.426	.596
xxx	2.345	1.616	.863		xxx	2.457	1.615	.867
  5	    0	    1	   2		  5	    0	    1	   2
---	 .452	 .254	.107		---	 .403	 .224	.103
x--	 .835	 .537	.245		x--	 .757	 .494	.220
-x-	1.110	 .706	.339		-x-	 .925	 .648	.340
xx-	1.453	 .930	.463		xx-	1.336	 .913	.452
--x	1.223	 .946	.373		--x	1.159	 .942	.389
x-x	1.674	1.200	.529		x-x	1.579	1.163	.496
-xx	1.900	1.353	.550		-xx	1.881	1.356	.607
xxx	2.301	1.601	.795		xxx	2.284	1.588	.775
  6	    0	    1	   2		  6	    0	    1	   2
---	 .446	 .231	.094		---	 .370	 .191	.079
x--	 .791	 .464	.220		x--	 .725	 .430	.210
-x-	1.059	 .646	.336		-x-	 .941	 .585	.309
xx-	1.415	 .905	.459		xx-	1.311	 .851	.404
--x	1.328	 .951	.367		--x	1.095	 .829	.342
x-x	1.712	1.129	.518		x-x	1.435	1.106	.452
-xx	2.016	1.340	.581		-xx	1.764	1.336	.531
xxx	2.200	1.532	.755		xxx	1.997	1.536	.726
  7	    0	    1	   2		  7	    0	    1	   2
---	 .439	 .225	.083		---	 .363	 .183	.061
x--	 .800	 .438	.201		x--	 .652	 .388	.176
-x-	1.076	 .617	.310		-x-	 .913	 .540	.261
xx-	1.408	 .836	.419		xx-	1.293	 .756	.385
--x	1.230	 .888	.354		--x	1.242	 .749	.327
x-x	1.625	1.107	.453		x-x	1.507	1.036	.419
-xx	1.852	1.360	.570		-xx	1.718	1.220	.469
xxx	2.337	1.480	.753		xxx	2.062	1.450	.717
  8	    0	    1	   2		  8	    0	    1	   2
---	 .474	 .226	.077		---	 .397	 .172	.054
x--	 .798	 .461	.179		x--	 .678	 .375	.127
-x-	1.039	 .609	.283		-x-	 .923	 .485	.230
xx-	1.431	 .804	.410		xx-	1.179	 .694	.321
--x	1.419	 .919	.347		--x	1.212	 .782	.274
x-x	1.674	1.105	.444		x-x	1.514	 .945	.429
-xx	1.962	1.322	.561		-xx	1.620	1.157	.495
xxx	2.289	1.465	.686		xxx	1.994	1.315	.661
  9	    0	    1	   2		  9	    0	    1	   2
---	 .519	 .263	.081		---	 .450	 .194	.050
x--	 .852	 .480	.182		x--	 .739	 .362	.125
-x-	1.128	 .641	.293		-x-	1.022	 .542	.181
xx-	1.475	 .927	.382		xx-	1.238	 .705	.230
--x	1.423	 .947	.341		--x	1.281	 .753	.236
x-x	1.725	1.145	.457		x-x	1.466	 .891	.269
-xx	2.108	1.396	.513		-xx	1.730	1.048	.387
xxx	2.386	1.533	.709		xxx	1.930	1.219	.470
Table 2 clearly illustrates the impact of batting order position on expected runs. In the AL with the leadoff hitter starting an inning, one can expect .553 runs to score. On the other hand, with the seventh place hitter leading off an inning, this falls to .439 runs. In the NL where the pitcher hits, the fall off is even more drastic, from .542 with the leadoff hitter starting an inning, to .363 for the seventh place hitter. This difference equates to over two runs per game.
One technical qualification to note is that the tables are derived from all events and include actual bunts in the calculation of their averages. A judgment was made, however, that this confounding effect was less significant than incorporating only those cases in which no bunt occurred. The latter involves significant self-selection: only the poorer hitters (and pitchers) bunt, resulting in a data set unrepresentative of the overall expectations.
Based on table 2, the sacrifice bunt still seems like a poor play in most runner on first, no out situations. The one exception, not surprisingly, is the NL pitcher spot, where a successful bunt reduces the expected runs by only .019 (.739 with the ninth place hitter up and a runner on first/no outs to .720 with a leadoff hitter up, a runner on second and one out). Given that these tables reflect overall averages of many teams over many seasons, it follows that a pitcher bunt would make sense in many specific instances.
However, one can now uncover an instance where a successful bunt actually increases the expected runs using the ERT. The run potential with runners on first and second with no outs and the pitcher hitting is 1.238. A successful sacrifice bunt brings up the leadoff hitter with runners on second and third and one out; a state with a run expectation of 1.336. Again, this needs caveats: not all bunts are successful, but clearly given that this is based on overall averages, one can imagine circumstances in which a bunt is the correct strategy.
One examination that researchers sometimes apply to the expected runs tables is that of breakeven percentages. That is, on what percentage of sacrifice attempts does one have to be successful to make the attempt at least a breakeven proposition with respect to the expected runs over the remainder of the inning. To take the example above: if the run potential without a bunt is 1.238 and with a bunt is 1.336, on what percentage of sacrifice attempts does one have to be successful to raise the run expectation above 1.238? Assuming an unsuccessful attempt results in no base runner advance and an out, the resulting run potential is .868. Thus the breakeven sacrifice percentage in this instance is 79% [(1.238-.868)/(1.336-.868)].
While mathematically these breakeven calculations appear helpful, I find them mostly irrelevant and avoid them for two reasons. First, more than two possible outcomes exist on any bunt attempt. For example an error would load the bases with no out: an increase to a run potential of 2.081. Other outcomes such as a double play could drastically reduce the run potential. While the probability of these and other potential outcomes remain small, they alter the run potential enough that any breakeven analysis that ignores them risks materially invalid conclusions.
But more basically, as I hope these tables begin to illustrate, the actual run potential in any situation is extremely dependent on the batter and hitter sequence following his at bat. A breakeven analysis offers value only after working out an accurate expected runs table. Until we have the ability to generate expected runs tables for each applicable batting sequence it does not really make sense to begin calculating a breakeven analysis, and only then if we can include probabilities for all the possible outcomes as discussed above.
The most interesting part of the analysis, however, is investigating the average results of actual bunts. While the ERT can help calculate the expected change in run potential given a successful or unsuccessful bunt, detailed analysis of the Retrosheet data provides an understanding of what actually happens on bunts. Managers want to win; therefore they may very well bunt in situations which offer a better run potential than average. To go back to the original example, a successful bunt with a runner on first and no outs in the AL appears to lower the run expectation by .184 runs; what happens in practice when teams bunt?
Table 3 provides the results of what actually happens when teams bunt. The analysis looks at all situations in which there were at least 200 bunt attempts and compares the results from bunting to all results. Unfortunately, Retrosheet does not make a specific notation for a sacrifice bunt attempt. From the data one can track either successful sacrifice bunts or all bunts (including those attempted for base hits). Fortunately, one can assume that few bunt attempts are for base hits and often occur with the bases empty.
As an example of how to interpret table 3, with no outs, a runner on second, and the eighth place hitter up in the American League, on average 1.039 runs will score over the remainder of the inning; this ties back to table 2. In those instances in which the batter executed a successful sacrifice bunt the expected runs over the remainder of the inning increased to 1.057. After any bunt, the expected runs over the remainder of the inning grew to 1.082.
Table 3 demonstrates that when teams actually bunt they sometimes do, in fact, increase the expected runs over the remainder of the inning, particularly late in the order with no outs and a runner on second or first and second. And this analysis aggregates all bunts: intelligent, ill-advised and those in between. The results imply that managers have at least some ability to recognize those situations in which bunts can increase run scoring. Bunting runners from first to second, except by the pitcher, still appears more problematic. But it must be remembered that the overall run potential of a base/out situation reflects the average of a large number of occurrences, and in many situations the expected runs are surely as low or lower than those that result from a bunt.
TABLE 3 - Results of Actual Bunts Compared to All Events
Lg      BOP	Runners	  All   SH Only  All Bunts
		No Outs
A	1	x--	 .951	 .848	 .899
A	1	-x-	1.263	1.062	1.203
A	1	xx-	1.614	1.635	1.676
A	2	x--	 .966	 .753	 .848
A	2	-x-	1.214	1.131	1.206
A	2	xx-	1.599	1.694	1.744
A	3	x--	 .945	 .769	 .818
A	5	x--	 .835	 .702	 .752
A	6	x--	 .791	 .642	 .643
A	6	xx-	1.415	1.416	1.388
A	7	x--	 .800	 .664	 .709
A	7	xx-	1.408	1.517	1.430
A	8	x--	 .798	 .714	 .715
A	8	-x-	1.039	1.057	1.082
A	8	xx-	1.431	1.575	1.496
A	9	x--	 .852	 .802	 .790
A	9	-x-	1.128	1.146	1.137
A	9	xx-	1.475	1.464	1.455
N	1	x--	 .911	 .878	 .909
N	2	x--	 .977	 .784	 .837
N	2	-x-	1.180	1.094	1.185
N	2	xx-	1.583	1.606	1.612
N	5	x--	 .757	 .800	 .714
N	6	x--	 .725	 .683	 .682
N	7	x--	 .652	 .575	 .587
N	8	x--	 .678	 .619	 .611
N	9	x--	 .739	 .769	 .724
N	9	-x-	1.022	1.159	1.137
N	9	xx-	1.238	1.404	1.325
		1 Out
N	9	x--	 .362	 .380	 .354
N	9	xx-	 .705	 .732	 .724
(Technical note: the "All" column does not include pinch hitting appearances, while the two bunt columns do)
Overall, table 3 highlights that, in general, when managers elect to bunt they produce results superior than that assumed by the expected runs tables. In the example above--AL: eighth place hitter up, runner on second, no outs--a successful bunt ought to reduce the run scoring potential for the remainder of the inning from 1.147 to .967 according to the overall ERT in table 1. Even the batting order subsets generated in table 2 suggests that a successful sacrifice bunt reduces the expected runs over the remainder of the inning declines from 1.039 to .947, a smaller reduction but a reduction nonetheless. Using the game generated data, however, illustrates that on average, managers use the bunt strategically enough to actually increase the run expectation over the remainder of the inning from 1.039 to 1.057.
Of course, when bunting, teams are often not as concerned about the overall run potential of an inning, but the probability of simply scoring one run. One of the terrific things about the Retrosheet play-by-play data is that one can also generate tables that contain the probability of scoring at least one run. Table 4 resembles the overall expected runs table in table 1, but the numbers reflect the probability of scoring at least one run as opposed to the expected runs over the remainder of the inning. For example, over all the games in the AL from 1977 through 1992, the probability of scoring at least one run with no out and a runner on second is .634.
TABLE 4 - One Run Probability Table (1977-1992)
AL	   0	   1	   2	NL	   0	   1	   2
---	.276	.161	.067	---	.261	.148	.061
x--	.432	.277	.129	x--	.424	.268	.124
-x-	.634	.414	.226	-x-	.609	.400	.216
xx-	.637	.430	.236	xx-	.622	.413	.220
--x	.839	.670	.279	--x	.814	.648	.267
x-x	.870	.656	.289	x-x	.847	.650	.275
-xx	.867	.689	.275	-xx	.838	.664	.267
xxx	.875	.679	.331	xxx	.860	.668	.315
Table 4 provides a little more evidence of why managers bunt. The probability of scoring a run decreases only from .432 with a runner on first and no outs to .414 with a runner on second and one out. As these values represent an overall average of all games, one can imagine that it many cases it surely increases the probability. Once again we can generate these tables by batting order position as a surrogate for the multiple batter sequences that can produce a huge variation in expected outcome.
TABLE 5 - One Run Probability Table by Lineup Position
AL				NL
  1	   0	   1	   2	  1	   0	   1	   2
---	.302	.170	.067	---	.301	.173	.066
x--	.458	.292	.121	x--	.426	.263	.120
-x-	.662	.436	.218	-x-	.606	.411	.232
xx-	.658	.427	.233	xx-	.653	.428	.228
--x	.827	.655	.295	--x	.794	.666	.284
x-x	.872	.672	.302	x-x	.864	.662	.305
-xx	.874	.691	.293	-xx	.852	.669	.290
xxx	.867	.696	.340	xxx	.829	.661	.338
  2	   0	   1	   2	  2	   0	   1	   2
---	.298	.176	.073	---	.300	.171	.065
x--	.483	.306	.148	x--	.497	.320	.146
-x-	.665	.433	.236	-x-	.659	.429	.223
xx-	.678	.466	.233	xx-	.653	.433	.232
--x	.870	.687	.294	--x	.846	.653	.276
x-x	.880	.671	.296	x-x	.855	.651	.299
-xx	.887	.725	.278	-xx	.847	.696	.268
xxx	.889	.700	.347	xxx	.882	.663	.323
  3	   0	   1	   2	  3	   0	   1	   2
---	.299	.185	.077	---	.301	.187	.078
x--	.457	.308	.150	x--	.470	.314	.156
-x-	.649	.439	.252	-x-	.644	.436	.254
xx-	.673	.460	.271	xx-	.668	.459	.262
--x	.842	.707	.288	--x	.854	.696	.291
x-x	.899	.688	.312	x-x	.889	.687	.302
-xx	.874	.731	.302	-xx	.888	.701	.315
xxx	.910	.702	.365	xxx	.879	.720	.350
  4	   0	   1	   2	  4	   0	   1	   2
---	.280	.182	.081	---	.271	.176	.083
x--	.433	.294	.141	x--	.444	.304	.149
-x-	.635	.427	.231	-x-	.632	.437	.234
xx-	.645	.445	.252	xx-	.638	.443	.260
--x	.830	.667	.290	--x	.811	.680	.278
x-x	.868	.668	.299	x-x	.866	.680	.308
-xx	.867	.706	.288	-xx	.862	.694	.268
xxx	.886	.682	.351	xxx	.908	.692	.352
  5	   0	   1	   2	  5	   0	   1	   2
---	.261	.163	.076	---	.245	.151	.073
x--	.405	.286	.136	x--	.396	.269	.132
-x-	.629	.416	.231	-x-	.581	.412	.235
xx-	.622	.435	.241	xx-	.630	.441	.236
--x	.842	.660	.263	--x	.794	.682	.288
x-x	.859	.654	.294	x-x	.855	.685	.284
-xx	.842	.672	.260	-xx	.853	.674	.278
xxx	.883	.691	.342	xxx	.878	.701	.326
  6	   0	   1	   2	  6	   0	   1	   2
---	.252	.148	.066	---	.221	.127	.060
x--	.394	.253	.128	x--	.383	.249	.128
-x-	.599	.405	.233	-x-	.559	.380	.218
xx-	.604	.427	.239	xx-	.606	.418	.224
--x	.793	.668	.270	--x	.756	.640	.266
x-x	.869	.636	.291	x-x	.832	.651	.278
-xx	.876	.654	.278	-xx	.838	.668	.261
xxx	.844	.668	.315	xxx	.848	.684	.307
  7	   0	   1	   2	  7	   0	   1	   2
---	.245	.140	.059	---	.211	.115	.046
x--	.394	.240	.117	x--	.350	.226	.113
-x-	.605	.380	.216	-x-	.556	.357	.200
xx-	.602	.403	.235	xx-	.592	.389	.222
--x	.814	.628	.266	--x	.784	.582	.267
x-x	.845	.643	.277	x-x	.830	.653	.257
-xx	.864	.690	.272	-xx	.815	.656	.236
xxx	.854	.668	.331	xxx	.831	.681	.322
  8	   0	   1	   2	  8	   0	   1	   2
---	.259	.134	.053	---	.220	.104	.038
x--	.393	.247	.106	x--	.360	.204	.082
-x-	.593	.379	.207	-x-	.537	.324	.168
xx-	.608	.392	.216	xx-	.549	.346	.194
--x	.855	.652	.262	--x	.759	.583	.222
x-x	.847	.627	.264	x-x	.810	.600	.286
-xx	.843	.651	.266	-xx	.727	.625	.248
xxx	.864	.656	.302	xxx	.840	.610	.306
  9	   0	   1	   2	  9	   0	   1	   2
---	.277	.154	.052	---	.240	.109	.030
x--	.423	.252	.108	x--	.397	.217	.072
-x-	.624	.386	.209	-x-	.585	.342	.133
xx-	.624	.425	.213	xx-	.580	.336	.136
--x	.822	.653	.266	--x	.781	.530	.194
x-x	.860	.646	.272	x-x	.734	.514	.165
-xx	.872	.678	.241	-xx	.770	.543	.197
xxx	.872	.662	.304	xxx	.808	.559	.218
Table 5 indicates a number of cases in which a successful bunt increases the probability of scoring a run. In the AL, when the ninth place batter bunts with a runner on first and no outs, the probability of scoring at least one run moves from .423 up to .441. The impact is even greater with a runner on second and no outs when playing for one run. For example, a successful bunt by the ninth place AL batter with runners on first and second increases the probability of scoring from .624 to .691. And this phenomenon is not limited to the bottom of the order. A successful sacrifice bunt by the second place hitter in this base/out situation raises the probability of scoring at least one run as well.
Again it needs to be emphasized that the batting order is simply a proxy for studying sequences of varying quality hitters. Even subdividing the data by the various lineup positions aggregates large amounts of data that mask many of the nuances in all the myriad possible sequences of batters. Thus, it certainly seems likely that many individual situations offer a much greater potential increase in the probability of scoring at least one run.
Table 6 compares the probability of scoring one run based on the overall run probability tables with what actually happens when teams bunt, using as reference the various lineup positions. As the table makes clear, when managers elect to bunt (on average) they typically increase the probability of scoring at least one run. In some cases the jump can be substantial. In the AL for example, if the number two hitter successfully sacrifices with a runner on second and no outs, the probability of scoring jumps from .665 to .736.
Once again the data underscores that managers employ the bunt much more advantageously than an arbitrary reading of the run probability table would suggest. Using the example above--AL: number two hitter at bat, runner on second, no out--a successful bunt should increase the probability of scoring from .634 to .670, based on the overall run probabilities in table 4. According to the lineup derived table 5, a successful sacrifice should increase the probability of scoring in the base/out example from .665 to .707 based. In fact, in those instances when managers chose to bunt, a successful sacrifice increased the probability of scoring to from .665 to .736.
TABLE 6 - Probability Results of Actual Bunts Compared to All Events
Lg      BOP	Runners	 All   SH Only  All Bunts
		No Outs
A	1	x--	.458	.476	.478
A	1	-x-	.662	.681	.692
A	1	xx-	.658	.766	.729
A	2	x--	.483	.455	.474
A	2	-x-	.665	.736	.726
A	2	xx-	.678	.757	.738
A	3	x--	.457	.448	.451
A	5	x--	.405	.405	.400
A	6	x--	.394	.386	.372
A	6	xx-	.604	.686	.667
A	7	x--	.394	.386	.395
A	7	xx-	.602	.715	.654
A	8	x--	.393	.421	.404
A	8	-x-	.593	.664	.646
A	8	xx-	.608	.714	.681
A	9	x--	.423	.454	.440
A	9	-x-	.624	.708	.693
A	9	xx-	.624	.703	.656
N	1	x--	.426	.457	.459
N	2	x--	.497	.461	.472
N	2	-x-	.659	.741	.735
N	2	xx-	.653	.686	.670
N	5	x--	.396	.454	.403
N	6	x--	.383	.417	.419
N	7	x--	.350	.401	.387
N	8	x--	.360	.384	.376
N	9	x--	.397	.432	.405
N	9	-x-	.585	.723	.663
N	9	xx-	.580	.678	.616
		1 Out
N	9	x--	.217	.247	.226
N	9	xx-	.336	.339	.342
(Technical note: the "All" column does not include pinch hitting appearances, while the two bunt columns do)
Over the past couple of decades baseball analysts have seemingly discredited the bunt in all but the most obvious situations. Much of their evidence is based on the use of an overall run expectation table that reveals a loss of run potential even with a successful sacrifice. These overall expected runs tables, however, fail to differentiate between the innumerable possible scenarios of the ability of the hitter at bat and those following in sequence. Subdividing the data by batting order position allows a look at more finely dissected sequences of player ability. Although most of this analysis still indicates a successful bunt does not increase the run potential, it certainly shows that it in certain base/out situations it is not as detrimental as commonly believed. In fact, disaggregating by batting order still averages over many different player ability sequences, suggesting that in a number of instances a bunt may actually increase the run potential.
The Retrosheet play-by-play data allows us to partially test this hypothesis that managers can outperform the run expectation tables by a selective employment of the bunt. While not conclusive, the data here is clearly suggestive: in some base/out situations teams do increase the run expectation with a sacrifice bunt beyond the overall run potential implied by the ERT. And furthermore, even in those cases in which the runs expected over the remainder of an inning after a sacrifice bunt are less than that derived from the ERT, the decrease is typically less than the derived value. In addition we can assume that a manager typically bunts in those situations in which the specific sequence of batters is inferior to the average reflected by the ERT.
It is in the case of playing for one run, however, that the overall aptitude of managerial decisions shows up most clearly. As table 6 reveals, when managers bunt they usually increase the likelihood of scoring at least one run in the inning. And this increase is materially greater than that suggested by simply looking at run probability tables. While the bunt should and will remain a controversial managerial decision, it is clear that managers use it more judiciously than a cursory analysis based on the run expectation and probability tables would suggest.
Dan Levitt is the co-author of Paths to Glory, winner of the 2004 Sporting News-SABR Baseball Research Award. He manages the capital markets for a national commercial real estate firm.
| Designated Hitter | June 29, 2006 |
If I Met Warren Cromartie in Front of the Reptile House at the Zoo, This is What I'd Say to Him
"Cool snakes, Warren."
"Andre Dawson used to bring pythons into the clubhouse. Did that every week until one ate Doug Flynn. We had to play the python at second that day. At the end of the week he was outhitting Flynn. Nobody noticed there had been a change. Bill Virdon wanted to keep playing him, but the Players Association said he would hurt licensing revenue. The SPCA said it was cruel to make him slither across the artificial turf like that."
"Flynn, or the snake?"
"I loved everything about Montreal, but I know I got out just in time. After a few games with Flynn and Angel Salazar playing together, you could see that vein in Skip's neck popping out. It was scary stuff."
"It always amazed me how players would complain about Montreal, or not want to play there. You're a pro athlete, young and rich. You can play in the best party city anywhere in the big leagues, or you can go to Milwaukee or Cleveland..."
"Just excuses. Customs, the cold weather, the language barrier. OK, customs could be a pain. But most guys had a place in Florida, so winters weren't a problem. And the language thing? First of all, most people there speak both English and French. I considered myself fortunate to get to experience a different culture anyway, even picked up some French on my own. And the women? Wow. Yeah, I'll stand in line a few extra minutes with my passport if that's the trade-off."
"Who were your running mates on those Expos teams?"
"Ellis Valentine was always a lot of fun. Anytime we'd go into a place, Jerry White would run to the bar and get shots for everyone. And man, you should have seen Larry Parrish on the dance floor. Big ol' Southern boy, but I'm telling you, LP could tear it up!"
"Gary Carter. Camera hog or gamer?"
"A little of both. Did he love the attention? Sure. But we all did. I mean, you have to be to be a ballplayer. This isn't dentistry. As long as he was in the lineup, we were cool with it. He could hit. And I know I wouldn't want to be squatting for nine innings in St. Louis in July--better him than me."
"How bad was the turf at the Big O, really?"
"Ask Andre. He was almost as fast as Raines when he started. But all those years running down flyballs in center just sapped it out of him. Go into the clubhouse after a game, there was more ice in there than Elizabeth Taylor's jewelry box."
"I could see you limping a bit. That from the turf?"
"Partly. I went quail-hunting with Pepe Frias once. Dude shot off a chunk of my ankle. I never told anyone in the front office. John McHale would have finished the job."
"What about crocodile hunting? Who's your go-to guy?"
"Chris Speier. People thought he was quiet, but I could definitely see him jumping in and rolling on a croc. He's a bad man."
"Rattlesnake?"
"Rodney Scott, no question. You ever see him swing the bat? He knew he wasn't hitting the ball anywhere, so he just chopped at it, tried to pound it into the turf and run it out. Perfect for whacking a snake?"
"Dick Williams is the only one who'd have been crazy enough to try that."
"Youppi! Great mascot, or the greatest mascot?"
"You asked me about what happened when we went out at night? One night me, 'Dre and Bobby Ramos hit Crescent Street. We're walking over, and we see Youppi! doing a promotion or something. It's winding down, and we ask him if he wants to join us. He smacks his head and does that googly-eye thing he does. So we figure that means he's game. We hit the clubs. Now, this is 1980. By this point we're getting good, and people are starting to recognize us a bit, especially Dawson. But as soon as they saw Youppi! that night, everyone just stopped. The ladies were all over him! I tried to get him to lend me the costume for another night, but he wasn't having it. That orange fur's a gold mine."
"And then the next year is the big '81 season. A lot of people remember you waving the Canadian flag after you guys finally won it. Seriously, Cro...was that a Wade Boggs jumping on the police horse moment, or was that for real?"
"From the heart, man, from the heart. People gave Montreal a hard time later on, but it was an exciting time back then. When we were winning, it was a party every night in that stadium. Ugly park, bad turf, but it was electric that year. We felt the love and support from the fans, and we felt like we were part of something special. I'll always have warm feelings for that city, and for Canada. It's a second home to me."
"I gotta bring it up. Rick Monday...why would Jim Fanning bring in Steve Rogers there, in relief, on short rest? I mean I was 7 at the time, and I knew Rogers was good. But I didn't understand why they brought in a starting pitcher in the 9th inning. I mean, nobody could touch Jeff Reardon all year!"
"I still think about that game. Rogers was great for us too. Who knows? We still could've tied it up in the bottom of the 9th, scored more than 1 run in that game maybe. That damn Monday."
"True story. I was in the broadcast booth at Dodger Stadium one time visiting the Marlins announcers, Dave Van Horne and Jon Sciambi. Van Horne and I are talking about the old Expos teams. And who walks into the booth just then to say hi? Monday. Van Horne introduces us. Monday says, 'Pleasure to meet you.' I looked him right in the eye and said, 'Wish I could say the same.'"
"I'd have had your back if things got ugly, believe me."
Thanks to Steve Goldman for providing the inspiration for this piece.
Jonah Keri is the editor and co-author of Baseball Between the Numbers. His Expos-related rookie card collection includes Andre Dawson, Gary Carter, Tim Raines, Randy Johnson, Larry Walker, Pedro Martinez, Vladimir Guerrero, and the immortal Andy Stankiewicz. He knows to an absolute certainty how the rest of the 1994 season would have played out had it kept going. You can reach him at jonahkeri@gmail.com.
| Designated Hitter | June 26, 2006 |
War Stories
On any given day now, you can walk into the Mets' clubhouse and find a friendly player ready to talk baseball with you. It might not be like the good old days of the Eighties, when Kevin Elster would graphically discuss the previous night's sexual conquests, but in this PC-era, listening to David Wright explain why he's hitting so many opposite-field home runs is good, clean fun.
And, hey, it beats the alternative.
I can attest to that, having lived though the media golden age at Shea, and the subsequent collapse in the early Nineties. Younger reporters who sometimes complain that today's stars, like Derek Jeter and Carlos Beltran, have nothing interesting to say, obviously don't know what it's like when the players declare war on the press.
Still, the newcomers have a point about the thick wall of clichés. Where did all this new millennium caution come from? I asked Jeter that very question recently, wondering why he affects that Dawn of the Dead expression whenever the camera goes on. His answer was surprisingly candid.
"It's you guys," Jeter said, nodding at a group of reporters standing around the clubhouse. "Because any time you do something you guys write about it, absolutely anything. You can't really be as loose as you want to be."
It's hard to imagine Jeter being loose and hip and funny - and, mostly, spontaneous. That person packed up and left years ago. The last time I glimpsed the real Jeter was in 1999, when I passed along a message from an extremely attractive female acquaintance: she wanted to meet the Yankee shortstop. At that point, Jeter was still semi-trusting of the press, so the offer was met with a curious arching of his eyebrows.
"You serious?" Jeter asked.
"I wouldn't have mentioned it unless I thought she was worth your time," I replied.
For a fleeting second, Jeter was actually considering it. The wall was down. Like Arnold Schwarzenegger in The Terminator, Jeter was doing the calculus.
Then he shook his head.
"Nah, I just can't do it," Jeter said finally.
I asked why.
"If I went out with her, then you'd have something on me."
For Jeter, and just about every other Yankee, it's safer to answer questions as neutrally as possible. A reporter gets enough baseball data to write his or her story, but very few responses come from the heart anymore. Then again, it's worth noting that getting too close can be dangerous, especially if there's a war going on.
The Eighties-era at Shea came to an official end in 1993, the year Bobby Bonilla and I went one-on-one in the clubhouse. Actually, the franchise had been in steady decline since the Mets lost the 1988 League Championship Series to the Dodgers, which started the house-cleaning of all the wild-siders.
Within 2-3 seasons, Elster, Wally Backman, Lenny Dykstra, Keith Hernandez, Darryl Strawberry and Ron Darling were gone. The final blow was the trade that sent David Cone to the Blue Jays in 1992. The clubhouse had turned decidedly chillier towards the press, since the remaining good guys - Dwight Gooden, Dave Magadan and Todd Hundley, were out-numbered and intimidated.
Still, the '92 Mets were supposed to be talented enough to make up for their lack of charisma. I was writing for the Daily News then, and with John Harper, then the beat writer for the Post, we collaborated on what we believed would be a diary of a championship summer. The editors at Random House figured this team couldn't miss, not with a free agent star like Bonilla, a future Hall of Famer like Eddie Murray and three starting pitchers (Gooden, Cone and Bret Saberhagen) who either had or would win a Cy Young Award.
Trouble was, this team had none of the impenetrable confidence of their Eighties predecessors. The '92 Mets had plenty of paper-talent but were otherwise empty; for all their dreams of dominance, they were only a game over .500 on June 1. That's when the bottom fell out. The Mets lost 37 of 58 games in July and August, at which point the book had done a 180-degree turn.
"We need a new theme," said our editor, David Rosenthal. He was a die-hard Met fan who went on to become executive vice president and publisher of Simon and Schuster's adult trade division. Then, as now, Rosenthal had a sense of what would sell.
"The book is going to be about how much the Mets suck and why. And here's the title."
He paused for effect.
"The Worst Team Money Could Buy."
It was a catchy and fitting phrase. And it was easy enough to document; Harper and I wrote alternating chapters as a diary of the failed summer of 1992, flashing back to the better days in the Eighties. More than anything, though, "Worst Team" was a look at the not-so-glorious life of a baseball writer, and how the likes of Murray and Bonilla and Vince Coleman and Jeff Torborg had taken the fun out of being around the Mets.
We delivered the book to Random House in November of 1992, with the release date scheduled for the first week of April, 1993. That spring, Harper had joined the Daily News and was assigned to the Yankees, which meant I was the book's sole representative in Port St. Lucie. In the final days of camp, I told Torborg what was coming.
"This book is tough but fair," I said. "So don't take any of it personally."
Torborg thanked me.
"I know how this business goes," he said. "I appreciate the heads up."
Turns out Torborg wasn't so appreciative, not after reading that he'd lost control of the team within the first few weeks of the '92 season, and that he was afraid to stand up to Murray and Bonilla. Torborg found it easier to demonize the press than assert authority on his own. He did just that after "Worst Team" was released.
How did I know? Because before the second home game of the season, I was greeted in the clubhouse by this salvo.
"Look who just walked in, motherf-----. Hey, Bobby, why don't you s--- my d---? But don't take it personally."
It was Bonilla, repeating the last words I'd said to Torborg.
"That's right, you heard me, motherf-----. But, hey, don't take it personally."
It was a set-up plotted by Torborg and GM Al Harazin. Bonilla would later admit to Peter Gammons he'd never actually read the book, but that didn't matter. He'd been stoked up by the team's elders, now ready to act as their muscle.
Mets' publicist Jay Horwitz quickly realized there was an explosive situation on his hands. He closed the clubhouse, although he couldn't promise a cease-fire. Throughout the ensuing game against the Astros - which Dwight Gooden lost - my colleagues kept asking, "Are you going back down there?"
I had to. I had no choice. To do otherwise would be caving in to the Mets' intimidation tactics. If I bailed now, I could never set foot in that clubhouse again. So after the last out I trudged downstairs, taking a final deep breath as I pushed past the door.
Bonilla was waiting.
"Whattya know, the motherf-----'s back," he bellowed. Bonilla was standing across the room, knowing I'd have to walk towards him to get to Gooden. He and Doc had lockers only a few feet apart.
What followed was the most brutal 10 minutes of my professional life. I was part of a group of reporters interviewing Gooden, listening to Bonilla taunt me.
"Come on, motherf-----, make your move," he said. "I know you're feeling the itch. Make your move."
Bonilla was staring me down; I could feel eyes lasering through me as I asked Gooden a question. Doc and I had been friends since his rookie year in 1984 and I knew he was caught in a terrible quandary. He wanted to shut Bonilla up, but he knew he couldn't reprimand a teammate in public. Poor Doc. He was so unnerved he started brushing his scalp while answering questions - even though he was completely bald, having shaved his head a week earlier.
Meanwhile, Bonilla persisted, growing more menacing by the minute.
"Make your move, Bobby," he said. "Cause I'll hurt you."
I looked at Bonilla and asked, "Are you threatening me?"
"It's like the home boys say back home: we just chillin," he said with a street-snicker. And with that, Bonilla swiped a radio-microphone out of his face. The eruption was coming, although Bonilla didn't realize a NY-1 camera had been trained on him all along. This confrontation, which Bonilla thought would forever be our ugly little secret, would soon be all over ESPN.
The tipping point was when Bonilla called me a c--t. I'd already heard enough insults, but that one I couldn't allow. I put my notebook in my back pocket, circled around the group at Gooden's locker and got into Bonilla's face. Nothing - no one - was between us.
"You want to fight me?" I said. It was a question and a challenge, both. Bonilla, who stood 6-4, 240 pounds, had me by four inches and 50 pounds. I didn't like my chances, but if he wanted to go, I gave him the opening.
Bonilla did nothing.
Instead, he waited until clubhouse manager Charlie Samuels rushed to separate us. Horwitz and two other clubbies crossed the room in another eye blink. By then, it was obvious no punches would be thrown, although Bonilla was again shouting at me, telling me, "I'll show you the Bronx right here, motherf-----."
Looking back, I realized the whole episode was designed to embarrass and scare me, not to actually break my face. There was a line Bonilla knew he couldn't cross and - lucky for both of us - he didn't. It was an awful rest of the summer; the Mets kept losing, Torborg got fired and the few Mets who were brave enough to talk to me had to make sure the coast was clear in case Murray was nearby.
As for Bonilla, we didn't speak for six long years. It took Bobby Valentine to finally broker a peace treaty. When Bonilla returned to the Mets in 1999, he told the rightfielder he wouldn't tolerate any wars in his clubhouse. Valentine encouraged me to make the first move. It was in Port St. Lucie that I finally approached Bonilla. Once again, I took a deep breath, but to my surprise, it was Bonilla who broke the ice.
"Sometimes, you wish you could do things differently, do them over," Bonilla said. "But you can't. So you move on."
And with that, he offered his hand. It was as close to an apology as Bonilla would ever get, so we shook. Life with the Mets has improved ever since: from Al Leiter to Mike Piazza to David Wright, the stream of good guys has made it fun to be at Shea again.
The era of sex-and-drugs and juicy quotes is over, but so is the dark age. I'll take that trade-off.
Bob Klapisch has covered baseball in New York for the New York Post, New York Daily News and, most recently, The Bergen Record and ESPN.com. He is the author of five books, including "The Worst Team Money Could Buy" (Random House). His work has appeared in Sports Illustrated, Men's Journal, FHM and The Sporting News.
Klapisch, who pitched at Columbia University, still throws for the Hackensack Troasts in the semi-professional North Jersey Majors-Met League. He lives in Westwood, N.J. with his wife and two children.
| Designated Hitter | June 15, 2006 |
The Real Kings of Dodger Stadium
After reading Rich's piece about his alma mater, Lakewood High winning its fifth CIF Southern Section baseball title, I asked him if I could get equal time for my alma mater, John F. Kennedy High of Granada Hills. The Cougars won their seventh Los Angeles City section title on May 27 with a surprising 4-2 win over Chatsworth High at Dodger Stadium. Kennedy tied John C. Fremont High for the most Los Angeles City titles overall.
For those of you from outside of California, the organization that runs high school athletics in the state, the California Interscholastic Federation, is divided into ten sections. They are nowhere close to being equal in size. The Southern Section is the largest in terms of population and area and covers schools in places like Anza, Lee Vining, Edwards Air Force Base, San Luis Obispo, and even Lakewood. It contains both public and private schools. The Los Angeles City Section consists of all the schools that are members of the Los Angeles Unified School District (LAUSD). Depending upon the sport, there are around 50-60 schools competing for the title.
Kennedy High opened in 1971 in order to take care of the booming population in the north end of the San Fernando Valley. The LAUSD drew up a district for it that included upper middle class neighborhoods at the very northern edge of the city of Los Angeles as well as more working class neighborhoods in Lake View Terrace and Pacoima. But in the 1970s and 1980s, the school drew most of its students who lived in areas that were right at the median income level, like my family. I grew up just four blocks away from the school. The 118 Freeway (it's changed its name a lot since I was a kid, right now it's the Ronald Reagan Freeway) overpass was about halfway between my home and school.
Although it was a new school, Kennedy quickly developed a good reputation in sports, especially in baseball. The area was loaded with youth baseball leagues and the school had a wealth of talent to draw from. A team from Granada Hills won the Little League World Series back in 1964.
By the 1970s, the balance of power in high school baseball had shifted from schools like Fremont, Dorsey, and Venice, and moved to the San Fernando Valley, where it has remained mostly unchallenged for over 35 years. From 1973 through 2006, only one team from outside the San Fernando Valley, San Pedro High in 1992, has won the Los Angeles City high school championship.
1973 was a big year for baseball in the Los Angeles City section. You could see three future Hall of Famers playing in Robin Yount (Taft), Eddie Murray (Locke), and Ozzie Smith (also of Locke), but it was upstart Kennedy (in just its second season) that made it to the final at Dodger Stadium to take on Sylmar. Both teams had already faced off three times in regular season play.
The teams went to extra innings tied 1-1. Kennedy took a 2-1 lead in the top of the eighth on a single from future major leaguer Jim Anderson. Kennedy starter Jeff Jens retired the first two batters in the bottom of the eighth, but a walk and a hit led to Sylmar tying the game. Sylmar would win the game in the bottom of the ninth.
Jim Anderson would be the first Kennedy player to reach the majors when the Angels called him up in 1978 at the age of 21. His career highlight was more of a footnote. In Game 4 of the 1979 ALCS, the Angels trailed Baltimore 3-0 in the fifth inning. The Angels had loaded the bases with one out and Anderson came to bat. He scorched a hard grounder down the third base line that Doug DeCinces of the Orioles managed to smother. DeCinces stepped on third and then gunned out Anderson for a double play. Baltimore went on to win to 8-0 and went to the World Series. DeCinces had attended James Monroe High, a rival of Kennedy in nearby Sepulveda (now called North Hills.)
Kennedy won its first City championship in 1981 with a 4-2 win over Banning High of Wilmington. The team featured a battery of two future major leaguers in Jeff Wetherby (he didn't pitch as a pro) and catcher Phil Lombardi. Wetherby was once featured in Sports Illustrated because he was the only hitter at the time who had a career batting average of 1.000 against Greg Maddux and that hit was a home run to boot.
In 1983, another Cougar, Darryl Cias, got a cup of coffee with Oakland, playing 19 games at catcher. A pitcher, Bobby Moore, got into 11 games for the Giants in 1985.
1985 would be Kennedy's next appearance in the City championship game and they faced Banning again. And they won again, 10-9, on a walkoff homer by Kevin Farlow, who hit a fly ball down the left field line that traveled about 331 feet.
When Kennedy next played in the championship, the coach was Manny Alvarado. In his first year on the job, he led Kennedy to its third City championship, defeating Palisades 4-3. One of Kennedy's players that year was outfielder Garret Anderson, whom most people viewed as a basketball star who was bound for Fresno State. But the Angels drafted him soon after the season ended and Anderson made it up to Anaheim in 1994.
Alvarado led Kennedy to the City championship game in 1995 and 1996 with his most talented teams. He had two players who would make it to the majors in outfielder Terrmel Sledge and pitcher Jon Garland. Kennedy beat Carson 3-1 in 1995 and Poly High of Sun Valley, 5-4 in 1996. Despite Garland's status as a top prospect, he didn't pitch in either championship game as he was an underclassman and Alvarado opted to start an older pitcher, Derek Morse in each game.
Garland almost pitched Kennedy to a third consecutive title in 1997. Kennedy reached the semifinals that season and faced Banning. The semifinal was the day before the final and section rules stipulated that a pitcher could not throw more than 10 innings in a week. So Alvarado opted to hold out Garland for the final. But it backfired as Banning upset Kennedy in the semis. Garland would get his chance to pitch in a big game when White Sox manager Ozzie Guillen had him start games in last year's ALCS and World Series.
Alvarado got Kennedy to the final again in 2000 though. But the Cougars were underdogs to El Camino Real High of Woodland Hills, which featured Conor Jackson. Kennedy trailed 2-1 going into the seventh. Kennedy tied the game on a sacrifice fly and then went ahead on a 2-run triple by Eric Moore. The 4-2 win was Kennedy's sixth title.
Despite the 2000 championship, Chatsworth High was starting to develop a powerhouse squad. The school's program seemed to crank out college players and draft picks every year. They won the City title in 1999, 2001, 2003, and 2004 (going 35-0 that season). El Camino Real upset Chatsworth in the 2005 championship game.
The 2006 season was supposed to be just a prelude to a Chatsworth-El Camino Real title game. Kennedy had a solid season, winning its league, but had still lost 10 games. Like all of Alvarado's teams, it had solid pitching (an ERA under 1.50) and an offense that was good at executing with runners on base. At the high school level, small ball is much more prevalent and more effective as runs tend to be scarcer.
Kennedy was the #3 seed behind Chatsworth and El Camino Real. Kennedy faced El Camino Real in the semis and shocked them 3-2 to set up a faceoff with Chatsworth at Dodger Stadium. Both teams had won six titles.
Chatsworth led 1-0 after five, but Kennedy rallied for four runs in the sixth, its entire offense for the day, and held on for a shocking 4-2 win. Alvarado was now 5-0 in City championship games and Kennedy was 7-1 overall. Including consolation games, Kennedy has won 9 of 10 at Dodger Stadium.
A few days after the championship, Alvarado and some of his players appeared on a local Fox Sports show on prep sports. Co-host Lindsay Soto asked if the win over Chatsworth would make Kennedy "one of the powerhouses in City baseball." Alvarado politely responded, "I think we've done pretty well already."
Bob Timmermann, Kennedy High Class of 1983, has seen his alma mater win the City Championship four times and saw Phil Lombardi and Jeff Wetherby both play in a game at Shea Stadium on July 20, 1989. He writes at The Griddle.
| Designated Hitter | June 03, 2006 |
Aluminum Adjustments (Part 2)
When we last parted, fair reader, I was blabbing away with the contention that college pitching statistics could be effectively separated from the effects of defense, parks, and strength of competition. But at least I made it up to you by offering up a Top 25 List. And nothing whips us baseball fans into a lather quite like a list. So today's installment promises more of the same. Only this time, we turn our attention to college hitters.
In analyzing this year's draft-eligible college hitters, we'll begin with the same "scouting" filter applied to the pitchers. This time, the list of hitters was further refined using the metrics explained below.
And, again, this is not a list based on any type of prediction as to how these players will perform at higher levels.
NAME/SCHOOL/POSITION - Pretty much as you'd think.
OPS - A traditional measure of a player's all-around offensive performance.
POWER - Chicks dig the long ball. Here a player's power will be expressed in two ways:
Here's a quick, feeble explanation of linear weights, because we'll talk about them again later on. The role of the hitter is to produce runs. That's their end of the bargain. It is possible to quantify the value of each offensive event, (walk, single, double, etc...), based on how it contributes (or hampers) run scoring. Using these values, you can judge a hitter's overall offensive value by taking the value of each offensive event and multiplying it by the rate at which he gets them. Is that clear as mud? Sorry. Anyways, linear weights power measures only those events (doubles, triples, home runs) that are a reflection of a hitter's power.
SPEED - Speed is a Tool that doesn't seem to translate well into traditional offensive statistics. Here, we'll use a player's Speed Score, a metric pioneered by Bill James. When determining a player's Speed Score, we'll look at a function of his stolen bases, stolen base attempts, triples, and the percentage of times scored once on base.
DISCIPLINE - Earlier this year, on another popular baseball website, a leading sabermetrician with connections to a major league team offered the following (paraphrased) opinion: "one key to a good draft is selecting players with excellent plate discipline at the expense of hitters with gaudy, yet possibly illusory, power numbers." This is incredibly valuable insight. For us baseball geeks, it's as if Warren Buffett dropped into a Yahoo Finance chat room and said "Hello. If you're looking to invest in the stock market right now, I recommend everyone invest disproportionately in manufactured housing sector stocks with P/E ratios under 12.5 and R&D budgets that represent between 5-8% of their previous year's revenues. Have a nice day." So, we're going to take a look at a hitter's plate discipline, using these metrics:
wOBA - This is where it gets good. OPS is a fine statistic. It's quick (OBP+SLG), and everyone can quickly digest the fact that 1.000 = great. But it's not exactly what we want. Because all OPS really gives you, essentially, is the ability to pick up a player's wallet and see how fat it is. Bigger is better, that's for sure. But if you really want to be able to get a clear picture of how much a player is worth, you need to be able to open up the wallet and see exactly how many, and of what denomination, bills he has inside. And that's where Andy Dolphin, Mitchel Lichtman, and Tom Tango come in. In their recent book (which you should buy), they introduce what they call wOBA. Here's what it is: wOBA is a linear-weights (remember these?) based formula scaled to map with OBP. So, .300 = bad, .400 = good, .500 = great. It's basically a batter's run value per plate appearance, scaled in a way that makes it more user-friendly (when you read wOBA, think OBP).
AwOBA - Hitters are ranked by this metric. It is wOBA, adjusted for park and strength of schedule. Building again on the work of Boyd Nation, using his Division I park factors, I have taken each hitter's wOBA and first adjusted for the parks in which they played. Next, I took the now park-adjusted wOBA and isolated that from the strength of a player's schedule, averaging the ISR -- another Boyd stat -- of the opponent's of each player.
Now then. Let's take a look at the Top 25 offensive seasons registered by this year's draft-eligible college hitters, as sorted by AwOBA.
| RANK | Name | Team | POS | OPS | LWP | ISO | Speed | BB% | BB/K | wOBA | AwOBA |
|---|---|---|---|---|---|---|---|---|---|---|---|
| 1 | Evan Longoria | Long Beach State | 3B | 1.103 | 20.83 | 0.250 | 4.326 | 17.54 | 1.43 | 0.470 | 0.541 |
| 2 | Josh Morris | Georgia | 1B | 1.069 | 28.59 | 0.351 | 5.773 | 8.26 | 0.38 | 0.444 | 0.517 |
| 3 | Cyle Hankerd | Southern California | LF | 1.045 | 20.49 | 0.211 | 4.400 | 9.54 | 0.64 | 0.449 | 0.497 |
| 4 | Jim Negrych | Pittsburgh | 2B | 1.169 | 22.20 | 0.258 | 3.314 | 18.02 | 0.95 | 0.499 | 0.497 |
| 5 | Jordan Newton | Western Kentucky | C | 1.206 | 30.39 | 0.361 | 7.549 | 20.28 | 1.08 | 0.492 | 0.484 |
| 6 | Drew Stubbs | Texas | CF | 1.047 | 22.99 | 0.231 | 8.351 | 15.29 | 0.75 | 0.448 | 0.482 |
| 7 | Michael Campbell | South Carolina | CF | 0.965 | 15.66 | 0.134 | 5.826 | 10.68 | 1.92 | 0.423 | 0.481 |
| 8 | Alex Presley | Mississippi | CF | 0.975 | 21.60 | 0.176 | 8.429 | 12.86 | 0.89 | 0.420 | 0.480 |
| 9 | Mark Hamilton | Tulane | 1B | 1.105 | 24.02 | 0.312 | 2.922 | 18.22 | 1.22 | 0.466 | 0.478 |
| 10 | Aaron Bates | N.C. State | 1B | 1.053 | 21.36 | 0.218 | 5.175 | 16.60 | 1.64 | 0.458 | 0.475 |
| 11 | Chris Coghlan | Mississippi | 3B | 0.920 | 17.38 | 0.118 | 8.594 | 12.70 | 1.88 | 0.410 | 0.468 |
| 12 | Josh Rodriguez | Rice | SS | 1.012 | 23.24 | 0.221 | 6.773 | 15.35 | 1.23 | 0.433 | 0.465 |
| 13 | Jon Jay | Miami | CF | 0.962 | 13.94 | 0.138 | 7.563 | 15.42 | 1.43 | 0.432 | 0.464 |
| 14 | Wes Hodges | Georgia Tech | 3B | 1.036 | 24.60 | 0.264 | 0.000 | 12.67 | 0.67 | 0.439 | 0.455 |
| 15 | Brett Pill | Cal State Fullerton | 1B | 0.964 | 20.32 | 0.179 | 5.212 | 14.47 | 1.00 | 0.423 | 0.453 |
| 16 | Andy D'Alessio | Clemson | 1B | 1.052 | 27.32 | 0.353 | 4.387 | 8.52 | 0.41 | 0.434 | 0.450 |
| 17 | John Shelby | Kentucky | 2B | 1.030 | 28.84 | 0.346 | 5.636 | 13.36 | 0.71 | 0.429 | 0.449 |
| 18 | Carson Kainer | Texas | LF | 0.965 | 23.21 | 0.170 | 5.405 | 8.04 | 0.56 | 0.416 | 0.447 |
| 19 | Jon Still | N.C. State | C | 0.996 | 15.85 | 0.174 | 3.925 | 16.04 | 1.42 | 0.431 | 0.446 |
| 20 | Matt Antonelli | Wake Forest | 3B | 1.031 | 24.15 | 0.249 | 7.571 | 15.14 | 1.58 | 0.441 | 0.444 |
| 21 | Jimmy Van Ostrand | Cal Poly | 1B | 0.994 | 21.23 | 0.260 | 4.206 | 13.79 | 1.00 | 0.430 | 0.444 |
| 22 | Blake Davis | Cal State Fullerton | SS | 0.941 | 14.33 | 0.119 | 7.572 | 9.05 | 0.95 | 0.414 | 0.443 |
| 23 | Chad Tracy | Pepperdine | C | 0.902 | 21.08 | 0.166 | 6.789 | 7.85 | 0.86 | 0.391 | 0.436 |
| 24 | Matt LaPorta | Florida | 1B | 0.948 | 17.41 | 0.278 | 0.000 | 15.05 | 0.82 | 0.411 | 0.432 |
| 25 | Chris Valaika | UC Santa Barbara | SS | 0.911 | 17.67 | 0.186 | 4.914 | 4.78 | 0.22 | 0.390 | 0.432 |
THANKS: Once again, these articles, and the research that underlies them, simply would not have been possible were it not for a few extremely smart people I have had the pleasure of getting to know in a non-creepy internet way over the past few months. First, Tom Tango offered insight, wisdom, and advice every step of the way. He is a brilliant guy, and the fan in me can only hope that he is on Theo Epstein's speed dial. Craig Burley's previous work in this area helped inspire me to undertake this effort in the first place, and his thoughts along the way even helped it all make sense. And finally, of course, I can't even begin to thank Boyd Nation for all of his time and help. Remember, when it comes to college baseball, it's Boyd's World, and we're just living in it.
| Designated Hitter | June 02, 2006 |
Aluminum Adjustments (Part 1)
If Moneyball taught us anything, it's that you should never underestimate a man with titties.
I am referring, of course, to the infamous passage from Michael Lewis's 2003 best-seller which details the reaction of an Oakland minor league coach after seeing the club's prized 7th round pick, Brant Colamarino, take off his shirt. But there are larger questions that this anecdote invokes, beyond the size of manzier for which Colamarino should be fitted. Namely, is it possible that in college baseball there still exists an entire class of players who are either over-looked or missed altogether due to the effects of the parks in which they play, the level of competition against whom they play, or due to scouts who might too often worship at the altar of The Five Tools?
Before going any further, let me be clear on two important points. First, I am not here to pick a fight with the scouting community. Because no major league team should, in their right mind, ignore the experience and observations of their professional scouts. Rather, what follows is an attempt at using the best of both worlds to determine the top seasons as recorded by this year's draft-eligible college hitters and pitchers.
Second, this is not a prediction of how a player's college performance will translate to wood bats and the major leagues. I am certain that work is being done, but you won't find it here.
With that out of the way, here's what I did. First, I took every draft-eligible college pitcher who had appeared on any of Baseball America's Top College Prospects lists at any point this year. Next, I sought to refine this "scouting" list by using the metrics explained below. So, it's as if your team's scouting department runs into the Baseball Operations office with their list of the best 50 or so pitchers in college baseball from the past season, the GM takes a look, and then turns to you as you sit at your laptop and says: "get to work."
So, here goes...
NAME: The player's name. See, this is going to be easy!
TEAM: Where they go to school. Still with me?
POSITION: I even threw in their handed-ness for free.
IP: Innings Pitched.
ERA: Your standard Earned Run Average. Joe Morgan should probably stop reading here.
STUFF: What defines a pitcher's "stuff?" Seriously. I'm asking. I don't know. To me, it's always been one of those things that everyone knows exists, but no one has been able to adequately explain. Like Scientology. Or David Hasselhoff's career. Alas, we'll seek to define it here through the prism of the following metrics:
DERA: Did somebody say defense-independent pitching performance? OK, then. Years ago, Voros McCracken penned what is arguably the most important sabermetric article on pitching ever written. The long-and-short of it is this: the analysis of a pitcher's effectiveness should be based only on plays which are completely under his control: home runs allowed, strikeouts, hit batters, and walks. By doing this, and thus assuming that a pitcher's singles, doubles, and triples allowed will all follow certain regular characteristics, you can peer into what a pitcher's true ERA would look like if they had an average defense playing behind them. So, there you go. What I've used for the list below is an equation developed by Boyd Nation specifically for the college game.
AdjDERA: This is where things get tricky. This analysis looks further than DERA by adjusting for both Strength of Schedule and Park Effects. These are critical factors when analyzing the college game, as the level of competition and the characteristics of the parks in which they play vary widely from team to team. For pitchers, there is an added level of complexity because this should be done only for teams against whom they have pitched, and only for stadiums in which they have played. Don't worry. I've gone through the 2,000+ game logs so you don't have to. Note that adjustments for schedule strength and park factors stem from Boyd Nation's ISR and PF.
Finally, then. After all that...here are the Top 25 pitching performances this year (through the weekend of May 21), as sorted by AdjDERA.
| RANK | Name | Team | POS | IP | ERA | K/9 | K/100P | K-BB/BF | K-BB/HR | DERA | AdjDERA |
|---|---|---|---|---|---|---|---|---|---|---|---|
| 1 | Mark Melancon | Arizona | RHP-R | 39.1 | 2.97 | 12.0 | 7.87 | 0.222 | No HR | 2.15 | 1.84 |
| 2 | Steven Wright | Hawaii | RHP-S | 101.2 | 2.48 | 9.8 | 7.82 | 0.227 | 45.500 | 2.25 | 2.20 |
| 3 | Chase Lirette | South Florida | RHP-R | 39.1 | 2.97 | 9.9 | 7.71 | 0.217 | 35.000 | 2.37 | 2.26 |
| 4 | Craig Baker | Cal State Northridge | RHP-S | 99 | 3.91 | 9.0 | 6.52 | 0.155 | 22.667 | 3.14 | 2.44 |
| 5 | Andrew Miller | North Carolina | LHP-S | 89.2 | 1.71 | 9.9 | 7.67 | 0.194 | 71.000 | 2.57 | 2.48 |
| 6 | Justin Masterson | San Diego State | RHP-S | 111 | 4.54 | 8.5 | 6.40 | 0.168 | 10.125 | 3.50 | 2.67 |
| 7 | Harold Mozingo | Virginia Commonwealth | RHP-S | 82.2 | 2.07 | 10.2 | 8.42 | 0.255 | 15.800 | 2.67 | 2.74 |
| 8 | Brad Lincoln | Houston | RHP-S | 113 | 1.67 | 11.2 | 8.48 | 0.261 | 14.375 | 2.77 | 2.75 |
| 9 | Joba Chamberlain | Nebraska | RHP-S | 75 | 3.72 | 10.4 | 7.14 | 0.174 | 18.667 | 3.29 | 2.75 |
| 10 | Kyle McCulloch | Texas | RHP-S | 93.2 | 2.98 | 7.2 | 4.65 | 0.120 | 51.000 | 3.12 | 2.77 |
| 11 | Kris Johnson | Wichita State | LHP-S/R | 46.1 | 3.11 | 8.6 | 6.48 | 0.145 | No HR | 2.95 | 2.82 |
| 12 | Jeff Manship | Notre Dame | RHP-S | 88.1 | 2.65 | 10.4 | 7.89 | 0.234 | 16.600 | 2.73 | 2.86 |
| 13 | Tim Lincecum | Washington | RHP-S | 116.1 | 2.01 | 14.3 | 9.87 | 0.257 | 17.714 | 2.95 | 2.86 |
| 14 | Ian Kennedy | Southern California | RHP-S | 94.1 | 3.63 | 9.0 | 6.61 | 0.155 | 21.000 | 3.23 | 2.97 |
| 15 | Max Scherzer | Missouri | RHP-S | 59.2 | 2.11 | 10.0 | 7.28 | 0.181 | 14.333 | 3.46 | 3.00 |
| 16 | Brett Sinkbeil | Missouri State | RHP-S | 61.2 | 2.34 | 9.9 | 7.55 | 0.188 | 22.500 | 3.13 | 3.03 |
| 17 | Chris Perez | Miami-FL | RHP-R | 43.1 | 1.87 | 11.3 | 7.84 | 0.164 | No HR | 3.15 | 3.08 |
| 18 | Andrew Carpenter | Long Beach State | RHP-S | 110.2 | 2.93 | 7.6 | 6.37 | 0.176 | 18.250 | 3.08 | 3.10 |
| 19 | Josh Butler | San Diego | RHP-S | 102.2 | 2.89 | 8.0 | 5.81 | 0.128 | 29.000 | 3.30 | 3.12 |
| 20 | Daniel McCutchen | Oklahoma | RHP-S | 112.1 | 3.61 | 8.4 | 5.83 | 0.144 | 10.286 | 3.70 | 3.15 |
| 21 | Jonah Nickerson | Oregon State | RHP-S | 94 | 2.59 | 8.8 | 6.74 | 0.172 | 16.750 | 3.18 | 3.24 |
| 22 | Mike Felix | Troy | LHP-S/R | 88.2 | 3.35 | 12.1 | 8.35 | 0.206 | 15.800 | 3.22 | 3.24 |
| 23 | Doug Fister | Fresno State | RHP-S | 102.2 | 3.86 | 8.5 | 5.50 | 0.113 | 26.500 | 3.58 | 3.33 |
| 24 | Brandon Morrow | California | RHP-S | 93.1 | 1.74 | 9.3 | 6.99 | 0.157 | 12.000 | 3.71 | 3.35 |
| 25 | Adam Ottavino | Northeastern | RHP-S | 86.2 | 2.91 | 11.9 | 8.86 | 0.242 | 21.000 | 2.70 | 3.38 |
THANKS: These articles, and the research that underlies them, simply would not have been possible were it not for a few extremely smart people I have had the pleasure of getting to know in a non-creepy internet way over the past few months. First, Tom Tango offered insight, wisdom, and advice every step of the way. He is a brilliant guy, and the fan in me can only hope that he is on Theo Epstein's speed dial. Craig Burley's previous work in this area helped inspire me to undertake this effort in the first place, and his thoughts along the way even helped it all make sense. And finally, of course, I can't even begin to thank Boyd Nation for all of his time and help. Remember, when it comes to college baseball, it's Boyd's World, and we're just living in it.
On Deck: The Hitters.
Kent Bonham is a consultant in Washington, DC. He can be reached here.
| Designated Hitter | June 01, 2006 |
Baseball Is More Than Superstars
Thanks to Chad Finn for his fine article on Red Sox journeyman players. Like Finn, I have always gravitated towards baseball's "average Joes" rather than the game's superstars.
Why do I find .230 hitters and junkball pitchers fascinating? In a word, reality.
How many people are the Mickey Mantles or Ozzie Smiths of their chosen professions? Those of us who love baseball but had modest talent could only imagine being in the majors in any capacity. If everything went absolutely right, us mopes of meager ability might be the 24th or 25th man on the roster of a losing team for half a season or have gotten a September cup of coffee. Never mind being the next Ted Williams. Having Ted Ford's career would have been a thrill beyond description.
Why do people complain about the inflated egos and wages of the big names while they ignore the genuinely grateful guys who pull down a much lower salary? If your tastes run closer to Ralph Kramden than Ralph Lauren, pick a journeyman and support him. He'll appreciate your cheers far more than the overpaid and overhyped lug with a fat contract.
Here are some of my favorite blue-collar ballplayers.
Ray Oyler and his .175 lifetime average (lowest of the live ball era for a player with a minimum of 1000 career at-bats) in 1266 ABs makes the Tigers shortstop the poster boy of the good-field, no-hit crowd.
With just one .200 plus season (.207 in 1967) during a big league career that lasted from 1965 to 1970, Oyler was obviously solid with the glove. Johnny Sain described Oyler as one of the best fielders he saw in half a century in the game. With a career average exactly 40 points below Mario Mendoza's, Oyler kept several American League pinch hitters gainfully employed.
1968 was the epitome of Ray's career. The Tigers won the American League pennant and defeated the Cardinals in the World Series despite Oyler's .135 batting average in 215 ABs. He appeared in 111 games that season, often as a late-inning defensive replacement.
The weak bats of Oyler and fellow infielders Dick Tracewski (.156) and Tom Matchick (.203) motivated Detroit manager Mayo Smith to make one of the gutsiest gambles in baseball history. Centerfielder Mickey Stanley was moved to SS to make room in the lineup for Al Kaline, who missed much of the season with a broken wrist. Oyler appeared in four of the seven World Series contests, all as a defensive replacement for Stanley.
Oyler went to the ill-fated Seattle Pilots in the expansion draft. Like many players, he feasted (relatively speaking) on 1969's expansion year pitching and jacked his average up to .165 in 255 ABs. The 305-foot left field line at Sicks Stadium undoubtedly helped Oyler smack seven of his 15 career home runs.
A hustling 5'6", 190-pound fireplug, Walt "No Neck" Williams was no slouch with the stick, as proven by his .270 lifetime average in a pitching-dominated era.
Originally signed by the Houston Colt .45s, No Neck (just one look at him explains the nickname) played briefly with the team in 1964 before being traded to the White Sox. He debuted with the south siders in 1967, and a .304 average in 1969 was good enough for sixth place in the American League.
What made No Neck special was his genuine and obvious enthusiasm. He didn't have much of an arm, but you knew he'd give an honest effort and more every time he took the field. Even with his lack of height, Williams seldom walked. Just 126 free passes in 2373 career ABs would make Billy Beane and the OBP crowd groan, but just 211 strikeouts attests to No Neck's skill as a contact hitter.
After hitting .289 in 350 ABs with the Indians in 1973, No Neck closed out his major league career with two seasons (1974-75) as a Yankees reserve. A top big league wage of $32,000 means Williams didn't get wealthy from baseball.
Another White Sox journeyman - slick-fielding first baseman Mike Squires - makes the list.
The ultimate stereotype buster, Squires is the extreme opposite of the typical slugger at his position. With just six home runs and a .260 average in 1580 career at-bats, the 5'11" Squires was known for his defensive abilities. He won the A.L. Gold Glove in 1981 while hitting .265 with 0 HR and 25 RBI in that strike-shortened year.
Squires was one first sacker who could do more than take routine throws, as he also filled in at catcher and saw some action as a defensive replacement at third base. Not unusual, you say? Keep in mind that Spanky was a left-hander, and it's obvious that he was a unique player.
Tony LaRussa was impressed enough with Squires to use him behind the plate for a pair of short stints in 1980. The White Sox's usual gaping hole at 3B and Squires' glove gave LaRussa the idea of using the southpaw on the other side of the infield in 1984.
Squires flawlessly handled a dozen chances in 13 games at 3B. He also played errorless ball at 1B (242 chances) and in the outfield (five putouts) for a perfect 1.000 fielding percentage. Sadly a .183 average in 82 ABs spelled the end of his big league career.
There are plenty of weak-hitting catchers, but Jerry Zimmerman stands out from the pack.
As a Reds rookie in 1961, the Nebraska native teamed with fellow rookie Johnny Edwards. A pair of newcomers behind the plate on the same team is rare, and that is especially true for a pennant-winning squad. The only other league champion with that distinction is the 1944 St. Louis Browns, who relied on Red Hayworth and Frank Mancuso during a time when even marginal players were extremely scarce because of World War II.
A rookie catcher with solid defensive skills can often be expected to improve offensively from a .206 average in 76 games and 204 ABs. In Zimmerman's case, it was an almost prophetic preview of his .204 career average. Batting average is only one component of a player's offensive contribution. In Zimmerman's case, it may have been his strong suit.
The power numbers - just 22 doubles, a pair of triples and three homers in 994 career ABs - adds up to a .239 slugging percentage, which is a dozen points lower than the previously mentioned Ray Oyler. A total of 78 walks and 11 hit by pitches pushes the on-base percentage to a whopping .269.
Those who love odd stats may want to check out Zimmerman's career. He scored just 60 runs over eight seasons. As a member of the pennant-winning 1965 Twins, the right-handed hitter appeared in 83 games, but had just 154 ABs. His .214 average and 33 hits included three extra-base knocks - one double, triple and homer. With just eight runs scored and 11 RBI, it's a good thing the Twins had Harmon Killebrew and Tony Oliva around. In four World Series appearances (two each in 1961 and 1965), Zimmerman batted just once.
Maybe this defensive whiz just needed more time at the plate to get his stroke down. Move to 1967, when Zimmerman had career highs in games played (104) and at-bats (234). The results? A .167 average (39 hits) with three doubles and a HR for a .192 slugging percentage. As a former catcher, I could never imagine being the next Johnny Bench or Pudge Rodriguez, but could I warm up pitchers in the bullpen and hit bloop singles like Zimmerman?
Gene Mauch hired Zimmerman as a coach with the first-year Expos in 1969. The former backstop also scouted for many years prior to his death in 1998.
Steve Fireovid is a frontrunner for the Rodney Dangerfield Award. With teams on a constant hunt for pitching, it would seem that this control artist would have gotten a shot or two as a fourth or fifth starter with someone.
The right-hander spent a decade in AAA with nine different organizations. Even though he consistently put up decent numbers, Fireovid was usually overlooked because he was a groundball specialist rather than a power pitcher.
What does Fireovid have to show for numerous trips to Toledo, Omaha, Des Moines and other trendy spots? Six widely scattered cups of coffee (small ones) with five different teams from 1981 to 1992 are the extent of his major league record.
He never pitched more than 26.1 innings or 10 games in any of those short stretches in the majors. If this sounds like someone with a 6.40 career ERA, guess again.
In his 31 games pitched (five starts) and 71.2 innings, Fireovid had a 3-1 record with a 3.39 ERA and just 19 walks. The hits (93) to innings ratio is high, but "Fire" also gave up a large number of groundball singles followed by double plays.
The hindsight scouting report: Deserved a decent shot, could have won 10 to 12 games at the back of the rotation. Would benefit greatly from a strong defensive infield behind him. Check out Fireovid's book The 26th Man for an inside look at the frustration of life as a career AAA type.
Speaking of perennial AAA guys and great baseball names, Razor Shines spent nine seasons (1984-1989 and 1991-1993) with the Indianapolis Indians. He also appeared in a total of 68 games for the Expos in 1983, 1984, 1985 and 1987.
A solid run producer with power in AAA, Shines didn't have much success as a Montreal pinch hitter and first baseman. He was 15 for 81 (.185) in the Show, with a lonely double as his only extra-base hit. Strangely, Razor never scored a run with the Expos.
Shines became the most popular player in Indianapolis history during his lengthy career in the city. In something that sounds like a story from the 1940s, he spent at least one offseason driving a heating oil truck in Indy.
Razor has become a successful minor league manager, moving up from Class A to his current position as skipper of the Charlotte Knights of the International League (AAA). I had the opportunity to hear Shines on a radio interview last year. This faithful baseball foot soldier bubbled over with enthusiasm as he discussed the players on the Birmingham Barons roster. Here's hoping that Razor gets a shot as a major league manager or coach.
There is much more to baseball than the big names. Some of the best stories and insights I've ever gotten have come from players on the lower end of the salary and fame scale. Give the average guys a chance, and enjoy the finest sport ever invented from a whole new perspective.
Al Doyle has been a regular contributor to Baseball Digest since 1986. He has also covered the Mexican League for the Mexico City News.
| Designated Hitter | May 25, 2006 |
Instant Replay and the 1985 World Series
Imagine it's the seventh game of the World Series with two outs in the bottom of the ninth inning. There's a runner on first base with the home team trailing by one run. The game is being played at Minute Maid Park in Houston with all its outfield nuances.
The Houston batter drives the ball toward the wall in deep left-center field. If it hits to the left of the line drawn on the outfield wall, it's a two-run home run, walk-off victory and World Championship for the Astros. If not, it's a possible tie game. The ball rockets off the wall near the line. To the umpire, it appears to hit right of the line, so the ball is ruled in play - a ruling that might become the biggest umpiring mistake in baseball history. The outfielder fields the ball quickly off the wall and fires it to the cut-off man. The relay throw comes to the catcher as the base runner heads home with the potential tying run. It's a close play, but the runner is clearly out for the final out of the game! In an instant, the visiting American League team has just won the World Series! Or did they?
Winners from the visiting dugout empty onto the field in joyous celebration. Just as quickly, the home dugout erupts in objection that the ball hit to the left of the line for a walk off home run. The home fans react as one, beseeching the umpires to review the play and reverse the call. Meanwhile, Astros manager Phil Garner runs out onto the field trying to get the umps' attention, with arms alternately flailing and pointing to the line on the wall. With no instant replay in baseball, the umpires' only recourse is to gather in conference to discuss the call.
Was it to the left or the right of the line? During the lengthy conference, TV replays in slow motion show that the ball did indeed land inches left of the line for what should have been ruled a home run! The Astros should be celebrating their championship! Now the crowd is screaming at the umps to reverse the call. The TV coverage shows it again, and again, and again from every possible angle with the same result. The crowd gets more and more hostile. Finally, the head umpire emerges from the huddle with clenched fist in the air, indicating the runner is out at home plate and the call stands. All hell breaks loose...
One can only imagine the bedlam this scenario could create. The outcome of the World Series would be completely decided by a blown call. Increasingly, it seems officiating is coming into question in major American sporting events. The Super Bowl saw a series of non-reviewable calls go the way of the Steelers that helped them win the NFL title. Likewise, the MLB playoffs and World Series saw a number of controversial calls, most notably the A.J. Pierzynski dash to first. Less controversial was a home run in Game 3 of the World Series, similar to the one described above, in which a ball scorched by Jason Lane actually hit to the right of the line but was ruled a home run for the Astros. Luckily for the umpires, the White Sox eventually won that game, and their blown call didn't affect the outcome. These situations always take me back to the 1985 World Series between the Cardinals and the Royals, and the "safe" call at first by umpire Don Denkinger. It is arguably the most crucial blown call in the history of baseball. More than twenty years later, Cardinals fans still claim their team would have won the Series if Denkinger made the correct call. Royals fans claim it was destiny regardless of the blown call. Clearly it didn't affect the outcome 100% like the scenario above, but it was certainly significant. I recently set out to try and quantify the impact of the blown call. You might be surprised at my conclusion.
 Allow me to review the game situation that autumn evening in 1985. The Cardinals were leading the series 3 games to 2 and had a one-run lead heading into the ninth inning of Game 6. Their closer, Todd Worrell, was trying to finish off the game and seal the championship. Jorge Orta led off the inning for the Royals by hitting a slow roller to first baseman Jack Clark who tossed to Worrell covering first. Worrell and the ball beat Orta to the bag, but Denkinger called Orta safe. Through a calamity of subsequent errors by the Cardinals, the Royals scored 2 runs in the inning to win Game 6, and then rode that momentum to a Game 7 victory and World Series title. In order to assess the impact of the call, one has to compare the probability of a Royals comeback in Game 6 with 1 out and nobody on base, versus 0 out and a runner on first base. Using Retrosheet data from the 1985 season, the pertinent probabilities for the 2 alternatives are below:
Blown Call
X0 = P(of 0 runs scoring with a runner on 1st, 0 out) = P(Cards win Game 6 in 9th) = .5750
X1 = P(of 1 run scoring with runner on 1st, 0 out) = P(extra innings) = .1833
X2 = P(of 2 or more runs with runner on 1st, 0 out) = P(Royals win Game 6 in 9th) = .2417
The probability of the Cardinals winning Game 6 following Denkinger's blown call (assuming a 50% chance of winning an extra inning game) is then: X0 + 0.5*X1 = .5750 + 0.5*.1833 = .6667. And the probability of the Royals winning Game 6 is therefore 1 - .6667 = .3333.
Correct Call
Y0 = P(of 0 runs scoring with 0 on base, 1 out) = P(Cards win in 9) = .8420
Y1 = P(of 1 run scoring with 0 on, 1 out) = P(extra innings) = .0915
Y2 = P(of 2 or more runs with 0 on, 1 out) = P(Royals win in 9) = .0665
The probability of the Cardinals winning Game 6 if Denkinger had made the correct call is: Y0 + 0.5*Y1 = .8420 + 0.5*.0915 = .8878. So the probability of the Royals winning Game 6 is 1 - .8878 = .1122.
Denkinger's call therefore effectively tripled the Royals chances of winning the game from .11 to .33.
Of course, this is assuming Todd Worrell and the Cards' defense gave up runs at the league average for the 1985 season, and that the Royals scored runs at the league average. This was actually not the case. The Royals' offense was less than ordinary, scoring 4.24 runs per game versus the major league average of 4.33 runs per game - roughly 2% below average. Meanwhile, the Cards' defense was best in the majors in 1985 thanks to Gold Glove winners like Ozzie Smith, Andy Van Slyke, Willie McGee, Terry Pendleton and Joaquin Andujar. Combined with their exceptional pitching, the 1985 Cardinals allowed 3.53 runs per game, 2nd best in the majors and 18% better than the league average. Assuming a stingier Cardinals run prevention pattern against the Royals by 20%, the probability of a comeback in Game 6 following a correct call would be .0898 instead of .1122.
I would also contend that the blown call created doubt in the Cardinals minds and uplifted the Royals hopes, resulting in more advantageous odds for the Royals. This hopefulness combined with momentum and home field advantage for the Royals would result in greater than a 50% chance of winning an extra inning game, and a greater than 50% chance of winning Game 7. Let's say both odds are .60 instead of .50. And let's say that the blown call reduced the Cardinals to mere mortals, at the league average in preventing runs. These are reasonable assumptions considering the Cards unraveled in Game 6 after the blown call, and continued that trend in Game 7, losing by a score of 11-0. And since the objective is not merely to win Game 6, but to win the World Series, let's redo the analysis to see the total impact of the call. The chance of the Royals winning both Game 6 and Game 7 if the correct call were made is:
P(winning Game 6)*P(winning Game 7) = .0898*0.5 = .0449
In comparison, the probability of the Royals winning both Game 6 and Game 7 following the blown call is: (1 - (X0 + 0.6*X1))*0.6 = (1 - (.5750 + 0.6*.1833))*0.6 = .1890.
This revised analysis indicates that Don Denkinger's call made a significant difference in the outcome of the 1985 World Series, allowing the Royals to improve their chances more than 4-fold, from a mere 4% chance of winning it all to a more encouraging 19%. In reality, the call at first base opened the door from a crack to ajar, and to their credit, the Royals were able to take advantage of their good fortune. Regardless, the odds are 4 to 1 that the blown call changed the outcome of the World Series. If instant replay were used to make the correct call, the chances are greater than 80% that the Cardinals would have won the World Series instead of the Royals.
In November of 1998 I had the pleasure of golfing with TV play-by-play announcer Dave Barnett. We were discussing the great home run race that summer between Mark McGwire and Sammy Sosa, and he mentioned that McGwire was robbed of a home run during a game he called in Milwaukee in mid-September. The umpires decided that a fan in the bleachers reached over the wall a la Jeffrey Maier to catch a potential home run ball. The play was ruled fan interference and a ground rule double for McGwire when replays showed the ball definitely cleared the wall before being touched by the fan. McGwire should have actually been credited with 71 home runs that magical year instead of 70. Without instant replay, one of the most hallowed records in major league baseball history was incorrectly recorded. Similarly, I was recently watching a Cardinals telecast and the camera zoomed in on Whitey Herzog in the stands. One of them mentioned that Whitey, the manager of the Cards from 1980 to 1990, would be in the Hall of Fame if the Cards had won that 1985 World Series. Without instant replay, Whitey Herzog was potentially denied his rightful place in Cooperstown.
I suppose life isn't always fair, but my point is that with the proper use of instant replay in baseball it can be fairer. The technology is available, so why not use it? The NFL and NCAA use it extensively to review controversial calls in football. It's used in the NBA to check shot clock disputes. But major league baseball steadfastly refuses to keep up with progress. Baseball needs to incorporate instant replay now before a scenario like the one at the beginning of this article hurts the integrity of the game. Without instant replay, who knows how many future World Series outcomes, all-time records, and Herzog-like Hall of Fame snubs will be in error?
Ross Roley is a lifelong baseball fan, a baseball analysis hobbyist, and former Professor of Mathematics at the U.S. Air Force Academy.
| Designated Hitter | May 18, 2006 |
Barry Bonds Homers
The words in the title have been spoken hundreds of times in the last twenty years by broadcasters and fans alike. Through Sunday, May 14, 2006, Bonds has hit 713 round-trippers, which places him third on the all-time homer list for the majors behind Hank Aaron and Babe Ruth. In this article, we will examine some of the statistical breakouts of those 713 long balls and compare them to Ruth's 714. Many of the differences are simply a sign of how the game has changed in 80 years, with many new teams and a different treatment of starting pitchers among the changes. When Ruth played, there were 8 teams in each league so there were fewer pitchers to face during a season. Also, a starting pitcher was expected to work much further into the game than starters do now, so a batter might only face two hurlers in a contest. Now it is common to have three or four pitchers work in one inning.
Barry Bonds hit his first big league home run on June 4, 1986 off Craig McMurtry of the Braves at Atlanta-Fulton County Stadium. The solo shot came in the fifth inning of a game in which the 21-year-old Bonds played center field for the Pirates a week after making his debut. McMurtry became the first of 419 different pitchers to surrender a four-bagger to Bonds; Babe Ruth hit his 714 homers off 216 hurlers, with 17 of the blasts off Rube Walberg. In fact, Ruth hit at least 10 home runs each off 13 different pitchers. Bonds has not hit more than eight homers off any one pitcher, although he has reached four pitchers for that total: Greg Maddux, Terry Mulholland, John Smoltz, and Curt Schilling.
Bonds, hitting in the first spot in the order for most of the 1986 season, smacked sixteen homers his rookie year. He reached 100 on July 12, 1990 against the San Diego Padres, with a blast off an Andy Benes pitch. In his career, Bonds has hit 82 home runs off Padres hurlers, more than any other team. In fact, the second highest total, 63 off the Expos/Nationals, is far behind that of the Pads. Ruth hit 123 four-baggers off Tigers pitchers and 108 off hurlers for the Philadelphia Athletics. The Babe hit home runs off all eight American League teams in his career and six homers off four different teams in the Senior Circuit in 1935. In contrast to Ruth, Bonds has homered off 27 different clubs during his National League career, including 11 American League teams. The three AL clubs which have not surrendered a four-bagger to Bonds are the Boston Red Sox, Cleveland Indians and Tampa Bay Devil Rays.
Early in his career with the Pirates, Bonds hit in the leadoff spot most of the time. During that time, he led off 20 games with a home run, which places him in the top 20 on the career list. His father Bobby hit 35 leadoff homers to place fourth on the career list and held the single-season record for 23 years. Barry has hit three inside-the-park home runs in his career, one in 1987 and two more in 1997. Ruth rounded the bases ten times on inside-the-park homers but never hit a leadoff home run.
Bonds hit his 200th career homer on July 8, 1993, his first season as a member of the San Francisco Giants. While with the Pirates, Bonds hit 176 home runs and the remainder have been as a Giant. Babe Ruth played for three clubs in his career, hitting 49 for the Red Sox, 659 for the Yankees and 6 for the Boston Braves. Bonds joined the 300 Homer Club in 1996 and reached 400 in 1998. On April 17, 2001, Bonds became the 17th member of the 500 Home Run Club with a two-run shot off Terry Adams of the Los Angeles Dodgers in San Francisco. It was the 7,501st at bat in his career, which places Bonds in the middle of the list for homer #500. Ruth had taken 5,801 at bats to become the first batter with 500 homers. Mark McGwire took the fewest at bats to reach the milestone (5,487).
On August 9, 2002, Bonds hit his 600th home run, becoming the fourth player in history to perform this feat. It was hit off Kip Wells of Bonds' old team, the Pirates, in a game played in San Francisco. Two years later, Bonds reached 700 homers on September 17, 2004 in another game played in San Francisco. Only three batters have hit 700 home runs. Ruth hit his in 1934 and Hank Aaron joined Ruth in 1973. Aaron holds the record for most home runs in the National League with 733 while Ruth's 708 leads the Junior Circuit.
Bonds has homered in 35 different ballparks in his career. His top total is the 140 hit at Candlestick Park in San Francisco, with 135 (through May 17) at AT&T Park (formerly Pac Bell Park). Ruth hit four-baggers in 12 different parks, with 259 at Yankee Stadium and 85 at the Polo Grounds, which was the Yankees' home prior to 1923. Bonds has hit 15% of all the four-baggers at Pac Bell. By comparison, in the first five years of Yankee Stadium (1923-27) the Babe hit 105 home runs, which is 19.8% of all homers hit at the stadium. This reflects the completely different game environment that existed in the early 1920s. Ruth outhomered all seven other American League clubs in 1920 when he swatted 54 homers. For a more recent comparison of ballparks, Larry Walker hit 12.8% of the homers hit in the first five years of play at Coors Field in Denver.
In his career, Bonds has homered off the following pairs of brothers:
He also homered off both pitchers named Greg Harris, who are not related. Ruth did not homer off any pairs of brothers in his career.
Babe Ruth hit multiple home runs in one game 72 times, while Barry Bonds has accomplished the feat 68 times. Ruth hit 16 grand slams and Bonds has 11. In four different seasons, Ruth hit at least 50 homers, with totals of 60, 59 and 54 (twice). Bonds set a new single-season record in 2001 when he clouted 73 homers but his next-highest season total is the 49 he hit in 2000.
On June 20, 1921, Babe Ruth hit his 127th career home run, thus passing Sam Thompson for second on the all-time list. Roger Connor and Thompson had been the top two batters on the homer list since August 28, 1896. The top five on 6/20/1921 were:
The total homers for those five batters, 632, is less than Ruth's career total. The Babe passed Connor on July 18, 1921 and gradually other batters climbed the career home run list. Hank Aaron passed Ruth for the top spot on April 8, 1974. The top five that day were:
Mark McGwire displaced Killebrew from the top five in 2001 and Barry Bonds passed McGwire and Robinson in 2002. Bonds passed Willie Mays on April 13, 2004. It seems inevitable that Bonds will pass Ruth in the near future, thus dropping the Babe out of the top two on the career list for the first time since June 20, 1921. Ruth has been in one of the top two positions for nearly 85 years but amassing a larger career total does not necessarily make a player a better home run hitter than Ruth. The Babe hit 33.6 home runs for every 500 plate appearances in his career, a number only topped by Mark McGwire, who hit 38.1 per 500 plate appearances. Bonds has a production rate of 30.4 per 500 plate appearances. Bonds has accomplished many things in his career but still lags behind the Babe as a home run hitter.
As April turned to May in 2006, it appeared that, for Bonds and the Giants, personal goals have overcome the concept of team. Bonds seems unable to play left field even moderately well due to his injuries and his hitting has been embarrassing. But, evidently as long as Bonds wants to play, the Giants management is going to allow it since he is drawing fans to the park - thus adding cash to the owner's wallet.
David Vincent, called the "Sultan of Swat Stats" by ESPN, is the recognized authority on the history of the home run. He is the author of Home Run: The Definitive History of Baseball's Ultimate Weapon, to be published in March 2007 by Potomac Books, Inc.
| Designated Hitter | May 11, 2006 |
Our Favorite Obscurities
You can have the superstars. No, really, take them. They're all yours: all the smirking, soulless, multi-multi-millionaires, the self-aggrandizing sluggers whose heads were hopelessly swollen long before they ever became acquainted with the cream and the clear. Go ahead, cheer your lungs out in tribute. Just don't expect them to hear you.
All I ask is in return is that you give me their polar opposites. Let me root for the nobodies and the obscurities of the present and the past, the no-names and misfits, the Oddibes and Bombos, the who's-hes?, never-weres and maybe an occasional one-hit wonder or two. Give me the guys who savor the cheers and every inning of their careers, and I promise I'll be a satisfied baseball fan.
Now, I realize I'm probably overthrowing my fastball here, so to speak: I don't mean to hyperbolically claim that every superstar ballplayer is automatically a superjackass; if you don't like, say, Albert Pujols, you're likely either a miserable person, a Cubs fan, or both.
It's just that since I fell in love with baseball and the Red Sox growing up in Maine in the late '70s, I've found myself rooting the hardest for the playing whose names aren't in lights - and often aren't even on the lineup card. While my buddies pretended to be the usual Boston superheroes - Jim Ed Rice, Pudge Fisk, Freddie Lynn - in our neighborhood Wiffle Ball games, I usually imagined myself as the hustling hyper-hypo of a third baseman, Butch Hobson . . . at least until some mysterious new player arrived via Triple-A Pawtucket and piqued my interest.
I suspect I was among a select (and strange) few New England 8-year-olds who preferred pretending he was Sam Bowen to Dewey Evans. And I'm pretty sure I stood alone in being at least as interested to say hello to Chico Walker as I was to say goodbye to the icon he replaced in left field in the eighth inning of the Sox's final game of the 1983 season. Good luck in retirement, Yaz, and don't sweat it. If I do say so, this Chico cat looks set to hold down the fort in left field for the next 10 years.
What can I say? I was weird like that. Still am. But here's the thing: We all have them, nondescript ballplayers we admire for reasons inexplicable, or perhaps personal. (Hell, Barry Bonds insists his favorite player is David Eckstein. Other than himself, I presume.) Maybe your personal Obscure Hero did something memorable to win a game you attended. Or tossed you a baseball. Or had a goofily unforgettable name (Greg Legg!). Or offered you an autograph, a handshake, or some other small moment that, when you're 10 years old and awestruck, could not possibly be any larger.
Here, then, are mine. Consider this my way of paying homage to random dudes I've liked through the years, ballplayers who were forgotten, others who were barely heard from in the first place. All of them played in the majors, however temporarily. Many of them played in the mid-1980s for my beloved Maine Guides, an ill-fated, generally talent-free, and all-but-forgotten Triple-A farm team of the Cleveland Indians, an organization whose haplessness inspired the Reel Classic film "Major League." None of them will be getting into the Hall of Fame. You know, the one in Cooperstown. But they all hold a hallowed place in the halls of my mind.
Chico Walker: Oh, all right, so maybe he shouldn't have been the guy to replace Yaz during his final game - common sense and tradition say it should have been Jim Rice, the heir apparent who DH'd that day. But Walker turned out to be a versatile and valuable utility guy once he broke free of the Sox system; he rotted in Triple-A purgatory from 1980 to '84 while Boston management favored the likes of Steve Lyons and Ed Jurak. Wrote Bill James in his 1993 Player Ratings book:
"Switch hitter, plays all over the field like Tony Phillips, and is still an outstanding baserunner at 34. He'd have about 1,500 hits by now if he'd come up with the Red Sox about 1980, but they didn't think he could play."
I appreciate James's sentiment here, but as author Howard Bryant notes in "Shut Out: A History of Race and Baseball in Boston," there was likely a more sinister reason Walker never got a real shot with the Sox:
"To Peter Gammons, (Manager Ralph) Houk's generational tendencies were best illustrated through his relationship with a black utility player named Chico Walker. In the case of Walker, Gammons thought, there was always a white utility player who would play ahead of him. There was always a reason Walker never received a real opportunity to win a job. 'Chico Walker was a bright, intelligent player who could have had a much better career,' Gammons said. 'He had a lot to offer. But for some reason, and I think Houk was the reason, there was never a place for him in Boston.' "
Fortunately, Walker did eventually find his place in the big leagues, though it took far too much time. He got over 100 at-bats for the first time at age 28 with the Cubs in '86, and played 100 games for the first time at age 33 in '91. He batted .246 in 526 career games, all but 32 of which came after wasting his baseball youth with the Red Sox. It's too bad. They could have - and should have - used someone like him.
Junior Noboa: This is how bleepity-bleepin' inept the Indians were at supplying alleged prospects to My Beloved Guides: Noboa was rushed to the majors in '84 at age 19, his .254 batting average and one (1) homer in Double-A apparently too enticing for the big club to resist. After Noboa hit .364 that September, the buffoons in the Tribe front office took frequent and misguided pride in claiming they had the youngest player in the majors, assuming in their patented warped way that his young age and high batting average (in a freakin' 11-at-bat sample size, mind you) guaranteed him of future stardom. It worked out just as you'd imagine it might: he pinnacled as a dependable if ordinary .280-hitting second baseman in Triple-A. In parts of eight big league seasons, Noboa hit .239 with one (1) homer for six clubs. Oh, yeah, and the other 19-year-old in the majors that season? Some kid named Gooden for the Mets. Heard that worked out better.
Shooty Babitt: The subject of one of the all-time cruelest (or funniest) baseball quotes, depending on your sense of humor: "If he ever plays for me again," said A's manager Billy Martin late in the '81 season, "please, Shooty me." Martin, who apparently considered Babitt one notch above marshmallow salesmen on the evolutionary chain, kept his word. Babitt's big league career began and ended that season. But his unforgettable name lives on.
Butch Hobson: Clell Lavern Hobson Jr. Red Sox third baseman, 1976-80. Former Alabama quarterback. Bat-rack-endangering, elbow-bone-chip-adjusting, 30-homer-hitting, 44-error-making, Zimmer-abiding, chain-smoking certified lunatic. Naturally, he was my boyhood hero. I remember meeting Hobson for the first time in 1984, nervously waiting while he scribbled his name on my tattered baseball card. I remember thinking he looked so much older than I expected; little did I know that the prematurely grey hair truthfully suggested a hard-lived life. I also remember those timeless words of wisdom he offered upon parting: "Hey, kid, don't forget your pen." Ah, sweet memories.
Sam Horn: The less-talented prototype for Ryan Howard, a batting practice Hall of Famer, the patron saint of the message board (the Red Sox' fans internet gathering spot, www.sonsofsamhorn.com), and an all-around gem of a guy whose effervescent personality somehow failed to shine through on ill-fated gig as a Red Sox studio analyst. I know at least three baseball lifers - former big-leaguer Bob Tewksbury being the most notable - who swear that Horn hit the longest homer they ever saw. And the thing is, none of them are talking about the same shot. Howard, the Phillies' phearsome young slugger, seems poised to accomplish feats Horn can only daydream about - it helps to be able to hit a curveball, and the pitches with wrinkles forever fooled Big Sam. Still, just about every time the Phillies' budding behemoth went deep during his rookie-of-the-year push last summer, I'd catch myself flashing back to Horn's mighty debut with the Red Sox in '87, savoring the memories of his majestic, sky-scraping homers, and tripping back to those promise-filled days when certain superstardom was just a moonshot away.
Dwight Taylor: With just two at-bats in four games for the 1986 Kansas City Royals, Taylor would rank as an unknown even in my warped world - that is, if not for these two personal semi-claims to fame:
1) Spotting my 9-year-old sister staring at him, jaw agape, while he chatted up fans before a Guides game in '84, he playfully tugged her pigtail and teased, "What's the matter, dear? Haven't you ever seen such a handsome black man before?" She hadn't as far as I knew, which I dutifully informed Taylor. I'm pretty sure he's still laughing.
2) According to Boston Herald columnist Steve Buckley, the Guides' beat writer for the Portland Press Herald back in the day, Taylor and his wife were the parents of five children by the time they were in their mid-20s, thus earning the nickname "Try Some Sleep At Night" Taylor from his teammates. I suppose that passes for G-rated clubhouse humor. (Update, courtesy of a Google expedition: Taylor, now 45, has 10 kids and four grandchildren. That's what you call a productive ballplayer.)
Ron Jones: Never heard of him? You would have, had fate not been so cruel . . . or had AstroTurf remained an unrealized stupid-ass idea. Jones was one of the premier prospects in baseball in the late '80s, a line-drive hitting lefty who drew comparisons to Tony Gwynn for his sweet swing and Pillsbury Doughboy physique. He batted .371 in Class-A ball in '86; by late summer in the '88 season, he was playing regularly and tearing it up for the Phillies, whacking 8 homers the final two months. But soon he tore something else up: the ligaments in his knee. The injury ended his season, but he rehabbed, returned to the Phillies in '89, and seemed on his way to fulfilling the great promise that had earned him coveted Donruss Rated Rookie status along with guys named Sheffield and Griffey. The return lasted two weeks. He tore his ACL in both knees when his leg got caught in a seam in the brutal Veterans Stadium turf while chasing a fly ball. He made it back to the Phillies briefly in '90 and '91, kicked around Triple-A for years as a DH, even sipped a few Coronas in the Mexican League, but that disastrous day in Philadelphia, for all intents and purposes, spelled the end of a promising career.
Rodney Craig: In "The Curse of Rocky Colavito," Terry Pluto's wonderfully wry history of the Cleveland Indians, Craig warrants one lonely mention, on page 231. Here it is:
The Indians brought up a player from the minors named Rodney Craig. He wore a batting helmet that was something like a size 9. The players called him Buckethead. He was also supposed to be a great pinch-hitter - he went 2-for-19.
Now, to me that seems like a rather cruel and simplistic legacy. He had a big melon. He sucked. End of story. Hell, I mean, even if it's the truth, doesn't a man's career deserve something else, a footnote, an anecdote, a tip of the ol' cap, something? I say it does. So we've done some digging and some reminiscing, and here's what can we tell you about Rodney Paul Craig:
Tom Newell: Two major-league games. One major-league inning. A career ERA of 36.00. And my personal "Moonlight" Graham. Tom Newell is without exception my favorite baseball player of all time. My cousins and I got his autograph so many times at Guides games (by then they were affiliated with the far more competent Phillies) that he knew us by sight, if not by name. "It's you guys again?" he'd say, then shake his head, smile and sign whatever we were waving at him that day. He looked like a ballplayer, tall, trim and tan. He acted like everyone's friend. I rooted desperately for Newell to make the major leagues, and he did, with the Phillies at the tail end of the '87 season.
I'll forever recall seeing him at The Ballpark the day in September he learned he'd be going to the majors. "So you got called up," I said. He looked up from signing his name. "Yep. Driving to Philly after the game. It's my dream come true," he said, his grin the honest confirmation. His dream came true only for a moment. The next spring, he blew out his rotator cuff. He bounced around the minors for a number of years, never quite regaining his health or his fastball. Newell never again wore a big-league uniform. Not too long ago, maybe a year or so, a reader of a whimsical magazine piece I had written about the Guides emailed me to say that he had recently run across Newell in Reno, Nevada, where he owned a restaurant and lived happily ever after.
The reader mentioned that Newell had signed a baseball for his grandson and could not have been nicer; the years had not changed him. He also added, in a postscript, that the quirk of Newell's restaurant was a telling one: It featured a baseball theme, including several indoor batting cages. Reading this, I smiled, thinking of Jim Bouton's classic line from Ball Four: "You spend your life gripping a baseball, and all the time it was the other way around." Tom Newell pitched one big league inning. He made The Show. While the moment was fleeting, the memory will stay with him forever. Ask me, there's nothing obscure about that.
Chad Finn is the founder of Touching All The Bases, a blog that takes an irreverent but passionate look at Boston sports. In real life, he is a sports copy editor at The Boston Globe. He lives in Wells, Maine, with his wife Jennifer, their two-year old daughter Leah, her David Ortiz jack-in-the-box that she shares with her daddy, and a baby to be born later.
[Additional reader comments and retorts at Baseball Primer.]
| Designated Hitter | May 04, 2006 |
Who Was Really the 1979 NL MVP?
Only once in the history of the Most Valuable Player Award has there been a tie for the honor. In 1979, the Pirates' Willie "Pops" Stargell and the Cardinals' Keith Hernandez wound up with 216 points apiece in the Baseball Writers' Association of America voting, so each was awarded a plaque.
For the third-place Cards, Hernandez led the National League in runs (116), doubles (48), and batting average (.344), ran a close second in hits and on-base percentage, and won his second Gold Glove Award at first base. Stargell, who had finished second in controversial balloting in both 1971 and 1973, was the clean-up hitter (32 homers) and inspirational leader of the "We Are Family," world champion Bucs. Hernandez was listed by all 24 voters, while Stargell was omitted entirely from four ballots; however, Pops got ten first-place votes as compared to just four for Hernandez. When it all shook out, they came out even.
However, it is quite possible that there wasn't really a tie after all.
In my 1988 Society for American Baseball Research book, Award Voting, I addressed and criticized the phenomena of split votes - writers dividing votes in half between two players in the voting for major awards. Between 1959 and 1984, there were split votes in 33 different MVP, Cy Young, and Rookie of the Year elections (possibly because of my book, they have since been outlawed). The biggest impact of a split vote may have been in the 1968 NL Rookie caucus, when one writer split his vote between Johnny Bench and Jerry Koosman, and Bench won by one point, 10 1/2 - 9 1/2.
The biggest farce may have been in the 1979 NL MVP race, where one voter split his fourth-place vote between pitching brothers Phil and Joe Niekro (evidently under the impression that they were identical twins), but was still permitted six more selections. Under the 14-9-8-7-6-5-4-3-2-1 system used for the MVP Award, a fourth-place vote is worth seven points - and, in this case, those seven were split between the Niekro brothers, giving them just 3 1/2 points apiece. In other words, that writer's fifth-, sixth-, and seventh-place nominees each received more points than his fourth-place co-selections!
Assuming the acceptability of the split vote, the ballot in question should have been adjusted so that the Niekros were tied for fourth/fifth, receiving 6 1/2 points each, with the remaining selections moved down a notch (thus losing one point) each. One thing that did not occur to me until recently was that this mess-up conceivably could have created the tie for first place between Stargell and Hernandez: if either player was listed lower than fourth on that writer's ballot, he should have received one point less, swinging the election to the other player.
Stargell received ten first-place votes, three seconds, four thirds, a fourth, and two sixths, being left off the other four ballots. So, there is a two-in-23 possibility that he was listed on the Niekro ballot lower than fourth place.
Hernandez got four first-place nominations, eight seconds, seven thirds, two fourths, and three fifths. So, there is a three-in-22 possibility that he was listed on the Niekro ballot lower than fourth place.
The way I figure it, the probability is 20% that either Stargell or Hernandez (but not both) was listed lower than fourth on that writer's ballot. If so, and if the votes were counted correctly, that would have broken the tie between the two.
I talked to Jack Lang, former Executive Secretary of the BBWAA, about this. He says that the MVP ballots are shredded a few years after the elections, so there is no way to retrieve the ballot in question. Off-hand, Lang doesn't think this ballot affected anyone's standing in the race.
So, while it apparently can't be proven one way or the other, there is a one-in-five chance that one of the co-winners of the 1979 NL MVP Award got a gift he didn't deserve.
Bill Deane has authored hundreds of baseball articles and six books, including Award Voting, winner of the 1989 SABR-Macmillan Award. He served as Senior Research Associate for the National Baseball Library & Archive from 1986-94. He has since done consulting work for Topps Baseball Cards, Curtis Management Group, STATS, Inc., and Macmillan Publishing, and also served as Managing Editor of the most recent Total Baseball.
[Additional reader comments and retorts at Baseball Primer.]
| Designated Hitter | April 27, 2006 |
The Rise and Fall of Artificial Turf
Remember the time, not long ago, when we feared that baseball would be overrun with artificial turf? The phenomenon started indoors, somewhat forgivably, but by the 1970s every new park had to have fake turf, and even some of old fields were ripping up God's green grass and putting down the industrial stuff. Better living through chemistry.
After a few years no one would admit to actually liking it, but its adoption continued for a few years more, largely in deference to King Football. At some point a light went on, and baseball operators decided that whatever drove them to the carpets in the first place could no longer justify the discontent of their fans and players. Whereas nearly 40% of major league games were played on artificial turf over a period of nearly two decades, 90% of all 2005 contests took place on natural grass.
Although few people weep over the demise of artificial surfaces, the game played on these fields was spectacular. The baseball of the 1970s and 1980s, whatever one might think of the uniforms, or the hairstyles, or the color of the "grass," offered a wonderful balance of offense and defense, provided a fascinating variety of ball park experiences (home run parks, doubles parks, speed parks, pitchers parks), and gave us a dynamic group of stars, many of whom were defined by the places in which they starred - often as not, stadiums without a blade of natural grass.
It all started in Houston, Texas. The Astrodome served as the home of the Houston Astros for thirty-five seasons, and also housed the Oilers football team, college football and basketball, and the assorted auto convention, rodeo and tractor pull. The facility re-entered the news in September 2005 by serving as temporary housing for thousands of evacuees from New Orleans, victims of Hurricane Katrina. But the building's principal sports legacy rests with two claims-to-fame: it was the first domed stadium, and the first professional facility to use an artificial playing surface.
The Houston club was awarded a National League franchise in 1960, and originally hoped to have its dome in place before their first game in 1962. Legal issues delayed the start of the project, which led to the construction of a temporary 32,000 seat stadium on adjacent land. In fact, the two stadiums were constructed simultaneously in sight of each other. The original Houston team was called the Colt 45s, and its temporary edifice was Colt Stadium, famous for its unbearable heat and giant mosquitoes. Few mourned the park's demise after the 1964 season.
The opening of the Harris County Domed Stadium in 1965 was a much anticipated event, as commentators wondered whether it was possible or practical to play baseball indoors. Judge Roy Hofheinz, the team's principal owner and the longtime champion of the dome, changed the team's name to the Astros, and its new facility to the Astrodome, both monikers in celebration of the city's role as the center of the thriving space industry of the 1960s.
Branch Rickey observed, "The day the doors open on this park, every other park in the world will become antiquated." On opening day twenty-four actual astronauts threw out twenty-four first balls. A 475-foot wide scoreboard displayed an elaborate light show after each Astro home run or victory, including two "cowboys" shooting guns whose bullets ricocheted around the scoreboard, leading to a series of loud explosions. The Astrodome showed American "progress" at its finest. The facility, without a single beam obstructing the view of a single seat, was soon called the "Eighth Wonder of the World."
The field was natural grass, carefully tested to hold up under the building's roof, which was made up of over 4000 lucite panels to let in nature's sun. Unfortunately, the panels caused so much glare during practices in the spring that players had trouble catching pop flies. The solution was to paint the outside of the dome off-white, which caused the grass to die. The Astros played the last few weeks of the 1965 season on spray-painted dirt.
Hofheinz contacted Monsanto, a company that had installed "Chemgrass" in 1964 at Moses Brown School in Providence, Rhode Island, and got the firm to put its product in the Astrodome. Monsanto installed the turf in the infield in time for the Astros' April 18, 1966 opener, and the outfield was converted by their July 19 contest. The first man to bat on the fake grass was Dodger shortstop Maury Wills, who singled up the middle off Turk Farrell. The players accepted the surface pretty quickly, perhaps partly because the field it was replacing in Houston was filled with holes and ruts. Monsanto changed the name of its product to "Astroturf," a name often used for the next two decades to describe all artificial surfaces, though there were other competing technologies and brands.
Throughout the late 1960s, many journalists were predicting - and advocating - the installation of synthetic surfaces on all grass playing fields. The Sporting News, the erstwhile Bible of Baseball but accelerating rapidly downhill towards football primacy, favored the surfaces at least for football or multi-purpose fields. Football was a major impetus for the spread of artificial surfaces, as many of the new stadiums being built in this era were multi-purpose. Baseball didn't really have a lot of pull - for the most part, the reason municipalities agreed to build new stadiums was because of football, which was booming in popularity.
The University of Houston played its home football games in the Astrodome in 1966, and many college football facilities were converted by the end of the 1960s. In 1967, Astroturf was installed at Memorial Stadium in Seattle, which hosted a pro football team, the Seattle Rangers, in the Continental League. The AFL Oilers moved over from Rice University in 1968. The Philadelphia Eagles became the first NFL convert when fake grass was installed at Franklin Field in 1969. Baseball's All-Star Game in 1968, at the Astrodome, was billed as "Monsanto meets Ron Santo."
The reasons given by its early proponents were many: ease of maintenance, simpler conversion from baseball to football or vice-versa, better drainage. Football teams, even at the high school level, would not practice on their main field for fear of tearing it up during the week - with artificial turf, there was no longer a need for practice fields. The biggest reason of all was that the surface reduced injuries. If you didn't believe that, you only had to read the weekly half page articles written by Monsanto for The Sporting News - or the occasional four- or eight-page spread regularly appearing in the same paper. The stories boasted of the rapid, and apparently inevitable, revolution being waged - putting greens, tennis courts, welcome mats, front lawns, rooftop parks, surrounding the family swimming pool. Seemingly everywhere you turned there was a grass-like rug lying beneath your feet.
Many baseball teams, some with new stadiums in progress, seriously considered synthetic surfaces in the late 1960s, as regularly reported in the press. The first outdoor baseball field with artificial grass was Memorial Stadium in York, Pennsylvania, home of Pittsburgh's Eastern League (Double-A) affiliate. The Pirates were considering the surface for its new facility being constructed in Pittsburgh, while Monsanto was so eager to show off its product that it agreed to install the surface at no cost.
The Chicago White Sox became the second major league team to forego grass, installing a synthetic infield in White Sox Park in 1969, hoping it would lead to higher scoring games. The first major league outdoor game on a synthetic surface took place on April 16 when the White Sox beat the new Kansas City Royals, 5-2.
The next season brought four new turf fields, beginning with the conversion of the surfaces in San Francisco's Candlestick Park and St. Louis's Busch Stadium. The first outdoor NL game on turf saw the Astros beat the Giants, 8-5, in San Francisco on April 7. Four days later the Cardinals became the fourth team with Astroturf, and they celebrated with a 7-3 victory over the Mets.
In mid-summer, two new ballparks opened with artificial surfaces. Cincinnati's Riverfront Stadium debuted on June 30, featuring (for the first time in the major leagues) dirt cutouts around the bases - a characteristic first showcased at Portland, Oregon's Civic Stadium. The next month the Pirates opened Three Rivers Stadium with Tartan Turf, 3M's rival product to Monsanto's AstroTurf. The season also showcased the new surfaces in the post-season for the first time, as Pittsburgh and Cincinnati, in their brand new parks, met in the NLCS with the Reds advancing to the World Series. It would be 18 years until baseball had another post-season with all grass fields.
Sometime in the mid-1970s, baseball turned its pivot foot on this issue, though it was not obviously perceptible for many years. In 1970, not only were all new parks being introduced with artificial surfaces, but existing parks were replacing their natural grass. Within a few years, the new turfs (and the symmetrical concrete stadiums that housed them) were no longer looked upon as progress, but as a sign that the modern world had gone seriously awry. Dick Allen, future horse breeder, remarked, "If horses can't eat it, I don't want to play on it." Though his wit was typically unique, his sentiments were carrying the day.
After the two converts in 1970, no baseball park would ever again remove its natural grass in favor of an artificial surface. In fact, the White Sox became the first team to reinstall grass, in 1976, and the Giants followed suit in 1979. The last new outdoor baseball facility install an artificial surface was Toronto's Exhibition Stadium in 1977. There were three new synthetic fields built in the 1980s, but they were all under domes - in Minneapolis, Toronto (retractable) and St. Petersburg. The latter park was built in order to entice baseball to award them a franchise, but by the time the city got their team in 1998, their hardly-used facility was a dinosaur.
The visible effects of the shift away from fake grass had to wait for an entire generation of stadiums to be replaced, which began in the 1990s. The ten new stadiums completed between 1970 and 1990 (beginning with Riverfront and Three Rivers and ending with the dome in St. Petersburg, opened in 1990) all had synthetic surfaces. Starting with the new Comiskey Park in 1991, major league baseball has christened eighteen new baseball parks, every single one with real grass. There were still ten artificial surfaces used in 1994, and nine in 1998, but today there are just three, the three 1980s domed facilities. Of these, Toronto probably could switch to grass, since their roof retracts and all other retractable fields have grass. Minneapolis and Tampa Bay are likely stuck, though the teams have been trying to get new parks built for many years.
Artificial turf still lives on in pro and college football, though in reduced numbers. The surfaces have improved in many ways - many of them look more like grass than they used to, players run and cut better than in days past, and there are less funny turf bounces on the newer surfaces. That said, it is unlikely baseball will be returning to those days. The fans, media and players are united on that score.
Artificial turf in baseball is an anachronism today, and the mere mention of the subject is no longer considered appropriate in polite company. But make no mistake: the introduction of Astroturf in 1966 had a huge impact on the way the game was played for two decades, two of the best decades in baseball's history. Some of the more interesting teams of the era - the Big Red Machine, Herzog's Cardinals, George Brett's Royals, the 1980 Phillies - were defined by the fields they played on. In our mind's eye, when we see Brett and Ozzie Smith and Mike Schmidt, they are running, and diving, and hitting on a lime green carpet.
I miss them, and the game they played.
Mark Armour writes baseball from his home in Corvallis, Oregon. The co-author, with Dan Levitt, of the award-winning book Paths to Glory, Mark has written extensively for leading baseball web sites and publications, and is the director of SABR's Baseball Biography Project. His current effort, which he is shepherding with Dave Eskenazi, is Rain Check: Baseball in the Pacific Northwest, which will be released in conjunction with SABR's 2006 convention in Seattle.
[Additional reader comments and retorts at Baseball Primer.]
| Designated Hitter | April 20, 2006 |
Everything I Needed to Know About People I Learned at Wally Moon's Baseball Camp
Back in the early Sixties, my parents needed to ship me off for a couple of summers so they could marinate in married life and the excessive drama of their lives. Each had been born into small families unwilling to put up with the likes of me (overly talkative, overly active, overly curious -- who can blame them?), so the alternative was to park me at summer camp. And there I quickly learned more lessons about life than David Carradine got on 62 episodes of Kung Fu, and I didn't even need to shave my head.
At that time we were living in West L.A., and I was a baseball fanatic, so when they discovered Wally Moon's Baseball Camp in West Covina, they decided it was perfect. It had baseball, it was far enough away that they wouldn't be expected to show up for games or regular visits, and the food was bad enough that I might shed a bit of my excess blubbericiousness.
Wally Moon didn't teach me any important life lessons himself, but he was an interesting player. If you don't know about him, read the next two paragraphs.
Wally Moon was an outfielder for the Los Angeles Dodgers, normally batted third in the line-up. Walked more often than he struck out. I would like to tell you he was "like" someone playing today, but no one came to mind and when I checked out his comparable players on Baseball-Reference, none of them really seem to channel, as Plato said when he saw him play, The Wallyness of Wally. Moon was an outlier, an exception in every way you could analyze him. First, he looked really unusual in a "good looking" way, and he sported a unibrow. His stance was odd, too...not Craig Counsell weird, but just weird enough that 10-year olds might imitate it -- except there was nothing cool about it to a 10-year old and I didn't know anyone who did. He was a college man, making him an exception. He went to a school, Texas A&M, that hadn't produced a major leaguer with at least a medium career since Beau Bell 13 years earlier and wouldn't produce another one until Davey Johnson 11 years later. And Moon reportedly earned a Masters degree, making him an incredible exception for a baseball player. He was a power hitter who hit to the opposite field. He was from a place in Arkansas that not only produced no other major leaguers, but a part of Arkansas that developed not a single major leaguer within 55 miles of his home town. He had been the N.L.'s rookie of the year in 1954. His range numbers were never good after his rookie campaign, but he won a Gold Glove in 1960 that may have been deserved -- his home park's ultra-short left field fence behind him would trim the number of balls he could get to, so even with low range numbers, he may have played the field that well.
And his best stretch, 1959-61, saw him put up a .310/.405/.485 batting line. That this was his best stretch is both a reason for acclaim and a factor that makes some revisionists undervalue his performance. The Dodgers during those years played in the L.A. Memorial Coliseum, an Olympic track facility that worked for football but was beyond funkadelic for baseball. Look. The right field fence was near Tijuana, so it killed most lefties. The left field fence had to be squashed into the rectangle so it was only 251 feet from home plate. To try to balance that zaniness, the team put up a 40 to 42 foot screen, about 10% taller than Fenway's Green Monster. Wally Moon was able to launch occasional homers by looping to the opposite field with an inside-out swing, and people in L.A. took to calling those kinds of lazy high-arcing big flies "Moon Shots". To look at Moon historically, should we diminish our appreciation because it was such a ridiculous park configuration, or should we grant him a bit of reverence for figuring out how to overcome an equally ridiculous punishment for left-handed batters?
I had never gotten to play on a formal team. Little League was too far away and my parents too unwilling or unable to ferry me back and forth. So all my previous experience was of the two- or three-a-side variety Wiffle Ball, three flies up, and a myriad of invented games, played in backyards or nearby parks not intended for such activities, usually with weird-o Washington Park dimensions and grounds rules and neighboring yards that ate balls including my Warren Spahn-autographed Wiffle Ball, ordered for a dollar and two box tops.
Beyond my lack of formal experience, I was at some other disadvantages. I was short for my age. And I was overweight. And slow. Edgar Martinez-slow...Walter Young-slow. Special effect slow, like The Six Million Dollar Man...but much slower. And fatter. I came equipped with only two aptitudes: when I made contact with the ball, I hit flat beautiful ropes you could hang the wash on (and to all fields), and I had a rocket launcher for an arm. The hitting to the opposite field knack was environmentally-etched...if you couldn't hit to right in The Park I played in, you'd lose the ball in the underbrush.
The baseball camp routine went like this. At the start of the week, camp counselors chose teams aimed at balancing skill. I ended up on Bill's Braves, managed by Bill Tucker, a total gem of a fellow. He was a really fine athlete (a back-up quarterback at La Verne J.C.) and extremely tolerant of limitations, even extreme ones like mine. Extremely positive. Mornings were drills, and after the third day or so, games in the afternoons. My first couple of weeks I would end up like 3-for-18 in games with 12 strikeouts, and at least a couple of my outs were beautiful frozen rope singles that would be turned into humiliation when the outfielder's throw beat me to first. There's the first lesson...
Epiphany #1 -- What you value personally may not have any value in the environment you're in.
To me, lashing a rope was, in and of itself, a magnificent piece of art. In the schoolyards of my youth, I would frequently hit for my own personal version of the cycle -- a line drive hit to left, center and right in the same game -- and my peers would appreciate the artistry involved. At camp, this meant zero. Any hit to right that went into the gap was merely a single for my brick-footed amble, and anything near the right-fielder was a potential 9-3 putout. Bill worked with me on my hitting, and he taught me valuable lessons I would apply with good use for the next 20 years, but nothing that broke me out of my slump.
Coach observed my struggles and taught me a simple thing. I wasn't very good at hitting the inside pitch. Most of my strikeouts were on inside pitches. Yes, I needed to learn to hit them, but Coach realized it would be faster in terms of yield if I could get pitches over the fat part of the plate. So he taught me to lean into inside pitches and get hit. The umps were generous with the strike zone, but found it impossible to call a hit batsman a strike. So I started overcoming my fear of being hit by doing it accidentally-on-purpose and becoming almost an asset to my team. Moreover, once I'd been hit in a game, all the pitchers at camp except one (he liked hitting people) would try to keep the ball away from me and that meant I could get my arms extended and make good contact. This leads to the next lesson...
Epiphany #2 -- We all have weaknesses and sometimes the best way to attack one is to try to turn it into a strength.
By the fourth week, even Bill's patience was stretched. I had improved a little bit, but I wasn't good enough to be average. I got shifted to a new counselor's team. Casey didn't know one-fifth what Bill did, but he knew a few things, and some of them were things Bill didn't. He noticed that when I swung and missed, my front shoulder was coming up, so he taught me to lock it down hard while in my stance. It wasn't much, but it just happened to work. That week, I was 13 for 16, and two of my outs were 9-3 putouts. One of my hits went so far, I got a triple out of it (imagine a David Wells triple). Lesson time...
Epiphany #3 -- Coaching, teaching and managing are not either/or, good or bad, they are additive.
No matter how much you know, everybody knows something useful you don't. Go to the greatest expert in the world, find me a replacement-level actor in that same field, and that inconsequential nobody will know something valuable Ms. Nobel Prize doesn't. A corollary I believe but haven't yet proven is that coaching/managing is additive. You work for a great manager, and she teaches you a bunch of useful things. You go to work next for a total dinwiddie, nowhere near as good, but that total dinwiddie has some small thing to teach you and it just happens to break a logjam for you or make what you learned earlier ten times as valuable. You never dismiss totally even the most incapable coach because he has something somewhere you can gain from. And opening yourself up to learning doesn't mean throwing away what you already know; presume you're adding, not replacing, knowledge.
I have to share a caveat on that insane .812 batting average week, but there's another life lesson in there. By a fluke of scheduling, 9 of my hits were against the same pitcher. I was only 4-for-6 against the rest of the league. But a rainout and something else meant we faced this one team over and over, and that team had this stud fastball pitcher with an almost perfectly-overhand delivery (think Rick Sutcliffe), a delivery that terrified most batters. Maybe it was because I was so short, or just some sort of dumb luck, but whatever he threw, it looked like batting practice to me. I could see the ball from release and it was just easy to see all the way, bigger than the moon. Everyone else in the league struggled against him but me. And the life lesson is...
Epiphany #4 -- Rock, paper, scissors. Everything good can be beaten by something better. Everything not good can beat something great. Match-ups can be unpredictable. Don't assume.
Everybody's stud pitcher is someone else's cup of meat. Mark Belanger hit .221 lifetime against right-handed pitchers. Nolan Ryan yielded only .203 lifetime to batters. But Belanger hit over .300 lifetime against Ryan. Whatever magic Ryan had over hitters, it just didn't happen to work on The Blade. And it's true at work and in school and in dating and everywhere.
I had dozens of other lessons, but I'm going to leave you with one last one, because it may be the single most important thing I have to teach you, Grasshopper.
Epiphany #5 -- Never staple your lips together with a heavy-duty Bostitch stapler. Or do it twice.
I'm not making this up. One morning I was skipping breakfast, reading a Sporting News and this terrible scream came from down the hall. I ran towards it and there in the office was Gene, screaming as though someone had stapled his lips together with a heavy-duty Bostitch. The sound was so unnerving it took me a second to realize he was bleeding and that his lips were, actually, snapped together with a metal strip.
Gene was the (apparently) well-adjusted kid on my team. Normal in every way, except perhaps a little more self-assured and much more popular. But he'd walked into the office, picked up the front desk's stapler, said "Excuse me", and when the staff looked up, stapled his lips together. He was gone five days. He came back to get his belongings and go home. And the story the office women told was that on the way out with his mother, Gene and parent stopped in the office, and Gene took the stapler and did it again.
My life has changed in almost every way since that summer. I am easily the fastest 50-year old on the field. My opposite field stroke is no longer my best one. I'm not so rotund as to make bending over for a ground ball a challenge. Some things are the same. I still have a deadly arm, and I still use the hit-batsman technique to make umpires call a ball that's more than a foot inside a "ball" instead of that automatic strike they love to use to move the game along.
You may think I'm a wuss, but I have never been tempted to staple my lips together with a Bostitch or Swingline or any other stapler twice. Or even once.
And I learned that lesson, among everything else I needed to know about people, at Wally Moon's Baseball Camp.
Jeff Angus' new book is Management by Baseball: The Official Rules for Winning Management in Any Field (Harper Collins, May 2). Jeff is a management consultant and baseball writer (stats columns for The Seattle Times) who speaks on Management by Baseball topics.
| Designated Hitter | April 13, 2006 |
Can Money Buy Love in Baseball?
One of the prizes in baseball's free agent market was Johnny Damon. Expected to re-sign with the Boston Red Sox, Damon shocked the Red Sox nation when he left the team he helped win a title in 2004. What was even more shocking was his destination, the dreaded New York Yankees. Note only did Damon break the hearts of the Red Sox faithful, for the extra millions the Yankees paid, Mr. Damon was required to dramatically alter his personal appearance, cutting his trade-mark hair and shaving his beard to join the men in pinstripes. The Damon story suggests that money can buy looks. But can all that money buy another World Title for the Bronx Bombers?
We are told over and over again that money can indeed buy the fans love in baseball. Supposedly teams that spend the most win the most. As is so often the case, the numbers tell a different tale.
Our story begins in 2001. That year the Yankees, Red Sox, and Los Angeles Dodgers became the first teams in Major League Baseball history to spend more than $100 million on player salaries in a single season. The following year the Yankees pulled away from the pack, becoming the first team to clear the $125 million barrier. In 2003 the spending continued with New York's payroll surpassing the $150 million mark. The next season another record was set, with Yankee salaries rising above $180 million. In 2005 team payroll actually cleared the $200 million barrier. Among all teams excepting the Yankees, player payroll has increased only 7% in the last five seasons. Over the same period the Yankees have increased payroll by more than 85%.
| Year | Yankee Payroll | Yankee Wins |
|---|---|---|
| 2005 | $208,306,817 | 95 |
| 2004 | $184,193,950 | 101 |
| 2003 | $152,749,814 | 101 |
| 2002 | $125,928,583 | 103 |
| 2001 | $112,287,143 | 95 |
| TOTALS | $783,466,307 | 495 |
Source: Payroll Data is from USA Today.com
Over these past five years the Yankees have spent more than $780 million on player salaries. What did all this spending buy? The Yankees have won more regular season games than any other team in Major League Baseball. New York has averaged 99 wins per season, while the next berst teams, the Oakland Athletics and the St. Louis Cardinals, have averaged 96. Yes, over five years, those $780 million Yankees have only won fifteen more games than their closest competitors.
This neck-and-neck competition on the field should have been reflected in the payrolls of each team. The numbers defy this expectation. Over these five years Oakland has spent less than $240 million on player salary, or less than a third of the Yankees payroll during the same period. St. Louis has been a bit more spendthrift, paying its players more than $410 million. Still, St. Louis and Oakland combined have spent over $100 million less to achieve almost as many wins as the Yankees.
What else did the Yankees gain from all this spending? They did manage to win the same number of World Series titles as Oakland and St. Louis combined: zero. A massive payroll, more massive every year, and in each season the last game the Yankees played ended in a loss. To be fair, the Yankees are not alone in their failure to buy a title. Of the eighteen teams in baseball history that have spent more than $100 million on players in a given season, only the 2004 Boston Red Sox managed to win the World Series.
This lack of success leads us to wonder, given the amount of money the Yankees are spending, why have the Bronx Bombers not won the World Series recently?
Contrary to popular perception, payroll in professional sports is not strongly linked to wins. A $100 million team does not win twice as many games as a $50 million team - not even close. Our own work has shown that only about 18% of a team's regular season wins can be attributed to its payroll. In other words, more than 80% of a team's regular season record cannot be tied to team spending. We would add that this is what we see when we look at teams in Major League Baseball from 1988 to 2005. In other words, the lack of a link between spending and wins is not a recent phenomenon. Across time more spending is not an elixir that leads automatically to success on the field. As the saying goes, games are not won on paper. Moreover, they are not won just because you spent a pile of paper.
The Yankees, however, both spend and win. The Yankees have consistently placed near the top of the league in regular season wins and at the very top in payroll. But near the top is not actually ascending to the ultimate height, a point principal owner George Steinbrenner often notes when he frets about his team's lack of a World Series title over the past five years.
Steinbrenner should well fret. A number of factors can conspire to bring down even a team packed with all-stars. The three most salient roadblocks are: performance inconsistency, the ravages of time, and luck.
Baseball is a game of inherent inconsistency. Remember, we are talking about grown men hitting a round ball with a round bat. Even the very best hitters are unsuccessful more often than not. And even the best cannot simply create success whenever they like. Take the Yankees most recent addition, Johnny Damon.
| Year | Damon's OPS | Ave CF OPS | Difference |
|---|---|---|---|
| 2005 | 0.805 | 0.776 | 0.029 |
| 2004 | 0.857 | 0.816 | 0.041 |
| 2003 | 0.750 | 0.799 | -0.049 |
| 2002 | 0.799 | 0.805 | -0.006 |
| 2001 | 0.687 | 0.781 | -0.094 |
| 2000 | 0.877 | 0.807 | 0.070 |
| 1999 | 0.856 | 0.799 | 0.057 |
| 1998 | 0.779 | 0.779 | 0.000 |
| 1997 | 0.723 | 0.798 | -0.075 |
| 1996 | 0.680 | 0.819 | -0.139 |
| Ave | 0.781 | 0.798 | -0.017 |
Source: ESPN.com
Note: OPS stands for on-base percentage plus slugging percentage.
Hitting performance can be measured many different ways. When measured via OPS, the Damon story illustrates our story of performance inconsistency. Some years, like 1998, 1999, 2000, 2004, and 2005, Damon's performance at the plate exceeded the average hitter at his position. In other years, like 1996, 1997, 2001, 2002, and 2003 Damon performed below the average centerfielder. The Yankees will be paying Damon $52 million over the course of four years - and hope he will be above-average each season. Yet Damon has never had a four-year span of consistently above-average play, and there is no reason to expect he will have one now. Given his past performance, at least one of these four campaigns will likely be below average for the Yankees' new centerfielder.
Damon's career performance is not anomalous. Our analysis indicates that less than 40% of player performance in any given season can be attributed to what a player did the previous season. That is past success - or past failure - is a weak predictor of future outcomes. Hitting success will naturally fluctuate - due to chance, injury, schedule, diet, and perhaps hundreds of other factors - just as weather fluctuates in July. July may be hot and sunny on average, but any given day can be rainy and chilly. Neither Damon or his teammates has demonstrated the ability to overcome the reality of statistical variation, any more than anyone can guarantee that everyday at the ballpark in July will be sunny and warm.
Inconsistency is not the only challenge facing the Yankees; the passage of time is an enemy as well. The Yankees management has tended over the past half-decade to sign or trade for well-established players with strong reputations. Unfortunately, the nature of free agent rules has resulted in a Yankees line-up replete with players over the age of 30. Yale economist Ray Fair demonstrated in a recent study entitled "Estimated Age Effects in Baseball" that the performance of baseball players will peak at age 28 and slowly decline thereafter. Of the players projected to start for the Yankees on opening day in 2006, only Robinson Cano is under 30. The remaining players have crested the statistical hill and will all tend to decline rather than improve on their previous feats.
Still, the end is not so close that the Yankees roster is ready for retirement. Over the last five years the Yankees have employed older players and still crafted the best winning percentage in baseball. The World Series title, though, has proven elusive. Hence we come to our third road block to success. Beyond inconsistency and time, teams must also contend with luck.
| Year | WS Champion | Season Wins | ML Wins rank |
|---|---|---|---|
| 2005 | Chicago White Sox | 99 | 2nd |
| 2004 | Boston | 98 | 3rd |
| 2003 | Florida | 91 | 7th |
| 2002 | LA Angels | 99 | 4th |
| 2001 | Arizona | 91 | Tied-6th |
| 2000 | New York Yankees | 87 | 9th |
| 1999 | New York Yankees | 98 | 3rd |
| 1998 | New York Yankees | 114 | 1st |
| 1997 | Florida | 92 | 4th |
| 1996 | New York Yankees | 92 | 3rd |
How often has the team with the best record in the regular season won the World Series title? In the past ten years, this has happened once. In 1998 the Yankees led Major League Baseball in regular season victories and also won the last game they played. In 2000 the Yankees posted the 9th best record in baseball and took home the trophy. Although each Yankee team since has outperformed the 2000 edition in the regular season, the parade each year was held someplace else. As the Yankees learned in 2002 and 2003, being the very best from April to September does not guarantee happy days in October.
Certainly a student of Yankee history would see a different story. In the forty years beginning in 1923 and ending in 1962 the Yankees took the World Series title twenty times. In sixteen title years, the Yankees also posted the best record in Major League Baseball.
In the 1960s the frequency of the best regular season team capturing the crown changed dramatically. Part of this change can be explained by how many teams are allowed to participate in baseball's post-season. Until 1969 the World Series was played by the best teams in the American and National League. In other words, only two teams played in baseball's post-season. In 1969 baseball introduced two divisions in each league and post-season participation was expanded to four teams. With four teams participating the fortunes of the best team declined. Across 25 seasons, beginning in 1969 and ending in 1993, the team with the best record won the title in seven years, or 28% of the time.
After the 1994-95 labor dispute was resolved, baseball began allowing eight teams to participate in the post-season. Now the path to the title required the champion to win three different playoff series. Perhaps it is not surprising that in the years since only the 1998 Yankees managed to win the most regular and post-season contests in the same campaign.
It is important to note that post-season expansions are not the whole story. The difference between the best and the rest has changed since the days of Babe Ruth and Lou Gehrig. In the days of Ruth, baseball players were primarily white players from the Eastern United States. The integration of baseball, coupled with the willingness of teams to search the world for playing talent, has greatly expanded the population of available talent.
What does this mean for the Yankees? The Yankees may be able to acquire the best free agent talent available, but no team can buy all the best players - there are just too many of them to fit on a single roster. No matter how large the Yankee payroll, the opposing teams will also have good players, especially in the playoffs when the weakest teams have been eliminated. In the end, when two good teams face-off the outcome can be more about luck than about skill. And with the playoffs expanded to three rounds, winning a title in the 21st century might require more luck than ever before. Unfortunately for the Yankees, luck is the one thing money cannot buy.
Even without a crystal ball, death, taxes, and the uncertainty of baseball can reasonably be predicted. The natural inconsistency of player performance, declining productivity of aging veterans, increases in the league-wide level of talent, and the unpredictability associated with a long post-season, all conspire to rob George Steinbrenner of the World Series titles he keeps trying to buy. So although we are sure the Yankees will lead Major League Baseball in payroll in 2006, a payroll title does not guarantee a parade in October. And Damon may look better in 2006. But just like he did in 2005, he may still lose the last game he plays in 2006.
David Berri, Martin Schmidt, and Stacey Brook are authors of The Wages of Wins: Taking Measure of the Many Myths in Modern Sports (Stanford University Press), forthcoming in May, 2006.
| Designated Hitter | April 06, 2006 |
Baseball Without the Numbers
There's a college campus not far from my house where I used to walk the dog. I say "used to" because old Fred didn't quite make it to opening day this year; after 14 years, the hips finally gave out. He liked the campus because nobody enforced the leash laws there; I could just let him roam. He'd lead and I'd follow, and at some point my mind would go off duty and head on back to the car, leaving Fred and me to wander unsupervised. A wolf pack of two.
It was on such an occasion last summer that he walked us around a one-story building and down a hill, on an asphalt path we'd never followed before. It darkened briefly as the forest closed in; then the boughs parted, and there appeared in the clearing a ballfield - instantly recognizable even to a subcognitive BEING - with a game in progress.
The bats were aluminum and the uniforms ugly - burgundy and squash yellow at bat, spearmint and berry in the field. Neither team was the home nine; the college team wears navy blue with yellow trim, and in any case the Division II season had ended weeks before. Some of these players could have been college-age, but for the most part they looked older - thicker-built, hairier, more deeply settled into adulthood. I reckon it was an adult league game.
Fred and I were about the 7th and 8th spectators, joining one old guy in a grey nylon windbreaker and a handful of girlfriends perched on aluminum bleachers. We had approached from behind the third-base dugout - the spearmints', empty but for the manager and a couple of subs. There was a guy on first, and the ump called ball four on the batter just as we ambled up. That put two men on with . . . how many out? The scoreboard was dark. What was the score, anyway? What inning? The girlfriends could probably tell us, but when Fred and I went wolf-packing he was the Alpha dog; I took my cue from him. He parked his belly down on the grass; I laid myself on one side and propped myself up on an elbow.
The next hitter stepped in, 6'4" or so with a long stride. Looks like a hitter, I thought, and my eyes turned reflexively to the blank scoreboard, as if expecting the guy's batting average and HR/RBI totals to appear. But the board remained empty; no stats. No scorecard in my lap either, nor any graphic across the bottom of a TV screen. Just the plain old batter, holding the bat. I sized him up as he took his stance; didn't look particularly hard, but I must've seen something I liked - maybe his grip, or the geometry of his limbs, or the way his head locked into place. For whatever reason, I looked at this guy and thought, Here comes a base knock, and seconds later he rapped it on one hop to the centerfielder to load the bases. The ensuing batter gave off the same vibe - "hit" - and he got one, too, chasing two runs home. But there was something off about the hitter up next - a little too broad, maybe, or too blocky in his motions; maybe too far forward in his stance. "Grounder to short," I mused, and sure enough he hit it right there - another run scored on the force out.
How seldom we watch baseball this way in the post-James, post-Rotisserie, post-Moneyball era - without the collar of numbers tugging our perceptions into line. If you're younger than 30, you probably don't know what it's like to sit in ignorance of platoon splits and win expectancy and value over replacement; and if you're older you may well have forgotten. When we watch baseball today - in person, on TV, via the Web - we expect to be fed a steady diet of data, and augment the supply from our own warehouses. Sometimes the numbers help us understand and anticipate; at other times, they're just background noise. But their omnipresence shapes the way we follow the action. They condition what we look for, hence what we see.
Out here, on the back diamond with my dog, there was no scoreboard, no radar gun, no pitch count, not even a distance painted on the outfield fence. Baseball without numbers. We were off the leash, completely unsupervised.
The Spearmints brought in a new pitcher - the former centerfielder, lean and wiry, his obvious athleticism wasted on the mound. He looked pissed off about it, too; his warmup pitches came in hard, and the catcher's mitt popped. I took a half-glance at the on-deck hitter, a big jowly dude sporting a mustache like Bob Horner's; and knew right away what would happen: He'd swing late on a couple of fastballs and foul them off the other way, then chase a slider in the dirt and get himself out. Which he did, in just that order; down on three pitches.
There was a time when I fairly routinely had what can only be called premonitions - accurate foreknowledge of baseball outcomes. They invariably came to me when I was distracted, semi-engaged in the game - watching from a figurative distance or through half-closed lids. Ordinarily I didn't share these inklings with others, but once in a while I would chance it - and then be the least surprised person in the room when I turned out to be correct.
On my first trip to Fenway Park, in 1987, Jim Rice came up with two outs in the 9th, Sox down by a run, and was greeted by a shower of boos. "You people should never boo this guy," I told the fan sitting next to me. "You know what's gonna happen? He's gonna golf one up over the Monster, then run around the bases really slow with his head down - no emotion, nothing. That'll show 'em." I said this without the slightest hesitation; also without the slightest idea that Rice, in nearly 30 career at-bats against Dennis Eckersley, had never homered - and had struck out nearly half the time. Had I been aware of those numbers, then I surely would never have "known" what was about to occur - viz., that Rice would indeed hit a game-tying homer over the Monster and then circle the bases matter-of-factly, head bowed, while the boos turned to cheers. this game, where Albert Pujols literally barred John Rodriguez from going out to the on-deck circle in the midst of a 9th-inning rally. "Eckstein's going to end it right here," Pujols said - even though it would take at least a double by Eckstein (hardly known for his power) to drive home the winning run.
Eckstein hit a walk-off grand slam, the Cardinals' first one in nearly 20 years.
Asked afterward if he'd seen something in the pitcher's delivery or pitch selection or some such, Pujols demurred. "I couldn't tell you," he said. "I just knew."
The Spearmints still were not out of it; still one out to go, and the sacks jammed again after another walk. It had been a long half-inning, but I was still enjoying myself and in no hurry to leave; Fred appeared content to wait around for a while. But as the next hitter stepped into the box the dog suddenly stirred; hoisted himself up onto his front paws and then painfully, laboriously stood up. He stretched, shook, and looked down at the field with his tail erect. For a moment he fixed his gaze, as if reading a sign; then he turned and sauntered off slowly, his nose in the grass.
I was watching him go, trying to decide whether or not to get up and follow, when I heard the clang of the bat. By the time I picked up the ball, it was already soaring over the fence. The Burgundys came charging out onto the field, and the Spearmints walked off dejectedly; game over. A grand slam. The girlfriends were not happy; Spearmints. Sorry, ladies.
I hadn't seen it coming and still wasn't sure it had really happened. But the field was empty, so I picked myself up and started walking after the dog, who was already halfway up the path on his way to the car.
Larry Borowsky writes Viva El Birdos, a blog about the St. Louis Cardinals.
| Designated Hitter | March 23, 2006 |
The Irrational Market
I love watching sports odds. For all the pre-season hype and predictions, all the column inches wasted on how some guy's having a great spring, the fat guy lost weight, the youngsters look good, and the managers says no one has a guaranteed spot, this is where you can see what the real weight of baseball opinion is, because it's where people are staking their money. We can churn out all the expected runs scored/allowed standings, run simulations with Diamond Mind Baseball's predictions, but the actual market-based is the most interesting.
That's because there's only one reasonable reaction to looking over the lines as I write this: people are crazy. The White Sox are 4-1 to win the World Series. Four to one. I know they're the defending champions, but this makes no sense.
Consider for a second the odds that they'll even get a playoff berth. If they were a strong team (say 90 wins strong) in a really weak division, they might have a 75% chance of getting to the playoffs. But the line...the line essentially says that not only are they a strong team in a weak division, they're going to breeze through the playoffs.
Or, rather, consider that the playoffs are a series of coin flips, for ease of demonstrating how wacky this is.
White Sox make the playoffs: 75%
They make the playoffs and win the ALDS: 38%
They win the ALDS and the ALCS: 19%
They win the ALCS and the World Series: 9%
You want 10:1 odds or higher then. To get to the point where a 4-1 bet becomes even rational, you have to believe that the White Sox are a 90-win team in a really weak division, and that they're going to be far superior to their competition in every playoff round. And in recent years, we've seen great teams - truly great ones - lose playoff series to teams that were pretty clearly their inferior. This would be a bad bet if we knew, ahead of time, that the White Sox would win 100 games.
And that's obviously not the case. Is there that much money behind this? Is being the former champion such a big deal that everyone from Chicago put some money behind a repeat? I wish I could short that bet, but unfortunately, there's no derivatives market for sports betting that I'm aware of. That's probably a good thing.
I was curious, though, after I saw that - where else is does the market's belief about playoff chances clearly diverge from mine?
Who the Money's Behind
Top eight teams, by odds offered:
Los Angeles Angels of Anaheim, 13-1
Boston Red Sox, 8-1
Chicago Cubs, 10-1
Chicago White Sox, 4-1
Los Angeles Dodgers, 12-1
New York Mets, 5-1
New York Yankees, 17-5 (or 3.4-1)
St. Louis Cardinals, 7-1
Strictly from the betting so far, here are your division winners:
AL East: Yankees
AL Central: White Sox
AL West: Angels
NL East: Mets
NL Central: Cardinals
NL West: Dodgers
Boston and the Cubs win the wild card.
That's an entirely reasonable set of predictions, even as I look at the odds themselves and wince.
Sooooo...a lotta people from the Greater Los Angeles area putting money on their home team in Vegas, huh? You look at the Dodgers, they've got a great chance to get into the playoffs, and once there, hey, who knows? Other than that, though, none of these look like they've got a positive expectation.
Red Sox, same deal, but the odds aren't good. The Yankees even more so. I wouldn't take the Cubs bet until I know Prior's fine, but if you figure he is, they're about the same bet as the Cardinals, really.
Good Money After Bad, AL
Teams contending but not favored:
Cleveland Indians, 14-1
Minnesota Twins, 30-1
Oakland A's, 15-1
Seattle Mariners, 65-1
Texas Rangers, 40-1
Toronto Blue Jays, 15-1
Again, the baffling AL Central. Both the Indians and Twins are better teams than the White Sox, but they're getting much longer odds, the Twins almost irrationally so. I'd chalk this up to a contraction discount, but they're a good team. Even if you figure that the wild card's going to the East, and it's a race between the Indians, White Sox, and Twins, the Twins are by far the lowest valued.
That's a little baffling. Almost baffling as the A's. Even while their offense looks weak, they're going to run a stellar pitching staff out there. They're clearly the pick of the AL West litter, but if you give them a 50/50 chance to make the playoffs, they still come out ahead on the odds. Do people really think that Beane's...(uhhh, is this a family blog?) stuff doesn't work in the playoffs?
Similarly, it's odd to see that two .500 teams, the Mariners and Rangers, are both long shots, and the Mariners are by far the least favorably viewed. This illustrates something interesting, which I'll come back to in a second.
Good Money After Bad, NL
Atlanta Braves, 22-1
Houston Astros, 30-1
Milwaukee Brewers, 30-1
Philadelphia Phillies, 35-1
San Francisco Giants, 15-1
Phirst things phirst: that line is evidence that the bettors know what they're doing. The Phillies aren't going anywhere with Ryan Phranklin in their rotation. That guy's going to get absolutely brutalized in that park. If you're a season-ticket holder, please - get out from under those games as early as possible. And try to sell to people you don't know. Take it from someone who dumped Ryan Franklin tickets on people for years: the disappointed look of friends and family and the wrecked trust just isn't worth it.
Anyway, not to pound this too much, but the Astros and Brewers, who are in a division with two really strong teams and no patsies at all, get the same odds as the Twins, who are in a decent division and have a good shot to end the year with the best record in the AL Central. I don't get it. I can see that the NL wild card berth might go to someone who's not that good, but the imbalance is strange.
Compared to some of the other bets, that 15-1 for the Giants is silly.
The Forgotten
Pittsburgh Pirates, 80-1
San Diego Padres, 48-1
Yeah.
The Walking Dead
Teams offered at 100-1 or better:
Arizona Diamondbacks, 100-1
Baltimore Orioles, 100-1
Cincinnati Reds, 180-1
Colorado Rockies, 200-1
Detroit Tigers, 100-1
Florida Marlins, 250-1
Kansas City Royals, 200-1
Tampa Bay Devil Rays, 250-1
Washington Nationals, 100-1
Interestingly, this is not all dead money. Even the slight inefficiencies aren't worth taking these odds on, since the 5% chance a team like the Diamondbacks might grab a berth in a weak division is still not worth it once they get through the playoffs.
But take the Tigers. They should be around .500 team in a division where 85 wins might win the division. Give 'em a 10% chance to make the playoffs, and suddenly those are decent odds. They're not good - once you figure they're going to have to run the playoffs against much stronger competition, you start to look for 175-1 or higher, which you won't get.
Moderately Interesting Conclusion
There are cases where the opinion looks quite strange to someone trying to predict next season. With a few exceptions, it's last year's standings, with a few significant moves:
The Blue Jays move up, and there are some other moderate movers with modest moves, but, by and large, only extremely large moves in the off-season cause the perception of a team's chances to change. In general, a team has to win - and win a lot - before they can be perceived that way.
This suggests an immediate applicability to teams: if the perception of a team lags a year behind and huge off-season acquisition binges can only make people pay so much attention, then it's likely, as is frequently speculated, that the effects of winning lag a team. A contending team may see some bump in perception during the year, but there's only so much a team can do - if the Blue Jays can spend that much money and be regarded as having half the chances the Red Sox have, well, they're going to have to show a lot on the field to start building confidence in their prospects for competing.
It means that short-term acquisitions may not be the boon teams think they are, most importantly. Signing a washed-up designated hitter to a $3.4m contract because you think fans are going to respond is a waste of $3.4m, because at the end of the year the team still stinks, the fans still think the team stinks, and they didn't all vomit with excitement and rush to buy season-ticket packages when you announced the deal.
Fandom appears to be extremely conservative and comfortable to wait and be surprised when things turn out differently then last year.
In the meantime, there's money to be made for those willing to look ahead.
Derek Zumsteg writes for the Seattle Mariners-centric site U.S.S. Mariner, but has been published in all kinds of random places, and does all his own stunts. His first book will be out in a year, which doesn't help you at all. He does not, as far as you know, bet on sports himself.
[Additional comments and retorts at Baseball Primer.]
| Designated Hitter | March 16, 2006 |
Long-Term Free Agent Contracts: A Historical Perspective
As the old English proverb goes, hindsight may be 20/20, but there's a lot of evidence that signing another team's free agent to a long-term, big money contracts is poor business. My interest in this topic was set in motion last year when the Dodgers shelled out Darren Dreifort money to perennially-injured outfielder J.D. Drew, 5 years $55 million. Right away you heard the cries: "DePodesta waaaaay overpaid," "He'll never live up to that contract," and then the comments regarding his walk year being a "free agent push."
When Toronto GM J.P. Ricciardi doled out a combined $102 million to free agent hurlers A.J. Burnett and B.J. Ryan this off-season, similar comments were heard uttered. Perhaps J.P. just likes guys with initials for first names (look for F.P. Santangelo to get a coaching job). It's hard to fault Ricciardi though, as the Blue Jays needed a closer and a front-line starting pitcher and got arguably the best of each that were available (sorry Billy Wagner fans).
All this got me thinking: exactly how true is the statement that signing another team's free agent to a long-term, big money free agent contract is often a losing proposition? It's easy to look back on some of the more noteworthy and controversial contracts of the recent past and wonder, "What was that GM thinking?" As a Dodger fan, I was thrilled that the team added Kevin Brown to the rotation after the 1998 season. So what that they spent $105 million over seven years on a 34 year-old pitcher? It wasn't my money. Brown, of course, was coming off a great 1998 in which be put up a WARP of 9.9 while pitching the Padres to the World Series. He then went on to have good seasons for the Dodgers in 1999 and 2000 (WARPs of 7.7 and 7.9) before being hurt for a good portion of the following five years. I won't even get into the Dreifort contract.
I thought it would be interesting to dig into the numbers and determine whether the "walk year" phenomenon held up to the underlying data. I hypothesized that the good deals would balance the Kevin Brown-type deals and that there might be a slight regression in terms of the free agent's year-by-year performance over the life of the contract as the player aged.
In order for this analysis to encompass an adequate amount of data, I selected all free agent contracts signed during the 2000-2004 off-seasons that met the following criteria: 3 years or more in length at a minimum of $5 million per year OR 4+ years and a minimum of $15 million total. Totals much less than that wouldn't impact a team's budget too significantly, save the bottom-feeders such as the Devil Rays and Royals.
The Results
                             Hitters     Pitchers
Total players in sample         29          17
Average age when signed      30.5 yrs    31.6 yrs
Average contract length       5.7 yrs     4.1 yrs
Average total contact         $55.5M      $43.7M
Average annual salary          $9.7M      $10.7M
The Hitters
Sample average:
          Contract Yr   Year 1   Year 2   Year 3
OPS          0.914       0.831    0.830    0.802
EqA          0.307       0.290    0.283    0.273
VORP          48.1        40.4     36.9     27.6
The good signings: Alex Rodriguez (although at $25 million, you could make the argument that he's still overpaid), Manny Ramirez (see A-Rod comment), Hideki Matsui, Cliff Floyd, Miguel Tejada, Vladimir Guerrero, Richie Sexson, Johnny Damon, Ellis Burks (at least until the final year of his 3 year $20 million deal), Ray Durham, Carlos Delgado (so far).
The bad: David Segui, Todd Hundley, Edgardo Alfonzo, Charles Johnson, Edgar Renteria, Roger Cedeno, David Bell, Kaz Matsui.
The in-between: Moises Alou, Tino Martinez, Mike Cameron, Jim Thome.
Jury is still out: J.D. Drew, Adrian Beltre, Carlos Beltran, Jason Giambi, Ivan Rodriguez, Magglio Ordonez (although there is an argument to be made that this already is a bad signing).
As one might expect, the data gives credence to the oft-uttered "contract drive" theory. Clearly, free agent hitters had excellent years in their walk year and followed that up with ever-increasingly worse years. The biggest offenders (a.k.a. the guys who took a dive) were, by far, catchers Charles Johnson and Todd Hundley. After posting a terrific .954 OPS in 2000, Hundley signed a lucrative four-year $23.5 million with the Cubs and proceeded to put up OPS numbers of .642, .722, and .735 in several injury-riddled years with the Cubs and Dodgers. Johnson, meanwhile, put up a .961 OPS, also in 2000, before signing a five-year $35 million deal with the Marlins (back when they had money). He never came close to 2000 again, posting OPS totals of .771, .670, and .775 between 2001-2003.
More recently, the Dodgers' Adrian Beltre and Carlos Beltran had career years in 2004, posting OPS numbers of 1.017 and .927, respectively. Those years netted Beltre $64 million over five years from the Mariners while Beltran, the prize acquisition last season of the Mets, took $119 million on a seven-year deal. 2005 OPS totals?: Beltre: .713 and Beltran .744. Not exactly what the Mariners and Mets were hoping for. David Bell was given a four year $17 million deal by the Phillies after he hit 20 home runs in 2002, but he's been nothing but a headache for the Phillies since the signing and now they can't give him away.
Guys that continued to build upon their free agent year with their new teams (note that "N/A" refers to future years - i.e. Guererro has been an Angel for just two years):
                      Contract            OPS
                        Year    Year 1   Year 2   Year 3
Carlos Delgado          0.907    0.981    N/A      N/A
Richie Sexson           0.915    0.910    N/A      N/A
Vladimir Guerrero       1.012    0.989   0.959     N/A
Miguel Tejada           0.808    0.894   0.864     N/A
Alex Rodriguez          1.026    1.021   1.015    0.996
Manny Ramirez           1.154    1.014   1.097    1.010
Unlike some of the guys whose performance took the proverbial dive after signing a big-money free agent contract, these superstars of the game proved to be worth the money. I think it's worth noting that none of the players who suffered declines after signing their deals (particularly Beltre, Beltran, Bell, Hundley, Johnson, and Roger Cedeno) have ever been classified as true superstars. Beltran is the closest, but even he had never had a .900+ OPS season prior to 2003. Seems safe to say that the superstars have been, in most cases, worth the big investment.
The Pitchers
Pitchers have been an even riskier investment, and perhaps that isn't surprising given their greater injury risk.
Sample average:
          Contract Year   Year 1    Year 2    Year 3
Stuff         14.3         12.4       5.0      (0.4)
DERA          3.71         4.02      4.43       4.57
VORP          41.6         22.4      21.6       16.4
For those unfamiliar with the metric "Stuff," it is a measure of a pitcher's overall dominance and factors in strikeouts, home runs allowed, runs allowed, walks, and innings per game. A 10 equates to a league average pitcher. For reference, in 2005, Johan Santana had a 44 Stuff rating while a seemingly mediocre pitcher such as Brian Lawrence had a 6.
The good signings: Mike Mussina, Jason Isringhausen, Tom Glavine (barely), Greg Maddux, Andy Pettitte, Bartolo Colon.
The bad: Aaron Sele, Keith Foulke, Kevin Appier, Andy Ashby, Mike Hampton, Denny Neagle, Steve Karsay, Chan Ho Park.
The in-between: Kelvim Escobar.
Jury is still out: Carl Pavano, Pedro Martinez.
While it's not surprising that our pitchers' years following the signings of new contracts show a decline, the speed at which that decline occurred was a surprise. By the second year of their new contracts, the 17 pitchers in our sample had seen their average VORP sliced nearly in half and by the third year they were teetering on replacement level status. Hitters meanwhile had seen their VORP decline by approximately 23% by the second year. Worth noting here is the impact that a specific pitcher had on these results. His name: Chan Ho Park. After winning 33 games between 2000 and 2001 while making the All-Star team in his last season as a Dodger (2001), Park signed a five-year $65 million contract to go from pitching in pitcher-friendly Dodger Stadium to its polar opposite in Arlington. His new environs coupled with the pressure of a $65 million contract, combined to result in an increase of nearly two full runs in the Korean's ERA (3.79 as a Dodger to 5.76 with Texas and San Diego). Could A.J. Burnett be the next Park? History tells us it's a possibility. J.P. Ricciardi is gambling $55 million that Burnett will help Toronto close the gap in the AL East. In Ricciardi's defense, the team's locale basically forces the team to overpay for free agents.
So what conclusions can we draw from all this?
It is likely that teams will continue to view the later years of a long-term deal as essentially "sunk costs." For instance, the Mets know that it's highly improbable that Billy Wagner will be worth eight figures in 2009, but it took adding the extra year to get the benefit of what are likely to be very good 2006 and 2007 seasons. Unfortunately for most teams, it's the type of deal that would bust budgets in and of itself, so the Wagners of the world will be reserved for the big-market teams only.
David Regan is a freelance writer whose previous work has been published at a variety of sources, including Baseball Prospectus, InsiderBaseball, and RotoAmerica.com. He welcomes comments, suggestions, and questions via e-mail here.
| Designated Hitter | March 09, 2006 |
Where Do We Go From Here?
It was a year ago next week that the House Committee on Government Reform put Major League Baseball on the hotseat and its tepid steroid testing program under a microscope.
The politicians wanted answers and they wanted action and they got both. The image of larger-than-life superstar Mark McGwire wobbling under the weight of his own guilt told the American public all it really needed to know about the exciting home run boom of the past decade, but the story didn't end with a few embarrassed players and enhanced penalties for steroid abuse in baseball.
The congressional hearings and the ugly Bay Area Laboratory Cooperative (BALCO) scandal illustrated the magnitude of the problem and convinced the Major League Baseball Players Association to sign on to a tougher testing regimen, but left one troublesome question unanswered:
Where do we go from here?
The next Hall of Fame election will force voting members of the Baseball Writers Association of America (BBWAA) to play a major role in deciding just how ensuing generations of baseball fans view the juiced-ball/juiced player era.
Who wasn't looking forward to the likely Class of 2007 -- Cal Ripken, McGwire, Tony Gwynn -- until McGwire's sad performance last March 17 turned the coming election into a referendum on the steroid era?
I don't think a day goes by that I am not asked at least once whether I will vote for McGwire or Barry Bonds when they become eligible for Cooperstown, and I have a ready answer.
My newspaper, the Baltimore Sun, does not allow its writers to vote on awards, so I no longer have to fill out a ballot for the American League Most Valuable Player or the Cy Young Award or the Hall of Fame. That means I don't decide whether Big Mac or Bad News Barry should be enshrined in spite of their alleged misdeeds.
I realize that's a major copout, but it puts me in a perfect position to take an objective look at the subject.
If Mark McGwire used illegal performance-enhancing drugs to put on the dynamic home run display in 1998 and climb into the upper reaches of baseball's all-time home run list, then I don't think he should be rewarded with a plaque in that hallowed hall.
If Barry Bonds or Sammy Sosa knowingly cheated to achieve the strength and batspeed that put them among the elite power hitters in the history of the game, Hall of Fame voters should think more than twice before checking the box beside either of their names on the ballot.
Trouble is, the only player of that magnitude who has been proven to have used steroids is Rafael Palmeiro, who tested positive early last season after pointing his finger at the House Committee like Bill Clinton and insisting that he had never, ever used illegal performance-enhancing drugs.
What everybody else did is a matter of conjecture, though a new book by two reporters who covered the BALCO scandal provides some compelling and comprehensive evidence that Bonds used several performance-enhancing substances.
Therein lies the problem for Hall of Fame voters, who will have to vote as much with their hearts as with their heads. It's hard not to conclude that McGwire, Bonds and Sosa were chemically enhanced when each made his assault on the all-time single-season home run record.
The dramatic change in the musculature of several top home run hitters over the course of their careers and -- in some cases -- the swift reversal of those changes after strict steroid testing was imposed a couple of years ago, leaves you in the uncomfortable position of the wronged wife who finds her husband in bed with another woman and he asks her, "So, are you going to believe me or your eyes?"
Still, the responsibility of voting for the Hall of Fame is a solemn one, since it puts baseball writers in a position to give a Caesar-like thumbs down on the entire body of a player's career.
It's one thing to look at Mark McGwire -- or listen to his squirrelly performance before Congress -- and draw the obvious conclusion. It's quite another to cast such an important vote based on what amounts to a very strong feeling based on very little factual information.
McGwire never tested positive for steroids. He admitted to using the pseudo-steroid androsteindione during the home run race with Sosa, but that supplement was not restricted at the time by either Major League Baseball or the U.S. Food and Drug Administration.
Was his weepy dissembling in front of Congress strong enough evidence to keep him out of the Hall of Fame? In other words, do you really know what happened...or do you just think you know?
We've still got at least six years to debate whether there is enough hard evidence against Bonds, but the circumstantial case is compelling. His personal trainer, Greg Anderson, went to jail along with BALCO guru Victor Conte. Bonds' leaked grand jury testimony seems to indicate that he used "The Clear" and "The Cream," though he testified that he didn't know they contained illegal steroids.
The new book charges that Bonds used all kinds of different illegal substances, but he didn't -- technically -- break any baseball rules unless he took steroids after the first steroid abuse program was put into place.
Hypothetically, if you were a voter and you had decided that McGwire and Bonds were dirty enough to be kept out of Cooperstown, would it be fair to lump Sammy Sosa in with them?
Sosa may have looked like something out of a Saturday Night Live routine when he feigned an inability to speak and understand English during the hearings, but he has repeatedly denied any involvement with illegal steroids and he has never been the target of any credible accusation of steroid abuse.
Once again, you look at the Sosa of 1990 and the Sosa of 1998 and you can't help but conclude that something fishy was going on, but there is -- as yet -- no hard evidence that he did anything other than work really, really hard in the weightroom. It is totally logical to believe that Sosa is the product of mad science, but proving it is another matter altogether.
Now for the other big gray area. Gaylord Perry is in the Hall of Fame largely because of his long-standing reputation as baseball's greatest cheater. It's a different kind of cheating. Loading a baseball up with Vaseline is a lot different than setting a bad example that could lead young boys to abuse dangerous chemicals, but it is cheating nonetheless.
If baseball could wink at Perry, how can we get all self-righteous with a bunch of guys who, with the exception of Palmeiro, were never caught doing anything?
What it will come down to is the corporate wisdom of the 500-or-so Hall of Fame voters, who have done a terrific job over the years of keeping the gate at Cooperstown.
The Hall of Fame ballot, after all, is just the blank canvas for each individual opinion.
The issue of who decides and how is just as troublesome as the issue that will be decided over the decade or so. Many newspapers are uncomfortable with their reporters taking part in what is, essentially, a fairly significant news event.
The Baltimore Sun and several other major newspapers have decided that they would prefer to have their employees simply cover the news and let someone else make the newsworthy decisions on who should win certain awards or gain induction in the Hall of Fame.
I accede to that authority, but I believe that the baseball writers charged with voting on the postseason awards are uniquely qualified to render those decisions while still meeting the ethical standards of the journalistic profession.
I feel even more strongly that the BBWAA is the proper body to choose the inductees for the most revered of the various professional sports halls of fame.
In short, it's a difficult job, but there is no one better qualified to do it.
Peter Schmuck is a columnist for the Baltimore Sun and President of the Baseball Writers Association of America (BBWAA). He covered baseball for 26 years before becoming the Sun's Page 2 Sports columnist 18 months ago.
[Additional reader comments and retorts at Baseball Primer.]
| Designated Hitter | March 02, 2006 |
Pitchers, Pitch by Pitch
Last week, in this same Designated Hitter column, Dan Fox took an excellent look at what batters did on a pitch-by-pitch basis. Well, guess what? Pitchers have pitch-by-pitch stats, too, and they're just as interesting! I've sliced this data dozens of ways, and there's literally hundreds of different stats you could create from Baseball Info Solutions "pitch data," so I'm only going to focus on the four I've found that I believe are most relevant.
When a pitcher throws the ball, it can either land in or out of the strike zone. Pitchers will throw the ball in the strike zone anywhere from 44% of the time to 65% of the time. (If this sounds familiar it's because I went over this same stat, but for batters in my Dissecting Plate Discipline article.) Let's call this stat Zone Ratio (ZRatio) which will simply be the ratio of pitches thrown in the strike zone to pitches thrown out of the strike zone.
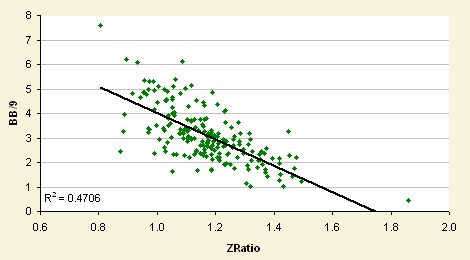
You won't be surprised when I tell you this stat correlates well with walks, but not all pitchers that have a low ZRatio necessarily walk a lot of batters. Let's take a look at the top and bottom 5 lists for starting pitchers only.
Top 5 ZRatio		         Bottom 5 ZRatio
Carlos Silva    1.86		Al Leiter       0.90
Paul Byrd       1.49		Kirk Rueter     0.89
Brad Halsey     1.48		Scott Downs     0.88
Bartolo Colon   1.47		Felix Hernandez 0.87
Greg Maddux     1.46		Dewon Brazelton 0.81
Seeing pitchers like Dewon Brazelton and Al Leiter who walked over 6 batters per 9 innings last season on the bottom list isn't much of a shock, but it is a little odd to see Felix Hernandez and Scott Downs who both walked under 3.5 batters per 9 innings. Looking at the top list, Carlos Silva threw far and away the highest percentage of pitches in the strike zone in baseball which sounds about right considering his miniscule walk rate of .4 batters per 9 innings.
Top 5 ZRatio		         Bottom 5 ZRatio
R. Betancourt   1.65		Ryan Dempster   0.87
Heath Bell      1.54		Akinori Otsuka  0.85
Matt Belisle    1.51		J.C. Romero     0.83
Luis Ayala      1.51		Mike Gonzalez   0.83
Paul Quantrill  1.48		Mike Wuertz     0.78
Looking at relief pitchers, no one appears out of place on the bottom list, but it is interesting to see the Cub's closer Ryan Dempster and the Pirates possible closer Mike Gonzalez. I wonder if throwing that many pitches out of the strike zone will catch up to them eventually? The top of the list is pretty ho-hum in my opinion.
After the pitcher throws the ball, the batter can either swing or take the pitch. Batters should typically be expected to swing at a high percentage of pitches inside the strike zone, but what I find fascinating are pitchers that can make batters swing at pitches outside the strike zone. For this we're going to look at outside swing percentage (OSwing) which is the percentage of pitches thrown outside the strike zone a batter swings at.
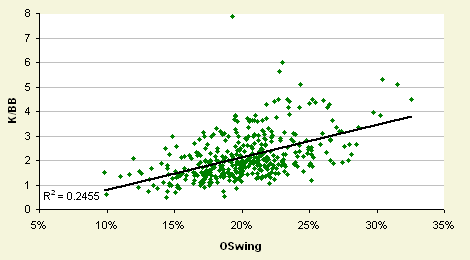
Perhaps you could consider this a measure of deception. Pitchers will cause batters to swing at pitches outside the strike zone anywhere from 9% to 31% of the time. It doesn't have a great correlation with anything, but I suppose it matches up best with a pitcher's strikeout to walk ratio. Once again, let's look at the top and bottom 5 lists for starting pitchers.
Top 5 OSwing			Bottom 5 OSwing
Brad Radke      31.51%		Hayden Penn     13.75%
Johan Santana   30.43%		John Maine      13.41%
Curt Schilling  29.75%		Zach Day        13.10%
Felix Hernandez 28.59%		Glendon Rusch   11.99%
Odalis Perez    27.94%		Scott Erickson   9.95%
In the top 5 we have a pretty interesting list including arguably the best pitcher in baseball Johan Santana who's only second in OSwing to his teammate Brad Radke. Felix Hernandez also shows up and is the only player on the list who has a ZRatio less than 1. On the bottom of the list, there's not really anyone worth mentioning.
Top 5 OSwing		         Bottom 5 OSwing
Brad Lidge      32.54%		Jesus Colome    12.43%
Rudy Seanez     30.24%		Matt Mantei     12.32%
Derrick Turnbow 28.48%		Armando Benitez 11.67%
Mike Wuertz     28.11%		Danny Kolb      11.03%
J. Papelbon     27.87%		Nate Bump        9.82%
The top list of relievers is just as impressive with two closers. Only Mike Wuertz has an ERA over 3. Bringing up the rear are former closers Matt Mantei and Danny Kolb. And then there's Armando Benitez which I find particularly odd. I'm really not sure what he's doing there, but I bet if you were to look at his OSwing in previous seasons, it wouldn't be anywhere near the bottom.
Moving along, once a batter has decided to swing at a pitch, he can either make contact with it or whiff at the ball. Pitchers will have batters swing and hit their pitchers between 60% and 90% of the time. Let's simply call this Contact, which is the percentage of pitches a batter makes contact with when he swings the bat. Obviously this will correlate quite well with a pitcher's strikeouts.
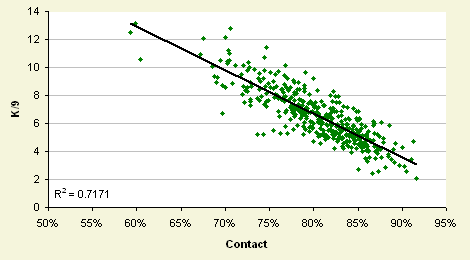
Looking at the top and bottom 5 Contact lists for starting pitchers; Johan Santana makes another appearance on a top list. It looks like if Kerry Wood could actually stay healthy he's still got what it takes to make batters miss along with Kelvim Escobar who is not just looking to stay healthy but could also join the pitching elite. The bottom of the list is scattered with pitchers who barely strikeout anyone including Carlos Silva. Should I just reserve a spot for a Twins starting pitcher on every list?
Bottom 5 Contact	                  Top 5 Contact
Kirk Rueter     91.58%		Ezeq. Astacio   74.46%
Carlos Silva    91.08%		Johan Santana   74.26%
Kirk Saarloos   89.66%		Jake Peavy      73.86%
Shawn Estes     89.21%		Kelvim Escobar  71.81%
Ryan Drese      89.09%		Kerry Wood      70.45%
Taking a look at the relievers, there's two of the best closers in Brad Lidge and Joe Nathan on the top list. Ugueth Urbina used to close but recently has ended up on teams with established closers. Weurtz shows up on another list. Could he possibly be a future closer? At the bottom of the list are pitchers you wouldn't trust to close out Little League games.
Bottom 5 Contact		         Top 5 Contact
Paul Quantrill  91.21%		Joe Nathan      67.51%
Scott Munter    90.44%		Ugueth Urbina   67.24%
Kevin Gryboski  90.20%		Mike Wuertz     60.45%
Nate Bump       90.04%		Brad Lidge      59.86%
Jesse Crain     88.12%		Rudy Seanez     59.25%
Finally, when a batter makes contact with the ball, it can either be put into play or fouled off. I'm not so interested in what batters do to pitches outside the strike zone, but more so what they do to pitches inside the strike zone. So let's look at the ratio of pitches inside the strike zone that are fouled off and call it the Foul Ratio (FRatio).

FRatio correlates quite well with strikeouts, but also has some correlation with a pitcher's fly ball percentage. It's a little strange, but basically it suggests that pitchers who put the ball in play more frequently are often ground ball pitchers. Pitchers will have a FRatio of anywhere from .45 to 1.45.
Top 5 FRatio	                  Bottom 5 FRatio
Mark Prior      1.19		Ric. Rodriguez  0.55
Chris Young     1.17		Carlos Silva    0.53
Erik Bedard     1.14		Kirk Rueter     0.50
Matthew Cain    1.13		Scott Erickson  0.47
Kyle Davies     1.12		Mike Gosling    0.45
Looking at starting pitchers only, the top list has some pretty interesting names on it. It's worth noting that only Mark Prior has an OSwing over 20% on this list. No list would be complete without Silva, so he shows up on the bottom list (have you learned enough about him yet?).
Top 5 FRatio		         Bottom 5 FRatio
B.J. Ryan       1.43		Pete Walker     0.55
J. Papelbon     1.41		Joey Eischen    0.54
Russ Springer   1.37		Scott Sauerbeck 0.54
Scott Eyre      1.36		T. Mulholland   0.54
Ugueth Urbina   1.35		Brian Shouse    0.50
B.J. Ryan heads up the top list for Relievers, but is the only active closer of the lot. Most of the high profile closers in baseball aren't too far from the top 5. There's no one too notable towards the bottom of the list, but former closer Danny Graves missed the 5 spot by just .3%. In addition, Joey Eischen and Scott Sauerbeck managed to strike out a good deal of batters despite having a lousy FRatio.
So what kind of conclusions can we make from looking at a pitcher's pitch-by-pitch data? Well, it's clear to me that having a high OSwing and a high FRatio is clearly preferable, so let's look at one final list which is a combination of the two. I believe this should give us a good indication of a pitcher's overall skill level or possibly potential. For sake of a better name, let's call this stat Potential. Here are the top 10 starters and top 10 relievers.
Top 10 Starters		         Top 10 Relievers
Johan Santana   0.332		J. Papelbon     0.392
Curt Schilling  0.317		Joe Nathan      0.345
Brad Radke      0.279		Robert Jenks    0.331
Rick Helling    0.266		Brad Lidge      0.328
Mark Prior      0.264		Eddie Guardado  0.319
Scott Kazmir    0.260		Mariano Rivera  0.303
Rich Harden     0.259		Juan Rincon     0.301
Jake Peavy      0.250		Scott Eyre      0.291
B. McCarthy     0.239		Jose Valverde   0.290
Robinson Tejeda 0.235		R. Betancourt   0.288
These are two very prestigious lists with some interesting players thrown in. The only starter that seems totally out of place to me is Rick Helling since everyone else is either already a good pitcher or is seen as one with great potential. The relievers are no different as you have 5 of the best closers in baseball and no one had an ERA over 3. I'd show the bottom lists, but there's really no one worth mentioning.
What will be really interesting to see is if these stats have predictive power, my guess is that they probably do, but next year when the Baseball Info Solutions 2006 pitch data is complete, we'll be able to take a much better look at whether or not any of these stats correlate from year to year. There's obviously a lot of work to be done and analysis like this is just scratching the surface, but it seems to me that pitch-by-pitch data is the future of player based statistical analysis.
David Appelman is the creator of FanGraphs.com. You can contact him via e-mail.
[Additional reader comments and retorts at Baseball Primer.]
| Designated Hitter | February 23, 2006 |
Swinging, Taking, Fouling, and Other Baseball Trivia
"It breaks your heart. It is designed to break your heart. The game begins in the spring, when everything else begins again, and it blossoms in the summer, filling the afternoons and evenings, and then as soon as the chill rains come, it stops and leaves you to face the fall alone. You count on it, rely on it to buffer the passage of time, to keep the memory of sunshine and high skies alive, and just when the days are all twilight, when you need it most, it stops."
- A. Bartlett Giamatti, the former commissioner of Major League Baseball
Last weekend the four greatest words in the English language were uttered across our great land - "pitchers and catchers reported." And with those words those of us who know that the phrase "baseball trivia" is an oxymoron, have once again come to life.
For those who don't know me, I'm the author of the blog Dan Agonistes and I also contribute to The Hardball Times. I've long admired the writing of Rich and Bryan and so was thrilled when Rich was kind enough to invite me to pen this guest article. Hopefully, this will be the first of several this season.
But on to today's topic, and that topic is pitches, pitches, and more pitches.
Making My Pitch
While the information revolution may have far-reaching impacts on the economy and speed, as well as the process of democratization across the globe, all that pales next to what it's done for the accessibility and ability to quickly analyze baseball statistics.
And so it is that we can analyze the 191,824 plays from the 2005 baseball season and take an in-depth look at pitches. Today I'll simply lay out some of the leaders and trailers in a few of the categories related to pitch-by-pitch data and then make a few observations. You can think of this as an update to the article "Here's the Pitch..." published on The Hardball Times back in September.
For this article, I looked at the 341 players in 2005 with 200 or more plate appearances which totaled just shy of 600,000 pitches. In order to set a baseline, the average among these players for each of the categories we'll look at are as follows.
Pitches Per Plate Appearance (P/PA):    3.75
Swinging at the First Pitch (1stP/PA): 27.6%
Swinging and Missing (Miss/P):          8.0%
Fouling off the Pitch (Foul/P):        17.2%
Taking the Pitch for a Ball (B/P):     36.7%
Taking the Pitch for a Strike (C/P):   17.1%
Put the Ball in Play (X/P):            20.1%
It should also be noted that for the third through seventh categories intentional balls thrown to the batter have been excluded from the analysis on the basis that those pitches are not in any sense under the control of the hitter.
I should also note that these statistics correlate very well from year to year. In other words, in some sense, these rates reflect a strategy adopted by a hitter either consciously or unconsciously in response to his physical skills coupled with how pitchers work against those skills, but more on that later.
So buckle up because here we go...
Pitches Per Plate Appearance
We'll start off with a category that gets a lot of mainstream press and for which you can get data readily available on MLB.com, and that is pitches per plate appearance. The top 10 in that category are:
                        PA    P/PA
Jayson Werth           395    4.62
Bobby Abreu            719    4.39
Casey Blake            583    4.28
Pat Burrell            669    4.27
Chris Shelton          431    4.26
Gregg Zaun             512    4.25
Adam Dunn              671    4.24
David Dellucci         518    4.22
Mark Bellhorn          355    4.21
Brad Wilkerson         661    4.21
You'll notice that Jayson Werth has a healthy lead over Bobby Abreu mostly due to his 114 strikeouts in 337 at bats. He did also have a decent walk rate and did so 48 times. Werth recorded 4.35 P/PA in 2004. This, and the inclusion of Mark Bellhorn point out that a player needn't have a great season in order to make this list and that the leaders are usually guys who also strikeout a lot which allows them to see more pitches. In looking at the data, however, I found the correlation much stronger with taking called balls (a correlation coefficient of .63 which can range from -1 to 1 and indicates the strength of the linear relationship between two variables) than for taking called strikes (.39) or swinging and missing (.03). In other words, inclusion on this list is more related to good pitch recognition than to simply being a free swinger.
Data from 2000-2004 confirmed that a higher P/PA correlates strongly with OPS as you would imagine, and since OPS is a good proxy for run production, players who see more pitches are on average better contributors.
Interestingly, I also found that there was a weak correlation between P/PA and hitting fly balls and line drives, and a negative one for hitting ground balls and popups. Players who see more pitches are often more feared by pitchers because of their power and so this certainly plays a role.
And that brings us to those who saw the fewest pitches...
                        PA    P/PA
Robinson Cano          551    3.05
Pablo Ozuna            217    3.16
Juan Castro            292    3.16
Alex Cintron           348    3.18
Yuniesky Betancour     228    3.18
Cristian Guzman        492    3.19
Nomar Garciaparra      247    3.19
Carl Crawford          687    3.23
Neifi Perez            609    3.23
Yadier Molina          421    3.24
Yankee rookie Robinson Cano walked just 16 times in his 551 plate appearances to take the top spot. It's no surprise that Nomar Garciapara and Neifi Perez made the list. Cristian Guzman, for whom nothing went right in 2005, also made the list although historically he's a guy who sees few pitches and recorded a 3.35 P/PA in 2004.
Just missing the list are three players who had fairly good production in 2005; Vladimir Guerrero (3.25), Garret Anderson (3.28), and Jorge Cantu (3.29). Guerrero saw even fewer pitches in 2004 (3.17) and yet performed slightly better and so it isn't necessarily the case that having a low P/PA means you can't have a good season. However, since these players aren't drawing very many walks they must compensate by putting up high batting averages like Guerrero or high slugging percentages like Cantu in order to be productive. That is a difficult thing to do.
Although it at first surprised me, players who see fewer pitches tend also to foul off a greater percentage of the pitches they do see. After a moment's thought though, this is clearly because they take so many fewer pitches.
Swinging at the First Pitch
The second category is one that you see from time to time and certainly reflects a strong preference amongst hitters - offering at the first pitch. The leaders are...
                        PA    P/PA  1st/PA
John Mabry             274    3.48   50.0%
Corey Patterson        483    3.37   49.1%
Pablo Ozuna            217    3.16   47.9%
Jeff Francoeur         274    3.41   47.4%
Nomar Garciaparra      247    3.19   46.2%
Jason Dubois           202    3.82   45.0%
Victor Diaz            313    3.67   45.0%
Brad Eldred            208    3.60   44.7%
Alex Cintron           348    3.18   44.5%
Wily Mo Pena           335    3.77   44.5%
Corey Patterson had a horrible final season in Chicago and is a case where the numbers weren't that consistent and therefore are revealing. When he performed better in 2004 he swung at the first pitch 36.4% of the time (making him, of course, one of the last guys you want to leadoff), indicating that as his numbers dropped in 2005 he began pressing and becoming even more aggressive. As a result, he saw fewer pitches, missed more of those he swung at, and ended up hitting fewer line drives. All of which adds up to a trade to Baltimore.
It'll also be interesting to see if Braves rookie Jeff Francoeur continues his aggressive strategy which failed to yield a walk in his first 130 plate appearances and just 8 non-intentional walks in 274 plate appearances.
And those who are reluctant to swing at the first pitch...
                        PA    P/PA  1st/PA
Jason Kendall          676    3.93    6.4%
Oscar Robles           399    4.02    7.0%
Chris Shelton          431    4.26    9.0%
David Eckstein         713    4.01    9.5%
Chad Tracy             553    3.83    9.8%
Bobby Abreu            719    4.39   10.3%
Mark Ellis             486    3.99   10.9%
Juan Pierre            719    3.71   11.4%
Darin Erstad           667    3.84   12.0%
JJ Hardy               427    3.57   12.2%
Interestingly, three 2005 rookies (Oscar Robles of the Dodgers, Chris Shelton of the Tigers, and J.J. Hardy of the Brewers) made the list, all of whom appear to have taken the opposite approach of Francoeur. However, as I found when looking at 2000-2004 data there is no correlation between OPS and swinging at the first pitch and it appears that players simply choose the strategy that works best for them. This also revealed in that players who swing at the first pitch are neither more nor less likely to be fly ball hitters.
However, swinging at the first pitch was strongly correlated with swinging and missing (.63) and very strongly negatively correlated with taking pitches for balls (-.84). Both of these associations make sense since players who swing more often at the first pitch are, therefore, less likely to get good pitches to hit and if you're swinging at the first pitch almost half the time you're obviously not being the most patient.
Swinging and Missing
Chicks dig the long ball and you have to take big swings to hit the big fly. Of course, you're also at greater risk to miss entirely and here are the players that did so frequently in 2005.
                        PA    P/PA  Miss/P
Brad Eldred            208    3.60   24.4%
Russell Branyan        242    4.15   19.1%
Wily Mo Pena           335    3.77   19.0%
Jason Dubois           202    3.82   18.7%
Carlos Pena            295    3.93   17.9%
Dallas McPherson       220    3.83   17.7%
Miguel Olivo           281    3.67   17.1%
Humberto Cota          320    3.60   16.3%
Dustan Mohr            293    3.80   16.2%
Jeff Francoeur         274    3.41   15.9%
Brad Eldred takes the top spot by a whopping margin on the strength of striking out 77 times in 190 at bats, a rate that even Rob Deer would appreciate. He also saw fewer pitches per plate appearance than league average, which is not good when you swing and miss as much as he did resulting in just 13 walks and a .221/.279/.458 line.
As you might guess, players who swing and miss a lot tend to be fly ball hitters and also swing at the first pitch. All is not lost however, as these players can also put up decent numbers as Russell Branyan (.257/.378/.490) and Francoeur did last season. Overall, I found a weak positive correlation between avoiding swinging and missing and OPS.
And who are the contact hitters you might ask?
                        PA    P/PA  Miss/P
David Eckstein         713    4.01    1.9%
Luis Castillo          524    3.94    2.1%
Oscar Robles           399    4.02    2.1%
Juan Pierre            719    3.71    2.5%
Kenny Lofton           406    3.58    2.6%
Chris Gomez            254    3.71    2.7%
Jason Kendall          676    3.93    2.7%
Brian Giles            674    3.92    2.8%
Orlando Palmeiro       231    3.76    2.8%
Marco Scutaro          423    3.77    2.9%
Juan Pierre, Luis Castillo, and David Eckstein all were in the top five for the 2000-2004 period as well and the list is populated with contact hitters. When these guys swing, they usually hit the ball.
What I would not have guessed is that there is a weak but clear negative correlation between making contact and hitting foul balls (-.29). Players who swing and miss more often also hit more foul balls.
Which brings us to...
Fouling off Pitches
Players who foul off lots of pitches are said to be scrappy battlers who wear down the pitcher who finally succumbs to their persistence and throws a meaty fastball that the battler lashes into the corner.
Actually, no.
In looking at who does and doesn't foul off a lot of pitches, the common wisdom doesn't seem that strong.
                        PA    P/PA     F/P
AJ Pierzynski          497    3.56   24.5%
Johnny Estrada         383    3.29   24.2%
Toby Hall              463    3.30   24.1%
Joe Crede              471    3.61   23.6%
So Taguchi             424    3.55   22.6%
Rod Barajas            450    3.80   22.6%
Jose Lopez             203    3.76   22.4%
Ivan Rodriguez         525    3.33   22.2%
Humberto Cota          320    3.60   22.2%
Alex Cintron           348    3.18   22.2%
As mentioned previously players who foul off a lot of pitches tend to also be players who swing and miss but more strongly players who offer at the first pitch. That's probably not a good combination as a quick look at almost any of these players batting lines will tell you. As a group, they stunk in 2005.
The exception to this rule is Francoeur who just missed the list at 21.9%. Somehow he still managed to hit .300/.336/.549. The fact that his name keeps coming up indicates to me anyway, that there was something a bit odd about his short season that may not bode well for the future.
On the other hand, those players who swung and missed the least include:
                        PA    P/PA     F/P
Dave Roberts           480    3.85   11.3%
JJ Hardy               427    3.57   11.3%
Oscar Robles           399    4.02   12.0%
Luis Castillo          524    3.94   12.4%
Bernie Williams        546    3.57   12.5%
Bobby Abreu            719    4.39   12.6%
Scott Hatteberg        523    3.86   12.7%
Brian Giles            674    3.92   12.9%
Chris Snyder           373    4.01   12.9%
Robert Fick            260    3.71   13.0%
Here we see players who perform better (with the exceptions of Bernie Williams, Chris Snyder, and J.J. Hardy) and generally see more pitches per plate appearance.
Speaking of fouling off pitches, there were five plate appearances in 2005 that featured 10 foul balls. They were:
I told you that the words baseball and trivia don't belong together.
Taking Pitches
Next, let's take a quick look at those players who tend to take pitches.
                        PA    P/PA     B/P
Chipper Jones          432    4.02   46.9%
Brian Giles            674    3.92   45.9%
Jason Giambi           545    4.21   43.7%
Lance Berkman          565    3.86   43.5%
JD Drew                311    3.88   43.4%
Ryan Klesko            520    3.77   42.7%
Jeff DaVanon           271    4.06   42.6%
Mark Sweeney           267    4.09   42.6%
David Ortiz            713    4.00   42.5%
Adam Dunn              671    4.24   42.5%
Obviously, these are also players who see more than your average number of pitches per plate appearance and are certainly better than average hitters. Ryan Klesko makes the list but has only a slightly higher-than-average P/PA since he also offers at 34.2% of first pitches.
As mentioned previously, players who take a lot of pitches also happen to be fly ball hitters and hit slightly more line drives than average.
And here are those who hack away...
                        PA    P/PA     B/P
Angel Berroa           652    3.35   26.3%
Aaron Miles            347    3.31   27.4%
Juan Castro            292    3.16   27.8%
Pablo Ozuna            217    3.16   28.1%
Carl Crawford          687    3.23   29.0%
Deivi Cruz             275    3.30   29.0%
Ivan Rodriguez         525    3.33   29.0%
Jeff Francoeur         274    3.41   29.2%
Jorge Cantu            631    3.29   29.3%
Johnny Estrada         383    3.29   29.3%
We've seen some of these players before since taking pitches has a strong negative correlation with pitches per plate appearance and less so with swinging at the first pitch.
As I showed in the article on THT, this is the category where those in the first list and those in the second exhibit the biggest differences in OPS - a difference of over 130 points between the top and bottom 20%. Much of that difference is, of course, accounted for by the fact that on base percentage is a component of OPS and players who are always swinging simply aren't walking.
Certainly over-aggressiveness at the plate is a major contributor to these low percentages of taking pitches as those of us who saw Aaron Miles play (and bat second during much of the time I might add) last year can attest. However, it's important to keep in mind that pitchers also challenge hitters who are perceived to be weak and so in some at-bats the hitter has little opportunity to take a ball.
Plate Discipline
Finally, we'll look at a derived statistic I call Plate Discipline or PD. Simply put, this statistic is a measure of the ratio of pitches taken for balls to pitches swung and missed at or fouled off where 100 is league average.
The rationale for calculating it like this is that those players who display plate discipline avoid swinging at bad pitches. To an extent then this skill can be measured by the percentage of balls they take as opposed to the percentage they swing at with an unsuccessful outcome (miss or foul ball). The underlying assumption, of course, is that many of the pitches they miss entirely or foul off are ones that in actuality are out of the strike zone. Now obviously nowhere near all pitches swung and missed at or fouled off are out of the strike zone. Many of them are "pitcher's pitches" and others are right down broadway that the batter misses. Like I said, this measures plate discipline to an extent. Now if I had pitch location data from Baseball Info Solutions like David Appleman at FanGraphs does, then we'd really be in business.
But be that as it may, here are the leaders in PD.
                        PA    P/PA      PD
Brian Giles            674    3.92     202
Luis Castillo          524    3.94     187
Oscar Robles           399    4.02     186
Dave Roberts           480    3.85     183
Scott Hatteberg        523    3.86     169
Chipper Jones          432    4.02     168
Chris Gomez            254    3.71     166
Craig Counsell         670    4.08     163
Kenny Lofton           406    3.58     160
Scott Podsednik        568    3.89     160
This is an interesting list and is populated with players who have high walk-to-strikeout ratios as in Brian Giles (119/64), Luis Castillo (65/32), and Chipper Jones (72/56). However, it contains other players whose BB/K ratio is right around 1.0 such as Oscar Robles (31/33). The difference is that players like Robles also took a greater percentage of pitches for strikes.
And those who don't exhibit that discipline include:
                        PA    P/PA      PD
Brad Eldred            208    3.60      51
Jeff Francoeur         274    3.41      53
Angel Berroa           652    3.35      54
Humberto Cota          320    3.60      55
Ivan Rodriguez         525    3.33      58
Miguel Olivo           281    3.67      59
Jason Dubois           202    3.82      60
Corey Patterson        483    3.37      61
AJ Pierzynski          497    3.56      62
Johnny Estrada         383    3.29      62
No strangers on this list as it contains lots of impatient and free swingers. Although Jorge Cantu didn't quite make the list (PD of 65), David Appleman has a nice piece on him at THT that reveals that by the end of the season he was swinging at 37% of the pitches out of the strike zone.
Boiling it Down
So what does it all mean?
I find these lists interesting because they illuminate a part of the game that isn't readily accessible to our limited senses. Even fans who watch their team religiously have a hard time spotting these trends because of the sheer number of observations involved and our bias for remembering dramatic events along with those that occurred most recently.
They also reveal that in some sense hitters can succeed at the plate with a variety of different strategies akin to the notion that pitchers can be successful in variety of ways that include:
1. Strikeout a lot of batters in order to minimize the number of balls put into play and, therefore, balls that will be hits (Nolan Ryan).
2. Walk very few batters and give up very few homeruns to minimize the effect of the hits you do give up (Greg Maddux).
3. Walk fewer batters than average but strikeout more than average to minimize base runners and balls hit into play (Fergie Jenkins).
4. Rely on deception to decrease the number of hard hit balls, thereby decreasing the percentage of balls put into play that turn into hits (Charlie Hough).
5. Walk very few batters but rely on keeping hitters off balance to minimize base runners and the number of line drives (Jamie Moyer).
But probably what I like most about these statistics is that you can use them to help understand how a hitter might have changed his approach in a given year. For example, below are three players whose performance changed from 2004 to 2005. You'll notice that I also included ground ball, fly ball, pop out, and line drive percentage along with the percentage of fly balls that are homeruns.
                    PA P/PA 1st/PA  GB%   FB%    P%   LD% HR/FB% Miss/P  F/P   B/P   PD
Derrek Lee   2004  688 3.94 32.7% 41.0% 36.4%  5.4% 17.4%  16.5% 10.1% 14.9% 40.0%  111
             2005  691 4.03 29.2% 39.6% 33.9%  6.3% 20.1%  23.4%  8.4% 16.4% 40.3%  112
Andruw Jones 2004  646 3.88 32.4% 47.1% 28.2%  7.5% 17.2%  23.3% 13.8% 15.1% 38.5%  105
             2005  672 3.82 34.1% 41.8% 33.7%  9.6% 15.0%  29.6% 12.9% 16.7% 36.8%   86
Sammy Sosa   2004  539 4.00 29.7% 43.8% 30.3%  8.4% 17.9%  30.0% 15.0% 16.1% 40.0%  118
             2005  424 3.64 37.5% 44.5% 28.4% 10.4% 16.7%  13.0% 14.5% 16.7% 37.2%   82
Derrek Lee had a monster year in 2005, leading the league in hitting at .335 while smacking 46 home runs. As you can see in 2005, he was a bit more patient seeing more pitches per plate appearance and reducing the number of first pitches he offered at. As a result, his line drive percentage increased as did his fly ball percentage. Since roughly three quarters of line drives end up as hits and three quarters of fly balls end up as outs, you would think his batting average wouldn't change. But notice that his percentage of fly balls that went out of the park increased from in 2005 (23.4%) over 2004 (16.5%). When you put this together with the increased line drives his average goes up over 40 points as it did in 2005.
Andruw Jones hit 51 home runs in 2005 and was more aggressive at the plate as can be seen in the table. This resulted in 42 more fly balls which means more home runs as his percentage of home runs on fly balls also increased from 23.3% to 29.6%. However, hitting fewer line drives and more popups served to keep his average basically the same from year to year.
And with the retirement of Sammy Sosa, I thought it appropriate to look at the difference between his 2004 campaign--when he was already well below his peak performance of 2001--and his last season with the Orioles. As you can see, he dropped a third of a pitch per plate appearance to below league average while offering at the first pitch 8% more often. He hit fewer fly balls and line drives and more popups which, along with a plummeting rate at which his fly balls left the park (30% to 13%), caused his batting average to crash and his power to diminish. His overall plate discipline decreased dramatically as well. As a Cubs fan, that's not the way I wanted Slammin' Sammy to go out, but that's a topic for another day.
| Designated Hitter | February 16, 2006 |
A WARPed Study of Yankee CF and Red Sox LF
USC has long been known as "Tailback U" and Penn State "Linebacker U." Notre Dame has produced some remarkable quarterbacks over the years. For one reason or another, a number of college football teams are famous for being able to fill a certain position with premium talent, year after year. Well, have you ever given some thought to which professional baseball clubs are best known for a particular position? I thought I might take a look at the topic and narrow my focus to the two greatest runs at one position by a franchise in baseball history, and then see whose was better.
Now, if someone were to bring to my attention a similar run of greatness by one team at one position like the New York Yankees and Boston Red Sox have had at center field and left field, respectively, I would probably have to admit to some sort of east-coast bias. I am, after all, a lifelong Red Sox fan and, as such, more familiar with the Sox and Yanks than any other two franchises in baseball. Besides, we northeasterners are nothing if not provincial, right? Sure, off the top of my head, I can say the Cards have had their share of excellent first basemen (Bottomley, Mize, Musial, Hernandez, McGwire) and the Pirates some great shortstops (Wagner, Vaughan, Bell). And, in addition to a legacy of great center field play, the Yanks have had some remarkable right fielders (Ruth, Maris, Jackson, O'Neill) and catchers (Dickey, Berra, Munson, Posada). You could total up the production for some of these cases and probably find better overall totals than what the Red Sox have to show for left field. But there are also a number of mediocre seasons amidst the legends and stars in those other examples. What separates center field and left field for the Yanks and Sox, respectively, is that the two franchises have more or less been able to trot out one productive player after another for a span of seventy years. I can't seem to identify a similar phenomenon, one that has had another franchise, essentially uninterrupted, employ players ranging from very good to legendary over seven decades at a given position.
The method I chose to analyze this is admittedly rough. Although mindful of Yankees center fielder Earl Combs, a Hall of Famer, and a Boston Red Sox left fielder by the name of Babe Ruth, I am starting in 1936 with Joe DiMaggio's rookie season. The date is somewhat arbitrary but, let's be honest, center field in Yankee Stadium and left field at Fenway Park were not exactly hallowed grounds before Joe DiMaggio and Ted Williams. Since DiMaggio's inaugural season was three years before Williams broke in with the Sox, it should be noted that the start date benefits the Yanks.
Here's how I compiled the data: I took the player that played the most games in a season at center field for the Yanks and left field for the Sox and found their WARP3 (Wins Above Replacement Player) number, a figure featured on Baseball Prospectus' website that seeks to determine how many wins a player contributes in a given season above a replacement player of the same position, and then adjusts the figure for all-time. Some people question the reliability of BP's defensive numbers but, for the purposes of this exercise, I am confident that WARP3 will prove instructive. The results have a familiar ring to them. Sorry Sox fans (and I am a diehard), but once again Boston comes up short of their neighbors 200 miles to the southwest.
First, here is the table. Remember, the player listed for each season is the one that played the most games for their team at the position.
| Year | Yanks CF | WARP3 | Sox LF | WARP3 |
|---|---|---|---|---|
| 1936 | Joe Dimaggio | 7.4 | Heinie Manush | -0.5 |
| 1937 | Joe Dimaggio | 12.9 | Buster Mills | 2.1 |
| 1938 | Joe Dimaggio | 10.1 | Joe Vosmik | 6.1 |
| 1939* | Joe Dimaggio | 11.7 | Joe Vosmik | 2.7 |
| 1940 | Joe Dimaggio | 10.9 | Ted Williams | 10.7 |
| 1941 | Joe Dimaggio | 13.3 | Ted Williams | 13.8 |
| 1942 | Joe Dimaggio | 8.7 | Ted Williams | 14.9 |
| 1943 | Roy Weatherly | 2.1 | Johnny Lazor | 1.0 |
| 1944 | Johnny Lindell | 7.8 | Bob Johnson | 8.9 |
| 1945 | Tuck Stainback | 0.9 | Bob Johnson | 5.4 |
| 1946 | Joe Dimaggio | 8.2 | Ted Williams | 14.7 |
| 1947 | Joe Dimaggio | 7.1 | Ted Williams | 12.8 |
| 1948 | Joe Dimaggio | 9.6 | Ted Williams | 11.1 |
| 1949 | Joe Dimaggio | 6.2 | Ted Williams | 12.2 |
| 1950 | Joe Dimaggio | 7.5 | Ted Williams | 5.7 |
| 1951** | Joe Dimaggio | 5.0 | Ted Williams | 11.1 |
| 1952 | Mickey Mantle | 9.3 | Hoot Evers | 2.9 |
| 1953 | Mickey Mantle | 7.3 | Hoot Evers | 0.3 |
| 1954 | Mickey Mantle | 9.0 | Ted Williams | 9.4 |
| 1955 | Mickey Mantle | 11.0 | Ted Williams | 7.5 |
| 1956 | Mickey Mantle | 14.6 | Ted Williams | 7.1 |
| 1957 | Mickey Mantle | 14.4 | Ted Williams | 11.1 |
| 1958 | Mickey Mantle | 11.3 | Ted Williams | 7.1 |
| 1959 | Mickey Mantle | 10.8 | Ted Williams | 2.2 |
| 1960 | Mickey Mantle | 9.3 | Ted Williams | 6.2 |
| 1961 | Mickey Mantle | 12.7 | Carl Yastrzemski | 2.0 |
| 1962 | Mickey Mantle | 8.6 | Carl Yastrzemski | 6.7 |
| 1963 | Tom Tresh | 6.9 | Carl Yastrzemski | 8.3 |
| 1964*** | Mickey Mantle | 9.0 | Tony Conigliaro | 3.8 |
| 1965 | Tom Tresh | 7.4 | Carl Yastrzemski | 5.9 |
| 1966 | Mickey Mantle | 6.1 | Carl Yastrzemski | 7.3 |
| 1967 | Joe Pepitone | 4.2 | Carl Yastrzemski | 11.6 |
| 1968 | Joe Pepitone | 3.4 | Carl Yastrzemski | 11.3 |
| 1969 | Ron Woods | 0.9 | Carl Yastrzemski | 8.1 |
| 1970**** | Bobby Murcer | 6.8 | Billy Conigliaro | 2.2 |
| 1971 | Bobby Murcer | 10.0 | Carl Yastrzemski | 6.3 |
| 1972 | Bobby Murcer | 10.4 | Carl Yastrzemski | 4.4 |
| 1973 | Bobby Murcer | 8.1 | Tommy Harper | 6.0 |
| 1974 | Elliott Maddox | 6.3 | Carl Yastrzemski | 7.1 |
| 1975 | Elliott Maddox | 2.9 | Jim Rice | 4.7 |
| 1976 | Mickey Rivers | 6.6 | Jim Rice | 3.9 |
| 1977 | Mickey Rivers | 6.4 | Carl Yastrzemski | 8.1 |
| 1978 | Mickey Rivers | 5.5 | Jim Rice | 10.5 |
| 1979 | Mickey Rivers | 1.5 | Jim Rice | 8.3 |
| 1980 | Rupert Jones | 2.6 | Jim Rice | 4.7 |
| 1981 | Jerry Mumphrey | 5.5 | Jim Rice | 5.8 |
| 1982 | Jerry Mumphrey | 5.5 | Jim Rice | 7.0 |
| 1983 | Jerry Mumphrey | 3.3 | Jim Rice | 8.9 |
| 1984 | Omar Moreno | 2.3 | Jim Rice | 7.4 |
| 1985 | Rickey Henderson | 11.4 | Jim Rice | 5.6 |
| 1986 | Rickey Henderson | 9.4 | Jim Rice | 9.4 |
| 1987 | Claudell Washington | 2.9 | Jim Rice | 3.0 |
| 1988 | Claudell Washington | 5.4 | Mike Greenwell | 10.4 |
| 1989 | Roberto Kelly | 4.8 | Mike Greenwell | 5.8 |
| 1990 | Roberto Kelly | 6.6 | Mike Greenwell | 6.2 |
| 1991 | Bernie Williams | 2.3 | Mike Greenwell | 6.2 |
| 1992 | Roberto Kelly | 6.4 | Billy Hatcher | 0.2 |
| 1993 | Bernie Williams | 6.8 | Mike Greenwell | 6.7 |
| 1994 | Bernie Williams | 7.5 | Mike Greenwell | 3.5 |
| 1995 | Bernie Williams | 8.6 | Mike Greenwell | 3.0 |
| 1996 | Bernie Williams | 8.9 | Mike Greenwell | 2.3 |
| 1997 | Bernie Williams | 8.6 | Wil Cordero | 3.7 |
| 1998 | Bernie Williams | 9.2 | Troy O'Leary | 4.5 |
| 1999 | Bernie Williams | 10.9 | Troy O'Leary | 5.8 |
| 2000 | Bernie Williams | 8.2 | Troy O'Leary | 2.8 |
| 2001 | Bernie Williams | 9.0 | Manny Ramirez | 8.7 |
| 2002 | Bernie Williams | 8.0 | Manny Ramirez | 8.2 |
| 2003 | Bernie Williams | 4.5 | Manny Ramirez | 9.0 |
| 2004 | Bernie Williams | 5.0 | Manny Ramirez | 7.8 |
| 2005 | Bernie Williams | 3.1 | Manny Ramirez | 8.1 |
| Total | 516.8 | Total | 467.7 | |
| Ave/Season | 7.4 | Ave/Season | 6.7 |
* Ted Williams played RF in 1939, and had a WARP3 of 10.0
** Mickey Mantle played 85 games in RF, posting a 2.4 WARP3
*** Yaz played CF that year, and posted a 6.9 WARP3
**** Yaz mostly played 1B, posting a 9.2 WARP3
Interestingly, if you compare the top-five players for each team, they are basically in a dead heat. Ted Williams, the best player in the study, combines with Carl Yastrzemski, Jim Rice, Mike Greenwell and Manny Ramirez to provide almost 410 wins. Mickey Mantle, Joe DiMaggio and Bernie Williams rank directly behind Williams and are joined by Rickey Henderson and Bobby Murcer to give the Yankees nearly 409 wins.
| Ted Williams | 157.6 |
| Carl Yastrzemski | 87.1 |
| Jim Rice | 79.2 |
| Mike Greenwell | 44.1 |
| Manny Ramirez | 41.8 |
| Total | 409.8 |
| Mickey Mantle | 133.4 |
| Joe Dimaggio | 118.6 |
| Bernie Williams | 100.6 |
| Bobby Murcer | 35.3 |
| Rickey Henderson | 20.8 |
| Total | 408.7 |
Of course, the Sox top-five would have even more of an edge if Ted Williams had not served in both World War II and the Korean War. Williams missed out on his 24, 25 and 26 year-old seasons after going off on American League pitching to the tune of a .356/.499/.648 line at the age of 23 and .406/.553/.735 in 1941 at the age of 22. He had established himself as a player of historic significance, was just entering his prime and then went off to war. He also missed the 1952 and 1953 seasons. Two factors, however, mitigate the effect of Williams' missed time. One, he was ably replaced by Indian Bob Johnson (of Designated Hitter fame) in a couple of these seasons. Two, Joe DiMaggio also defended his country and so it would be inconsistent to gripe about Williams without mentioning DiMaggio's service time. But the fact remains that Williams missed more time than DiMaggio. He was also a better player than Joe D. When you net out what Williams could reasonably have been expected to contribute minus what the Red Sox got from guys like Indian Bob (some good work) and Hoot Evers (not so much), the Red Sox lost out on about 50 wins. The Yanks lost out on about 20.
Where the Yanks make up much of the difference is with a bevy of quality, lesser-known players. Despite not having someone emerge as the sort of long-term solution to which the Yanks had grown accustomed, they were constantly in pursuit of just that, and therefore, able to admirably fill center field during the time between Mickey Mantle and Bernie Williams. Players like Mickey Rivers, Roberto Kelly, Jerry Mumphrey, Tom Tresh and Claudell Washington blow Boston's middle-of-the-road types out of the water.
| Mickey Rivers | 20.0 |
| Roberto Kelly | 17.8 |
| Jerry Mumphrey | 14.3 |
| Tom Tresh | 14.3 |
| Elliott Maddox | 9.2 |
| Total | 75.6 |
| Bob Johnson | 14.3 |
| Troy O'Leary | 13.1 |
| Joe Vosmik | 8.8 |
| Tommy Harper | 6.0 |
| Tony Conigliaro | 3.8 |
| Total | 46.0 |
The consistently solid performances the Bombers received out of center field despite periods of frequent turnover leads me to believe that quality play at the position is not something incidental to Yankee tradition but very much a focal point of their architects past and present. Consider this succession. The Yanks traded Bobby Murcer to the San Francisco Giants for Bobby Bonds in October of 1974. With Chris Chambliss, Thurman Munson and Graig Nettles already in the fold and Elliott Maddox having emerged as a superior defender in center field, new owner George Steinbrenner wanted to make sure he had the right mix to surround his promising core and it was determined that Murcer was expendable. And so despite his enormous popularity with Yanks fans and being hailed as the "next Mickey Mantle" (and sometimes even looking the part), Murcer was shipped out. The Yanks netted Bonds, who performed well in 1975, putting up a line of .270/.375/.512. The problem was that Maddox, in the midst of another productive season in 1975 and in a scene reminiscent of Mantle's injury in the 1951 World Series, injured his right knee on a wet June afternoon at Shea Stadium, where the Yanks were playing home games that season. He would never be the same.
After the 1975 season, the Yanks determined that the way they would fill the hole left in center field would be to take advantage of Bonds' big season by flipping him. Bonds was able to fetch them "Mick the Quick" Rivers from the California Angels. Rivers, who would be instrumental on New York's late 1970's championship clubs, became expendable when the Yanks reacquired Murcer in June of 1979. They traded Rivers to Texas along with a few others for Oscar Gamble and some filler.
Next in line for the Yanks in center field was Ruppert Jones, but he too experienced injury troubles in 1980. The Yanks would trade Jones at the end of Spring Training in 1981 to the San Diego Padres for Jerry Mumphrey. Mumphrey had two-and-a-half solid seasons before the Yanks flipped him for Omar Moreno in the summer of 1983. This was the first of the center field trades to quibble with. Mumphrey had been a solid player for the Yanks and still had some good years in him. For his part, Moreno stunk as a Yankee, just as he had as an Astro and a Pirate. It was a baffling move. The silver lining of Moreno's poor play was that it made Steinbrenner determined once again to find someone capable of carrying on the tradition of great center field play for the Yankees. He had his man in Rickey Henderson, whom the Yankees acquired in December of 1984 from the Oakland Athletics. In 1985 and 1986, Henderson would give the Yanks their best consecutive seasons in center field since Mantle in '56 and '57. Claudell Washington pushed Henderson over to left in '87, and he and Roberto Kelly would hold the position over until Bernie took the reins full time in 1993.
The Red Sox story is less complex. Except for war years and injury seasons, the Sox really only had four left fielders from 1939 to 1996. Ted Williams gave way to Yaz, who was replaced by Rice, who yielded to Greenwell. There was a period in between Greenwell and Manny Ramirez where the Sox struggled to find a worthy successor but even in that span they were able to turn to Troy O'Leary for a stretch. O'Leary provided the Sox with a few solid years, not to mention Game 5 of the 1999 ALDS, a favorite memory for any Sox fan. One major reason the Sox don't stack up, however, is that their stars put up a number of pedestrian seasons. Teddy Ballgame, Yaz and Rice combined for seven sub-5 WARP3 seasons while the great Bomber trio of DiMaggio, Mantle and Williams combined for just 3 (all Bernie's).
It has been a lot of fun plowing through various resources to compile the information necessary to write this bit. The real intrigue for me, however, comes from the tangential anecdotes that arise from such an analysis. Ted and Joe D, '46 and '49, Mantle's perennial World Series heroics, Williams' late-career surge, Yaz in '67, the Yankees post-Mick centerfield turnstile, Murcer's promise, Rice in '78 - hell '78 period, Rickey, the Gator and Bernie and Manny's postseason square-offs. Stay tuned, too, because this story is far from over. Damn near a Boston folk hero for his heroics against the Yankees in Game 7 of the 2004 ALCS, Johnny Damon now heads to the Bronx.
This topic is worthy of a novel, a narrative that could weave through the principals, capturing the eras, the cities and the traditions in the process. The Yankees and Red Sox owe so much of their storied pasts to their center fielders and left fielders, respectively, that it would be a most worthwhile undertaking. Like so many other baseball themes, simply scratching away at the surface of this topic has uncovered endless material, capable of captivating a true fan for more time than he or she would probably care to admit. The subject matter has been fascinating but when it comes to the qualitative comparison, like so many other Yanks-Sox tilts, the results remain the same. The Yanks best us again.
Patrick Sullivan is in his 26th season of a lifelong love-affair with both baseball and the Boston Red Sox. In the small-world department, his fiancée, Johanna, grew up just blocks from Rich. Sully, as he is known to readers of The House that Dewey Built, and Johanna will be married in California this December.
[Additional reader comments and retorts at Baseball Primer.]
| Designated Hitter | February 09, 2006 |
A New Way To Look At Baseball Journalism
Like probably most of the people who read this site, I spend way too much time reading about baseball online. These days, my job requires it, but even before that, back in the angry, scary, dead-fluorescent-light of office life, the vast majority of my time was spent ignoring spreadsheets and pouring through this site, and Baseball Prospectus, and Hardball Times, and Baseball Think Factory, and even, if I was feeling frisky, Tommy Lasorda's MLB Blog. I can't get enough, and I suspect you can't either.
I liked to imagine little personalities for all my favorite online writers. Jim Baker seemed like the overeducated grad student who was smarter than everyone else in the room but also was cool enough to tell me what I'd missed on Conan the night before; I envisioned him wearing tweed. Joe Sheehan, inexplicably, seemed like a leather-jacket wearing badass, a guy who would either break down Torii Hunter's flaws or crack some guy's skull in a bar fight, doesn't matter which, bring it on, whaddya rebelling against, whaddya got? It was quite the shock to see him talking to Brian Kenny on ESPN News and learn that he's the bearded, scholarly type. People always look different on television, I guess.
Well, at least Neyer was the way I thought he'd be.
Anyway, watching the world of traditional media slowly transmogrify - if I might use a word I learned in an Ingmar Bergman class - itself into the world of blogs. More and more newspapers are finally catching on to what the rest of us have always known; it is impossible to overstate how bored people are at work. You're seeing beat reporters starting little online tidbits on their paper's Web sites, and you're even seeing columnists trolling around message boards. (Bernie Miklasz at the St. Louis Post-Dispatch is particularly good at this, though deep down, you know he'd still rather be following Springsteen.)
And here's the thing: The blogs and online tidbits are, without fail, more fun to read (and more informative) than the game stories they're purportedly paid to produce.
If we may go away from baseball for a moment, since it has been so dreadfully long since a blasted game has been played, I would like to submit Mark Tupper, sports editor of the Decatur (Ill.) Herald & Review as an example. Tupper has been covering the Illinois men's basketball and football teams for nearly two decades, but he doesn't have the stodgy, turgid, curmudgeon style that longtimers are often prone toward. He understands what fans care about, and he writes in a conversational, intelligent and lively style. No one knows more about Illinois basketball, and he's a joy to read.
Well, he is on his blog, anyway. His game stories aren't boring, exactly, but they fall prey to the same verse-chorus-verse, inverted pyramid, statement-playerquote-statement-playerquote formula that has made anyone with a modem switch to blogs. Tupper seems to recognize this, quoting the imminently quotable Bruce Weber speak for him most of the time. Game stories by beat reporters never fail to remind us that most athletes, no matter how much we might like to be, are not inherently interesting people and rarely have much of note to say. Sorry. Don't kill the messenger.
But in the blog, Tupper tells you what's really going on. Take a story last month, from when Illinois lost at Indiana in what the kids like to call a "heartbreaker." Tupper's game story had the usual clichés and mealy-mouthed prattle about "falling just short" and "moral victories." In the blog, written quickly and from the gut (Tupper usually files blog entries directly after the game is over), Tupper gets to the point: "the sad truth is that Illinois missed a great chance." This was absolutely true, and not something Tupper could write in a straight game story. The difference was palpable: One story gave you factual details that anyone watching the game could have figured out on their own; the other told you what happened.
So, to baseball. In a long season, much of a beat reporters' coverage is nothing but game stories. But the inertia of the process leads to the same bland story structure:
A: Team won/lost
B: Manager muses on victory/loss
C: Key player comments on his play(s)
D: Dictation of events surrounding key plays in game.
E: Manager/player points out that the game is just one of many and will, in fact, be repeated tomorrow.
This is not to say that beat reporters are lazy; far from it. It's just that the world of newspapers, when compared to blogs, does not give them the freedom (or, more accurately, the space), to delve into what actually mattered in the game, accounting for context, complexity and ultimate impact. Baseball blogs are the most fun sports blogs to read because great ones have multiple entries every day, and they provide perspective and talking points; they are great because they assume you have already seen the game. We are no longer in the days of radio; if you have MLB.TV, or even freaking cable, you can watch every game. We do not need reporters to tell us the facts; we need people to tell us what it means. Or, more specific, to ask us what we think it means.
Where am I going with this? I envision a world with two different kinds of beat reporters covering each team. (Except for the Devil Rays; nobody covers the Devil Rays.) One is involved in fact gathering; who's hurt, who's dealing with contract problems, who's tussling with Tony LaRussa because they have a disagreement about the relative value of cute puppies. And another to actually watch the games, without knowing the players personally, without dealing with sports information, without having to jump through all the demoralizing hoops required of those who cover our games.
Newspapers have a chance to take the power back; they can cover their teams without access, without having to suffer through the now-obviously-broken relationship between reporters and the players they cover. And they can provide their readers much better coverage. It's a matter of breaking loose of the chains and embracing the way this is all inevitably going.
We online sports fans have been enjoying this forever. We have no problem with everyone else joining the party.
Will Leitch is the editor of Deadspin.com and author of the young adult novel Catch.
| Designated Hitter | February 01, 2006 |
Big West Preview
I'd like to start off by thanking Rich Lederer and Bryan Smith for running this series, and asking that I take on the Big West Conference. I'm Jeff Agnew and I publish a blog on the Long Beach State Dirtbags, Dirtbags Baseball, and wish there were more folks taking on college baseball in the blogging community (that's an invitation!). Without further adieu, here's my take on the Big West. The teams are presented in the projected order of finish in the Big West coaches preseason poll.
1. Cal. State Fullerton.
2005: 46-18 | Super Regional | 9th in final poll | 10th in RPI
Coach: George Horton 402-172-1 (9 years)
Preseason Rankings: (5th by Baseball America, 9th Collegiate Baseball, 8th by NCBWA and 5th by USA Today/ESPN Coaches poll)
After winning the National Championship in 2004, the Titans looked like a strong contender to return to Omaha last season. They hosted a Regional that included the Arizona Wildcats, a CWS team from '04. Taking 2 of 3 from Arizona, and the Regional, Fullerton then played host to a Super Regional against Arizona State. After losing games 2 and 3, it was the Sun Devils that booked the trip to Nebraska.
CS Fullerton looks very strong again this season. The Titans had 14 players selected in the 2005 draft, six on day one. But it was their great fortune that five of them did not sign, including four who form the core of a very strong infield. The unsigned draftees include junior Brett Pill at first (45th round, Yankees; .327, .384 OBP, .492 SLG%, 9 HR), senior Justin Turner at 2B (29th round, Yankees; .324, .391 OBP, .447 SLG%, 17 doubles), junior Blake Davis at shortstop (46th round, Indians; .325, .384 OBP, .481 SLG%, 8 triples) and top defensive catcher junior John Curtis behind the plate (29th round, Indians; .234, .332 OBP, .284 SLG%). Also unsigned, and returning, is senior outfielder Danny Dorn (23rd round, Devil Rays, .272, .421 OBP, .474 SLG%, 10 HR). With such abundant experience, and talent, the Titans will be very solid in the field and at the plate. The key losses on offense are Sergio Pedroza (3rd round, Dodgers; .324, .458 OBP, .616 SLG%, 16 HR) and 3B Ronnie Prettyman (10th round, Mariners; .327, .383 OBP, .518 SLG%, 18 doubles, 8 HR).
On the mound, Fullerton returns projected 1st rounder sophomore RHP Wes Roemer (7-3, 3.80, 1 save, .259 OBA, 71K, 15 BB, 90 IP) and junior closer Vinnie Pestano (3-4, 2.68, 13 saves, .239 OBA, 49K, 16 BB, 50.1 IP, 34 appearances). Gone are starters LHP Ricky Romero (13-5, 2.89, .212 OBA, 139K, 34 BB, 134 IP), the 6th player taken overall, by the Blue Jays, and LHP Scott Sarver (9-3, 4.60, .295 OBA, 59K, 27 BB, 88 IP), selected in the 21st round by the Astros. Junior JUCO transfer LHP Ryan Paul (LA Pierce JC; in 2005: 5-2, 2.11, 77K 18 BB, 64 IP), was drafted in the 28th round by the Tigers, and figures to be one of the weekend starters.
The bottom line on Fullerton is that this team didn't need an overhaul ...just a few new parts.
2. Long Beach State.
2005: 37-22 | Regional | 19th in final poll | 22nd in RPI
Coach: Mike Weathers 157-84 (4 years)
Preseason Rankings: (22nd by Baseball America, 16th Collegiate Baseball, 17th by NCBWA and 20th by USA Today/ESPN Coaches poll)
Long Beach State will be younger, with substantially less Division I experience than last season. The 49ers adopted the Dirtbags moniker in 1989, the year Coach Dave Snow's team took Long Beach to the College World Series for the first time. The program has since been a perennial top 25 team. The 2006 roster will feature 23 new players, largest turnover in the Dirtbag era.
Playing their home games in Blair Field, one of the most extreme pitcher's parks in college ball, Long Beach State is an easy sale to pitching prospects. Result: The 2005 Dirtbags led NCAA Division I in ERA at 2.53. But with the exception of starter RHP Jared Hughes, the core of the staff will not be back for '06. Friday starter LHP Cesar Ramos (10-7, 2.64, .227 OBA, 95K, 16 BB, 126 IP) was drafted by the Padres in the supplemental 1st round. Saturday starter RHP Marco Estrada (8-3, 2.43, .212 OBA, 104 K, 29 BB, 111.1 IP) went in the 6th to the Nationals. The '05 Dirtbags also had arguably the best setup/closer combination in Division I, in RHP Brian Anderson (3-0, 0.83, 2 saves, .151 OBA, 37 K, 9 BB, 43.1 IP, 30 appearances) and RHP Neil Jamison (4-0. 0.00, 11 saves, .158 OBA, 27 K, 5 BB, 29.2 IP, 27 appearances). Jamison was drafted by the Padres in the 6th, and Anderson by the Giants in the 14th. Two other pitchers were also drafted on day one, southpaw Steve Hammond in the 6th, and RHP Cody Evans in the 10th. All told, Long Beach State returns pitchers who accounted for only 25% (130 of 522) of innings pitched - 89 of them by Hughes.
Hard throwing junior Jared Hughes (in '05: 8-3, 2.83, .212 OBA, 87 K, 23 BB, 89 IP), a projected 1st rounder who went 7-0, 1.62, in the Cape Cod League this summer, will anchor the staff. Junior JUCO transfer RHP Andrew Carpenter is likely to start Saturdays, with freshman Vance Worley taking the mound on Sundays. Last season Carpenter was 8-2, 3.15 for Sacramento CC. True freshman Worley (McClatchy HS, Sacramento) was the top pitching draft prospect in northern California in 2005 and would likely have been drafted in the first couple rounds had he not suffered an elbow strain his HS senior year. Now healthy, he may become the next dominate starter in the Dirtbags' string.
The big question mark on the hill for Long Beach is the bullpen. They have no obvious choice to succeed Jamison and Anderson. The likely candidates include senior Brett Andrade (1-0, 4.66, .317 OBA, 3K, 3 BB, 9.2 IP), and whichever of a nice crop of freshman rise to the occasion.
At the plate, the Beach ought to improve on their 3.25 runs per game. The most significant loss - and a big one - is SS Troy Tulowitzki, the 7th player taken overall in the draft (by the Rockies). Evan Longoria split time between third and short last season, replacing Tulowitzki for several weeks while he was out injured. Longoria broke out in the Cape Cod League this summer and was named MVP after leading the league in homers (8) and RBI (35). Like Hughes, he projects to be selected in the 1st round in June. Senior outfielder Sean Boatright may be a key. Often injured, if he can stay healthy his gap power will extend rallies. Slick fielding freshman shortstop Danny Espinoza looks to have a lot of playing time, provided he handles D-I pitching. He adds a dimension missing from the Dirtbags in recent years, excellent speed on the basepaths.
3. UC Irvine.
2005: 31-25 | 54th in RPI
Coach: Dave Serano 31-25 (1 year)
Preseason Rankings: (NR by Baseball America, 51st Collegiate Baseball)
Together with Cal Poly SLO, UC Irvine appears to have the best shot at joining Fullerton and Long Beach in the Regional field. The Anteaters return one of the premier closers in the nation in junior RHP Blair Erickson (1-2, 1.80, 10 saves, .140 OBA, 52K, 22 BB, 35 IP, 28 appearances). Erickson projects as a first round pick. Like Blair Field in Long Beach, Anteater Ballpark is a pitcher's dream. Also returning is senior LHP Glenn Swanson, who comes off an injury shortened season, and looks to be a high pick as well. Junior RHP Justin Cassel (9-4, 3.54, .278 OBA, 86K, 21 BB, 117 IP) is an additional solid starter.
Irvine lost a lot of offense to the draft in Brett Dalton (.376/.419/.471), Mark Wagner (.355/.398/.495) and Matt Anderson (.332/.402/.508). Senior Jaime Martinez (.339/.384/.475) returns. If they can produce the runs, the Anteaters have a shot at the post-season.
4. Cal Poly San Luis Obispo.
2005: 36-20 | 57th in RPI
Coach: Larry Lee 101-71-2 (3 years)
Preseason Rankings: (NR by Baseball America, 41st Collegiate Baseball, 41st by USA Today/ESPN Coaches poll, and also received votes in NCBWA)
Cal. Poly has already gotten off to a great start, sweeping Baseball America ranked #21 Fresno State last weekend. Many thought the Mustangs should have been included in the field of 64 last season, but the selection committee apparently felt their #57 RPI wasn't enough, despite tying Long Beach State for 2nd in the Big West standings at 14-7.
The 2006 Mustangs lose their #1 and #2 starters to the draft. LHP Garrett Olson (12-4, 2.71, .243 OBA, 128K, 47 BB, 136 IP) went to the Orioles in the supplemental 1st, and RHP Jimmy Shull (8-7, 4.61, .259 OBA, 85K, 33 BB, 111.1 IP) to Oakland in the 4th. The pitching staff will be anchored by returnee junior RHP Gary Daley (6-2, 4.74, .247 OBA, 59K, 39 BB, 89.1 IP). Junior RHP Bud Norris (5-0, 4.54, 1 save, .242 OBA, 38K, 30 BB, 33.2 IP, 17 appearances) also figures to play a big role. He started Saturday against Fresno and earned the win, going 7.0, and yielding 1 run (earned) on 6 hits. Both figure to go early on day 1 of the June draft.
Gone is their top offensive player, catcher Kyle Blumenthal (.410/.511/.557), taken by the Rockies in the 14th round. Also gone is outfielder Brandon Roberts (.339/.409/.454), selected by the Reds in the 7th. Junior 1B/OF Jimmie Van Ostrand (.345/.425/.466) is back, as is junior 2B Brent Walker (.311/.405/.372). Seventeen new faces join the Mustangs, including JUCO transfer junior catcher Matt Canepa, who hit .343 his sophomore year at College of San Mateo, striking out just 9 times in 137 AB.
5. UC Riverside.
2005: 28-27 | 86th in RPI
Coach: Doug Smith 28-27 (1 year)
Preseason Rankings: None
UCR returns fleet junior outfielder Brett Bigler (.322/.395/.386), who in '05 stole 14 of 17 attempted, and senior outfielder/top offensive player Aaron Grant (.357/.471/.469). Senior RHP Haley Winter (6-8, 3.44, .281 OBA, 68K 30 BB, 110 IP) anchors the staff. For the Highlanders to contend for an at large bid, they'll have to improve on their 4.82 team ERA from 2005.
6. Pacific.
2005: 30-28 | 113th in RPI
Coach: Ed Sprague 50-62 (2 years)
Preseason Rankings: None
Though construction has slowed, Pacific inaugurates a new ballpark this season, Klein Family Field. Until it's completed, they'll play in another new park, Stockton Ballpark (home field for the Stockton Ports in the California League). On the field, the Tigers have sophomore 3B Justin Baum (.332/.389/.700, 17 HR) back. Gone is RHP Josh Schmidt (6-4, 1.79, 11 saves, .224 OBA, 89K, 25 BB, 60.1 IP, 36 appearances), selected by the Yankees in the 15th.
7. UC Santa Barbara.
2005: 26-30 | 99th in RPI
Coach: Bob Brontsema 436-364-2 (12 years)
Preseason Rankings: None
The Gauchos had one of the great stories of tragedy and triumph in college baseball last season. 2005 Senior infielder Chris Malec (.316/.404/.477) was diagnosed with testicular cancer, and underwent surgery, in April. Amazingly, he returned to action against Long Beach State at Caesar Uyesaka stadium on Friday, May 6. I was in attendance, and the emotion in the stands was palpable. The next day, in a scene out of The Natural, Malec crushed a grand slam. The Gauchos swept the Beach. The story gets better, as Malec has moved on to the next level, signing with the Yankees after being selected in the 16th.
UCSB returns junior infielder Chris Valaika, out for most of the 2005 season with an injury. If Valaika can return to '04 form when he was named Big West Freshman of the Year, while hitting .347, he could move up considerably in the draft.
8. Cal. State Northridge.
2005: 18-36 | 177th in RPI
Coach: Steve Rousey 51-116-1 (3 Years)
Preseason Rankings: None
You've got to hand it to the Matadors. After a dismal 2005 season, they haven't avoided tough competition. According to SEBaseball.com, they have the 13th toughest intended non-conference strength of schedule in Division I, playing the likes of Arizona State (from whom they took 1 of 3 this past weekend).
Northridge has a couple of good bats in junior infielder Chase McGuire (.318/.391/.459) and senior infielder Erik Hagstrom (.310/.400/.359), but there's just not enough pieces here to contend. Especially with the loss of outfielder Mike Paulk (.330/.414/.549).
Big thanks to Jeff, and again, please be sure to visit his site: Dirtbags Baseball.
| Designated Hitter | January 31, 2006 |
Big XII Preview
College Baseball Preview Week heads east today, as we move on from the Pac-10 to the Big 12. We will be sure to catch you up on the Big West later, but in 2006, it only seems natural to segue from USC to Texas. Sorry, Rich.
Howdy, my name is Ryan and I been running a website called Texas A&M & Baseball In No Particular Order for about 3 years now. I won't bore you with my life story so I'll catch you up to speed really quickly....I love Aggie baseball and Bryan and Rich have kindly invited me to say a few words about the Big XII and the fast approaching season.
One last thing before I get into it....keep supporting collegiate baseball. It's a great thing and I'd love to see it continue to grow, so get out to the ballparks near you and watch it on TV (you can even play the video game now). Bryan & Rich do a great job keeping the college game on their minds and in their writing and I tip my cap to them for that.
In the words of my boy, Pat Green, "Here we go"....
Texas
2005 Season: 58-15; National Champions (def. Florida)
Preseason Rankings: #1 Baseball America, #1 Collegiate Baseball, #1 NCBWA
Preseason All-Americans: Adrian Aleniz-SP (CB-2, NCBWA-1), Jordan Danks-OF (BA-3) Kenn Kasparek-SP (CB-3), Kyle McCulloch-SP (BA-2, CB-1, NCBWA-1), Drew Stubbs-OF (BA-1, CB-1, NCBWA-1)
Coming off of their second National Championship in 4 years, Texas is only losing 3 arms from a pitching staff that was one of the elite in the nation last season. They're returning a weekend rotation of Kyle McCulloch (138.2 IP, 2.92 ERA, .267 BAA, 99 SO, 45 BB), Adrian Alaniz (108.0/2.67/.235/94/32), & Kenn Kasparek (73.0/2.10/.214/46/31) which is just scary. They only had 3 pitchers with ERAs over 3.00 and two of them aren't returning. As an Aggie, it hurts me to type that out.
Offensively, they're only returning 6 of 14 players with >10 ABs from last season but this wasn't a team that relied on hitting the tar out of the ball. They're also bringing in OFer Jordan Danks who is one of 9 true freshmen to be named to Baseball America's Preseason All-American team since 1983 (which was 3 years before Danks was even born).
Drew Stubbs is getting the most preseason hype but he got the same thing last preseason. He really reminds me of Vince Young heading into this past football season ... a freak of an athlete with a huge upside who has had a couple pretty good seasons but has yet to put it all together and earn his All-American hype. Head coach Augie Garrido has it right when he says that Stubbs is the best athlete he's ever coached but won't say he's the best baseball player he's ever coached. Stubbs hit .301/.372/.474 as a freshman & .311/.384/.527 as a sophomore with 8 & 11 HRs, respectively, in his career. Like I said, good but not Golden Spikes good.
One thing that always impresses me is that Texas has no problem scheduling strong opponents in non-conference play. They start the season in the Astros College Classic with games against Rice & Tulane. They have 3 game series with both Stanford and Long Beach State plus 2 more weeknight games with Rice and a single game against Arizona State.
After coming away with two rings on three consecutive trips to the championship game Garrido continues to build his legacy as one of the greatest collegiate baseball coaches ever. Looking into the future it doesn't appear things will drop off too terribly much. The horns continue to restock with talent and win with great fundamentals and great coaching.
Nebraska
2005 Season: 57-15 (19-8; T-1st), Big XII Tournament Champions, CWS Appearance
Preseason Rankings: n/a Baseball America, #4 Collegiate Baseball, #5 NCBWA
Preseason All-Americans: Joba Chamberlain-SP (BA-2, CB-1, NCBWA-2), Johnny Dorn-SP (CB-2, NCBWA-2), Brett Jensen-RP (CB-1, NCBWA-2)
I can't believe that Baseball America doesn't have Nebraska in their Top 25. The Huskers are going to field a good ball club even after losing the 3/4 of their infield in Alex Gordon (2005 Golden Spikes winner), Joe Simokitis, & Curtis Ledbedder as well as OFer Daniel Bruce (OF). Those 4 made up all of Nebraska's offensive 1st or 2nd team All-Conference players. They do return 2Bman, Ryan Wehrle (.275/.377/.329), who was named All-Big XII Honorable Mention last season as a freshman.
Their pitching staff was phenomenal in 2005 and they're returning 9 of their 11 pitchers with 10+ IP led by their All-Americans Joba Chamberlain (118.2 IP, 2.81 ERA, .218 BAA, 130 SO, 33 BB), Johnny Dorn (104.0/2.16/.199/75/21) & Brett Jensen (46.0/1.96/.207/46/9). Of the 9, only two had an ERA over 3.00 and only one was higher than 3.35. That's sickening.
In the end, pitching takes you to the postseason and this team certainly has that. On a side note, it will be interesting to keep an eye on their pitching staff after losing pitching coach Rob Childress who took over the head coach job for my Texas A&M Aggies.
Baylor
2005 Season: 46-24 (19-8; T-1st), CWS Appearance
Preseason Rankings: n/a Baseball America, #23 Collegiate Baseball, n/a NCBWA
Preseason All-Americans: n/a
Even coming off of an exciting College World Series season I would be surprised to see Baylor make it through the Regionals in 2006. The Bears lost 2 of their top 3 hitters (Michael Griffin & Josh Ford) from a lineup that was, to put it quite simply, bad. The Bears hit .269/.341/.398 as a team in 2005. They do return All-Big XII DH, Zach Dillon (.304/.379/.417), who will probably suit up behind the plate fulltime now that Ford is gone.
In 2005 the Bears got by on their good pitching, even more than Texas did, but only Cory VanAllen (107.1 IP, 4.02 ERA, .286 BAA, 68 SO, 38 BB) will return to their starting rotation along with relievers Ryan LaMotta (79.2/.221/27/23), & Jeff Mandel (66.0/1.91/.221/27/23). But man, they lost so much pitching ... 49% of the team's innings will not return including the staff's 3rd, 4th, 5th, & 6th lowest ERAs, respectively (only relievers LaMotta & Mandel were better).
Missouri
2005 Season: 40-23 (16-11; 4th), Regional Appearance
Preseason Rankings: #10 Baseball America, #14 Collegiate Baseball, #16 NCBWA
Preseason All-Americans: Max Scherzer-SP (BA-1, CB-1, NCBWA-1), Hunter Mense-OF (BA-3, NCBWA-2)
It was unfortunate that Mizzou had to travel to Cal-State Fullerton for Regionals in '05 because they had a pretty good little team last year. The Tigers are returning All-American Max Scherzer (106.1 IP, 1.86 ERA, .163 BAA, 131 SO, 41 BB) as their Friday starter as well as 3 other 1st or 2nd team All-Conference players -- OF-Hunter Mense (.327/.440/.473), SP-Nathan Culp (92.2/3.50/.287/63/31), & RP-Taylor Parker (50.0/2.88/.193/42/23).
On the offensive side of the ball, they're returning 10 of their 13 offensive players with 50 or more ABs but did lose their hands-down top offensive player, James Boone, who led the team in BA, RBIs, OBP, SLG, & SB. While the Tigers return Scherzer, Culp and Parker they only return two other arms from their 13 pitchers from last season. Regardless, starting pitching is king in college baseball and Scherzer/Culp should carry them through conference play and into the postseason. If another arm or two step forward this could be another great season for Tiger fans.
Oklahoma
2005 Season: 35-26 (14-13; 5th), Regional Appearance
Preseason Rankings: n/a Baseball America, #29 Collegiate Baseball, #28 NCBWA
Preseason All-Americans: n/a
New head coach, Sunny Golloway, emerges as one of two new head coaches in the Big XII this season. Golloway was promoted from within after a messy "resignation" from head coach Larry Cochell and a confusing soap opera with Wichita State's longtime head man, Gene Stephenson (funny). Golloway takes over an incredibly experienced roster as the Sooners are returning 10 of their 13 players who had 20+ ABs and 7 of their 9 pitchers who threw more than 10 innings in 2005.
Their top returning offensive players are 3Bman, Ryan Rohlinger (.345/.449/.563) who led last year's squad with 11 HRs & 53 RBIs and Freshman All-American OFer, Kody Kaiser (.305/.376/.520) who was the only other Sooner to reach double digit HR numbers with 10 ... the next closest was 6.
Out on the bump they do return a very sizable portion of their pitching staff but it isn't a great staff. Of the 7 returning arms mentioned the lowest ERA of the bunch came from Will Savage (97.1 IP, 3.98 ERA, .292 BAA, 53 SO, 19 BB), who threw mostly out of the bullpen. Their most experienced starters are Brad Burns (66.0/4.50/.288/48/37) & Steven Guerra (85.2/5.91/.298/53/24).
Texas A&M
2005 Season: 30-25-1 (9-18; 5th)
Preseason Rankings: n/a Baseball America, n/a Collegiate Baseball, n/a NCBWA
Preseason All-Americans: n/a
Finally, I am including my Aggies. Coming off of a Super Regional performance in 2004 the Ags suffered through a disapointing season in 2005 and are looking for a big improvement with new head coach Rob Childress. Childress was snatched up from Nebraska where he was the recruiting coordinator and the pitching coach. His arrival in Aggieland, quite simply, makes me giddy as I think about our future. Why shouldn't it? As the recruiting coordinator he brought the Huskers 4 of the last 5 Big XII Players of the Year in addition to 6 Freshmen All-American pitchers over the last 7 seasons.
Unlike OU, our coaching change resulted in a slight bit of attrition but I think we gained more than we lost. Childress will be picking up an offense that at .274/.347/.380 was almost as poor as Baylor's. Add to that the loss of our top two bats (including Cliff Pennington) and you get the feeling that the offense won't be the strong suit of this squad. However, we return 1B/DH Ryan Hill (.317/.386/.399) and catcher Craig Stinson (from a medical redshirt) and have brought in 4 D-I transfers to combine with a group of youngster who were wetting their feet last season. I think things will turn out better than many will expect.
The pitching staff, which has a good mix of experience and youth, should be solid. We return junior Jason Meyer (77.0 IP, 3.04 ERA, .230 BAA, 49 SO, 41 BB) and sophomore Chance Corgan (58.2/4.45/.251/50/28) to our weekend rotation as well as a bullpen led by super-soph (and defensive back for Coach Fran) Jordan Chambless (32.0/2.25/.209/42/19), junior Kyle Nicholson (40.1/3.35/.253/31/8), & junior Austin Creps (40.0/4.28/.263/28/14). Creps, who was a Summer All-American this past summer, will probably get the first look at the third starting spot. Also, keep an eye out for freshman righty Kyle Thebeau.
Looking at the schedule we have games against 4 of the top 5 ranked preseason teams including a huge non-conference trip to Gainesville to take on the Gators in a 3 game set. We also have single non-conference games against Notre Dame & Rice.
I'm really anxious to see what immediate impact Childress will have on the pitching staff. Overall, I would conservatively say that this is a team that should finish in the middle of the pack and should be even fun to watch in 2007 & 2008.
You can read more about the Ags at my website next week as I start my annual week long Aggie Baseball Preview in preparation for the season opener.
The Rest of the League
Kansas (36-28; 11-15; 7th) will be interesting to follow. They return former-Stanford arm, Kodiak Quick (121.1 IP, 3.41 ERA, .243 BAA, 91 SO, 42 BB), who was their only legit starter last season and closer Don Czyz (62.1/3.47/.216/60/26). Their offense should at least have a solid middle with Jared Schweitzer (.366/.466/.585) & John Allman (.350/.477/.437) both back after lighting up the Big XII (both hit well above their season average in conference play).Oklahoma State (34-25; 12-15; 6th) finished last season amidst a downward spiral losing 11 of their last 17 games. They bring back a good portion of their offense which is lead by NCBWA 3rd Team All-American, Adam Carr (.336/.377/.702), and OFers Ty Wright (.342/.430/.510) & Corey Brown (.360/.496/.691). I should point out that Wright & Carr both hit ~65-70 points below their overall season batting averages in conference play (and that Carr hit only 5 of his 22 HRs against Big XII opponents). Brown hit 30 points higher. On the mound they lost their top two starters and bring back Brett McDonald (17.0/1.59/.169/12/7) as their best returning arm.
Barring the arrival of some incredible transfers or freshmen, Texas Tech (34-25; 9-16; 8th) fans need to prepare for a long season in Lubbock. The Red Raiders lost a ton of players on both sides of the ball. They return 6 offensive players who accounted for less than 40% of last season's at bats and only two of those 6 hit over .300, Joseph Callender (.362/.410/.439) & Matt Smith (.321/.473/.429). On the mound they return 5 pitchers whose collective 2005 ERA was 5.87 and only two of those five had individual sub-5.00 ERAs (and none were below 4.00).
Kansas State (30-25; 8-19; 10th) is returning a bunch of guys but according to head coach, Brad Hill, will be filling holes at SS and OF with 3-4 freshmen. They do return 2/3 of their weekend rotation in Adam Cowart (100.2/3.93/.267/70/15) & Chase Mitchell (87.0/4.45/.264/61/32). In addition to those two, and in paying homage to The Three Amigos, they have a plethora of bullpen guys coming back. The plethora really isn't as bad as I thought they'd be as they posted a 3.91 ERA in 165.1 IP last season.
Big thanks go out to Ryan for this fantastic preview. As with all our Designated Hitters, we urge you to support Ryan by reading his site, Texas A&M & Baseball In No Particular Order. You won't be disappointed.
| Designated Hitter | January 19, 2006 |
A Quantitative Approach to Studying Release Point Consistency
We know an awful lot about pitchers. We know how hard they throw, how many batters they strike out, what kinds of pitches they have, and whether their deliveries are fluid and easy or violent and rough. This is all objective and indisputable information that has a lot of value when it comes to projecting a pitcher's future health and success.
One thing we don't know much about, though, is the consistency of a pitcher's release point. The fact that we don't have a good way of measuring what's arguably the most important part of being a good pitcher is one of the more ironic twists of modern analysis. Sure, you can look at a bad curveball and say "he let go too early" or "he held on too long," but that's just one of a few thousand pitches that the guy's going to throw all year, so it doesn't tell you very much. What we need is a way to quantify the extent to which release points varies over a larger period of time for different pitchers. And, thanks to MLB.tv and MS Paint, we're getting there.
Take this low-quality screengrab of Felix Hernandez, immediately prior to release:

The ball is a little fuzzy, but it's definitely there about to leave his hand. Just moments from now, it's going to fly past some unfortunate hitter's bat at 95 miles per hour, since all Felix ever does is dominate. But anyway, here's the really cool part: copy and paste that picture into MS Paint. Now move your cursor to the center of the ball. In the lower right corner of the window, there should be a set of coordinates - for me, it reads 124,37. Think of this like a set of coordinates on any generic x,y plot. The center of the ball is 124 units (pixels) from the left of the window, and 37 from the top.
I didn't know quite what to make of this the first time I noticed it, but after a little brainstorming, I realized that this could be an effective way to quantify both release point location and, with a large enough sample, consistency (it's the second one that I actually care about). So I devised a plan: collect a group of images of a pitcher much like the one of Felix above, enter the x,y location of the ball into a spreadsheet, and calculate 95% confidence intervals at the end to get an idea of his release point consistency.
For the purposes of this article, I decided to compare Mark Prior to Kerry Wood, since one is considered to have picture-perfect mechanics while the other...not so much. As far as further methodology is concerned, note that:
1) For each pitcher, I looked at 40 pitches - 20 from the windup, and 20 from the stretch. These are kept separate, in case either pitcher happens to change his delivery with runners on.
2) I only used images from one game so that I didn't have to account for differences in center field camera angle. Incidentally, both Wood and Prior's games took place on the same day - April 13th, a doubleheader vs. San Diego.
3) All pitches were chosen randomly.
4) To account for any differences in scale between images (since the camera has a tendency to zoom in and out), I chose reference points at opposite corners of the batter's box and adjusted accordingly.
5) Once I had 95% confidence intervals in pixels, I converted to inches by using the fact that a baseball is about three inches in diameter, and showed up as eight pixels wide on screen.
So, onto the results of this study:
Kerry Wood, Windup

The little red box represents the 95% confidence interval - based on the collected data, Wood would be expected to release 95% of his pitches from the windup within a box measuring 1.6 by 3.1 inches. The area of this box is 4.84 square inches.
Kerry Wood, Stretch

Same deal - based on the data, Wood should throw 95% of his pitches from the stretch within a box whose dimensions are 2.5 by 2.8. The area of this box is 6.95 square inches.
Although we obviously don't have a baseline for how much variation you'll see in a standard pitcher's release point, since this is a fledgling analysis, Wood's results compare favorably to Felix's, at least as far as pitching from the windup is concerned.
Mark Prior, Windup

Dimensions of the box: 3.4 by 5.0. Area: 17.0 square inches. That's more than three times the variability that we saw in Kerry Wood's release point, which I wasn't expecting. That's a huge difference.
Mark Prior, Stretch

That's more like it. Dimensions of the box: 1.6 by 2.3. Area: 3.52 square inches. Better than Wood, and better than Felix.
Based on the results of this study, you'd be tempted to say that, as long as there isn't anyone on base, Kerry Wood's release point is significantly more consistent than Mark Prior's. I don't think anyone expected that to be the case ahead of time, but that's what the numbers bear out. To get a better indication of whether or not this is really true, though, you'd have to compare them over more than one game. I would've loved to do just that, if only the whole process weren't so time-consuming - it took me six hours to look at Joel Pineiro over three starts by himself, so even accounting for the fact that it gets quicker as I become more familiar with the procedure, comparing two pitchers is at least an entire day's work. So, consider this as more of an introduction to the methodology rather than a comprehensive investigation.
As far as Prior is concerned, something that may have influenced his final numbers is the fact that the game I looked at was his season debut, six days after throwing 87 pitches in a minor league rehab start. Looking at the spreadsheet, Prior's release point was getting lower as the game wore on, the gradual dropping of his arm being a possible sign of fatigue with his arm strength not yet at 100%. It is worth noting, though, that his considerable improvement with men on base in the April 13th game wasn't a fluke - opponents put up a .766 OPS against him with the bases empty last season, striking out in 23.1% of their plate appearances, but with men on their OPS dropped to .578 while their strikeout rate jumped to 32.8%. In 2005, Mark Prior was a much better pitcher with men on base, and based on the results of this preliminary study, it may have been because he was way more consistent with his release.
A study like this is going to have both its strengths and limitations. On the downside, it's a very tedious process, as you're going to lose the better part of an entire day if you're looking to gather any sort of meaningful results. It's also strictly two-dimensional, as it doesn't give a real good idea of how far forward the ball is being released. Short-arming the ball a foot in front of your throwing shoulder is going to make it do one thing, while a full-extension release will make it do quite another. The system could be improved by having a side-view camera providing z-axis location information, but until then we'll have to maximize the resources at hand. Additionally, it should be noted that this kind of investigation would be difficult to perform on someone who deliberately mixes up his arm angles, a la Jamie Moyer.
All that said, the biggest issue is how to properly interpret the data once you have it. Release point consistency is nice and all, but a consistently good release point and a consistently bad release point are two very different things that cause very different things to happen. Looking at the numbers, we can see that Kerry Wood's release point was more consistent with nobody on than Prior's, but Wood got slapped around while Prior was terrific. Why? Was Wood releasing the ball in a bad place all game long? I'm guessing that better pitchers will generally have more consistent release points, and that these kinds of apparent exceptions are considerably outnumbered by their opposites, but I can't say that with any degree of certainty.
Accepting that any new kind of study is going to have its kinks to smooth out, I think the potential upside here makes it worth pursuing further. Although it's possible to perform manually, one could conceivably automate the whole process, turning what used to be three hours of work into three minutes of watching a machine do everything for you. With the data that would provide, you could look at anything - release point consistency against right- and left-handed batters, correlations with things like walks and strikeouts...pretty much everything you can do with the stats we already have. Comparing a guy's consistency when throwing different pitches (fastballs, curveballs, changeups, etc.) could prove to be a pretty telling indicator of what he needs to work on in the bullpen. And those are just a few examples. Like with any metric, you could use this one in any number of ways.
Still, the most important thing here is: it's something. It's putting a number to what used to be educated guesswork. And as far as I'm concerned, doing that is always worth the effort.
Jeff Sullivan is the creator and primary author of the Lookout Landing Seattle Mariners blog. He's also a student at Trinity College, although nobody's sure where he finds the time. He can be reached by email at jeff@lookoutlanding.com.
| Designated Hitter | January 05, 2006 |
The Rebuilding of the Giants, 1969-70
I came to know baseball in the early-to-mid 1960s, in the San Francisco Bay Area, in a houseful of Giants' fans. I can't remember not hearing the Giants' game on the radio, ubiquitously, in the house or in the car ...
"How're you doing, everybody? This is Russ Hodges, along with Lon Simmons, welcoming you to another broadcast of San Francisco Giants baseball ..."
Coming of age as a fan of this team in this period was, it's fair to say, a mixed blessing. On the one hand, I got to enjoy the thrilling exploits of a core of brilliant stars the likes of which few ball clubs in history have ever amassed: Hall of Famers Willie Mays, Willie McCovey, Juan Marichal, Gaylord Perry, and Orlando Cepeda were all there. On the other hand, for all their talent, the Giants of that period displayed a maddening incapacity to get over the hump, to fill that last remaining hole or two in the lineup and become a great ball club instead of a very good one. After winning a pennant in extremely exciting fashion in 1962, the Giants reeled off a sequence of seasons in which they won 88, 90, 95, 93, 91, 88, and 90 games - and finished third, fourth, second, second, second, second, and second.
Being a Giants' fan in those days was - let's see, how best to put it: it was like going out on an elegant, romantic dinner-and-dancing date with a stunningly gorgeous woman, and then going back to her place - and on her doorstep, she gives you a quick handshake, a peck on the cheek, and a good night, buster. Yes, there are worse ways to spend an evening, but there might well have been, shall we say, more satisfying conclusions as well.
Winning Now, the Stoneham Way
The Giants were owned by Horace Stoneham, then in his early sixties. Stoneham - bald, round, bespectacled, publicity-shunning - was a mild, genial fellow who'd inherited the ball club from his father in 1935, and running the Giants was, quite literally, the family business, his life's work. Stoneham never employed a General Manager in the modern sense; working in close consultation with a close-knit team of executives, most of whom had worked for him for decades (including Rosy Ryan, Tom Sheehan, Carl Hubbell, and Stoneham's nephew Chub Feeney), Stoneham oversaw everything, and authorized every major player transaction.
Even to a very young fan like me, riding his bike to the A&W in Keds and hand-me-down jeans, it was obvious that Stoneham and his management team understood where they were in the success cycle: they had a core of superstars, and it was time to make hay while the sun shines, to win now. The Giants "got" that. Their problem, which so frustrated my brother and me, was that they didn't seem to have a clue as to how to actually patch those last few remaining holes on the roster.
The first thing the Giants spent the mid-1960s frantically dealing for was the perfect left-handed pitcher. In a 48-month period following their '62 pennant, the Giants acquired:
- Billy Hoeft
- Ken MacKenzie
- Bob Hendley
- Bill Henry
- Warren Spahn
- Joe Gibbon
- Ray Sadecki (sigh)
- Billy Hoeft (again)
- Mike McCormick
Some of these southpaws did quite well, and others bombed. Some were bargains, and some cost the Giants dearly (I'm looking at you, Ray). But by golly, they were all left-handed!
The other thing the Giants thought they needed was the ultimate veteran pinch-hitter. It seemed between 1963 and 1969 that a faded star's decline phase wasn't officially complete unless and until the Giants created a spot for him on the end of their bench:
- In '63, 32-year-old Norm Larker, for the final stint of his career
- In '64, 34-year-old Del Crandall
- In '64, 37-year-old Duke Snider, for the final stint of his career
- In '65, 34-year-old Ed Bailey
- In '67, 33-year-old Norm Siebern
- In '67, 36-year-old Dick Groat, for the final stint of his career
- In '69, 35-year-old Leon Wagner, for the final stint of his career
This Geezer of the Year club put up an aggregate line of .200/.296/.281 in 544 at-bats, for a combined OPS+ of 63.
Still, the issue with both of these patterns wasn't so much that they were bad moves in and of themselves. (Well, besides the Cepeda-for-Sadecki trade, anyway.) The issue was that this focus on southpaws and senior citizens ignored the vastly larger problems festering away on the roster: the offensive sinkholes at shortstop and second base, as well as (usually, and shockingly) left field and right field. Season after season went by, and the team's core of prodigious sluggers had no one on base to drive in except one other. The Jesus Alous and Hal Laniers kept racking up the at-bats, while management kept obsessing over the arrangement of the deck chairs and remaining oblivious to the icebergs. All the while, the Giants kept falling just short of the pennant.
And so, while forlornly reading in every October's sports sections about the Dodgers' or Cardinals' exploits in the World Series, my brother and I drew the conclusion that Stoneham and his doddering cronies had skill at signing and developing young talent, but were completely inept at the tasks of making trades and fashioning the full major league roster. We took to deriving bitter laughs from role-playing games, in which one of us would be Stoneham (or better yet, Chub Feeney - the name alone was gut-busting), and the other would be a rival GM, and we'd conduct a trade negotiation. The Giants would invariably wind up swapping Marichal and McCovey for Gerry Arrigo and Floyd Robinson, or some such. "Are ya sure ya don't want me to throw in Jim Ray Hart there too, young fella?"
Rebuilding, the Stoneham Way
And so imagine our horror when, during the December 1969 winter meetings, it became obvious that the Giants, following their fifth consecutive second place finish, had decided it was finally time to shake things up. They swung three significant trades in a week's time:
- Pitcher Ron Herbel, catcher Bob Barton, and third baseman Bobby Etheridge went to the San Diego Padres for pitcher Frank Reberger.
- Pitcher Ray Sadecki and outfielder Dave Marshall went to the New York Mets for infielder Bob Heise and outfielder Jim Gosger.
- Pitcher Bob Bolin went to the Seattle Pilots for outfielders Steve Whitaker and Dick Simpson.
I was aghast, gnashing my braced teeth and wailing my angelic little voice in apoplexy. I understood that none of the talent they'd surrendered was star-quality, but Sadecki, Bolin, and Herbel were useful major league pitchers. And what did they get? Frank Regurb - Frank Rergreb - Frank who?!? And Bob who?!? And what are they trying to do, corner the market on lousy utility outfielders?!?
It got worse. The Giants struggled through the early part of the 1970 season, playing under .500 ball for an extended period - an experience I had never known as a fan. Worst of all, their problem in early 1970 was clearly and abundantly their pitching! As of June 5, 1970, the Giants had scored 304 runs, or 5.7 per game, far and away the most in baseball - but they had allowed 344 runs, 6.5 per game, the most in baseball by an even wider margin. Their won-lost record was a dreary 24-29, barely ahead of the hapless San Diego Padres for last place. Wouldn't they want to have Sadecki, Bolin, and Herbel back now!
I was inconsolable. Adding to my misery, in late May of 1970 the Giants traded Frank Linzy, their longtime relief ace, with over 300 bullpen appearances in his career, to the Cardinals for Jerry Johnson. Yes, the Jerry Johnson, the one with a grand total of 56 major league games under his belt, and a won-lost record of 12-17. The immortal Jerry Johnson!
It got still worse. In December of 1970, they traded second baseman Ron Hunt - the one middle infielder they had who could actually hit a little, for whom they'd given up Tom Haller a couple of years earlier - they traded Hunt to the Expos, for none other than Dave McDonald. Dave who, you ask? Well, so did we. Dave McDonald, it turned out, was a 27-year-old left-handed-hitting first baseman with the whopping figure of 9 major league games on his resume. So not only was he lousy, he was a left-handed-hitting first baseman.
Repeat, a left-handed-hitting first baseman. You've got Willie McCovey on your roster, at his monumental peak. What in the world are you doing trading a perfectly good regular second baseman for a second-rate, minor league, left-handed-hitting first baseman?!?
Amazing as it may seem, it got still worse. During spring training in 1971, the Giants sold McDonald, back to the Expos. Staggered by this latest development, I reeled. Trying to comprehend it, I sat alone in my room, miserably drawing moustaches on Pee Chee athletes, desperately clinging to the last fringe of sanity. I marveled that the Giants had surrendered Ron Hunt in exchange for the market cash value of Dave McDonald!
This was it. The apocalypse was upon us. The Giants were going down the tubes, their days as a winning team finished. And worst of all, they'd done it to themselves, squandering what supporting cast they had around their core of stars, in exchange for a pocket full of lint. As the 1971 season opened, I held my hands over my eyes, barely summoning the courage to peek through my fingers at the carnage I would surely behold.
Then the season began. The '71 Giants blasted out of the gate. They won and won, with reckless abandon, surging to 12-2. Then 18-5. Then 27-9. Then 37-14! It was their best start in my memory, their best start in fact since the hallowed season of 1962. They cooled off after that white-hot start (how could they not have?), but had enough momentum to win the division, in exhilarating fashion, over the hated Dodgers.
I was, of course, ecstatic. All was forgiven.
You Mean ... It Worked?!?
But in the forgiving, I was forced to confront some perplexing questions. Why hadn't the Giants struggled in 1971? Was it just dumb luck on their part, or had I been missing something important in my gloomy assessment of the 1969-70 transactions? Could it be that the Scotch-pickled Stoneham and his circle of old fogey advisors actually knew what they were doing?
I was forced to re-examine their moves in a new light, and I came to form an assessment that I've pretty much held ever since: while I don't think I would have done it exactly that way, there was indeed a distinct method to their madness. The Giants had a clear plan of action in the 1969-70 and 1970-71 off-seasons, and they executed it with something bordering on fanatical rigor.
The sequence of trades which had so appalled me hadn't really been much of a sequence of "trades" at all. They could more accurately be described as "dumps." The moves were far less concerned with what talent they collected, than they were with clearing room, on the roster and on the payroll.
Yes, payroll mattered, even in pre-free agency days. Giants' attendance had taken a major hit upon the arrival of the A's in Oakland in 1968, and by 1969 it was painfully clear that they would need to find a way to operate with significantly less revenue. Even - really, especially - in an era in which major league team payrolls were measured in thousands instead of millions, every few thousand dollars were important. Whatever else mid-tier veterans such as Herbel, Sadecki, Bolin, Linzy, and Hunt meant to the Giants, they each meant annual salaries of at least $10,000 more than young players replacing them. That was a cost Stoneham was now unwilling to bear. Unloading them was a business move at least as much as it was a baseball move.
And from a pure baseball perspective, it also made sense to clear space on the roster for younger talent to fill the significant roles those veterans had been holding. The Giants, whatever major faults they demonstrated during Stoneham's entire 40-year tenure, were remarkably good - tremendous, actually - at producing talent with their minor league system. They had lots of it coming along in the late 1960s and early 1970s. And young players, no matter how talented and well-developed they may be when coming out of the minors, require substantial playing time at the big league level to attain full competence. And even with substantial major league playing time, not all prospects, no matter how good, make the grade in the majors.
There's one and only one way to find out if talented young players will become good big leaguers, and that's to give them the opportunity to play in the majors, if not as full-time regulars, then at least in more than bench-warmer roles. The Giants, beginning in 1969, and accelerating in '70 and '71 (and beyond), provided genuine, substantial opportunities for their young talent.
A couple of the players netted in the three December '69 trades were more than mere triple-A filler: pitcher Frank Reberger and middle infielder Bob Heise were decent prospects, and both were given reasonable chances with the Giants. Jerry Johnson was also (I came to realize) a talented young player, and the Giants gave him room to develop as a relief specialist, focusing on his fastball. Another veteran traded in mid-1970, pitcher Mike McCormick, netted a young pitcher, John Cumberland, who was given a full shot.
Moreover, the freed-up roster space created opportunities for many more young talents from the Giants' own system. Pitchers Rich Robertson, Ron Bryant, Skip Pitlock, Steve Stone, and Don Carrithers were all given serious shots. Outfielder Ken Henderson, who'd gotten his initial opportunity in 1969 when shoulder problems sidelined Jim Ray Hart, was given a full chance as a regular in 1970. Catcher Dick Dietz had been used as a semi-regular for a couple of years, but in 1970 the Giants went ahead and committed to him full-time. Infielder Tito Fuentes had been up and down with the Giants for several years, but in Hunt's absence, the team gave him another opportunity as a regular second baseman in 1971. Twenty-one-year-old Chris Speier was allowed to bypass triple-A and installed as the regular shortstop in '71. Young third baseman Alan Gallagher was granted substantial playing time in '70 and '71.
Not all of these youngsters did well; indeed a few bombed. But others blossomed wonderfully. All in all, the team took some lumps, patiently suffering through some struggles, but also benefited from some pleasant surprises.
The team that scuffled through the early part of 1970 perked up and played much better over the second half of that season (a fact I only grudgingly semi-acknowledged at the time, insisting on viewing the glass as half-empty). And then the '71 Giants vanquished my negativity with their roaring start and eventual division triumph. The ball club in both '70 and '71 was an interesting blend of old and new:
- The core of veteran superstars (Mays, McCovey, Marichal, and Perry) was fraying around the edges, but still highly productive.
- One terrific young star stood out (Bobby Bonds).
- The bulk of the cast were the crew of newcomers, few of whom had played significant major league roles before 1970.
- A few veterans were deployed in supporting roles (defensive specialist Hal Lanier, relief pitchers Don McMahon and Steve Hamilton).
- In late '71, two more talented rookies arrived (first baseman-outfielder Dave Kingman and pitcher Jim Barr).
It had turned out to be, right before my eyes, an impressive demonstration of a contending ball club substantially restructuring while remaining competitive. The Giants had pulled off the kind of difficult feat that years later in my business career, in a different context but with similar meaning, was described to me as the challenge of metaphorically "rebuilding the airplane in mid-flight."
The Giants didn't do everything right, not by a long shot. They should have gotten more in the trade market for Ron Hunt than, effectively, nothing. And in May of 1971 they made a pointless, ridiculously foolish trade, of George Foster for Frank Duffy. That fall they made another, giving up Gaylord Perry and Duffy for an already-fading Sam McDowell.
The Giants made mistakes, and they continued to suffer poor attendance and its financial constraints. In 1972-73, they were forced to surrender Mays, McCovey, and Marichal in salary dumps. Before Stoneham finally sold his beloved ball club following the 1975 season, it would have more downs than ups. Still, through it all, as late as 1973 the Giants were putting a highly competitive team on the field. Horace Stoneham and his executive team certainly had their weaknesses, but on balance, they truly did know what they were doing.
Steve Treder is a staff writer for The Hardball Times, has presented papers to the Cooperstown Symposium on Baseball and American Culture, and had numerous articles published in Nine: A Journal of Baseball History and Culture. A lifelong San Francisco Giants' fan, he is Vice President for Strategic Development for Western Management Group, a compensation consulting firm headquartered in Los Gatos, California.
[Additional reader comments and retorts at Baseball Primer.]
| Designated Hitter | December 30, 2005 |
Ode to the Crazy Maverick, Finley (Part Two)
Finley screws Catfish, and Catfish shows the world what kind of salaries players could make in free agency
Finley continued to sign great players that had made the run possible. Not content with just signing them, they had to have colorful nicknames. Johnny Lee Odom had become "Blue Moon" Odom. When it came time to sign another pitcher, Finley came up with another one.
"Do you have a nickname?" he asked.
"No sir," replied the pitcher.
"Well, to play baseball you have to have a nickname. What do you like to do?"
"Hunt and fish," was the reply.
"Fine," Finley said. "When you were six years old you ran away from home and went fishing. Your mom and dad have been looking for you all day. When they finally found you about, ah, four o'clock in the afternoon, you'd caught two big fish...Ahh...catfish...and were reeling in a third. And that's how you got your nickname."
So was christened, "Catfish" Hunter.
James Augustus Hunter may have grown up on a farm in North Carolina, but he was far from a dumb hick. As he grew into one of the best pitchers in the game, he also began to understand how Finley worked.
In 1974 Hunter signed a two-year contract with the A's. Finley, being Charlie O'Finley, had acted as his own attorney in many cases, regardless of his lack of education in law. In the case of Jim Hunter's contract, there was a provision requiring that one-half of his salary was to be paid to an insurance company, named by Hunter, for the purchase of an annuity; the money was to be paid during the season.
Shortly after the '74 season began, Hunter supplied Finley with the name of the insurance company. There was a problem, however. Finley never made a single payment to the insurance company in the name of Hunter during all of 1974. Finley had discovered that the $50,000 wasn't tax-deductible. He wouldn't be able to take the deduction until years later. Hunter's lawyer pressed Finley for the $50,000. Finley started making up a variety of excuses as to why the money wasn't being deposited. With Finley and the A's now in default, Dick Moss and the Players Association sent written notice to the club to remedy the default within 10 days.
It should be noted that the timeframe to remedy the default was not arbitrary. A clause in the Uniform Players Contract, in existence long before the union, read as follows (about being in default and not remedying it within 10 days): "[T]he player may terminate this contract upon written notice to the Club, if the Club shall default in the payments to the Player provided for."
Finley called Hunter to his office. When Hunter arrived, not only was Finley in the office, but AL President Lee McPhail, as well.
Charlie, at this point, must have underestimated Hunter's intelligence. He held up a check for $50,000 and said he would pay the sum now, but refused to sign the application to the insurance company. Hunter replied that he didn't want the money paid to him, but rather as had been agreed to. Hunter then turned around and walked out the door.
The Lords knew they were in a pickle with Finley. The case would go to arbitration. Finley, being Finley, couldn't get the story straight when he and the labor-relations members of management prepared to make the case. When it got to arbitrator Peter Seitz, he was dealing with the same problem. Finley was now denying that he ever received notification from Hunter's lawyer.
On December 13th, the decision was rendered by Seitz. "Mr. Hunter's contract for service to be performed during the 1975 season no longer binds him and he is a free agent," read part of the ruling. Charlie O had screwed over Hunter, and now Hunter was going to benefit from it. He was going to benefit from it in numbers that seemed cartoonish by the days' standards.
The derby for Hunter began on December 19th. It was unlike anything that had ever happened before. The frenzy for Hunter by the owners from December 19th to New Year's Eve Day showed just how much money the owners had and, more correctly, how much they were willing to spend on talent when the constraints of the Reserve Clause were removed.
The two-year contract that Hunter had signed with Finley had been for $100,000 a year with the deferments. By the time twenty-four clubs had jockeyed for the rights to Hunter and the Yankees had finished negotiations, Hunter had agreed to a deal worth $3.5 million.
Finley hadn't just screwed himself over, but the Lords, as well. The seed that had been growing slowly in the back of Marvin Miller's mind about breaking the Reserve Clause now sprouted like Jack's beanstalk.
The Seitz Ruling and Finley's ability to see through it
At the beginning of the 1975 season, Miller decided to test the Reserve Clause by seeing if he could get Andy Messersmith of the Dodgers to hold out for the season without agreeing to a contract. Messersmith had been at loggerheads with the Dodgers on his contract, and had shown up to Spring Training without one. To play it safe, Miller looked to Dave McNally of the Expos as back-up in case Messersmith buckled over the course of the season, when the ever increasing dollars being offered to him would surely arrive from the Dodgers.
Miller had Paragraph 10(a) of the Uniform Players Contract which said, "The Club shall have the right to renew this contract for the period of one year on the same team." Miller's interpretation was clear: If a player was not re-signed within one year of his contract not being renewed, he would be eligible for free agency.
Andy Messersmith never buckled. In October of 1975, the Union filed the Messersmith/McNally grievances. The arbitration case weaved through the off-season and set baseball on edge. On December 23, arbitrator, Peter Seitz ruled, "The grievances of Messersmith and McNally are sustained. There is no contractual bond between these players and the Los Angeles and Montreal clubs, respectively." The Reserve Clause had been revoked.
The Lords were incensed. First thing they did was fire Seitz as an arbitrator. Clark Griffith could only muster, "Oh, shit" when the news arrived.
Free agency would be available, but how would Miller negotiate the terms? As Miller wrote in, A Whole Different Ballgame, "In the wake of the Messersmith decision it dawned on me as a terrifying possibility, that the owners might suddenly wake up one day and realize that yearly free agency was the best possible thing for them; that is, if all players became free agents at the end of each year, the market would be flooded, and salaries would be held down."
Charlie saw this advantage. "Hey what's the problem?" Finley said. "Make 'em all free agents!" Miller waited to see if anyone would actually listen to the maverick. "My main worry was that someone would actually listen to him," Miller said.
The result? No one listened.
Finley had said how the owners could actually benefit from the ruling. The owners, through their own stupidity, balked at Finley's suggestion and have been paying for it since.
Finley sees his fate. Vida Blue, and Bowie too
Finley had always worked on the edge. When free agency became part of the new landscape, he knew his days as an owner were numbered.
In early '76, Finley decided that he was going to get something out of the new paradigm. He started by calling the Red Sox. The proposed blockbuster trade was Joe Rudi, Rollie Fingers, Vida Blue, Gene Tenace, and Sal Bando for Fred Lynn, Carlton Fisk and a couple of minor leaguers.
Not content with just the Red Sox, Finley got the Yankees on the horn. He tinkered with offers and counter-offers, and not just with the Red Sox and the Yankees. By the time he was through, Finley had negotiated with every American League franchise, with Kansas City the exception.
With one day left before the June 15th trading deadline, Finley still hadn't signed his star players. Then Charlie made the shift: "trade" was shelved for "cash."
He also started playing the Red Sox against the Yankees. When Dick O'Connell of the Red Sox got a hold of Finley, the latter said, "I'm with Gabe [Paul of the Yankees]. I'm offering Rudi, Blue, Baylor, or Tenace for a million apiece and Bando for half a million. Are you interested?"
The Red Sox mulled the various options and scenarios. O'Connell phoned Finley and asked, "Are Rudi and Fingers still available at a million dollars apiece?" "Yes, they are," replied Finley.
The Red Sox now had Rudi and Fingers.
The problem was Finley was still working with Gabe Paul on a deal for Vida Blue. As O'Connell got off the phone, he realized that if Blue became a Yankee, the Red Sox deal would be a wash.
To get around this problem, O'Connell got the Tigers in the mix. By getting Detroit in on the negotiations for Blue, maybe the Red Sox could at least get Blue out of the Yankees' hands and into the Tigers'.
Detroit offered a million dollars for Blue. Finley relayed the news to Paul, who, in turn, countered Campbell's offer with a deal for $1.5 million and landed Blue. However, there was one small problem. Blue was still not signed with the A's. Paul had swung the deal, but on the conditions that Blue was signed.
Finley called up Chris Daniels, Blue's agent and said he wanted to work a contract up. Finley and Daniels negotiated back and forth over the terms for the three years, never mind the fact that Finley was not really using his money, but rather Steinbrenner's. It wasn't until later in the day that Blue and Daniels got the news about the Yankees. Finley would make more on the deal to New York than Blue.
The fire sale news was spreading quickly, and finally made its way to the commissioner's office. Kuhn and Finley had been at odds since Day One. They were polar opposites in nearly every manner. When it came to their relationship over baseball business, Kuhn had reprimanded Finley on more than one occasion. Such had been their relationship.
When Finley and Kuhn met face-to-face over the fire sale, the A's owner started off on the commissioner. "Don't butt into this," Finley said. He then went into a long diatribe about how free agency and poor attendance were killing any chances for the A's to be competitive. By the end of the conversation, nothing had swayed Kuhn on the matter.
The next day, Kuhn forbid the Yankees and the Red Sox from playing their newly acquired players. Allowing them to play would send a signal that pennants could be bought outright, and that was something that would create a travesty of the game. Kuhn ruled that the sales be voided.
Finley went off the handle. He called Kuhn, "the village idiot." He then ramped that up to "the nation's idiot," and finally, "his honor, the idiot in charge."
Finley bows out
Charlie never got the memo. He continued to unload players, but was at least wise enough to not do wholesale transactions. He got his front office staff down to six. One of whom was a fourteen-year-old teenager, who was listed on the A's organizational chart as vice-president. The teen, by the name of Stanley Burrell, would grow up and break into entertainment as "M.C. Hammer."
The Lords desperately pushed to get Finley out of the Lodge. Finally, Walter Haas, Jr. arrived on the scene and offered to purchase the club in cash, to the tune of $12.75 million.
At Finley's farewell press conference, he said, "[It] is no longer a battle of wits but how much you can have on the hip. I can no longer compete."
My Ode to Charlie
As I said, I miss Charlie. I can see him with his Kelly green jacket and matching cowboy hat. He's just the thing the starched shirts need today.
Finley wasn't just some kook. On top of owning the Athletics, he owned the NHL Oakland Seals for a bit, another team I grew up loving while watching the likes of Carol Vadnais and Gary Smith. He owned the Memphis Pros, of the American Basketball Association at one point. The idea of using orange balls at night was actually tried in several exhibition games. He toyed with the "designated runner" and hired a sprinter exclusively for the purpose of pinch running and stealing bases.
Yes, this is my ode to Charlie O. May the baseball gods, once again, have mercy on my soul.
Update(01/05/06)
Sources:
Lords of the Realm - John Helyar
A Whole Different Game - Marvin Miller
Numerous newspaper articles culled from ProQuest
Wikipedia
Baseball-Reference
Maury Brown is the co-chair of SABR's business of baseball committee, and the editor of Business of Baseball.com. He's currently a staff writer for The Hardball Times, and pesters another Portland, OR resident, Rob Neyer, far too much for the use of his research library. He's been sourced for commentary and analysis by the Boston Globe, CNN/Money, Toronto Globe and Mail, Los Angeles Times, Pittsburgh Post Gazette, San Jose Mercury News, and Oregonian.
| Designated Hitter | December 29, 2005 |
Ode to the Crazy Maverick, Finley
I miss Charlie Finley.
There, I said it.
He was vile. He was vulgar. He was a loose cannon. He was reckless. He was brilliant. He was a great evaluator of talent. And, he could throw that talent away if he wanted to make a buck. He was, as Marvin Miller said, "One part P.T. Barnum and one part George Steinbrenner."
May the baseball gods have mercy on my soul. May Bowie Kuhn put a pox upon my house. May the Lords of Baseball shout, "Bow ye down, as we show you no mercy!"
Yes, I have sinned. Yes, I miss Charles Oscar Finley.
I grew up in the Bay Area taking in the Giants at Candlestick with Mays, and Marichal, and McCovey, and Spahn, and both the Alous -- Matty and Jesus. Pardon me as I rub my hands together as I try to warm my still cold hands from those trips.
Then Finley arrived with the A's and that changed everything.
The drive was shorter, the tickets cheaper, and the ballpark warmer. These things, of course, meant nothing to a kid. What mattered to me were the names on the roster. Names with the likes of "Blue Moon," "Catfish," "Monday," "Blue," "Rudi," "Tenace" and "Fingers." The real and the fabricated names blurred in my mind. Those were all their God-given names, as far as I knew. I saw the bright white, yellow and green uniforms as something that matched the times. The white shoes were something that made my team stand out from the drabness that permeated the other clubs. They all looked like cold damp mildew by comparison. Ostentatiousness be damned, I loved them.
I also loved the promotions. The yellow and orange balls that were given away. Why not use them for night games? The possibilities were not yet stomped down in a kid's mind due to my limited understanding of how the Lords of baseball worked.
Most of all, I loved Harvey. Harvey was the mechanical rabbit that popped up out of the ground behind home plate to deliver the umpire fresh balls for the games. It was a magical time to be a kid at the Oakland Coliseum.
Is it any wonder I chose to follow the business end of baseball as I grew up? Is it any wonder I have that solid dose of pretzel logic required to keep any man from going insane when tackling the "upside-down is right-side up" world of the MLB front office? I can blame it all on Charlie. That crazy maverick, Finley.
A salesman, a maverick, and "disreputable character" is born
Charles Oscar Finley was born to sell. As a child growing up in Birmingham, Alabama, a young Charlie once won a medal and a bicycle for selling 12,500 subscriptions to the Saturday Evening Post. He loved baseball. He had been a batboy for the Birmingham Barons and played semi-pro ball in his youth. After his dad had been transferred to Gary, Indiana, he followed in his father's footsteps and went to work at US Steel after his graduation from high school. Not content with this life, he sold life insurance on the side. He set the company sales record for policy sales in his first year.
Finley was also unstable physically. He worked himself to the bone, contracted tuberculosis, and spent time in a sanitarium. In classic Finley form, he had broken sales records for life insurance, but he had neglected to take out a policy on himself.
While recovering from his illness in the hospital, Finley had an epiphany: doctors. Sell insurance to doctors. He developed an insurance plan for those in the medical industry. By the time the '40s had waxed into the '50s, Finley was a multimillionaire and set his eyes back on baseball -- and big-league baseball, to be more specific.
Finley made a run at purchasing the Philadelphia Athletics in 1954, but got beat out by Arnold Johnson. Then he went after the White Sox unsuccessfully. Undaunted, he went after the expansion Angels, even to the point of trying to lure Roy Rogers into the ownership group to offset Gene Autry's bid. But, he lost on that deal as well.
Then the unexpected happened. Arnold Johnson dropped dead. Finley leapt at the chance by offering up $2 million to Johnson's widow for the 52% stake in the Athletics. The owners sent Orioles chairman Joe Iglehart to check Finley out. His report to the Lords was, "Under no conditions should this person be allowed into our league."
There was a slight problem. No one -- no one but Finley, it seemed -- wanted to own the Athletics. Reluctantly, the owners approved the sale on December 19, 1960. Charlie O' had prevailed.
Finley turns the Athletics upside down in Kansas City
Finley set right off into turning the baseball establishment on its proverbial ear. He immediately went to work painting sections of Kansas City Municipal Stadium in colors that would have made the rainbow blush -- everything from citrus yellow to turquoise to an eye-shattering florescent pink for the foul poles. Not content with this, he went with the uniform colors in kelly green, "Fort Knox gold," "wedding gown white" and shoes that were white "kangaroo albino" graced the players.
Charlie then decided to become the P.T. Barnum of the baseball establishment. He opened a zoo beyond the right-field fence with livestock ranging from sheep to monkeys to rabbits. The prized livestock addition was the new team mascot, a donkey he named Charlie O.
Finley did theme days to try and drum up attendance. Everything from Farmers' Day, in which an embarrassed Diego Segui was delivered to the mound by hay wagon, to Shriner nights and "Bald-headed men" night.
All of this did absolutely nothing to increase attendance. Finley decided that maybe greener pastures would be available elsewhere. He started not so quietly shopping the idea of moving the A's. He tried moving the team to Dallas-Ft. Worth (voted down by he owners 9-1). He actually signed a contract with the state of Kentucky to move the club to Louisville for the '64 and '65 seasons. The vote to approve that move failed 9-1.
Finley remained undaunted. He attempted six weeks later to move the club to Oakland. That move failed by a 9-1 vote, as well. He seemed driven to relocate to anywhere to get out of, as he privately said, "this horseshit town" of Kansas City. He wasn't opposed to promoting the A's and, more importantly, himself, outside of Kansas City. He shocked the Lords, when he announced that it was his intention to do a tour in 1965 of every American League city with his mascot, Charlie O. They traveled in a special trailer that was, as the AP reported it, a "plush, air-conditioned, radio equipped trailer," complete with an itinerary of stops. April 21: Detroit. April 25: Cleveland. April 28: Chicago. New York, Baltimore, Boston, Washington and Los Angeles rounded out the tour.
The Lords proceeded to ignore Finley when he got in the trenches and did actual business with his fellow owners. This reaction infuriated Finley who thought that the other owners failed to see his genius.
And he was a genius -- if not in reality, at least it was so in Charlie's mind. He had hired Frank Lane as GM of the Athletics when he purchased the Club, and had Joe Gordon as manager. Gordon and Finley clashed. Gordon was shown the door in June of '61. Finley then canned Lane in August. He replaced the latter with F.P. Friday, one who had never worked in baseball, but rather in another area Finley was familiar with: insurance. As the Kansas City Star wrote, "Never has there been a baseball operation so bizarre, so impossible, so incredulous. If an ownership had made a deliberate attempt to sabotage a baseball operation, it could not have succeeded as well."
While other clubs had moved forward with full-time General Managers, Finley continued to work relentlessly scouting, signing and trading players. This, of course, went against the tenet of the old guard, which was to sit back and let others work for you. When John Fetzer of the Tigers approached Finley about hiring a GM, he replied, "When the day comes that I find a GM that can do a better job than Charlie O, I'll hire the son-of-a-gun."
Finley moves the A's to Oakland
Finally, on October 18, 1967 the American League gave in and granted Finley the right to move the Athletics to Oakland for the 1968 season. Senator William Stuart Symington said from the floor of the Missouri Senate, that Finley was "one of the most disreputable characters ever to enter the American sports scene," and said Oakland was "the luckiest city since Hiroshima."
Once the team moved to Oakland, Finley continued to work his magic in terms of PR by hiring Joe DiMaggio as executive VP of the A's in March of 1968. The Yankee Clipper understood how things would be with Charlie. "I'm not exactly the executive type," DiMaggio said. "Only one man makes decisions for this firm, Charlie Finley."
Lane and Finley's signings started to pay dividends. The franchise went from 62-99 in 1967 in KC, to 82-80 for the '68 season in Oakland. And while the attendance didn't look much different than it had in Kansas City, the winning became contagious.
In 1971 they won the AL West, but got swept by the Orioles in 3 games during the AL Championship. In '72, they didn't falter, beating the Reds 4-3 in the World Series.
Dick Williams, the manager of the A's at the time, was recently interviewed by Jeff Angus about that World Series, and a particularly interesting tale involving a suitcase. The team was in Cincinnati and there's this suitcase that came with the team but they can't figure out who it belongs to. No one claims it, and it's really locked up. So a couple of clubhouse guys take it out on the field to try to open it. No luck. Finally, they decide to use a gun. With the suitcase now open, the contents were revealed. It was filled with Charlie's shoes. One suitcase for nothing but shoes. It was pure Finley.
In 1973 they repeated as World Series Champions...and again in '74. The players became stars, and the stars wanted more money. Finley, being Finley, danced around the details of following through with some of those contract agreements. In 1974, however, Finley would meet the enemy, and the enemy was him.
Update(01/05/06)
Sources:
Lords of the Realm - John Helyar
A Whole Different Game - Marvin Miller
Numerous newspaper articles culled from ProQuest
Wikipedia
Baseball-Reference
[Editor's note: Be sure to return tomorrow for Part Two of the "Ode to the Crazy Maverick, Finley."]
Maury Brown is the co-chair of SABR's business of baseball committee, and the editor of Business of Baseball.com. He's currently a staff writer for The Hardball Times, and pesters another Portland, OR resident, Rob Neyer, far too much for the use of his research library. He's been sourced for commentary and analysis by the Boston Globe, CNN/Money, Toronto Globe and Mail, Los Angeles Times, Pittsburgh Post Gazette, San Jose Mercury News, and Oregonian.
[Additional reader comments and retorts at Baseball Primer.]
| Designated Hitter | December 22, 2005 |
A Long Time Ago In A Galaxy Far Away. . .
One of the great oddities in baseball is how we perceive players. If a player does one or two things spectacularly well, he ultimately ends up being better regarded than players who do a lot of things well. Of recent vintage was 1998 and 1999 when home run behemoths Mark McGwire and Sammy Sosa got all the ink over players like Barry Bonds and Ken Griffey Jr. Earlier in the decade in Canada RBI man Joe Carter had a higher profile than Larry Walker. Or, if you wish to go back to the 1970's and 1980's, you'll find more casual fans have heard of Dave Kingman over Dwight Evans.
For that matter, don't you find it odd that Tim Salmon never went to an All-Star Game? Not one.
Bill James said in his book Whatever Happened To The Hall of Fame--The Politics Of Glory that players who do one or two things well tend to be overrated while those who do a lot of things well tend to be underrated.
Today we're going to talk about an historically underrated player. He didn't have one ability that defined him but didn't have a single hole in his game: he could hit, hit with power, run, field and throw. Baseball-Reference has tests that involve Black Ink and Gray Ink. Black Ink describes how often a player led the league in some statistical category; Gray Ink describes how many times he finished top ten in the league. This player has two points of black ink but 161 points of gray ink.
In other words, he was never the best, but consistently among the best.
We're talking about Robert Lee "Indian Bob" Johnson.
Johnson was born in Oklahoma in 1906, and his family soon moved to Tacoma, Washington. He left home in 1922 at age 15 and began his baseball career with the Los Angeles Fire Department team. Because Johnson was part Cherokee, he was subjected to the nickname "Indian Bob," just as other players of Native American ancestry had similar epithets foisted upon them in this era.
Johnson was soon playing semi-professional ball. When his brother, Roy Johnson, became a professional, he felt buoyed. He said, "When Roy became a regular with San Francisco in 1927 I knew I could make the grade in fast company. I had played ball with Roy and felt I was as good as he was."
However, Johnson failed trials with San Francisco, Hollywood, and Los Angeles. He did not play professionally until Wichita of the Western League signed him in 1929. Johnson played in 145 games at two levels and batted .262 with 21 HR while slugging .503. After again hitting 21 HR (in just over 500 AB) the following season in Portland, he went to spring training with the Philadelphia A's but didn't make the roster due to his inability to hit the curveball. Over the next two seasons in the minors, Johnson batted a combined .334 with 51 HR while slugging .567 and showing both patience at the plate and a powerful throwing arm in the outfield.
Opportunity knocked in 1933 as Connie Mack sold off veteran Al Simmons to the White Sox leaving Johnson and Lou Finney to battle for the leftfield job in spring training. Johnson won the job and had an excellent freshman season at age 27...
 AVG/ OBP/ SLG  Runs 2B 3B HR RBI OPS+ RCAA
.290/.387/.505  103  44  4 21  93  134   37
...and was generally considered the league's finest rookie.
Johnson would quickly prove that 1934 was no fluke. On June 16th, the A's and White Sox played a twin bill. After losing the opener 9-7, the A's come back to win game two 7-6. Johnson went 6-for-6 with two home runs (both off Whit Wyatt), a double, and three singles. Four days later, he hit his 20th round tripper of the season against the Browns giving him the league lead (he finish fourth). He also enjoyed a 26-game hitting streak. After two fine seasons, Johnson was beginning to get recognition as he was named the starting left fielder of the American League All Star team in 1935. Johnson also finished fourth in the loop in home runs for the third time in his first three seasons and enjoyed his first 100 run/100 RBI season (he had topped 100 runs in both 1933 and 1934).
Despite turning 30 in 1936, Johnson kept right on raking and showed a little extra speed on the base paths, hitting a career high 14 triples. In both 1936 and 1937, he ripped 25 HR driving in 100+ runs despite not getting 500 AB in '37; of interest, on August 29 he again victimized the White Sox in a doubleheader as the A's set a new AL record in the opener of a twin bill by scoring 12 runs in the opening frame, six of which were driven in by Johnson. After four years in the majors, other aspects of Johnson were becoming known around the league. Johnson was a bit of a practical joker, and it was in 1937 when Yankees' HOF second baseman Tony Lazzeri pulled a prank on him, knowing he would probably appreciate the joke.
Lazzeri doctored a ball over the course of two weeks by pounding it with a bat, soaking it in soapy water, and rubbing it extensively with dirt and finally coating it with white shoe polish to make it look like new. Bill James described it as a ball that was "as dead as Abe Lincoln." It was so heavy and lifeless that it would plop down harmlessly once struck with a bat.
Lazzeri sprang his joke on September 29 long after the Yanks had clinched the pennant. During an inning in which Johnson was due to bat, he ran out to second base with the gag ball in his pocket. When Johnson stepped into the batter's box, he trotted out to the mound and switched balls with Yankee southpaw Kemp Wicker. Wicker grooved Lazzeri's "mushball" down the pipe and Johnson took a mighty cut and hit it on the screws. However, rather than hitting a prodigious moonshot, the ball plopped harmlessly foul behind the plate while a perplexed Johnson stood there wondering just what the hell happened while the other players and the crowd burst into laughter.
Johnson continued to get better as he aged as he put together his best two seasons at 32 and 33, topping 110 runs/RBI both years while batting at least .300/.400/.500. On June 12, 1938, Johnson was a one-man wrecking crew against the St. Louis Browns, hitting three bombs (and a single) and driving in all eight runs.
1938 and 1939
 AVG/ OBP/ SLG  Runs  2B 3B HR RBI OPS+ RCAA
.325/.422/.553  229   57 18 53 127  146   95
Johnson was also developing the reputation of being an athletic fielder. He lead the AL in assists twice (in The New Bill James Historical Baseball Abstract, the best outfield arm of the 1940's is said to be either Johnson or Dom DiMaggio and he was also 4th all-time in outfield assists per 1000 innings) and also filled in occasionally at second and third base (poorly it should be added). He was named to the AL All-Star team both years.
Johnson finally began to show the effects of age during his age 34 and 35 seasons and started to lose some bat speed. Connie Mack even felt the need to give his star slugger time off from covering the expansive left field pasture at Shibe Park, playing him 28 games at first base in 1941. He still had power and a sharp batting eye and remained a potent RBI man, topping 100 RBI in both 1940 and 1941--the latter his seventh straight season over the century mark.
Johnson's power started to wane in 1942 as he suffered through his worst season statistically to that point in time, failing to hit 20 HR or 90 RBI for the first time in his career. However, part of this was attributable to the fall of offense across the board due largely to players enlisting in the military for WWII. His OBP and SLG marks were still good for top 10 finishes in the Junior Circuit and good for fifth in MVP voting. After continually clashing with Mack over pay, the manager finally said goodbye, sending him to the Washington Senators for third sacker Bob Estalella and Jimmy Pofahl. Baseball Almanac notes that this was the only time in baseball history where a player who led his team in RBI for seven straight years was traded.
Johnson lasted one year with the Senators where age and huge Griffith Stadium all but neutered his power as he slugged a career low .400, and for the first and only time in his career he failed to hit at least 10 home runs (7). He was sold to the Boston Red Sox by Griffith who later regretted the move. The diluted war-time talent in the majors coupled with Fenway Park's hospitable climate for right-handed hitters allowed Johnson to finish out his major league career in style. In a season which either spoke highly of Johnson's ability at age 38 or spoke poorly of the level of war-time talent left in the majors by 1944--*cough* Browns win the pennant...Browns win the pennant *cough*--Johnson enjoyed his finest statistical season (including hitting for the cycle on July 6):
 AVG/ OBP/ SLG  Runs  2B 3B HR RBI OPS+ RCAA
.324/.431/.528   106  40  8 17 106  174   61
Still, a lot of other fine players also played through the war years including HOFers Paul Waner, Chuck Klein, and Joe Medwick and didn't play as well as Johnson. Further, he was able to play 142 games in left field and enjoyed his first season on a team .500 or better since his rookie year as the Red Sox finished 77-77. For his efforts he was named to his seventh All Star team and finished 10th in MVP voting. As World War Two dragged on to 1945, Johnson was able to enjoy one last moment in the major league sun. He played 140 games in left field and provided the Red Sox with 82 runs created (AL left fielders averaged 67 RC in 1945), which earned him his eighth and final All Star nod. With the war over, Johnson pushing 40, and the return of Ted Williams, the Red Sox and Johnson parted company and he continued his career with the Milwaukee Brewers in the American Association.
Despite his advanced athletic age, Johnson managed to hit .270 with 13 HR and a .456 SLG in 94 games. He moved on to Seattle of the Pacific Coast League for the next two years, batting .292 with 35 doubles, 12 HR and a .441 SLG in 487 AB. Johnson, now 44, went home to play for and manage the Tacoma Tigers in the Western International League where he wielded a potent bat, hitting .326 with 13 doubles, five homers and a .463 SLG in 218 AB. He didn't play in 1950 but resurfaced briefly in Tijuana the following year at age 46. Johnson batted .217 in 21 games, then hung up his spikes for good.
So how do we measure Johnson's career? He probably missed being a Hall of Famer by a whisker. Johnson was hurt perceptually due to playing on second-division teams never reaching the World Series or even coming particularly close to one. He was also overshadowed by all-time great outfielders like Joe DiMaggio and Williams. Further, he finished his career during the second World War. Also working against him was his consistently high level of play; his OPS+ never going higher than 174 or dropping below 125 and always provided above-average offense for his position. He never had an eye-popping, jaw-dropping season that nets players MVP awards. He is also perceived by many to be the equivalent of the Phillies fine outfielder of the 1940's and 1950's, Del Ennis.
In short, he was invisible.
However, when we examine his record, he fits right in with four contemporary outfielders who are in the Hall of Fame and three of whom--like Johnson--finished their careers during WWII: Earl Averill, Klein, Medwick, and Paul Waner.
Player              AVG   OBP   SLG Runs   HR  RBI  OPS+ RCAA*
Bob Johnson        .296  .393  .506 1239  288 1283   138  413
Earl Averill       .318  .395  .533 1224  238 1164   133  391
Chuck Klein        .320  .379  .543 1168  300 1201   137  409
Paul Waner         .333  .404  .473 1190  139  957   134  588**
Joe Medwick        .324  .362  .505 1198  205 1383   134  368
Del Ennis          .284  .340  .472  985  288 1284   117  145
* Runs Created Above Average is a counting stat
**Waner's career length is the longest of the six players
As mentioned, a lot of folks dismiss Johnson's achievements because of a superficial statistical similarity to Del Ennis. I threw Ennis in here to show that he's not at all comparable to the above group. His HR/RBI totals are similar but he's last in AVG/OBP/SLG, runs, OPS+ and RCAA. The difference between Johnson and Ennis' respective levels are about the same as Rusty Greer (120 OPS+/149 RCAA) and Chipper Jones (141 OPS+/429 RCAA); nobody suggests that Greer and Jones are similar as hitters. In the chart above, we can see how close Johnson's level of play was to Hall of Fame quality. His eight All Star selections reflects the high regard contemporaries viewed Johnson. After Al Simmons was sold to the White Sox, Johnson all but became the Athletics offense. During his ten years with the A's, the team created 7612 runs. Johnson was responsible for 1162 (15.26%). The roster over that ten years were -420 RCAA while Johnson had 317 RCAA.
Although never topping statistical lists, Johnson was consistently among the leaders. From the period 1930-50, Johnson was tied for second in doubles (396), eighth in triples (95), third in home runs (288), third in runs (1239), second in RBI (1283), sixth in OBP (.393), sixth in SLG (.506), and fifth in OPS (.899). Here are the top ten finishers in RCAA (totals accumulated before 1930 and after 1950 are not counted):
1.    Ted Williams                908
2.    Joe DiMaggio                695
3.    Babe Ruth                   460
4.    Bob Johnson                 413
5.    Charlie Keller              394
6.    Earl Averill                356
7.    Tommy Henrich               274
8.    Jeff Heath                  261
9.    Al Simmons                  250
10.   Roy Cullenbine              215
Johnson's RCAA is 73rd all time. When you consider that, along with being a fine fielder with a terrific throwing arm, you begin to appreciate the complete package that was Robert Lee "Indian Bob" Johnson. Truly an All Star in the fullest sense of the word and an unappreciated talent. When you look back at some of the superb players to grace the diamond in the 1930's and 1940's, don't forget about the man that patrolled left field at Shibe Park for a decade.
John Brattain writes for The Hardball Times and his work has been featured at About.com, MLBtalk, Yankees.com, Replacement Level Yankee Weblog, TOTK.com, Bootleg Sports, and Baseball Prospectus.
[Additional reader comments and retorts at Baseball Primer.]
| Designated Hitter | December 17, 2005 |
The Case for Bert Blyleven: A Late Convert Joins the Flock
So I was staring at the big-lettered flyer that landed in my mailbox this week, screaming at me -- Hall of Fame voter, and the target of a 37-cent propaganda campaign courtesy of BertBelongs.com.
I could almost feel the spittle on my face.
"You have another chance to put Bert Blyleven in the Hall of Fame. Don't whiff!"
Unsure whether I was supposed to feel threatened or guilty, I respectfully placed the postcard in the trash, right next to the Rite Aid coupons. It was only then I noticed the flip-side of the mailing, which reminded me that only five pitchers had ever totaled more than 3700 strikeouts.
Now I really felt guilty. Thirty seven hundred? I didn't know that. Or, if I did, I made it a runner-up to what I considered a more compelling Cooperstown stat -- won-loss record, which in Blyleven's case was never good enough to get my vote. I wrote off his achievements to longevity, not necessarily excellence and tried to keep my conscience quiet.
The problem, of course, is that no one tells writers how to judge a Cooperstown beauty pageant. The task is even more difficult when you're asked to assess a career you've only marginally covered. I was in high school when Blyleven registered his only 20-win season in 1973. When Blyleven's career intersected mine in the mid-80s, we still never actually crossed paths: I was covering the Mets for the New York Post, while he was busy racking up wins in the American League.
If it was only arithmetic, filling out a Cooperstown ballot would be stress-free, guilt-free and far less controversial. But which numbers do you pick? And even if you decide that, say, strikeouts are more important than winning percentage, many believe stats by themselves are a weak, if not cowardly, way to avoid thinking through the election.
It was Dick Young who told me in my rookie year at the Post, "choosing a Hall of Famer is like voting for president. You'll just know who the right guy is."
That kind of over-simplified logic is what made Young a tabloid hero but otherwise a brutally narrow-minded man. Mike Marley, who used to cover boxing for the Post, summed up Young thusly: "Frequently wrong, never in doubt."
I didn't want to end up like Young, mean and inflexible. So I rescued the flier from the trash and decided it was time to re-think Blyleven. But instead of crunching numbers, I summoned a few ghosts from the Seventies and early Eighties, the ones who actually remember Blyleven in the flesh, not just through BaseballReference.com.
I spoke to Henry Hecht, who covered the Yankees in the Billy Martin era and preceded me at the Post. I asked if he would vote for Blyleven.
"Absolutely not," Hecht said. "He was never a dominant pitcher. He won 20 games just one time. How many games over .500 did he finish? Thirty seven or eight? Tommy John finished 57 over and I couldn't vote him. Tommy was my friend and it broke my heart to tell him, but I couldn't give him my vote. So why would I vote for Blyleven?"
I hung up looking for a more profound summary of Blyleven's numbers. Hecht was statistically correct about the right-hander's 287-250 record, but it was also true that Blyleven's ERA was as good or lower than the league average in 17 of his first 18 seasons. Numbers don't lie, Hecht said, but it sure depends on which number you let whisper in your ear.
Maybe it wasn't Blyleven's fault that he didn't win more often. As blessed as he was with that monstrous curveball, Blyleven was clearly cursed by being in the wrong place at the wrong time, like in 1984 when he won 19 games for an Indians team that finished sixth in the East. Or in 1986, when he won 17 games for the Twins, who finished 21 games out of first place.
If Blyleven had pitched for the Mets that year instead of Minnesota, he might've won 25 games and inched ever closer to the holy grail, 300 for his career. What was it that made him so tough to hit? What made him so special? It was that curveball, obviously. I remember its huge, looping trajectory, wondering how the hell he gripped that pitch and generated so much spin.
Finally, it dawned on me: Blyleven was a Hall of Famer not just because of his 3701 strikeouts or 287 wins or a 2.47 ERA in the post-season. It was the uniqueness of his best weapon, the curveball, that set him apart. All the great ones manage to put a singular mark on the game. Sandy Koufax had what old-timers called the greatest lefthanded curveball of the last 50 years. Steve Carlton had that untouchable slider. Nolan Ryan had the heat, even until the end. Mariano Rivera has the meanest cut-fastball a pitcher of any age could ever hope for.
Lucky for me I'm able to write about Rivera's killer pitch up-close -- indeed, ask him how it's thrown.
"Loose wrist, plenty of spin," he said. "It's easy, bro."
It's not, of course. Rivera has a gift so few pitchers possess: that long, loosed-armed delivery which gives him incredible whip-like action with every cut-fastball. David Cone used to call Rivera "Inspector Gadget" because of the way his arm seemed to extend upon release of the ball.
I never had the chance to break down Blyleven's mechanics, so I called another star from that era, to ask for a scouting reported. When I reached Goose Gossage, he was driving on a Colorado interstate, happy to talk about a pitch that was still freshly imprinted in his memory bank.
"Oh my God, that fucking curveball was unreal," Gossage said. "People used to talked about (Dwight) Gooden's hook, I swear Blyleven's was better. I've never seen anything like it -- then or now. You know the expression, 'dropping off the table?' That's what his curveball was like. It just disappeared. And the thing is, he threw it hard, then he'd blow that fastball right by you up in the strike zone. Guys had no chance."
So when I asked Gossage if he thought Blyleven deserved to be in the Hall, I could almost see his eyebrows flexing, as if to ask: are you kidding me?
"Hell, yes," Goose said. "Dominant pitcher, great pitcher. He's one of the guys I don't understand why they haven't made it yet. (Andre) Dawson, (Jim) Rice...that guy intimidated the shit out of every pitcher. He made that whole (Red Sox) lineup tougher. No one ever intimidated me, but I'll be honest, Jim got my attention."
Goose hung up, but not before we promised to run into each other at some point in 2006.
Yankees' spring training maybe -- or, I said respectfully, at the induction ceremony in Cooperstown.
"Ah, we'll see," Gossage said. "But if you're going to cover it, tell Bert I said hello. I'm hoping he makes it."
He's at least one vote closer today.
Bob Klapisch covers baseball in New York for The Bergen Record and ESPN.com. He's been a Hall of Fame voter since 1995 and says: yes on Gossage, no on Mattingly and yes on Pete Rose...the day after he passes away.
[Additional reader comments and retorts at Baseball Primer.]
| Designated Hitter | December 15, 2005 |
Pride and Prejudice
It's not that I'm looking for a reason to change my mind about my National Baseball Hall of Fame selections (because I'm not). But fan reaction -- or the lack thereof -- has helped me realize that I made the right decision by a) not voting for Bruce Sutter, Lee Smith or Jim Rice, and b) continuing to vote for Bert Blyleven after leaving him off my first ballot.
In three years since becoming a Hall of Fame voter, I have not received one e-mail, letter or phone call in support of Sutter, Smith or Rice -- not one. And it's not like I've kept my opinions a secret.
Within 48 hours of going public with my first ballot in 2003, however, I was contacted by a hearty group of Blyleven supporters who made such an impressive case for his inclusion that I vowed then that Blyleven would get my vote every year until he made it to Cooperstown.
That support has not waned.
Make whatever derogatory remark you want -- Blyleven's numbers are based on longevity, he never won a Cy Young Award, he was known for his curveball and nothing more -- the case is strong and clear cut.
Bert Blyleven belongs in the Hall of Fame.
Forget his name for a moment. Most Hall of Fame voters who are down on Blyleven will turn off their hearing aids at the least mention of him anyway. Just answer this question honestly: If I told you that only one pitcher in the history of baseball (Nolan Ryan) ranks higher than "Pitcher X" in all three of the following categories -- wins, strikeouts and shutouts -- would you put "Pitcher X" in the Hall of Fame?
If you answered "no," then it's time to reserve your room in the psychiatric ward.
I am convinced that Hall of Fame voters don't vote for Bert Blyleven because his name is Bert Blyleven. What other legitimate reason can there be? Every other argument is secondary to the facts.
Tom Seaver, Steve Carlton, Gaylord Perry, Fergie Jenkins, Robin Roberts, Don Sutton, Early Wynn and Phil Niekro are all in the Hall of Fame, and their average stats are nearly identical to Blyleven's. In the Dutchman's 4,970 innings (that's four innings more than the group average), he allowed 91 more hits and 30 more earned runs, but he struck out 438 more batters, allowed 107 fewer walks and coughed up four fewer home runs -- which is ironic because one of the big knocks on Blyleven is he allowed too many round-trippers.
So you're going to deny a guy enshrinement because he gave up one more hit every 55 innings and one more earned run every 166 innings than those other eight Hall of Famers did (on average)?
That's weak -- and unfair.
Throw in the fact that Blyleven won two World Series championships with the 1979 Pirates and 1987 Twins while fashioning a 5-1 W-L record and a 2.47 ERA in postseason play and the case is even more clear.
It's time for Hall of Fame voters to put their stubborness aside and swallow their pride. If you didn't vote for Blyleven in the past, you've been making a mistake.
I know. I made the same one.
But only once.
Jeff Peek writes for the Traverse City (Mich.) Record-Eagle and has been a member of the Baseball Writers Association of America (Detroit chapter) for 13 years. He drives farther to cover his team, the Detroit Tigers, than any other member of the BBWAA -- 240 miles, each way. This is his third year as voter for the National Baseball Hall of Fame.
[Additional reader comments and retorts at Baseball Primer.]
| Designated Hitter | December 14, 2005 |
Bert and Warren: A Comparison Worth Making
Over at the inestimable Baseball-Reference.com, if you level your gaze at Bert Blyleven's list of top ten most similar pitchers, here's what you'll find (with precise similarity scores in parentheses):
 1. Don Sutton (914)
 2. Gaylord Perry (909)
 3. Fergie Jenkins (890)
 4. Tommy John (889)
 5. Robin Roberts (876)
 6. Tom Seaver (864)
 7. Jim Kaat (854)
 8. Early Wynn (844)
 9. Phil Niekro (844)
10. Steve Carlton (840)
As you can see, peppering Blyleven's particular litany are eight Hall of Famers (Tommy John and Jim Kaat being the only exceptions). Suffice it to say, those are some impressive fellow travelers. However, one player not on Blyleven's list of similars who perhaps should be is Warren Spahn--the winningest left-hander in the annals of the game.
Superficially, there's not much linking these two. Spahn was a port-sider who relied on his heater until a knee injury forced him to develop a screwball, which became his out pitch over the latter half of his career. He retired following the 1965 season. The right-handed Blyleven, meanwhile, was a curveball specialist who pitched into the 1990s. More to the point, Spahn was voted in to the Hall of Fame in his first year of eligibility, and Blyleven was named by only 40.9 percent of voters in his eighth year on the ballot. They were different pitchers in different eras with different styles and, bizarrely enough, divergent reputations. Still and yet, these two hurlers share remarkably similar statistical profiles--provided you look at the right numbers.
You won't find Spahn on the list above because similarity scores, for the most part, rely on rank-and-file measures like wins, losses, winning percentage, unadjusted ERA, games pitched, innings, hits allowed, etc. However, if we rely on the more evocative pitching metrics, we find the two hurlers to be cut from an almost identical cloth. Consider these career comparisons:
                            Blyleven	          Spahn
Innings                      4,970.0          5,243.2
ERA+                           118              118
H/9 vs. League Avg.             95               93
K/9 vs. League Avg.            128               95
BB/9 vs. League Avg.            73               73
HR/9 vs. League Avg.            97               87
This table shows us that Spahn bested Blyleven in innings (narrowly considering the length of their careers), league-adjusted H/9 (narrowly again), league-adjusted HR/9 (semi-comfortably, although considering all the hand wringing over Blyleven's homer proclivities, it might surprise some to see that he was better than the league mean in this regard), while Blyleven was superior in league-adjusted K/9 (by a country mile or so). The two pitchers were roughly equal in park- and league-adjusted ERA and in league-adjusted BB/9. Considering the gaping divide between their fates--Spahn a pantheon-dwelling treasure, Blyleven forced to dither unjustly on the margins of very-goodness--you'd expect more of a statistical disconnect. Yet there's no such thing.
The difference, of course, is wins--the hoary, useless measure of pitching performance that's obsessed those of mainstream inclinations since the days of the trilobites. Spahn has 363 of them, good for sixth place on the all-time list, while Blyleven ranks "only" 25th with 287. There's a reason for this, and it's probably a patently obvious one to regular readers of a site as heady as this one: run support.
By using "neutral wins" (NW) and "neutral losses" (NL) we can assess what a pitcher's record would've been had he been graced (or burdened, as the case may be), over the same number of decisions, with league-average run support. Thanks to the efforts of Lee Sinins and his straight-from-heaven Sabermetric Encyclopedia, we have the career NW and NL numbers for Blyleven and Spahn:
                         Blyleven	              Spahn
Actual W-L record        287-250 (.534)	     363-245 (.597)
Neutral W-L record       313-224 (.583)	     353-255 (.581)
Without correcting for run support, Spahn quite famously has a comfortable advantage in winning percentage; however, if you recalibrate for Blyleven's generally lousy lineup compatriots, he actually outdoes Spahn in such a neutral context. At this juncture two points bear repeating: Blyleven is the equal of Spahn--the board-certified, inner-circle Hall of Famer--in terms of park- and league-adjusted ERA, and he bests him in winning percentage once league-average run support is ascribed to both hurlers. Why there's any sort of debate over Blyleven's Cooperstown bona fides is truly a mystery. But let's carry on . . .
It's no longer elusive knowledge that ERA is a sub-optimal way to evaluate pitchers. ERA and, by extension, earned and unearned runs aren't as laughably bootless as, say, RBI or the previously sullied pitcher wins and losses, but they're still fraught with inadequacies. Those shortcomings likely don't need rehashing with this audience, so let's leave it at this: runs-per-game is a better performance measure. That's mostly because runs-per-game (R/G) leaves out the inanities involved in scoring errors and isn't soiled by the overly forgiving nature of the unearned run rule.
                            Blyleven           Spahn
Career R/G                    3.67	           3.46
Career R/G vs. Lg. Avg.        90                80
This is a fairly clear advantage for Spahn. Both were comfortably better than the league average, but Spahn betters Blyleven by ten percent in league-adjusted R/G, which reflects the fact that Spahn, generally speaking, pitched in a more offensive environment. Of course, there's also the matter of park effects.
While park tendencies are reflected in ERA+, they're not in the other semi-sophisticated measures you'll find above, including league-adjusted R/G. Insofar as this particular comparison is concerned, it's vital that we explore the parks these two toiled in for their careers. Summarily speaking, Blyleven had a substantially tougher go of it. For his career, Blyleven's home parks had an average factor of 102.0, and in only two seasons did he pitch in a ballpark that favored the pitcher. In stark contrast, Spahn's home parks had an average factor of 94.5, which indicates, on balance, a strong tendency toward run suppression, and in all but three of his 21 full seasons in the majors his parks favored the pitcher. That's a healthy dose of disparity in terms of environment, and it's not reflected in many of the measures we've dealt with heretofore. So let's recast R/G after correcting for league and home digs:
                                   Blyleven       Spahn
Park-adjusted R/G                    3.63          3.56
Park-adjusted R/G vs. Lg. Avg.        89            82
Spahn still holds sway after adjusting for the foibles of home park, but the gap narrows.
Overall, Spahn worked more innings and was better at keeping the ball in the park (although that was partially by dint of his home environments) and keeping unearned runs off the board. Blyleven, on the other hand, had superior strikeout chops and fared better once run support is made part of the calculus. Blyleven also tops Spahn in career Runs Saved Above Average, 344 (17th all-time) to 319 (20th all-time).
Spahn, of course, deserves qualitative bonus points for losing up to three years of his career to military service during World War II, and he was also a better hitter and fielder than Blyleven. In the final statistical analysis, Spahn cobbled together the better career, but that there's even been a protracted discussion on the subject--who's better, Spahn or Blyleven--is telling and to Blyleven's tremendous credit.
Put another way, to suggest that Blyleven isn't a Hall of Famer is also to suggest that the quality of Spahn's Cooperstown dossier is at least contestable. Who out there is willing to say that?
Elect Bert Blyleven to the Baseball Hall of Fame.
Dayn Perry is a baseball writer for FOXSports.com and an occasional contributor to Baseball Prospectus. His forthcoming book Winners: How Good Baseball Teams Become Great Ones is available for pre-order from Amazon.com..
[Additional reader comments and retorts at Baseball Primer.]
| Designated Hitter | December 13, 2005 |
If Don Sutton Was Great . . .
Forget the Hall of Fame. Imagine that Cooperstown is best known as the home of The Farmers' Museum ("Just head north on Route 80 and you can't miss it!").
For the moment, let's just focus on this question . . . Was Bert Blyleven a great pitcher? As great as (just to name two pitchers that come to mind) Nolan Ryan and Don Sutton? Let's look at some basic stats -- and I mean basic, even-an-old-sportswriter-gets-them stats -- along with one category that's just a tiny smidge past basic...
          Wins Losses WinPct   ERA   ERA+
Sutton     324  256    .559   3.26   108
Ryan       324  292    .526   3.19   111
Blyleven   287  250    .534   3.31   118
Those 324 wins are awfully impressive, and certainly more than 287. But did you notice those next two columns, with the losses and the winning percentages? Because he lost many fewer games than Ryan, Blyleven's actually got the better winning percentage.
Considering the vagaries of ERA, theirs are virtually indistinguishable. Look at that last column, though . . . ERA+ is sort of an adjusted ERA, taking into account the twin contexts of league and home ballpark, with 100 representing an average performance, ERA-wise. And the best of this group? Bert Blyleven, and it's not really close. Considering the closeness of their career records and their actual ERA's, I think any reasonable person would have to admit that if Sutton and Ryan were great pitchers and I --can think, without trying real hard, of an organization that's decided exactly that -- then Blyleven must have been great, too. Not just great, but as great.
Let's forget Nolan Ryan for a moment, and focus on Don Sutton. Ryan gets extra credit for all the no-hitters and the ability to throw 100 miles an hour and the inability to know where his next pitch might go. Sutton, though, gets no extra credit. Ask a fan what distinguishes Don Sutton, and he'll probably say something about curly gray hair. Sutton is considered a great pitcher for one reason, and one reason only: cold, hard numbers.
So let's look at some numbers, shall we?
Yes, Sutton did win thirty-seven more games than Bert Blyleven. That's a significant number, too. But as a friend likes to point out, pitchers don't win games; teams win games. The cold, hard fact is that Sutton pitched for better teams than Blyleven did, and thus was better-supported by his teammates. Does anybody really want to argue that if their positions had been reversed throughout their careers -- that if Blyleven, for example, had spent most of his career pitching for the Dodgers -- their career records wouldn't be reversed, too?
Forget the Farmers' Museum. I'll never travel north on Route 80, because when I go to Cooperstown it's to see the Hall of Fame. Unfortunately, right now the Hall of Fame is seriously deficient, because it still does not contain a plaque containing the semi-likeness of Bert Blyleven. And this continuing sorry state of affairs is a testament to the stubbornness of the voters who can't see past their own prejudices.
Rob Neyer is a senior writer for ESPN Insider and the author of several baseball books. This essay is a revised version of one that initially appeared in Rob Neyer's Big Book of Baseball Lineups (Scribner, 2003).
[Additional reader comments and retorts at Baseball Primer.]
| Designated Hitter | December 01, 2005 |
A Bases-Loaded Walk Down Memory Lane
As a mom, it was probably inevitable that I would get sucked into the whole "Creative Memories" fad. For those of you who don't know what that is (hmmm, a baseball site populated mainly by guys, that would probably mean about 99.9 percent of you -- the married ones with kids MIGHT know what I am talking about), it's the ridiculously overpriced but unbelievably addictive "scrapbooking" trend that may currently be obscuring what used to be your dining room table (oh wait, maybe that's just me).
So I got invited to one of those parties where they had a hidden vacuum that cleaned out my wallet and left me with lots of adorable stickers and construction paper cutouts. I really had every intention of making wonderful memory books to commemorate my daughter's baby years, her first steps, teeth and report cards, her bat mitzvah, her rock band.
Instead I have what used to be a dining room with a table (I think) precariously piled with several categories of photos waiting to be enshrined.
Let's face it.
There is only one set of "scrapbooks" I can count on where I can leaf through their pages and evoke my life's memories. My walks down memory lane are the kind where the bases are loaded: boxes of baseball scorebooks.
Right now, I have a pile of them in my home study that date back as far as mid-1995 (I have another box of them in the basement). It's hard to pinpoint anything resembling a chronological order since generally, when I'm going to a game or on the road, I'll just grab whichever one is the right size for the bag I'm carrying and has a few empty pages left.
And the truth is, most people won't even recognize many of the names on most of the pages.
But I will.
Mesa vs. Scottsdale, Arizona Fall League, October 1995: I have always rooted for the underdog. And I have always had a special place in my heart for the guys who play, as I put it, with that special kind of "joy." It may be a totally meaningless game, maybe spring training, maybe mid-August when their low-A team is 30 games out of contention. But you can tell that, as Jim Bouton put it in "Ball Four," they still remember to tingle every time they step on the field.
Jason Maxwell was one of those players. A utility middle infielder originally with the Cubs, he was a 74th-round draft pick who, when he eventually made it to the majors in 1998, was the lowest-drafted player to ever reach the show (his "record" was later broken by Travis Phelps -- 89th round).
On this particular day, the Cubs had weathered a few infield injuries and so they summoned Maxwell over from instructional league camp to fill in for a few days. His energy and exuberance caught my eye immediately and for six innings I couldn't stop watching him. In the sixth inning, Billy Owens (now the director of player personnel for Oakland) hit a high pop to shortstop. Maxwell lost it in the sun and it came down and cracked his cheekbone so loudly that it was like hearing a gunshot in that empty park.
I remember seeing Maxwell lying there for what seemed like hours, twitching in pain, his fall season clearly over. I cried.
Two years later I would see Maxwell again, batting leadoff for the Iowa Cubs in the very last Triple-A American Association championship series. I would tell him my story and he'd show me the small moon-shaped scar he has right below his eye.
Buffalo Bisons vs. New Orleans Zephyrs, Games 1 and 4 of the Triple-A World Series, Las Vegas, September 1998: I scribbled the following note on the bottom of the page of Game 1, a 7-2 victory by eventual TAWS champion New Orleans: "Guess which of these two starting pitchers was out all night at the casino?"
I truly regret the demise of the three-year Triple-A World Series. And not just because it meant a few days in Vegas. Okay, so maybe just because it meant a few days in Vegas. So sue me. But honestly, that first year of the event was one of the most enjoyable weeks of my baseball-writing life and I never even bet a dollar. And this time I am serious. Headquartered at Caesar's Palace, I spent most of my time trading stories and sipping lemonade (and an occasional strawberry margarita) with some of the most interesting and insightful veteran ballplayers Triple-A had to offer (I defy anyone to talk baseball with Jeff Manto and not come away knowing so much more about the game than before you sat down).
The night I arrived, there was a welcome reception for the players, press and other "luminaries" (yes, I am kidding when I say that word). I sat for awhile chatting with New Orleans' Game 1 starter, John Halama. He sipped Coca-Cola and went to bed early. The next morning I was heading downstairs to catch some rays at the very cool Caesar's Palace pool and ran into Buffalo's Game 1 starter Jason Rakers. He was on his way UP to bed after spending all night in the casino. (This is not a knock on Rakers, who was always a terrific kid to deal with).
Linescore: Halama, W, 9 IP, 4 H, 2 R, 9 K. Rakers, L, 4 1/3 IP, 7 H, 6 R.
Quell shock.
Game 4's boxscore is notable for the three-homer game from New Orleans outfielder Lance Berkman. He'd had a meh series, but the one-man wrecking crew performance he put on in the 11-6 TAWS clincher earned him the MVP award. In fact, when he hit his third of the game in the ninth inning, the ballots had already been filled out (unofficial tally indicated that journeyman Marc Ronan would have won). When that ball left the park, the sound you heard in the pressbox was the collective ripping up of all of those ballots.
East vs. West, Midwest League All-Star Game, Lansing, Mich., June 1999: Come on, tell the truth -- when is the last time you saw 14 pitchers combine on a one-hitter? The coaching staff of the Class A league's West Division All-Stars apparently were determined that every player on the bench and in the bullpen was going to get into this game, and no pitcher was going to be overworked. The result was this unusual gem and an unsuccessful campaign by the members of the pressbox to get the entire West Division pitching staff named "MVP" of the game (Jon Schaeffer of Quad Cities, who went 2-for-3, earned the honor). Even more interesting, only one of those 14 pitchers spent 2005 in the majors: Juan Rincon of the Twins. Okay, MOST of 2005 in the majors. At least one member of the East pitching staff had better success but his All-Star status wasn't enough to earn him a spot on his club's 40-man roster the following winter and so Houston farmhand Johan Santana was shipped to Minnesota in that year's Rule 5 draft.
Surprise Scorpions vs. Grand Canyon Rafters, Arizona Fall League, Oct. 10, 2005: If there is one boxscore that can sum up why, after all these years, I am still in love with baseball, this is the one. I love that in an almost empty ballpark, in a game that is virtually meaningless, you can see something you have never seen before and may never see again.
It was my first day on a week-long road trip to Arizona. My main assignment was to catch Angels shortstop prospect Brandon Wood to interview him since I'd chosen him as our USA Today Sports Weekly 2005 Minor League Player of the Year. I was a little nervous about chatting with him in the dugout prior to the game, only because ballplayers are nothing if not superstitious. What if I broke his routine and he went 0-for-4 with four strikeouts? He might never talk to me again. But Wood was sweet and friendly and humble and when we were done, I took a seat in the shade between home and first and pulled out a lucky purple pen to score the game.
In his first at-bat, Wood lined out to second. In his second (third inning), he hit a home run to left field. In his third at-bat, in the fourth inning, he homered again, and again to left. In his fourth at-bat (fifth inning), a home run to right field. Surprise was crushing Grand Canyon across the board (they would eventually win, 20-1) and so it took me a few seconds to realize he had hit three home runs and it was only the fifth inning and the pitching wasn't getting any better.
In the seventh, when he came up again, the Rafters had brought in perhaps their best relief pitcher, Twins prospect Travis Bowyer, and he held Wood to a single. So when Wood came up for a sixth time, with Bowyer still on in the eighth, I knew this would be his last at-bat of the game. Bowyer bore down and Wood worked him to a full count, and then blasted his last pitch over center field wall, perhaps his longest shot of the day.
I know they say there is no cheering in the press box. But I wasn't in the press box, I was in the stands. And I cheered. Quietly, but I cheered. Not for Wood -- for me, for getting to see something that special.
Oh, and best of all, Wood said he'd be happy to have me interview him any time I want. I wonder why?
Lisa Winston is a senior writer/baseball for USA Today Sports Weekly. She soon will reach her fourteenth anniversary with the magazine, where she has covered minor league baseball since the 1994 strike.
| Designated Hitter | November 17, 2005 |
Otis Redding Was Right
I've begun to see that the pleasure men take in being with each other -- playing cards together, being in a bar together -- isn't actively anti-female. It isn't against women; it just has nothing to do with them. It seems to come from some point in their lives before they were aware that there were women. They have so much fun together. I really have become much more sympathetic to men because of my job.Jane Gross, on her experiences as woman sportswriter, to Roger Angell, 1979
One of the primary reasons why I'm a baseball fan is that it is a way for me to connect with other men. Some dudes like to talk about cars or hunting or books or records. We generally need something to bring us together, to connect us. Women get together all the time and can actually talk about their feelings. While men aren't excluded from this kind of discourse, it sure isn't the norm. Then again, men can also sit together and watch a ballgame without saying anything to one another for more than an hour and be utterly content, whereas I defy you to put a group of women in a room and have more than 30 seconds pass without someone saying something.
But while male-bonding is an intrinsic part of baseball's appeal for me, I've always shared the game with women as well. The two are not mutually exclusive. Some of my earliest (and fondest) memories of the game are playing with Vera Plummer, a close friend of the family's whose daughter was my age. Vera grew up in Brooklyn but was a Yankee fan and to this day she'll show you Gil McDougald's batting stance and talk about Raschi and Reynolds with little prompting. While my father was impatient and often irritable when it came to playing ball, Vera never seemed to get tired of pitching me that whiffle ball. More than any specific detail, I recall the feeling of her enthusiasm and enjoyment.
One the greatest women fans I've ever known is my friend Marylou Ledden who grew up in Fitchburg, a small town about fifty miles west of Boston. Marylou had just turned 18 during The Summer of Love, also known as The Impossible Dream season in Boston, and I'm sure she knew as much about baseball as she did about sex, drugs and rock 'n' roll. Her father, a burly Irish drinking man, would take her to the bleachers at Fenway Park, and although she was quite beautiful, she was also surely no pushover.
 I first met Marylou around 1984 when I was about 13 at a party that my father took my sister, brother and me to during our weekend visit with him in New York. The gathering was at the apartment of a woman whose brother-in-law was Lorne Michaels and I distinctly recall Marylou, in jeans, wearing combat boots, and sporting a Lulu haircut like the one Melanie Griffith would make fashionable again in "Something Wild" a few years later. Like that character, Marylou lived down in the lower east side. She was bright and funny and attentive (we were the only kids at the party).
Over the next few years, she was around often and soon we developed a close friendship. She was like a big sister or a second mother to me. She thought I was a great kid and believed in me, and was very much of a mentor.
Not only was she funny and unpretentiously hip, but she was probably the most analytical and intelligent woman that I had ever met. She thought like men did, though she was anything but. She taught me about women and sexuality during my adolescence (taking me to see "A Room with a View" and "The Unbearable Lightness of Being," neither of which I understood at the time) and turned me onto literature and movies. We went to see Buster Keaton movies together and she would clue me in to the subtleties of the sexual dynamics in his movies. I took my cues from her laughter as we watched, and then later by discussing those moments at length.
She was also an avid sports fan, and someone who could appreciate the way men perceived and followed sports as well. At the same time, she was true to her own feminine instincts toward the game. She appreciated the beauty of the baseball, watching elite athletes perform, the strategies and history of the game, while she could also step back and salivate over them as sexual objects as well. I don't recall watching "Bull Durham" with her or what she thought about it, but she was as close to the Susan Sarandon character as anyone I have ever known. She wasn't a groupie, but she was a feminist who did not hate men.
Marylou moved to New York in the 1970s, and for years she remained loyal to the Red Sox -- she never let me forget the cruel messages I left on her answering machine after the Bill Buckner game. But by the mid-nineties there was no doubt that not only was she softening her stance towards the Yankees, she was even beginning to like them, too. After the Yankees dominated the league in 1998, she had been won over by Joe Torre's team. We went to any number of games together, including Pedro's first as a member of the Sox at Yankee Stadium, and talked on the phone during many more.
 In February of 1999, Torre was diagnosed with prostate cancer. Marylou had recently gotten married to a nice Jewish guy from New York -- she always had a thing for Jewish guys. Shortly thereafter, she began complaining of dizziness and, after a series of visits to the doctor, on May 7th, she was diagnosed with metastatic lung cancer. As it turned out, she was suffering from brain cancer as well.
She immediately began chemotherapy treatments, but before long it was clear that she did not have long to live. The last several months of her life were spent in the hospice ward of Beth Israel in downtown Manhattan. It was the first experience I'd ever had with anyone close to me dying. During the days, I worked on a forgettable Cameron Diaz movie, and during the evenings I watched the Yankees and visited Marylou. Often, while I was in her room, the Yanks would be on the small TV, and, at moments, it was easy to slip into the rhythms of the game, temporarily forgetting the gravity of her situation.
I remember being very worried one evening about the pending labor issues on the horizon, and Marylou dismissed my concerns by saying, "Baseball will survive." She said it quietly but it was as if she had never been more certain of anything in her life. "No, but, you don't understand," I protested. She gave me a look that said, "You just don't get it." "Honey, no matter what happens, baseball will go on."
About the only good thing I can say about cancer is that it allows you to say goodbye, it allows you to tell somebody how much you love them. Marylou had worked her ass off to get where she was in the world and though she was now slowly deteriorating she did not succumb to self-pity readily, though for a while there, she was plenty pissed off. Somebody recommended Mitch Albom's best-seller "Tuesdays with Morrie" to me, which I promptly devoured. When I told Marylou about it, she said, "I don't want to be anybody's fucking Morrie." She had just gotten married and would never get to be a mother, and was not ready to be anybody's wise old sage. But her rage didn't last long. "Why you?" her therapist told her one day when she was particularly upset, "Well, why the hell not you? What makes you so special?"
Just because she was dying didn't mean she was suddenly going to be accorded special treatment. I have a fuzzy memory of the summer. (One day I came home from seeing her and, alone in my apartment, watched David Cone pitch a perfect game.) Mostly, I remember the intensity of the emotions. And she continued to teach me. On another day, I was sitting by her bedside with her sister Lisa, and Aretha Franklin's version of "Respect" came up in conversation. "You know Otis Redding wrote that," I said. "No he didn't," she replied. "Oh yes, he did." But even before I could get going, she touched my forearm and looked me directly in the eyes and said, "You don't need to be right here. I still love you." This cut right through me. She knew me so well, understood my neurotic need to be validated by being correct all of the time.
I left the hospital that day, wandering back to Brooklyn in the heat of the New York summer, humbled by the fact that here I was really revved up about making her see that I was right about something trivial, when here she was withering away before my eyes. Later that night, I was relaying this story to a record-nerd friend of mine and he said, "Otis Redding did write 'Respect'." My first instinct was to run back to that hospice and shake her, "See, I told you I was right!"
But being right was irrelevant. Whether I was right or not did not affect the way she felt about me. If I learned one thing that summer it is when it comes down to it, and you don't have your looks or your health, when you have to be carried to the bathroom, when you start to lose your mind, nothing, and I mean nothing in this world matters but love. That's all you get, and if you are lucky enough, it will envelop you and make the existential fear of dying a bit easier.
Three months after she was diagnosed, Marylou died. I had stopped going to see her weeks earlier. It had become too painful to say goodbye again and again, not knowing when she would actually be ready to leave. That season, I wanted the Yanks to win more than ever -- to confirm the greatness of 98 -- but also felt that if there was ever a time that I wouldn't mind the Sox beating the Yanks, this would be it. For Marylou's sake. Life isn't that accommodating though and the Yanks whipped the Red Sox in the playoffs and went on to win the World Serious.
Death and illness followed the Yankees that year, drawing me even closer to them. Late in the season, Yankee third baseman Scott Brosius' father passed away after a long battle with colon cancer; soon after, Luis Sojo's father died of a liver infection following surgery for an aortal aneurysm. Then, before Game 4 of the Serious, Paul O'Neill's father passed away after a long battle with heart disease. In the victory pile after the game, I'll never forget the image of the massive O'Neill collapsing into Torre's arms like a child. I wished I was him and had a guy like Torre to console me.
I miss my old friend dearly because I still have so many questions to ask her, so many more games to watch with her. I doubt I'll ever know anyone like her again. In the last years of her life, when we'd go out to dinner, she'd make me order for the two of us because that's what a guy is supposed to do. It's not often that a woman teaches you how to be a man but, in the purest of ways, that's exactly what she did for me. Who says baseball is just about fathers and sons?
Alex Belth is the founder and co-author of Bronx Banter. His first book, Stepping Up: The Story of Curt Flood and His Fight for Baseball Players' Rights will be released next spring.
| Designated Hitter | November 11, 2005 |
Long Live the King
The city of Seattle has a litany of important historical dates:
November 4, 1861: Founding of the University of WashingtonJune 6, 1889: Great Fire destroys the central business district
February 6, 1919: First general strike in U.S. History
April 21, 1962: The Worlds Fair and the Space Needle open
November 29, 1999: The WTO conference leads to mass riots
To this list, we may one day add August 4th, 2005. The occasion? Felix Hernandez makes his major league debut, taking the hill in Detroit on a game that was only seen through a closed-circuit broadcoast on MLB.tv. Though the Mariners lost the game, it signaled the beginning of an era. The reign of King Felix has begun.
In the past two seasons, the Mariners have won 132 games while losing 192, a nifty .407 winning percentage. The team has spent two years losing, and doing so while being nearly unwatchable. It is one thing to lose with young players trying to earn their way to the major leagues. It is another thing entirely to lose with Rich Aurilia, Scott Spiezio, Pat Borders, Aaron Sele, and Ryan Franklin. Following the team on a daily basis became something of a burden. They were a bad team that was hard to watch and made up of players who were planning their post-career travels. The team's slogan, "You gotta love these guys," was eerily similar to your Mom telling you to eat your broccoli as a child. "Do I have to?" Unfortunately, there was no way to sweep Bret Boone under the table.
What's the old saying, though, it's always darkest before the dawn? Well, on August 4th, after having his every twitch in the minor leagues micro-analyzed by people grasping for hope (read: me), the dawn arrived in Seattle. We had seen the future, and the future was Venezuelan, baby-faced, and a little thick in the middle.
Five days later, Felix stepped on the mound at Safeco Field for the first time. The Minnesota Twins were the opponents, though they weren't so much a challenge as they were witnesses to the coronation. 8 innings, 5 hits, no runs, no walks, 6 strikeouts, and 14 groundballs on just 94 pitches. The Mariner offense managed just one run against the immortal Kyle Lohse and, on any other night, the crowd would have gone home railing on the team's inability to hit ball with stick. Instead, the fans watched the King take his throne.
The results were impressive. This 19-year-old was completely dominating, not just in performance, but in ability. The weapons at his disposal were numerous and debilitating. There are players whose domination is a marvel. Then, there are players whose domination is expected, because they're just playing a different game. Felix was clearly the latter.
Let's start with his four-seam fastball. At 96-98 mph, his velocity alone makes it extaordinarily hard to hit. This isn't a Matt Anderson "Hit Me" fastball. Throwing it with movement, it draws stares more often than not. It's the easiest strike one in baseball.
If he bores of peppering the zone in the high-90s, he can easily switch to his two-seam fastball, the sinker that caused worms and gophers to leave the grounds of Safeco Field en masse. This pitch is nearly always thrown at the knees and, with late downward movement, it is a groundball machine. This pitch was the key to Felix's groundball rate. He faced 328 batters in his 12 starts and induced 149 ground balls. Only 45 hitters managed to get the ball in the air. This two-seam fastball is why.
As good as his two high-velocity options can be, neither is his best pitch. In fact, you would be hard pressed to find a better pitch in baseball than the Royal Curveball. Thrown as a classic 12-to-6 over-the-top curve and coming in at 82-86 miles per hour, Felix's curve is the kind of breaking ball that makes batters wobble. Starting at your eyes and ending in the dirt, trying to calculate the plane that the ball will be on as it crosses the plate is, for all practical purposes, impossible. To top things off, he has more command of his curve than any other pitch. Down 3-0, you are more likely to see the Royal Curve than you are a fastball. It's his go-to pitch, not only when he needs a strikeout, but when he just wants to get the ball over the plate. Try hitting this thing when you're sitting dead red.
And, just for fun, Felix also has a change-up that, on its own merits, is one of the best in the American League. A true straight change, he drops it in at around 84 mph, usually just below the knees of a batter who has already completed his swing by the time the ball actually gets to the plate. The famous Roger Rabbit cartoon, where three swings are completed in the time it takes for the ball to get to the catcher's mitt, isn't that far off base.
When Felix is on the hill, it isn't just surprising when someone gets a hit. It's surprising when they don't look foolish. He uses four pitches that, judged on their own merits, are among the very best in the game individually. Trying to find a comparison for a guy with Felix's repertoire of pitches just isn't possible. If you put Billy Wagner's velocity, Brandon Webb's movement, Kerry Wood's curveball, and Johan Santana's change-up in a blender, then put it on high, you would have something like what the Mariners have. Only what the Mariners have is 19-years-old.
Scouts aren't the only ones drooling over Hernandez. Let's take a look at some of the markers that get performance analysts excited, shall we?
Most people agree that strikeout rate is the best predictor of future success in a young pitcher. If you can miss bats in the major leagues before you're allowed to drink, good things are probably in store. Well, Felix Hernandez struck out 23.4 percent of the batters he faced as a Mariner. Roger Clemens has a career rate of striking out 23.2 percent of batters he has faced. Strikeout rate? Check.
Okay, so, Felix makes guys miss. But, you have to be able to get the ball over the plate, too. All the stuff in the world doesn't make a difference if the batter can stare at four pitches out of the strike zone and stroll down to first base. Felix walked just 7 percent of the batters he faced in the majors while throwing just 14.4 pitches per inning. Command? Check.
The third true outcome, home run rate, has been preliminarily tied mostly to flyball rate. The more balls in the air a pitcher allows, the more often one will likely leave the yard. Felix allows fewer fly balls than any starting pitcher in the major league besides Brandon Webb. On the season, he allowed just 5 home runs in 84 innings, projecting out to 12 or 13 for an entire season. That total would be the best in the league just about every single year. Ability to keep the ball in the yard? Check.
Then, there are just the ridiculous numbers. Opposing batters hit .203/.263/.283 against him last season. That's a little bit worse than the season line Cristian Guzman just finished putting up.
Or, there's this little gem. Felix Hernandez's average game score was 63.1. Roger Clemens was the only guy in the majors with a higher average game score. The Rocket's was 63.5.
So, we admit, after watching his continual displays of brilliance, we went nuts. When it came to Felix, I gladly put down my objective analyst card and became a screaming fanboy. No one in Seattle would have objected if he had come riding in from the bullpen on a donkey with palm trees littering the outfield. The city was starved for a hero, a leader, a king. In King Felix, we found a phenom.
Long Live the King.
David Cameron is a member of the team of writers who author ussmariner.com. He has also written for Baseball Prospectus and his newest article will be published in the upcoming Hardball Times 2006 Annual. You can contact him by email at ussmariner@gmail.com.
| Designated Hitter | October 27, 2005 |
Can Baserunning Be the New Moneyball Approach?
Running the bases has almost always been seen as a side-dish. Even in the Bitgod (Back In The Good Old Days) view, a player who was in the 99+ percentile for baserunning had to have at least one more tool to get to the majors. A fellow like The Panamanian Express was only on the team because the owner, not the manager, insisted. BTW: I think "¿Who is The Panamanian Express?" is the question to the following Jeopardy answer: One of only two players in ML history with a season's worth of games to have created more outs than he had plate appearances.
The knowledge revealed by Sabermetric analysis, combined with the efflorescence of offense since the leagues juiced the ball in 1994, has relentlessly pushed the running game further into the background year-by-year, both for pragmatic reasons and for religious ones.
But this year, there's been a pick-up in interest about baserunning that transcends the easily measurable component of it (stealing). Two successful teams, the Los Angeles Angels of The O.C. and, to a lesser degree, the Chicago White Sox, have declared that part of their success is the ability to squeeze extra bases out of singles and doubles by taking the extra base. After interviewing Mike Scioscia, I wrote a couple of entries at my Management by Baseball weblog, here and here that talk primarily about hitting with runners in scoring position, but some about taking the extra base, as well (explaining how the two are inextricably linked in the Angel system's theory).
¿So what about taking the extra base? What can we learn, what do we know, what can we measure meaningfully?
I have a collection of 2005-through-August numbers from which I'll deliver some findings. The numbers are not as definitive, nor as granular, as the excellent opus Dan Fox of Dan Agonistes' blog has produced. Fox has some great work on his own blog, and a more recent three-part series at The Hardball Times that starts with this one. Fox suggested his numbers didn't match up well with what Scioscia talked about in my interview, and mine don't either. We both think the Angels do some slicing-and-dicing and are analyzing a sub-set of our data.
I don't intend this to usurp or compete with Fox' fine stuff. He has already analyzed what the numbers can deliver in terms of runs and win potential. Consider this more pattern-recognition, looking at the patterns that might provide more insight, a complement to his work, some brain candy delivered to your door to raise questions we should think about answering. I believe the utility of the math is ultimately going to stop short of what we want to know because there are too many environmental variables: individual park factors, outfielders' arms, game situation, base-out status, who the other runners on might be and team strategic theory, to name a few. But just because the math only gets us part of the way there doesn't mean it isn't juicy and valuable. And it doesn't mean we should stop asking questions and looking for answers.
In that spirit, let's set up the workbench with some numbers. These are from the 2005 through the end of August, a fair sample. First, Major League frequencies of opportunities, success and failure in three situations: 1st-to-3rd on a single, 2nd-to-Home on a single, and 1st-to-Home on a double.
Extra Base        1st-3rd        1st-3rd        1st-3rd        1st-3rd
   Opps.            Opps.        Success        % Success    Out tryin'
   12247            6203          1949             31%            60
Runners try for third on a single about a third of the time, and are only caught once for every thirty-two times they try.
                  2nd-Home       2nd-Home        2nd-Home       2nd-Home
                    Opps.        Success         % Success      Out tryin'
                    3846	         2590             67%             129
A lot higher frequency of attempts on 2nd-to-Home (clearly longer throws for the LF and CF), and runners get gunned down at a much higher rate (about half again as frequently), though still not very often.
                  1st-Home       1st-Home        1st-Home       1st-Home
                    Opps.        Success         % Success      Out tryin'
                    1672           763             46%            62
The benefit/cost ratio of already-safe-at-third versus taking a chance on being out at home is dampening attempts. The failure rate goes up sharply again (out about two-thirds more frequently than 2nd-to-home and about two-and-a-half times more frequently than 1st-to-3rd), yet still only 7.5% of the attempts.
DISCUSSION TOPICS: ¿Are outfielders' arms so lackluster, is station-to-station baseball so popular now as a result of higher run production, have teams equipped with analytical systems been able to optimize who goes when?
Ron Fairly suggested to me (and I tend to agree) that the throwing "tool" isn't accentuated much in the minors or bigs. That would make sense, because if you are a one-tool player, it's the least likely to get you a career outside of pitching, and of any two-tool combo you could Lego together, it's the least advantageous second tool, too. So, he asserts, outfielders are more likely to throw to the cut-off man than attempt the assist. I believe there were more good outfield arms displayed during games in the 1965-1993 period, and I'm not a Bitgod, though we're all capable of little Bitgoddities, so it could be selective memory on my part. But if I was a manager, my logical response to less frequent throwing to the target base would be to ratchet up, in context of course, the frequency of attempts until defenses started to respond. ¿Would you do that?
Some Team Totals
Here's the MLB numbers restated on one crowded line, with a mean average team line following:
       1-3   1-3   1-3  1-3 |  2-H   2-H   2-H  2-H |  1-H  1-H  1-H  1-H
       opps  safe  safe out |  opps  safe  safe out |  opps safe safe out
MLB    6203  1949   31%  60 |  3846  2590  67%  129 |  2198 1010  46% 74
Mean    207    65   31%   2 |   128    86  67%    4 |    73   34  46%  2
Let's run some individual team totals against that Mean team.
        1-3   1-3   1-3  1-3 |  2-H   2-H   2-H  2-H |  1-H  1-H  1-H  1-H
       opps  safe  safe  out |  opps  safe  safe out |  opps safe safe out
Mean    207    65   31%    2 |   128    86  67%    4 |    73   34  46%  2

LAA     228    75   33%    3 |   153   100  65%    5 |    62   33  53%  2

CWS     200    72   37%    1 |   114    85  75%    7 |    61   32  53%  4

HOU     160    55   34%    1 |   120    69  58%    5 |    77   35  45%  5

SEA     142    39   27%    1 |   106    73  69%    1 |    65   38  58%  2

NYM     188    65   35%    2 |    95    66  69%    0 |    57   24  42%  2
Keep in mind as Dan Fox already pointed out that these numbers are very context-sensitive (park effects, roster abilities, team strategies, coaching decisions). Seattle has a lot fewer opportunities than average, but they weren't experiencing many baserunners-on situations, and the Astros had about 9% fewer at-bats with runners on-base than the NL average. Compared to the ML average, the Angels have more opportunities, convert at about the same rate for higher gross yield and are thrown out at about the same rate. So they're not better quality, they are higher-input with higher-output and the same quality. Intuitively, one would assume that as you drive up quantity, your added increment would be lower-quality opportunities. That is, everyone is already sending Chone Figgins or Charles Gipson against Jeremy Reed or Judi Dench, so incremental chances would likely come with less-skilled runners or more-skilled outfielders. ¿What do you think?
There's a universal Truth, known to many as Angus' Eleventh Law, that whatever asset becomes debunked as overvalued will become undervalued before it finds its homeostatic set point. If that's in operation here, it may mean that there's a little edge in aggressive baserunning "the market" of MLB teams currently undervalues and, therefore, makes it some opportunity for others willing to pursue it. And if opponents aren't used to seeing such naked aggression, until they do, their immune response will be somewhat impaired. It may be that the alterations teams make to the Scamperball approach disadvantage them in minor ways we can't track through isolating baserunning: perhaps pitcher or infielder concentration, perhaps fielder positioning, or other things. ¿What do you think?
Some Individuals' Totals
Here are some individual players' numbers we can chew on. I consolidate all three situations (1-to-3, 2-to-Home and 1-to-Home) because breaking up individuals' segmented opportunities into three very small piles of data means a single additional opportunity or out radically changes the outcome. The ML average was 34% of opportunities converted into safe advances. Here are the baserunners who had the highest number of opportunities:
                      Opps   Safe   Safe    Out
Johnny Damon   Bos     66     38     58%     1
Manny Ramirez  Bos     63     21     33%     1
Bobby Abreu    Phi     63     32     51%     2
Derrek Lee     ChC     61     31     51%     1
Brian Giles    SD      61     28     46%     1
Miguel Tejada  Bal     59     31     53%     1
Derek Jeter    NYY     59     27     46%     2
Alex Rodriguez NYY     59     25     42%     2
Miguel Cabrera Fla     58     20     34%     0
Jason Bay      Pit     58     32     55%     0
Ichiro Suzuki  Sea     58     27     47%     2
Mark Teixeira  Tex     57     30     53%     1
What earns you a place on the list is a (a) high OBP after subtracting homers and, concurrently, (b) players coming up after you who are likely to hit singles and doubles. Very, very context-sensitive, and one has to think that Damon and Ramirez are the poster-kids for this particular Jimmy Fund. There's a decent spread of high- and normal success percentage runners in this table. There is no bell curve distribution for percentage attempted (no surprise...there's almost nothing in nature that manifests as a bell curve outside the minds of the early-20th century researchers who invented the bell curve). The 90th percentile rank for safe% is 60% and the 10th percentile rank for safe is 29%.
Here are the top runners by percentage of opportunities converted into safe advances (minimum 25 opportunities).
                 Opps   Safe   Safe    Out
Figgins   LAA     50     34     68%     3
Miles     Col     25     17     68%     0
Hardy     Mil     25     17     68%     0
Sullivan  Col     28     19     68%     1
Hairston  ChC     31     21     68%     0
A Boone   Cle     43     29     67%     2
Beltran   NYM     45     30     67%     1
Barmes    Col     30     20     67%     0
Crisp     Cle     44     29     66%     0
Podsednik CWS     32     21     66%     0
Not too many catchers or over 40s on this list. Two words that should strike fear into right-fielders and recreational hoops players everywhere: Aaron Boone.
Boone looks as out of place on this list as Ted Nugent would at a Friends meeting. Here are the trailers by percentage of opportunities coverted into safe advances. The local commuter trains (minimum 25 opportunities):
                 Opps   Safe   Safe    Out
Ortiz      Bos     49     6     12%     1
B Molina   LAA     32     4     13%     0
Berkman    Hou     30     4     13%     2
Thome      Phi     33     5     15%     3
T Martinez NYY     25     4     16%     2
Ward       Pit     36     7     19%     2
Zaun       Tor     45     9     20%     0
V Martinez Cle     44     9     20%     1
Too many catchers on this list. What ever happened to speedburners like Choo-Choo Coleman? I'll nominate Jim Thome as the least useful baserunner with his low percentage and extra outs. Who would you nominate?
There are a lot of questions to be answered. I haven't begun to ask them all. I ask you to view this as a first cut at a foundation for discussion. Of things we might find out based on the data we have access to, what are the most important ones we can discover; ergo, what are the next logical questions?
Jeff Angus is a management consultant specializing in knowledge management and change management, and the stats columnist for The Seattle Times during the baseball season. He writes the Management by Baseball weblog. His current book is "Management by Baseball -- A Pocket Reader," and he has a book coming out in May from HarperCollins, called Management by Baseball: The Official Rules for Winning Management in Any Field.
[Additional reader comments and retorts at Baseball Primer.]
| Designated Hitter | October 15, 2005 |
What Was Josh Paul To Do?
After watching the instant replay, in game two of the American League Championship Series on Wednesday night of A.J. Pierzynski striking out, I thought, as I'm sure a lot of viewers did, that it was the third out of the inning and the Angels and the White Sox were headed into extra innings.
Then one of the strangest things happened that I have ever seen. Home plate umpire, Doug Eddings, who made the out call by raising his right hand and making the fist sign, allowed Pierzynski to be safe at first. As long as I pitched in the Major Leagues, I too would have thought that when Eddings raised his right hand that that meant that it was a strikeout and my catcher caught the ball in the air without having to touch the batter to guarantee the final out of the inning. But I guess not?
Give Pierzynski a lot of credit though because, as he said, he thought the ball hit the dirt. He crossed home plate heading back to the dugout and then spun around and ran to first base as the Angels catcher, Josh Paul, rolled the ball toward the mound. By the time the Angels players could react to the NOW live ball Pierzynski was safe at first. And wouldn't you know it, Pablo Ozuna, pinch running for Pierzynski, stole second and scored the winning run on Joe Crede's single off the left field fence. Wow, what a finish!
This was a play that would probably go unnoticed during the regular season BUT this is for the American League Championship! I feel that Eddings blew the call which allowed the White Sox to win. But it was a must win for the White Sox because now the series is tied at one apiece as the two teams head to Anaheim or Los Angeles, or wherever the Los Angeles Angels of Anaheim call home.
The same can be said about the Houston Astros beating the St. Louis Cardinals last night in the must win. Now their series is tied at one apiece and they continue the National League Championship Series in Houston. Great pitching performance by Houston's Roy Oswalt helped the Astros win game two.
I had the opportunity to pitch in three League Championship series and it's where every player who ever wore a Major League uniform wants to be in October.
My prediction is that the Los Angeles Angels of Anaheim will be facing the Houston Astros to determine the 2005 World Series Championship and the Houston Astros will win their first ever pennant. They will win because of their outstanding pitching staff and timely hitting.
Let's see how smart I am. Whatever happens, let's just all enjoy the games and remember how many strange things have to happen to allow a team to be World Champions.
| Designated Hitter | October 14, 2005 |
Not a Prospect List
Opening disclaimer: I love Baseball America. I've been a subscriber for years; I read it cover to cover when it comes in (OK, not really cover-to-cover, since the old media guys in the front put me to sleep, but you know what I mean); I've built a small shrine to it in my basement.
Nonetheless, Baseball America has been the source of one of the great evils of our time -- the prospect list. We all know why they do it, of course; people like lists, and they like feeling like insiders, so prospect lists move copies. There's nothing inherently wrong with that, but these lists need to be kept out of the hands of people who make actual decisions, because they're reversing the process. It's the result of what I've heard called The Halo Effect.
Let's look at a couple of players:
| Year 1 | Year 2 | Year 3 | ||||||||||
| League | Stats | League | Stats | League | Stats | |||||||
| A | California | .341/.414/.540 | Southern | .252/.387/.514 | PCL | .346/.433/.500 | ||||||
| B | California | .302/.379/.527 | PCL | .283/.329/.422 | NL | .267/.321/.391 | ||||||
Now, there is an age factor here, as A was a year older than B in the years represented (although they're the same age in real life), but it's interesting how these tracks went, especially since they were both seasoned college players and not teenagers when they turned pro. A is Jon Knott, and Year 1 for him is 2002. Player B is Xavier Nady, and Year 1 for him was 2001. There is no reason in what's shown here that Nady should have been moved faster (or, since this isn't really about Nady, that Knott should have been moved slower). However, Nady was a second round draft choice who had been on every prospect list on the planet, while Knott was an undrafted free agent no one had ever heard of, so not only did Nady move faster up the ladder, he spent another year in San Diego in 2005 while Knott wandered in the wilderness of the PCL again. The Halo Effect does its damage, and prospect lists are one of the root causes of that.
All of this is a long prelude to what could, if you don't look closely, be mistaken for a prospect list. There is a difference, but feel free to laugh at my inconsistency for a moment if you wish. What follows is actually what the decision makers should be looking at, or at least a variant of it; it's a performance list. What follows is the list of the top performances by my favorite evaluation measures for college players by last year's sophomore class. The difference in this and a prospect list is that I haven't talked to anyone, much less a scout, I've never seen most of these guys, and the next time I use the word "toolsy" will be the first.
First, the hitters. These guys are ranked by AOPS (adjusted OPS), a stat of mine which takes traditional OPS and adjusts them for park factor and strength of schedule faced.
| Team | Name | OBP | SLG | OPS | AOPS | |||||
| Florida | Matt Laporta | .438 | .698 | 1.136 | 1.257 | |||||
| Florida State | Shane Robinson | .532 | .605 | 1.137 | 1.239 | |||||
| Pepperdine | Chad Tracy | .428 | .609 | 1.037 | 1.239 | |||||
| Mississippi | Mark Wright | .407 | .583 | 0.990 | 1.223 | |||||
| Lamar | Michael Ambort | .414 | .654 | 1.068 | 1.173 | |||||
| Mississippi | Chris Coghlan | .430 | .516 | 0.946 | 1.169 | |||||
| Georgia | Josh Morris | .405 | .541 | 0.946 | 1.166 | |||||
| Texas Christian | Shelby Ford | .479 | .578 | 1.057 | 1.160 | |||||
| Mississippi | C. J. Ketchum | .481 | .457 | 0.938 | 1.159 | |||||
| California | Brennan Boesch | .436 | .567 | 1.003 | 1.157 | |||||
| Arkansas | Danny Hamblin | .419 | .584 | 1.003 | 1.142 | |||||
| Pittsburgh | Jim Negrych | .471 | .694 | 1.165 | 1.142 | |||||
| Tulane | Mark Hamilton | .452 | .599 | 1.051 | 1.130 | |||||
| Miami, Florida | Jon Jay | .490 | .531 | 1.021 | 1.125 | |||||
| Cal State Fullerton | Brandon Tripp | .436 | .556 | 0.992 | 1.117 | |||||
| Georgia Tech | Wes Hodges | .466 | .566 | 1.032 | 1.115 | |||||
| Oregon State | Mitch Canham | .423 | .531 | 0.954 | 1.114 | |||||
| Texas Christian | Chad Huffman | .437 | .573 | 1.010 | 1.108 | |||||
| San Diego | Shane Buschini | .450 | .538 | 0.988 | 1.096 | |||||
| Rice | Josh Rodriguez | .411 | .555 | 0.966 | 1.092 | |||||
| Virginia Commonwealth | Scott Sizemore | .464 | .673 | 1.137 | 1.092 | |||||
| Cal Poly | J. J. Owen | .398 | .588 | 0.986 | 1.083 | |||||
| Santa Clara | Robert Perry | .427 | .556 | 0.983 | 1.079 | |||||
| Georgia Southern | Justin Klinger | .464 | .591 | 1.055 | 1.075 | |||||
| College of Charleston | Chris Campbell | .421 | .625 | 1.046 | 1.069 |
Now, you heard what I said earlier about talking to scouts, right? There's a temptation here to push the word count up by trying to offer a pithy comment about each of these guys, but that's not what we're doing here. These are the guys who have performed, and no one should care if they're strapping young hunks of manhood or guys who look up to Quasimodo, or would if they could keep up with him.
So, on to the pitchers. These guys are ranked by another creation of mine that I call RBOA (Runs Below Opponent Average), which is exactly what it sounds like. Because RBOA is a counting stat, it is affected by playing time issues, so sophomores who make their way into the rotation at midseason will suffer in this list. On the other hand, the college season is short enough that a pitcher who's only been in the rotation for half a season hasn't really provided enough of a sample size to be judged, so I think I'm OK with that.
| Team | Name | RBOA | ||
| Texas | Kyle McCulloch | 56.63 | ||
| Missouri | Max Scherzer | 53.76 | ||
| Nebraska | Joba Chamberlain | 48.61 | ||
| Oregon State | Jonah Nickerson | 44.41 | ||
| Winthrop | Heath Rollins | 42.10 | ||
| Florida State | Bryan Henry | 41.65 | ||
| Southeastern Louisiana | Bernard Robert | 41.44 | ||
| Texas | Randy Boone | 41.20 | ||
| Middle Tennessee State | Matt Scott | 40.13 | ||
| North Carolina | Robert Woodard | 39.79 | ||
| South Alabama | P. J. Walters | 38.37 | ||
| Oregon State | Dallas Buck | 38.33 | ||
| UC Irvine | Justin Cassel | 37.80 | ||
| Washington | Tim Lincecum | 37.26 | ||
| Clemson | Stephen Faris | 36.84 | ||
| Wichita State | Noah Booth | 35.15 | ||
| Miami, Ohio | Keith Weiser | 33.50 | ||
| Georgia Tech | Blake Wood | 32.48 | ||
| San Diego State | Bruce Billings | 32.00 | ||
| Baylor | Cory Vanallen | 31.70 | ||
| Central Florida | Tim Bascom | 31.55 | ||
| Arizona | Mark Melancon | 31.54 | ||
| Army | Nick Hill | 31.05 | ||
| North Carolina | Andrew Miller | 30.69 | ||
| Baylor | Jeff Mandel | 29.36 |
These, therefore, are the guys you want to start your watch list for next year with, although in this case there is a caveat. College pitchers often carry a tremendous workload, especially when measured with pitch counts. If that's something that concerns you, either professionally through your organization's stance or personally through your fantasy philosophy, do your homework on that front as well.
See, two perfectly good lists of players to watch, and I didn't use the word "gamer" once.
Boyd Nation is chief cook and bottlewasher at Boyd's World, a college baseball stats and analysis site, and provides college baseball data consulting to an undisclosed number of major league teams. In real life, he's an information security guy with a beautiful wife and three great kids in Birmingham, Alabama.
| Designated Hitter | October 06, 2005 |
Extra Base Hits
Baserunning - actually running the bases as opposed to stolen bases - has long been one of the more ignored aspects of baseball performance analysis. There have been brief discussions of it here and there (Dan Fox's work comes to mind), but a comprehensive study of it was lacking. To that end, I made a stab at valuing baserunning in Baseball Prospectus 2005 in an article entitled "Station to Station: The Expensive Art of Baserunning." While any data on baserunning numbers is a welcome relief to the void that currently exists, when evaluating baserunning skill and decision it's important to remember that there are many factors at play when a baserunner decides to attempt the extra base.
In Baseball Prospectus 2005, I considered several factors and their impact on baserunning decisions: the ballpark, the number of outs, the fielders, and the batter at the plate. Before applying each of these factors to the baserunning numbers, it's important to confirm that each one has a consistent effect on baserunner performance. For example, baserunning park factors - for both attempt rate and success rate - are very consistent from year to year. Much like other aspects of offense, the ballpark affects baserunning performance, though in the case of baserunning, I assume the size of the outfield and irregularity of the dimensions has more to do with it than things like the hitters background, size of foul territory, altitude, and other more general differences. Regardless, because baserunning park factors are so consistent from year to year, we can say with confidence that the park has an effect on baserunning numbers.
An even stronger correlation was present with regards to the number of outs, but the other two aspects - the fielder and the batter - were found to be essentially random and thus were not considered. It's the latter of these two factors to which I want to return today.
It's difficult to imagine that the batter at the plate has no discernable effect on the ability of baserunners to advance extra bases. Slap hitters like Ichiro Suzuki and Juan Pierre would seem unlikely to advance baserunners beyond the next bag on their high numbers of infield singles while power hitters like David Ortiz would seem likely to advance those runners on booming singles off the wall or cut off in the gap. There are some possible reasons for this - the same ball hit to the same place may be a single for some batters and a double for others or runners may be able to more quickly determine that a slap single is a single as opposed to a drive to the gap or wall - but on the whole, the absence of any ability to advance baserunners by batters was surprising.
With another year's perspective, let's dive back in and check this out again. To do so, three common baserunning situations will be considered: a single with a runner on first or second and a double with a runner on first. (If there are runners on first and second when a single is hit, only the lead runner is considered.) In each of these situations, any runner advancing more than the number of total bases of the hit will be considered to have taken the extra base. Additionally, runners thrown out at the extra base will also be considered to have attempted the extra base.
Next, each batter and runners totals will be adjusted for three factors: the park, the number of outs, and if there is a full count or not. The first two of these were used in the original analysis in Baseball Prospectus 2005, but the final one is a new twist. It's a well-known fact that runners get a head start when there is a full count on the batter and the difference between runners attempting the extra base with a full count and without is remarkably consistent from year to year. From 1990-2005, the attempt rate was between 43% and 47% without a full count and 58% and 68% with three balls and two strikes. (Interestingly, the lowest attempt rate with a full count prior to 2004 was 62%, but the numbers the last two years have been unusually low. Insert your chosen rant about "modern players not doing the little things to win" and "playing the game the right way" here.)
To determine if a batter truly has an effect on the runners on base, it's important to remember that specific batters and baserunners are often paired because lineup orders are often repeated. Sluggers in the middle of the lineup usually come to the plate with leadoff or #2 hitters on base, runners who are often the team's best baserunners. Thus, it may initially appear that middle-of-the-lineup hitters advance baserunners more than other hitters, but that conclusion would be based more on the quality of the baserunners than that of the hitter. Instead, for each batter and runner, an expected attempt rate (ATTr) is calculated by looking at the baserunning numbers excluding a particular runner.
Working with an example should make things clearer. Assume that Ortiz hit a single or a double in with Johnny Damon on first ten times and Damon took the extra base seven of those times. To determine who's more responsible for that advancement, we'll instead calculate Damon's baserunning in all situations except when Ortiz is batting. Assume then that Damon takes the extra base 60% of the time when other batters are hitting. In this case, then, Ortiz is credited with one of Damon's seven advances because Damon normally only takes six of ten extra bases.
Once those numbers are adjusted for the park, the count, and the number of outs, we can total the number of extra bases we would have expected each batter to advance the baserunners based on the ATTr of the runners when that batter was not up. We'll dub this rate - the ATTr above expected - netATTr. If batters show consistent netATTr from season to season, we can say with confidence that batters do have an influence on baserunning numbers.
Unfortunately, the correlation looks something like this:
Ugh. That may look more like a Rorschach test than a correlation, but it's simply an extremely definitive picture of complete randomness. If batters showed a strong tendency to advance baserunners more than expected from year to year, those dots would form more a line from the lower left quadrant to the upper right. Instead, a great, lifeless blob stares back at us from the center of the plot with no discernable trend.
Of course, the problem could be that the same sizes are too small. The set of data in use - singles or doubles hit with men on first or second - don't necessarily occur very often for most batters every season. Given that, we can employ a technique based on the one used by Keith Woolner in his rebuttal to Voros McCracken's research on Pitcher Control on Balls in Play. In that article, Woolner broke pitcher careers into two halves and compared them, but rather than breaking them up chronologically, he put all even-numbered seasons in one half and all odd-numbered seasons in another. This technique drastically increases sample size while still effectively choosing random data to avoid picking up other trends. (In the current case, we want to avoid batters who changed their hitting approach later in their careers, perhaps advancing more or fewer baserunners as a result.)
Comparing those two career halves and restricting it to batters who were involved in at least 100 baserunning instances in each half of their careers, the scatter plot now looks like this:
That may not look like much, but our correlation has jumped dramatically. In statistics, a tool called the coefficient of determination - commonly referred to as r-squared - reveals how much of the variance in one set of data can be explained by the other. R-squared is presented on a scale of 0 to 1 with 1 being a perfect correlation and 0 being complete randomness. In the first scatter plot, r-squared was 0.001, indicating nearly complete randomness. In the second plot, r-squared has jumped to .249, meaning 24.9% of the change in netATTr in one career half can be explained by the other half. Generally, r-squared needs to be a little higher before employing one variable to project the other. But for the purposes of establishing whether or not batters have some control over the runners on base in front of them, we can say that - contrary to the complete randomness seen in the first plot - there does appear to be some ability, albeit inconsistent, for hitters to advance baserunners more or less than league average.
This conclusion fits with what most of us have seen on the field. Batters show a huge degree of variance from season to season when it comes to advancing baserunners more than the runners would advance themselves, but over a career, there are some batters who will move runners around the bases a little more often than their lighter-hitting counterparts.
James Click is an author for Baseball Prospectus where he writes a weekly column, Crooked Numbers, and spends too much time looking up random baseball stats that he forgets as soon as the query is done running, a condition that has cost him more than a few bar bets. He lives in San Francisco, CA.
| Designated Hitter | September 29, 2005 |
Why I Love Baseball
In George Orwell's incisive essay "Why I Write," he says that all writers have multiple reasons for doing what they do. Some they keep to themselves, some they share with others, and some even they don't know about.
Orwell's meditations are pessimistic. To him, all writers are driven by selfishness and vanity mixed with other mysterious motives that may be more pure. "I cannot say with certainty which of my motives are the strongest," the author of Animal Farm and 1984 wrote, "but I know which of them deserve to be followed."
I'm a writer. It pays the bills. Strangely, though, when buried under jobs that promise a check and a publication credit, a weblog post ends up at USSMariner.com with my first name under it. Why is this? I've wondered a thousand times.
Leaving aside the smell of the grass or the way a broken-in glove feels -- everybody says that -- I've come up with a few reasons why I love baseball, and why I write about it when for all intents and purposes I should be doing something else.
I love baseball because we share it, all of us.
One of my wife's Okinawan uncles is fanatic about the game, and not just Japan's yakyuu. He checks out American box scores daily, watches all the televised Mariner and Yankee games, and tries to convince me that the Mariners' demise is directly related to the absence of Dan Wilson.
He grew up on a 700 square kilometer island in Asia and became a businessman. I grew up in rural Oregon intending to become a starving novelist and poet, dropping texts randomly into obscure journals and small presses for people to discover. He speaks no English. I barely speak the Japanese and Okinawan languages.
Yet we talk for hours about records, statistics, the arc of a swing or the contour of a pitch.
I love baseball -- odd as it seems -- because we disagree about it. I may think that you have dramatically underestimated the value of Ichiro, or overestimated the importance of a veteran closer, or too easily discounted the chances of the Cleveland Indians. You may think what I say is patently absurd, and your stance may be vindicated by history and logic.
But I'll still buy you a beer and laugh if it turns out that way. About what other than baseball is this true?
My job during college was a 40 hour a week gig at a youth sports organization. I signed kids up for Little League. Black kids, white kids, boys, girls, rich kids with roman numerals after their handles, hippie kids named "Heron" and "Thunder" and "Mountain." I watched them all walk out in new uniforms, glowing with anticipation and thought about how someday I'd like to write anything that gave people that kind of joy, without worrying about whether or not I got paid for it.
I love baseball because of Jackie Robinson.
Sport can be a great unifier, especially a game that's grown up with us. In these times where we -- as families and as a nation -- disagree about so much else, it's wonderful that there is the common vernacular of baseball and an accepted response to any discussion of a team's fate: "If they could only get some pitching." (This useful phrase has elicited many a knowing nod, solving numerous uncomfortable silences.)
Even better, there is an entire community of dedicated people devoted to studying whether or not this old canard is, in fact, true. Not because finding the answer will make them a profit, mind you, but just to see. To know. To learn. To share that learning with others.
I love baseball because Japanese-Americans, interned during World War II, built those most American of structures, baseball diamonds, where they were imprisoned. This embrace of the national pastime was a shining example of perseverance and love of country during a tragic, difficult period.
Then there's the lore of the game, those charming and occasionally apocryphal tales. Like the one about when Yogi Berra was introduced to Ernest Hemingway, he didn't ask about what deep and complex matters drove him to put words on a page. He asked "What paper you write for, Ernie?"
I love baseball because the Suquamish Indian Tribe sent a team to tour Japan in 1921 -- and is still so proud of those guys that they've got a photo of them hanging in the tribal center's entry hall.
Baseball mimics the seasons. When winter comes, the game goes away, and with Rogers Hornsby, we stare out of the window and wait for spring. At its core, this cycle is about hope. After my favorite team becomes the first in history to follow two 90 win seasons with two 90 loss campaigns, fans like me can get discouraged.
Then we get Felix Hernandez. Whom I love.
I love baseball because it reminds me of what I could be, and what I am trying to become. I write about it because it reminds me which of my motives are base, and which of my motives deserve to be followed.
In January, I'm going back to Okinawa. For a gift, I'm bringing my uncle one of my most cherished possessions -- a bat Mark Grace used during an early '90s spring training game.
His eyes are going to get big. I'm going to bow, and smile, and regret that we don't speak the same language.
You know what, though? We really do.
Jeff Shaw is the fifth-smartest baseball mind on the staff of USS Mariner, a blog about the Pacific Northwest's hometown nine. He lives in Bellingham, Washington.
[Additional reader comments and retorts at Baseball Primer and USS Mariner.]
| Designated Hitter | September 22, 2005 |
Is There Any Advantage in Keeping Fielders on Their Toes?
Ever heard someone say that a pitcher wants to "keep his fielders on their toes" to succeed? Let me present you a quote from an online paper to explain this idea:
Greg Maddux is the type of pitcher that works his spots around the plate and throws a healthy diet of off speed pitches. He will keep fielders on their toes by getting the batter to hit ground balls. This way, the fielders aren't just standing around falling asleep while the game is being played.Pedro Martinez is a power pitcher who strikes a lot of people out. Most of the time the fielders are just standing around while the batters are whiffing and, all of a sudden, the fielder makes an error on a ground ball because he is not ready. As a fan I like to watch the overpowering strikeouts, but as a player I think they are boring. Ground balls keep the fielders ready and make the games go faster.
This attitude has always seemed a little strange to me, to be honest. Personally, I've never seen a fielder just standing around because the pitcher allows so few balls in play. In fact, and this is based on personal observation only, it seems to me that pitchers who allow many walks and strikeouts (in other words, pitchers who do not allow many balls in play) tend to be fly-ball pitchers, and fly-ball pitchers tend to allow lower Batting Average on Balls in Play (BABIP) than ground-ball pitchers.
I decided to take a look at this question by conducting five studies. What I found was very interesting.
First of all, I took every pitcher season with at least 350 Batters Faced (BFP) between 2002-04 using the Lahman Database. This gave me 529 pitcher seasons, more than enough for a large sample size. The first Study I ran was pretty simple: I calculated each pitcher's Balls in Play per Batter Faced (BIP/BFP), and split the data into three groups, pitchers who were one Standard Deviation (SD) above average in BIP/BFP, pitchers who were one SD below, and the rest. What interests me are the first two. Take a look at the results:
	          N	BFP	BIP	BIP/BFP	H-HR	BABIP	R	IP	RA
High BIP/BFP	67	44600	35465	0.795	10502	0.296	5686	10360	4.94
Low BIP/BFP	90	62826	39982	0.636	11353	0.284	6090	13502	4.06
The first (High BIP/BFP) is the group that is supposed to keep batters on their toes. As you can see, its BABIP against is higher than that of the second group, and by quite a bit. It seems that the more Balls in Play (BIP) you allow, the higher your BABIP becomes. There is one problem, however, with this initial Study, and it has to do with the last column in the above table. The Run Average (RA) of the first group is much higher than the RA of the second group. This creates a potential bias for which we need to control. That forms the basis of my next two studies.
What I did to attempt to control for this bias is split the 529 pitchers into three groups: pitchers who were a SD below average in RA, pitchers who were a SD above average in RA, and the rest. For studies two and three, I used the first two groups.
Study #2 focused on the bad pitchers, those that were one SD below average in RA, of whom there were 102. I then repeated the process I used in Study #1 on this group of pitchers, and came up with the following result:
	          N	BFP	BIP	BIP/BFP	H-HR	BABIP	R	IP	RA
High BIP/BFP	19	8548	6811	0.797	2083	0.306	1309	1914	6.16
Low BIP/BFP	16	8224	5468	0.665	1646	0.301	1266	1810	6.30
Again, the pitchers who supposedly do not keep their fielders on their toes had a lower BABIP. This time there was no bias in terms of RA; in fact, the group that allowed more BIP/BFP had a lower RA.
Let's move on to Study #3 which replicates Study #2, but using the best players, those with the lowest RAs in the data set. Here are the results:
	          N	BFP	BIP	BIP/BFP	H-HR	BABIP	R	IP	RA
High BIP/BFP	11	8655	6576	0.760	1822	0.277	763	2112.3	3.25
Low BIP/BFP	10	6439	3655	0.568	1006	0.275	510	1598.3	2.87
The same problem that arose in Study #1 is apparent here as well. The low BIP/BFP group has a much better RA than the high BIP/BFP group. This is because the low BIP/BFP group strikes out so many more batters, and it's a problem that cannot really be addressed within the parameters of this study. However, the BABIPs for the groups are so close that when we factor in that the BABIP for the low BIP/BFP group has to be regressed a little more due to a smaller sample, we can conclude that there is no difference in BABIP between good high BIP/BFP pitchers and low BIP/BFP pitchers. I think. (I say that because in a minute I will show this conclusion to be incorrect). Still, we see no evidence that "keeping fielders on their toes" will result in better fielding.
Studies #4 and #5 repeat what I did in studies #2 and #3, respectively, except I adjusted pitcher BABIPs for their team BABIP, thus filtering out other potential biases (fielders, park, etc.). The groups are the same; the only thing that will change are their BABIPs. Let's take a look at the high-RA pitchers:
	          N	BFP	BIP	BIP/BFP	H-HR	adjBABIP	R	IP	RA
High BIP/BFP	19	8548	6811	0.797	2083	0.312	1309	1914	6.16
Low BIP/BFP	16	8224	5468	0.665	1646	0.309	1266	1810	6.3
Adjusted BABIP was calculated by taking each player's hits on balls in play, finding his expected hits on balls in play based on his team's BA, and then dividing hits on balls in play by expected hits on balls in play and multiplying that by the average BABIP of the group.
Here, we again see that those who allow few BIP/BFP have a better BABIP. Let's move on to my final study:
	          N	BFP	BIP	BIP/BFP	H-HR	adjBABIP	R	IP	RA
High BIP/BFP	11	8655	6576	0.76	1822	0.269	763	2112.3	3.25
Low BIP/BFP	10	6439	3655	0.568	1006	0.256	510	1598.3	2.87
Now you can see why I said that among pitchers with low RAs, the ones who have low BIP/BFP rates also have better BABIPs. Adjusting for team makes a big difference.
Anyways, as you can see, in all five studies, the pitchers who allowed few BIP/BFP, pitchers, who could also be called "three true outcomes" pitchers because they allow many home runs, walks, and strikeouts, had much better BABIPs than those who allow the ball to be put into play most often. Why? It seems to me that the positive correlation between strikeouts and BABIP is part of it, probably a large part. But no matter what the exact reason, it seems fairly clear that this piece of conventional wisdom is wrong. "Keeping fielders on their toes" does not ensure better defense; in fact, it does the opposite.
Note: I also thought of doing a study using pitch count data since throwing more pitches results in longer at-bats, and fielders that supposedly get bored. However, as walks and strikeouts are really what dictate how many pitches a pitcher throws, and since they largely dictate a pitcher's BIP/BFP, the correlation between BIP/BFP and Pitches/BFP is almost perfect (.95 r-squared). In other words, doing such a study would add nothing new.
David Gassko is a writer for The Hardball Times and runs the blog, Statistically Speaking.
[Additional reader comments and retorts at Baseball Primer.]
| Designated Hitter | September 15, 2005 |
Hot Doggin' It: A Peek Inside the Sausage Race Factory
Like most of us, my dreams of setting foot on a major-league baseball field died a painful, inglorious death in youth. In the spring of 1985, my name was left off the call-back list for my high school freshman baseball team. Mistakenly, I'd anticipated a bull market for good-field/no-hit futility infielders with outstanding hustle, decent plate discipline, and a working knowledge of the nascent field of sabermetrics. The coaches of East High's rookie squadron begged to differ, a decision that no doubt haunts them to this day.
 Twenty years later, however, I did make it onto a major league baseball field, and in a manner that even some big-leaguers would envy: I ran the Sausage Race at Miller Park. With my wife Andra and an entourage of six others -- including her parents Aaron and Aune, celebrating their 40th wedding anniversary on that very day -- in tow, I made my major league debut as 20,000 cheering fans looked on, shouting my name in encouragement. Thirty-five-years old, two years removed from arthroscopic shoulder surgery, I made The Show at last.
The Sausage Race (officially the Brewers/Klements Racing Sausages) began in the early '90s as a scoreboard gimmick. Back when the Brewers played at County Stadium, three virtual sausages -- the Bratwurst (#1), the Polish Sausage (#2) and the Italian Sausage (#3) -- "ran" an animated race to the accompaniment of the "Chariots of Fire" theme at the end of the sixth inning. By the mid-'90s, the Hot Dog (#4) joined the lineup. But more importantly, the team which brought you the Bernie Brewer mascot sliding from a chalet perched in centerfield into a giant beer stein after a Brewer home run had come up with a new gimmick: for Sunday games, the mascots as we now know them -- over seven feet tall and made of foam -- would conclude the race after the animated portion, emerging from a gate in leftfield. In 2000, the team's final year at County Stadium, the "real" sausages ran every game, and the scoreboard element was consigned to the dustbin of history.
My father-in-law claims that the idea of actual racing "sausages" (instead of their video counterparts) may have come from him. There's the slightest possibility he's onto something. His son Adam, now my brother-in-law, worked for the Brewers in ticket sales in 1993 and 1994, and would have been capable of passing the idea along; years later, with no single person claiming credit for the "eureka" moment, a Brewers employee he met admitted that the idea came from the father of one of his fellow employees. Well, that's Pop Hardt's version of the story, and he's sticking to it.
Like all too many of the good things in life, landing a role in the Sausage Race takes a connection on the inside. Several years ago, when Andra returned to Milwaukee to continue her film career, she became friends with one Mike Zidanic. Last spring on a visit from New York City, she met Mike's brother Joe, the Brewers Controller and Director of Spring Training Operations. Andra told Joe about my website and my writing, and came away from the conversation with a business card and a promise that given two weeks notice, Joe could get me into the race the next time I was in town. As fate would have it, that next time was the weekend of my wedding back in May. Alas, the Brewers were on the road; otherwise our family and friends might have been treated to a rehearsal dinner with me in a seven-foot tall costume. Much to the relief of my mother, things didn't happen that way.
Andra's parents may have differed on that topic, however. Their pride in all things Wisconsin -- from the Badgers to the bratwursts to Summerfest to the spectacular art museum -- is strong, and Andra guessed right when she set the wheels in motion to get me into the race as part of the surprise, action-packed anniversary weekend she and her brothers had planned for her parents. They were truly tickled to have me providing some of the afternoon's entertainment by upholding a local tradition, one that the whole family would be talking about years from now. It's not as though they've never touched mascot greatness, however. Adam once got to bring the Bernie Brewer costume home from work, and photos of the occasion dot the Hardt household. I'm still not sure that doesn't trump my claim to foam-covered fame.
Normally I can't be separated from my scorebook when attending a ballgame. I keep score not only because I want a precise and personal record of what happened and what I saw on any given trip to the ballpark, but also because it keeps me tethered to the action. But knowing what I've signed up for, I've left my scorebook in New York City this time. It's hard enough getting a friend to cover when I take a refreshment break at a ballgame, but asking someone to score while I run the Sausage Race is too much, even of an in-law.
Besides, by the bottom of the first inning, I can tell that everyone in my entourage is just as distracted as I am. After the Brewers put two men on with nobody out against the Padres' Jake Peavy, the heart of the lineup -- Prince Fielder, Carlos Lee, and Geoff Jenkins -- all goes down swinging. Apparently, even the Brewer sluggers can't wait to see me run. A few shakes of the head are all we can muster.
And so we watch with only mild interest as Peavy and the Brewers' Doug Davis settle into a pitchers' duel as the innings fly by. The Padres score the game's first run in the third inning on a handful of singles and a bunt. At this point I realize that breakfast is a distant memory and that salted peanuts alone are not going to be enough to tide me over until my duty is done. Against the admonishments of my mother-in-law, I take my Family Day coupon for a free hot dog and small soda to the nearest concessions stand, load up on Secret Stadium Sauce, mustard and sauerkraut, and down my dog -- an impressively grilled frank that puts the Yankee Stadium fare to shame -- in about two minutes time. Alas, the entire bottom of the third and top of the fourth take scarcely longer (a combined 16 pitchers, I discover later), the hitters swinging early in the count like they've got a plane to catch.
My palms sweat as the bottom of the fourth approaches. Just nine more outs until I have to report for duty, my hot dog and soda now churning in my stomach. The Brewers put something together. Fielder leads off the inning by ripping a double down the rightfield line. Lee lines a single up the middle; Fielder freezes momentarily, and only reaches third base. On a 2-0 count, Jenkins hits a screaming one-hopper right to Xavier Nady, the Padre first baseman, who's close to the bag as he holds Lee on. He steps on first, then, almost with a look of astonishment that I can see from the upper deck, throws home. Fielder tries to score, doing so with a style that suggests Refrigerator Perry smuggling a Thanksgiving Turkey into his bedroom while his relatives load their plates with stuffing. Uh-uh. It's his second baserunning mistake of the inning. Fielder lowers his head and collides with Padre catcher Miguel Olivo, who holds onto the ball. Out. Two pitches later, Lee and Hall advance as Olivo's throw back to the mound eludes Peavy. The powerful Russell Branyan is intentionally walked to load the bases to face weak-hitting Chad Moeller, who promply pops out to end the threat.
The next inning sails by, and soon Andra walks me down to Guest Services, on the first level behind home plate. Joe is there to meet me, and two of my fellow participants are there as well: Kip Elliot, Chief Financial Officer for the Minnesota Twins, and Matt McKenzie, a writer for Street & Smith's Sports Annuals. Joe greets us, then quickly hands us off to Chris Peck, officially the supervisor of the Brew Crew, the in-game hospitality staff which runs the ballpark's between-innings festivities. Later I learn that Chris likes to refer to himself as the VP of Mascot Affairs to impress the ladies.
Joe tells Kip's wife and Andra to stay nearby so that he can get them onto the field to shoot photos when the moment arrives. Chris guides us down into the bowels of Miller Park, along the bare cement industrial concourse that rings the field. Doors to offices, clubhouses and storage rooms open off the concourse; there's even a mini concessions window with what must be employee prices listed on a small plastic sign: "Hot dog, $1.50." Kip, Matt and I make small talk amongst ourselves as we're led down a hallway to the Sausage locker room. Around us, a buzz of ushers, concessionaires, maintenance and ground crews go about their business.
It's not even as glamorous as you'd expect. The four huge costumes lie face up on a concrete floor bare except for a heap of four smaller sausage costumes. It's Sunday, and as Chris has explained, that means this race is actually a relay, with the four big weenies running their appointed routes from partway down the leftfield line, around the dirt behind home plate and to the Brewer dugout on the first base side, where we'll tag our little weenie counterparts, who finish the race by running all of about 20 yards.
Before we do anything, Chris passes around a clipboard. Each of us required to sign a waiver indemnifying the Brewers and their employees should anything happen to us in the race. Nobody gives the waiver a second thought as we sign our disability payments away while sizing each other and our costumes up. We're all rookies at this, and none of us has any real preference as to which sausage we'll represent. I had gone into the weekend thinking Bratwurst, perhaps a simple Pavlovian reaction to the word "Milwaukee," but the thought of lederhosen, fake though they may be, is too much. Thinking of the quality frank I'd ingested a few innings before, the ease of punning around with the title ("Top Dog," "I Wanna Be Your Dog," "Frankly, My Dear"...), and a bit of doggerel my grandfather used to recite ("A loaf of bread, a pound of meat, and all the mustard you can eat..."), I pick the Hot Dog. With an eye towards strategy, I note that it's also the smallest costume, which makes sense as I'm the shortest of the three of us. Matt, who stands about 6'3", takes the Italian, the other short one -- a completely opposite strategy from mine. Kip takes the Bratwurst, leaving the Polish for our mystery guest, who we're told is a TV announcer for the Padres.
We study our costumes, attempting to stand them up and watching them crumple (they're soft at the base) as Chris runs down what to expect: the costumes are hot, but we won't have them on for more than a few minutes; we'll carry them down to the leftfield gate, a good schlep for these contraptions, which appear to weigh about 30 pounds; you can't see much through the mesh screen; you can't lift your arms very far; you don't want to lean too far forward or you'll tip over; please don't tip over, because it costs us about $5,000 to clean a costume; keep running after you tag your little partner, because we have to be off the field in 90 seconds.
It's a lot to digest, and so Chris keeps hitting some of these points as we carry our costumes back down the hallway and onto the concourse. As we do, a vehicle -- a golf cart without its top or a set of clubs, perhaps -- whizzes by. It's Derrick Turnbow, the Brewers' scraggly closer, headed down to the bullpen now that the fifth inning has ended. Turnbow can't even be bothered to turn his head at the sight of us, but then he's probably seen this very sight some 70 times this year.
A few steps along the concourse and Chris has recruited Marty Hagedorn, a younger employee wearing a navy blue t-shirt with the words "Brew Crew" on the back. Marty is to carry the Polish costume down to the gate, and if the mystery guest doesn't show up, to run the race himself. No sweat; Marty tells us he won on Saturday, running as the Hot Dog. In the absence of "celebrities" like us, Brewers employees often get to race themselves.
As we pass the entrance to the visitors clubhouse, a stocky, bald man comes hustling in from the other direction. It's Mark Grant, the Padres color analyst and a former major league pitcher. He's going to change into short and a t-shirt and will meet us at the gate. Meanwhile, Kip, Matt, and I have reached a gentleman's agreement on strategy. Rather than risk injury or embarrassment to ourselves or each other, we're treating our upcoming race less as a competitive affair than as a "Sunday jog." With the kids involved, we've decided to keep things close so that they can decide the final outcome.
Finally, we reach the entrance to the gate, where two big doors swing open to let us in. To the left of us is the paramedic cart, manned by two stern-faced medics, one of whom is reading a newspaper. To the right is the batting-practice cage, where we lean the costumes upside-down. Through the gate is Brewers leftfielder Carlos Lee watching as Doug Davis retires the Padres 1-2-3. I look through the chain-link fence as Chris continues with his advice: the dirt we'll be running on is loose, and it changes in consistency near home plate, so don't be alarmed; watch out for stray bats near the on-deck circles; the costumes are top-heavy, so please don't tip over.
Grant shows up, bursting with energy and enthusiasm. Husky at 42, he certainly looks more athletic than the rest of us, though we're all plausibly in shape. He tells Chris of his plan to mix it up with Padres reserve Robert Fick as he runs by the visitors dugout. Chris turns white as a ghost. "Please don't," he pleads, motioning to Elliot, "Or else I'm going to have to hit up this guy for a job. Don't."
Tangling with the players is no laughing matter, not since the fateful day two summers ago when Pirates first baseman Randall Simon catapulted the the race into the forefront of the sporting nation's consciousness by hitting the Italian Sausage (worn by one Mandy Block, a "Brew Crew" employee) with a bat. The blow caused the Hot Dog (worn by Veronica Piech) to fall as well, causing both young ladies scrapes and bruises. A county sheriff arrested Simon after the ballgame on a charge of disorderly conduct, handcuffing him and booking him at the Milwaukee County jail. Simon was released but fined $432. He paid and apologized, but his career, marginal enough as it was, became a migrant one as well. A month after the incident, he was traded to the Cubs, helping them down the stretch and nearly to the World Series. But he split last season with the Pirates and the Devil Rays, hitting a meager .188 with three homers, and drawing releases from both clubs. After tearing up the Mexican League earlier this year, he's presumably pounding the sausage somewhere else.
As Chris pleads, all I have to say is "Randall Simon" before Grant concedes the point. There will be no tomfoolery, at least no more than usual. The message is clear: mess with this particular sausage party, and you'll be a pariah.
Chris advises us to stretch and our quartet begins to limber up, mindful of our shoulders, backs, hamstrings, calves, and groin muscles. Nobody needs a trip to the DL for this, we remind each other, repeating our "Sunday jog" mantra. The medics watch us, their icy glares reminding that they have little desire to cart anybody off the field, especially a non-player.
As they glare, a ball comes whizzing into leftfield, ricocheting with a loud bang off of the outfield wall as Padres leftfielder Damian Jackson retrieves it. Brewer second baseman Bill Hall has whacked a double, scoring Geoff Jenkins to tie the game. Both hits come off of Chris Hammond, who has relieved Peavy after five innings. The home crowd is getting worked up into a frenzy. From the second deck directly above us, two fans call out, "Which one of you is the Hot Dog?" I raise my hand. "Kick some ass, Hot Dog," he screams, clearly a couple beers ahead of the rest of us. I give the fans a thumbs-up.
Chris has told us not to suit up until there's one out in the home half of the sixth, but with the Brewers mid-rally, who knows when that will be? Brewer manager Ned Yost sends up a pinch-hitter for Russell Branyan in Wes Helms, prompting Padre manager Bruce Bochy to counter with reliever Clay Hensley. As Hensley warms up, I whip out my cell phone to call Andra, relaying the message that I'm the Hot Dog and telling her to spread the word to the family. Helms takes the at-bat to a full count before lofting a fly ball to shallow right, deep enough to score Hall from third base, where he advanced on the previous throw home. It's 2-1 Brewers, and the crowd has reached a fever pitch.
It's also time to suit up, and the four of us turn away from the gate and towards our costumes. I feel like an astronaut about to don my spacesuit, but I'm wrong. There's no way a spacesuit can be less cooperative. I watch as Matt struggles to put his costume on, laughing nervously at his expense. Looking into the costume, I'm reminded of a scene in Home Movie, a Chris Smith documentary Andra and I had watched on my laptop in flight. One couple has bought an abandoned missile silo in Kansas and converted it to an subterranean home; Smith shows several shots down the cylindrical tunnels that remind me what I'm viewing here, the top of my costume seemingly 15 feet away.
It takes me two tries to get into the costume straight enough so that my head goes through the shoulder harness. My arms are pinned to my sides, and I worry about my surgically repaired shoulder as I struggle and twist my way into uniform. Finally, I'm in, but even as I struggle to balance myself standing up, that's the least of my problems. Now I can't see a damn thing.
The costumes each have a circle of mesh just below the characters' necklines. The mesh is colored white, and the holes are very small. In direct sunlight, the effect is literally blinding; it's necessary to create an artificial visor by cupping my hands in front of the mesh, just to get my bearings. To say that I can really see is a stretch; suddenly the danger inherent in this endeavor is much more palpable than before. As Hensley strikes out Moeller and Davis to end the inning, I get that much more of a reminder when the gate swings open, nearly clocking me even as I'm looking straight ahead.
 Chris instructs us to head down the foul line to the notch where the warning track inside the field of play ends. My adrenaline surges. The sun beats directly down on us, and it's difficult to see. The crowd is on its feet, trumpets herald our place at the starting line, and the PA announcer introduces each one of us to the cheers of 20,000 fans. I've got the inside position, next to Polish, German, and Italian, hoping that this gives me an advantage.
A gunshot sounds over the PA and we're off. Polish Sausage clearly didn't get the memo about the Sunday jog, and gets about 10 paces ahead of the field before the rest of us know what's hit us -- I'm left wondering if Grant greenied up in the Padre clubhouse.
As we choke on Polish's dust, the other three of us are neck-and neck-until Italian Sausage makes his move. German Sausage responds by giving him a wider berth, stumbling as he does so. Our empty heads collide; we trade paint. I'm not sure if it's my fault, so I bark out a rather sorry "Sorry!" without breaking stride. By the time we've passed the Padre dugout, I've got sole possession of third place, but a good ten paces behind Italian and another ten behind Polish.
As we round the home plate bend, I maintain my lead over German, but by then Polish has already tagged his partner. Lost cause. Italian tags, and his partner, the fastest of us all, nearly closes the gap before the little Polish crosses the tape. By then I've tagged my partner, slapping a hollow-headed little Hot Dog as she runs her way to third-place glory. We've been instructed to keep running through the tag because we have to get off the field ASAP, though Polish and German have stopped. As I tag I see Andra, video camera in hand, but I can't even stop to talk as we're hustled off the field still nipping at the heels of the little weiners. Some people get 15 minutes of fame; our entire race is done under 45 seconds.
Still, it's a hero's welcome we receive at the rightfield gate as we jog off the field and onto the concourse. Struggling out of our costumes, we shake hands with each other, hug our wives, and high-five our relay partners; mine's a cute brunette girl of about eight named Sabrina, who's apparently looking forward to regaining her two front teeth. I've had the costume on for all of five minutes, but I'm drenched with sweat, charged with adrenaline. No, I didn't win, but the important thing was that I competed, and no one will ever be able to take that away.
Yes, I'm afraid so: when you run the Sausage Race, everyone's a weiner.
Jay Jaffe is the creator of the Futility Infielder website, an author of Baseball Prospectus, and a graphic designer who lives in New York City. He'd like to thank Joe Zidanic, Chris Peck and the Brew Crew for making his race day happen, the Hardt family for their love and support, and Nicole Hanson for providing the great race photos.
[Additional reader comments and retorts at Baseball Primer.]
| Designated Hitter | September 08, 2005 |
Remember When
When I was five years old, we had this Saturday morning tradition. Dad would take me and my two-year-old brother Barry to 7-Eleven, or Schepps, for something out of the ice cream freezer. I think I usually went with a Banana Fudgsicle, Barry one of those orange Push-Ups, or maybe a Drumstick.
There were four games in town in the mid-70s, one of which was king. My parents were religious Dallas Cowboy fans (not that that distinction made them even remotely unique in these parts). Fall Sundays were devoted to football, usually at our house or the Donskys', with Halleck's chicken, chips and El Fenix queso, and Pepsi as the everyday lineup, and a mess of all kinds of other stuff in rotation around it.
Pulling up to Schepps on one of those Saturday mornings, I asked Dad how many Cowboy players he knew personally. Upon learning that the answer was zero I questioned why he cared so much whether Dallas won. I have no recollection what his answer was. But the question, and the parking space we pulled into while my question hung in the air, are etched permanently in my memory.
There were also the Texas Rangers and Dallas Tornado and Dallas Blackhawks. The latter two were never televised. The Rangers were televised roughly once a week, which made them no different from the Cowboys in that respect. They were different in just about every other possible way, though. Rather than serve as the focal point of the day, the televised Ranger game, if anything, was generally background scenery while we got ready to go swimming somewhere.
My most vivid memories of Ranger games on TV in the mid-70s involve Mark Fidrych firing a gem against Texas (while at either the Kreislers' or Bruckners' house, waiting to swim); Eric Soderholm driving in a game-winner against Texas in the ninth (ruining my mood as I dove into the pool at the Viroslavs'); and Willie Horton hitting three home runs in a game (while at Grandma and Papa's, about to head to the pool). I have it stuck in my mind that Adrian Devine pitched in the game that Horton went nuts in.
When I was seven, we graduated from weekly ice cream to a pack of Topps, baseball half the year and football the other half. (I can't remember whose idea it was to make the switch, but I like to think it was mine.) I still remember the older man who ran the Schepps grabbing the cardboard box full of wax packs off the top shelf of the candy aisle, pulling out not the top pack but one near the bottom of a stack and promising me and my brother that there'd be a Cowboy in it. And he was right: a few cards in (seems like Lem Barney and Vern Den Herder delayed the gratification, though there's no way I actually remember that part), Rayfield Wright's All-Pro face smiled at me, keeping to himself the secret of how Schepps Man knew. The bookmark-grade slab of "gum" was an afterthought, if that.
The love affair with sports no longer belonged only to Dad.
I'm not sure when baseball separated itself from football for me. My parents weren't really baseball fans. If I'm really honest with myself, the time when football was no longer riding shotgun, and instead began to take a backseat, was probably 1984, when the Cowboys started missing the playoffs -- until that time I was as crazy a football fan as I was a baseball fan. As demoralizing as it was to have my football year end with the regular season, I look back on it and realize how it set me up to be somewhat of a snobby fan. It's easy to slither off the bandwagon when a team you expect as a child to go to the Super Bowl every year has as awful a win-loss record as 9-7!
Further back -- and the fact that I vividly remember this tells you how snooty a Cowboy fan I was ... how entitled I felt ... even at age eight -- the Cowboys had a 1977 home game against Tampa Bay blacked out because they failed to sell out Texas Stadium (The horror!). What I remember about that is the stroll on which Mom took us (including my five-month-old sister Mandy) around Pennystone and Blue Trace, with the game on the radio, courtesy of Verne Lundquist and Brad Sham (I've always been a radio guy anyway, in both sports, from those days until now).
I was profoundly sad. The blackout shook my eight-year-old soul like a stock market crash. Because in those days, Dallas Cowboy ups and downs were Jamey Newberg ups and downs.
But Dallas went on to smack the Broncos in the Super Bowl that year. I celebrated by working and reworking my jigsaw puzzle that winter of Randy White and Harvey Martin mauling Norris Weese. A thousand times.
So how was it that baseball kept up with football in those years? Dallas was winning 11 or 12 games every season, finishing atop the division almost without exception, while the Rangers would annually hover around .500 (with the exception of the 1977 Willie Horton club, which won 94 times but still finished eight games behind the Royals). How was it that my affection for the Rangers didn't keep as company the Tornado and Blackhawks, rather than the Cowboys?
Because of the tosses with Dad or Barry, or the daily games of streetball, or the pitchback in the backyard? Doubt it; they were all just as likely to involve a football as a baseball.
I think it was a few things. Football was a once-a-week event, baseball a daily ritual. Though we never missed an opportunity to meet Roger Staubach at Neiman's or Drew Pearson at Joske's, it was a lot easier to catch Jim Sundberg and Mike Hargrove at John Mabry Clothiers, or Jim Fregosi and Bill Fahey and Roy Smalley at Northaven Field to kick off the Little League season. And the world of baseball cards proved to be limitless, football cards not so much.
(Anytime I hear "Philadelphia Freedom" [Elton John], or something by Cliff Richard [thank goodness that's pretty much a non-existent possibility these days], or "Steal Away" [Robbie DuPree], or "Too Much Time on My Hands" [Styx], or "Still the Same" [Bob Seger], I immediately think I'm in the car with Mom, as she's about to drop me off at whatever mall the baseball card shop "Remember When" was located at.)
Once I was old enough to play organized ball, there was lots of baseball, no football. There were summers when the game was part of my routine every day, either games at Northaven or practices at Walker or scorekeeping at Churchill. And Risenhoover and Merrill on the radio at night, bringing me Rangers baseball as I drifted to (or fought) sleep.
And as for the Rangers, those years of mediocrity probably solidified a loyalty that Cubs fans made an art, and that Cowboy fans have never really shown, or understood. It's easy to root for a perennial winner; there's more character, though, in standing behind Sisyphus and helping push.
The game itself has always captivated me. You can't find a book about football in the same league as "Nine Innings" or "Men at Work" or "Three Nights in August," none of which I imagine would show up on a list of the 100 best baseball books ever written. I'm a competer -- which I know isn't a word but which still connotes something different than "competitor," I think -- and I find irresistible the chess matches that make up the at-bats and the innings and the games and the series and the seasons and even the off-seasons in baseball. I say that now as a fan; once upon a time it was as a player.
There was a photo of Bucky Dent one '70s spring in Street & Smith's, hurdling a runner trying to break up a double play, and a shot in the same magazine of Robin Yount ranging into the hole, and they made me want to be a shortstop. It was my home on the baseball diamond for 12 years, until my high school coach put me on the mound as a junior and made me a pitcher-outfielder my senior year. (My day to pitch? "Bullet the Blue Sky" on my headphones, on the bus headed to Loos Fieldhouse or Reverchon Park.)
I hated Coach for moving me to the outfield. And then I wished someone had moved me sooner. It's where I ended my baseball career one year later and two years after that, in that one week in Austin, that one day in Georgetown, and that one final week again in Austin. I love the outfield. I loved shortstop more; but I was better as an outfielder.
To this day there are guys I played with in Little League and middle school and BBI and high school and those 10 days at Disch-Falk and that one at Southwestern and on the intramural softball fields with whom I keep in touch. Maybe that's what it's been, more than the baseball cards and the transistor radios and the Street & Smith's and even the chess matches, that's responsible for my latching so acutely onto baseball. I've been able to share my passion for this game with so many people, a group that has multiplied exponentially the last eight years.
Erica just started Kindergarten. And though she didn't know any of her classmates beforehand, it won't surprise me if she sat down to eat lunch last week with someone who one day will stand up at her wedding.
And on that day when her mother and I give her away, I hope to remember these Kindergarten days well, and the things I was thinking about as we were getting her ready to head out the door that first morning. One of which was which kind of ice cream she'd pick out that afternoon.
Jamey Newberg, author of www.NewbergReport.com as well as six annual Bound Editions of the Newberg Report, is a lawyer at the Dallas firm of Vial, Hamilton, Koch & Knox, maintaining a practice specializing in general civil litigation, school law, and insurance coverage. He earned his undergraduate degree, his law degree, and two "Thanks, but no thanks" pats on the back from Coach Gus after trying to walk onto the University of Texas baseball team in 1987 and 1989.
| Designated Hitter | September 01, 2005 |
From the Press Box to the Pitcher's Mound. . .Sort Of
"If I ever get some super-cancer," I say to Alex Rodriguez, "I know exactly how I'd want to go out."
The Yankee third baseman flexes an eyebrow.
"Go ahead, tell me," he says.
"The Make-A-Wish Foundation comes to my bedside and says, 'Anything you want.' I say, 'OK, let me pitch to Alex Rodriguez. One at-bat. I've got him figured out.'"
Now A-Rod is laughing.
"How would you pitch me?"
"I am so below your hitting speed you'd never touch me. All off-speed stuff. You'd be wrapped so tight you'd over-swing at everything and would have to retire on the spot. Then I could die in peace."
Rodriguez, still amused, says, "You figured it out, didn't you? Pretty good for a writer."
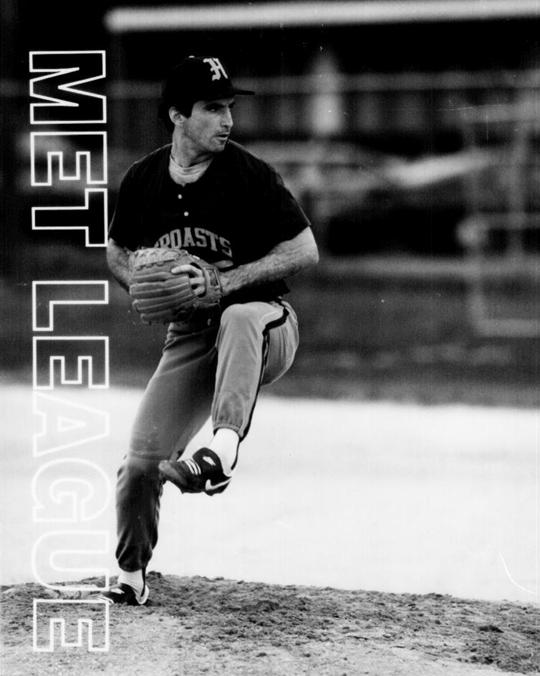 I take that as a compliment - sort of. It wasn't the sportswriter in me that was talking to A-Rod, it was the semi-pro pitcher who hasn't let go of the game in his 40s. From Leonia (NJ) High School, to Columbia University to the Hackensack Troasts in northern New Jersey's Majors-Met League, I've led a not-so-secret double life that's set me apart from my colleagues in the press box. As the father of two toddlers, baseball has helped me cope with diaper-hell, as well as stave off a total surrender to the couch.
I've been covering New York baseball since 1984. I love a 2-1 pitcher's duel because I still see the grace and beauty of fastballs at the knees and sliders on the corners. Truth is, I see myself out there, which is ludicrous considering everyone else my age has stopped reaching so high.
I remember Don Mattingly recounting how he and Tino Martinez snuck off to a back field in spring training in 1999. The Yankee captain hadn't picked up a bat since his last plate appearance in the 1995 Division Series against the Mariners, but Tino had convinced Mattingly to spend a few minutes in the cage, tap into his ghosts, just to see if they still were breathing.
"First couple of pitches, it all came back to me, line drives up the gaps," Mattingly said. "Then I thought, 'What the hell am I doing?' I put the bat down and never went back there. I know I'm never going to be what I once was. And I'm okay with that."
I know I should be as reasonable as Mattingly. The other New York baseball writers who had successful college careers have moved on, too. John Harper from the Daily News (who played at University of Bridgeport) and Tom Verducci from Sports Illustrated (who played at Penn State) play golf now. So why can't I?
Maybe it's because they were never pitchers. From Little League all the way to Cooperstown, there's a fraternity convened by the adrenaline rush of throwing a baseball. Bret Saberhagen once told me, "Nothing matches making a hitter swing and miss. It's the greatest feeling in the world. Guys who retire, they spend the rest of their lives looking for it, but once you stop pitching you never get it back."
Of course, my addiction will be easier to kick because I don't throw all that hard. At 80-mph (on a good day), my two-seamer resembles Kevin Brown's, minus 10-12 mph and the personality disorder. But Saberhagen was right about the miracle a major leaguer creates every time he throws a ball. That's why I laugh when people say writers are jealous of the players' money.
Me? I envy the heat. Just about everyone can toss a football or sink a jumper. In that sense, any amateur athlete can mimic an NFL or NBA star. But the ability to throw 90-plus is a gift from the gods, bestowed upon the (very) few. If you don't believe me, check out the gun readings at one of those pitching-booths at the ballpark. Even the toughest-looking guys, all beered up and trying to impress their girlfriends, have trouble reaching 70-mph. Most everyone else is in the 50's and low 60's.
At 80-mph I'm at least able to picture what Mount Olympus looks like. One afternoon in 1997, I was sitting in the visitor's dugout during batting practice in Atlanta talking to Al Leiter about - what else, pitching - when he suddenly said, "Get a ball, let's see what you've got."
So there I am, playing catch with the then-Mets' ace, sweating through my street clothes trying to make my fastball run. For some stupid reason I wanted to impress him.
"Fucking Klap, give it up," is what I heard John Franco say through a smirk, while Leiter was busy analyzing my delivery. For one precious moment, he no longer saw me as a writer but as a fellow pitcher, although with his harsher scrutiny came a piercing blow to my ego.
"Your ball moves, but you need to throw it harder," Leiter said. "You have to get on top of the ball."
"Like this."
Leiter unleashed a cut-fastball the likes of which I had never seen or caught. He threw it so hard I heard the ball hiss, which was unsettling enough. Then it broke to my left, as if it'd been hijacked by a wind shear. Somehow, the pitch accelerated as it darted, which so completely overloaded the synapses of brain my glove never moved.
I just couldn't catch it.
"That's what I'm talking about," Leiter said matter-of-factly.
"That's what you throw in a game?" I said in disbelief.
"Not really. That was about 80 percent."
All that happened before Leiter and I stopped speaking to each other in 2004, when I wrote that he was partially responsible for getting Scott Kazmir traded to the Devil Rays. Leiter subsequently told Michael Kay on ESPN Radio that I should be working for the National Enquirer. So much for my frat brother.
Sooner or later, writers and ballplayers all reach the crossroads. Sides must be chosen: you're either with the press or with the club and the gulf gets wider every year. I've made my peace with the fact that, A-Rod aside, pitching helps my soul more than it does my standing in the clubhouse. The majority of major leaguers are like Derek Jeter, who've decided there's no upside to getting close to the press. We can only hurt the corporation, is what Jeter's handlers have convinced him.
So why do I keep pitching? Probably for the purest reason of all - it's what I do, at least when I'm not writing or helping feed the kids. To stop now would mean tearing away layers of psychological flesh. I guess I'm afraid of what's underneath. Middle age, maybe.
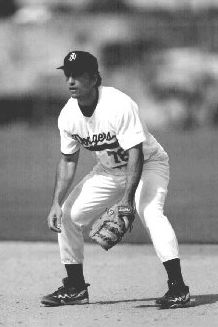 All this explains why I play in a league populated by college kids home for the summer, or ones who've just graduated and are looking to get picked up by an independent team. I've chosen this universe instead of some creaky over-40 league where no one runs or plays defense anymore. But it's also true the kids don't appreciate baseball like the older players. To them, the games are just one of the leisure options that include, in descending order: girls, the bars and the Jersey shore.
One 24-year-old lefty sat next to me in the dugout this summer and drank Red Bull while listening to his iPod between innings. When it was time to get back on the mound, he didn't even turn the music off - just hit the pause button. Such is the confidence that comes with a 90-mph heater.
It's the kid's utter belief in himself that keeps me in touch with the mindset of a major leaguer. Minus the millions in the bank, the kid is Jeter. He is simple, primal, untouched by neurosis. By the time I come home from Hackensack, I am somehow a better husband, a more playful father. My writing is leaner as I picture myself on the mound, engaged in a war at 60 feet, 6 inches.
The longer I play, the more I understand what Saberhagen meant about chasing the holy grail. It doesn't come from writing on deadline. That's just typing in agony. It doesn't come from being in the clubhouse. Too much standing around. Even delivering a spot-on column has a smaller pay-off than it used to. I worry that everyone's lost interest in the written word.
One thing's for sure - the kids sure don't buy the paper. To them, reading is for the elderly, the sedentary. My career interests my teammates not because of my writing, but because of my access to Yankees tickets, even though I've told them the Yankees don't comp the press. And, of course, I'm the one they go to with questions about Jeter - the most common of which is: who's he banging?
The camaraderie in Hackensack is terrific, but I wonder if any of my young friends will still be playing in ten years. Most won't, I bet. There aren't too many Julio Francos (or even John Francos) left. It takes too much work to keep the addiction alive. I still remember the 1996 World Series and what David Cone looked like after Game Three.
He's stopped the Braves cold in their home park, out-pitching Tom Glavine after the Yankees had been flattened twice in the Bronx. Looking back, if Cone's 5-2 victory didn't save the franchise, it at least kept Joe Torre from being fired. Without him, the Yankees would've conceivably been swept, and it would've been just as easy to think of Torre being dismissed by George Steinbrenner.
As courageously as Cone had pitched, he paid a heavy price. He was limping heavily, pained by the arthritic hip that would ultimately end his career in 2003.
"You know, this gets harder every year. I can't even fucking walk," Cone said grimly. "I don't know why I keep doing this."
"You know exactly why," I said.
Cone stopped and nodded. The more it hurt, the more he actually loved it.
Someday, I hope my son understands why his wrinkled old dad is still pitching. Considering he's only three, I better keep popping the Advils and never look back. The couch might be gaining on me.
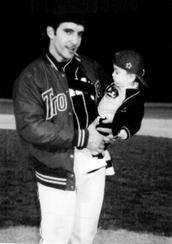
Bob Klapisch has covered baseball in New York for the New York Post, New York Daily News and, most recently, The Bergen Record and ESPN.com. He is the author of five books, including "The Worst Team Money Could Buy" (Random House). His work has appeared in Sports Illustrated, Men's Journal, FHM and The Sporting News.
Klapisch, who pitched at Columbia University, still throws for the Hackensack Troasts in the semi-professional North Jersey Majors-Met League. He lives in Westwood, N.J. with his wife and two children.
[Additional reader comments and retorts at Baseball Primer.]
| Designated Hitter | August 25, 2005 |
The Predictive Value of Bases on Balls
Since the introduction of sophisticated baseball analysis twenty-five or so years ago, analysts have recognized that on-base-percentage (OBP) is the most informative statistic when evaluating a batter. That is, of all the traditional statistics, OBP best reflects a batter's contribution to run scoring. Because the main difference between OBP and batting average is mainly that the former includes bases on balls while the latter does not, an increased recognition of the value of a walk has occurred recently.
Not surprisingly, as analysts gained an appreciation for the value of the base on balls, the importance of the ability to draw a walk began to be applied in instances that may not be as appropriate. Some began to look at the propensity to walk by a minor leaguer as a predictor of major league success. The theory behind this idea derived mainly from the belief that a high walk total signified good plate discipline and strike zone judgment. The existence of these latter two skills, in turn, suggested a player had a higher likelihood of continuing to develop as a hitter.
I never really liked this theory. In the base data set I used in my work on modeling player careers, there was one player who debuted in the majors with a horrible walk ratio but later evolved into a Hall of Famer with a decent walk rate. Willie Stargell walked only 17 times in 438 plate appearances (excluding hit by pitch or sacrifice flies) in 1964, while recording a .304 OBP and .501 SLG. Seven years later Stargell had a huge season, leading the Pirates to the championship with a .398 OBP and .628 SLG. That year he drew 83 bases on balls in 594 plate appearances.
Of course one counter example proves nothing, but it suggested to me that young players who walked only infrequently could develop into stars as well. Furthermore, one can easily imagine the theory supporting this opposing view: a young player who rarely walks has additional room for improvement as they further learn the strike zone (and some players like Alfonso Soriano keep hitting without ever learning the strike zone).
To test whether the ability to draw a walk as a youngster leads to a higher propensity to evolve into a quality major leaguer, I looked at a number of minor leaguers and compared how they developed. Specifically, I looked for pairs of regular players of the same age, minor league level (AAA, AA, A+, or A), and ability who differed significantly in their likelihood of walking. I generally looked for pairs that differed by at least .060 BB/PA, although most had a larger difference. I found 31 such pairs using the years 1998 and 1999; the average BB/PA for the low walk players was .047 (19 BB per 400 PA), while the average for the high walk players was .130 (52 BB per 400 PA). I have highlighted one pair below as an example.
Player                 Level   Year   Age   MLEOW   OW25   BB/PA
Encarnacion, Mario     AA      1999   21    .515    .620   0.118
Barrett, Michael       AA      1998   21    .518    .623   0.056
To approximate ability I used Offensive Winning Percentage at age 25 (OW25), a statistic discussed at length in Paths to Glory, a book I co-authored with Mark Armour. Offensive Winning Percentage was developed by Bill James twenty-five years ago to measure the contribution of a player's batting statistics within the context of the game. Offensive Winning Percentage attempts to estimate the winning percentage of a team with eight other hitters of equal ability and league average pitching and fielding.
James further introduced the concept of minor league equivalencies in the 1985 Baseball Abstract. He demonstrated that minor league batting statistics are meaningful and could be translated into major league equivalents. The key for making sense of minor league statistics, as with many of baseball's other statistical issues, is context. The three contextual items that one must consider in minor league player evaluation consist of the player's age, the level of the league, and the run context the team plays in, including the average runs scored per game in the league and effect of the team's home park.
For the analysis of minor league players I first convert the player's season statistics to a major league equivalent offensive winning percentage (MLEOW). And second, I adjust the MLEOW based on the player's age to predict what his Offensive Winning Percentage at the major league level will be at 25. Using this metric for all players provides a common evaluation point at an age by which most quality players have made their major league debut.
The pairs were then compared three years later to check if one group or the other improved more dramatically. To compare the two groups I took a simple average (not weighted by plate appearances) of their OW25 three years later. [Note: After three years some of these players had been promoted to the majors, so no minors to majors adjustment was needed.] To jump to the conclusion, there is little difference between the development of the two groups. Superficially, the high walk group seemed to exhibit a higher level three years later.
Type		Number	         OW25		OW25 y+3
Low Walk		31		.392		.259
High Walk		31		.394		.322
For several reasons, two theoretical and one practical, I do not believe the difference above reflects a real difference in the development of players. On the theoretical side, a number of the marginal minor leaguers were receiving only limited plate appearances (leading to a wide range of non-representative OW25 due to the small sample sizes), thus, potentially skewing the simple averages. Second, adjusting for players no longer in Organized Baseball (OB) is a little bit tricky. If the average OW25 of the 62 players is close to .400, averaging in a zero for players out of OB will tend to artificially depress the numbers for a group. If these players remained in OB they would probably be below average, but not zero. In this sample the low walk group had nine players out of OB three years later, while the low walk group had six.
To adjust for the first concern, I looked at all players with more than 250 PA or zero. I still included players with no plate appearances because if a player was out of the league that did indicate a lack of improvement. Making this first adjustment slightly narrowed the difference between the groups.
Type		Number	         OW25 y+3
Low Walk		30		.262
High Walk		22		.312
On the practical side, one of the reasons why I do not believe that the above two tables suggest high walk players develop better is that there is not an equal likelihood for all players to move up to the major leagues. Poor minor league hitters are unlikely to make the majors regardless of whether they can draw a walk.
Therefore, as a further test, I looked only at those nine pairs where all the players registered an OW25 greater than .450--in other words, pretty good prospects: players expected to be able to hit close to the major league average at age 25. All eighteen players who met this criteria remained in organized baseball three years later. Interestingly, the two groups showed almost identical development.
Type		Number	         OW25		OW25 y+3
Low Walk		9		.538		.398
High Walk		9		.539		.389
Finally, I evaluated only the top prospects; those with an OW25 of at least .500. Only ten players (five in each group) hit this well. For these minor league hitters, the low walk group actually improved more, although I wouldn't read too much into such a small sample size.
Type		Number	         OW25		OW25 y+3
Low Walk		5		.596		.421
High Walk		5		.596		.371
One interesting aside of this analysis is that it gave me a chance to test my adjustments in calculating OW25, the estimated offensive winning percentage of a player age 25. Obviously, individual players' performance varies widely over a three year period, but for a group of players the value should remain fairly consistent. In fact this seems to be the case. The 37 players who had 250 or more PA three years later recorded an OW25 of .397; three years earlier those same 37 had an OW25 of .421. As can be seen above, all 62 averaged an OW25 of .393. In other words, the adjustments seem to reflect player aging fairly well. One can also see some regression to the mean, however, in the last two tables above: on average, players recording a very high OW25 in a single year do not seem to be able to hold that level as they move through the minor league system.
In terms of player value, baseball analysts have been instrumental highlighting the value of a walk. A walk contributes to team run scoring, and the sabermetric offensive statistics include walks in calculating the run contribution of a batter. But this value should not be confused with some sort of a predicative significance for young ballplayers; at least not until some additional research suggests otherwise.
Dan Levitt is the co-author of Paths to Glory, winner of the 2004 Sporting News-SABR Baseball Research Award. He manages the capital markets for a national commercial real estate firm.
[Additional reader comments and retorts at Baseball Primer.]
| Designated Hitter | August 18, 2005 |
The Official Scorer
Any fan attending a baseball game knows at least some of the players. Many of the more astute fans will know at least one of the umpires. But the one person who has an effect on the game who usually goes unnoticed is the official scorer. This person is appointed by the league, sits in the press box and determines whether a play is a hit or an error, a wild pitch or a passed ball or even sometimes no play at all.
But just who is this person and why is there a need for one anyway?
The Official Baseball Rules contain the following definition in section 1.01:
"Baseball is a game between two teams of nine players each, under the direction of a manager, played on an enclosed field in accordance with these rules, under jurisdiction of one or more umpires." Section 10.01(a) states: "The league president shall appoint an official scorer for each game. . .The scorer shall have sole authority to make all decisions involving judgment, such as whether a batter's advance to first base is the result of a hit or an error."
Section 10 continues on to explain the details of how these decisions are to be made, including the following sentence: "The scorer shall not make any decision conflicting with the Official Playing Rules, or with an umpire's decision."
Players, coaches, managers, broadcasters and fans all see a play on the field and have an opinion as to what the call should be. However, most people's decision is biased in favor of their team. The official scorer provides an unbiased look at each play to determine what that play was and how it shall be recorded.
These scoring decisions feed the box score of each game and the box scores feed the statistics for each player and team. Ultimately, each call becomes part of the official record of baseball and can affect many aspects of the game, such as league leaders, post-season awards and the record book. But these decisions have a more far-reaching effect because statistics drive player salaries and eventually Hall of Fame voting.
Until 1980, newspaper writers held these positions. However, those papers decided that this was causing a conflict of interest for someone who had to interview field personnel to write a story. Thus, baseball started hiring independent contractors to fill the job of official scorer.
The qualifications for a scorer are: (1) knowing the rules, especially section 10; (2) knowing how to apply the rules; (3) having the integrity to make the correct call regardless of the consequences; (4) understanding that someone who questions a call is upset at the call not the person making it; and (5) being aware of the entire field during a play.
Let's look at each of these points in more depth.
The tenth and last section of the Official Baseball Rules is titled "The Official Scorer." The 24 parts of the section cover game situations and are divided by topics such as "runs batted in," "hits," "caught stealing," "assists," and "earned runs." In this section the rules committee has spelled out what the decision should be for each type of play. Some of the phrasing is more precise than other parts but this is the text that determines how a scorer does his job.
For example, section 10.12 states: "Credit participation in the double play or triple play to each fielder who earns a putout or assist when two or three players are put out between the time a pitch is delivered and the time the ball next becomes dead or is next in possession of the pitcher in pitching position, unless an error or misplay intervenes between putouts."
This seems simple but in order to apply this rule you also have to understand rule 10.10 on putouts and 10.11 on assists. Also, the last phrase requires some interpretation. Just what is "an error or misplay?" Let's look at a sample play. With a runner on first base, the batter hits a ground ball to shortstop, who tosses the ball to the second baseman covering the bag for a force out. The relay throw to first base is wild and bounces to a stop near the stands. The batter/runner sees this and starts toward second while the catcher retrieves the ball in foul territory. The backstop's throw to the second baseman is in time to put out the batter/runner. This is not a double play because the wild throw to first is a misplay between putouts which caused the batter/runner to attempt the advance to second. The correct scoring here is a 6-4 putout on the runner and a 2-4 putout on the batter/runner but no double play for the team.
If the batter/runner reached second base safely, then the correct scoring would be to charge the second baseman with an error on the throw to allow the batter/runner to advance.
There are many times that a scorer has to know how to interpret or apply the rules. The previous example is one example but here is another version of the same play. The throw by the second baseman is right on target, in plenty of time to put out the batter/runner at first base. However, the first baseman drops the ball, thus allowing the batter/runner to reach safely.
Many people will use the phrase: "Don't assume the double play" to rule on this play. This comes from rule 10.14(c): "No error shall be charged against any fielder when he makes a wild throw in attempting to complete a double play." However, there is also a note after this rule that says: "When a fielder muffs a thrown ball which, if held, would have completed a double play, charge an error to the fielder who drops the ball and credit an assist to the fielder who made the throw." Therefore, this play is considered a double play. Rule 10.04(c) about RBI also applies here.
Some scoring rules reference playing rules in other sections of the rule book. For example, rule 10.07(e), which concerns the concept of determining the value of base hits, states: "When the batter/runner is awarded two bases, three bases or a home run under the provisions of Playing Rules 7.05 or 7.06(a), he shall be credited with a two-base hit, a three-base hit or a home run, as the case may be." So the scorer must know and understand rules 7.05 and 7.06 to correctly use rule 10.07.
The third qualification is integrity. Official scorers are often the target of yelling and name calling. It seems that everyone has an opinion about the correct call to be made. A fan yelling is annoying. A player or manager calling the press box and yelling is more disturbing. Rarely does the complaint get more violent than just yelling but it does happen occasionally. A scorer has to make the correct decisions regardless of the consequences.
Many times a manager will talk to the scorer about a decision hoping that it will be changed. Even if that call is not changed, the manager hopes to influence the scorer in future decisions so that calls will be more favorable to his team. Calls can not be changed simply to quiet complaints. If a rule was misapplied, then change the call but a scorer cannot bend to the will of a team employee who complains about a call.
This leads into the next qualification. If someone is upset, it has nothing to do with personalities. It is the call itself and not the person making that call that is at issue. A scorer cannot take it personally if someone complains. Some jobs just draw complaints - this is one of them. Thinned-skinned people need not apply.
The last qualification is very important. The scorer must be aware of every player on the field who is participating in a play. If there is a runner on first and the batter hits a ball down the right-field line, the scorer has to watch the ball and the fielder for a possible misplay. However, the scorer also has to watch the runner to see what he does.
If the fielder mishandles the ball slightly and the runner scores from first, whether or not the batter is credited with a run batted in is determined by the actions of the runner and the third base coach. If the runner stops at third but then runs home because of the misplay, then there is no RBI and the fielder is charged with an error. If the runner never stops or slows down at third, then credit the RBI and no error. See rule 10.04(d).
Good judgment on the part of the official scorer is critical to success and the scoreboard cannot affect the call. If a pitcher is throwing a no-hitter when there is a mishandled ground ball in the infield, the scorer should make the call based on the play and not the fact of the no-hitter. If a batter scores on a ball hit to the outfield that is mishandled by a fielder, then the scorer must determine if that misplay rises to the level of an error regardless of the concept of an inside-the-park home run.
About 90% of all calls can be made by most people. The official scorer is hired to make the other 10% of the calls. Rule 10.18 is probably the most misinterpreted rule in the book. It relates to earned runs and requires a lot of interpretation on the part of the scorer. The issue comes from this sentence: "In determining earned runs, the inning should be reconstructed without the errors (which include catcher's interference) and passed balls, and the benefit of the doubt should always be given to the pitcher in determining which bases would have been reached by errorless play." Some of these innings are easy but many are not. These innings always come under the 10% rule.
So there you have it - a short look at what it takes to work a job that has the potential to upset someone every day.
Sample Plays
Here are some sample plays to call. The answers appear at the bottom of the column.
Play 1:
With a runner on second base, the pitch gets away from the catcher. The runner tries to advance to third but is thrown out. Your call?
Play 2:
With a runner on third and one out the batter hits a fly ball in foul territory down the left field line. The fielder moves over near the ball but lets it drop. Your call?
Play 3:
The runner on first attempts to steal second base. He beats the tag but overslides the base and is tagged out before he is able to scramble back to the bag. Your call?
Play 4:
With runners on first and second, the batter hits a slow roller between the pitcher's mound and the third baseline. The pitcher fields the ball while running toward the line and flips it to the third baseman. All runners are safe. Your call?
Play 5:
Runners on first and third. The runner on first breaks for second on the pitch. The catcher throws to second and the runner on third starts for home. Seeing this, the shortstop runs in front of the bag, catches the ball and throws it back to the catcher, thus allowing the runner to reach second base. The backstop blocks the plate and tags out the runner. However, the ball pops out of his glove and the umpire waves the runner safe. Your call?
Play 6:
A tie game is rained out after 6 innings. What do you report to the league?
Play 7:
The batter hits the ball down the right field line and runs to second base. He takes a few steps past the bag and the right fielder throws the ball to the shortstop at the bag. The shortstop tags out the batter/runner before he can return safely to the base. Your call?
Play 8:
The runner on first base starts for second base on the pitch. The ball sails over the catcher's head to the backstop and the runner reaches third safely. Your call?
Play 9:
With a runner on first the batter bunts the ball in front of the plate. The catcher's throw to first is wide and both runners are safe. Your call?
Play 10:
With runners on first and second and no outs, the batter hits a popup near second base. The shortstop moves over under the ball and the umpire calls "infield fly." The runner on second is struck by the ball while not standing on the bag. Your call?
Play 11:
The batter hits a ball toward the mound that the pitcher deflects toward the second baseman. The latter fielder grabs the ball and throws out the batter/runner. Your call?
Play 12:
The home team is ahead 3-0 in the top of the fifth inning when the starting pitcher leaves the game due to an injury. Two other hurlers appear in the game for the team and the score remains 3-0. The second pitcher works through the end of the eighth inning and the third works the ninth. Your call?
Play 13:
With the bases loaded the batter is awarded first on catcher's interference and a run scores. Your call?
Play 14:
With a 2-1 count on the batter the pitcher is removed from the game. The new pitcher walks the batter. Your call?
Play 15:
It is the last game of the season and the home team needs to win to clinch a playoff spot. With the score tied in the bottom of the ninth inning and a runner on second base, the batter hits a ball over the right-field fence. The runner from second scores. The batter rounds first and is mobbed by his teammates. They celebrate and eventually leave the field without allowing the batter to complete the circuit of bases. Your call?
Play 16:
The batter hits a foul popup which is dropped by the catcher. The batter then hits a home run. Your call?
Play 17:
With the home team ahead 5-0, the bases loaded and two outs, the manager brings in his closer. The next batter makes the final out. Your call?
Play 18:
With a runner on third base and no one out, the catcher calls for an intentional walk for the batter. The second intentional ball sails very wide and high past the catcher and the runner on third scores. Now the catcher resumes his usual position behind the plate and the upset pitcher throws two balls unintentionally out of the strike zone. Your call?
Play 19:
With a runner on third base and one out, the batter hits a fly ball to center field. The runner on third scores after the catch. After the ball is returned to the pitcher he tosses it to the third baseman who steps on the bag and looks at the umpire. The arbiter calls the runner out on appeal for leaving the base too soon. Your call?
Answers For Sample Plays
Play 1:
There is no official name for this play. The runner is not charged with a caught stealing [rule 10.08(h) note]. Simply record the out as 2-5 and announce no caught stealing.
Play 2:
No play. If the fielder deliberately allows the ball to fall in foul territory to prevent the runner from scoring after a catch no error is to be charged. [rule 10.14(e)]
Play 3:
The runner is charged with a caught stealing. Credit the catcher with an assist on the play and a putout to whichever fielder made the tag. [rules 10.08(h)(3), 10.11 and 10.10]
Play 4:
If, in the scorer's judgment, the pitcher had no chance to put out the batter/runner at first base, then credit a hit. Otherwise, it is a fielder's choice; charge the batter with a time at bat and no hit. [rules 10.05(f) and 10.06(d)]
Play 5:
Many rules apply here. The scoring runner is charged with a caught stealing. Assists are credited to the catcher and shortstop and an error is charged to the catcher. The runner from first advances on a fielder's choice – no stolen base. [rules 10.08(f), 10.08(h)(1), 10.11, 10.13 and 10.08(d)]
Play 6:
This is a regulation game. The record of all individual and team actions count up to the moment the game ends. Since it is a tie, no winning or losing pitchers are entered into the record. [rule 10.03(e)(1)]
Play 7:
Credit the batter with a double, an assist to the right fielder and a putout to the shortstop. The runner ran past the bag and did not slide past it so he gets credit for the last base reached; if he had slid past the base he would have been credited with a single. [rules 10.07(c) note, 10.07(d), 10.11 and 10.10]
Play 8:
Credit the runner with a steal of second and charge the pitcher with a wild pitch. [rule 10.08(a)]
Play 9:
Credit the batter with a sacrifice and the catcher with a throwing error. [rules 10.09(a) and 10.13]
Play 10:
This is an unassisted double play for the shortstop. [rules 10.10(b)(1), 10.10(b)(2) and 10.12]
Play 11:
Credit an assist to the pitcher and the second baseman and a putout to the first baseman. [rules 10.11 and 10.10]
Play 12:
The starter can not get the win in this game since he did not pitch the required five innings. The relief pitcher who was the most effective in the judgment of the official scorer is credited with the win. In this case, the second pitcher can be given the win and the third pitcher a save. [rules 10.19(c)(1) and 10.20]
Play 13:
Credit the batter with an RBI and no time at bat. Charge the catcher with an error. [rules 10.04(a], 10.02(a)(1)(iv) and 10.13(f)]
Play 14:
Charge the walk to the first pitcher. [rule 10.18(h)(1)]
Play 15:
Credit the run to the runner on second, an RBI and a single to the batter. The home team wins by one run. [rules 10.18(a), 10.04 and 10.07(a)]
Play 16:
This is an unearned run because the batter's time at bat was prolonged by the error. [rule 10.18(b)(1)]
Play 17:
Credit a save to the finishing pitcher since the tying run was on deck when the pitcher entered the game. [rule 10.20(3)(b)]
Play 18:
The run scores on a wild pitch and the walk is not intentional. Only an intentional ball four makes the walk intentional. [rules 10.15(a) and 10.16(b)]
Play 19:
Credit a double play to the fielders involved (at least the center fielder, pitcher and third baseman.) [rules 10.12 note, 10.11 and 10.10]
David Vincent is a long-time member of SABR and was presented with the organization's highest honor, the Bob Davids Award, in 1999. Vincent is the founding secretary of Retrosheet, which is collecting play-by-play accounts of every game in major league history. He has served as an official scorer in four minor leagues, working over 800 games and is now the official scorer in the Washington Nationals debut season. He is known around baseball as "The Sultan of Swat Stats" for his expertise in the history of the home run.
[Additional reader comments and retorts at Baseball Primer.]
| Designated Hitter | August 11, 2005 |
Bargaining with Rick Monday
Like bellbottoms and white loafers, Rick Monday has drifted in and out of style. On more than one occasion, he has dressed the diamond with aplomb - the most beloved or desired baseball player in the country. At other times, you just want to box him up and cart him off to Goodwill.
From my earliest moments as a baseball fan to today, for 30 of Monday's 40 years in the game, he has been one of the most vexing characters I have witnessed on the baseball stage. And I'm going to tell you why.
Let's start out of chronological order, with an anecdote.
When I was a kid - and I couldn't remember the age without looking it up, but it turns out I was 12 - I was sitting in the reserved level of Dodger Stadium on a school night with my dad. The Dodgers were in a tough game against the Reds, still their top division rival of that era.
By this time, Rick Monday had established himself as a true disappointment in Los Angeles. Through his first three seasons with the Dodgers, he had managed 34 home runs after hitting 32 alone in his final season with the Chicago Cubs. He wasn't a complete failure - white loafers don't go out of style overnight. But he was an easy target for disdain for a kid in the blue seats who had already seen better.
I was a quiet kid and a small kid, but a huge fan. This manifested itself in cheering when things went well and quiet moans when things did not. But frustration with Monday had been building for a long time.
In the bottom of the ninth inning, Monday came up to bat. And while he was at the plate, I suddenly screamed out, "Monday - a homer or your life!!!"
You just have to imagine the distaste that I must have built for Monday for such an eruption. My father, not prone to shock, was agog. In the row in front of me, a stranger, a veteran of the baseball wars, turned back and growled, "Dream on, kid."
The pitcher (Doug Bair) threw. Boom! Over the fence. Ballgame. Dodgers win.
The hero was Rick Monday? The hero was Rick Monday.
My dad was beside himself. The man in front turned back, his turn to be agog.
Not for the first time and not for the last, Dodgerdom had sold its soul to a fickle Monday.
The ups and downs of Rick Monday don't start with the Dodgers, of course. Monday, as many of you know, was the first amateur baseball player drafted by the majors, ever. He was picked No. 1 by the Kansas City A's in 1965, after starring at Santa Monica High and Arizona State. Monday then rewarded the A's a year later by going 4 for 41 with six walks (.384 OPS) in his first season - evidence that his seductive charms could not be trusted blindly, though it's hard to blame Monday, who was still only 20 years old.
For several years thereafter, before he penetrated my consciousness (I was born in '67), Monday was a good player, if not a star. Ten consecutive seasons with an OPS+ over the league average of 100, nine of those seasons above 120. Monday had some power, some speed, and could draw many a walk, first with the A's (in both Kansas City and Oakland), then with the Chicago Cubs.
Trying to catch up to the Big Red Machine in 1976, the Dodgers had already been engaged in trade discussions with Chicago concerning Monday when the Cubs came to town for a three-game series in April. Monday went 1 for 8 in the first two games, but was still batting an enticing .345 (1.053 OPS, not that anyone paid attention to that then) on April 25.
In the bottom of the fourth inning, 37-year-old William Errol Morris and his 11-year-old son suddenly appeared out of nowhere in the Dodger Stadium outfield with a flag and some lighter fluid. To this day, I had always wondered why, and baseball researcher Bob Timmermann found me a newspaper clip to explain it. "The man who tried to burn the American Flag at Dodger Stadium was attempting to draw attention to what he claims is his wife's imprisonment in a Missouri mental institution, authorities say," wrote the Los Angeles Times on April 30.
The incident has always been painted as a protest against the country, but by this evidence it seems there was something more eccentric at work - which frankly fits with the story I'm trying to tell. In any case, Monday's response to the attempted flag-burning, in the nation's bicentennial year, won national acclaim.
"He got down on his knees and I could tell he wasn't throwing holy water on it," Monday told the Times, and you can just hear the future broadcaster in him, can't you? "If he's going to burn a Flag, he better do it in front of somebody who doesn't appreciate it. I've visited enough veterans' hospitals and seen enough guys blown off defending that Flag."
And so Monday dashed over from his center field position and swiped the flag so that it could be delivered to safety - which at that time was known as police impound. (Ultimately, it found a haven in Monday's residence.)
With this dramatic act, Monday became the most popular man in baseball. Ceremonies honored him in virtually every city he visited. From the famous Los Angeles Herald-Examiner photo of the flag rescue a poster was made, a copy of which found a spot in my bedroom. Yep, I was eight years old and on the Rick Monday bandwagon.
He had become too popular, it appeared, for the Dodgers to continue entertaining their dream of acquiring him.
"There's no way they'll trade him now," Dodger vice president Al Campanis told Ross Newhan of the Times. "He's Mr. Red, White and Blue."
But with Monday, you never knew.
Monday, who earned $90,000 in 1976, requested a multiyear contract in the offseason that Chicago wasn't willing to offer, reopening the door for the Dodgers. "A romance of considerable duration was consummated" on January 11, 1977, wrote Newhan, when with reliever Mike Garman, Monday came to Los Angeles in exchange for Bill Buckner, Ivan DeJesus and Jeff Albert. Newhan wrote that Campanis had pursued Monday for "nearly four years."
Even back then, I had mixed feelings. Buckner had been a Dodger my entire baseball-watching life, and I liked him. So as warm as I might have been toward the patriotic Monday, I didn't take this as particularly good news.
And my pessimistic instincts were right. In Monday's first season with the Dodgers, they won the National League pennant. But Monday wasn't a part of it. In his worst season since he was 20, Monday batted .230 (91 OPS+) with 15 home runs in 118 games.
But Monday is getting one of the last laughs on me. When I went back this week to look at his stats from ensuing seasons, I found they have aged well. From 1978-1983, Monday's OPS was .837, which is something for that era as a Dodger.
Still, it's safe to say that Monday probably would have faded into Dodger oblivion had it not been for his second dramatic moment: a pennant-winning home run in the 1981 NL Championship Series against the Expos, a blast that I heard in the middle of another school day, late for class, on a transistor radio surrounded by about 20 schoolmates in front of my high school library.
The hero was Rick Monday? The hero was Rick Monday.
The clip of Monday jubilantly rounding first on his home run sprint probably received more local airtime in the 1980s than any other Dodger memory. It became as imprinted on your brain as anything that side of Kirk Gibson. And count me among those who wonder if Monday's two games of Capture the Flag paved the way for him to begin a broadcasting career in Southern California, and who wonder sometimes if those flags were worth it.
Driving home from work one night this month, I listened to the Dodger radio broadcast with a hint of this story in mind. I turned on the radio and prepared to keep track of the number of minutes it took for Monday to give the score of the game.
It's a sad prejudgment, but all too reasonable. On the radio, you will hear Monday extoll the virtues of baseball fundamentals, all the while failing to execute the primo fundamental of calling a ballgame - providing the score.
When I left my desk that evening, the Dodgers were winning, 4-2 after seven innings. In the car, I waited for an update. When the half-inning ended, Monday said that the Dodgers ended up with nothing except a two-out walk by Milton Bradley, and that going into the bottom of the eighth, the Dodgers led, 5-2.
Huh? Was I crazy? Where did that run come from?
As it turned out, Hee Seop Choi had homered in that eighth inning while I was walking to my car. But by the time three outs had been recorded, Monday had apparently forgotten about it.
Listening to Monday broadcast is really a strange phenomenon. He can speak, or at least be understood - that's not the problem. And the fact that some of his insights aren't always that insightful isn't the most aggravating thing. He honestly just seems easily distracted. He seems to treat the game as background music, mere accompaniment for his solo. Sure, he'll look up and check out what the band is doing on a regular basis, but his focus just seems to be somewhere else for long stretches.
In a sense, he covers a game like a blogger, giving you something extra from time to time but relying on you to fill in the nuts and bolts. A radio blogger is an interesting concept, but not an ideal choice for the game's play-by-play man.
Ross Porter, the recently martyred Dodger broadcaster, might not be the announcing magician that Vin Scully is, but with Porter, there was no mistaking his solid understanding that the game was the thing. For all the grief Porter took - some of it unfair - over peppering his broadcast with stats, the game always came first. It isn't the case with Monday, who you'll often catch calling two pitches at once because his digressions have put him so far behind. ("The first pitch is a ball and now he strokes a single into right field ...") The idea that Monday remains a Dodger broadcaster to this day, that he has essentially been tenured, almost makes me want to give back the '81 title, and gives me non-serious thoughts about wishing William Errol Morris had been allowed to make his husbandly statement.
And yet, I find I have misjudged Monday more than once in the past. This guy has been part of my baseball life for pretty much the whole time, and figures to be around for a while longer. He doesn't seem like a bad guy to me. He seems very much who he is, very flawed but very genuine.
I want to like Rick Monday. I want my long association with Monday to ultimately be positive. I want to be able to cherish his heroics, rather than rue them. Wouldn't that simplify my life?
Perhaps someday I'll meet Monday, and just knowing him will do the trick. But if that day doesn't come, I'm still willing to make a deal. I'm willing to try, once more, to embrace him. I just have this one request.
"Monday, the score or your life!!!"
Jon Weisman writes many different things, most relevantly about the Dodgers at Dodger Thoughts, a part of Baseball Toaster.
[Additional reader comments and retorts at Baseball Primer.]
| Designated Hitter | August 04, 2005 |
Let 'er Rip
Early in 3 Nights in August, we learn this about Cardinal manager Tony La Russa: "La Russa likes his hitters to be aggressive on the first good strike they get in an RBI situation. Especially pinch hitters, because they often get only one good strike in the entire at-bat. La Russa and his coaches inculcate this philosophy into players from the earliest stages of spring training . . . . ." A few pages later, the manager watches approvingly as Scott Rolen swings and misses at an 0-0 pitch with the bases loaded: "La Russa prefers his aggressiveness here, would rather see it than not, convinced that this aggression will produce more runs over the course of the season."
Is that a fact? If so, it flies in the face of the deep-count batting approach that our SABR-savvy generation deems proper. In the Age of On-Base Percentage, first-pitch swinging has a terrible rap; you can't draw a walk if you go up there hacking. You're supposed to be patient, work the count, and wait for your pitch.
But what if you get "your pitch" on the first pitch?
As regular readers of my blog, Viva El Birdos, know only too well, I'm with La Russa on this one; or rather, I'm against the knee-jerk preference for "patience." My feelings on the subject sharpened this year in reaction to the popular storyline about StL's new leadoff man, David Eckstein. "He always takes a strike," broadcasters and writers repeated ad nauseum; "he fouls off pitches, really battles, makes the pitcher work." This list of virtues fits right in with the OBP gospel, although in Eckstein's case it strikes me as being a tad empty -- his career OBP is a middling .339. In mid-May, after watching him take a fat first-pitch strike late in the game with two out and the tying run at 2d base, I bitched:
[Eckstein] did get himself a couple of pitches to hit later in the at-bat (esp. a sloppy breaking pitch way up), but they came on 2-2, after he'd gone into hunker-down mode. He battled, and the at-bat lasted 8 pitches, but the best hitting opportunity was the first pitch -- and Eckstein was taking all the way, for no reason.
If Eckstein had swung at that 0-0 pitch and popped it up, he would have been criticized for lacking plate discipline. But when a hitter takes an 0-0 fastball right down the middle, nobody peeps; that's just seen as smart, patient hitting.
It isn't. Using the miracle of Retrosheet, I sorted all the at-bats for every National League team from last season according to what happened on the first pitch. (See the end of the article for data sources and notes.) Each at-bat went into one of five first-pitch categories: called ball, called strike, swinging strike, foul, and ball put in play. If we combine the last three categories -- which all involve swinging the bat -- into one, we end up with three basic 0-0 outcomes: called ball, called strike, or swing. Here are the results:
| when batter... | avg | obp | slg | rc/27 |
|---|---|---|---|---|
| takes ball on 0-0 | .270 | .382 | .452 | 6.4 |
| swings on 0-0 | .270 | .300 | .439 | 4.9 |
| takes strike on 0-0 | .233 | .275 | .353 | 3.4 |
The table does reinforce one Age of OBP doctrine: discretion is good. Better to get ahead 1-0 in the count than to swing on 0-0. But the blanket "take a strike" approach looks rather foolish per these data; when the first pitch was a strike, hitters who swung at it (even if they missed or fouled it off) were 40 percent more productive than hitters who took it for strike one. Even with respect to getting on base, the swingers were more effective than the takers: hitters who swung at the first pitch had an OBP 25 points higher than hitters who took strike one.
I'm not suggesting (nor are the data) that hitters should swing at any 0-0 offering that comes within a foot of the strike zone; these are macro figures which mask all sorts of micro situations in which it might make sense to take a strike. If the pitcher breaks one off on the corner or puts a sinker in at the knees and you can't do much with the pitch, might as well take. And if the pitcher is struggling with his control, maybe it's not a bad idea to see if he can follow up strike one with strike two. But it is a bad idea simply to take a first-pitch strike on principle. La Russa's instincts are correct: you ultimately score more runs if you attack the first strike you see.
And the effect is hardly limited to the Cardinals. It's nearly universal. Only one National League team (the Marlins) was better off taking an 0-0 strike than swinging at it -- and the advantage was infinitesimal (0.1 rc/27). All 15 of the other teams scored more when they swung, with advantages ranging from 0.5 rc/27 (San Francisco) to 2.6 rc/27 (Atlanta).
Of course, pitches don't come across the plate labeled "ball" and "strike" -- most of them are borderline. If the batter lets it go, maybe he gets the call and it's ball one; if he swings, it's a strike no matter what. So let's combine the two "take" categories -- i.e., called balls and called strikes -- into one, and boil the matter down to the hitter's fundamental choice: take or swing.
| when batter... | avg | obp | slg | rc/27 |
|---|---|---|---|---|
| takes on 0-0 | .253 | .337 | .407 | 5.0 |
| swings on 0-0 | .270 | .300 | .439 | 4.9 |
Basically, it's a wash -- hitters who took on 0-0 registered tiny, probably random advantages in OPS and rc/27 over hitters who swung. But the data still seem to validate La Russa's emphasis on aggression in RBI situations. In such situations you generally need a hit, not a walk -- and first-pitch swingers hit 17 points higher, and slugged 32 points higher, than first-pitch takers. Conversely, if your team needs a baserunner more than a base hit, the conventional wisdom -- take a pitch -- is with you.
Interestingly, nearly half the teams in the league (7) were more productive when they swung on 0-0 than when they took, irrespective of whether the pitch was a ball or a strike. That's fairly remarkable, since swinging on 0-0 radically decreases the chance of a walk. Leaguewide, hitters who swung on 0-0 had a walk rate of .026; hitters who took (whether ball or strike) had a walk rate of .089. But some teams overcame that inherent OBP deficit by slugging the daylights out of the ball on 0-0. Consider the Cardinals and the Braves, who both were about 0.6 rc/27 more productive on at-bats that began with a swing:
| avg | obp | slg | rc/27 | |
|---|---|---|---|---|
| StL take | .265 | .346 | .429 | 5.5 |
| StL swing | .288 | .319 | .497 | 6.0 |
| Atl take | .260 | .352 | .418 | 5.4 |
| Atl swing | .297 | .324 | .478 | 6.0 |
Whatever they lost in OBP by swinging aggressively, these teams more than made up for in slugging.
Leaguewide, National League batters swung at 47.8 percent of the 0-0 strikes they saw in 2004. But this percentage varied widely from team to team. The Expos swung at the lowest percentage of 0-0 strikes, only 38 percent. That's just 0-0 strikes, not all 0-0 pitches; the Expos let a lot of hittable pitches go for strike one. At the other end of the spectrum we have the Cubs, who hacked at 59 percent of the 1st-pitch strikes thrown their way.
The team-by-team median percentage was 48 percent. Now check this out: Of the seven teams above the median -- i.e., the teams that swung most often at 0-0 strikes -- six ranked among the top seven in NL runs scored. The seven teams below the median all ranked at the bottom of the league in runs scored, with the lone exception of Philadelphia. The teams that swung on 0-0 most often averaged 802 runs; the teams that swung least often, 698.
It's also interesting that the 0-0 swingers -- with the notable exception of Chicago -- ranked in the upper half of the league in both walks and OBP. Here, take a look:
| team | pct of swings on 0-0 strikes |
rank/runs | rank/walks | rank/obp |
|---|---|---|---|---|
| Chi | 59 | 7 | 14 | 11 |
| Col | 54 | 4 | 6 | 2 |
| Hou | 54 | 6 | 4 | 6 |
| StL | 52 | 1 | 8 | 4 |
| Atl | 51 | 5 | 5 | 5 |
| Pit | 49 | 13 | 16 | 13 |
| SF | 49 | 2 | 1 | 1 |
| Cin | 48 | 10 | 3 | 9 |
| SD | 48 | 8 | 7 | 7 |
| Mil | 46 | 14 | 9 | 12 |
| LA | 45 | 9 | 10 | 8 |
| NY | 45 | 12 | 11 | 14 |
| Chi | 59 | 7 | 14 | 11 |
| Pha | 45 | 3 | 2 | 2 |
| Fla | 41 | 11 | 12 | 10 |
| Ari | 40 | 16 | 15 | 16 |
| Mon | 38 | 15 | 13 | 15 |
For all the first pitches they took, the Marlins and Dbacks et al drew fewer walks than the teams that went up there hacking. Which tells me that it's possible to be aggressive without sacrificing discipline. On the contrary, from this study -- admittedly limited, one league one year -- it appears that aggression is an essential component of discipline. You have to keep the pitchers honest, take the get-me-over fastball out of their kit and force them to work the corners from the beginning of the at-bat. That's how you get favorable counts -- make the pitchers work fine on 0-0, take part of the plate away from 'em. So it's not all about running deep counts and waiting for your pitch; it's about knowing the strike zone and recognizing your pitch -- even if it happens to come on 0-0.
In early June, after Scott Seabol hit a dramatic first-pitch homer to key a win over the Yankees in June, I had this to say at Viva El Birdos:
We've been trained to think the only good at-bats are patient, carefully considered ones, in which the batter steps out of the box between pitches to think things over and tap his pipe on the heel of his shoe. But a first-pitch swing can be carefully considered too; you can go up there looking for one pitch in one zone -- say, a fastball middle in, like the one Seabol whacked out the yard yesterday -- and swing if and only if the pitch meets those specs. That takes as much plate discipline as a 10-pitch at-bat, imho, for the latter is often born of sheer survival -- if it's close, you have to swing -- while the former requires a true exercise of discretion.
If Seabol had popped up, there would have been hell to pay. But he took the right approach; he was playing percentage baseball. Even in the Age of OBP, sometimes you just have to let 'er rip and take your chances.
A NOTE ON THE DATA
All of my data comes from the Retrosheet Event Files. The information was obtained free of charge from and is copyrighted by Retrosheet.
If you've ever used these files, you know they are a) extraordinarily useful and b) a bear to work with. For the sake of simplicity, I used fields that did not code outs for things like sac bunts, sac flies, etc. In my data these outs showed up as ordinary outs, inflating the number of at-bats and thus lowering all the run-scoring output. The effect is small enough that I decided to live with it, but I wanted to make the disclosure.
A second disclosure: Since the subject of interest is the batter's discretion to swing or take on 0-0, I threw out all at-bats in which that discretion was removed -- i.e., intentional walks and bunt attempts. However, only the failed bunt attempts could be excluded, since the ones that succeeded on the first pitch -- or that began with ball one -- were subsumed under other data categories. Similarly, I could not exclude mandatory swings on hit-and-run plays, nor mandatory takes sent in from the bench. A more refined study would account for such factors.
For another in-depth study about the 0-0 pitch, see Craig Burley's two-parter "The Importance of Strike One" -- part one here, and part two here.
Larry Borowsky writes about the St Louis Cardinals at Viva El Birdos, one of the blogs in the SportsBlog Nation
family. He has never knowingly taken steroids.
[Additional reader comments and retorts at Baseball Primer.]
| Designated Hitter | July 21, 2005 |
The Ethics of Pitching Jesus High and Tight
Jesus was at bat.
This wasn't unusual in the Texas-New Mexico League, farthest from the white balls and bright lights of the major leagues while still drawing a paycheck. Latin players on their way up or Mexicans on their way home would often end up here, dabbing the sweat from their eyes as they stared into the sun. There were no lights at any of the parks in the league. The sun darkly pounded them into submission, stuff no one could hit.
The grass was dead in patches. Once they tried painting it green and gave up. Two parks gave up the illusion and stripped the field bare to its naked red dirt, raked into neat soft piles that would swallow up grounders and mark balls indelibly. He'd heard a coach saying the only soil he'd ever seen so red was out back of Ty Cobb's place. Even this wizened old man wasn't old enough to remember Cobb, let alone find the red dirt of his fertile rich past. Cobb never drove a Corvette.
And Jesus was at bat. I stepped back off the mound again, pulled off my hat and used my sleeve to wipe the grit and sweat and...whatever off my forehead, just inches and gravity from blinding me and running down to water this soil. I'd heard Todd Obadal, the ballpark's announcer whose voice didn't sound natural unless it was cheaply echoing off three poles and into the echoes of the aluminum bleachers radiating the late summer heat, say his name as he walked up to the plate. Todd carried a battered old Macmillan's up with him to the press box every day, reading and memorizing in between batters.
Jesus was new in the league, his uniform still white and no name across the back. It took two weeks to get the uniforms back from the sporting goods store in Roswell that would stitch the name on tight. There was a joke that everyone was on tryout until the name got there. The whole league used the same place, central and cheap, run by a fan that gave the owners a deal in return for seats in the shade and a sign in left. I looked out at the sign, easier to do than look at Jesus or my manager.
The name still echoed somehow, the flat land running to the mesas in the far hazy distance under the meadow of white clouds playing tricks with my ears or maybe the rattle of the bleachers forming some primitive recording, playing it back. "Now at bat, Jesus." He had a last name, but that didn't register. Martinez? Lopez? Rodriguez? Something common. Worse if he hadn't been Latin. Jesus Smith. Jesus Johnson.
Because he wasn't Hay-soos, he was Jesus. The only times he heard it pronounced that way were in Sunday school or Sunday afternoon with the coaches yelling at him. "Jesus H. Christ," they'd yell as if the H stood for something, "keep the ball down, kid. You ain't got the stuff to blow it past these guys like you did back in high school. If you could you wouldn't be here, playing in Big Springs." He'd never seen a spring.
The manager had heard it too, the name, Jesus. Announced by Todd, rattling off the bleachers and rolling off into the desert, Jesus was coming to bat. The hair on his ears practically bristled, a stark white against the leather of his red neck. Literally red. Not sunburned now, but baked to a perfect brick red by years, decades, eons of standing where he stood and not budging, not backing off because some sun was pitching him inside.
"Did he say Jesus?" the manager asked no one in particular. "What in hell's bells is that boy thinking? How many Hay-sooses we got in this league and he goes and calls this one by the name of our Lord and Savior." No one in particular responded, immune to these monologues, only attuned to their name or ducking if he threw the water cooler like he would do occasionally. I'd seen him check it once, seeing if it was empty enough to pick up without straining himself and still full enough to make a resounding crunch and splash as the top came off.
"Boy," he said, pointing to the batboy, a twelve year old taking vocabulary lessons all summer after a season of Dixie League ball had someone won him some prize. Prize, as if serving some halfwit no-talent ten-games-back ball club was anything worth winning. His eyes lit up anytime he was spoken to and no one told him his prize wasn't...prizy. What's the word? "Boy, go tell Obadal that Hay-soos up there didn't walk on water or die for his sins." The boy wasn't quite sure what to make of that. A flick of the manager's head told the boy he was serious enough and off he ran, across the line of spit and seeds and boys spitting them there, through the maze of chain link at the edge and out. His cleats -- cleats! -- crunched in the packed gravel of the ground and rang out like the devil's piano as he ran up the nine levels of bleachers to the press box.
As I stood back on top of the mound, I glanced in. The manager was standing on what would have been the top step of the dugout, if there'd actually been steps. It was ground level, the line between gravel and dirt being some agreed upon line between dugout and field. He wasn't looking at me and wasn't looking at Jesus either. He was glaring at him. The salt bit into my eye even though I'd just wiped it away. I refused to blink it away and it came out the other side like a tear.
Jesus had one hit on the day, a double down the right field line in the first inning. Marsh had thrown a good pitch, a slider down and away that stayed up just enough for the right-hander to push it the other way. In the third, he'd hit one while our manager was warbling about the name that I'd thought was going out to dead center, the death valley of the ballpark marked 400 because that was as high as someone could count. The heat or the wind or the sheer height of the ball brought it down as Crowell had one foot on the warning track. Jesus smiled as he turned back from near second, his trot never changing on the route from home to first, first to near second, and near second back to the dugout. He sat down, away from the others, his face obscured by shadow and chain link from me.
I'd come in for the sixth, a reliever in all senses of the word. The heat had broken Marsh's slider into hittable pieces and his fastball lost the spots it was supposed to go. He left the pounding isolation of the highest point on the field and was seated next to the water cooler, the sweat of the two mixing as he sat bare-chested and used his uniform to mop his bald head. Now here in the seventh, one out away from leaving a man on and stretching as tradition demands, I was debating the ethics of pitching Jesus high and tight.
It came in reverse, the batboy clanging down from the press box, across the rows of people sitting, off work from the factory or the fields, back across the grey dusty gravel that would leave a chalk on your black cleats or pickup truck. He skidded as he turned, snaking back in the dugout and running back up to the manager. "Obadal says that the manager from the other team told him that the name was Jesus, not Hay-soos and that Jesus ain’t Mexican."
"Ain’t Mexican, he says?" The manager adjusted a seed in his mouth, his tongue a size too large for his lipless mouth and the wrinkles taking the expression out of his eyes.
"Yessir, Obadal says he's from Colorado and that his name is Jesus." The boy spoke with a rote cadence, as if the message he carried was much more important than it was. It was Jesus or Hay-soos and either way, he was coming back to bat soon. I didn't see in the first or second times he was at the plate that he would smile while he was up there. His back was to me, of course, as I sat in the dugout and now, thinking back to the batboy looking up, breathing hard, waiting for the manager to say something, I was sure that Jesus smiled in the dugout waiting for his next turn or smiled as he stood in right field, a million miles away in the gray gravel dust and wavy heat lines of the afternoon.
He'd said nothing, the manager. He looked up and down the row of players scattered lazily across the bench, waiting for the next seed to come floating heavily, arcing to the dank gravel of the dugout, inches from dirt. They'd occasionally play a game of trying to be the closest to the line. The rules would change, mid-game sometimes. Going over, into the dirt, was no good or some arbitrary points were set as too far right or left. I was never good at the game or at spitting seeds. My teeth would never crack them open, unthinking like so many that had spent so many hours learning a skill, if you could call it that, becoming a pastime.
I leaned forward, taking a sign that the catcher didn't show me. My leg came up as I drove forward, the ball in my hand asking where to go, what to do and I let fly. My head snapped over, losing sight of things for a moment and when I righted myself, Peters, the catcher, had the ball in his glove, holding it. Jesus hadn't moved despite the ball having to have come close enough to ripple past the white polyester folds of his uniform, ticking past the stitches of the interlocked A's over his heart. The smile hadn't changed either.
Now, the manager was looking out at me. My fastball, intentioned as it was, may have been tight, but not high. "Bubba," he said to me, though my name nor anyone else's on the team was not Bubba either, but seemed to be his preferred name for all that were not Boy or, for our oversized first baseman, an adoring "Big 'Un." He was close enough for me to feel the sound as much as hear it. "Bubba, I want you to go out there and when Jeeeeeee-zuz," dragged out in derision, "comes back up, you put one right in his ear. You hear me?"
"Yes, sir," I said. At 18 and nothing but a diploma and a fastball different than most guys I knew, I wasn't about to question the man that decided whether or not I pitched, whether or not he'd tell his scout buddies that he had a lefty with a nice screwball that he'd found pitching Legion Ball near Palo Duro, and whether or not I'd get my two hundred dollars that week.
On the mound, it was a different story. I wanted to do what I was supposed to and yet the smiling man disconcerted me. His even demeanor and bright white uniform looked not to belong. There was no name and a number -- three -- that seemed to shimmer somehow through some trick of the light. The ball seemed harder, hot from its use and the yarn digging into my skin as I squeezed it. Looking in, there was no sign. The eyes of my manager dug into the head of Jesus, willing that smile off his face, wanting to see his uniform dirty, crumpled, his name somehow changed by a hard piece of horse.
My arms stretched out and went over my head, leg high and the ball blazed, this time out of the corner of my eye, I saw the ball nearly in his face, the catcher's glove darting up out of habit. Jesus turned, quickly as only a real ballplayer knows, sending through the tight spin of the seams that it would stay straight and turning his head somehow ducked out of the way. His knees barely moved and his clean uniform barely rustled.
The umpire took his mask off and gave me a look, knowing that it was a purpose pitch. I wasn't really sure of what the purpose was. I couldn't even fake the shrug that would say it got away from me, that these things happen in baseball. The umpire knew. I knew. The crowd knew. Jesus knew.
I saw him look back at me. The sun seemed hotter and what wind there was paused. His mouth moved, almost too slow to see. My gray uniform was heavier, the grit on my face dirtier, and the ball that wasn't in my hand felt emptier. August in West Texas is lonely and hot. The fans abandon you for high school football and you're left playing a game between yourselves.
He crossed the line, stepping from gravel to dirt. Quick steps out towards the mound and a flicking wave towards the umpire. Maybe he thought that the manager was coming out to give me the what for or maybe he was just as hot and sweaty as I was under the powder blue uniform he wore.
The catcher came out as well, dumb, in the sense that he never said much. In the months I'd been out here, the catcher had said maybe ten words to me outside of 'good game' and 'right here,' his call for me to focus and put the next pitch in his glove. He was older than the rest of us. He played in Double-A a few years back, came home to work the oil patch for the winter and stayed a couple summers with his new wife and kid.
He sighed before speaking. "Bubba," he said like he was blaming me with it, "didn't I tell you to put one in Jesus' earhole?"
I nodded.
"Didn't I tell you to do something and here I am standing out here in the damn sun sweating and wondering why that blasphemous smiling sumbitch is still standing up there looking pearly white?" He ended it with his voice going up, like he was growing hysterical or maybe asking a question. I looked past him, past the catcher, and Jesus was standing there with the bat in his hands, smiling and looking at me when he did it again. His mouth barely moved.
The manager's mouth started to move again, but I handed him the ball and walked off. I was unbuttoning the jersey top, looking to let the sun beat down on me at the same time I unburdened myself. I winked at Jesus as I crossed the line from dirt to gravel. My glove was pointless so I tossed it to the batboy. My cleats crunched on the gravel, the white chalky dust starting to sink into the polish.
I walked past the bus, knowing I'd never get on it again, 300 miles from Palo Duro with half a baseball uniform, a change of clothes and sixty-one dollars in my wallet. I would need to stop and change my shoes but I didn't want to slow down. I wasn't sure that if I looked back the the ballgame wouldn't pull me back.
I didn't know what I was going to do next, but I had a long walk ahead of me. There would be plenty of time to make plans. It might be nice to go to college. The sun would set eventually, behind me, and I'd wake up somewhere tomorrow. There wouldn't be a baseball in my hand, but that seemed okay for now. My step was lighter and my heart unburdened by plugging Jesus with my best fastball.
Anyway, he'd whispered "I forgive you." Or something like that.
Will Carroll once wrote fiction before taking residence in the dark lands of facts and rumor. Those writings can be found at Baseball Prospectus, where Carroll writes a near-daily column entitled "Under the Knife." He stole the title for this story, but can't recall from where.
| Designated Hitter | July 14, 2005 |
Would You Like Some Baseball With Your Ham?
Armed with a free ticket to go anywhere in the world (well, the world as defined by United Airlines) thanks to a globetrotting brother who travels extensively on business, I decided to make sure that I got close to the maximum mileage out of it. So I packed my suitcase, tossed in my scorebook, and headed for Japan. I was last there in 2003 when I took a lightning trip through the country to see all 12 of Japan's teams in their then 11 different home stadiums. But since 2003, the Japanese leagues have seen one team move from Tokyo to Sapporo, two teams merge, a two-day players strike, and a new team fill out the circuit in the city of Sendai.
So, I decided to go check out the new team and the new stadium and took in three games in a much more relaxed eight-day span. Despite the changes in Japanese baseball, there is one thing that is constant: if you want to go see a long baseball game, go to Japan. While I was there, I took in 11 hours and 38 minutes of baseball that covered just 28 innings.
The first game I took in was at the Sapporo Dome on June 29. In 2004 the downtrodden Nippon Ham Fighters, who always seemed to rank seventh in popularity among the six teams in the Tokyo metropolitan area, moved up to the northern island of Hokkaido and made the Sapporo Dome their home. They changed their uniforms, mascot, and even team name from the Nippon Ham Fighters to the Hokkaido Nippon-Ham Fighters. Someone must have figured out that a hyphen might keep people from calling the team the Ham Fighters.
 The Sapporo Dome uses a twist on the retractable roof idea. The Sapporo Dome uses a retractable field. For baseball, artificial turf is used, but for soccer, a grass field from outside is rolled in through the back of the stadium and then the seats are rotated 90 degrees. You can see the whole process here and scroll down to the link for the QuickTime movie. The Sapporo Dome is one of the few Japanese parks with an organist, although recorded music predominates.
The game experience at the Sapporo Dome is fairly typical of a Japanese game. The Fighters have a loud and organized cheering section like all teams. When you enter the Sapporo Dome, you come in below the seats and the sound from the field doesn't carry down into the concrete vestibule. So when you're waiting in line to buy your food during the game, you can hear the PA announcements and the organist, but no crowd noise.
The game on June 29 was not a thing of beauty. The Fighters, managed by American Trey Hillman, started Australian lefty and former Twin Brad Thomas against the defending Japan Series champion Seibu Lions. Thomas lasted just two innings and threw 71 pitches, but the Fighters won a 4-0 shutout behind some great relief pitching from Naoyuki Tateishi and a 2-run homer from Fernando Seguignol. The game was over in a "brisk" 3:28.
Both teams were scuffling along in the bottom half of Japan's Pacific League as the first place Fukuoka Softbank Hawks (formerly the Daiei Hawks), managed by Sadaharu Oh, and the formerly woebegone Chiba Lotte Marines, managed by Bobby Valentine, were both playing over .600 ball. But you only need to finish third in the Pacific League to make the playoffs. Presently, Seibu, Nippon-Ham, and the newly amalgamated Orix Buffaloes (the merged version of the old Orix Blue Wave and the Kintetsu Buffaloes) are all battling for the final playoff spot in the Pacific League. The second and third place teams play a best-of-three series with the winner facing the first place team in a best-of-five series. The Central League as of now has no playoffs and the Hanshin Tigers have a comfortable lead over the Chunichi Dragons.
After Sapporo, I headed down to Sendai, which is a little under 200 miles north of Tokyo on the Pacific Coast to go see the Tohoku Rakuten Golden Eagles take on the Fighters. The Friday night July 1 game was washed out, so I headed out for the Saturday afternoon game. I arrived over 90 minutes before the first pitch, but was surprised to find the game sold out. I assumed that a game between a last place expansion team that was 21-55 and the fourth place team in the Pacific League would not be a tough ticket. However, the Eagles, who were put together quickly in the offseason, are playing the 2005 season in tiny Miyagi Fullcast Stadium, which seats just under 20,000. After about 20 minutes of wandering around the stadium looking for a scalper, two women offered to sell me their extra ticket in the bleachers and I was in.
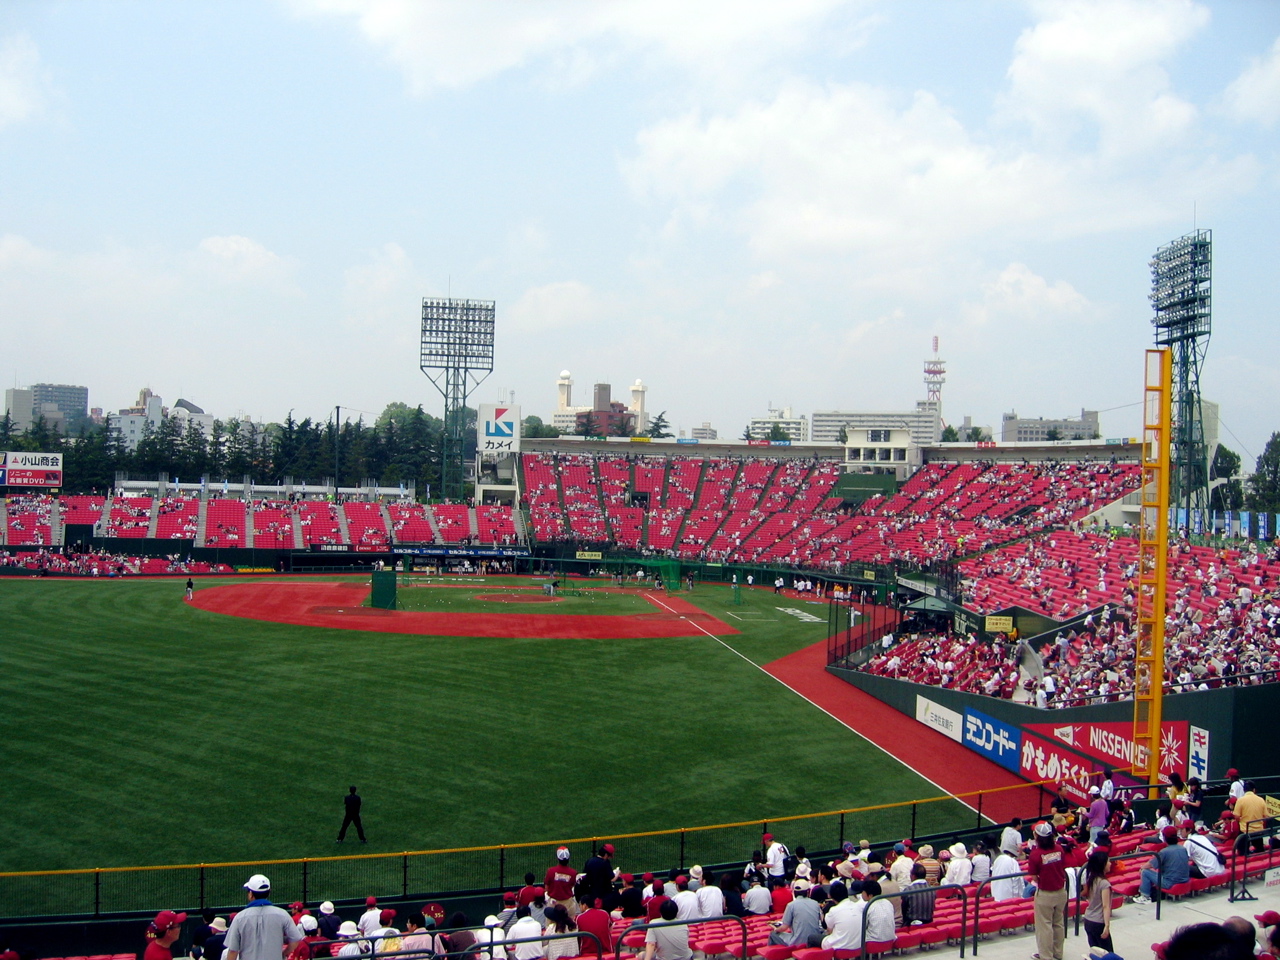
The seat, such as it was, was a portion of concrete in the left field stands. But there was a fine view of the field and it was a sunny and warm day in Sendai and not too humid for July. Turned out it would be a nice evening, too.
The game had poked along for six innings in a leisurely 3:08. Every inning seemed to feature runners on base, full counts, pickoff throws, pitching changes, and breaks to go wake up spectators who may have dozed off. Going to the bottom of the ninth, the Fighters led 6-3.
In the ninth, Hillman brought in his closer Yokiya Yokoyama. But he got off to a bad start, walking the leadoff man, DH Takeshi Yamasaki. Yamasaki had notched his 1000th career hit during the game and it was stopped briefly to give him a bouquet of flowers, which he opted not to carry around the bases. After Fumitoshi Takano flied out, pinch hitter Ryutaro Tsuji (but he only uses his given name professionally) singled to right. Then Daisuke Masuda singled to load the bases. Catcher Akihitio Fujii, hitting .212, singled in a run to make it 6-4.
 Rakuten manager Yasushi Tao then turned to pinch hitter Koichi Oshima. The slap-hitting infielder was hoping to extend the inning in some way to bring the top of the order back up. But Oshima was able to line a Yokoyama offering down the first base line and into the right field corner for a sayonara triple to clear the bases and give the Eagles an improbable 7-6 win, delighting what was left of a sellout crowd of 19,083. When the game ended, the clock on the scoreboard showed the elapsed time: 4:20. The game featured 13 runs, 26 hits, 8 walks, 3 errors, and 25 men left on base. 13 pitchers combined to throw 337 pitches. And by the time the game ended, the lights were on at Fullcast Stadium and the bright sun had dipped behind some clouds.
A triple in Japanese baseball is a fairly rare play. The leaders in each league have 7 or 8 triples, but no one else is close to them with the second place batters in each league having three. Japanese parks are symmetrical with shallow gaps and corners that don't lend themselves to bad bounces. The shallow gaps allow slow players like Tuffy Rhodes and Benny Agbayani to play center field. The fences tend to be higher than MLB parks all the way around, so there aren't many ground-rule doubles either.
Although the Eagles have taken their lumps in 2005, it appears that the people of Sendai have taken quite a shine to them. The team's logo appears on signs hanging from just about every fixed object in the city of Sendai. Department stores and the stadium shop cannot seem to sell enough of the Eagles gear. The Eagles mascots, Clutch and Clutchina, along with a motorcycle-riding crow called Mr. Carrasco, are a big hit with the crowds. However, the Eagles better be ready for the inevitable drop in attendance that will happen when the people of Sendai realize that they have a bad team on their hands. A new stadium is in the works, or at least is advertised as such from what I could make out, for the 2006 season.
My tour of Japan ended on July 4 at the Tokyo Dome. The Fighters returned to their old home to play a three-game series against the second place Chiba Lotte Marines. Although the Fighters left the Tokyo Dome after the 2003 season, they reserved the right to play a series or two each season in Tokyo as the home team.
The game afforded me the opportunity to see the Fighters' much heralded rookie Yu Darvish, the team's first round draft pick. Darvish, an 18-year-old from Osaka who went to high school in Sendai, had won his first two starts for the Fighters. The Marines countered with their own #1 draft pick, Yasutomo Kubo, a 24-year-old from Japan's industrial leagues.
Both pitchers were sharp for most of the game. Darvish's only blemish came when he surrendered a 492-foot, two-run home run to Chiba's Seung-Yeop Lee in the second inning. The homer netted Lee a one-million yen bonus for hitting an advertising sign with Shigeo Nagashima's face on it, the Japanese version of "Hit Sign, Win Suit" (Lee won about $9000.) Kubo gave up a pair of solo home runs and the game went to extra innings tied 2-2.
In the top of the tenth, Thomas came out of the pen. But he was cursed by bad luck. Chiba second baseman Koichi Hori led off with a popup that Nippon-Ham center fielder Tsuyoshi Shinjo (whose name does not appear on scoreboards written in Japanese characters, but rather as SHINJO) lost in the canvas roof of the Tokyo Dome. The ball dropped and Hori was at second. However, all the infielders had run into the outfield to help and no one was covering third, so Hori just kept on running and took third with what was ruled a double and a fielder's choice. (The choice being to not cover third apparently.) Eight batters later, four runs had scored and Chiba led 6-2.
But the Fighters still had something left. Seguignol led off with a single. Shinjo came up with a chance to redeem himself after a night where he had misplayed the popup and struck out four times (giving me a chance to teach my Japanese friends the phrase "golden sombrero"). Shinjo didn't strike out this time. Instead, he bounced into a 6-3 DP and the Marines went on to win. This 10-inning affair lasted 3:59.
Most of you in the U.S. are probably wondering if there were any future major leaguers that I saw. Well, if I had the slightest bit of scouting acumen, I could tell you something of value. But I really don't. After all, I have a Nori Nakamura bobblehead. One would assume that Darvish, an 18-year-old who is already pitching fairly well, would be the likeliest candidate, but the fate of any pitching prospect is always tricky. Darvish has to hope that he does not run into the burnout problem that many young Japanese pitchers face. He hasn't pitched enough innings to make a judgment about him.
The Fighters' third baseman Michihiro "Guts" Ogasawara had batted .327 with a .411 OBP and a .560 SLG in his first eight years in Japan, but he seems to have lost his stroke a bit in 2005. He has 22 home runs as of July 11, 2005, but he was batting just .248 and his OBP had dropped to .329. His fielding at third base also seemed a bit awkward, although he did break in as a first baseman. Ogasawara's biggest handicap may be that he is 31-years-old and will likely not be a free agent until he's 33. But you have to root for a guy called "Guts."
Bob Timmermann is a librarian who lives in South Pasadena, CA. He is a member of the Society for American Baseball Research and has given presentations at SABR annual conventions on Japanese baseball and the life of the only major leaguer born in China, Harry Kingman.
| Designated Hitter | July 07, 2005 |
Ranking the Best Pitching Seasons Ever
What was the best pitching season ever? We could look at the lowest ERA, but in some eras, ERAs were naturally low, like in the deadball era before 1920 when there were many seasons with ERAs under 2.00. We could look at the seasons with the most wins or highest winning percentages, but those are determined not just by the quality of the pitching but also by the run support a pitcher gets.
We could get around this problem by comparing a pitcher's ERA to the league average. Two pitchers might be judged equal if their ERAs are both 25% below the league average. Pitcher A might have an ERA of 3.00 with the league average being 4.00 while pitcher B has an ERA of 2.25 in a league with an average ERA of 3.00.
But a problem that often emerges in this approach is that the best seasons often come when runs per game were very high or very low. In extremely high scoring seasons, it may be easier to go far below the league average since the average is so high. Extremely low scoring seasons might increase the chances of any pitcher having a very low ERA.
One possible solution is to compare the best pitcher in the league to the other good pitchers in the league. If it is easy for one pitcher to go far below the league average, it should be easy for a few others. By comparing the league leader in ERA (or any measure of pitching quality) to the other very good pitchers, the problem mentioned above might be lessened.
ERA can also be affected by the home ballpark of the pitcher. So in addition to comparing the best pitchers to other good pitchers, their performance should be adjusted for park effects. Pitchers in high scoring parks will have their runs allowed adjusted downward and vice versa.
One measure that allows for this is called RSAA. It comes from the Lee Sinins Sabermetric Encyclopedia, a commercial database that can be purchased by any baseball fan. Here is the definition: "Runs saved against average. It's the amount of runs that a pitcher saved vs. what an average pitcher would have allowed."
I looked at how the RSAA of league leaders since 1900 compared to the average RSAA of the pitchers who finished 2-10 (hence, the idea of comparing top pitchers to other good pitchers). For example, Walter Johnson had 75 RSAA, meaning he allowed 75 runs less than the average pitcher. The next 9 best pitchers in 1913 averaged 25.56. So Johnson was 49.44 better.
But having, say, 30 more RSAA than the next best nine pitchers might mean more in a low scoring year than a high scoring year. In a low scoring year it will take a lower number of runs to add one over the course of a season. But how many? I used the formula which says it takes 10 times the square root of the number of runs scored per inning by both teams (found in Total Baseball, 5e). If each team scores .5 runs per inning, the total is one. The square root is 1 and 10 times that is 10, so it would take 10 additional runs over the course of a season to win one more game. The Lee Sinins Sabermetric Encyclopedia can call up the top 10 each season in RSAA.
Who were the top pitchers according to this method? The top 10 in the AL are listed below:
Pitcher	         Year	RSAA	RSAA 	Diff*	R/W	Extra Wins
Walter Johnson	1913	75	25.56	49.44	9.39	5.26
Pedro Martinez	2000	77	24.56	52.44	10.89	4.81
Lefty Grove	1931	75	26.67	48.33	10.73	4.50
Lefty Grove	1932	75	26.70	48.30	10.81	4.47
Walter Johnson	1912	74	29.56	44.44	10.02	4.44
Walter Johnson	1918	56	16.92	39.08	8.97	4.36
Cy Young	         1901     72	25.11	46.89	11.08	4.23
Pedro Martinez	1999	71	28.11	42.89	10.87	3.95
Lefty Grove	1926	62	23.33	38.67	10.34	3.74
Hal Newhouser	1945	59	24.44	34.56	9.34	3.70
Lefty Grove	1936	70	29.78	40.22	11.32	3.55
*2-10
In 1913 it took 9.39 runs to win one more game. Since 49.44/9.39 = 5.26, Johnson added 5.26 more wins than the average of the next best nine pitchers in the league (I have eleven pitchers here--Hal Newhouser's season was a war year, when many good pitchers may have been in the military).
For the NL, the top 10 were:
Pitcher	         Year	RSAA	RSAA 	Diff*	R/W	Extra Wins
Grover Alexander	1915	69	15.80	53.20	9.00	5.91
Dolf Luque	1923	66	24.00	42.00	10.40	4.04
Bob Gibson	1968	56	21.78	34.22	8.72	3.93
Greg Maddux	1995	64	24.80	39.20	10.17	3.86
Christy Mathewson	1905	61	25.33	35.67	9.62	3.71
Dwight Gooden	1985	58	22.75	35.25	9.51	3.71
Dazzy Vance	1930	64	22.36	41.64	11.33	3.68
Carl Hubbell	1933	52	18.10	33.90	9.44	3.59
Dazzy Vance	1924	56	20.78	35.22	10.07	3.50
Bucky Walters	1939	58	23.11	34.89	9.99	3.49
*2-10
One problem can be seen--if you know some baseball history--is that we still see the best pitching performances coming from what are generally fairly high or fairly low scoring years. I really don't know the solution. Comparing players using standard deviations instead of simple averages might be better. I ran this study and ranked pitchers in ERA based on how many standard deviations below the average of all qualifying pitchers they were. Pedro Martinez in 2000 was the best, being 3.79 SDs below average.
Looking at ERA has an advantage over RSAA, since it only includes earned runs whereas RSAA includes both earned and unearned runs. Unearned runs may not be the fault of the pitcher. I also looked at the best ERAs relative to the 2-5 pitchers each year.
But both RSAA and ERA are, in part, determined by the quality of the fielding behind the pitcher. In his Win Shares methodology, Bill James attempted to rate pitchers solely on their contribution to winning, independent of the fielders. Using the electronic Win Shares database, I found the best seasons by taking the league leader and seeing how many Win Shares he had as percentage of the pitchers who finished 2-5.
Pitcher	  Year	WS	Ratio
Alexander	  1915	43.32	1.87
Maddux	  1994	25.96	1.86
W. Johnson 1913	50.28	1.81
Alexander  1917	39.11	1.77
Grove	  1931	41.83	1.74
Walsh	  1908	46.62	1.74
Alexander  1916   41.95    1.72
Maddux	  1995	29.87	1.72
Vance	  1924	35.57	1.68
W. Johnson 1915	39.34	1.67
Carlton	  1972	40.38	1.67
Martinez	  2000	28.86	1.64
Chesbro	  1904	51.80	1.63
Luque	  1923	38.97	1.63
Walters	  1939	34.50	1.59
Gibson	  1968	36.36	1.52
Clemens	  1997	31.66	1.52
Martinez	  1999	26.89	1.52
Perry	  1972	39.04	1.50
The same pitchers seem to be near the top on all of these lists (including the lists at the links given above). There could be a problem that the quality of pitchers they are being compared to is relatively low (which might explain why they all do so well in simple comparisons to the league average as well). Maybe some years just did not have many good pitchers. I don't know how that could be determined. One suspicion I have about some of Pedro Martinez's good years is that there were no other very good pitchers. Roger Clemens was in decline. Randy Johnson was traded to the NL. But maybe the same could be said about Bob Gibson in 1968. Sandy Koufax was gone. Tom Seaver had yet to hit his prime. Maybe it could be said about any of these pitchers.
Some pitchers who stand out even among this crowd are Walter Johnson, Grover Cleveland Alexander, Greg Maddux, and Pedro Martinez. They each have two consecutive seasons that both appear near the top of these lists. They proved what they did was no fluke.
Cyril Morong teaches economics at San Antonio College and is a lifelong White Sox fan. A member of SABR since 1995, his articles have appeared in The Baseball Resarch Journal, By the Numbers and on line at The Chicago Sports Review.
[Additional reader comments and retorts at Baseball Primer.]
| Designated Hitter | July 01, 2005 |
Introducing Monte Carlo Win-Loss
The flaws in pythagorean Win-Loss percentage (commonly the square of runs scored divided by the sum of the square of runs scored and the square of runs allowed) are fairly well known. 20-2 blowouts count as only one win, but may affect pythagorean win-loss percentages dramatically. One-run wins and losses count as a whole win or loss, while pythagorean win-loss will treat them as nearly half a win and half a loss. All of these are true, but the method is still pretty darn good.
There has been a fair amount of work on what just is the best exponent to use, and I've settled on 1.83 for Baseball-Reference, but other choices abound and some have even resorted to variable exponents to squeeze out those last three to four wins of error. I'm not going to go down that path here. I would like to look at a different way to approach this issue that accepts that teams have blowouts and one-run wins and incorporates this into the method.
At the 2004 SABR convention in Cincinnati, I presented a talk on monte carlo simulation of pennant races (http://www.bb-ref.com/sabr/). The idea behind Monte Carlo Win-Loss Percentage is similar. (Monte Carlo techniques are common computational solution techniques used to simulate complicated systems. Basically, you run a lot of simulations and aggregate the data.)
- Get the runs scored and allowed for a team's 162 (or whatever) games.
- Randomly order the runs scored values (doing both is redundant).
- Play 162 games by reading down the list of runs scored and allowed and when runs scored exceed runs allowed the team "wins" and vice-versa the team loses. (Ties do occur and are half a win and half a loss.)
- For example (with ten games),
Team's actual results Randomly ordered and simulated RS RA W/L RS RA W/L 5 4 W 2 4 L 11 5 W 4 5 L 4 1 W 5 1 W 5 3 W 4 3 W 5 1 W 5 1 W 6 1 W 10 1 W 10 7 W 12 7 W 12 7 W 11 7 W 4 3 W 6 3 W 2 0 W 5 0 W Record 10-0 Record 8-2 - Do this 1000 times (an arbitrary choice, but the numbers don't vary much in consecutive 1000 season runs) and aggregate the data.
What are the Flaws?
Well, this method assumes that runs scored and runs allowed are independent of each other and that clearly is not the case. Managers manage to the score and the four runs allowed by mop-up relievers in the bottom of the ninth could turn a real win into a monte carlo loss (the same thing happens with pythagorean to a lesser degree). However, I think this method more correctly handles the cases where a team has a lot of one-run wins or many blowouts. Suspended games are somewhat problematic and tie games are troubling, but I think all of this gets evened out over the long run.
Does it work?
Yes, but not well enough to supplant pythagorean win-loss records.
I've computed Monte Carlo Win-Loss Percentages (mcWL%) for every team from 1901 on and it does a little better than Pythagorean Win-Loss Percentage (pythWL%) with a 1.83 exponent.
Root-mean square error between mcWL%, pythWL%, and actual WL% for 2076 seasons since 1900.
So one measly percentage point, or one-sixth of a game better estimate over the course of a season. Also the mcWL% was as closer or better than pythag in 53% of the cases.
So not great, but competitive.
What can you do with this?
I have a couple of ideas, but I'll expand on those later. One thing that is neat about these simulations is that you can count how many times the team's actual wins exceeded the simulated seasons wins. For instance a team that exceeded the simulation all 1000 times was probably very lucky to do so, and a team that never did was very unlucky (I call this percentile). We can also track their best and worst results along with the average.
Luckiest teams by mcWL% - WL%
team_ID    year_ID    W   L    mcW   mcL  HighW  LowW     WP   mcWP  pythWP  lucky       %ile
BOS           1946  104  50   93.4  62.6  102.0  84.5  0.675  0.599   0.629  0.076       1.000
NYG           1909   92  61   83.1  74.9   93.5  74.5  0.601  0.526   0.560  0.075       0.998
NYG           1913  101  51   92.6  63.4  102.5  83.5  0.664  0.594   0.627  0.070       0.998
NYY           2004  101  61   89.8  72.2   98.5  78.5  0.623  0.554   0.548  0.069       1.000
BRO           1954   92  62   81.3  72.7   92.0  71.0  0.597  0.528   0.523  0.069       1.000
CHW           1959   94  60   84.9  71.1   94.0  74.5  0.610  0.545   0.559  0.065       1.000
CIN           1981   66  42   59.1  48.9   67.0  51.5  0.611  0.547   0.524  0.064       0.999
CIN           1944   89  65   80.0  75.0   91.5  71.0  0.578  0.516   0.530  0.062       0.999
NYY           1943   98  56   88.9  66.1   99.0  80.5  0.636  0.574   0.595  0.062       0.999
PIT           1908   98  56   88.9  66.1   99.5  79.0  0.636  0.574   0.600  0.062       0.997
SLB           1902   78  58   71.6  68.4   80.0  62.0  0.574  0.512   0.509  0.062       0.990
NYM           1972   83  73   73.5  82.5   83.0  65.0  0.532  0.471   0.459  0.061       1.000
PHA           1931  107  45   98.4  54.6  106.5  88.0  0.704  0.643   0.640  0.061       1.000
STL           1917   82  70   73.9  80.1   83.5  65.0  0.539  0.480   0.470  0.059       0.996
NYG           1925   86  66   77.0  75.0   86.0  66.5  0.566  0.507   0.522  0.059       1.000
CHC           1907  107  45  100.1  54.9  109.5  91.0  0.704  0.646   0.670  0.058       0.992
NYG           1906   96  56   88.0  65.0   97.5  74.5  0.632  0.575   0.592  0.057       0.997
PIT           1905   96  57   88.4  66.6   98.0  77.0  0.627  0.570   0.588  0.057       0.996
PIT           1909  110  42  102.0  51.0  113.5  94.0  0.724  0.667   0.694  0.057       0.997
BRO           1924   92  62   83.3  70.7   94.0  74.5  0.597  0.541   0.528  0.056       0.999
Unluckiest teams by mcWL% - WL%
team_ID    year_ID   W    L   mcW    mcL  HighW  LowW     WP   mcWP  pythWP   lucky       %ile
BSN           1935  38  115  53.3   99.7   64.5  43.0  0.248  0.348   0.327  -0.100       0.000
NYM           1993  59  103  71.4   90.6   81.5  61.5  0.364  0.441   0.454  -0.077       0.000
CIN           1937  56   98  68.2   86.8   79.5  59.0  0.364  0.440   0.434  -0.076       0.000
PHI           1936  54  100  65.6   88.4   74.5  55.0  0.351  0.426   0.416  -0.075       0.000
STL           1909  54   98  66.1   87.9   76.0  55.0  0.355  0.429   0.398  -0.074       0.000
SLB           1905  54   99  66.5   89.5   78.0  58.0  0.353  0.426   0.421  -0.073       0.000
PIT           1917  51  103  63.2   93.8   71.5  54.5  0.331  0.403   0.388  -0.072       0.000
BSN           1912  52  101  63.6   91.4   73.0  53.5  0.340  0.410   0.402  -0.070       0.000
DET           1952  50  104  61.3   94.7   71.0  49.5  0.325  0.393   0.374  -0.068       0.001
PHA           1945  52   98  63.3   89.7   72.5  53.5  0.347  0.414   0.385  -0.067       0.000
NYM           1962  40  120  50.9  110.1   61.0  41.0  0.250  0.316   0.313  -0.066       0.000
WSH           1907  49  102  60.3   93.7   69.0  51.0  0.325  0.391   0.361  -0.066       0.000
BRO           1912  58   95  67.9   85.1   79.0  58.5  0.379  0.444   0.433  -0.065       0.000
HOU           1975  64   97  74.8   87.2   83.5  64.5  0.398  0.462   0.469  -0.064       0.000
SDP           1994  47   70  54.5   62.5   63.5  46.0  0.402  0.466   0.453  -0.064       0.003
PHA           1946  49  105  59.0   96.0   68.0  50.5  0.318  0.381   0.387  -0.063       0.000
PHI           1930  52  102  62.4   93.6   73.0  50.5  0.338  0.400   0.392  -0.062       0.002
SLB           1911  45  107  54.5   97.5   63.5  42.5  0.296  0.358   0.341  -0.062       0.002
PHI           1923  50  104  59.8   95.2   69.5  47.5  0.325  0.386   0.367  -0.061       0.002
BSN           1911  44  107  54.9  101.1   63.0  43.5  0.291  0.352   0.333  -0.061       0.001
Teams for which pythWL% and mcWL% differ the most
team_ID    year_ID    W    L    mcW    mcL  HighW  LowW     WP   mcWP  pythWP       %ile
BRO           1918   57   69   57.0   69.0   64.5  47.0  0.452  0.452   0.387       0.543
CHC           1905   92   61   96.2   58.8  106.5  86.0  0.601  0.621   0.680       0.083
BSN           1904   55   98   57.8   97.2   67.5  49.5  0.359  0.373   0.316       0.187
CHW           1905   92   60   91.8   66.2  100.0  81.5  0.605  0.581   0.636       0.563
BSN           1906   49  102   53.6   98.4   63.0  45.0  0.325  0.353   0.300       0.059
STL           1908   49  105   50.5  103.5   63.0  42.0  0.318  0.328   0.277       0.328
WSH           1903   43   94   49.3   90.7   59.0  40.0  0.314  0.352   0.302       0.015
CIN           1901   52   87   54.0   88.0   62.5  45.5  0.374  0.381   0.334       0.264
SDP           1972   58   95   62.6   90.4   73.0  53.0  0.379  0.409   0.362       0.075
WSH           1947   64   90   63.0   91.0   72.5  51.0  0.416  0.409   0.363       0.660
CHC           1909  104   49  102.9   52.1  111.5  92.0  0.680  0.664   0.709       0.651
CLE           1908   90   64   86.9   70.1   96.5  77.5  0.584  0.553   0.598       0.871
NYY           1939  106   45  104.8   47.2  114.0  94.0  0.702  0.690   0.734       0.683
BRO           1909   55   98   60.6   94.4   70.0  52.5  0.359  0.391   0.347       0.031
BSN           1905   51  103   54.6  101.4   63.0  46.0  0.331  0.350   0.306       0.119
DET           1905   79   74   72.4   81.6   81.5  61.5  0.516  0.470   0.426       0.993
HOU           1963   66   96   64.8   97.2   73.0  55.0  0.407  0.400   0.357       0.686
PIT           1918   65   60   64.6   61.4   72.0  55.0  0.520  0.513   0.556       0.581
STL           1944  105   49  102.8   54.2  112.5  93.5  0.682  0.655   0.697       0.784
BRO           1910   64   90   68.6   87.4   79.0  57.5  0.416  0.440   0.398       0.065
I've also made available a dump of my simulation results. The fields are tab-delimited. You can import this into excel easily using the text to columns command (the most useful command for any stathead, well after sorting). Simulation Data.
The columns are straightforward, except for stdW which is the standard deviation of the wins totals across the 1000 simulations, and bstW and wstW are the best and worst win totals of all 1000 simulations.
[Additional reader comments and retorts at Baseball Primer.]
| Designated Hitter | June 23, 2005 |
My Little Blue Book
When I was nine years old, my parents gave me a little book with a blue cover for Christmas. It was small enough to fit into a stocking--5 by 4 inches, with the kind of cheap-grade paper that made its 174 pages seem more like 50. Written by Louis Phillips in 1979, it had the terse, uninspiring title BASEBALL.
You wouldn't think much of the book if you saw it today. It's littered with dry lists (the 3,000-hit club, top ten lifetime homers, etc.), strange-but-true anecdotes (like Harvey Haddix's lost masterpiece), a glossary of baseball terms (a can of corn is "a high, lazy fly ball that can be easily caught"), and mini-bios and illustrations for some of the game's most honored luminaries. The quality of the drawings is variable at best - you'd swear Carl Yastzremski was actually Richie Cunningham, and that someone inserted a sketch of Dionne Warwick in place of Rod Carew.
But to me the book was a godsend. I studied it obsessively for the entire winter after I got it. I could tell you that Tris Speaker hit more doubles than any man in history, that Al Zarilla was the last guy to smoke two triples in an inning, and that Walter Johnson struck out 3,508 batters, more than every other major-league pitcher (up to that point, anyway; the figure has been bested eight times since). For awhile my father and his friends used to try to stump me by asking me to, say, rattle off the complete list of 500 home-run hitters, or give the names of the last Triple Crown winners in each league.
The weird thing is, I wasn't a huge baseball freak when my parents gave me that book for Christmas. I mean, sure, I'd been to many ballgames by 1979. But to be honest those games are mostly a miasma of hazy impressions. I never had the primordial experience where you walk into a ballpark for the first time and fall in love with the smell of the grass or the thwack of the ball hitting the bat. Instead, I fell in love with baseball through a book. You might even say that I fell in love with BASEBALL before baseball itself.
It's a little embarrassing now that I think about it, that a throwaway stocking stuffer--which couldn't have cost more than a buck-fifty--was my way into the National Pastime. In fact, after I'd memorized all the stats in my little blue book, I got ahold of some baseball periodicals and followed the 1979 season after it was over (sorta like a guy I knew who liked reading literary criticism about Moby-Dick, but hadn't actually read Moby-Dick).
After that stat-fueled winter of 1979, I got into baseball--I'm talking real, actual baseball here--pretty hardcore. But until that time, baseball was mostly a series of lists and dates and numbers to me. Something about those stats had a kabbalistic hold on me, which is exactly what the traditionalists complain about--that today's kids are reducing the wonderfully elusive game of baseball into a Matrix-like stream of data. But that's what baseball was to me in the early days: a parade of numbers.
My ally in the world of baseball numbers was always my brother Sean. Four years younger than me, he was something of a math prodigy. My dad would quiz him when he was still young enough to sit in the seat of a grocery cart, asking, for example, "what's negative three minus negative five," and Sean would chirp "Two!" Later he learned how to do long division in a blink and read college textbooks as a hobby--you know, for fun. Eventually he had to be sent to an advanced math school (think this episode of the Simpsons) because he was too bored with regular ol' addition and subtraction.
Around that same time, in the mid-'80s, I read Robert Coover's The Universal Baseball Association, Inc.: J. Henry Waugh, Prop. I was too young to understand it as a work of meta-fiction, but I was smitten with the main character, Henry Waugh, and his attempts to devise a role-playing baseball game that he could play on his kitchen table:
Henry had spent the better part of two months just working on the problem of odds and equilibrium points in an effort to approximate [the game's] complexity. Two dice had not done it. He'd tried three, each a different color, and the 216 different combinations had provided the complexity, but he'd nearly gone blind trying to sort the colors of each throw. Finally, he'd compromised, keeping the three dice, but all white, reducing the total number of combinations to 56, though of course the odds were still based on 216. . .Besides these, he also had special strategy charts for hit-and-run plays, attempted stolen bases, sacrifice bunts, and squeeze plays, still others for decided the ages of rookies when they came up, for providing details of injuries and errors, and for determining who, each year, must die.
This was turbo-charged Strat-o-matic, a league where you got to be player, fan, manager, GM, owner, and even God Himself. It was just attractive enough to a self-absorbed teenager (is there any other kind?) that I decided I was going to invent a role-playing baseball game of my own.
But I would need help from my brother Sean. The two of us were heavily into Bill James, APBA, and baseball arcana (I remember going to a ballgame with him once and both of us trying to name every ballplayer from 1982 whose last name ended in the letter Y--we got everyone but Tim Flannery). In many ways Sean was the ideal partner as we embarked on our super-project. But in another way we were totally ill-suited to the task. After all, I was only 14 years old; he was 9. Math prodigy or no, I'm not sure we realized the enormity of constructing a game that was, essentially, an extremely complex orrery--a mechanical model of baseball itself.
But try we did. We spent the better part of one summer figuring out the percentages of various incidents, both on and off the field (i.e., when the Pittsburgh Drug Trials exposed baseball's drug problem a short time later, I factored in the odds that a player would be suspended for putting coke up his nose). Far and away our biggest bugaboo was devising a mathematical model for baseball's aging patterns. Sean and I filled notebook after notebook charting the flow of hundreds of players' careers.
It was an endless, painstaking research project, but I realized, near the end of that summer, that our data was fundamentally screwy. Specifically, I noticed that different types of players aged differently--that slender slap hitters were different animals from lunky longball types (an insight that eventually made PECOTA tick). But because I hadn't factored that in, it made our research virtually useless. I began to feel in over my head. When I started high school in the fall, I set aside my preoccupation with baseball numbers and turned to other things: girls, the Godfather movies, the Clash, things like that.
But Sean stayed with the stats. He figured out that you didn't really need dice or mathematical models to make a workable baseball role-playing game. Instead Sean skipped over all the research and hatched a baseball league out of his own imagination. It was called the United Baseball League, or UBL, and it was filled with concocted players who seemed straight out of a Preston Sturges movie: Apollo Armstrong, T-Bone Clemons, Barrett Vollm, L'Shaen Galloway, Lefty Wells (a righty), and Amos Grace (Brooks Kieschnick before there was Brooks Kieschnick).
Sean would spend his days filling new notebooks with new numbers, all of them recording the goings-on of his baseball otherworld. One time I peeked at his stat pages and discovered thousands of simulated teams and players, going back to the 1940s. The closest analogy I can think of are the mad ravings of Charles Crumb, the older brother documented in the movie Crumb. As he slowly began to lose his mind, Charles' comic strips dispensed with actual drawings and instead became crowded--even ravaged--with odd markings and hen pecks, a strange kind of graphophilia whose meanings were known only to him. That was Sean's United Baseball League.
Sean eventually outgrew his numbers fetish, just as I did, and both of us ended up drifting into the humanities (I'm now a writer; he's an actor). When I was home from college one summer I ran across the research I had done on our role-playing baseball game and I threw it all away. I guess I was at that age where a mathematically modeled baseball game seemed silly, if not downright hubristic (in a Robert McNamara sorta way).
If you think about it, my folly of trying to reduce baseball to numbers is the same one that gets levied against Billy Beane and Paul DePodesta. The anti-numbers crowd (Joe Morgan, Richard Griffin, Buzz Bissinger, Larry Bowa) caricaturize sabermetrics as narrow-minded and robotic--some human element, they say, always slips out, unaccounted for.
The older I get, however, the more I realize that baseball numbers have a personality all their own. In fact, I sometimes like to think of a ballplayer's statline like a song melody. As your eye scans left to right, you pick up tones, rhythms: some are jagged and staccato, others have a sweet languor; some burst at the seams, almost comically, while a few are nearly sublime. Here are a few of my favorites (I'll let you guess who they belong to):
155 	611 	135	 230 	46 	18 	39 	131  	7 	.376 	.450	.702
2-3	.400	77	0	0	55	82.3	37	20	137	1.20
 97 	303  	54  	92  	6 	14  	8  	28 	26 	.304 	.346	.495
21-20 	.512 	44 	44 	23 	0	342 	311 	113 	208 	3.39
 92   	0  	29   	0  	0  	0  	0   	0 	29  	---   	---	---
I like the cadence of those lines. They give off the pleasing impression that the backs of baseball cards are as personable as the fronts.
One of the first things that strikes you about baseball, especially compared to other sports, is the sheer volume of it. Last year alone there were 2,464 games, 188,519 plate appearances, and well over half a million pitches thrown. Most of these situations were probably pretty boring, very much like one another. The thrill, however, is when the unexpected slips through the cracks.
People give Jayson Stark a lot of crap for his Useless Information columns--you know, where he lists all of baseball's latest numerical oddities. There are even some people who think that such eccentricities aren't germane to "real" baseball because they are essentially valueless. (A few years back Lee Sinins refused to consider Kevin Millwood's no-hitter, in which he walked three hitters, any different from other games where a pitcher might allow, say, three stray singles. This is what I would call the fundamentalist version of performance analysis, where all incidents on a ballfield are converted into their most concise unit of value.)
But to me the game has always been about these serendipitously random moments--like when two balls were in play at Wrigley Field in 1959, or when a guy in the upper deck of Yankee Stadium caught foul balls on back-to-back pitches, or when a Randy Johnson fastball just so happened to cross the path of an unfortunate flying dove. The game is full of such impossibilities. My brother Patrick was there when Randy Velarde turned an unassisted triple play, while a friend saw the Twins turn two triple plays in one game at Fenway Park. Sometimes it seems like everything has happened in baseball--but nearly every week, if not every day, the game comes up with something that you've never seen before.
Back in 1979, I read this passage in Louis Phillips' BASEBALL:
Although many players have managed to hit 2 home runs in a single inning, not one player has ever hit 2 grand-slam homers in a single inning in major-league play.
I'm not sure why that factoid made an impact on me, but I used to chew on it when I was a kid. I dreamed that sometime, somewhere, someone could pull off that feat.
Flash forward twenty years later. I'm sitting in the stands in Dodger Stadium on a night in late April, and Fernando Tatis goes yard with the bases juiced--not once, but twice in the third inning. The second one was a low liner that just barely cleared the fence in left center. The Dodger fans around me glumly buried their heads in their hands, but I stood up, stunned. As Tatis rounded the bases, the first thing I thought of was my little blue book. It was almost dead to me--I hadn't thought of it in years. But on that night the memory of those pages came back to me, as alive as ever. It was enough to give me a lump in my throat.
Brian Gunn ran Redbird Nation, "a St. Louis Cardinals Obsession Site," for two years. He's now a full-time movie writer in Los Angeles. If you'd like a compendium of his best sportswriting, you may order the Redbird Nation Reader from Lulu.com. All proceeds benefit the March of Dimes.
| Designated Hitter | June 16, 2005 |
Cool Papa Dwell: Memoirs of My Dad and Baseball
"Hey, Dad...you wanna have a catch?"
-- Ray Kinsella, Field of Dreams
Alomar, Alou, Armas. Bell, Bonds, Boone. Grieve, Griffey, Garvey...well, I'm sure someone fathered by Garvey will make the big leagues -- he just won't have the same last name.
Baseball, perhaps more than any other sport, is deeply engraved in the foundation of father and son relationships. From Herm and Jack Doscher to Steve and Nick Swisher, fathers and sons have been a common occurrence in baseball. But it's just not in the big leagues. For every Ed and Bobby Crosby, there are thousands of Rich and Joe Lederers.
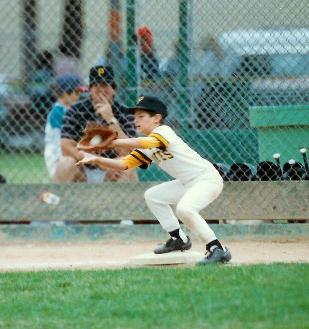 Baseball is almost a rite of passage when it comes to father-son bonding. The root of this bonding most likely starts with a game of catch, or better yet, one's first baseball glove. How many of us actually remember our first football or basketball as vividly as our first glove? They say smell is the sense that triggers the strongest memories, yet I can't conjure up any memories of my Dad's cologne after he showed me how to shave. I don't remember the smell of grass the first time I helped my Dad mow the lawn. But I can still remember the trail of oil and leather wafting from the kitchen into my room when my Dad was breaking in my first glove.
Oh, how baseball did spoil me! Baseball gave me what seemed like adult privileges as a kid...privileges I could share with my Dad. Playing catch with my Dad was my way to stay outside long after the street lights clicked on. Watching baseball games on TV with my Dad -- never on a school night though -- allowed me to stay up past my bedtime. Taking a trip to the stadium with my Dad for a game was my opportunity to enjoy hotdogs and ice cream sundaes (inside miniature helmets, of course).
As front yards shrink and the work week grows, I fear there is less and less interaction between fathers and sons. The simple game of catch has fallen by the wayside along with other father-son activities like building a tree house or changing the oil of the family sedan. I've always liked Harry Chapin's "Cats in the Cradle," but just recently I noticed one heart-wrenching verse:
"My son turned ten just the other day
He said, "Thanks for the ball, Dad, come on let's play
Can you teach me to throw," I said "Not today
I got a lot to do," he said, "That's ok"
And he walked away but his smile never dimmed
And said, "I'm gonna be like him, yeah
You know I'm gonna be like him"
A father not having time to play catch with his son? That's grounds for child neglect in my book! The notion of "an American boy refusing to play catch with his father," as Kevin Costner's character says in Field of Dreams, well, that's just downright inexcusable. I can only hope that every boy can enjoy the bond with his father that is the game of catch.
Playing catch with my Dad was not like any catch you have ever played. Usually it'd start out like any normal soft toss. But the kid inside of him would shine through and before I knew it, my Dad was winding up like Bob Feller and throwing a huge floating changeup that made my knees buckle. Or sometimes he'd flip it behind his back at 70 MPH for a strike. Then there were the risers from his fast-pitch softball days that would leave my glove hand bruised. And when he'd release the ball while still in his windup like some wannabe Al Schacht, we'd usually have to end the game because I was cracking up so hard. When throwing batting practice, my dad was Tom Seaver. Coaching me, he was Earl Weaver. At home, Ward Cleaver. To this day, I refuse to not believe that my Dad was the best baseball player I ever came in contact with. He was, and still is, my idol.
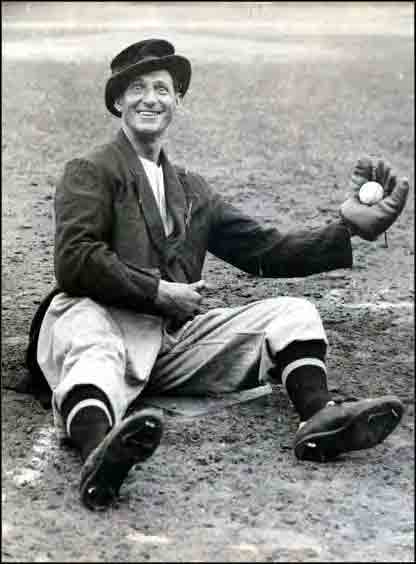
This Father's Day, grab your glove out of the garage and go play catch with your son. Or if you're older, don't hesitate to call your Dad and tell him 'Thank You' for playing catch with you.
Dad, thank you for writing such an outstanding blog so I, and everyone else, can enjoy your fantastic writing and love of baseball.
Thank you for telling fascinating stories about Lou Gehrig and Sandy Koufax.
Thank you for allowing me to sit in on your APBA and rotisserie drafts when I was a kid.
Thank you for impersonating Al Hrabosky.
Thank you for consoling me the night you had to break me the news that I couldn't play on the All-Star team due to living outside of the district.
Thank you for bestowing upon me the difference between Darryl Strawberry, the hitter and Darryl Strawberry, the man.
Thank you for coaching me in Little League and managing me in AYSO soccer.
Thank you for pronouncing 'Alejandro Pena' like you spent the entire 80s as the U.S. Ambassador to the Dominican Republic.
Thank you for continuing to fill in the blanks about the grandfather I never met.
Thank you for supporting me in whatever sports I wanted to play, be it baseball, soccer or golf.
Thank you for teaching me the "Dodger Song." ("Oh really? No, O'Malley!")
Thank you for laughing at me when I came home with a Kevin Maas rookie card...it was a lesson well learned.
Thank you for turning me on to Vin Scully and off of Joe Morgan.
Thank you for showing me how to throw a curveball ("shake hands with the center fielder") and a changeup ("pull down the window shade").
Thank you for taking me to see George Brett play in a charity softball game, for meeting him was quite possibly the start of my love affair with baseball.
Thank you for introducing to me to Bill James, OPS+ and park factors.
Thank you for surrounding me with coaches like Vern Ruhle, Jeff Burroughs and Mark Cresse.
Thank you for letting me take a break during homework on the evening of May 1, 1991.
Thank you for explaining to me how to keep score and read a box score.
Thank you for playing catch with me.
Thank you for being my Dad.
Happy (early) Father's Day!
[Additional reader comments and retorts at Baseball Primer.]
| Designated Hitter | June 10, 2005 |
Gibson Was Great in '68
Bob Gibson was a very good pitcher for several years through the 1967 season, and a very good pitcher for several more years starting in 1969. But in 1968, particularly during a two-month stretch in mid-season, Gibson was arguably the greatest pitcher of all time.
His period of dominance actually began after he suffered a broken leg on July 15, 1967. Returning to action on September 7, Gibson went 3-1 with a 0.96 ERA the rest of the regular season, then led the Cardinals to the world championship with a 3-0, 1.00 World Series performance. Picking up right where he left off, Gibby was 4-0, 1.64 in spring training of the next year.
Then followed his epic 1968 season: a 1.12 ERA, the lowest ever for anyone pitching as many as 300 innings. In fact, he flirted with a sub-one ERA, entering August with a 0.96 mark, and still standing at 0.99 after Labor Day.
One of the reasons Gibson's season doesn't receive the recognition it deserves is his relatively modest 22-9 won-lost record. How does someone lose nine games with a 1.12 ERA? It was mostly a case of poor offensive and defensive support:
In those games, Gibson went 0-9 despite a 2.14 ERA. Had the Cardinals scored but four runs in each of Gibson's 34 starts, he would have gone 30-2. Yes, 1968 was a historically low-scoring season, with only 3.43 runs per team per game in the NL. OK, if the Cards had scored 3.43 runs in each game Gibson pitched, he STILL would have gone 30-4. If they had scored merely three runs in each game, Gibby would have been 24-4. Even if St. Louis had scored only two runs in each game, he would have gone 23-10. And -- ready for this? -- if they had scored just ONE RUN in each game he pitched, Gibson would still have had a winning record, at 13-10.
There is also the perception that EVERY hurler dominated in The Year of the Pitcher. But Gibson's ERA was 63% better than the rest of the National League's 3.03 mark, and 44% better than that of the runner-up in the ERA race.
Gibson pitched 13 shutouts in '68, and easily could have challenged Grover Alexander's record of 16. Besides the May 17 heartbreaker, Gibson twice pitched a complete game victory in which the only run he allowed was unearned. In all, he had 11 games in which he allowed just one run, several of them flukish. Five times during the season, he had a streak of 20+ scoreless innings. Remarkably, Gibson had a 1.83 ERA (but only a 9-9 record) in games he did NOT pitch a shutout.
From June 2 through July 30, 1968, Bob Gibson put on the greatest two-month display of pitching in baseball history. In a stretch of 99 innings, he gave up just TWO RUNS. One scored on a wild pitch ("a catchable ball," according to opposing first baseman Wes Parker), and the other on a bloop double which was fair by inches. Those were the only things standing between Gibby and ten straight shutouts.
It started with a complete-game, 6-3 victory on June 2, in which Gibson whitewashed the Mets in the last two frames. He then ran off five shutouts in a row, beating the Astros (June 6), Braves (June 11), Reds (June 15), Cubs (June 20), and Pirates (June 26). Over the 45 innings, he surrendered just 21 hits and five walks. He was threatening the records of six straight shutouts and 58 consecutive scoreless innings set by the Dodgers' Don Drysdale just a month earlier. And his next start would be on July 1 –- against Drysdale!
The drama ended early, when a low fastball eluded back-up catcher Johnny Edwards in the first inning, allowing a Dodger run to score. Undaunted, Gibby blanked L.A. the rest of the way to win, 5-1, then shut out the Giants five days later. On July 12, Gibson gave up just three hits in a win over Houston, but one was Denis Menke's seventh-inning blooper that landed just inside the left field foul line and plated a run.
On July 17, the Giants paid Gibson the supreme compliment, scratching scheduled starter Juan Marichal so as not to waste their ace against an invincible opponent. It paid off: Gibson had a 6-0 lead after four innings, but the game was rained out, just short of official status, and Marichal won the next day.
Gibby followed with shutouts over the Mets (July 21) and Phillies (July 25) before allowing a fourth-inning run against New York on July 30. He won that game and added three more victories in August to complete a 15-game winning streak, including ten shutouts and a 0.68 ERA.
Gibson was never knocked out of the box during the season, completing 28 of 34 starts and being pinch-hit for late in the other six, as he averaged 8.96 innings per start. Gibson's worst ERA in any month was 1.97 in April. His worst against any team was 2.11 vs. Los Angeles. Help from his home park, Busch Stadium? Gibson's road ERA that year was 0.79.
Gibson continued his dominance into Game Seven of the 1968 World Series against Detroit. In his first 24-2/3 innings of the Fall Classic, he struck out 34 batters, and allowed just 11 hits, three walks, and one run for a 0.36 ERA. Suddenly, he ran out of magic, coughing up four runs on seven hits in the last 2-1/3 innings of the finale. Fittingly, the Cardinals didn't score until there were two out in the ninth inning, and lost, 4-1.
And so ended a pitching season for the ages.
Bill Deane has authored hundreds of baseball articles and six books, including Award Voting, winner of the 1989 SABR-Macmillan Award. He served as Senior Research Associate for the National Baseball Library & Archive from 1986-94. He has since done consulting work for Topps Baseball Cards, Curtis Management Group, STATS, Inc., and Macmillan Publishing, and also served as Managing Editor of the most recent Total Baseball.
[Additional reader comments and retorts at Baseball Primer.]
| Designated Hitter | June 02, 2005 |
The Yankees and the First Free Market
Soon after the New York Yankees' four-game sweep at the hands of the Cincinnati Reds in the 1976 World Series, George Steinbrenner assembled his brain trust to discuss the upcoming free agent marketplace, the first of its kind in baseball history. Despite the sweep, the Yankee brass had a right to be upbeat--it was their first trip to the Series after eleven mostly forgettable seasons, they had reopened the refurbished Yankee Stadium to rave reviews, and they had a fine team. Gabe Paul, the club's general manager and architect, had engineered an astounding series of trades, landing Chris Chambliss, Willie Randolph, Dock Ellis, Lou Piniella, Ed Figueroa, Mickey Rivers, and Oscar Gamble, all in just two years. Paul's deals brought them to the brink, and the new era of free agency promised to push them over it.
In December 1975 an arbiter had determined that pitchers Andy Messersmith and Dave McNally, by playing the previous season without signed contracts, were no longer bound to their former clubs, paving the way for widespread free agency after the 1976 season. In the spring there were more than 200 unsigned players, but only 22 made it through the entire season. These 22 formed the first free agent class.
The ground rules of the marketplace have changed many times over the years, but in the first go-round teams were allowed to sign no more than two free agents, or the number of players they lost themselves, whichever was higher. The teams conducted a dispersal draft, with each club selecting the right to negotiate with certain players. Teams could pick as many players as they wished, but each player could only be selected by 12 clubs, effectively cutting his own free market in half.
Steinbrenner had completed the purchase of the Yankees in early 1973, and since that time had been right in the middle of all of the available high-profile talent.
In 1974 Steinbrenner had been convicted of making illegal contributions to Richard Nixon's reelection campaign, and of coercing his employees to lie to a grand jury. He was suspended from the day-to-day operations of the Yankees for two years, an unenforceable prohibition that baseball tried with Steinbrenner again in 1990. The record-setting Hunter deal, we were asked to believe, was made by Gabe Paul alone, without consultation with the principal owner. No one was fooled. With Steinbrenner again the public face of the team by 1976, the Yankees were obviously going to be big players in the first free agent market.
When his front office gathered, Steinbrenner's opening words were: "We are not going to win a championship with Fred Stanley at shortstop." Indeed, the Yankees fielded nearly a complete team of All-Stars in 1976, with Stanley clearly the weak link in the regular lineup. There was only one starting shortstop available on the market, 34-year-old Bert Campaneris of the Oakland A's. Gabe Paul had another name in mind: Baltimore's Bobby Grich, an outstanding defensive second baseman who had played shortstop in the minor leagues. Grich was also a fine right-handed hitter, another thing the Yankees needed, and Paul made the case that he would be the missing piece. It was quickly agreed that Grich would be their top priority.
Their second choice was also an easy one, Cincinnati left-hander Don Gullett. Gullett was just 25, and had beaten the Yankees in the first game of the just completed World Series.
In the November 4 dispersal draft, the Yankees selected nine players: Grich, Don Baylor, Gullett, Gary Matthews, Wayne Garland, Reggie Jackson, Campaneris, Dave Cash, and Billy Smith. The order of these selections is significant, although some of it (like Baylor ahead of Gullett) was dictated by how many other teams had already selected the player. Asked about the Yankees' priorities after the draft, Steinbrenner allowed, "We are primarily interested in Grich, Gullett, Baylor and Jackson." In reality, Plan A was to go hard after Grich and Gullett. There was not really a Plan B, since George was not accustomed to needing a Plan B. The Yankees wanted Grich and Gullett, and that was that.
The club quickly contacted Jerry Kapstein, the agent for both Gullett and Grich, and secured the right to make the last offer, essentially guaranteeing that they would top the highest bid. Their initial offer to Gullett, six years and two million dollars, was enough to land their prey, thereby angering several other teams who hadn't even had the opportunity to speak with the star pitcher.
Unlike the prolonged chess matches we endure today, in 1976 the players acted as if they feared waking up from their dream. Don Baylor was signed by the Angels on November 16, and the following day brought contracts for Joe Rudi (also the Angels), Dave Cash (Montreal), Gary Matthews (Atlanta), and Bert Campaneris (Texas). The Yankees signed Gullett on the 18th, and then asked Kapstein what it was that Bobby Grich wanted.
What Bobby Grich wanted, it turned out, was to play for the Angels, in his beloved southern California. When Grich heard that Baylor, his best friend in baseball, had signed with California, he called Kapstein and asked him to contact Harry Dalton, the Angels' general manager, whom Bobby knew well from their years together in Baltimore. The Angels had shown little interest in Grich because they already had a well-regarded second baseman, 24-year-old Jerry Remy, and because everyone assumed the Yankees would outbid everyone for him. California had selected Grich with their last pick in the draft, and was the twelfth and final team to choose the second baseman. Dalton's priorities were Baylor and Rudi, and he quickly landed both.
The rule allowing each team to sign only two free agents contained a single exception: a team could sign enough players to replace their own lost players. The Angels played the 1976 season with two unsigned players: seldom used utility men Paul Dade and Billy Smith. On September 9, the Angels purchased infielder Tim Nordbrook from the Orioles, an unusual transaction for a team that was in fifth place, 17 games behind the Royals. What made this deal interesting was that Nordbrook was also soon to be a free agent, giving the Angels a total of three. The Angels made no effort to sign Nordbrook, so they ultimately "lost" three players who combined for 25 at bats, and 4 hits, in the 1976 season.
Bobby Grich was aware of all this, and knew that the Angels could sign a third player. When Kapstein passed on Grich's interest to Dalton, Harry told him that the Angels had already spent more money than they had wanted and were out of the market. The four-time Gold Glove winner persisted, telling Dalton that if the Angels made a decent offer he would take it without any bidding war. Dalton agreed, talked to Gene Autry, and got the OK to invite Grich to Anaheim to work out a contract.
But not before Grich had his promised meeting with George Steinbrenner. The Yankees put on quite a show, telling Grich that he would guarantee them the championship, that he would be an outstanding shortstop, the missing piece to a coming dynasty. Bobby said he'd think it over, that he was leaning toward the Angels but he was impressed with the Yankees pitch. Of course, George wasn't used to people "thinking it over," so he told Grich that if he signed with the Angels he would lodge a protest with the commissioner about their suspicious purchase of Nordbrook. This was a mistake. Grich left the meeting, called his friend Dalton to ask whether the Yankees had a case, and quickly worked out an agreement with the Angels.
The Yankees did not want to be publicly spurned by anyone, so they leaked a story that they had soured on Grich's demands (though he had made none) and were wary of his ability to play shortstop. The guy they wanted all along, it turns out, was Reggie Jackson. This was convenient, since by this time there were only two free agents left on the Yankees draft list: Jackson and Billy Smith. There was no way the Yankees were going to come away with only one free agent, and there is no way they were going to sign the likes of Smith. So, of course they wanted Reggie Jackson. They got him pretty quickly, for five years and three million dollars.
Gabe Paul got his shortstop in March, trading the displaced right fielder Oscar Gamble to the White Sox for Bucky Dent. The Yankees went on to win the next two World Series titles, thanks in large part to two big years and post-seasons from Jackson.
It is interesting to speculate on what would have happened had the Yankees landed Grich in 1976. Jackson earned the nickname Mr. October in New York, and Dent had one of their most famous home runs. Grich, on the other hand, had many fine seasons ahead of him, and Gamble had a great year for Chicago in 1977 and several more good ones. What we are left with is this: had the Yankees acquired Bobby Grich, all of what followed, the subsequent trades and signings, the managerial changes, the infighting, the wins and losses, the whole Bronx Zoo saga, all of it would have been different. How it would have turned out is anyone's guess, but it's hard to imagine how it could have been as fascinating as what actually transpired.
Mark Armour is an engineer and writer from Oregon. He and Daniel Levitt wrote the award-winning book, Paths to Glory, and are at work on a follow up. Mark has also written extensively for Baseball Prospectus, several other leading baseball web sites, and many SABR publications, and is the director of SABR's Baseball Biography Project.
| Designated Hitter | May 26, 2005 |
Retrosheet: Filling in the Blank Generation
Keep Johnny Carson in New York!
May 29, 1972 - The last time anyone would hear that embarrassing bullhorn-fueled burst of nonsense coming from the snarled lip of my crazed next door neighbor, Johnny H - "The Singing Cop" with his greasy metronomical hair curl dangling over his forehead, desperately trying to keep in time with an era long gone (quick, somebody grab his wrist and check his Vitalis signs!). He was still pleading from the window of his early '60s Cadillac (you know, the one with the disconcerting five-foot wooden poster that screamed out, "Keep Johnny in New York!" fully nailed onto the roof) while making his last rounds in trying to drum up support to keep The Tonight Show in New York, even though the show had left NYC for the mud-slinging Hollywood hells of Burbank earlier in the week.
You see, Johnny H was that rarest of cats, a hunky local celeb who thought he was Elvis' brother, an actor (his work on the pro-Cuba soap opera "La Tigressa" is still talked about in some circles. . .unfortunately, these circles are mostly in secret CANF meetings held in the backrooms of Cuban ciguarded bodegas), singer (his 1964 rockabilly side for Lordize Records has a twin guitar break that sounds like a spent Duane Eddy neck gnarling his way through the distorto district of Twangsville), ballplayer, and town policeman.
He clicked off the bullhorn and asked me if I needed a lift anywhere. I told him I was going to meet up with a couple of my friends as we were heading over to The Stadium for a Yankees-Tigers doubleheader. While being chauffeured across town in a dice-hanging, megaphone-blasting (he feared not the clunky monsters of "Target Earth!") Elvismobile would seem to be pretty un-hip, I was running late so I hopped in (naturally, I checked under the rumpled blanket in the back seat to see if Johnny H had gone through with that ill-advised Milton DeLugg kidnapping scheme he had been cooking up).
Johnny H dropped me off at my friend's house, which was located in the backroom of a rundown thread and scallop factory that his family owned. With the mesmerizing whir from the embroidery machines greeting me, I found my two pals already hoisting the moist--a case of Blatz beer and a fifth of Southern Comfort. So we killed some time yakking up baseball, needling down some choice Three Dog Night cuts (what, you were expecting Sir Doug Saldana or Wild Man Fischer?) and rummaging through his baseball card collection. As a companion piece to my growing fluency with Blatz, I started draining some rhythmic shots of Comfort (I now realize how easy it was for Tiny Tim to fall into that horrid three-jar-a-day habit he had of drinking straight-up Ragu Spaghetti Sauce!). I had never tasted that Southern Comfort peach-flavored bourbon liqueur befueur, but "Godfrey Jack Daniels" it went down smooth. Smooth enough that before I knew it, I was more than a half a bottle in and half a bottle out of it. And BP time at the stadium was quickly approaching.
As we were brown bagging it on our way to catch the bus heading to the Port of Authority in NYC, the dreaded woozies started to get to me. Once on the bus, sitting across from the old ladies with cauliflower rears and a crew of dolled-up guys that looked like they might end up sharing some scurvish bath water with Billy Murcia, the whole damned NJT tram started to spin. Fortunately, the ride into Manhattan takes only ten minutes and the P.A. was just ahead. Back then, one of the true tests of a teenager's worth (along with hot wiring cars, easing box-cars of their excess beer, and switching around loose tombstones in the cemetery) was getting in and out of the Port's upstairs bathroom without becoming a scarnation-instant junkie with an honorary degree from Synanon High. But I had to go so bad. . .cripes, it was almost like I was saving up my inner fluids for a YellowDiscipline.com money shot! Luckily, I had no problem making my way through the future residents of gurneyville. Hell, I was skipping over more people than a demoralized census taker. And I had a doubleheader to get to!
I threw up. Now, I had thrown up many times before, but always from something of a natural bent--like a gunnysack full of moldy White Caskets, my Uncle Al's exotic headcheese pizza with mutt dip, or those dastardly tainted Oreo cookies that were left too close to an open can of turpentine. My friends started dragging me down the steps to the subway, passed the seemingly mile long stretch of "Ulzana's Raid" posters, pulling me by a guy dealing a makeshift game of stuss that would have made the great Scarne look like a kid trying to dead deal from the bottom of his "Official 1965 Mr. Met Card Game" deck.
Finally, my friends helped me get my act together (which probably took longer than the mad scientists took in assembling George "The Stork" Theodore during a schematic-free, lightning-deprived weekend) and plopped me down in a subway car. Glancing around, I found that no one was sitting near me. Now either everybody thought I was part of the notorious Musante/Sheen Gang and was there to film "The Incident: Part II," or they felt that I had cornered the market on death-reek colognes with my disenchanting Eau de Parvo # 9.
Looking up, I noticed that the overhead poster ads were starting to morph together--the twin girls from the Wrigley's Doublemint Gum poster now had herpes and were begging for home owner loans at a UNICEF meeting under the stark graffiti tags of the infamous TRACY 168. It was as if a psychotic Ray Johnson baldly snuck into the car and collaged my dipsomanical mind. As we took off for Stadium in our improbable topsy-turvy subway car, I came to the conclusion that some of Professor Pepperwinkle's theories might actually have merit!
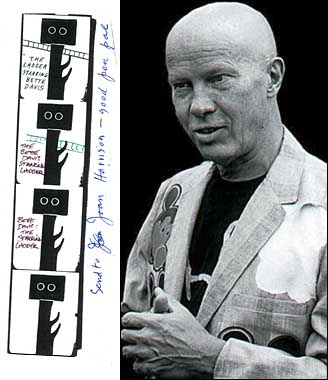
Ahh. . .The Yankee Stadium! Where every usher had gnarly fingers, green hair brought on by a slight case of Phytophthera Infestans, and liver spots the size of their off-duty PBA shields (by the way, did you know that in the '70s a strange phenomenon took over NYC, for a record eight-years running, the answer to every Rorschach test given in the city was "uhh. . .the liver spots on Roger Grimsby's face?"). These ushers were but mere trembling statistics, dressed up in their drab uniforms while still suffering greatly from the lasting effects of the Volunsteady Hand Act of 1919.
After one such Souse of Usher cleaned off our already clean seats with his whisk-ey broom, my buddies tried to get me to sit still and enjoy the game. Ooof. . .there I was, sulking lower than Jorge Cantu's batting helmet and taking up more aisle space than "Dancin' Harry" at some long-forgotten NBA playoff game. I was in such a bad state that I couldn't even stagger down to my old pal Michael Burke's dugout box seats and partake in his open endorsement of Neo-Mulhoolyism. My pals whisked me off to the inviolability of a Yankee Stadium bathroom, the last stall on the left (IT'S ONLY A GAME, IT'S ONLY A GAME. . .) to be exact, where I spent most of the doubleheader coxswayin' in the Ty-D-Bowl Man's boat.
Hell, I was so out of it, I kept waiting for Don Wert's (the only ballplayer that has his last name go directly across on a keyboard, except for that little-known shortstop Muzzy Asdfgh from the 1880s) name to be Shepparded in, even though he had been dealt away two years earlier. It should also be noted that terminal out patient, Ray Oyler, was no longer with the Tigers, having moved on to Seattle in the George Lauzerique (who, I imagine, is still waiting for a call back from the James Bond people) deal. Rumor has it that Oyler did rather well for himself after retiring from baseball, when he hooked up with the Milton Bradley Company and became their cover model for the board game, "Hangman."
Having sprinkled the infield with fleeing brain cells, I really don't remember much from the double-header. . .so there is but one place to turn.
Retrosheet Rocks!
The greatest memory retrieval system for pathetic burnout victims of the '70s, like you and me!
I now see that the Yankees swept both ends of the doubleheader and that Sparky Lyle saved both games (I do seem to remember hearing "Pomp and Circumstance" on and off that day, but I always figured it was just the overly triumphant guy in the stall next to me). Hey, I also see that in the first game, it was one of only seven career appearances for Detroit pitcher Bob Strampe, who headed off the mound and into the unforgiving pages of "The Baseball Encyclopedia" with his 11.57 ERA in tow. Thanks for playing along, Bob!
Speaking of "The Baseball Encyclopedia," I'm still amazed by the fact that when the space shuttle program had problems with their ablative shields randomly burning through, the Macmillan Publishing Company stepped in and allowed NASA to copy their top-secret, solidifying formula used in the making of the hard cardboard box cover that housed the original 1969 Baseball Encyclopedia. Bravo gentlemen, bravo. I find now that Eddie (looked like a CPA, hit like a DOA) Brinkman went 2-for-6 in the doubleheader. Dully impressed!
Huh? Hal Lanier, once a top executive swingman for Buhl In-dust-tries, went 1-for-4 in the twin bill with an RBI in each game! Discovering something like this is almost as shocking as the time I pulled a Gene Brabender baseball card and found out it WASN'T part of the Wacky Pack set!
Wow! I see that Billy Martin got tossed in the first round of the doubleheader. And how do you explain a Paul Jata batting third for the Tigers?. . .Then again, how do you explain Junket Rennet Custard, Cerebus the Aardvark, and the continuing success of Vincent Schiavelli? You can't, you just can't.
Not only did this day mark the final jaunt of Johnny H and my tale of the vomitous Yankee-Tiger double dip, it also was the day where the Yankees finally gave up on Bozo and shipped Rich (four errors in one game) McKinney out to AAA Syraexcuse. While this might pale next to the insane time/space coalescing kabob of Jack Kerouac, Mickey McDermott and Paul Gleason shacking up together in liver cadavering splendor, I still dig it. It's amazing that I can remember that Element Lad was Jan Arrah from the planet Trom, Baron Mikel Scicluna's finishing move involved a roll of dimes, and to have your dog-worn couch reapulstered at Gimbels, you had to call Murray Hill 7-7500! (that's Murray Hill 7-7500! ), but I can't remember a damn thing about the subusway ride home. (Boy, I sure hope David Smith's Retrodeclarativememory site gets off the ground!)
I do remember crawling toward my house and running into one of my ne'er-do-well druncles. He had one scantzy look at me and said, "Son. . .half of your well-being fell off a truck anyway." In case you were wondering whatever happened to Johnny H - "The Singing Cop" and his snazzy early-model Gibson Flying V guitar. . .Well, he was thrown off the town police force, dumped his va-va-vooming platinum blonde wife, went on to fake his own death by pretending to jump off the George Washington Bridge by leaving his cruddy Caddy running in the right lane, as he hopped into a waiting second car driven by his sexy 14-year-old blonde sweetheart/president of the "Johnny H Fan Club," opened a rock-and-roll hot dog stand in upstate N.Y., and, most disturbing, had his name changed to Aron. He died last year.
Oh well, as that great American thinker, Norton Nork, once mimed, "Not everything in life can be solved by hammering out a metallic State Farm logo."
Thanks to Johnny H. and Retrosheet for the ride.
Darren Viola, also known as Repoz, hung around Yankee Stadium in the 1960s and 1970s, various New York City punk clubs in the 1980s and 1990s as a DJ, and has been Baseball Think Factory/Baseball Primer's historian extraordinaire and collector of obscure references during the 2000s.
| Designated Hitter | May 19, 2005 |
What's Old is New
Over the last fifteen years, the major leagues took on the task of rebuilding its infrastructure, the stadiums we enjoy visiting so much. From Philadelphia to San Diego, new construction brought us open concourses, more leg room, luxury boxes, video scoreboards, retractable roofs and higher taxes. In Pittsburgh, fans now have a view of the city skyline; in Denver, the snow covered mountains loom over the outfield fence even in July. You can bring your dog to PETCO and visit with Boog Powell in Baltimore. The new stadiums are more than just a place to watch a game; they're an event unto themselves.
It was a little different in Washington this weekend. I was invited down to attend the game on Saturday night, and I found that I liked RFK Stadium. The park was built in 1962 for the second version of the Washington Senators, born when the original team moved to Minnesota. It's the same stadium you saw in Philadelphia, Pittsburgh, Cincinnati, San Diego and still in St. Louis. And, believe it or not, I liked it. It's a park built with one thing in mind, to watch a sporting event.
It's easy to get to RFK. We took a subway ride from downtown and didn't need to change trains. It looked like there was a lot of parking at RFK, and it was located next to the highway. There were plenty of concessions, and although we were down the right field line, we had a nice view of the action. As I sat there watching the rain and then the action, I thought, why spend all that money on a new park when this was a perfectly reasonable place to play ball.
The Red Sox tried to get a new stadium for years. When the new ownership took over, it was clear to them that it wasn't going to happen. Instead, they looked inward to see what could be done with their existing building. The results are marvelous. The Green Monster seats are the hottest ticket in town. The right field roof, which was dangerous to stand on as late as the 1999 All-Star game (I was up there) is now a beer garden. Plans are in the works to add even more seating to the existing structure. So far, every change the Red Sox made improved the park. They're even going to get rid of the .406 Club, a poor improvement the old ownership installed. Slowly but surely the Red Sox are turning Fenway into a state of the art facility while retaining it's old time charm.
Why can't the Nationals do the same with RFK? If they move DC United to the Redskins home, you could make the seating baseball only. The stands that move for football could be made permanent and angled better for baseball sightlines. The useless outfield seats could be torn down and a lower level of bleachers could be added with a view past the outfield wall. Some clever architect could find a way to insert luxury boxes as well. And most importantly, the field can be torn up and replaced with a state of the art drainage system. The deluge I saw on Saturday night indicated the need for a way to clear the field of water quickly.
Baseball would also be preserving a part of it's past. Just as Wrigley and Fenway stand as monuments to the early intimate ballparks, RFK could stand as a reminder of an era of stadiums that were part of the scene for three decades. Camden Yards is no longer retro; it's become the norm. What's special about going to a new ball park anymore? They're mostly designed by the same people and have the same features. We appear to have replaced one set of cookie cutter parks with another. Granted, they are more fan friendly. They contain more nooks and crannies. There's more to do than in the old stadiums. But in a way the ballpark has become the event. "I'm going to Camden Yards," not, "I'm going to the ball game."
RFK is now the retro park. It's the type of stadium my generation grew up visiting. With Busch soon going the way of the wrecking ball, RFK will be the last of a breed. Rather than make it obsolete, let's fix the flaws. Let's leave it as a reminder of a generation's youth. Let's save the taxpayers of the nations's capitol some hard earned cash. RFK is a place where the game is the event. It would be nice to keep that in at least one venue.
David Pinto is the owner and author of Baseball Musings. David has been involved in baseball research professionally since 1990 when he was the STATS, Inc. consultant to ESPN's Baseball Tonight. The Day by Day Database at his site is fast becoming one of the most popular research tools on the web.
[Additonal reader comments and retorts at Baseball Primer.]
| Designated Hitter | May 12, 2005 |
Brave Heart
I'm a fan of the Cardinals, hardwired to be so. My Dad grew up in Alabama back in the days when the closest thing the American South had to big league baseball was the far-flung broadcasts of KMOX out of St. Louis. So in some senses, he was predisposed to favoring the Cards. However, this was cemented during the '46 World Series when he and one of my uncles made an exceedingly modest bet on the outcome. My uncle took the Red Sox, and my Dad took the Cardinals. The Cards won, and Dad was hooked. The team has been an indelible part of my family ever since.
When I was growing up, each summer we'd make the 13-hour drive from South Mississippi to St. Louis to take in a handful of Cardinal games. My Mom, dutifully in attendance but with only a perfunctory interest in the game itself, would often do needlepoint in the stands. My first major league game was a Cards win over the Reds in 1980, and I was hooked. It would be a fine decade for Cardinal Nation. The radios in our house, for some reason, couldn't pick up KMOX. However, my Mom's Chrysler could, so my Dad and I, during games of critical mass, would often sit in that car parked in our driveway and listen to Jack Buck growl the action to us from afar. I remember listening to the a crucial road tilt with the Mets in late '87--the one in which Terry Pendleton's clutch bomb essentially felled the vile Amazin's for good that season. At that point in my life, I'd never been to New York, and it seemed to me and my provincial ignorances a veritable Sarajevo of potential hostilities. I worried for the physical safety of my team--that they won the game was gravy.
The Cardinals and their successes (and their occasional failures) pepper the memories of my youth. I now live in Chicago, far, in the geographical sense, from my home and my family back in Mississippi. That's served only to buttress my febrile love for the Cardinals and the sense of complicated pride I feel in being a native of the South. But this column isn't about the Cardinals or the South.
For a long time, I viewed the Atlanta Braves as traitorous interlopers. They weren't the South's team; the Cardinals were. The Cardinals had spent years cultivating the market, and then the Braves came along and undermined all of it. You'll find a great many people of my Dad's vintage in the South who are Cards fans, but most of a younger stripe favor the Braves. This bothered me for many years. I regarded them to be a whimsical spurning of history and tradition.
For many years, the only thing the Braves could otherwise do to raise my anger was occasionally preempt "Night Tracks" on WTBS during that fleeting and regrettable time in my life when the novelty of the music video held sway over televised baseball. (I shudder at the memory.) They weren't really considerable opponents back in the days when Rick Mahler, Rafael Ramirez and Bruce Benedict roamed the land. All that, of course, changed.
By the time the '90s rolled around, the Braves--thanks to the impossibly heady triumvirate of John Schuerholz, Bobby Cox and Leo Mazzone--began a run of dominance not seen since the Yankees were brawling at the Copa. That all this was coincided with a rather bereft decade in terms of Cardinal achievements made it sting even more. So I cultivated a hatred for the Braves that went far beyond whatever animus you might feel for intruders of glancing consequence. They were now the force nonpareil in the NL, and a deep adoration for the team pollinated the South. Grrr.
A very vocal majority of my college friends were Braves fans, and this led to countless arguments among us. I would rail against the frat boy smugness of Chipper Jones, moan to the heavens about the leviathan of a strike zone that Greg Maddux and Tom Glavine alone seemed to enjoy and harrumph about the prevailing whiff of evil surrounding Ted Turner. And all the while the Braves kept racking up division title upon division title. This decidedly one-sided rivalry reached a particularly grisly nadir in the 1996 NLCS, when the Braves, down three games to one, performed hate crimes upon my Cardinals, outscoring them 32-1 in the final three games to take the series. I recall, in the instant after Glavine's bases-clearing triple in the early innings of Game Seven, hurling my remote control through an open window. The indignity was such that I was forced into exile for many weeks.
I'm older now, and, if not mature (I'm not), I'm less prone to abject homerism and, as such, able to appreciate the amazing bestowals of the once-maligned Braves. Somewhere along the way, my feelings toward the Braves scooted along the continuum from red-faced hatred to grudging respect to subtle admiration to, finally, the point I'm at today--I like the Atlanta Braves. I've probably watched a thousand Braves telecasts in my life, and I've come to regard the arid wit of Skip Caray as a sort of comfort food for me ears. His voice, which I don't hear enough these days, takes me back, as they say. Mostly, though, I admire how the organization has evolved and thrived under an array of economic conditions and with generations of different players. I'm proud of them. They'll most assuredly never displace the Cardinals in my heart and mind, but the Braves now have ineffable honor of being, dare I say it, my second-favorite team. It feels good to say it.
In my professional capacity, the Braves have made a mouth-breathing fool of me over the past several years. I've picked against them season after season only to be proved wrong, season after season. My predictions of their demise weren't borne of dislike or wishful thinking; rather, I just couldn't see how they'd keep up in spite of all the roster upheaval. As I look over the standings right now, I see the Braves are once again in first place in the East and once again toting around the best record in the NL. Again, I'm confounded. We're toe deep in what may be the most amazing Braves season since the '91 campaign that started it all. And, like those paid actors at McDonald's with little regard for their cardiovascular health, I'm lovin' it. Should they encounter my Redbirds in the post-season, I'll root like all hell against the Braves, but should their paths fork away from one another, I'll have no reservations in rooting like all hell for the Braves.
So, Atlanta Braves, you amaze me game after game. I enjoy your company, I respect your accomplishments, I like you, and I even root for you. Most of the time. Oh, and I'm sorry for all those mean things I said about you.
Dayn Perry is an author at FOXSports.com and Baseball Prospectus.
[Additional reader comments and retorts at Baseball Primer.]
| Designated Hitter | May 05, 2005 |
Watching Dave Hansen: Living Vicariously Through the Career of a Pinch-Hitter
Dave Hansen, number five all-time in pinch-hits, was called up to the Seattle Mariners yesterday, extending a 15-year Major League career that seemed on the verge of winding down after the Chicago Cubs cut him at the end of spring training. From the Associated Press account:
"This is really exciting. I thought I bonded really well last year with these guys," Hansen said in between a stream of hugs and handshakes with teammates. "I hoped I would be able to come back."This news brings me great cheer, for many reasons. Hansen, like me, was born in 1968 and raised in Long Beach, California, so every day he spends in the bigs provides me with at least some small sliver of evidence that I am still young enough to be of playing age. Put me in coach, I'm ready to play!
It's also inspiring to see a hard-luck story -- and behind every great pinch-hitter there's a hard-luck story -- squeeze a few last jackpots out of a bum deal.
But most of all I'm thrilled because I know Hansen to be a genuinely good, generous, and humble guy who deserves success more than most ballplayers you'll ever meet. I know this because I played with him growing up. And not just on the diamond, but in a rock band. In fact, he announced his signing with the Dodgers (who drafted him with the 47th pick in 1986) on stage, at the St. Maria Goretti carnival, where our cover band, The Ladds, was playing the second of two triumphant shows. It was definitely one of the best days in either of our lives up to that point. And it was one of the last times I ever talked to him.
IN THE LBC
I knew about Dave Hansen years before I actually met him. In Long Beach and Lakewood, where we grew up, the baseball tradition is so thick and all-encompassing that adults and kids alike spread excited or envious rumors about 10-year-old stars from rival Little Leagues and faraway elementary schools.
It helped that most Little Leagues within several square miles played in Heartwell Park, a lush, rectangular 122-acre spread stretching nearly two miles long. You could always ride your bike or skateboard up a few blocks to check out the rival talent you knew you'd be squaring off against come puberty. When I was an 11-year-old 6th grader at Mark Twain Elementary and an all-star for Lakewood Village Little League, I heard awestruck tales of three regional studs-in-the-making: Ralph Lakin, Troy Hamill, and Dave Hansen.
It does Dave no disservice to say he was easily the worst of the three. Lakin, by the time he was a sophomore in high school, was a square-shouldered mustache-boy who could drive the ball 400 feet from both sides of the plate and throw fastballs in at least the high 80s. Hamill was a mid-sized shortstop and surfer dude with astonishingly powerful wrists; think of Spicoli as Soriano. Hansen was a classic quarterback/shortstop type -- about six foot, 185; slightly slower afoot than the other two, strong and accurate arm but not a rocket, and a more patient approach at the plate. He was good enough at football to be one of the best high school quarterbacks in Southern California, but he didn't seem to drink from the same magic waters as Lakin and Troy-boy.
Here's a hint about how crazy our youth baseball competition was -- when I was playing in the Heartwell Pony League (ages 13 and 14), our 13-year-old team came second in the league, losing two out of three in the playoffs against the long-dominant Cobras. The Cobras' infield included not only Hansen, but future nine-year major leaguer Brian Hunter, and 13-year-minor leaguer Brian Grebeck, the younger and almost-as-good brother of 12-year major league veteran Craig. The Grebecks were the classical type churned out by my alma mater Lakewood High School -- undersized, overachieving middle infielders who lived and breathed the game of baseball, taking nourishment from the likes of such local Dodger retirees as Eddie Roebuck, Jim Lefebvre, and Norm Larker.
All this heavily nurtured talent was funneled into the Lakewood High School baseball program, and its legendary ear-splitting coach John Herbold, who would go on to run Cal State L.A.'s baseball program for two decades. Herbold managed to dominate a five-team Moore League whose other schools produced such talent as, oh, Tony Gwynn, Jeff Burroughs and Bobby Grich. Yet Herbold's Hustlers, as the name on our T-shirts from eight-year-old camp proudly boasted, would beat these marvelous athletes year in and year out based on a marinated knowledge of the game, "working it" day after day, and playing baseball like it oughtta be played.
It's hard to be an over-achieving Hustler when everything about the game comes easy to you and the surrounding sports-mad culture showers you with praise while excusing your excesses. This is what happened to Lakin and Hamill and a few other happy-go-lucky God-like talents in Lakewood and Long Beach. But Hansen always approached the game as if he was studying for a particularly difficult chemistry final, face screwed into intense concentration at the plate, footwork and angles at shortstop as methodical as David Eckstein's.
Unfortunately for Hansen (and me, and a lot of other people), Herbold abruptly left Lakewood the same year we were supposed to arrive, replaced by a coach who preferred weightlifting football players to runty, tobacco-dipping year-round baseball fanatics. Dave's parents had moved to Rowland Heights, about a half hour away, but if Herbold would have stayed he would have used his uncle's Lakewood house as a residence, and the school would have almost certainly won some CIF championships during my tenure. Instead, he dominated the weaker local competition around Rowland, hitting .432 with 11 homers and 29 walks in just 44 at bats during the regular season of his senior year.
By then, we had become pals. He remained friendly with the Lakewood players he left behind, especially our lightning-quick second basemen Wayne Tennis (who turned the pivot faster than I've ever seen a teenager, keeping Damion Easley rooted firmly on the bench). Hannie was a Grade-A, 100% surfer -- crazy Bermudas, sandals and vans, and a lingo-rich vocabulary you had to hear to believe. We'd almost want to drop coins in the guy, just to hear him talk; never has the word "kook" sounded so funny.
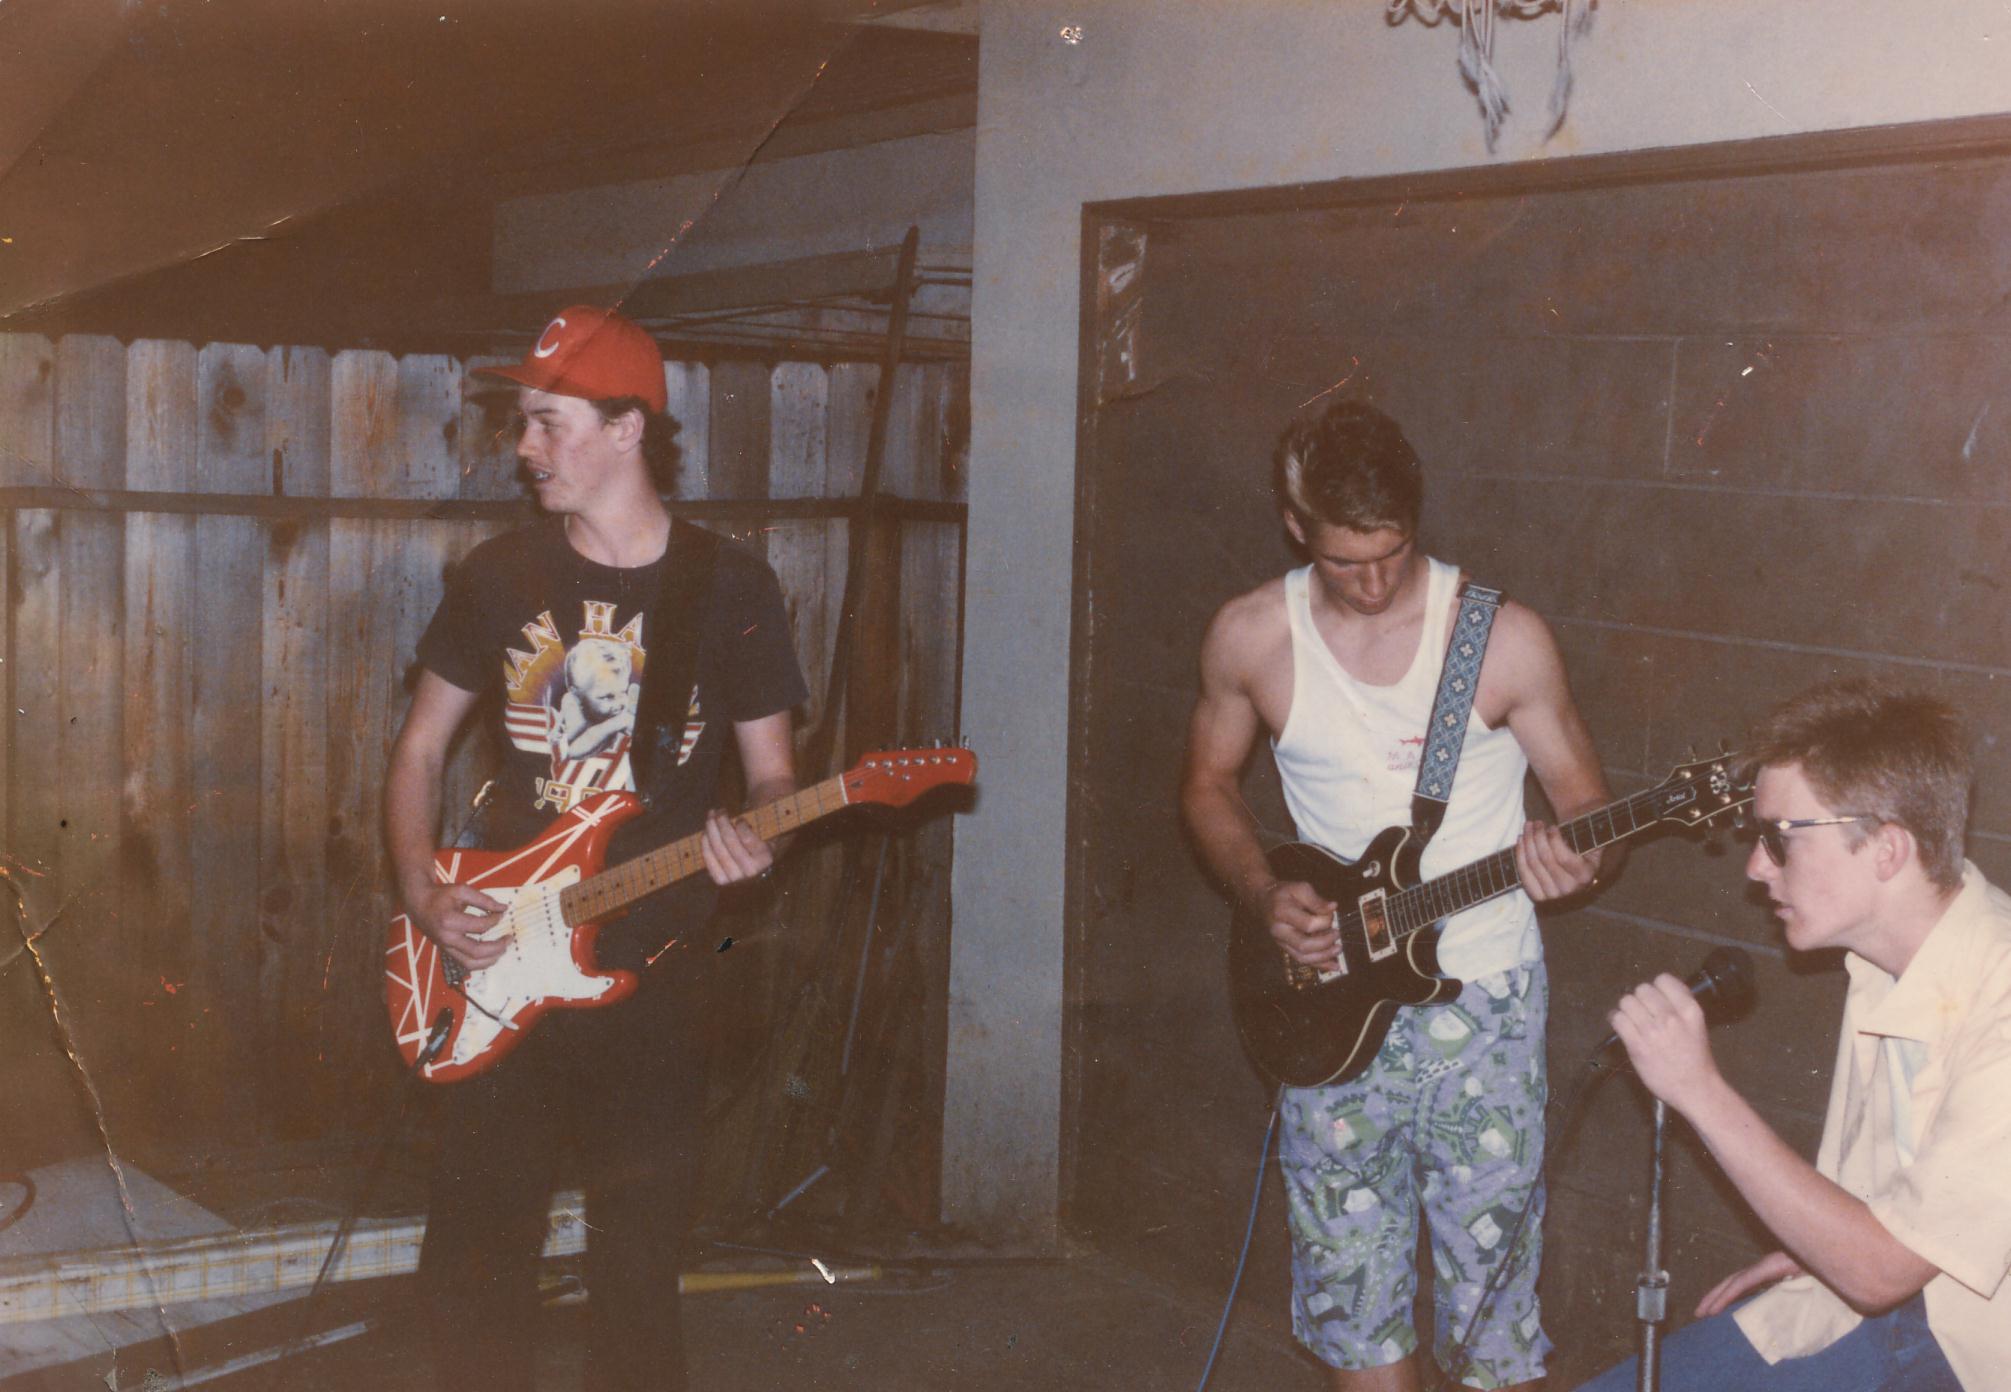
I don't know how it all got started, but some time in the last six months of our senior years, we began hanging out at his uncle's house after school, bashing on some of the instruments lying around from his uncle's days in a surf/garage band way back when. Dave was a terrific guitar player, especially good on Ventures instrumentals like "Walk Don't Run," and early Beatles tunes. He'd screw around with a song like "You Can't Do That," I'd try my worst to sing like John Lennon; his cousin Tony would chip in on an axe decorated like Eddie Van Halen's, the heavy-metal troll who lived next door would play Judas Priest licks, and my childhood pal Dave Rima would beat the skins. Before you knew it, The Ladds were born, and started performing at junior high dances and the like.
You learn specific, intimate things about people when you play in a band with them. With Hansen, two things stick out in my memory -- his humble and respectful behavior toward his kin (extraordinary for any 17-year-old, let alone a doted-on two-sport athlete), and his submersion of ego in the cause of a Greater Good (specifically, a well-performed song). He was funny and handsome, and could certainly be the life of the party; yet I, who was none of those things, probably had the bigger ego.
We knew, after he'd been signed, that if there was anyone who wouldn't squander a $90,000 bonus, and the opportunity to play for his favorite team, it would be Hansen. High school ended 10 days later, and we started to scatter our various ways, but from that point on, all of us who had ever harbored dreams of a big league career lived vicariously through Dave.
THE MAKINGS OF A PINCH-HITTER
Dave Hansen shot up through the minor leagues, establishing himself as a Dave Magadan-type third baseman -- high average with walks, and gap power. He hit .299/.384/.377 in rookie ball as a 17-year-old; .262/.332/.338 the following year in the California League, .291/.361/.410 at Vero Beach (A-ball) in 1988. Then in 1989 he became the first Dodger in four years to go from A-ball to the big leagues in one season, even if it was a rather extreme cup of coffee -- Franklin Stubbs got hurt, so the Dodgers flew Hansen seven hours from San Antonio to Montreal, where he sat against the lefty Mark Langston, and then sent him back down 36 hours later when Mickey Hatcher came off the disabled list. His quote in the L.A. Times was classic; we all passed it around:
"I was in my hotel room today and I'm thinking, I don't know what I'm doing here," said Hansen, who was on the 28th floor. "This is a big skyscraper and I'm on top of it. It didn't all sink in until I came to the park and put on the uniform."Back then, Hansen was clearly the Dodgers' third baseman of the future. The L.A. Times ran a story on July 28, 1990 about the "New Dream Infield" that would finally erase the memory of Garvey, Lopes, Russell and Cey -- Karros, Vizcaino, Offerman, and Hansen. Dave was only 21, he'd won the Most Valuable Player award in the Dominican Winter League playing under Kevin Kennedy, was in the midst of an all-star season leading the Triple-A Albuquerque Dukes to the league championship, and the Dodgers were using place-holder third basemen like Jeff "career high OBP: .286" Hamilton ... what could possibly go wrong?
Three things: An early leg injury, Tommy Lasorda, and one mediocre season.
The injury is in my memory, though I couldn't find any evidence of it while researching, so I may be mistaken ... but I have the distinct recollection that Hansen hurt his leg somehow, and lost his not-insignificant speed, some time before his 22nd birthday. He stole 31 bases and hit 19 triples in the minors over 2,718 at bats; but just 4 SBs and 6 3Bs in 1718 ABs in the bigs. No doubt his defense suffered as well.
But the more important roadblock was Tommy Lasorda, who was one of the worst managers in Major League history when it came to dealing with the third base bag. After Ron Cey left in 1982, the Dodgers starting third basemen the next six years were, in order: Outfielder Pedro Guerrero, someone named German Rivera, career .318 slugger Dave Anderson, 35-year-old Bill Madlock, Mickey freakin' Hatcher, and Jeff Hamilton. If there was an outfielder who'd proven he couldn't handle ground balls (Cory Snyder, Candy Maldonado), or a banjo-hitting infielder lying around (Enos Cabell, Bob Bailor), Tommy'd throw 'em out there. Even Eddie Murray had to play three games at the hot corner under Lasorda.
In 1991, Hansen was 22, coming off a .316/.425/.437 year at Albuquerque. The Dodgers finished five games out of first place the year before, featuring a makeshift injury-replacement platoon of 28-year-old second basemen Mike Sharperson and (ironically enough) a 25-year-old Lenny Harris, who would go on to set the all-time record for pinch hits. Both Harris and Sharperson had career years in 1990, and could have made an effective platoon at second base (where a 30-year-old Juan Samuel was stinking up the joint), but Lasorda elected to try Jeff Hamilton one last time, and sent Hansen down for further seasoning. After Hamilton broke down, Harris and Sharperson resumed their platoon, but with less success.
Soon, in a season marked by injuries, the Dodgers began using Hansen like a yo-yo, coming up to the big club to pinch-hit whenever another starter would go down. It was a curious role for the third baseman of the future, but Lasorda was always a curious manager. Here's a funny quote from the July 13, 1991 L.A. Times:
"I'm getting pretty good at this," said Hansen, who is in his second stint with the Dodgers this season. "The first time I got called up in '89, I brought four bags. Now I brought just one. Plus, of course, my guitar."Here's another ironic one, from a week later:
Dave Hansen, who joined the team from triple-A Albuquerque to fill the roster spot vacated by the injured Darryl Strawberry, said he is prepared for the unfamiliar role of a pinch-hitter. "I've never really done it before, but heck, all it is is hitting, right?" he said. "And I love to hit."That very day -- July 20, 1991 -- Hansen hit his first big league home run, a pinch-hit three-run job that helped lift the Dodgers to a comeback win over the Mets. I learned about this happy news several thousand miles away in Prague, Czechoslovakia, when I received a faxed copy of a Long Beach Independent Press-Telegram article, sent by my friend Shannon (who, ironically, I'd met at that St. Maria Goretti show). Later, in 2000, Hansen would set the all-time record for pinch-hit home runs in a season, with seven.
After going .268/.293/.393 in 53 mostly pinch-hitting at-bats as a 22-year-old rookie, Hansen was finally ready for a starting role in 1992. Unfortunately, he tanked, hitting .214/.286/.299 in 132 games, as the Dodgers plummeted from 93-69 to 63-99. (It also didn't help him that the National League that year averaged a paltry 3.88 runs a game, its lowest total since 1968, making most offensive stats look far worse than they actually were, especially in pitcher-friendly Dodger stadium.) Regardless, that was basically the last chance at a starting job Hansen ever got -- the team's third baseman of the future in 1993 was 35-year-old Tim Wallach, who responded with a stirring line of .222/.271/.342, and yet kept his job in '94 and '95 as well.
Meanwhile, Hansen developed into a deadly pinch-hitter, spending Wallach's tenure by hitting a robust .318/.414/.412 over 330 at bats. After getting 341 ABs at age 23, he has never topped 181 in a season since, except for when he played in the Japanese league in 1998. He could have been a Dave Magadan, or even (with some luck) just like young Sean Burroughs is now. And, Lord knows, he could have easily turned into a bitter man.
Yet when you hear him interviewed on the radio, or see his quotes in a newspaper, or listen to people like Vin Scully wax poetic about the guy, you realize he took the exact opposite approach. As he told Sports Illustrated five years ago, "I choose to like it instead of bitching about it." He's the guy who will tell you that he's "blessed," that it's just great to be a grown man paid to play a boy's game, and that there's no point in losing perspective.
Some people make it, some people don't, and some people make it in ways they never expected. Hansen was a hard-working nice guy when he was 13 years old, and remains so now, which is a key reason why he's still playing professional ball and climbing up the pinch-hit list while the rest of his old pals thicken around the middle and complain of back pain. We still have many mutual friends (he has never, to my knowledge, put on any airs when hanging with the boys from the neighborhood), and keeping track of his exploits has long become a currency we all trade when catching up on old times. I hope he lasts long enough to pass Manny Mota and even old Lenny Harris himself, and I would dearly love to see him get a ring, but when he finally hangs up those spikes what I really look forward to is busting out the old guitars.
Matt Welch (mail-at-mattwelch.com) is Associate Editor of Reason magazine, where he contributes to the Hit & Run weblog. His work is archived at mattwelch.com, where he also blogs.
[Additional reader comments and retorts at Baseball Primer.]
| Designated Hitter | April 28, 2005 |
Jack McKeon: A Storied Career
Marlins manager Jack McKeon has taken some heat lately from a few "experts" for letting his pitchers throw complete games early in the season.
I've known Jack since 1988 and I can tell you one thing: He couldn't care less what the experts think as long as his team is winning. When you consider the basis of his baseball philosophy, you'll understand what makes McKeon so different than most of today's "feel good" managers in the age of "The Athlete Knows Best."
McKeon and I collaborated on his new book: I'm Just Getting Started this past year. We spent a lot of time together and the former catcher was able to detail how he became the manager he is today at the age of 74, the oldest manager to ever win a World Series.
One of his strongest beliefs is that a young pitcher must pitch extended innings to build up a strong arm. He does not like the way many of today's pitchers are "babied" by management. He believes in a different kind of Moneyball.
"Moneyball is basically computer stats," Jack says. "I think my style is more observation and going with your gut.
"I never learned my baseball out of a book. I learned it by doing it and watching the best in the game do it. I go all the way back to Branch Rickey."
Now that is going back, but McKeon is not just some oldtimer afraid to change his ways. He will change, if he feels it's for the better.
"Some of the stuff in Moneyball has some merit," McKeon says. "There's no question about it, but you can't just go by numbers. How far back do the numbers go? Has the player changed? It doesn't take into consideration the mental approach the player has that day.
"What if his kid's in the hospital, maybe he is not focused as he normally is because of that," McKeon notes. "Something like that changes the entire picture. You have to go with your gut as well as your stat sheet. When you see me sitting in the corner of the dugout, I'm using a computer all right, the computer in my head."
The image of McKeon sitting alone in that corner of the dugout has become a staple of Marlins' broadcasts. That isn't just Jack McKeon sitting there, that's 50 years of managerial experience sitting there. McKeon fell in love with some of the teaching tools that Rickey brought to the game.
"When he was trying to teach a guy to throw a curveball down low and just off the plate," McKeon says, "he would lay a $20 bill right there on the ground. He'd say, 'If you hit the $20 bill, you got it.'
"Now that's Moneyball. That got the pitchers focused. They were focused on what their job was to do -- hit that $20 bill," McKeon says. "They had to follow through and come down through their motion. It was a great incentive. It was not only a fun thing, it was a teaching tool. I've never forgotten that."
McKeon knows the same drill would work today with one minor change. "You'd have to use a $100 bill," he says.
There were other Branch Rickey pitching drills that McKeon loved. "Rickey was one of the first guys to put up strings for the strike zone as a teaching tool, which I copied and used to teach Jim Kaat when I had him in the minors," McKeon says in the book. "Rickey would get two poles and put strings across them and he would make it the size of the strike zone. He would have the guys hit the inside corner, the outside corner, up and down, all around the plate. It was a great way to teach location. Rickey didn't know it at the time, but he developed the first K Zone."
As for Kaat, McKeon, who has a story on everyone, has one for the lefty, who is now a broadcaster with the Yankees. The so-called experts might want to listen closely.
"Jim Kaat was the first player that I was around on an everyday basis who you could tell was going to be a star," McKeon explains. "When I met him he was just an 18-year-old kid in Missoula, Montana. He pitched 251 innings that season. It was only a 17-man roster and we only had seven pitchers on the team. That would never happen today, the way young pitchers are babied."
If a minor league manager allowed a young pitcher to throw 251 innings in this day and age, he'd be fired, but McKeon saw something in Kaat that was special. He saw how Kaat knew how to work a batter and change velocity on his off-speed pitches, something many of today's pitchers never grasp.
"Jim was one of the most fascinating young men that I've ever managed," McKeon says. "This guy had tremendous instincts, excellent knowledge of pitching, tremendous work habits and tremendous focus.
"You had to understand this young man," McKeon explains. "In today's game, if you used a radar gun you wouldn't sign him, but he had great knowledge of pitching. He could paint the black on the inside. He could paint the black on the outside. He changed speeds. For an 18-year-old kid he had tremendous knowledge of pitching.
"Here, I'm his catcher, I'm a player-manager, and I see that this guy can pitch in the big leagues. He knows how to pitch. He knows how to win."
McKeon also gave his young players an opportunity to work out of jams, something that would help them later on in their careers.
Recalls Kaat, "I remember Jack coming out to the mound and saying, 'Well you got into this mess, let's see how you're going to get out of it.'"
By taking that approach, Kaat says, he learned how to pitch out of trouble.
Because of all of Kaat's ability, McKeon knew the young man was going to be a star, something no one else in the organization knew.
"Charlie Dressen was just let go as manager at Washington, he came out along with Calvin Griffith and Joe Haynes,'' McKeon says of the late-season scouting trip of 1958. "Calvin was the president and Joe Haynes was the vice president and pitched a number of years in the big leagues and was considered a pitching guru in the organization. Now, a lot of clubs have gurus. Maybe someday I'll even become a guru. Anyway, the three of them come out to Missoula one night to see our team play.
"Kaat was pitching and he pitched a two-hit shutout and I think we won 2-0, and after the game we went out to have a bite to eat. I sat down with those guys and said to Joe Haynes: 'What did you think of Kaat?'
"He said, 'Not enough stuff to pitch in the big leagues.'
"I said, 'I tell you what, I'll make you a bet. I'll bet you a steak dinner that within two years he pitches in the big leagues.'
"When I believe in somebody," McKeon adds, "I put my faith in them."
McKeon has a lot of faith, considering he goes to Mass every day.
"That's what I did in Game 6 of the World Series with Josh Beckett," McKeon says. "I wasn't going to give that game away. I knew Josh could win it. And he did."
Joe Haynes took the bait and the bet.
A year later Kaat started the season at Chattanooga. "On July 1st he was leading the league in strikeouts and he was having a great year down there so they bring him to the big leagues," McKeon recalls. "He pitches his first game in Chicago on, I think, July the 3rd.
"I got on the phone to Joe Haynes and said, 'Hey, where's my steak?'"
Turns out that Kaat, the pitcher with "not enough stuff to pitch in the big leagues" pitched 25 years in the big leagues.
"I don't think I ever got that steak dinner but I was just happy that Kitty got to the big leagues and there he was 25 years later with 283 victories," McKeon says proudly, taking a victory puff of his ever-present (except for nine innings) Padron Cigar.
Not only did Kaat go on to win those 283 games, he completed 180 of of his 625 starts (or nearly 30%). Imagine that.
Kevin Kernan is a columnist with the New York Post. He has covered sports for 28 years and during that time has not once smoked a cigar. I'm Just Getting Started is published by Triumph Books.
[Additional reader comments and retorts at Baseball Primer.]
| Designated Hitter | April 21, 2005 |
On the Road With the Dodgers
It was 1965. Major League Baseball's National and American Leagues were still settling into the new 10-team configurations brought on by the first expansion era of the early decade; the first U.S. combat troops were arriving in Vietnam; Timothy Leary was tripping on LSD; and I took a trip of a lifetime.
Being the son of George Lederer, L.A. Dodgers beat writer for the Long Beach Independent, Press-Telegram, has many advantages as brother Richard has so eloquently outlined in these spaces. Richard and I cut our baseball teeth on games at Los Angeles Memorial Coliseum in the Dodgers' early days in Los Angeles. The exciting move to the new Dodger Stadium in Chavez Ravine in 1962 included some visits for us during construction. Together, from 1962 to 1968, we attended virtually every Sunday afternoon game and many others, sitting in the front row of the Loge level past third base, then hounding for autographs for an hour or more after the games waiting for Dad to file his story.
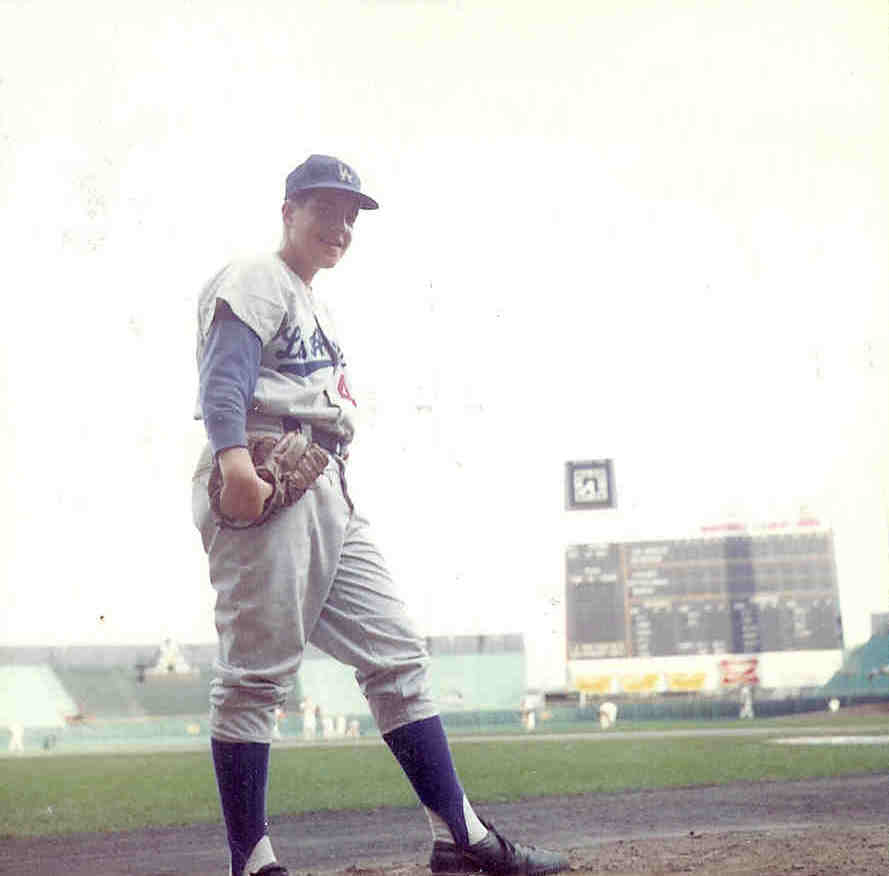 I had the tremendous fortune to join the Dodgers' official travel party on a complete 10-game road trip during the summer of 1965. For a 13-year-old aspiring pitcher, it was a wide-eyed experience to be treasured for a lifetime.
The Walter O'Malley Dodgers were the envy of baseball, traveling on their team-owned jetliner -- the "Kay O," named for O'Malley's wife, Kay. I accompanied Dad and the team on the plane, on the team bus rides, in the press box at each game, and even an occasion in the dugout and on the field during batting practice. Dad snuck in a couple of side excursions for me, as if he was afraid I may get bored.
Think about it. These were the Los Angeles Dodgers! Two years removed from their 1963 World Championship. Sandy Koufax, Don Drysdale, Maury Wills, and . . . well, OK, it was the pitching-dominated 1960's. Ron Fairly was the team's most productive hitter with an OPS of .768 (Rookie of the Year Jim Lefebvre and Lou Johnson led the team with 12 HR). But they were in first place in the National League en route to a pennant and another World Series win. And I was 13 years old! They were all superstars.
My recollection of the whole event begins with a quiet warning from Dad that he was waiving his parental discretion with the hope that I could ignore the profane banter that I was going to be subjected to round the clock. Heck, I don't even remember any remarks making an impression on me. I was 13, you know.
The stark contrast of 1965 to today is illustrated in so many ways. The Dodgers closed out a home stand at Dodger Stadium on Wednesday night, flew to Albuquerque on Thursday afternoon for an exhibition game against their Texas League AA affiliate on their way to a 10-game road trip beginning in St. Louis on Friday night, July 30.
With the help of a letter I wrote to home that has been thankfully archived in a scrapbook, a few details are available beyond the scant few that my memory has preserved. I wrote that 200 people, a red carpet and brass band greeted the team at the Albuquerque airport and a motorcycle cop-escorted motorcade paraded the team to the stadium for an evening game.
At the risk of unduly removing the luster from the story, I must admit one of my most vivid memories of the trip was the national anthem before that game. Due to tight seating arrangements for the big city press visiting the AA ballpark, I sat in a box seat behind the dugout with the Dodgers traveling secretary, Lee Scott, and the parents and daughter of Dodgers catcher John Roseboro. The unfortunate attempt by a soloist performing the Star Spangled Banner left Mr. Roseboro doubled over and many of the players on the field in obvious contortions trying to restrain their laughter.
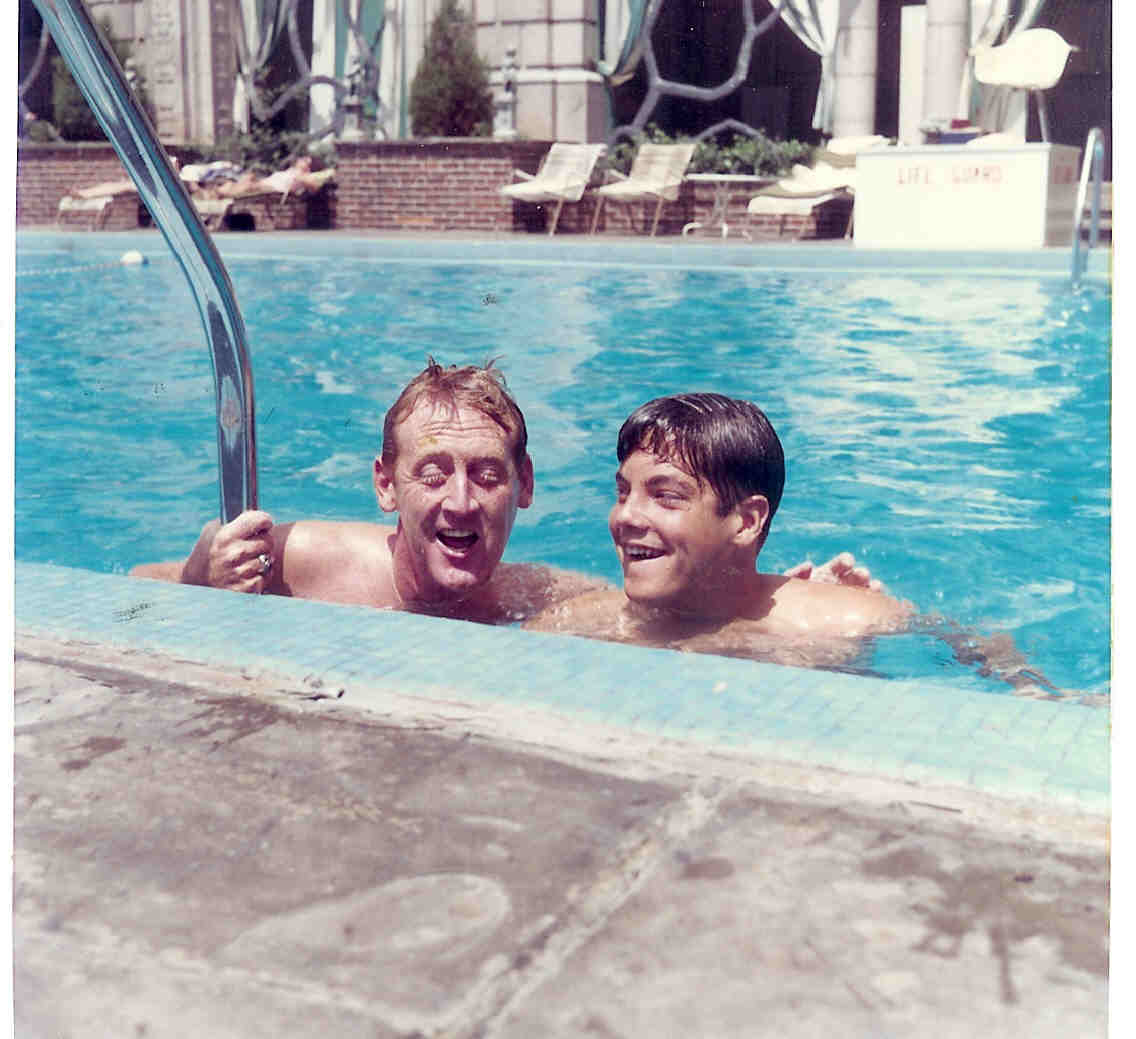 The game lasted until 10:30 p.m., the team plane took off at midnight and by the time we hit our room in St. Louis, it was 5 a.m. Friday with a game to be played that night -- most likely a then-typical 8 p.m. start time -- to open the four-game series against the Cardinals, the defending World Series champions. We slept past noon, then had breakfast with Wally Moon. The weekend-through-Monday stay in St. Louis included a visit to the zoo and a dip in the pool with Dodgers announcer Vin Scully. The press box in the old Busch Stadium (once known as Sportsman's Park) was Dad's least favorite in the league because its configuration created a particularly frightening view considering his fear of heights.
The Dodgers and Cardinals split the four games and the team was off to Milwaukee for a three-game set with the third-place Braves. It was to be the Braves' final season in County Stadium before the move to Atlanta. Tuesday's game was rained out in the first inning and made up as part of Wednesday's "twi-night doubleheader" as Dad described in his article. Perhaps the most exhilarating experience was the opportunity to don a Dodger uniform and spend some time in the dugout and a brief game of catch on the sidelines during pre-game warm-ups. (Three years later, I had the thrill of pitching batting practice to Dodger pitchers during the early batting rounds before a game at Dodger Stadium.)
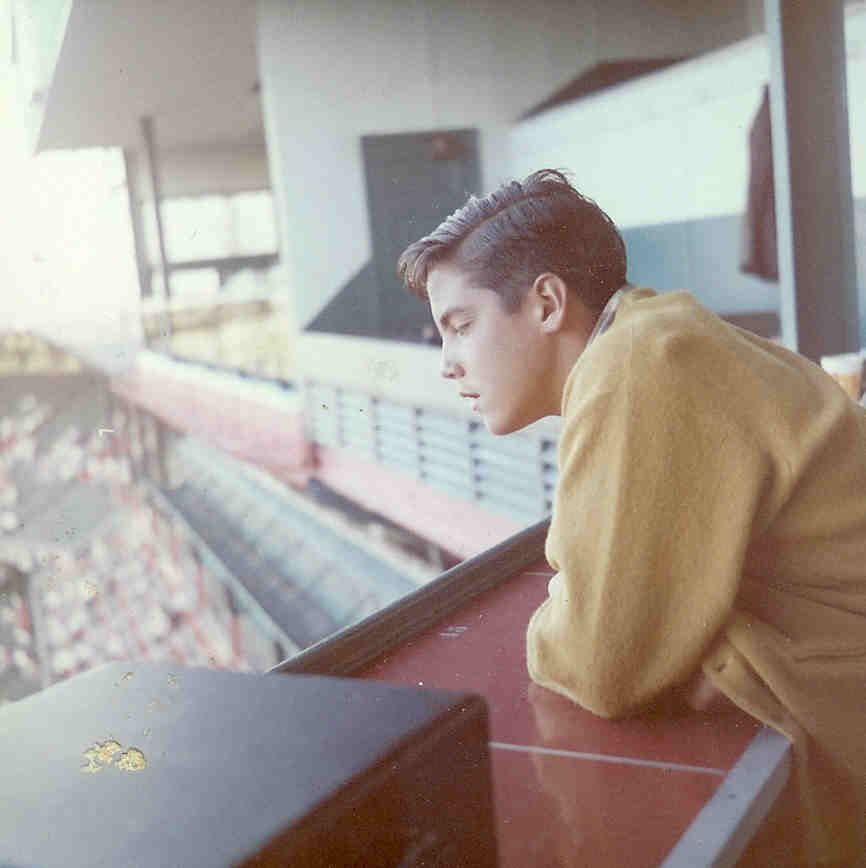 The teams split that doubleheader and the Dodgers took the series with a win in Thursday's finale behind Sandy Koufax's second complete game of the trip, his 12 strikeouts giving him 23 for the two starts on the trip. It was a magical season for Koufax on the way to his second of three Cy Young Awards. In 41 starts, he had 26 complete games and a 26-8 record. Oh, and he mixed in a couple of relief appearances that would have produced saves had they been an official stat at that time. He had an ERA of 2.04 and chalked up 382 strikeouts, breaking Rube Waddell's 61-year-old major league record. Did I mention a contrast between 1965 and today?
The final leg of the trip was a weekend in Cincinnati for three games against the second-place Reds in Crosley Field. The stay in Cincinnati provided the opportunity for the second excursion of the trip, an afternoon at River Downs racetrack with the other member of the Dodger broadcast team, Jerry Doggett. The trip ended on a bad note with an injury to Don Drysdale during an 18-0 drubbing by the Reds in the final game.
Along the way, the experience was awe-inspiring. Most notable of all was the dream like experience of being asked for autographs. It happened on a few occasions while traveling with the team. You see, I was within a few months of reaching six feet and 200 pounds. Maury Wills told me he thought I was a college student and Carroll Beringer asked me how many years of high school I had left. I took great joy in telling them, "I'm only 13!"
What a trip!
Tom Lederer manages sports and aquatics programs for the City of Lakewood, California, selected the number one Sportstown in California by Sports Illustrated.
| Designated Hitter | April 14, 2005 |
Slip Sliding Away
Every once in a while, I will pick a date in baseball history and take what happened on that date, and then play a game that I like to call "Slider."
I call it "Slider" for two reasons. First, because the object of the game is to "slide" from something on that date in baseball history to another baseball-related item, and keep the stream going for as long as you can manage. Secondly, I call it "Slider" because, as a batter, when you see a pitched baseball with a red "dot" on it, it's a "Slider." And, since what you aim to do in this exercise is to connect the dots, "Slider" just seemed to be a good name for this game.
For this episode of "Slider," I am going to start with October 16, 1962. This was the day that Game Seven of the 1962 World Series (between the New York Yankees and San Francisco Giants) was played at Candlestick Park in San Francisco.
Ordinarily, the winner-take-all game in a World Series is exciting enough as a standalone entity. However, there are some very interesting storylines associated to this particular game that make this one standout (to me) more than most other notable Series games. And, the majority of these storylines involve New York Yankees pitcher Ralph Terry.
Exactly two years and three days earlier, Ralph Terry was called into the 8th inning of Game Seven of the 1960 World Series (between the New York Yankees and Pittsburgh Pirates) to close out that frame. At that moment, it appeared as if Terry's effort in the 8th would be his final work for the 1960 season. The Yankees were losing the game by a score of nine to seven and were down to their final three outs. However, New York rallied for two runs in their half of the 9th and tied the game at nine. This gave Terry a chance to continue in the game. Unfortunately for Ralph, the first batter that he faced in that next inning was Bill Mazeroski and he hit a walk-off homerun to win the Series for the Pirates.
So, now, here is Ralph Terry in another Game Seven in 1962 with a chance for some World Series legacy redemption. However, just the fact that Terry was on the mound for this game required some divine intervention.
Ralph had pitched Game Two of the Series and then came back on normal (four days) rest to pitch Game Five. Terry won that Game Five with a complete game. The next two starting pitchers for New York after Game Five should have been a gimpy Bill Stafford or someone else (for Game Six) and then Whitey Ford (for Game Seven), if necessary. However, Hurricane Frieda hit the West Coast and brought cause for Game Five of the Series to be pushed back for three days. This delay enabled the Yankees to start Ford in Game Six and have Terry come back to throw Game Seven.
And, what a Game Seven it was for Ralph Terry. He had a Perfect Game going into the 6th inning which was broken up with two out in that frame when Jack Sanford (a pitcher!) of the Giants singled to right-center. Terry would go on to hold the Giants to two hits and no runs over the first eight innings. And, these innings were tight for Terry -- as the best the Yankees could do was scratch out one run in the 5th inning of the game.
This all led to the 9th inning of this game. Terry was still on the hill for New York and clinging to that one-nothing lead. Matty Alou led off the 9th for the Giants with a pinch-hit drag bunt single. However, Ralph rebounded to whiff the next two batters that he faced. Now, one out away from the win and the championship, Terry had to face Willie Mays.
Coming inside to Mays with his first two pitches, Ralph fell behind in the count. Next, Terry fired a fastball, low and away, that Mays managed to line into the right field corner for a double that would have tied the score (99 times out of 100) except the Yankees Roger Maris made a great play getting to the ball and holding Matty Alou to third base. Next up for the Giants was Willie McCovey (with the tying run now on third and the winning run on second). Yankees manager Ralph Houk elected to leave Ralph Terry in the game and they chose to pitch to McCovey (despite the open base at first).
McCovey fouled off the first pitch from Terry. On the next offering, McCovey uncoiled and launched a rocket line-drive. After the game, Willie called it "the hardest ball I ever hit." Unfortunately for the Giants, McCovey hit the ball towards Yankees second baseman Bobby Richardson who snared it at shoulder height for the final out of the game and the championship. As a result of all this, Game Seven of the 1962 World Series was one of the most exciting baseball games in history. And, in honor of Ralph Terry's contribution to this moment in baseball history, we are going to use him as our first sliding point in this edition of "Sliders."
In 1964, the Yankees traded Ralph Terry to the Cleveland Indians. In exchange, New York received pitcher Pedro Ramos.
Ramos would pitch with the Yankees through 1966 and then began to bounce around a bit. During his last year in the majors (1970) he pitched in a handful of games for the Washington Senators.
Pedro actually broke into the big leagues with Washington in 1955. However, that was the Washington team that moved to Minnesota in 1961. In fact, Ramos pitched the final Senators game in 1960 before they moved to become the Twins. The Washington team that Ramos joined in 1970 was the Senators that would eventually move to Texas (in 1972) and become the Rangers.
Jeff Burroughs was also a member (albeit for a brief period of time) of those 1970 Washington Senators. Burroughs was the first overall selection in the 1969 baseball draft. He was followed in the draft by J.R. Richard (who was selected second overall by the Houston Astros).
On July 30, 1980, J.R. Richard suffered a stroke during a workout and his major league career essentially ended on that date. On that same day, the Minnesota Twins Jerry Koosman pitched a 10-inning complete game, three-hit, victory (by the score of two to one) over the New York Yankees.
The next season, Koosman was traded to the Chicago White Sox in exchange for three players and cash. One of the players was Randy Johnson. No, it was not THAT Randy Johnson -- it was a then 23-year-old Designated Hitter named Randy Johnson who never really amounted to much in the big leagues. But, THIS Randy Johnson was born on August 15, 1958 -- the same date that Joe Cowley was born.
Joe Cowley, as a member of the Chicago White Sox, would go on to pitch one of the ugliest no-hitters in baseball history on September 19, 1986 (against the California Angels) when he walked seven batters during the contest (in a 7-1 win). Bob Boone scored the lone run for the Angels in this game.
Bob Boone retired from active playing in 1990 as a member of the Kansas City Royals. Jeff Conine would make his major league debut that same season, also with the Royals. The Royals would allow Conine to be taken in the 1992 Expansion Draft by the Florida Marlins. As a member of the Marlins, Jeff Conine would be named the Most Valuable Player in the 1995 All-Star Game. Conine came into the game as a pinch-hitter and homered in his first ever All-Star At Bat. The pitcher who surrendered the hit was Steve Ontiveros of the Oakland A's.
In 1994, Steve Ontiveros led the American League in ERA without the benefit of pitching a shutout during the entire season. The next pitcher to lead his league in ERA without registering a shutout would be Pedro Martinez in 2002 (with the Boston Red Sox).
Through 2004, Pedro Martinez hit 115 batters with pitches during the regular season in his career.
This Pedro tidbit allows for many sliding directions from this point. This is probably a good time to let someone else do the sliding. Take it from here for me. Feel free to continue this one in the comments options below. Thanks for following along this far. I hope this edition of "Sliders" was fun for you.
Steve Lombardi has been writing baseball-related content on the Internet since 1997. His first baseball book will be available in May 2005. For more information on the book, feel free to drop Steve a line at books@netshrine.com
| Designated Hitter | April 07, 2005 |
Picturing Baseball
Since you're here reading the fine Baseball Analysts site, I assume you've read a lot of baseball articles already. Along the way, you've probably seen a lot of tables that look like this:
CLUB          W       L       RS      RA   Pyth Diff
STL          105      57     855     659       5
ATL           96      66     803     668       1
LAD           93      69     761     684       4
HOU           92      70     803     698       1
SFG           91      71     850     770       3
CHC           89      73     789     665      -5
SDP           87      75     768     705       0
PHI           86      76     840     781       0
FLO           83      79     718     700       0
CIN           76      86     750     907       9
PIT           72      89     680     744      -2
NYM           71      91     684     731      -5
COL           68      94     833     923      -5
MIL           67      94     634     757       0
MON           67      95     635     769       0
ARI           51     111     615     899      -3
This is a pretty important table, actually. It includes the wins and losses of all National League teams last year, plus their runs scored and allowed and their "pythagorean variance," which is the difference between the number of wins you'd expect from each team based on its runs scored and allowed, and its actual wins. Arguably, this table contains the most important, fundamental stats of the season for each team.
Let's say you're a Reds' fan. Because the list is sorted by number of wins, you can see that the Reds finished seventh from the bottom of the NL, with 76 victories. You can also see that they scored 750 runs, which is in the middle of the pack somewhere, but allowed 907 runs, which looks like the second-worst total. Finally, you see they actually outperformed their Pythagorean projection by nine games.
As I said, that's a lot of information, and it took a bit of work to pull these facts out of the table. And that was just one team -- imagine being a general baseball fan and wanting to understand the big picture; wanting to understand how all sixteen teams relate to each other. If you can imagine how frustrating that would be, then you grasp the essence of my pet peeve: the overwhelming terrible use of numbers in baseball writing. I'm not talking about the analysis of the numbers (though that often misses the mark, too). I'm talking about the way the numbers are displayed.
Specifically, I'm talking about articles in which the writer uses stats to make a point. Don't you think that the writer should present the stats in a way that highlights the point? And that doesn't force readers to cross their eyes and furrow their brows?
Yes, baseball stats are an integral part of the game. Yes, the MacMillan Baseball Encyclopedia was probably the best Christmas present I ever received. Yes, our understanding of the game is deepened and strengthened by the insightful use of baseball stats.
But that doesn't mean that every interesting baseball article has to include tables of stats. Just because it works for the Baseball Encyclopedia doesn't mean that it works for a magazine, newspaper or website. In fact, research has pretty conclusively shown that tables do a poor job of making a point. Readers don't take the time to read them and often don't understand them.
Okay, that's the first half of the rant. Now for the second half: too often, publications that do graphs do them completely wrong. Recently, Baseball America ran a graph of contract information that consisted of blue bars on a blue background, which inspired a rant at my website. But I shouldn't just pick on BA. USA Today, that popularizer of the pie chart and other specious graph designs, has probably done more to undermine the notion of good graph design than any publication in the history of publishing.
On the other hand, we have the New York Times, which in my opinion consistently shows a phenomenally insightful touch with their graphics. The Times, as you know, is supposed to be written for high-minded intellectuals who live in New York; USA Today is supposed to written for the average person who lives everywhere else. As a result, there is a perception that graphics are "devices for showing the obvious to the ignorant." No, no, no. Graphs can convey "complex information, as long as it's done with grace and clarity," in the words of Edward Tufte, the Godfather of Good Graph Design. Let me give you an example.
Here is a graph of runs scored and allowed by each team in the National League last year, adjusted by park factor. Teams that scored a lot of runs are on the right, while teams that gave up the least runs are at the top of the graph. Some folks object to this graph layout, because the "Runs Allowed" axis runs from high on the bottom to low on the top, instead of low to high. I've done that for a reason. Most people associate "up" and "right" with a good outcome, because larger numbers are usually good. So I ran the axis such that the best position is in the upper right hand part of the graph, and the worst position is in the lower left. I've also added dotted lines depicting the average number of runs per game, and added a couple of labels (good offense, bad defense, etc.) to help understand the graph. Finally, I've added the pythagorean variance to the team label, so that you can see how the team's actual won/loss record differed from its relative position on the graph.
The reason to graph this information is that runs scored and allowed are directly related to wins and losses, and the depiction of spatial relationships for each team lets you understand each team's strengths and weaknesses. Cincinnati was not only the worst defensive team in the league, it was WAY worse than every team other than Arizona. And St. Louis was clearly the best team in the league, as evidenced by its position in the upper right corner.
But the graph can be improved by substituting different lines -- ones that show the implied won/loss record of each team. Specifically, the three lines in the following graph now represent projected victory totals at three levels, with winning percentages of .400, .500 and .600. These lines allow you to group the teams by performance levels, regardless of whether they rely on pitching or hitting.
![runstwo[2].GIF](http://baseballanalysts.com/archives/runstwo[2].GIF)
Now you can see that Cincinnati and Montreal were both .400 teams, but one was built on offense and the other on defense (note the ironic use of "built"). St. Louis was the only team clearly over the .600 mark, while the Cubs and Braves were slightly under that line -- the Cubs were hurt by their Pythagorean difference. It's true that you don't have the exact number of wins, losses, runs scored or runs allowed on this graph, but why do you care? You can get that information from lots of other websites. This graph allows you to see the critical relationships in ways a table of numbers can't. Applying some of Tufte's criteria, this graph gives the viewer the greatest number of ideas in the shortest time with the least ink in the smallest space. That's a mouthful, but that's also the goal.
To paraphrase Edward Tufte one last time, the objective of graphical representations is to facilitate better reasoning about quantitative data. Good graphs allow the reader to focus on the substance of the data and determine the cause and effect relationships. Tables of numbers don't do this well at all, and neither do poorly designed graphs. But well-designed graphs can show the way.
I took up this cause two years ago, with the creation of the Baseball Graphs website. The good news is that lots of other folks are joining in. Here are some other recent examples of excellent baseball graphs:
* Historical Baseball Trends
* David Pinto's fielding graphs
* Andrew Drake's superb Major League Charts
* John Burnson's book The Graphical Pitcher
* Hardball Times division races
Since first rolling out the baseball graphs site, I've moved onto a lot of other projects at The Hardball Times, such as Win Shares, WPA and even writing weekly columns. But good graphical displays remain my top priority and my raison d'etre on the Web. The cause is gaining steam, but it still has far to go. I thank Bryan and Rich for the chance to get on my soapbox once again.
Studes is a writer at the Hardball Times, and also the manager of the Baseball Graphs website.
| Designated Hitter | March 31, 2005 |
Luck of the Drawl
In the summer of 1990, I was working on a project which required me to spend long stretches of time in Atlanta. That entire summer working with my native Georgian colleagues over lunches at the Varsity, I predicted that their Braves would be the team of the future, what with their great pitching prospects. But the local yokels only saw a team peopled by Andres Thomasi and Oddibe "Young" McDowells. It's odd given the spoiled, playoff-weary, "we don't even bother to chop until the second round of the playoffs" types the fans have become.
I remember one game I attended with eight thousand hearty souls in which Dale Murphy, Ron Gant, and Pittsburgh's Bobby Bonilla all homered twice. Barry Bonds went deep just once, the slacker. And the Pirates came back from a 13-7 deficit to score four in the top of the ninth, but came up short as pinch-hitter John Cangelosi led off and ended the inning with a strikeout (the other out being a rare K for Bonds). The scant few fans in the upper deck section in which I was seated went crazy and bonded in that impersonal yet connected way that sportsfans do.
However, despite the presence of youngsters Tom Glavine, John Smoltz, Steve Avery, Pete Smith, Derek Lilliquist, and Kent Mercker on the pitching staff-all under 25 and all getting amble innings-the Braves finished last for the third straight year in 1990. They did, though, make one very important move, hiring back Bobby Cox two-thirds of the way through the season.
Of course, since 1990 the Braves have won thirteen division titles. They have not missed the playoffs since the last Bush presidency (I am ignoring the playoff-less 1994 season in all of this analysis). They have 15 in total since divisional play started in 1969. That's two more division titles than the next team (the Yankees and A's both have 13).
Their 13 straight playoff appearances is the longest such streak in baseball history. The Yankees current streak of ten is their longest (five-year streaks: 1949-53 and 1960-64; 4-year: 1936-39 and 1955-58). The Indians had a five-year streak in the mid-Nineties (1995-99). The Giants had a four-year streak back in John McGraw's day (1921-24). The A's had a four-year streak broken last year and had a five-year streak in the days of Reggie Jackson and Vida Blue (1971-75).
And that's it. No other team has won more than three straight (unless you count Charlie Comiskey's St. Louis Browns of the American Association in the 1880s, before they were known as the Cardinals). And even though one could argue that with an extra round of playoffs added in 1994 it's easier than ever to make the playoffs, the Braves have done it by winning their division, not by using the wild card backdoor. The Yankees have two wild card appearances in their current streak (1995 and 1997), and the A's had one wild card in the middle of their four-year streak (2000-2003).
The Braves have had more playoff appearances during their current streak than six of the original sixteen teams have in their entire histories.
They are discussing having their names permanently etched in the top spot of the NL East for all posterity. Few seem to remember that when the "streak" started they were in the NL's Western Division (a remnant of the Gussie Bush and Phil Wrigley era), there were no wildcards, and there were just two rounds of playoffs.
The odd thing is that with all that success, the Braves have just one World Series ring to show for it (1995) and only five National League pennants, the last coming in 1999. They have not been able to get out of the first round of the playoffs in seven of the last eight years. Since the Braves won their last World Series title, the Marlins (1997 and 2003) and the Mets (2000) -- both division rivals -- have gone to the fall classic via the wild card and the former has two rings to show for it.
A lot of that has to do with how Atlanta constructs and employs a roster for the regular season, the long haul, in such a way that does not lend itself well to the micro-season that is a playoff series. And a lot has to do with some rather odd in-game decisions by Monsieur Cox that I won't go into right now. However, one has to wonder how bad their streak of luck in the playoffs has been, from an historical standpoint, and if another such streak can be found on this side of the Buffalo Bills.
First, let's take a look at the Braves record and determine if it truly is that much worse than anyone else's. As I mentioned earlier, the Braves have won 15 division titles since divisional play began. They have five National League pennants and one World Series crown to show for it.
The Orioles have the same number of league pennants and one more World Series title but did it with just eight division titles. Ditto for the Reds, except they have three World Series wins. The Dodgers have five pennants and two World Series rings to go with their nine division championships. The Yankees have ten pennants and six World Series championships resulting from 13 division crowns. The A's have six pennants, four Series rings, and 13 division titles. Even the Marlins have two rings without ever winning a division title. (Note: these numbers reflect just the divisional play era.)
The bottom line is that the Braves have converted less than 7% of their division titles into World Series rings. Of teams with more than three division crowns, the only team with a worse conversion ratio is Houston (0-for-7). Also, the overall expectation for any given division champ to win the World Series is 19%, based on the results so far.
But how many rings would one expect the Braves to have won? Given that there are eight teams that make the playoffs, let's assume that each has a one-in-eight chance to reach the promised land of champagne showers and Bud Selig-presenting trophies. In the days before the wild card, each team had a one-in-four chance (i.e., 1969-2003, excluding the strike year of 1981 in which eight teams made the playoffs). In the days before division play, let's assume that each playoff team had a one-in-two chance. (Yes, this may be simplistic, but given that weighing factors home-field advantage, series length, series procedures, and regular-season win differential would produce odds that are better predictors but given the limited sample size and the number of various factors, I don't think anything conclusive can be derived.)
One would expect the fifteen Braves division titles to translate into 2.5 World Series crowns, so they have come up 1.5 short. Given the odds, here are the teams that underachieved and overachieved the most in the era of divisional play.
| Underachievers | WS Expected | WS Actual | Diff |
| Atlanta Braves | 2.50 | 1 | -1.50 |
| Houston Astros | 1.25 | 0 | -1.25 |
| San Francisco Giants | 1.25 | 0 | -1.25 |
| Chicago Cubs | 0.75 | 0 | -0.75 |
| Cleveland Indians | 0.75 | 0 | -0.75 |
| Overachievers | WS Expected | WS Actual | Diff |
| New York Yankees | 2.38 | 6 | 3.63 |
| Florida Marlins | 0.25 | 2 | 1.75 |
| Cincinnati Reds | 1.88 | 3 | 1.13 |
| Oakland Athletics | 2.88 | 4 | 1.13 |
| New York Mets | 1.25 | 2 | 0.75 |
| Toronto Blue Jays | 1.25 | 2 | 0.75 |
Those lists should not be a surprise. The Braves are the worst of the group. Before we put this into an historical context, let's look at Atlanta's record in converting division crowns into pennants. The Braves have five pennants from their 15 division titles. That's 33%. The average conversion ratio for a division winner has been slightly higher at 39%. Here are the underachievers/overachievers for league titles:
| Underachievers | Lg Expected | Lg Actual | Lg Diff |
| Houston Astros | 2.50 | 0 | -2.50 |
| Pittsburgh Pirates | 4.50 | 2 | -2.50 |
| Chicago Cubs | 1.50 | 0 | -1.50 |
| Chicago White Sox | 1.25 | 0 | -1.25 |
| Kansas City Royals | 3.25 | 2 | -1.25 |
| Overachievers | Lg Expected | Lg Actual | Lg Diff |
| New York Yankees | 4.75 | 10 | 5.25 |
| Florida Marlins | 0.50 | 2 | 1.50 |
| New York Mets | 2.50 | 4 | 1.50 |
| Cincinnati Reds | 3.75 | 5 | 1.25 |
| St. Louis Cardinals | 2.75 | 4 | 1.25 |
The Braves don't appear here. They are actually right on the money, five pennants expected and five won. Even though the Braves have lost in the first round for the last five years straight, and in seven of the last eight, they did get to the World Series in four of their first five years during "the streak." So it all evens out. It's like flipping a coin that ends up heads four of the first five times. It'll eventually end up tails enough times to even it up if you flip the coin often.
OK, now let's put the Braves' World Series underachieving in a more historical context. Combining the data from before and after division play was instituted, are there bigger underachievers than the Braves?
| Underachievers | WS Expected | Actual WS | Tot Diff |
| Chicago Cubs | 5.75 | 2 | -3.75 |
| NY-SF Giants | 8.75 | 5 | -3.75 |
| Brook-LA Dodgers | 8.50 | 6 | -2.50 |
| Philadelphia Phillies | 2.63 | 1 | -1.63 |
| Bos-Milw-Atl Braves | 4.50 | 3 | -1.50 |
| Houston Astros | 1.25 | 0 | -1.25 |
| Overachievers | WS Expected | Actual WS | Tot Diff |
| New York Yankees | 16.88 | 26 | 9.13 |
| Phila-Oak Athletics | 6.88 | 9 | 2.13 |
| Florida Marlins | 0.25 | 2 | 1.75 |
| St. Louis Cardinals | 7.38 | 9 | 1.63 |
| Cincinnati Reds | 3.88 | 5 | 1.13 |
| Boston Red Sox | 5.13 | 6 | 0.88 |
The Yankees leading the overachievers list is no surprise given that they have 26 rings and all. However, the Red Sox appearance may be a surprise given their infamous 86-year drought that was ended last year, but the Red Sox have a history that parallels the results the Braves have witnessed during their current streak: early success followed by a long period of failure.
Also, you might notice that the underachieving by the Braves in recent years is not even in the class of the Cubs and the Giants over their entire franchise histories. One thing should be kept in mind, however. Given that there are four times as many teams in the playoffs today, it takes four times as long to reach the same level of underachieving.
For instance, the Braves have been in the playoffs without winning the World Series in each of the last nine years. Given that they have a presumed one-in-eight chance of winning a ring, they have just underachieved by slightly over one World Series win during this span. From 1911 to 1913 McGraw's Giants lost three straight World Series. The expected number of World Series for them during this span is 1.5. Therefore, the Giants' underachieving was much more efficient than the Braves'.
So where does this leave us? Yes, the Braves have come up very short during their division-title streak, but how badly they have underachieved may have more to do with the era in which they play than with any "choking" by the team. Who's to say they would have even made the playoffs throughout the current streak had baseball never expanded to three divisions? They had an inferior record to the NL West winner in two of the seasons of the streak, and their NL East opponents were very weak in a number of the others.
Mike Carminati is the proprietor and author of Mike's Baseball Rants.
| Designated Hitter | March 24, 2005 |
Growing Up With Vin Scully
I first met Vin Scully in my grandfather's kitchen. He came singing out of a small black transistor radio that sat on the windowsill above the sink. These were the Dodgers of 1974. I was six years old. I'd sit listening on a stool near the sink while Papa washed dishes and Vin called the action. There are times and places, most of them brief and small, when you feel perfectly at home in the world, when even the thought of any sort of sorrow or peril is a million miles from you. That stool, in that kitchen, with Vin's inimitable voice was one of those times and places for me.
My parents were going through a divorce. My mother was sick most of the time, and my father was elsewhere. I was scared and I didn't really trust anyone. Except Vin. He'd say, "Hi again, everybody, and a very pleasant good evening to you, wherever you may be," and my life would come back on line. It wasn't just that he was out there and that he loved baseball as I did. It was his sound, the sound of a merry gentleman, full of comfort and joy.
I know there were kids like me in the heartland clinging to Jack Buck on KMOX, and I'm sure there were boys and girls back east falling for Ernie Harwell or Mel Allen. But I don't know if they could ever feel what I felt for Vin's voice. I swear the way his smooth, round Irish lilt wrapped itself around me, it promised, almost every summer night, to keep me safe.
It's been 30-plus years since those first games in Papa's kitchen and still, every time I hear Vin I get a rush of that same feeling. Like Proust's madeleines his voice kicks me back. And my four decades are just a drop in the bucket. Scully's been singing Dodger stories since 1950. Think about that. From Brooklyn to Los Angeles. He's seen Sandy Koufax come and go. He was there when the Dodgers' forever infield -- Garvey, Lopes, Russell, and Cey -- broke in and bowed out. He was at the mic for Fernandomania and he welcomes Gagne to the jungle now. The team's town has changed, its players have changed, and its owners have changed, but Vin has remained.
How do you assess the value of that? Not just for me or for any one fan, but for the franchise and the community? I honestly don't think you can. In an era dominated by free agency and disaffection, when Darryl Strawberry comes in one year and Mike Piazza gets sent out another, the identity of a professional club, the thing, the attitude and spirit, you root for and identify with is at risk. It's no turn-back-the-clock slam on the players or the union to say so, it's just what is, and has been for a while now.
People say you root for the uniform, and sure, there's some of that, but in the case of the Dodgers, I think Vin is the uniform. As it was with the Lakers and Chick Hearn for so long (and how blessed has LA been in this regard, with the Kings also having Bob Miller for so long), Scully, the sound of Scully, is synonymous with Dodgerdom. Whatever else we're doing when we put on a cap or a t-shirt, we're pledging allegiance to Vin. He's who we are.
That's no doubt true in many major league cities, but it's especially crucial in Los Angeles. It's a vast stretch between the coast and the desert, and thanks in part to a tangle of freeways, a history of water grabs, and great geographical diversity, the L.A. area is a spread-wide place, with communities distanced and often cut off from one another. That's part of the charm of the place, for sure; you get great variety and, at the margins, some fantastic cultural, culinary, and political mélanges. But it comes, too, with a kind of alienated undercurrent, like the city's prone to spin, from time to time, like Yeats' widening gyre, like you're not always sure what connects you to folks on some other spoke of the wheel. I've always felt that Vin counteracts that in some steady, fundamental way.
I was at a game at Dodger Stadium in the early '80s, I think, and it was souvenir-baseball-radio night. The first 10,000 fans or something got baseball-shaped transistor radios. And there we all were, holding the balls up to our ears, watching the game with our eyes, and listening to Vin describe it with his words. Every radio was on. The open-air stadium was like your living room, rich with his voice. And I remember thinking then that it's Vin who unites us -- culture, class, and race be damned. I've been at stop lights and in unfriendly bars, restaurants, gas stations, gyms, and liquor stores where Vin's name -- or the sound of his call on a radio -- has been nothing less than a shibboleth.
Which brings us to his words. Because it's not just the voice, of course. It's how he tells stories. I could talk about a hundred different things -- from his flare for the homespun phrase with a touch of Shakespeare (or his flair for the Shakespearean phrase with a touch of home) to his feel for the classic structure of tension and resolution (his sense of which I'd put up there with any great filmmaker you want to mention), to his pitch-perfect metaphorical touch ("He's like a tailor; a little off here, a little off there and you're done, take a seat," he once said of Tom Glavine) -- but I'll focus on two: detail and empathy.
Thanks to Rob McMillin at 6-4-2, I had a chance to hear Scully's call of the ninth inning of Koufax's 1965 perfect game again recently. It's a terrific piece of poetic storytelling (Gary Kaufman wrote a great piece about it at Salon.com several years ago), and the thing that jumps out at me is his habit of describing, without fanfare, just the smallest sorts of actions and gestures. There's a bit in that ninth inning where he describes Koufax and his hat:
"Koufax lifted his cap, ran his fingers through his black hair, then pulled the cap back down, fussing at the bill. Krug must feel it, too, as he backs out, heaves a sigh, took off his helmet, put it back on and steps back up to the plate."
Like Hemingway, Scully lets the mundane resonate and tell its own story. As a batter steps into the box, Vin tells you where he comes from, what his mother and father do, or what he likes to read. It's at those moments in which the players, who might otherwise be unfamiliar to us -- by virtue of what they do, how much they make, and how they've been characterized or ignored by the press -- become known on some basic level.
The temptation as a storyteller is to make too much meaning, to layer dramatic moments with interpretation. You hear a lot about Scully being the consummate professional because he's no homer, because his calls are objective and clean of angle. That's all true, but I think that's a byproduct of this other thing. I think a key to his genius is that he often lets things be what they are and, like a good writer, he pays attention to the little things. You're as likely to hear about how a runner moves his feet or a batter wiggles his bat as you are to hear about whether the one is thrown out or the other gets a hit. Nothing escapes notice, so meaning tends to layer itself in our minds as much or more than in Scully's.
I've often thought of this as a kind of "giving way" on Vin's part. As much as Scully's an unmistakable presence on air, he's also willing to recede to the point of remaining totally silent at certain times. In the moments after Kirk Gibson hit his famous home run in Game One of the 1988 World Series, while Jack Buck was giddily shouting, "I do not believe what I just saw!," Scully, who'd called the shot like he's called so many others -- "High fly ball into deep right field. She is...gone!" -- took a long pause to let the crowd noise reach the mic and the moment reach its emotional height, before coming back on to cap things with the sweet little turn, "In a year that has been so improbable, the impossible has happened."
But even more than in these characteristic silences, Scully's empathy shines through in his habit of describing a scene by trying to imagine himself in it. He'll often playfully speculate about what a first baseman must be saying to a pitcher in a mound conference, or some such thing, but that's not what I'm talking about. I'm talking, instead, about those times -- and they happen almost every game -- when he introduces a scene by thinking, almost feeling, through the likely emotional register of Teddy Roosevelt's proverbial "man in the arena."
Here are the key moments in the ninth inning of Koufax's perfect game (italics mine):
And . . .
It's hard to describe the effect this turn has, but I think, for lack of a better term, I'll call it ethical -- and I mean that in the classic sense -- as a mode of thinking outside of oneself and about the fortunes of another. You hear all the time that listeners feel as if they know the announcers who call their home team's games. You hear, too, that they feel as if they're known by those guys behind the mic. It's never true, of course (I'm sure Scully hears a dozen times a day, as he did from me when I first met him in person two years back, that he's been "such an important part" of the life of someone he's never met), but I think in Scully's case, there is, in his tone -- and in his rhetorical style -- something inherently welcoming, something that underwrites his calls with a genuine sense of its being possible.
That's a powerful thing. It meant the world to me when I was six.
And the truth is, it still does. The season officially begins on Sunday night, April 3, when the Yanks and Sox go heads-up. But for me, like it's been for thirty-odd years, the real start of the season comes two nights later, when Vin says, "Hi again everyone, and a very pleasant good evening to you, wherever you may be."
I'll be in the kitchen.
Eric Neel is a columnist for ESPN.com's Page2 and a regular contributor to ESPN the Magazine. He lives with his wife Gwen and daughter Tess in Humboldt County, California.
| Designated Hitter | March 17, 2005 |
The Mazzone Effect Revisited
Back in the early days of the off-season, like many of my fellow Braves fans, I began to ponder the Braves pitching situation for the upcoming season. The team was about to lose three members of the rotation along with several effective members of the bullpen. It looked like the Braves would be rebuilding a pitching staff with spare parts once again.
With the exception of the "Big-3" of the 1990s (Glavine, Maddux, and Smoltz), the Braves pitching staff is always in motion. This is not much different from many other teams, but few clubs with such shuffling have had the sustained pitching success of the Braves. And much of the success has come from players not deemed worthy of roster spots on other big league clubs. The Braves have made a habit of turning cast-off non-roster invites into big-name free agents.
Clearly, the Braves are doing something right, and much of the credit has gone to pitching coach Leo Mazzone. The table below lists the mean rank and the mean of each team's ERA since 1991, Mazzone's first full year has the Braves pitching coach.
Team	Mean MLB     Mean	  Team	  Mean MLB    Mean
	ERA Rank     ERA	           ERA Rank    ERA
-----+-----------+----------+--------+-----------+--------
ATL	2.18	    3.50	  PIT	  15.04	     4.37
LAD	4.57	    3.75	  OAK	  16.14	     4.49
NYM	8.04	    4.01	  ANA	  16.39	     4.46
STL	9.36	    4.12	  SEA	  16.75	     4.49
HOU	9.50	    4.02	  CHW	  16.96	     4.45
MON	10.04	    4.09	  TOR	  17.21	     4.48
ARI	10.79	    4.20	  CLE	  17.54	     4.50
SFG	10.89	    4.15	  MIL	  18.21	     4.56
SDP	12.00	    4.21	  BAL	  18.57	     4.56
BOS	12.57	    4.25	  MIN	  19.61	     4.70
FLA	13.42	    4.35	  KCR	  20.96	     4.72
CHC	13.50	    4.28	  TBD	  22.29	     4.89
NYY	13.50	    4.26	  TEX	  23.50	     4.92
CIN	13.86	    4.32	  DET	  24.57	     5.04
PHI	14.61	    4.32	  COL	  27.46	     5.32
			  League		     4.38
There's no doubt that the Braves have had the best pitching staff in baseball since Mazzone became the organization's big league coach. But, just as I was becoming complacently confident in the Braves ability to succeed with a new group of pitchers, I began to have doubts. Is Leo Mazzone as good as we think he is? We all remember Jaret Wright, John Burkett, and Damian Moss; but what about Albie Lopez, Odalis Perez, and Jason Schmidt? Maybe, we're just remembering the success stories. Maybe some of the guys who were successful with the Braves just got a bit lucky during their tenure. Even if the success under Mazzone is for real, maybe John Schuerholz's keen ability to nab good pitchers or Bobby Cox's clubhouse management are the real secrets to success. I needed to know. (Little did I know that the Braves would soon make some bold moves by adding Tim Hudson and John Smoltz to the rotation, and acquiring Danny Kolb for the pen.)
With this in mind, I set out on a quest to analyze how much better pitchers have been with Mazzone than without. I looked at every pitcher who had pitched at least one full year for Mazzone, and compared their seasonal ERAs with and without Mazzone as their pitching coach. In December of last year I posted some rough results on my weblog, Sabernomics. The verdict: having Leo Mazzone as a pitching coach lowered a pitcher's ERA by a little more than half a run. This estimate controlled for many potential biasing factors. To my surprise the results set off a chain-reaction of follow-up studies at Baseball Think Factory, which largely confirmed the robustness of my initial findings.
Since I first crunched the numbers, I haven't had much time to work with the data in greater depth. Thanks to a kind invitation from Rich and Bryan, I have a reason to revisit the issue. In this article I discuss an expansion of my previous approach looking at the difference in Mazzone's effectiveness on starters and relievers. One of the supposed keys to Mazzone's success is an off-day throwing program for starters. If this is his "secret" to success, the Mazzone effect should be more pronounced for starters.
To begin, I used The Lahman Baseball Archive to identify all pitchers who pitched at least one full season for Leo Mazzone over their careers. I used a sample of pitchers who pitched for both Mazzone and a different pitching coach, and I only looked at player-seasons in which the player stayed on the same team for a full season. Using this data, I compared the seasons in which the pitchers pitched for Mazzone to the seasons without his oversight. To control for other influences, I used multiple regression analysis -- including control variables for age, the run environment of the league, the career quality of the pitcher, and the defense behind the pitcher.
Defining a pitcher as a starter or a reliever is a bit tricky, because some pitchers do a little of both over the course of the season. After some toying around with the data I settled on the following definitions. For this study, a starter was a pitcher who pitched at least 100 innings and started 75% of the games played in that season. A reliever must have pitched at least 30 innings and started in only 25% or less of the games in which he played that season. I tried several other starter/reliever measures, but they yielded results that were not meaningfully different from the ones I present below.
Here are the regression-estimated impacts of Leo Mazzone on park-adjusted ERAs for all pitcher-seasons in the sample (a minimum 30 innings pitched for a pitcher-season) and separated into starters and relievers. For simplicity, I only report the coefficient estimates (which are statistically significant) on Mazzone's presence as the pitching coach, the number of pitchers, and number of pitcher-seasons in the sample. You can view the full regression results and technical notes here.
Pitcher	        Impact	 Pitchers   Pitcher
Classification   on ERA	 in Sample  Seasons
--------------+------------+----------+----------
All              -0.625	  98	   694
Starters         -0.412	  22	   152
Relievers        -0.676	  56	   248
When looking at all of the pitchers in the sample, Leo Mazzone's presence lowered a pitcher's ERA by about 0.63 ERA points. To put the effect in perspective, for the average 2004 National League pitcher (4.31 ERA) Leo's impact on earned runs was about the same as Coors Field in the opposite direction. Note to Dan O'Dowd: take the balls out of the humidor and hire Leo Mazzone.
When separating pitchers into their defined roles, relievers appeared to benefit more from their time under Mazzone than starters did, though not by much. For starters, having Leo Mazzone as a pitching coach was worth about 0.41 earned runs per 9 innings or 1 earned run per 22 innings. For relievers, Mazzone was good for about a 0.68 reduction in earned runs per 9 innings, or 1 run per 13 innings. It's pretty clear that he helps both classes of pitchers quite a bit, but he seems to do a little bit more for relievers than starters.
What about the ability of players to retain what they have learned from Leo? Should we expect success under Mazzone to continue? And what if the success under Mazzone is the result of John Schuerholz identifying good pitchers before they become Leo's responsibility? One of the results from my earlier study was that players tended to pitch worse both before and after pitching for Leo. So, I ran a second set of regressions with indicator variables for seasons pitched before and after working under Leo.
Pitcher	        ERA	     ERA
Classification   Before Leo     After Leo
--------------+------------+-------------
All              0.625	     0.624
Starters         0.367	     0.461
Relievers        0.747	     0.559
Starters and relievers pitched worse both before and after playing for Mazzone. Something good was clearly happening when pitchers played for the Braves. One noticeable difference between starters and relievers was that the Before Leo impact for starters was smaller in magnitude. Why might this be? I considered the possibility that the long run of Glavine, Smoltz, and Maddux in the Braves rotation, all of whom had some pitching success before Leo arrived, might be the culprit. When I dropped the Big-3 from the analysis, the estimated impact was the same, though the before Leo variable was just barely statistically insignificant. The smaller impact on ERA from seasons before Leo may reflect John Schuerholz's ability to target good starters that make Mazzone's job easier as well as some of the impact of the Big-3.
But, there is no doubt that pitchers of both classifications suffered when they left Atlanta. If Leo is just spotting problems and fixing them, pitchers should retain the advantage they received when they join the team. It turns out that whatever inspiration Leo provides, you can't take it with you. Whether it's a lack of fine-tuning by Mazzone or Braves management just knows when it's time to cut a guy loose, I can't say. No matter what the cause, these numbers do not bode well for the Angels, Diamondbacks, and Yankees who acquired Paul Byrd, Russ Ortiz, and Jaret Wright in the off-season. While all of these players may provide solid pitching performances for their new clubs, I don't expect their performances to be as good as they were for the Braves.
The fact that pitchers seem to lose the Leo magic when they leave the Braves indicates to me that part of the Mazzone method involves handling pitchers during the game. The larger ERA gains for relievers over starters are consistent with this hypothesis. If this is the case, then manager Bobby Cox deserves some credit as well. It would be interesting to study the in-game use of pitchers by the Braves, and how their strategy differs from other organizations. I bet Studes could figure out a way to do this with Win Probability Added.
One real problem with determining exactly who is responsible for the success of Braves pitching is that the team has had stable management over this era. John Schuerholz and Bobby Cox have overseen the Braves pitchers along with Mazzone, so I can't isolate their individual influences. However, I don't think this really matters. Leo is in charge of the pitchers, and the rest of the management over him has stuck by him; therefore, I feel comfortable attributing much of this success to Mazzone. But, I want to acknowledge the potential contributions of Cox and Schuerholz to the Braves pitching consistency.
So where does this leave us? Well, Mazzone is a pretty darn good pitching coach. I think we already knew that, but now we really know it. Leo's influence seems to extend beyond a simple off-field training strategy for his pitchers, and both starters and relievers benefit from his oversight. If the powers that be ever decide to open the Hall doors to pitching coaches, Leo Mazzone has a very strong case.
J.C. Bradbury is an economist who runs the weblog Sabernomics: Economic Thinking About Baseball.
[Additional reader comments and retorts at Baseball Primer.]
| Designated Hitter | March 03, 2005 |
Luck, Fate, or Providence
I first became aware of Bill James and his work during the spring of 1983. At the time, I was 15 years old and a fanatic baseball fan, growing up in Des Moines, Iowa.
One day, my father took me on a business trip to Kansas City. At the time, he thought we were going to drive home that evening. But for some reason, my dad decided he needed to stay an extra day to meet with some additional clients. I needed to get back home to go to school, so my dad bought me a bus ticket to get back that evening. He also bought me a copy of the 1983 Baseball Abstract so I would have something to read on the bus ride.
I think my dad bought me that book to help me get interested in math. At the time, I was struggling badly with high school algebra, and he likely wanted me to see things in a new light. As it was, I still got a "D" in high school algebra, but I was quickly completely absorbed in the Baseball Abstract, and a rapid convert to the way that Bill James thought about baseball.
One thing that I particularly respected was his writing ability. His sense of humor and his love of the game shone through in every essay. Growing up in a Triple-A city, I had always been interested in young players and how they projected to do in the Majors. Bill's creation of the Major League Equivalent (MLE) for minor league numbers was, for me, the most fascinating part of his work. It eventually became the starting point of all quantitative prospect analysis.
I graduated from high school in 1986, and went to college at Northwest Missouri State University. I decided to study history, with the goal of becoming a college professor. Following baseball prospects was my main hobby, but at the time I had absolutely no idea that it would become not just a hobby, but a career.
I went off to grad school at the University of Kansas in July of 1990. I picked KU for two pragmatic reasons: they gave me a graduate assistantship, and it was within driving distance of Northwest Missouri State, where my girlfriend Jeri was two years behind me. I knew I wanted to marry her, so keeping close was very important for weekend visits.
I knew Bill James lived in Lawrence, the home of KU, and in the back of my mind I wondered if I'd ever run into him, but it was no more than a fleeting thought.
Jeri and I got married during the spring of 1992 after she graduated from college. In early May of 1993, Jeri asked me what I wanted to do for the summer. My teaching assistantship did not cover the summer months, so I made ends meet during financial dry spells by delivering pizzas and working fast food. I jokingly said "I'd love to work for Bill James." Ha ha. It would certainly beat slinging tacos.
The next day, Bill James walked into the luggage store where my wife worked, to purchase a briefcase. She recognized him from the name on his check, asked if he was Bill James the baseball writer, and off-handedly mentioned that her husband was a big fan and would love to work for him. "I'm looking for an assistant," responded Bill, "if he is serious, here is my business card. Have him call me."
Luck, Fate, or Providence. Take your pick.
At the time, Bill was writing a yearly annual called the Player Ratings Book. He needed someone in the office who knew about minor league players, and I was fortunate enough that my interests and skills matched his needs.
I worked with Bill from late May of 1993 through August of 1996. My main duty was to help him with research for the Player Ratings Book, but I was also involved with research for some of Bill's other books, including Whatever Happened to the Hall of Fame? (also known as The Politics of Glory), The Bill James Guide to Baseball Managers, and some early work on the New Historical Baseball Abstract. I also answered the phone, took messages, changed light bulbs, and made sure nobody broke into the office when Bill was on vacation. Along with Jim Baker, Rob Neyer, Matthew Namee, Mike Kopf, and Mike Webber, I am one of only a small handful of people who have had the opportunity to work with Bill. It is fair to say that I would not be doing what I do for a living were it not for the events of May, 1993.
Bill is probably the most unique thinker I've ever met, especially in the way he can express ideas on paper. Bill is not always comfortable with talking or expressing ideas orally. Some people think he is gruff and unapproachable, and at times he really does come across that way. But he is really an exceptionally kind person, once you get to know him.
On more than one occasion, Bill would try to give me oral instructions about a research project, but would get frustrated with his inability to explain what he meant (or my inability to understand what he was talking about). He would then disappear into his office for a few hours, eventually emerging with a written document explaining in detail what it was he was trying to say. Bill is adept at using both mathematic and grammatical forms of written communication, both numbers and language. He is constantly thinking and tinkering and testing, not only conventional wisdom but also his own assumptions.
While Bill is certainly the "father" of modern sabermetrics, he isn't really a "numbers geek" in a pejorative sense. He is more aware of the difficult-to-quantify factors in baseball than many people believe. Sabermetrics is not about plugging numbers into a computer. That's one of Bill's pet peeves, the misconception that sabermetrics is about "computerizing baseball." I think Bill would say that the whole goal of sabermetrics is to study baseball, to test common assumptions, to find out what we know, and what we don't know, and to try and find ways to improve our knowledge. Yes, a part of that is to find ways to study and quantify those things which are difficult-to-quantify. Using numbers and computers and formulae are a part of that process, but they are not the process itself. The point is to gain knowledge.
If there is one thing that working with Bill taught me, it was to not reject something just because it does not fit into your preconceived notions. If you find a piece of information that doesn't fit into your system, make sure that the problem isn't your system.
Bill and I remain in touch, and I am fortunate enough to consider him a good friend.
John Sickels worked with Bill James from 1993-1996. He publishes the John Sickels Baseball Newsletter and is the author of several books, including The 2005 Baseball Prospect Book. John's work can also be found on Minor League Ball.
[Additional reader comments and retorts at Baseball Primer.]