This early in the season the leader and laggard boards often have some interesting names, and it is fun to theorize which of these are legitimate breakouts (or breakdowns) and which are small sample size flukes. The pitchf/x data adds a powerful tool in helping with this classification. It allows us to look deeper into why a pitcher may have struggled or succeeded in a start. We have already seen some great analysis along these lines. RJ Anderson has a series of posts looking at Lincecum's, Sabathia's and Wheeler's performances thus far based on pitch speed and movement and release point. River Avenue Blues broke down Wang's first two games to see what might be up.
These are good examples of using all the data pitchf/x offers to assess recent performance. Of course what often happens is people just look at fastball speed and ignore movement, location, and release point data. For example after Cole Hamels first poor start everyone focused on his 86 mph fasball, but, as Hamels said himself, he started off with a fastball in the mid-80s early last year too. The image below shows Hamels's average fastball speed by start. The x-axis is not scaled by date, but by start (so no matter how far apart in time two consecutive starts are they are always the same distance apart along the x-axis). The division between seasons in marked with a red line.
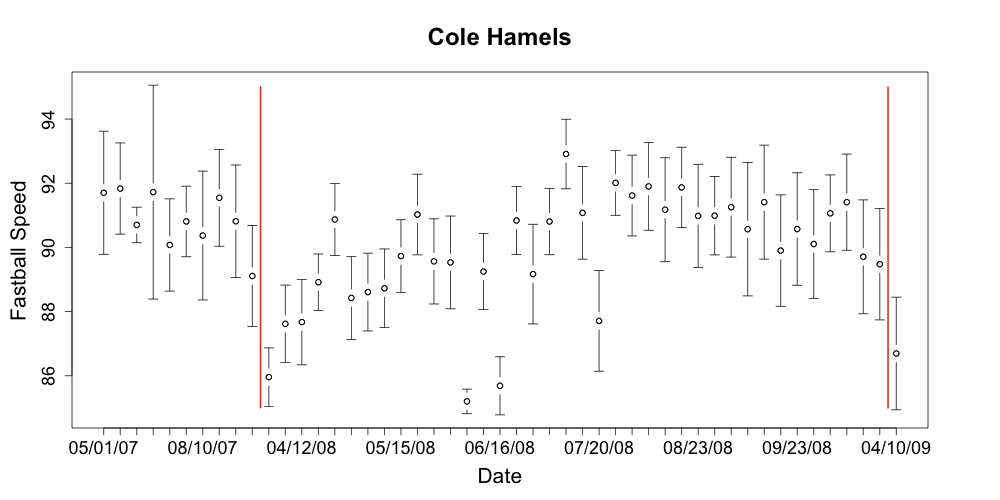
Hamels's fastball speed is right where it was last year (not to say that we should be worry free about Hamels; last year he pitched 261 innings after just 189 in 2007). This provides a useful way to see if a pitcher's speed is within his normal variation. Consider Wang:
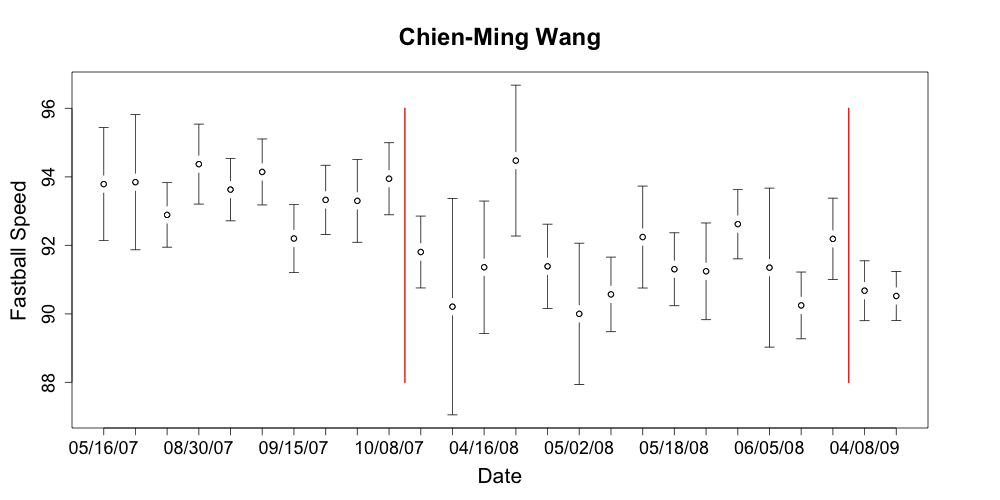
His fastball in his injury shortened 2008 was 2 mph slower than his fastball in 2007. For his first two starts of 2009 it is in the low range of his already low 2008 numbers. That could mean trouble.
As I noted earlier the best pitchf/x analysis will take into account all the data, but most people will be lazy. Like I just did, they will look at just fastball speed. So I wanted to know how much we could learn only looking at that. More specifically what can we say about performance for the rest of the season looking just at fastball speed thus far into the season. I looked back at last year to find out. Most starters have started two games with about 100 pitches per start, about half of them fastballs. So what can we know with 100 fastballs worth of data?
I started off with the average speed of every pitcher's first 100 fastballs in 2008 and then compared that with his average fastball speed for all of 2007. I wanted to see how well that pitcher performed from that point forward, so I found their FIP from the game after they reached their 100th fastball on in the 2008 season. (FIP stands for fielding independent pitching. Developed by Tangotiger, it roughly gives the expected ERA of a pitcher if he pitched in front of an average defense). From that I subtracted that player's preseason CHONE projected FIP (CHONE is one of the best projection systems. It was created by Sean Smith). The result is how the pitcher performed over the rest of the season relative to his projection. Here are the players with the biggest increase and decrease in fastball speed.
The second column is how much faster (or slower) the player's first 100 2008 fastballs were compared to his 2007 fastballs. A positive number is a faster fastball in 2008. The third is FIP minus projected FIP. Like ERA a low FIP is good, so a negative difference is outperforming the projection.
+---------------------+--------------+----------------+
| Name                | FB speed dif | FIP - proj FIP |
+---------------------+--------------+----------------+
| Ervin Santana	      |         2.28 |          -1.16 |
| Tim Lincecum        |         1.65 |          -0.83 |
| Josh Beckett        |         1.36 |          -0.45 |
| John Maine          |         1.07 |           0.10 |
| Santiago Casilla    |         1.06 |           0.92 |
| Wandy Roriguez      |         0.96 |          -0.84 |
| Manny Delcarmen     |         0.89 |          -0.86 |
| Wilfredo Ledezma    |         0.82 |          -0.05 |
| Shaun Marcum        |         0.79 |          -0.26 |
| Leo Nunez           |         0.77 |           0.05 |
+---------------------+--------------+----------------+
| Francisco Rodriguez |        -2.34 |           0.05 |
| Mike Mussina        |        -2.34 |          -1.37 |
| Daniel Cabrera      |        -2.49 |           0.82 |
| Brad Lidge          |        -2.51 |          -1.10 |
| Jeff Suppan         |        -2.61 |           0.80 |
| Oliver Perez        |        -2.81 |           0.21 |
| Chris Young         |        -3.42 |           0.41 |
| Bob Howry           |        -3.89 |           0.84 |
| Cole Hamels         |        -3.90 |           0.15 |
| Heath Bell          |        -4.01 |           0.30 |
+---------------------+--------------+----------------+
Although there is considerable variation seven of the ten pitchers with the largest increases in fastball speed outperformed their projection and eight of the ten with the largest decrease underperformed their projection. In addition the top two were two of the biggest breakout pitching performances of last year and you could have seen it just 100 fastballs into the season. Of course the trend is not perfect, 100 fastballs into the season Brad Lidge, Mike Mussina, Hamels and Francisco Rodriguez were way below their 2007 averages and they all had great seasons (although Hamels's and Rodriguez's performances were slightly worse than projected). Here are the results for all players.
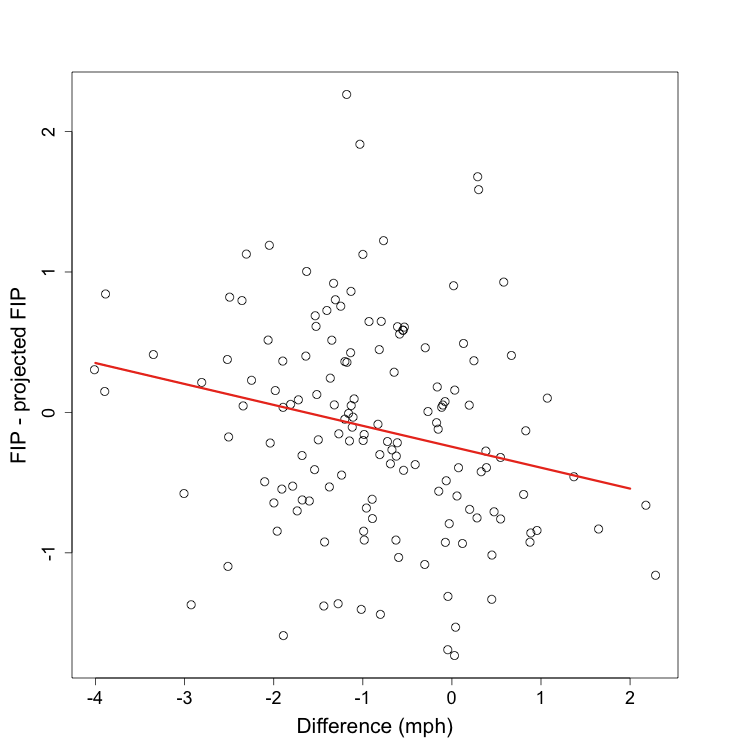
The relationship is very significant ( p < .01), but explains little of the variation (r2= 0.05). The equation for the best fit line is y = -0.24 - 0.15x. Where x is the difference in fastballs speeds (first 100 '08 fastballs minus '07 fastballs) and y is remaining 08 FIP minus projected FIP. So an increase of one mph is worth a 0.15 decrease in FIP (or each decrease of a mph is worth an increase of 0.15 FIP). Also if a pitcher is throwing just as fast in his first 100 fastballs of the season as he was all of last season (x = 0) you expect him to outperform his projection by almost 0.25 runs. If you thought going into the season he was a 4.00 FIP (or ERA) pitcher and his first 100 fastballs are just as fast as his fastballs the year before you would expect him to be a 3.75 FIP (or ERA) pitcher. But there is so much unexplained variation (95% in fact) this pitcher could end up performing very well or very poorly.
So, although the trend is significant, there is so much unexplained variation I would say with just the speed of the first 100 fastballs we don't know that much more than before. But that will not stop me from posting this season's leaders and laggards in fastball speed difference. Some of the pitchers have not reached the 100 fastball cutoff used in the above analysis. Remember someone at the top of the list could end up with very poor performance relative to projection, like Santiago Casilla last year. A pitcher at the bottom could end up like Mussina.
 Greatest difference between 09 fastball speed thus far and 08 fastball speed

+-------------------+--------+--------+
| Name              | Number |    Dif |
+-------------------+--------+--------+
| Todd Coffey       |     61 |   1.93 |
| Justin Verlander  |    119 |   1.81 |
| Kevin Correia     |    109 |   1.23 |
| Jonathan Sanchez  |     74 |   1.14 |
| Josh Johnson      |    163 |   1.14 |
| Matt Albers       |     55 |   1.13 |
| Chirs Volstad     |    117 |   1.09 |
| Adam Eaton        |     55 |   1.09 |
| Armando Galarraga |     97 |   0.98 |
| Jason Marquis     |    105 |   0.94 |
+-------------------+--------+--------+
| Geoff Geary       |     63 |  -2.04 |
| Matt Harrison     |     59 |  -2.05 |
| Daniel Cabrera    |    131 |  -2.25 |
| Manny Delcarman   |     68 |  -2.26 |
| Oliver Perez      |    126 |  -2.39 |
| Joe Saunders      |    128 |  -2.44 |
| Daisuke Matsuzaka |     62 |  -2.44 |
| Hideki Okajima    |     55 |  -2.66 |
| Dana Eveland      |     91 |  -2.88 |
| Dennis Sarfate    |     67 |  -3.12 |
+-------------------+--------+--------+
With all the caveats I will still venture that the pitchers at the top of the list, as a whole, out-perform their projections and the pitchers at the bottom under-perform. It will be interesting to see if any of the names on the top of this list turn out to be this season's Tim Lincecum or Ervin Santana.
Sorry this post was a little light on visualizations. I promise my next post will make up for it.