Over at Beyond the Box Score Sky Kalkman posted an introduction to understanding pitchf/x graphics. It is a great post for people who are having a hard time understanding these graphics. I also liked the comments section where there is some discussion of the state of pitchf/x analysis. In particular some commenters noted areas of the current analysis they found lacking.
Trey Hilman's Chin commented:
I do have one question to go along with all this. For any particular pitch, is there a range of movement that is generally recognized as “good” for that pitch classification? I am terrible at judging “stuff” simply by watching a pitch, but it would be nice to look at some of these charts and intuitively see that a particular pitch had a “nasty slider” tonight, etc.
Similarly, azruavatar wrote:
5 inches of break is absolutely meaningless to me in the context of a slider. I also question whether all 5 inches are created the same. Rivera’s cutter is notorious for late movement. If a pitch moves 5 inches over 20 feet compared to 5 inches over 60 feet that’s an incredible difference.
It seems that people are having the hardest time intuitively understanding pitch movement and putting an individual pitch's movement in perspective. Another commenter suggested Josh Kalk's two-part Anatomy of a League Average Pitcher series. The first broke down the league average fastball, sinker and cutter by presenting the frequency distribution of speed and movement for these pitches, and the second did so for off-speed and breaking pitches. These allow one to see if, say, a pitcher's curveball breaks more than the average curveball. But we are still left wondering if that additional movement makes the pitch any more successful. I will begin to address this question here for the breaking (and knuckling) pitches, and look at fastballs and changeups in a future post.
The pitchf/x system measures pitch movement in a number of ways but the two easiest to understand are the horizontal movement (pfx_x) and the vertical movement (pfx_z) of a pitch. Alan Nathan has a helpful description of the meaning behind these two values:
pfx_x,pfx_z: The deviation (in inches) of the pitch trajectory from a straight-line in the x (horizontal) and z (vertical) directions...[T]he effect of gravity has been removed from pfx_z, so that both parameters are the "break" of the pitch due to the Magnus force on a spinning baseball...[A positive value of pfx_x corresponds to] a deviation to the catcher's right and a negative value to the catcher's left. Similarly, a positive value of pfx_z is a pitch the drops less than it would from gravity alone (most pitches fall in this category), whereas a negative value is a pitch that drops more than from gravity alone (e.g., a "12-6" curveball).
So the movement of a pitch is the difference between where you would expect the pitch to end up as it crosses the plate based solely on its velocity, trajectory and gravity and where it actually ends up as it crosses the plate. This difference is broken up into its horizontal and vertical components. Then you can plot the horizontal and vertical movements of a number of pitches together in a scatter plot to see the movement of a particular pitch type or from a particular pitcher.
Curveballs
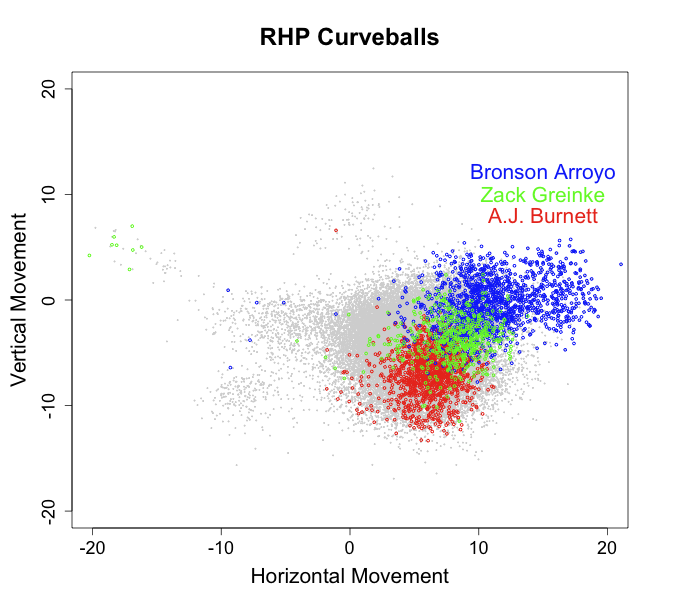
In gray, are all curveballs thrown by RHPs. You can see that most tail to the catcher's right by about 5 inches (meaning they tail away from RHBs) and break down by about 5 inches. On top I plotted the curveballs of three pitchers with distinctive and successful curves. Bronson Arroyo's curve has almost no vertical movement, but far and away the most horizontal movement of any curveball in the game. A.J. Burnett's curve, on the other hand, has some of the most downward movement of any pitcher's curve, but average horizontal movement. (Arroyo's curve's dependence on its heavy horizontal movement compared to Burnett's on its heavy vertical movement may partially explain Arroyo's more extreme platoon split compared to Brunett's). Zack Greinke combines intermediate levels of horizontal and vertical movement in his very successful curveball.
I am using the pitchf/x given pitch classifications and you can see three strange 'blobs' off of the central cluster of pitches. These are not curveballs. I think they are misclassified changeups. One cluster comes from sidearm pitchers and another from pitchers who throw sinking fastballs and changeups.
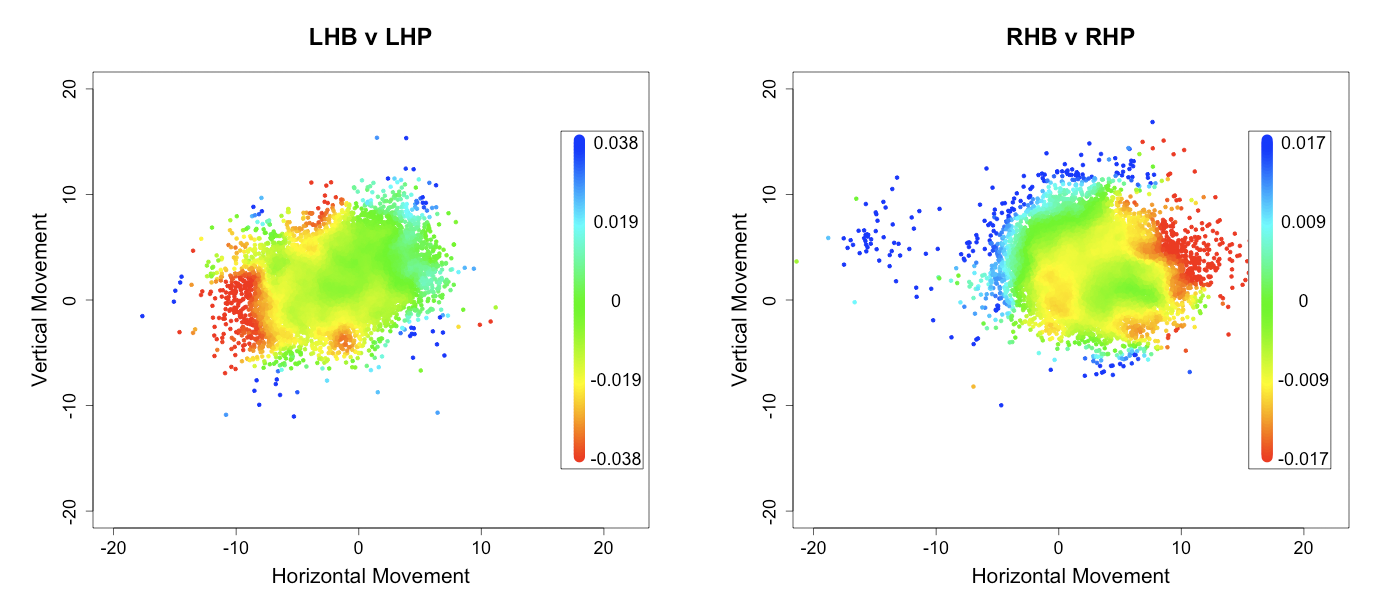
Now that we have seen the range of movement for all and a select group of individual pitchers's curves we can look at how curveball success varies by movement. In the images below I show the run value of a curve based on its movement. I decided to take a slightly different approach from my run value by location heat maps. I wanted to show not only the run value by movement, but also roughly the number of pitches with that movement. So I plotted the heat map colors on top of the scatter plot of pitches. Note that I change the color scale in each image, while this makes it harder to compare across images, it makes it easier to highlight differences within a particular image.
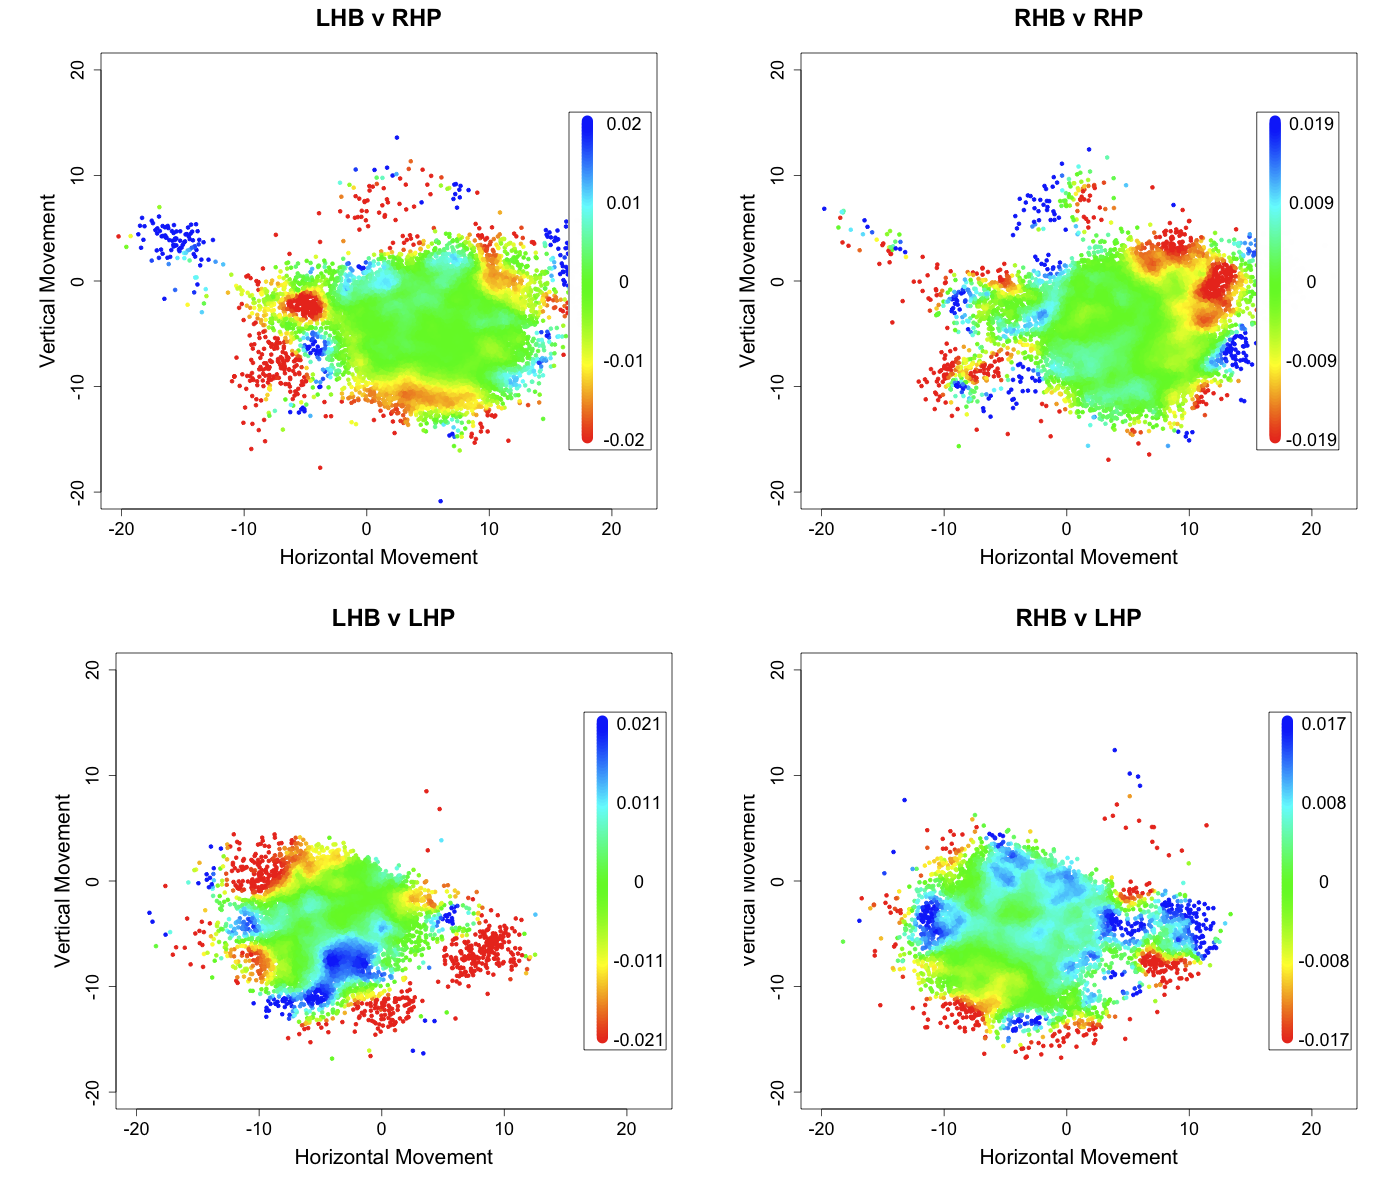
These are pretty messy complicated images. Studes suggests that at times these heat maps are too messy to be very informative. I think that is the case here (although I cannot agree too much or I lose my raison d'être). So I took a more traditional route below and plotted run value versus first the vertical movement (averaging over the horizontal) and then against the horizontal movement (averaging over the vertical).
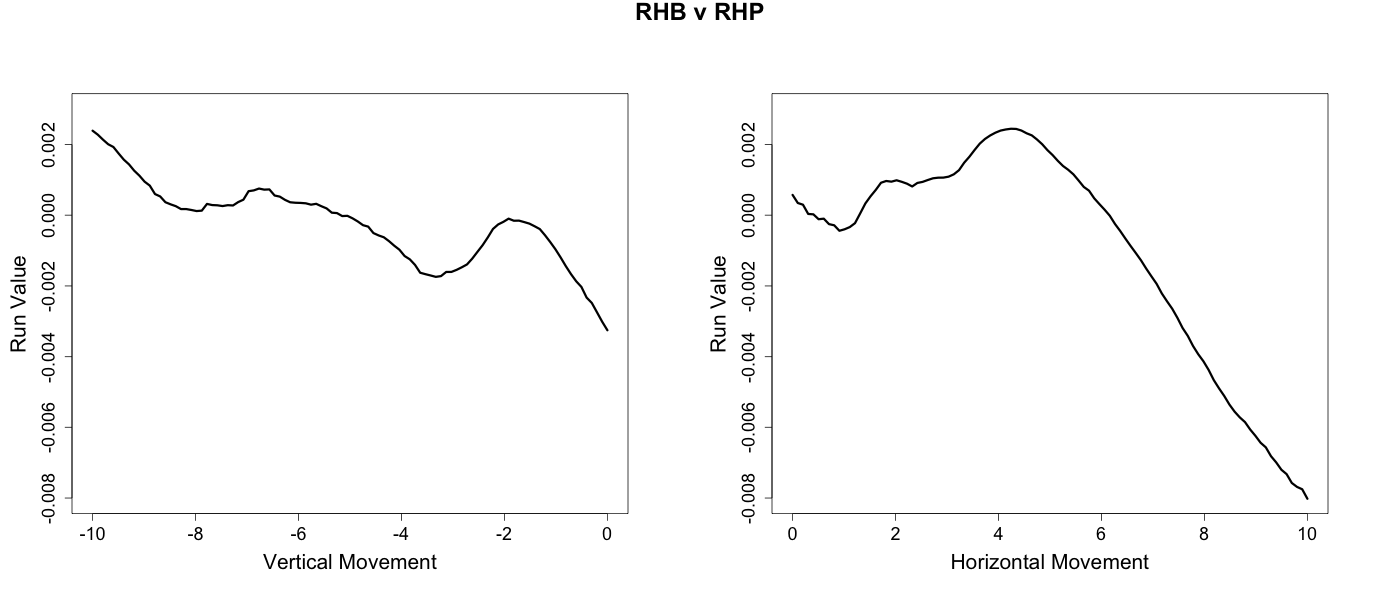
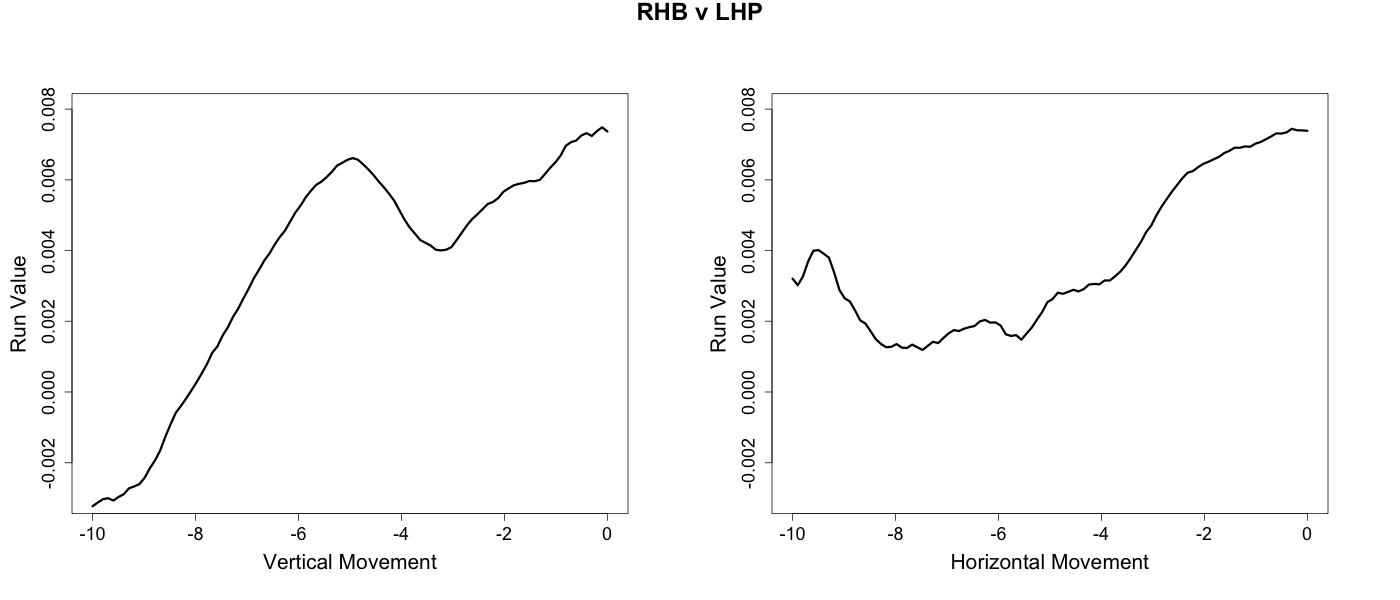
These figures reveal an interesting dichotomy between same handed versus opposite handed at-bats. In opposite handed at-bats the success of the curveball is mostly determined by its vertical break. The greater the downward break the more successful the curve. Conversely, in same handed at-bats the horizontal movement of the pitch largely drives the pattern. The more a curveball tails away from a batter the more successful it is.
Sliders

RHP's sliders, on average, have slight tailing away movement from RHBs and slight rising movement, although there is considerable variation. Greg Maddux's slider, for example, tailed in to RHBs. Justin Duchscherer's slider has little horizontal movement but above average rising movement. Carlos Marmol's slider is in the top five among sliders for both horizontal and downward movement, which makes it the slider with the most overall movement in the game.
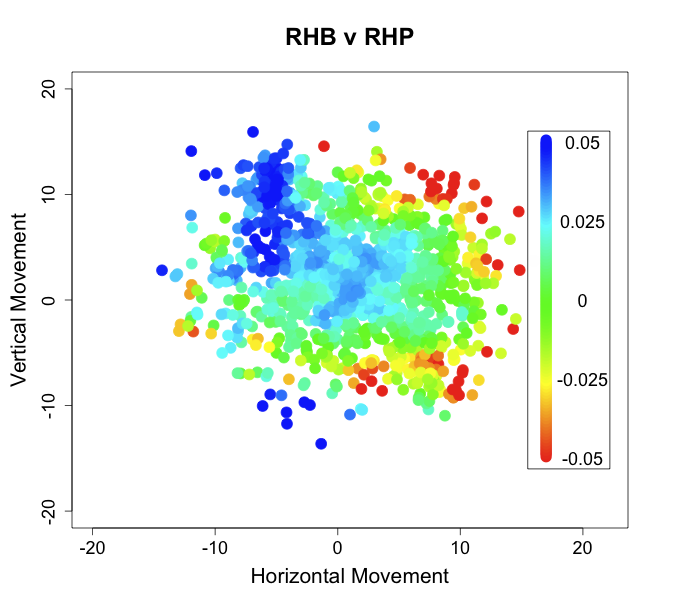
I use the same technique described above for curveballs to produce the run value by movement images for sliders below. Since sliders are thrown overwhelmingly in same handed at-bats I only present those.
Here, I think, the heat maps show a relatively clear gradient, with sliders that tail away from the hitter the most being the most successful.
Knuckleballs
There are fewer knuckleballs thrown than sliders or curves, but I really wanted to include them. John Walsh wrote the seminal pitchf/x article on the knuckleball. He found that, unlike other pitches, knuckleballs do not have a consistent pattern of movement, but a random horizontal and vertical movement each anywhere from -15 to 15 inches (for Wakefield, at least). The success of an individual knuckleball varies directly with its, seemingly random, amount of movement; batters make less and poorer contact the more movement a knuckleball has. Using the method described above I am able to make one slight addition to Walsh's conclusion.
Outside of the north-west quadrant we get a confirmation of Walsh's results; there is a lower run value as the break increases. But knuckeballs with positive vertical movement and negative horizontal movement have even higher run values than those with no movement. Thus knuckleballs that break up and in to batters, even if they have a lot of movement, are very unsuccessful. This makes knuckleballs even more random; even if a pitcher can get lots of movement on his knuckleball if it happens to break up and in he could be in trouble.
In a future post I will look at fastball and changeup movement.