To begin with I want to say great work to all my colleagues here on their draft coverage. The interviews they all posted were first rate, Marc's coverage has been exhaustive and Marc and Rich's liveblog was a perfect way for me to follow along with the first round. So great work team.
The draft was probably the most exciting baseball event of the past week, but a not too distant second, for some of us, was the release of the first batch of hitf/x data. This is the analogous data for batted balls that pitfchf/x gave us for pitches. Like pitchf/x it is captured by two high speed cameras at each stadium. Based on pictures of the ball just as it is struck by the bat and fractions of a second afterwards the batted ball's initial speed and trajectory are estimated. For a technical discussion about how this is done and the accuracy of the method check out this post at Tango's and MGL's Inside the Book blog.
This first release of hitf/x data covers all batted balls from this past April and gives the speed of the ball just it leaves the bat and its vertical angle (or launch angle) and horizontal angle (or spray angle). Analysis of this week-and-a-half old data has already poured in. Ryan Howard crushes the ball. The optimal vertical angle to hit the ball at is around 11 degrees (with 0 degrees being parallel to the ground). David Ortiz is in trouble, balls came off his bat at the same speed as balls of the bat's of Alexi Casilla and Endy Chavez.
It has been a little while since I have had a really nice heat-map heavy visualization post and I thought this data would be a great opportunity to rectify the situation. Since there is only one month of data available the heat-maps presented here are more 'smoothed' than ones I have presented previously. For this reason I am not 100% comfortable about the conclusions at the outer edges of the images. But in and around the strike zone, where there have been lots of hits, I think the results are good.
Vertical angle of a hit based on pitch location
First off let's look at the average vertical angle of a batted ball based the location in the strike zone where it was hit. We know that hit balls with a low vertical angle tend to be ground balls and pitches lower in the zone are hit more often for ground balls. Thus, we should expect that pitches down in the zone are hit for a low vertical angle. Is that the case?
The vertical angle ranges from 90 degrees (popped straight up), to -90 degrees (driven straight into the ground), with a zero degree hit being parallel to the ground. Also remember that the images are from the catcher's perspective, so negative x-values are inside to RHBs and positive x-values inside the LHBs.
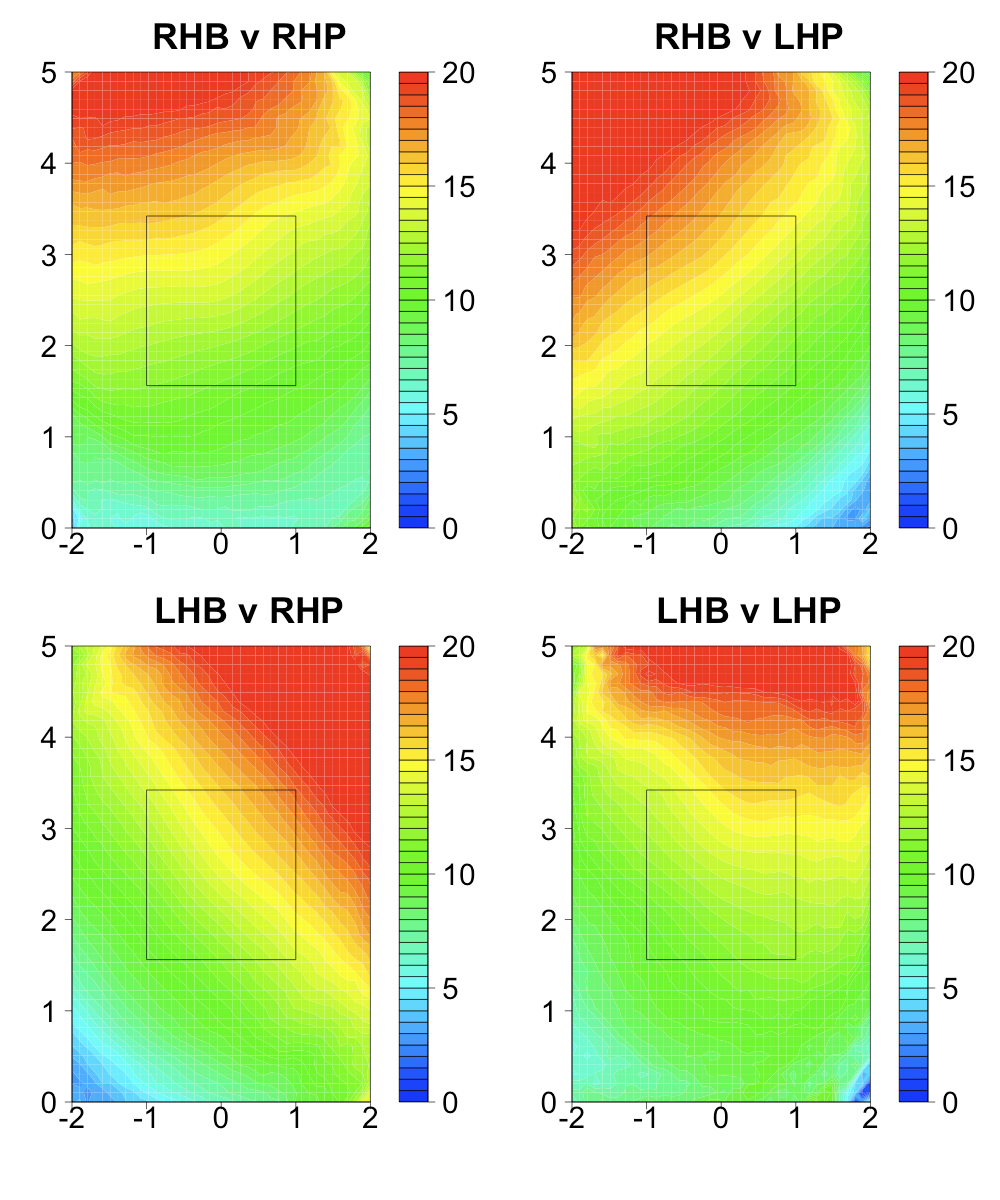
As expected the lower in the zone the lower the vertical angle of the average hit ball. In opposite-handed at-bats there is an additional trend for away pitches to have a lower vertical angle off the bat. So pitches down-and-away are the most likely to be groundballs and pitches up-and-in are the most likely to be fly balls and pop ups. In same-handed at-bats this inside-outside trend is much weaker and the gradient is largely just based on vertical location of the pitch.
Horizontal speed off bat based on pitch location
The initial speed of the ball off the bat is not as important in determining the success of a hit as the initial horizontal speed. A hit popped straight up very fast is just as bad a hit popped straight that is a little slower off the bat. On the other hand, the horizontal speed (the speed of the hit in the horizontal plane) is important in determining how hard a ball is to field and how far it goes. So below I plot the average speed of a hit ball in the horizontal plane (in mph) versus pitch location. Based on my HR heat maps I expect the highest speed hits to be slightly up-and-in.
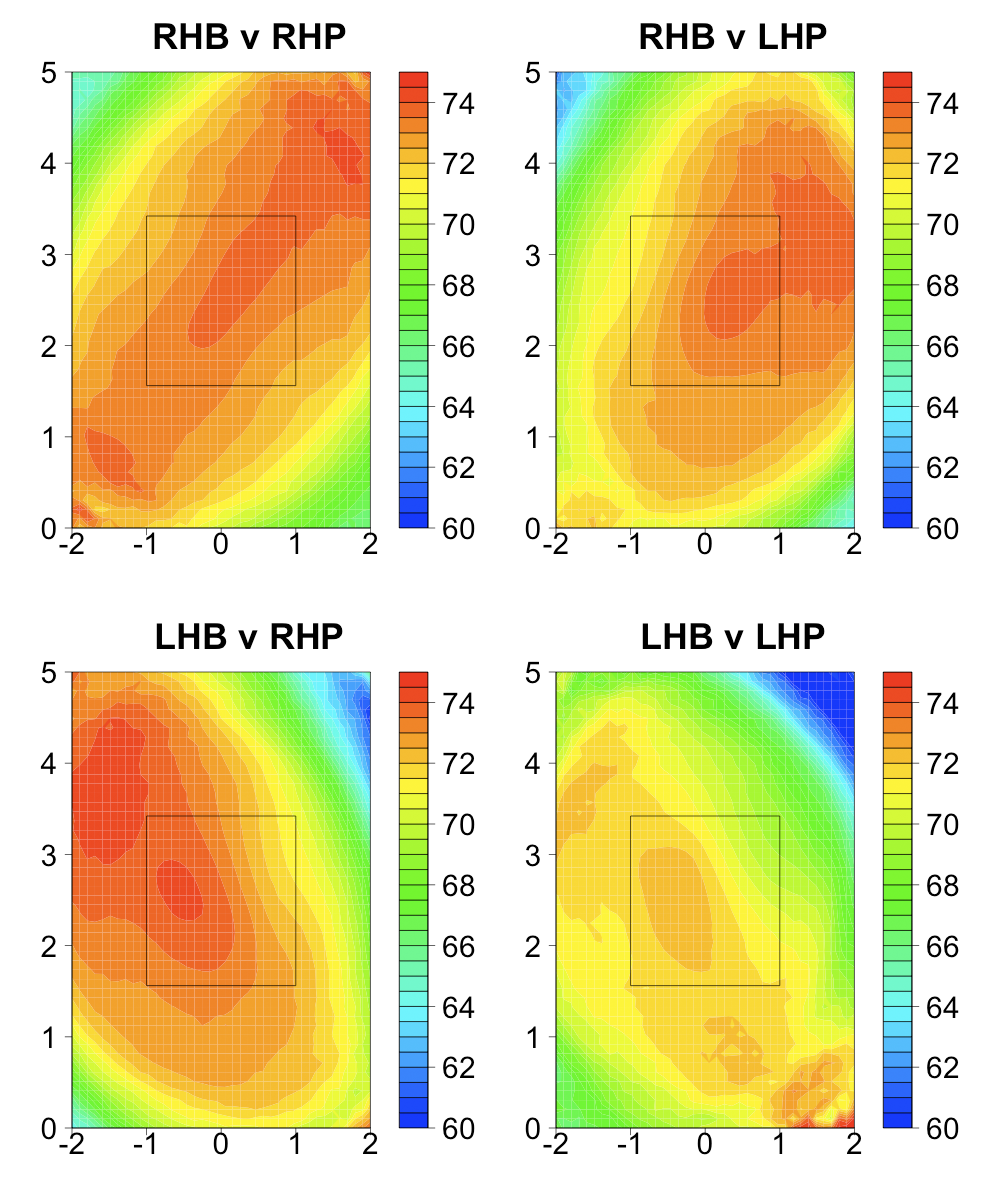
Wow, that is the opposite of my assumption. The peak speed is up-and-away, and far up-and-away. There is a large peak speed out of the strike zone. The area of high speed hits extends from up-and-away to down-and-in through the strike zone. This is actually the same trend we previously saw with the highest run value of contacted pitches. Remember this is just based on batted balls, so there could be something of a selection bias. Maybe the only pitches up-and-away that are swung at and hit get crushed. Still this result is very surprising to me.
Edit
Peter Jensen made the following comment:
I think you may want to choose actual SOB to graph instead of horizontal SOB. Balls hit with a greater vertical angle will have a smaller proportion of their speed as a horizontal component. A batter hitting a high inside fastball is almost forced to hit it in the air because he is hitting it during a portion of his swing where the bat angle has the head above the handle. That portion of the swing also is near the maximum swing speed so the batter will be trying to undercut the ball slightly to raise the vertical angle of the ball off the bat even more and maximize his distance and the possibility of a home run. So the batter is sacrificing horizontal speed off the bat to gain maximum hit ball distance
A batter hitting an outside high fastball. Will be doing just the opposite. His bat angle still has the head lower than the hands causing a lower vertical angle. Most batters should be trying to hit the ball as a line drive to the opposite field since their chances of hitting a home run a relatively small and a line drive to the opposite field maximizes their run value. It also lowers the overall vertical angle of the hit ball and maximizes the horizontal component of the total speed off the bat. That is why your second set of graphs look the way they do. Change from HSoB to SOB and they should look very different. Love the graph images by the way.
Here is the total speed off the bat by pitch location.
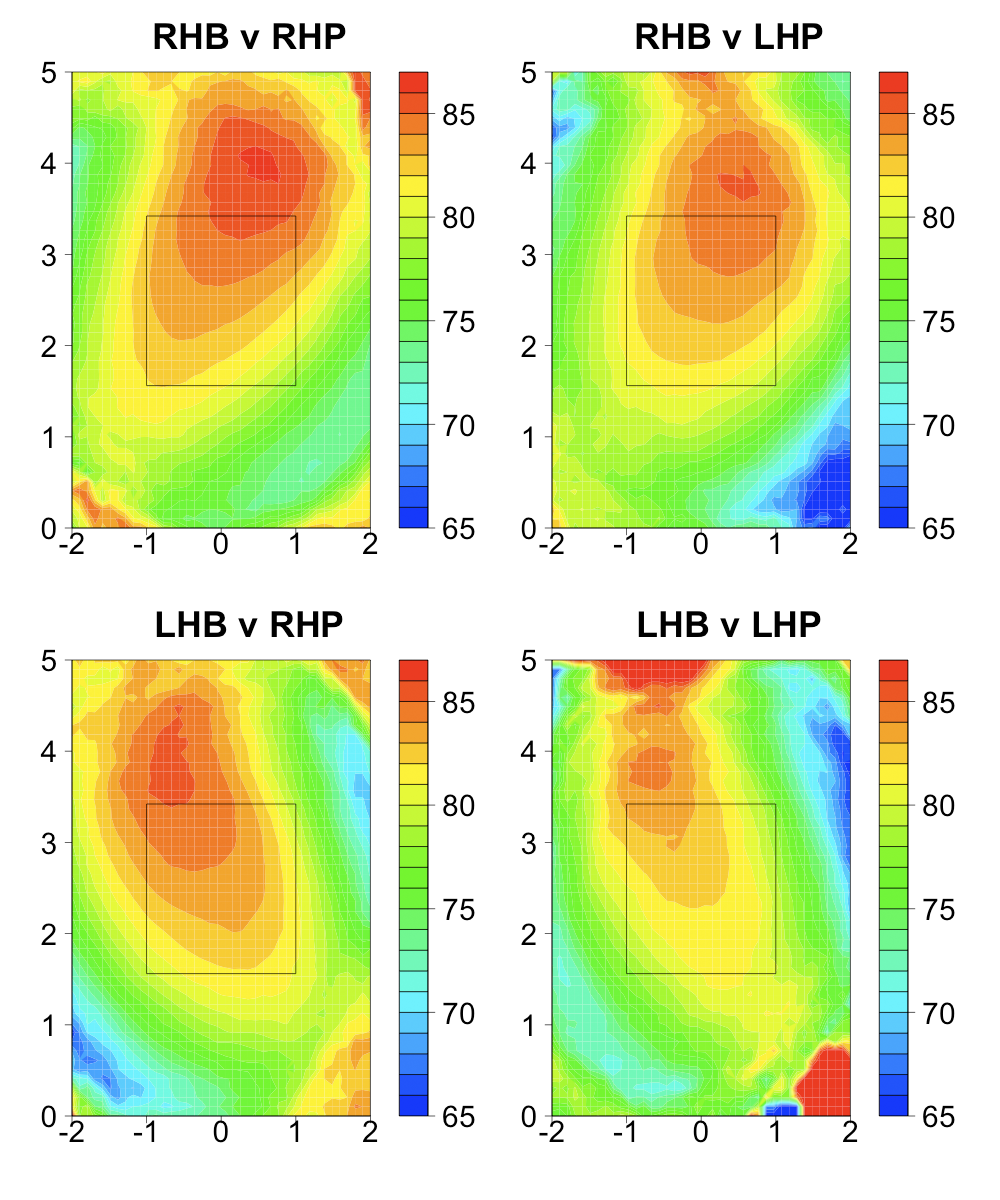
Just as Peter suggests this pulls the location of fastest balls off the bat closer to the batter and up. It is still slightly outside, but not far outside like before. The area of high horizontal speed hits down in the zone were, not surprisingly, slowish in total speed.
End of Edit
The next couple of weeks will be very exciting as this new wealth of data is examined. It affords a novel way to examine questions about baseball, and a potentially valuable tool to evaluate batters. If you have any general questions about the hitf/x data or any specific questions you think the data could answer feel free to post them in the comments. Also, make sure to check out Mike Fast's and Harry Pavlidis' early work with the data that I linked above.