Rich Lederer • Baseball Beat
Patrick Sullivan • Change-Up
Jeremy Greenhouse • Touching Bases
Dave Allen • F/X Visualizations
Sky Andrecheck • Behind the Scoreboard
Marc Hulet • Around the Minors
Al Doyle • Past Times
Retired Uniforms:
Bryan Smith • WTNY
Joe Sheehan • Command Post
Jeff Albert • The Batter's Eye
RSS Feed
Home
*Examining the Past, Present, and Future*
Lineup Card
Recent Entries
» Putting Together a Reality Team
» Historical Hall of Fame Vote Comparisons: 2012
» An All-Christmas Team
» The New-Look Angels
» John Denny: The Forgotten Cy Young Award Winner
» Money Isn't Everything
» What Would It Take to Hit .400 in the 21st Century?
» Halos Heaven
» Brandon McCarthy's Breakout Season
» Link-o-Rama
» Historical Hall of Fame Vote Comparisons: 2012
» An All-Christmas Team
» The New-Look Angels
» John Denny: The Forgotten Cy Young Award Winner
» Money Isn't Everything
» What Would It Take to Hit .400 in the 21st Century?
» Halos Heaven
» Brandon McCarthy's Breakout Season
» Link-o-Rama
Best of Baseball Beat
Abstracts From the Abstracts
1977 Baseball Abstract
1978 Baseball Abstract
1979 Baseball Abstract
1980 Baseball Abstract
1981 Baseball Abstract
1982 Baseball Abstract
1983 Baseball Abstract
1984 Baseball Abstract
1985 Baseball Abstract
1986 Baseball Abstract
1987 Baseball Abstract
1988 Baseball Abstract
1978 Baseball Abstract
1979 Baseball Abstract
1980 Baseball Abstract
1981 Baseball Abstract
1982 Baseball Abstract
1983 Baseball Abstract
1984 Baseball Abstract
1985 Baseball Abstract
1986 Baseball Abstract
1987 Baseball Abstract
1988 Baseball Abstract
Bert Blyleven Series
Meeting Up and Hanging Out with Bert
The Results Are In And...
Aficionado Heavily Invested in Blyleven
Latest on Blyleven's Chances for the HOF
The Internet Zealot Responds
400 Down and 5 to Go...
Bert Be Home By Eleven?
Blyleven's Forgotten Season (1973)
HeyMan, Your Comments Don't Hold Water
The Waiting is the Hardest Part
Another Addition to the Blyleven Series
Search for the Truth
As Dominant as His HOF Contemporaries
Listen, Buster
A Larger Step for Blyleven
Answering the Naysayers (Part Two)
Another Small Step for Blyleven
Q&A: Blyleven on the Twins
The Majority Rules, Right?
It's All Dutch to Some
The Hall of Fame Case for Bert Blyleven
Q&A: Blyleven on Felix Hernandez
Clemens Rocketing Up Charts
Poz: An Interview With a KC Star
A HOF Chat with Tracy Ringolsby
Up Close and Personal
A Peek Into the Mind of a HOF Voter
Answering the Naysayers
It's That Time of the Year (Again)
"If Cooperstown is Calling..."
The Bert Alert
One Small Step for Blyleven...
Only the Lonely
Exclusive Interviews
Lee Sinins
Alex Belth
David Pinto
Will Carroll
Mike Carminati
Aaron Gleeman
Joe Sheehan
Jay Jaffe
Jeff Peek
Tracy Ringolsby
Joe Posnanski
Bill James Part I, II, III
Jon Lalonde
Chuck Tiffany
Dayn Perry
Fay Vincent
Nate Silver
Alex Belth
David Pinto
Will Carroll
Mike Carminati
Aaron Gleeman
Joe Sheehan
Jay Jaffe
Jeff Peek
Tracy Ringolsby
Joe Posnanski
Bill James Part I, II, III
Jon Lalonde
Chuck Tiffany
Dayn Perry
Fay Vincent
Nate Silver
Bullpen
Rich Lederer
The Odd Couple (with Alex Belth)
The MostUnder Over Underrated Player in Baseball (with Brian Gunn)
Three Wise Men (roundtable by Alex Belth)
Infrequently Asked Questions (interview with Matt Welch)
Interview (Orioles Think Tank)
Bernie and the Yanks (Bronx Banter)
Hope and Faith: How the LAA Win the World Series (Baseball Prospectus)
NL West (The Soul of Baseball)
Greatest Living Hitter? (Sports Illustrated)
Roundtable: 2008 HOF Ballot (Armchair GM)
The Most
Three Wise Men (roundtable by Alex Belth)
Infrequently Asked Questions (interview with Matt Welch)
Interview (Orioles Think Tank)
Bernie and the Yanks (Bronx Banter)
Hope and Faith: How the LAA Win the World Series (Baseball Prospectus)
NL West (The Soul of Baseball)
Greatest Living Hitter? (Sports Illustrated)
Roundtable: 2008 HOF Ballot (Armchair GM)
Patrick Sullivan
Designated Hitters
David Bromberg (Q&A: John Denny)
Mark Armour (H. Killebrew and Versatility)
Joe Lederer (Soundtrack of a Prospect)
David Bromberg (Clemente's Autograph)
David Bromberg (Woody Fryman)
D. Baumstein (WAR Against Age: Pitchers)
Doug Baumstein (The WAR Against Age)
Doug Baumstein (A Lifetime on the Road)
John Fraser (Pick Six)
Mark Armour (How to Score More Runs?)
Bill Parker (What Opening Day Tells Us)
Stan Opdyke (Pat Rispole)
Chris Jaffe (Evaluating Baseball's Mgrs)
Stan Opdyke (Baseball Radio in NYC, 1953)
A. Nathan (Performance of Baseball Bats)
Michael Weddell (Edgar Martinez/HOF)
Jon Weisman (100 Things Dodgers Fans...)
Stan Opdyke (Connie Mack and Vin Scully)
Eric Walker (Evaluating Run Production)
Brent Mayne (The Intangibles of Catching)
Chris Moore (Best Fastballs in Baseball)
Dave Baldwin (The Batter’s Brain)
Shawn Haviland (Ivy League to MLB)
Larry Granillo (Walking Off)
Rob Iracane (Solo HR Won't Break You)
Tommy Bennett (Charm of AM Radio)
Harry Pavlidis (Johan Santana's Fast Start)
John Walsh (WAR and Remembrance)
Eric Walker (Precisely Inaccurate)
Bob Timmermann (As They See 'Em)
Geoff Young (Unicycles and Delusions)
Baseball Analysis at Tufts (Groundballers)
Baseball Analysis at Tufts (GB Out Rates)
G. Rybarczyk ('09 Hit Tracker Projections)
Joe Lederer (Curt Schilling/HoF)
Conor Gallagher (Hall of Fallacies)
Chris Green (Jim Rice, HoF, the Numbers)
Shawn Hoffman (Baseball's Bear Mkt?)
Paul Anthony (Manny Syndrome)
Ross Roley (World Series Odds)
B. Timmermann (Catcher's Interference)
R.J. Anderson (Waiting the Hardest Part)
Maury Brown (Cubs, MLB, and Cuban...)
Myron Logan (Dee-Fense, Dee-Fense)
Craig Calcaterra (Frivolity, Part I, Part II)
Chad Finn (Ode to Baseball Cards)
David Cameron (Mariners Foibles)
Chris Dial (Chipper Jones)
Pat Lederer (Memory Lane)
David Appelman (Clutch Pitching)
Bob Rittner (DH)
Jonathan Mayo (Roger Clemens)
Lisa Winston (My Son-in-Law...)
Russ McQueen (The Yellow Hammer)
Bob Rittner (I'm OK, You're OK)
Mark Armour (In Defense of the HOF)
Pat Jordan (Friends)
Dan Levitt (Analysis of Terry Ryan)
Doug Baumstein (Trading Econ 101)
Ross Roley (Runner's Reluctance II)
Ross Roley (Runner's Reluctance I)
Mark Armour (No-Longer Lovable Sox)
Bruce Regal (Stealthy and Wise)
Brian Gunn (Roid Monster)
Current/McEvoy (Value of the SB)
John Rickert (Sinister Thefts)
Nate Silver (Sabermetrics)
David Vincent (Home Run Production)
Joe P. Sheehan (Enhanced Gameday II)
Mark Armour (An Ode to Sport)
David Gassko (All-Time Worm Burners)
Joe P. Sheehan (Enhanced Gameday)
John Walsh (When Titans Clash)
Fox/Williams (Quantifying Coaches II)
Fox/Williams (Quantifying Coaches I)
Jacob Luft (Bull Durham Rant)
Chad Finn (Strat-O-Matic)
Lisa Winston (Rotisserie Baseball)
Dave Studeman (Baseball Stats)
Steve Treder (Roger Craig)
Marc Normandin (Jeff Bagwell)
D. Appelman (Expanding Strike Zone)
Jeff Sackmann (Worst MiL Defenders)
Jeff Sackmann (Best MiL Defenders)
Maxwell Kates (Van Lingle Mungo)
David Appelman (Pitch Location)
Kent Bonham (Danny Ray Herrera)
Glenn Stout (Two Baseball Poems)
Bruce Regal (The Challenge Round)
Mark Lamster (Barry & Ty)
Geoff Young (NL West)
Tom Lederer (The Ryan Express)
Brian Erts (Great Leap Forward)
David Pinto (Parity and the N.L.)
Jacob Luft (Fathers and Daughters)
Jamey Newberg (Pete's Sake)
Jeff Albert (A. Jones Swing Analysis)
Jeff Albert (A-Rod Swing Analysis)
Keith Law (Death, Taxes, and Waivers)
Peter Abraham (Tales of Torre Tales)
Larry Borowsky (Let 'er Rip II)
Dan Levitt (Empirical Analysis of Bunting)
Jonah Keri (If I Met Warren Cromartie...)
Bob Klapisch (War Stories)
Bob Timmermann (John F. Kennedy HS)
Kent Bonham (Aluminum Adjustments)
Al Doyle (More Than Superstars)
Ross Roley (Instant Replay)
David Vincent (Barry Bonds Homers)
Chad Finn (Our Favorite Obscurities)
Bill Deane (1979 NL MVP)
Mark Armour (Rise/Fall of Artificial Turf)
Jeff Angus (Wally Moon Camp)
David Berri (Money and Baseball)
Larry Borowsky (Baseball w/o the #s)
Derek Zumsteg (The Irrational Market)
David Regan (Free Agent Contracts)
Peter Schmuck (Steroids and the HOF)
David Appelman (Pitchers, Pitch by Pitch)
Dan Fox (Swinging, Taking, Fouling, Etc)
Patrick Sullivan (Study of NYY CF/BOS LF)
Will Leitch (Baseball Journalism)
Jeff Sullivan (Pitcher Release Points)
Steve Treder ('69-'70 Giants)
Maury Brown (Charlie Finley)
John Brattain (Bob Johnson)
Bob Klapisch (The Case for Bert Blyleven)
Jeff Peek (Pride and Prejudice)
Dayn Perry (Bert and Warren)
Rob Neyer (If Don Sutton Was Great...)
Lisa Winston (Minor League Memories)
Alex Belth (Otis Redding Was Right)
David Cameron (Long Live the King)
Jeff Angus (Baserunning Study)
Bert Blyleven (Baseball Playoffs)
Boyd Nation (Not a Prospect List)
James Click (Batters-Baserunners Study)
Jeff Shaw (Why I Love Baseball)
David Gassko (BIP/BFP Fielding Study)
Jay Jaffe (Milwaukee Sausage Race)
Jamey Newberg (Remember When)
Bob Klapisch (Press Box to the Mound)
Dan Levitt (Predictive Value of BB)
David Vincent (Official Scorer)
Jon Weisman (Rick Monday)
Larry Borowsky (Let 'er Rip)
Will Carroll (Fictional Short Story)
Bob Timmermann (Japanese Baseball)
Cyril Morong (Best Pitching Seasons)
Sean Forman (Monte Carlo Win-Loss)
Brian Gunn (My Little Blue Book)
Joe Lederer (My Dad and Baseball)
Bill Deane (Bob Gibson, 1968)
Mark Armour (1977 Yankees)
Darren Viola (Retrosheet)
David Pinto (RFK)
Dayn Perry (Brave Heart)
Matt Welch (Dave Hansen)
Kevin Kernan (Jack McKeon)
Tom Lederer (Dodgers Road Trip)
Steve Lombardi (Slider)
Studes (Picturing Baseball)
Mike Carminati (Luck of the Drawl)
Eric Neel (Vin Scully)
J.C. Bradbury (Leo Mazzone)
John Sickels (Bill James)
Search Baseball Analysts
Archives
By Category:
Around the Majors Content Only
Around the Minors Content Only
Baseball Beat Content Only
Baseball Beat/Change-Up Content Only
Baseball Beat/WTNY Content Only
Behind the Scoreboard Content Only
Change-Up Content Only
Change-Up/Around the Majors Content Only
Command Post Content Only
Crunching the Numbers Content Only
Designated Hitter Content Only
F/X Visualizations Content Only
Past Times Content Only
Saber Talk Content Only
The Batter's Eye Content Only
Touching Bases Content Only
Weekend Blog Content Only
WTNY Content Only
By Month:
February 2012
January 2012
December 2011
October 2011
September 2011
August 2011
July 2011
June 2011
May 2011
April 2011
March 2011
February 2011
January 2011
December 2010
November 2010
October 2010
September 2010
August 2010
July 2010
June 2010
May 2010
April 2010
March 2010
February 2010
January 2010
December 2009
November 2009
October 2009
September 2009
August 2009
July 2009
June 2009
May 2009
April 2009
March 2009
February 2009
January 2009
December 2008
November 2008
October 2008
September 2008
August 2008
July 2008
June 2008
May 2008
April 2008
March 2008
February 2008
January 2008
December 2007
November 2007
October 2007
September 2007
August 2007
July 2007
June 2007
May 2007
April 2007
March 2007
February 2007
January 2007
December 2006
November 2006
October 2006
September 2006
August 2006
July 2006
June 2006
May 2006
April 2006
March 2006
February 2006
January 2006
December 2005
November 2005
October 2005
September 2005
August 2005
July 2005
June 2005
May 2005
April 2005
March 2005
February 2005
January 2005
December 2004
November 2004
October 2004
September 2004
August 2004
July 2004
June 2004
May 2004
April 2004
March 2004
February 2004
January 2004
December 2003
November 2003
October 2003
September 2003
August 2003
July 2003
June 2003
Reference
Organizational Stats
Arizona Diamondbacks Bat / Pitch
Atlanta Braves Bat / Pitch
Baltimore Orioles Bat / Pitch
Boston Red Sox Bat / Pitch
Chicago Cubs Bat / Pitch
Chicago White Sox Bat / Pitch
Cincinnati Reds Bat / Pitch
Cleveland Indians Bat / Pitch
Colorado Rockies Bat / Pitch
Detroit Tigers Bat / Pitch
Florida Marlins Bat / Pitch
Houston Astros Bat / Pitch
Kansas City Royals Bat / Pitch
Los Angeles Angels Bat / Pitch
Los Angeles Dodgers Bat / Pitch
Milwaukee Brewers Bat / Pitch
Minnesota Twins Bat / Pitch
New York Mets Bat / Pitch
New York Yankees Bat / Pitch
Oakland Athletics Bat / Pitch
Philadelphia Phillies Bat / Pitch
Pittsburgh Pirates Bat / Pitch
St. Louis Cardinals Bat / Pitch
San Diego Padres Bat / Pitch
San Francisco Giants Bat / Pitch
Seattle Mariners Bat / Pitch
Tampa Bay Devil Rays Bat / Pitch
Texas Rangers Bat / Pitch
Toronto Blue Jays Bat / Pitch
Washington Nationals Bat / Pitch
All-Star Links
Official Websites
News and Notes
Baseball News Blog
Baseball Newstand
ESPN Baseball
Fox Sports Baseball
Pro Sports Daily
Roto World
The Roto Times
USA Today Baseball
Baseball Newstand
ESPN Baseball
Fox Sports Baseball
Pro Sports Daily
Roto World
The Roto Times
USA Today Baseball
Reference and Analysis
Baseball Almanac
Baseball America
Baseball Archive
Baseball Contracts
Baseball Cube
Baseball Graphs
Baseball Library
Baseball Musings Player Database
Baseball Page
Baseball Primer
Baseball Prospectus
Baseball Reference
Baseball Statistics
Baseball Truth
Boxscore Central
Diamond Mind Baseball
Doug's Stats
FanGraphs
Fast Balls (pitchfx catalog)
Hardball Dollars
Hardball Times
Hit Tracker
Retrosheet
Rotobase/Rotoblog
Stat Corner
STATS
Tango on Baseball
Yahoo Sports MLB
Web Gems
Bill James Primer
Sabermetric Manifesto (Grabiner)
Pitching and Defense (McCracken)
Pitching and Defense (Tippett)
Transactions Primer (Neyer)
Baseball Stats (Batter's Box)
Prospect Report (Cameron)
Pitcher Workloads (Sheehan)
Goodbye to Old Baseball Ideas (Rickey)
Sabermetric Manifesto (Grabiner)
Pitching and Defense (McCracken)
Pitching and Defense (Tippett)
Transactions Primer (Neyer)
Baseball Stats (Batter's Box)
Prospect Report (Cameron)
Pitcher Workloads (Sheehan)
Goodbye to Old Baseball Ideas (Rickey)
Columnists
Baseball Blogs
Around the Majors
Athletics Nation
Baseball Crank
Baseball Musings
Baseball-Reference Blog
Batter's Box
Big League Stew
Bronx Banter
Catfish Stew
Cub Town
Dan Agonistes
Dodger Thoughts
DRays Bay
Ducksnorts
Futility Infielder
Halos Heaven
Inside the Rockies
It Might Be Dangerous
Knuckle Curve
LoHud Yankees Blog
Lookout Landing
Management by Baseball
Metaforian
Metsgeek
Mike's Baseball Rants
Only Baseball Matters
Redbird Nation
Red Reporter
Sabernomics (Braves)
Seth Speaks
ShysterBall
6-4-2 (Angels/Dodgers)
The Book
TheCubdom
The Cutting Edge
The House That Dewey Built
The View From The Bleachers
Tiger Blog
U.S.S. Mariner
Viva El Birdos
Where's Kernan
Minor Leagues
Arizona Fall League
BA Player Finder
Cal Leaguers
Jamey Newberg
JDM's Scoresheet Baseball
Minor League Baseball
Minor League Park Factors
Minor League Splits
No Pepper
Sickels' Minor League Ball
Warm October Nights
BA Player Finder
Cal Leaguers
Jamey Newberg
JDM's Scoresheet Baseball
Minor League Baseball
Minor League Park Factors
Minor League Splits
No Pepper
Sickels' Minor League Ball
Warm October Nights
Amateur
Boyd's World (College)
Cape Cod Baseball League
College Baseball Blog
College Baseball Insider
Collegiate Baseball Newspaper
College Splits
College Splits Blog
Dirtbags Baseball (Long Beach State)
NCAA Baseball
NCBWA
Team One Baseball (High School)
Texas A&M & Baseball
Cape Cod Baseball League
College Baseball Blog
College Baseball Insider
Collegiate Baseball Newspaper
College Splits
College Splits Blog
Dirtbags Baseball (Long Beach State)
NCAA Baseball
NCBWA
Team One Baseball (High School)
Texas A&M & Baseball
Historical
Cuban Baseball
House of David
Jim "Mudcat" Grant's Web Page
Negro League Baseball Players Assoc
Negro Leagues Baseball Museum
1919 Black Sox
Pacific Coast League
Philadelphia Athletics Historical Society
Shoeless Joe Jackson Society
SABR-L Archives
Walter O'Malley
House of David
Jim "Mudcat" Grant's Web Page
Negro League Baseball Players Assoc
Negro Leagues Baseball Museum
1919 Black Sox
Pacific Coast League
Philadelphia Athletics Historical Society
Shoeless Joe Jackson Society
SABR-L Archives
Walter O'Malley
Miscellaneous
Forums
Credits
Ticket Center
Tickets to Baseball -
Premium Red Sox Tickets - Tickets to Marlins Games - Cardinals Game Tickets - NY Yankee Tickets - Tickets Oakland Athletics - Dallas Cowboys Tickets - Arizona Cardinals Tickets - Tickets Seattle Seahawks - Buffalo Bills Tickets Online - Tickets to Dolphins Football
Buy Boston Red Sox tickets,
Philadelphia Phillies tix,
NY Yankees tickets,
NY Mets tickets, and
MLB All Star game tickets at ABC tickets
Not sure where to find the best online sportsbooks? Start your search with PlayersJet.
Get deals at SportsMemorabilia.com on baseball apparel, including Phillies jerseys and more for adults and children.
Shop the largest selection baseball equipment on sale at Sports Unlimited. Check out tons of baseball gloves, youth baseball gloves and catchers gear from Rawlings, Wilson, Nike & Under Armour.
2011 Draft Order
Courtesy of Baseball America
First-Round:
 1. Pirates (57-105)
 2. Mariners (61-101)
 3. Diamondbacks (65-97)
 4. Orioles (66-96)
 5. Royals (67-95)
 6. Nationals (69-93)
 7. Diamondbacks (for B. Loux)
 8. Indians (69-93)
 9. Cubs (75-87)
10. Padres (for Karsten Whitson)
11. Astros (76-86)
12. Brewers (77-85)
13. Mets (79-83)
14. Marlins (80-82)
15. Brewers (for Dylan Covey)
16. Dodgers (80-82)
17. Angels (80-82)
18. Athletics (81-81)
19. Red Sox (from DET for Martinez)
20. Rockies (83-79)
21. Blue Jays (85-77)
22. Cardinals (86-76)
23. Nationals (from CWS for Dunn)
24. Rays (from BOS for Crawford)
25. Padres (90-72)
26. Red Sox (from TEX for Beltre)
27. Reds (91-71)
28. Braves (91-71)
29. Giants (92-70)
30. Twins (94-68)
31. Rays (from NYY for Soriano)
32. Rays (96-66)
33. Rangers (from PHI for Lee)
Supplemental First Round:
34. Nationals (Dunn)
35. Blue Jays (Downs)
36. Red Sox (Martinez)
37. Rangers (Lee)
38. Rays (Crawford)
39. Phillies (Werth)
40. Red Sox (Beltre)
41. Rays (Soriano)
42. Rays (Balfour)
43. Diamondbacks (LaRoche)
44. Mets (Feliciano)
45. Rockies (Dotel)
46. Blue Jays (Buck)
47. White Sox (Putz)
48. Padres (Garland)
49. Giants (Uribe)
50. Twins (Hudson)
51. Yankees (Vazquez)
52. Rays (Benoit)
53. Blue Jays (Olivo)
54. Padres (Torrealba)
55. Twins (Crain)
56. Rays (Choate)
57. Blue Jays (Gregg)
58. Padres (Correia)
59. Rays (Hawpe)
| Baseball Beat | July 31, 2006 |
All Things Dodgers (and Almost a Dodger)
I went to the Nationals-Dodgers game on Sunday. Los Angeles won 4-3 to sweep the three-game series with the Nats.
The attendance was reported at 43,346 even though it appeared as if there were somewhere between 23,000 and 33,000 fans on this sunny day. The 56,000-seat stadium looked about half full to me, which would suggest the middle point of my range. The freeways, parking lot, and concession stands were as light as I can recall in a long, long time.
The matchup of cellar-dwelling teams may have offered an excuse to stay home but perhaps the real reason was a Dodger lineup that featured an "Unknown" player batting fifth when the game started. The name on the right-field scoreboard was changed to "Betemit" before the newly acquired third baseman batted in the second inning.
Those fans in attendance are now quite familiar with Wilson Betemit. The 6-foot-3, 200-pound switch-hitter doubled twice and singled in his Dodger debut. He went 3-for-4 but didn't score or drive in a run.
The Dodgers scored their first three runs on solo homers by JD Drew, Andre Ethier, and Jose Cruz Jr. Drew and Ethier hit theirs back-to-back in the third and Cruz went yard as a pinch hitter in the seventh to tie the game. The fourth and decisive run was scored when James Loney and Cesar Izturis ripped consecutive doubles in the bottom of the eighth. Jonathan Broxton (2-0) picked up the win and Takashi Saito recorded his ninth save.
Broxton and Saito have combined to strike out 124 batters in 97 2/3 innings. The balance of the pitching staff has whiffed only 533 in 842 1/3 innings. Including their current setup man and closer, the Dodgers are 11th in the NL in Ks. Worse yet, LA is 15th in punchouts on the road and the starters are within 10 strikeouts of being in the cellar.
General Managers Jim Bowden and Ned Colletti apparently sat together during the game and discussed an Alfonso Soriano trade. Trading prized prospects for Soriano without locking him up to a longer-term deal at a reasonable price seems short-sighted to me, especially when the Dodgers are in greater need of a power pitcher who can take some pressure off the defense.
By the way, is it just me or has anyone else noticed that Frank McCourt and Jim Tracy are in last place while Paul DePodesta's new employer is in first place?
Congratulations to Chase Utley, who extended his hitting streak to 31 games on Sunday. The Phillies second baseman has now hit in more consecutive games than any other player this year.
I have a special affinity toward Utley. Chase and my son Joe played youth baseball for Long Beach Little League. Joe played on the Dodgers. Chase played for the Pirates. One of Chase's teammates was Sean Burroughs, who just may be the best Little League player ever. Joe and Chase are two years older than Sean and neither played on the LBLL All-Star teams that Burroughs spearheaded to World Championships in 1992 and 1993.
My son's team was coached by a real estate agent and me. The Pirates were coached by an attorney and Sean's dad, Jeff, the 1974 AL MVP. Needless to say, the Dodgers never beat the Pirates in those years. Jeff was a terrific coach and the Pirates had more talent than the rest of the league combined.
I can remember Utley's tryout like it was yesterday. You could tell that he was special. Everything Chase did stood out. He roped a handful of line drives from the right side, then crossed over the plate and repeated the same feat from the left side. The kid had star written all over him.
Utley prepped at Long Beach Poly High School (hitting .525 with 12 home runs his senior year in one of the toughest leagues in the country) and was selected by the Los Angeles Dodgers in the second round (76th overall) of the 1997 amateur draft. He turned down a large signing bonus from his hometown team, played three seasons at UCLA (earning All-American honors his junior year), and was taken by the Philadelphia Phillies in the first round (15th overall) in the 2000 draft. He signed that summer, hit over .300 in low-A, advanced to high-A in 2001 and triple-A in 2002. Utley tore up the International League the second time through in 2003 and got called up to the majors that summer.
The 6-foot-1, 185-pounder was one of the best-hitting middle infielders in 2005 and has become one of the best hitters period this year. A fan favorite, Utley's makeup is off the charts. He plays hard all the time, running out groundballs and hustling in the field and on the basepaths. Chase is well-liked and respected by his teammates, as well as those of us who were fortunate to witness his beginnings.
| Baseball Beat | July 29, 2006 |
A Mystery Solved
Is there a better baseball website than Retrosheet? Thanks to the miracle of Dave Smith's creation, I was able to identify the date--rather easily, I might add--of the following photo of my brother Tom (right) and me prior to an afternoon ballgame at Dodger Stadium.
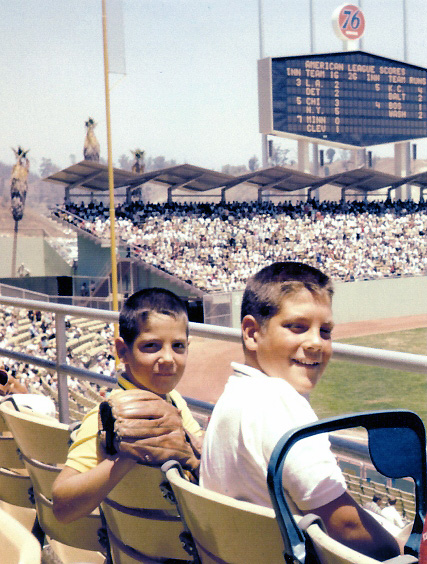
The date? July 29, 1962. Yes, this photograph was taken 44 years ago today by my Dad prior to a game between the Dodgers and Giants in the first year of the stadium that was also known as Chavez Ravine.
JFK was President. Richard Nixon, Kennedy's opponent in the 1960 election, would go on to lose the California governor's race in November. Lawrence of Arabia won an Oscar for Best Picture. Johnny Carson took over as host of the Tonight Show. Wilt Chamberlain of the Philadelphia Warriors scored 100 points against the New York Knicks in a single game. Sonny Liston knocked out Floyd Patterson in the first round to become World Heavyweight Champion. Arnold Palmer won two of golf's majors and Rod Laver became only the second man to capture the Grand Slam in tennis. Bob Feller and Jackie Robinson were voted into the Hall of Fame in their first year of eligibility.
The photo was snapped one week before the birth of Roger Clemens and the death of Marilyn Monroe. I had just turned seven earlier that month. My brother was ten. We spent many a Sunday in those days in Loge 149, Row A, Seats 1-4. It was our home away from home. (The Dodgers later moved our season tickets down a couple of aisles to Loge 153, Row A, Seats 1-4. But we didn't complain. They were free.)
For Dodger Stadium historians, note the yellow seats in the Loge section--the same color as the Field Box and the Pavilion. The grass was not particularly green and the outfield wall was a pale blue. Looking past the two cowlicks on my head, the left-field foul pole (which was mistakenly placed in foul territory that first year) and the Dodger bullpen can be seen to the right of several palm trees with brown drooping fronds in serious need of some tender loving care.
Oh, I almost forgot. Now, why am I so sure of the date, you ask? Well, the scoreboard above the left-field pavilion and below the Union Oil 76 sign tells it all.
The American League scores were on display at that moment. All ten teams were in action. In a sign of the times, there were three doubleheaders (signified by 1G and 2G). The Los Angeles Angels--not quite yet of Anaheim--and Detroit Tigers were deadlocked, 2-2, in the third inning of the first game of a doubleheader. The New York Yankees were beating the Chicago White Sox, 5-3, in the fifth. The Cleveland Indians were shutting out the Minnesota Twins, 1-0, in the seventh. The Kansas City Royals...err, Athletics...were leading the Baltimore Orioles, 4-2, in the fifth. And the Washington Nationals Senators were edging the Boston Red Sox (yes, your father's Red Sox), 2-1, in the fourth.
Going into this project, I suspected that the year was 1962. But I wasn't 100% sure. To satisfy my curiosity, I went to the home page of Retrosheet, clicked on Boxscores, then 1962, Los Angeles Dodgers, Game Log, and began searching various Sundays in the hope of finding the head-to-head contests as detailed on the scoreboard. Starting with April 15, I clicked on seven dates until I found the perfect match.
It was magical. I checked the line scores for every American League game first, making sure that they coincided with those on the scoreboard. Yes. Yes. Yes. Yes. Yes. Five-for-five.
Upon the realization that I had stumbled upon the actual date of the prized photo, I wanted to know who the Dodgers played and how they fared on that sunny day in Los Angeles. Lo and behold, the Dodgers beat the Giants that afternoon, 11-1. Maury Wills, Jim Gilliam, Willie Davis & Co. batted around in the first inning, scoring six runs while knocking out starter Billy O'Dell. Don Drysdale won his 19th game by limiting the team that Danny Kaye called the JINTS in his D-O-D-G-E-R-S song later that summer to six hits, no walks, and one run.
Here is an excerpt of Dad's game story, which appeared in the Long Beach Press-Telegram the following morning:
The sizzling Dodgers completed a three-game sweep by belting their immediate challengers, 11-1, Sunday, thereby taking a four-game edge into the second All-Star break. Not since 1955, when they won by 13 1/2 games, have the Dodgers enjoyed such a refreshing pause.
The one run the Giants scored was on a homer by Willie Mays. It was his 32nd of the season. While perusing the other line scores, I learned that Hank Aaron and Frank Robinson each slugged two HR playing head-to-head in Cincinnati, while future Hall of Famers Roberto Clemente, Brooks Robinson, and Billy Williams also clubbed long balls that day.
Furthermore, I noticed that Bob Gibson picked up his first and only save of the season and second of his career while giving up three hits and two runs in just one inning against the hapless New York Mets (who were 26-76 and 43 games back of the Dodgers before August rolled around). I also got a kick out of the fact that Juan Pizarro lost the first game and won the second game of a doubleheader against the Yankees. The southpaw started the opener and pitched just two-thirds of an inning, then came back in the nightcap and hurled 4 1/3 innings of scoreless relief.
As shown in the Standings At Close of Play of July 29, 1962, the Dodgers were leading the major leagues in runs scored and the Yankees in fewest runs allowed. Did I get that backwards? Nope. That's not a typo. Oh sure, the Dodgers could pitch and the Yankees could hit. Don Drysdale won the Cy Young Award with a 25-9 record and a 2.83 ERA while leading the majors in strikeouts with 232. Sandy Koufax led the NL in ERA (2.54), H/9 (6.54), WHIP (1.04), and K/9 (10.6). Conversely, Mickey Mantle won the AL MVP, finishing second in AVG (.321) and first in OBP (.486), SLG (.605), and BB (122).
But the Dodgers had a potent lineup that year. Tommy Davis led MLB in batting average (.346), hits (230), and RBI (153). Maury Wills, the NL's MVP, broke Ty Cobb's 47-year-old record by stealing 104 bases. He was only thrown out 13 times all year. Maury also led the big leagues in games played with 165. Ahh, yes, 165.
The Dodgers and Giants finished the regular season with identical records of 101 wins and 61 losses. They met in a best-of-three playoff series in October and the Giants prevailed two games to one, thereby winning the National League pennant. The stats from the playoffs counted so Wills was credited with playing in a total of 165 games that year.
The Giants faced the Yankees in the World Series and lost in seven games. MVP Ralph Terry threw a four-hit shutout in the decisive game for his second victory of the series. Nursing a 1-0 lead in the bottom of the ninth with two outs and runners on second and third, Terry got Willie McCovey to line out to second baseman Bobby Richardson to end the game and the series. Some say that if the ball had been hit a half-foot higher, it may have left the ballpark and the Giants--rather than the Yankees--would have been crowned World Champs.
The 1962 season is coming back so clearly to me now. Thank you Kodak. Thank you Retrosheet.
| Designated Hitter | July 27, 2006 |
Tales of Torre Tales
This is perhaps the only baseball story you will ever read that starts out with a snake.
Texas left-hander Kameron Loe has a pet boa constrictor named Angel. It's seven feet long and he brings it to Ameriquest Field on occasion and lets it slither around the infield grass.
The Yankees were in town on May 5 and there was this huge snake, sunning itself in foul territory as the Yankee beat writers set up in the press box.
I'm new to the Yankees this season, having spent the previous four seasons in sports journalism purgatory with the Mets. After covering the Machiavellian Bobby Valentine, somnambulant Art Howe and the inexplicably angry Willie Randolph, I had found Joe Torre to be a refreshing change.
I didn't know him well after a few months but he seemed like a reasonable, intelligent person who didn't mind dealing with the media. On some days he even seemed to enjoy it.
Most impressive was his archive of anecdotes. Name a player or ask a question about a certain play in a game and Torre had a story to tell. Most refer back to his days as a player with the Braves and Cardinals. Or when he managed the Mets.
In spring training, he had the group of us in stitches telling a story about Atlanta's traveling secretary, who happened to be a dwarf. When he checked the team into a hotel, Clete Boyer used to give him a boost so he could talk to the clerk at the front desk.
But snakes? Now there seemed a challenge.
"Think Joe has a story about snakes?" I asked Sam Borden from The Daily News as we watched this Angel in the infield.
"Oh, sure," he said. "I'll ask him."
When we finished with our baseball questions before the game, Sam told Torre about Loe's pet and asked him what he thought about snakes.
Twenty-nine other managers would have looked at Sam and said "what the hell are you asking me about snakes for?" Randolph, I'm quite sure, would have rolled his eyes and complained about having been asked such a question.
Joe smiled and launched into a story about the time he went on a USO Tour of Vietnam and somebody draped a snake around his neck and had him pose for a photograph.
"Damned thing nearly choked me to death," he said.
Everybody laughed.
Once having had a snake around your neck doesn't make you a good manager. But being able to tell that story does.
I get e-mails and comments on my blog every day questioning the moves Torre makes. How he handles his bullpen. His love of veteran players over better-suited reserves. His abuse of catcher Jorge Posada. If you ask some Yankee fans, he's an idiot and they can prove it. The four titles were the result of a high payroll, they contend. The Yankees have won in spite of him.
If you ask me, they just don't get it.
Baseball is nine months of work. You report to spring training in February and the best teams finish up in October. Being able to crunch the numbers is great. But being able to take pressure off your players and create an atmosphere where people enjoy coming to the park is more important. In New York, it's paramount.
Torre has an almost singular talent of saying the right thing at the right time. When Randy Johnson was struggling in the spring, the manager lowered expectations, deflecting some of the heat away from Johnson. The Big Unit has since rebounded.
In early May, when Alex Rodriguez was briefly dropped to fifth in the batting order, Torre sold it as a clerical error that ended up working out. It saved Rodriguez from several rounds of questions about a slump he was enduring at the time. He went on to be the American League player of the month.
When Bernie Williams was ejected from a game for the first time in his career, Torre came back with a story about the time he was once ejected while standing on third base.
He and Nick Colosi got into it over a comment Torre had made in the papers about the umpires. "I finally told him to f--- off," Torre said. "Son of a bitch threw me out, too."
Made what Bernie did seem not so bad.
There are 10 reporters who travel with the Yankees: Eight from newspapers, one from MLB.com and another from WFAN radio. All are pretty sharp. If motivated, we could make trouble and plenty of times, we do just that.
Every paper also has a platoon of columnists and sidebar writers. Throw in the local television stations, floaters from suburban papers and national writers and a typical home game can attract a few hundred of us.
But Torre has learned how to make the media madness work for him. He anticipates the questions, defuses the controversies and lessens the pain for his players.
A computer can predict for you how often Player X will get a hit against a certain left-handed pitcher with two runners on base. But it can't tell you how the same player will perform after reading for three days what a stiff he is and should be traded.
How do you put a value on that? I don't know. But there is great value in it, especially in a market like New York.
Torre has his quirks. Unless it is pouring rain, his pre-game meeting with the media is held in the dugout. Be it roasting hot or cold enough to chatter your teeth, Torre does his media duties from the dugout.
A few minutes into the interview, as if on cue, one of the clubhouse attendants brings him a cup of green tea. If it's a warm day, it's iced tea.
The session is an egalitarian affair. No matter who you are, you're allowed to worm your way through the crowd and ask a question. From Mike Lupica to stargazing fan-boys from weekly papers, Torre takes on all comers.
But Torre has no time for ESPN. He believes they hammered too much on Roger Clemens for throwing the piece of bat at Mike Piazza during the 2000 World Series. So he doesn't yuck it up with Chris Berman or pop up on SportsCenter. He growls a few words when one of their reporters asks a question, then invariably makes some kind of remark when they walk away.
He also doesn't much like questions about how he uses his bullpen, unless it's from a beat writer. One of the backup writers from the New York Times questioned his use of Mariano Rivera in the ninth inning of a tied game a few weeks ago and Torre's response was "You been around much?"
Torre glared at the guy as he answered and kept glaring through the next question, which was asked by somebody else about another subject.
Dom Amore of the Hartford Courant has been around Torre a while and warned me in spring training about not acting too familiar with him. Torre likes writers, like players, to pay their dues. Show up and act like you know the deal and he'll freeze you out.
You won't get called by your first name for four or five seasons. He's not going to pretend he knows you until he actually does. There's no phony sentiment, which some managers try. It invariably fails. Reporters are trained to sniff out phonies.
Torre, in many ways, is a 1950s man transported to modern times. He likes the horses, Frank Sinatra, a good cigar and a nice drink with a big dinner. You'll find the Daily Racing Form open on his desk before you will Baseball America.
For a man who has his assistant answer his e-mail because he's not much for computers, Torre understands the media machine better than any consultant you can find. He knows the value of admitting to bad news and moving on, making it a one-day story instead of three or four.
The attraction of the Yankees is their popularity. Denying that would be foolish, so embrace it. Invite everybody to the dugout to ask his or her questions and control the story instead of letting it control you.
Even if two wise guys decide to see what you have to say about snakes.
Peter Abraham covers the Yankees for The Journal News of White Plains, N.Y. He has been with the paper since 1999. Before that, he covered another memorable coach, Jim Calhoun at the University of Connecticut.
| WTNY | July 26, 2006 |
Short Stocks
Short-season baseball. A hodgepodge of good college players, learning high school players, foreign players of every background. Age differences can run up to about 6 years - wood bat experience about the same.
For these reasons, judging short-season baseball has always been a torment to me. It's hard to get a good handle on players when you have very little context about what it means that they're doing. However, any dismissal of short-season baseball means you don't see Anibal Sanchez or Radhammes Liz coming, when everyone else did.
As of yet I have no great way to add context to short-season numbers, but I think it's best to pull players into categories they fit in, and evaluate them there. College players in short-season ball are evaluated separate from the high school players of the same caliber. Players who spent their springs in extended spring training get grouped into one as well.
Looking at the leaderboards and through the box scores of short-season leagues with this mindset, certain players start to jump out. Here's a list I have of players impressing in their non-impressive leagues this summer ...
Removed From Aluminum
We expect big things from the college crop at this level, as we would if they started next season in low-A. And most of the time, they deliver - short-season leaderboards are littered with college players, some just organizational guys drafted after the 20th round. Looking at the leaderboards, you then have to pick a player who has completely distinguished himself from those around him.
When Evan Longoria left the New York-Penn League, the home run race suddenly became a one man show. Yesterday, we talked about how Warren McFadden is benefitting in the Cape Cod League from no longer playing in Tulane's AAA stadium. The same is now happening for Mark Hamilton, who has twice as many home runs as the nearest slugger. Readers will know that I've long loved Hamilton, and that his stock really jumped for me when I found out he was hitting .245/.383/.592 on Friday nights in college. The Cards will probably jump Hamilton to high-A next season, but as long as the strikeouts don't bring him down, Hamilton should rise quickly. I still don't believe he slipped through the second round.
I'll go with an atypical selection for my pitcher in this category: Steve Uhlmansiek. Unlike Hamilton, Uhlmansiek wasn't playing in college baseball as of two months ago, nor even 14 months ago. But the Mariner southpaw was once Mike Pelfrey's ace-teammate at Wichita State, and Seattle drafted him knowing he had to be healed first. The road to recovery from arm surgery is a long one, so his performance thus far is just a stepping stone. But after spending two years forgotten about as a prospect, Uhlmansiek belongs in the discussion once again.
On Their Own For the First Time
The Oakland A's have appeared very focused on appearing less dogmatic in their drafting ways since Moneyball. That included drafting three high school pitchers in the high rounds in 2005, a group that has looked less than impressive in their first professional season. This season, they went the high school route early again, drafting high school slugger Matt Sulentic in the third round.
In addition to his high draft status, Sulentic also was aggressively promoted to the Northwest League, the higher of the A's two short-season affiliates. And unsurprisingly to Billy Beane and co., Sulentic has matched every challenge. Sulentic has a hit in each of his last six games, where he's collected five extra base hits and five walks. His .355 average is near the top of the NWL leaderboard - a remarkable feat for someone yet to turn 19.
Pitchers at this age are far more coddled by their organizations, making a selection here a little more difficult. Clayton Kershaw is a possibility, but the first high school pitcher should dominate the Gulf Coast League. I almost went with Sean O'Sullivan, who doesn't really fit the bill. But the year's top draft-and-follow is making another Angels investment look good.
Instead, we'll go with Jeremy Jeffress, who has proven that not every high school flame-thrower is raw. The Virginia right-hander touched the high 90s during the showcase circuit, making teams forget about his small 6-0 frame. Now, his performance on the mound is living up to those velocity readings. Jeffress hasn't allowed a run in his last three outings, and in those 11.2 innings, he's allowed 3 hits, 4 walks and struck out 12 batters. Suddenly, the Brewers pitching crop (Yovani Gallardo, Mark Rogers, Will Inman, Jeffress) is starting to look pretty impressive.
Making Up for Lost Time
Bonus babies need to be delicately taken care of, and as a result, many teams are now giving their high profile draftees a year wait to make their full-season debut. Instead, the player spends his spring in extended spring training, and his summer in short-season ball. The thinking is that a player learns how to be on his own in a controlled environment, while also setting up a player for better success in his first season.
One organization seeing a lot of positive feedback from this strategy is the Tampa Bay Devil Rays. Two of the Midwest League's best arms, Wade Davis and Jacob Magee, are both high school draftees who spent their 2005 seasons dominating the NYPL. Given their success, the team had little reservations about making Jeremy Hellickson wait to debut in full-season ball.
And again, the results are looking good, as Hellickson is leading the New York-Penn League in strikeouts with 38. Another small right-hander, Hellickson throws three good pitches - and offers plus pitchability. He'll have to sharpen his breaking pitch going forward to become an elite arm, but he's the most polished of the Davis-Magee-Hellickson bunch.
There was little competition for what hitter would win this award, because as dominating as Mark Hamilton has been on his home run race, Chris Carter has been better. Seemingly the sports world's most popular name, Carter is neither the old Vikings receiver of the Arizona Diamondbacks' AAA slugger. Instead, Carter was a higher round pick from Las Vegas by the White Sox last season that disappointed when they tried him in the South Atlantic League this season.
After his bad full-season trial, the team quickly pulled him, assigning him to extended spring training immediately. It's thought that he blossomed here, as Carter now has 10 home runs in the Pioneer League - the next closest number is five. While he's limited to first base and doesn't walk enough, players with Carter's type of power are few and far between. You can bet that now the Kannapolis Intimidators are desperately awaiting Carter's arrival.
Many other players would have fit this category, including a host of Angel prospects. Ryan Mount has been fantastic in Carter's shadow in the Pioneer League, and his presence up the middle makes him a better prospect. And the Angels drafted Trevor Bell before Mount, and Bell is near the league's top ERA mark.
| WTNY | July 25, 2006 |
Working Through Wood
It should be no surprise that when you put wooden bats in the hands of aluminum-ready college hitters, they struggle. It's a pitching dream to make this 180, but an offensive nightmare.
However, despite depressed numbers, there is nothing better for a college player to spend his summer enduring the tribulations of using wood. Scouts flock to these leagues, trying to project how a player will handle the full-time switch. Some players see their stocks fly through the roof in these situations; other players watch their draft status fall.
No league is better in this regard than the Cape Cod League, which annually produces more top-round college talent than any summer destination. And even where the best of the best flock, struggles with wood follow. Twenty hitters drafted in the first five rounds of the 2006 draft spent their previous summer in the Cape; the group produced an aggregate .745 OPS.
We're nearing the end of the regular season in this year's version of the Cape, so it's time to look at potential names to add onto 2007 follow lists. While we'll save the pitchers for another day, here's my position breakdown of the best seasons/prospects that should be available for the 2007 draft.
Catcher
Starting at the top, we have Matt Wieters, who I previously stated as the top-ranked player for the 2007 draft. While Vanderbilt ace David Price is riding an impressive scoreless streak for Team USA, things have not changed as Wieters has produced substantially in his first Cape Cod League summer. The Georgia Tech catcher, who I previously mentioned would be the tallest in Major League history (or near the top), is hitting .329/.447/.529 this summer. Wieters was fantastic in the collegiate postseason, and if he continues on his current path, should be a top-3 pick next June.
Another catcher enjoying a strong summer is Josh Donaldson, from Auburn, who splits his time between behind the plate and the hot corner. Donaldson did throw out 38% of baserunners in his sophomore campaign, however, so don't be surprised if teams take him with the intention of making a full-time catcher out of him. With his current summer in the Cape Cod League, where he's hitting .320/.393/.524, teams won't have reservations playing him anywhere. The other player to watch at the position is Mitch Canham, champion Oregon State's backstop. This summer, Canham is hitting .344/.446/.492 following a good experience in Omaha.
First Base
There's a small crop on the right side this season, as only one name really sticks out as a potential high-round 2007 draftee: Matt Rizzotti. Despite playing at a small school, Manhattan, Rizzotti is enjoying his second good summer in the Cape. Scouts have seen enough of the first baseman to think highly of him. This summer, he's currently hitting .236/.401/.377, showing a lot of patience, a good amount of hitting ability, and a workable amount of power. Behind Rizzotti, there's very little, as only non-high tier prospects Mitch Moreland (Mississippi State) and Jordan Pacheco (New Mexico) moderately stick out.
Second Base
Clemson remained atop national rankings all season thanks to a fantastic offense that had no leader, but a high, high number of contributors. One of the better hitters for the Tigers was Taylor Harbin, who is continuing his good offensive production in the Cape. Harbin impressed often on television during the postseason, and scouts have high opinions of the second baseman, as well. Harbin doesn't have fantastic patience, but has a good amount of pop, all of which can be seen from his current .271/.304/.396 line.
Speed usually dominates this position, and a couple of other players find their way here because of their legs. Eric Farris is diminutive and offers very little pop, but his speed and patience should find him drafted next season. He's currently 10/12 on the bases in the Cape while hitting .344/.417/.406. Jeffrey Rea has not been as good at the plate or on the bases, but the Mississippi State middle infielder is the better prospect of the two. Rea will actually be a senior next season, so the leverage a team good have on him could yield a decent middle-round selection. This summer, Rea is hitting .293/.404/.358 with eight steals.
Shortstop
Surprisingly, the first position on the defensive spectrum has very few good players this summer, as many of the better players on this position currently play for Team USA. That leaves the best shortstop as Michael Fisher, another Georgia Tech player, which shows the reason for their big 2006 offense. Fisher's ability to play multiple positions might be his most attractive trait, because his bat has struggled a bit. This summer has been just OK, as Fisher is hitting .246/.342/.348. Another player to watch is Andrew Romine, from Arizona State, who didn't play often this spring due to returning from a scary blood clots surgery. Romine has all types of talent, but has yet to really put them on the field. He's a sleeper to look out for.
Third base
There's a couple players at the hot corner who stick out for me: Josh Satin (California) and Matt Mangini (Oklahoma State). The latter player is transferring there from N.C. State, where he made headlines with a huge start this spring. Mangini went on to have a decent second half, but his numbers remained solid. Teaming with Corey Brown next season, the Cowboys should have one of the nation's better 1-2 punches.
California looked to have a good 1-2 punch in Chris Errecart and Brennan Boesch at the beginning of the spring, but the two struggled, and Josh Satin emerged as one of the team's best hitters. His arrival has been prolonged this summer, as Satin seems to be upping his status to a top-3 rounder for next June. This summer, the Bear is hitting .262/.373/.346, and while the numbers don't look impressive, he's doing just enough to impress scouts.
Another player worth mentioning is Matt Cusick, the third baseman for USC. While Cusick offers nothing in the way of power, he's a good defender at third base and has great on-base skills. Rich Lederer has compared him to Bill Mueller. The comparison seems to be holding up in Cusick's wood bat trial, as he's hitting a defensible .283/.408/.349 on the summer. Teams will be scared off by his lack of power, but he should make the organization that gobbles him up in the middle rounds very happy.
Outfield
This is another position experiencing a weaker year than many in the past, as only a few players look to be solid, bona fide selections in next year's draft. One of them is Warren McFadden, who hit well in his redshirt freshman season with Tulane, smacking more than 20 doubles. The move from a Triple-A park to the Cape has gone well, some of those doubles have gone for homers, and McFadden's .270/.366/.487 line looks solid.
All Michael Taylor, of Stanford, needs to do is to convince the scouts that some of his tools will convert once he makes the full-time switch to wooden bats. So far, so good, as Taylor has impressed this summer. His patience remains an obstacle, as he has just a .287 OBP in the Cape, but his .197 ISO is one of the better numbers we have to report. Taylor runs well and hits for power, a combination that almost always yields a higher pick.
Colin Cowgill had a big breakthrough year with Kentucky in 2006, and has had a decent-enough summer to keep some dreams alive for next year's draft. His .232/.308/.379 line could certainly use some sprucing up, but a recent hot streak should do wonders for his stock. Also, keep an eye out for Tyler Henley, an outfielder from Rice. In the midst of a pretty big summer, .234/.390/.453, Henley could be getting the breakthrough he needs for a high selection.
As mentioned, next time around we'll look at the pitchers...
| Baseball Beat | July 24, 2006 |
Q&A: Bert Blyleven on the Twins
Bert Blyleven played for five different teams, covering 22 seasons during the 1970s, 1980s, and early 1990s. He was drafted by the Minnesota Twins out of high school in 1969 and made his major-league debut exactly one year later at the tender age of 19, beating the Washington Senators 2-1 at Robert F. Kennedy Stadium.
The man who would go on to win 287 games (17th most since 1900), strike out 3,701 batters (5th highest of all-time), and hurl 60 shutouts (9th most ever) is now in his 11th season as the color analyst for the Twins. He has been playing or announcing in the big leagues for four decades, spanning a total of more than 5,000 games (including over 3,000 under the employ of the Twins).
I caught up with Bert while the Twins were on the road in Cleveland this past weekend to get a handle on the hottest team in baseball. Minnesota has won nine of its last 10 games and 31 of its last 39. The only dry spell was right before and after the All-Star break when the team lost four of five.
Rich: Hi, Bert. Thank you for taking the time today to talk about your favorite team: the Minnesota Twins.
Bert: Thank you, Rich, for asking me to do this with you.
Rich: The Twins have the sixth-best record in all of baseball, yet find themselves in third place in the AL Central, 9 1/2 games back. Climbing over two teams to win the division is going to be tough and, last time I looked, MLB still only allows one Wild Card team per league. Close but no cigar. . .or do you think these guys could be smoking some good Cubans amidst the free-flowing champagne in the clubhouse in October?
Bert: A Major League baseball season is always a roller coaster ride. With 162 games to play a lot of things happen over the six months. The Twins started the season with a poor April while Detroit and Chicago started off hot. The cigar will have to wait until they start winning within their own division. Currently the Twins are 14-22 within their division as they start a three-game series in Chicago before heading home to face Detroit.
Rich: At 37-11, Minnesota has the best home record in all of baseball. But at 19-30, the Twins have the sixth-fewest number of wins on the road. It's typical for teams to play better at home than away but my goodness. . .
Bert: The Twins have been unbelievable at the Metrodome. I have always said that if a team can play .500 on the road and win at home that they should be in the race in late September. Eleven games under .500 on the road will have to improve if the Twins want a stiff of that cigar in October.
Rich: Stepping back for a moment, the Twins won a couple of World Series in 1987 and 1991. I bet you might even remember that first one.
Bert: As in 1987 and 1991, the key to any team winning their division is pitching and solid defense. In 1987, the Twins had a great bullpen that helped them get to the World Series and the defense was very consistent. In 1991, the key was their starting staff along with a good bullpen. Also those two teams had very consistent offenses with some power. The key for this year's Twins team is the starters because the bullpen might be the best in baseball. The starters have to be more consistent to allow this team to stay in games.
Rich: We're going to talk about the team's starting staff and bullpen in a bit more detail, but I'd like to review the team's recent history first. After hoisting two world championship banners in five years, the franchise then hit the skids, going eight seasons (from 1993-2000) without a .500 record. What happened?
Bert: Minnesota is known as a small-market team so when they lose key players through trades or free agency, they depend on their minor-league system to develop players for the Majors. The strength of any consistent organization is the young players and if they don't come up and produce it reflects in the standings. As the Twins did in the late '70s and early '80s, it sometimes takes time to develop a team that can work together to build a Championship team.
Rich: The Twins turned things around in 2001 and have played better than .500 ball every year since, including winning division titles and 90 or more games three times.
Bert: That's what I mean. Starting in 1999 you saw these names in the Twins lineup: Hunter, Lawton, Jones, Koskie, Mientkiewicz, Pierzynski, Guzman, Rivas. The pitching staff was young with Mays, Milton, Radke, Redman, Guardado, Hawkins and Romero. The Twins also had some veterans on this 1999 team but mainly these players, under manager Tom Kelly, learned to play together as a team. They took their lumps and finished the season with a 63-97 record. Three years later, with almost the same cast of players, they finished the 2002 season with a 94-67 record and went to the post-season for the first time since 1991.
Rich: Looking to the here and now, the team has a couple of big series this week vs. the White Sox and Tigers. Do you think the Twins need to win at least two out of three in each case to have a legitimate shot at winning the division or earning a Wild Card spot?
Bert: This year's Twins players are now going to face their biggest challenge. They are now starting to play teams within their division and they have to win series. It's not a matter of sweeping series but winning the series, two of three or three of four. They cannot afford to be swept in a series from here on out.
Rich: Let's talk about that pitching. Minnesota leads the AL in strikeouts while giving up the fewest walks. That's a pretty impressive combination.
Bert: Pitching is always the key to a team's success. The Twins have two starters in their rotation--Santana and Liriano--that strike players out. The other starters like Radke, Silva, and now Baker are control-type pitchers. They may give up more hits then innings pitched but this staff doesn't beat itself with walks. Then you look at the bullpen and you see relievers that throw gas like Rincon, Crain, Nathan and the newest member of the bullpen Pat Neshek. Even Dennys Reyes is doing a great job as the only lefty in the pen. This bullpen is the best in baseball.
Rich: Neshek has a lot of supporters among bloggers who follow the team closely. I know they were glad that the Twins finally called him up. I mean, this kid has had a history of doing nothing but getting batters out.
Bert: Pat's time will come. He has a funky delivery with an explosive fastball with a lot of movement. The Twins will let him get his feet wet first before throwing the rest of him into the water.
Rich: The starting staff has just one complete game thus far. You averaged 14 per year with your two stints with the team. What is the biggest difference between then and now?
Bert: Complete games are a thing in the past. Starters are usually asked to go seven innings and the bullpen will take it from there. This is why in today's game you see some teams carrying 12 or 13 pitchers. Starters are on pitch counts today and I'm still waiting for the first pitcher to "blow up" throwing his 101st pitch. I am not a believer in pitch counts, but I'm from a different era. Pitchers today are role pitchers rather then complete pitchers back in the "old days."
Rich: Francisco Liriano has been a pretty good role pitcher this year. Have you ever seen a more impressive rookie than him?
Bert: Liriano is probably the key player that has helped get the Twins back into the race. He is currently 12-2 with a Major League leading 1.93 earned run average. He has helped stabilize the starting rotation even though he is only 22 years old. Bet the Giants would like this guy back.
Rich: Liriano, Joe Nathan, and Boof Bonser for AJ Pierzynski and cash. Is that the biggest heist of all time or what?
Bert: What a trade Terry Ryan, the General Manager of the Twins, and his scouting staff did to pull off this one. Pierzynski for three pitchers that will be in the Twins system for years to come. Sometimes the baseball scouts don't get enough credit for the success in an organization, but they are huge.
Rich: Liriano has got to be the best young pitcher in baseball right now.
Bert: Hopefully, he can stay healthy as baseball is seeing a lot of young arms develop this season. It's an exciting time in baseball because of these young guns throughout both leagues.
Rich: Speaking of which, name a few young pitchers and hitters that have made you sit up and take notice this year.
Bert: Of course, you have to look at Detroit. Justin Verlander and Joel Zumaya are having a huge impact on this team's success. Jon Papelbon with Boston is a great story with him taking over the closer role and leading the league in saves. Looks like Eric Bedard of the Orioles is coming into his own. Bobby Jenks is doing his thing for the White Sox. On the hitting side, the story has to be Joe Mauer. Can he hit .400 and can a catcher win the batting title for the first time in the American League? In the National League, it's Freddy Sanchez of the Pirates. Getting his first chance to play every day, he is leading the league in hitting. And even though he's a veteran, how about the job Nomar Garciaparra is doing for the Dodgers? He has really helped the young Dodgers stay close in the National League Western Division. Brandon Webb, of the Arizona Diamondbacks, is having a Cy Young year winning his 11th game the other night and leading the National League in earned run average.
Rich: There's also another young gun out west who is having a pretty good start to his career. Seven starts. Seven wins. You have to go back to 1981 to find someone who has matched that feat.
Bert: Weaver didn't pitch when the Twins visited the Angels in late May. But, yes, he's another one. Over the years we have been spoiled by the veteran aces like Schilling, Johnson, Clemens, Mussina, and Maddux. It's nice to see young arms come into the different leagues and have instant success.
Rich: Changing gears here. . .Carlos Silva has really struggled this year. He was more of a groundball pitcher in 2005 than what he has shown in 2006. Silva's GIDP rate is down, the HR/9 rate is up, and his ERA has doubled from the mid-3s to nearly 7. What gives?
Bert: Baseball is about making adjustments. Carlos is going through that now. He has had to rely on changing speeds on his fastball, throw more breaking balls while continuing to throw strikes. Last year was last year. Today he is a different pitcher who doesn't have the same sinker he had last year. If you don't make adjustments in your game, whether you're a pitcher or a hitter, you will be watching from the sidelines. Plain and simple!
Rich: Two players we can always find on the field are Joe Mauer and Justin Morneau. The M&M Boys are in the midst of terrific seasons. Was this always just a matter of time or are they doing anything differently this year?
Bert: I would rather call them the "J&J" boys. In my opinion there is only one set of "M&M Boys" and that was Mantle and Maris. Or is it Maris and Mantle? Joe and Justin are both very good hitters. Joe is leading the Majors in hitting and Justin is becoming one of the best power hitters in the game. Joe is a pure hitter who will hit the ball where it is pitched. He is so calm at the plate and has a great eye and knowledge of the strike zone. Justin is a power hitter who wants to drive the ball over the fence but his batting average is over .300. And these two players are only 23- and 25-years-old. Another great find by the Twins and their scouts.
Rich: On the topic of finds, do you expect Terry Ryan to make any significant deals before the trade deadline next week?
Bert: I asked Terry that question the other day and he told me that if there is someone out there who can help this Twins team win, then he would have to see what can be done to get that player. But, as he told me, last season the Twins were also looking to improve their team right around this time of the season and everyone wanted Liriano in the trade. Sometimes it's the trades you don't make that work out best for a team. I really would be surprised if the Twins make a major trade because everyone trading wants young talented players in the Twins organization and I don't see them giving any of them up.
Rich: While on the subject of youngsters, can you give us your views on Matt Garza and Kevin Slowey? Their minor league stats have been sensational.
Bert: Here are two more examples of two young pitchers in the Twins minor-league system that are making an impact. Both pitchers are starters and hopefully one day starters for the varsity club. With Brad Radke, Kyle Lohse and maybe even Carlos Silva not coming back next season in a Twins uniform, these two might fit nicely into next year's plans.
Rich: OK, here is a fun one to close out our chat. It's the seventh game of the World Series and Liriano and Santana are both well rested. Who would you start and why?
Bert: I would start Santana because he has the "Cy Young" behind his name. But, Liriano would be the first one out of the bullpen if Johan got into trouble early in the game. Let's hope it happens for the Twins.
Rich: Well, good luck to Santana, Liriano, and the Twins. Come October, I don't think there are too many teams who would want to face those guys.
Bert: If the Twins are able to get to post-season I'm sure there are teams that would not like facing these two pitchers in a five-game series twice and maybe one of them three times in the World Series.
Rich: Boy, that would almost seem unfair. Thanks again, Bert.
Bert: Anytime, Rich.
| Designated Hitter | July 20, 2006 |
Let 'er Rip II
On July 4, Tony La Russa said this to a beat writer from the St. Louis Post-Dispatch:
I disagree with a lot of fans, some experts, whatever. There are times when taking a strike is a good baseball play. There are times when getting deep in a count is a good baseball play. But more often, aggressiveness with the first good strike you see gives you a better chance to be productive offensively. If you give a quality (pitcher) strike one, it's tougher to have a good at-bat.
It wasn't the first time we've heard that from Tony; he gave Buzz Bissinger much the same opinion in 3 Nights in August. It's a little bit jarring, because La Russa's offenses are generally patient and disciplined; they run up good walk totals and have high OBPs, characteristics that seem incompatible with a philosophy that seems to favor hacking at the first ball that catches a piece of the plate.
But is La Russa right? Will an offense get better results if the hitters just let 'er rip? I examined that question last year, looking at 2004 National League data. My study focused on the first pitch of the at-bat -- the 0-0 delivery, which Craig Burley described a couple years ago at The Hardball Times as "the predominant count in baseball." Of course it is: For every plate appearance, there's an 0-0 pitch. And it's a strike about 60 percent of the time.
What a hitter does with that strike goes a long way toward determining the outcome of his at-bat.
The 2004 data seemed to show that La Russa is generally correct: if the first pitch is a strike, the batter is best served to swing. I repeated the study this year, using 2005 data, and got nearly identical results. Take a look:
| 2004 | 2005 | |||||||
|---|---|---|---|---|---|---|---|---|
| when batter . . . | avg | obp | slg | rc/27 | avg | obp | slg | rc/27 |
| takes strike on 0-0 | .233 | .275 | .353 | 3.4 | .237 | .271 | .357 | 3.4 |
| swings on 0-0 | .270 | .300 | .439 | 4.9 | .269 | .296 | .440 | 4.8 |
Keep in mind that the "swings on 0-0" section of this table includes at-bats where the batter swings and either misses or fouls the pitch off, resulting in an 0-1 count -- the functional equivalent of a called strike. Such is the result more than half of the time; the first-pitch hacker puts the ball into play on only about 45 percent of his swings.
It's in part for that reason that the conventional wisdom these days favors deep counts and abhors early-resolving at-bats -- the line of thought La Russa was reacting to in his quote to the Post. The reasoning goes something like this: the more pitches you see, the better your odds of drawing a walk or getting a mistake to exploit, hence the better the chances of getting on base or driving the ball for an extra-base hit. But the numbers in this table indicate the exact opposite -- if the 0-0 pitch is a strike, your odds of reaching base or driving the ball are better if you swing.
This would seem to be the proper time to repeat my disclaimer from last year:
I'm not suggesting that hitters should swing at any 0-0 offering that comes within a foot of the strike zone; these are macro figures which mask all sorts of micro situations in which it might make sense to take a strike. If the pitcher breaks one off on the corner or puts a sinker in at the knees and you can't do much with the pitch, might as well take. And if the pitcher is struggling with his control, maybe it's not a bad idea to see if he can follow up strike one with strike two. But it is a bad idea simply to take a first-pitch strike on principle. La Russa's instincts are correct: you ultimately score more runs if you attack the first strike you see.
The Cardinals as a team tend to reflect La Russa's philosophy; in both 2004 and 2005 they ranked among the league's most aggressive 1st-pitch teams, swinging at more than 50 percent of 1st-pitch strikes. But tendencies vary widely from roster to roster. For instance:
| 0-0 strikes | swings | swing % | |
|---|---|---|---|
| Cubs | 3,499 | 1,877 | 54 |
| Mets | 3,471 | 1,517 | 44 |
| Florida | 3,474 | 1,331 | 38 |
These three teams saw a nearly identical number of 1st-pitch strikes in 2005 -- about 21 a game. The Cubs swung at 11 of 'em, the Mets only 9, the Marlins just 8.
How did it affect their overall scoring? In this case, not much; the trio finished 7th through 9th in NL scoring last year. Indeed, the strong correlation between 1st-pitch aggression and high run totals that I found in 2004 did not recur in 2005. Whereas the 8 most aggressive teams from 2004 scored, on average, 104 runs more than the least aggressive teams, in 2005 it was a total wash:
Run scoring was dead even (an average of 721 runs per team) on both sides of the median for 1st-pitch swing frequency.
The same variation in 1st-pitch aggression did not apply to pitching staffs. Opponents' swing frequency fell within a narrow range (43 to 49 percent) for 15 of the 16 teams; the Milwaukee Brewers, for some reason, threw particularly juicy strikes on 0-0 and induced a 52 percent swing rate. Opposing hitters' aggression seemed to work to the Brewers' advantage: They allowed the third-lowest OPS in the league when throwing a strike on 0-0. But the correspondence did not hold leaguewide; we can't say that pitching staffs that "induced" more swings on 0-0 got better results. Indeed, it's not clear how you would replicate that tendency over time; the discretion lies entirely with the batter.
One final note: in 3 Nights, Bissinger claims that La Russa specifically wants his guys swinging away in RBI situations. Turns out that Tony is far from alone in that regard. I broke out the 1st-pitch data for RISP situations and found that all 16 teams swung at 1st-pitch strikes more often in those situations than otherwise. Leaguewide, the frequency increased by about 9 percent -- from 44 percent in non-RISP situations to 53 percent with RISP. That only makes sense: With runners in scoring position, there may be a reward for simply putting the ball in play; you can move a guy up or knock him in with a groundout or a flyball. A strikeout, conversely, gets you nowhere -- so big-league batters, as a group, alter their approach accordingly, expanding their swing zones from the beginning of the at-bat.
There's no universal formula here; as La Russa himself says, "There are times when getting deep in a count is a good baseball play." But there are also times -- lots of them -- when a guy's got to just take his hacks. Times, in fact, when it's the smart play.
Larry Borowsky writes about the Saint Louis Cardinals at Viva El Birdos, one of the blogs in the Sportsblog Nation family.
| WTNY | July 18, 2006 |
Too Little Salty
Fact: In the prospect world, there is no one that creates more polarity than Jarrod Saltalamacchia. It isn't very close.
In a few popular midseason rankings, I have seen everything from Salty's ranking. He's been in the top 25 in one, to near the bottom of a top ten in catchers rankings. Jarrod was at 75 on my own list, and other sites would likely leave him out of the top 100.
If nothing else, Saltalamacchia represents one huge issue facing those who rank prospects: fish or cut bait?
After a good season as a teenager in the South Atlantic League in 2004, many (not including myself, unfortunately) predicted Salty would break out the next season. Scouts raved about Salty's bat, which only shined at times, but winced at his defense. With Brian McCann shining ahead of him in the system, Salty was a second tier prospect for the system.
Things changed last season, dramatically, when the catcher succeeded at one of the minor league's most difficult stadiums. Showing power that rivaled the best in the minors, projecting better offensive numbers for Salty than McCann was a common practice. Johnny Estrada was out the door, this we knew, but who was the right person to project as the Braves backstop?
Thanks to good defense in his Major League cup of coffee, along with solid offensive numbers, most people (this time including myself, thank you) went with Brian McCann. The Braves felt confidence in the slugger's ability to call a game, and didn't hesitate to start the season with him behind the plate. But they were prepared to have a problem of depth, surely the game's best problem to have.
Obviously, this season has not gone to plan. Saltalamacchia has hovered around the Mendoza Line for much of the season; his season numbers are among the worst of any full season qualifier in professional baseball. But in each quote, the catcher has maintained one fact: he's turned his focus from offense to defense this season. We have seen results, as I noted last week, as Salty's caught-stealing numbers are at a career high.
However, no team can employ a catcher with a sub-.600 OPS, no matter how good his defense is. Offensively, there have not even been the faintest signs of upside; Baseball America has reported scouts claim Salty looks lost at the plate. At the same time, McCann has predictably risen as one of the NL's better catchers; surely a player the Braves want for much of the next decade.
Surely the question most commonly circulating through the Braves player development channels is what method should the team take next to solve the catcher's problems. Do you put him at DH the rest of the season, and force him to tackle offense with the effort he's put on his ability to catch? If so, are you ready to accept Salty's future does not lie behind the plate? The Braves aren't, and have shown much in allowing Jarrod to stay behind the plate, and in AA this season.
In my latest rankings, I did not have Chris Iannetta ranked ahead of Saltalamacchia. Iannetta is in the midst of his own breakout season, poised to catch for the Rockies as early as 2007. His bat was better than both Ian Stewart and Troy Tulowitzki in AA Tulsa, and his defense is better than Salty's. How?
Hope. The Braves need to make a change with Saltalamacchia, and should likely finish the season with something dramatic. But the player we saw last season cannot be simply lost. The Braves must now find him, and when they do, we'll see that Salty deserved to be ranked among the game's top 100 prospects, if not in the top quarter.
| Baseball Beat | July 17, 2006 |
Nick Adenhart: A Rising Star (Once Again)
I watched Bryan Smith's 23rd-ranked prospect make his California League debut two weeks ago yesterday and had a chance to interview him after the game.
Nicholas J. Adenhart (A-den-hart) is a 6-foot-3, 185-pound right-hander out of Williamsport, Maryland. He is a very accomplished pitcher for someone who has yet to celebrate his 20th birthday. Adenhart was Baseball America's Youth Player of the Year in 2003 and its top-ranked high school prospect prior to his senior season in 2004. He tossed a perfect game in his first outing that spring, striking out 15 of the 21 batters faced.
A cinch first-round draft pick heading into his senior year, Adenhart blew out his elbow in May and had Tommy John surgery one week after the Los Angeles Angels selected him in the 14th round (413rd overall). Area scout Dan Radcliff and director of scouting Eddie Bane convinced Adenhart to forego a scholarship offer from the University of North Carolina and signed him to a $710,000 bonus on July 26, 2004.
Adenhart spent the next year rehabbing his elbow in Tempe, Arizona before making his professional debut on June 25, 2005. He pitched 50 innings in the Arizona and Pioneer Rookie Leagues that summer, fashioning a 3-3 record with a 3.24 ERA. Not surprisingly, his command was a bit off, walking 24 batters or 4.32 per 9 IP. However, he offset his wildness with 59 strikeouts, good for 10.62 K/9.
At the age of 19, Adenhart earned a non-roster invitation to the Angels' big league camp this spring. He threw three innings without allowing a run. Nick faced the Chicago White Sox, the defending World Series champions, in one outing. "I threw strikes and got a couple of punchouts," he told me matter of factly in the locker room in the aftermath of winning his Cal League debut for the Rancho Cucamonga Quakes.
Adenhart was assigned to the Cedar Rapids Kernels (Low-A) out of spring training. He dominated Midwest League hitters, leading the circuit in wins (10) and placing third in ERA (1.95) and strikeouts (99 in 106 IP). His performance earned him a starting assignment in the All-Star Game on June 20 and a promotion to the organization's High-A affiliate nine days later.
 Sporting a Fu Manchu-style mustache, the dark-haired prized prospect got the start on July 2 and pitched six innings, allowing four runs on eight hits and three walks while striking out four in front of Bane and several scouts. Thanks to Ben Johnson's 3-for-3 night (including a pair of home runs and two walks), Adenhart earned his first victory for the Quakes and his 11th of the season in a performance that was less than overwhelming but hinted at his star potential. Six of the eight hits were to the opposite field and the only extra-base hit was a slicing double to left in the fifth that failed to produce a run.
"My pitch selection was good, but I left a couple of the pitches over the plate with two strikes," was Nick's response when I asked him about his outing. "I wasn't at my best in terms of command."
Trying to establish his fastball the first time through the lineup, Adenhart ran into trouble in the second, allowing four hits (including three in a row to open the inning) and a trio of runs. "My touch and feel was off, and I was trying to do too much."
Adenhart "calmed down" and gave up just three hits and one run over his final four frames. "I located my fastball better down and in the zone."
The second-year pro throws a two-seam and a four-seam fastball. "I throw my two-seamer about 80-90% of the time. There is no difference in velocity between the two fastballs. I use my four-seamer when trying to elevate on 0-2 and 1-2 counts or into left-handed batters and away from right-handed batters."
Adenhart's fastball was clocked in the high-80s-to-low-90s, topping out at 94 on a few occasions. He is an extreme groundball pitcher and has only given up two home runs in 170 innings in his professional career. "Both home runs were on changeups that I left up."
"I get good sink on my two-seamer," while attributing his favorable groundball-to-flyball ratio to the pronation in his delivery. Nick recorded 11 of his 14 non-strikeouts on the ground the evening I saw him pitch.
Adenhart, who was invited to but did not pitch in the Futures Game, also throws an 11-to-5 curveball in the mid-70s and a circle change in the low-80s. "My changeup tends to be a strikeout pitch. I get lots of swings and misses, especially down-and-away to left-handed batters."
I asked Nick how his elbow felt two years after undergoing surgery performed by Dr. James Andrews. "My elbow is great. It feels different than before I had the surgery. But there is no pain or discomfort."
Adenhart made his next start five days later but was limited to just two innings (2-1-0-0-0-3 with three groundouts) a couple of days prior to the Futures Game. His next outing was last Wednesday, an impressive six-inning, four-hit, one-run victory with six strikeouts. He has pitched 120 innings thus far, going 12-2 with a 2.10 ERA. (Complete stats from MiLB.com.)
Although Adenhart won't turn 20 until August 24, I wouldn't be surprised if he made it to the big leagues at some point during the 2008 season. Once he arrives, the kid with the three "plus" pitches is apt to become part of a starting rotation that could include Kelvim Escobar, John Lackey, Ervin Santana, and fellow 2004 draftee Jered Weaver. The future of the Halos looks bright indeed.
Photo credit: Rob McMillin, 6-4-2.
| Baseball Beat | July 15, 2006 |
Confessions of a Baseball Analyst
News item: The Baltimore Orioles optioned struggling right-hander Daniel Cabrera to Triple-A Ottawa on Friday.
Comment: I thought Cabrera was poised to build on his improvement last season and take it up another notch this year. Boy, was I wrong. Rather than get better, the big right-hander has actually regressed. The lesson here is simple: no matter how hard one throws, it's virtually impossible to succeed if you don't throw strikes.
Cabrera has basically been a mess all year long. Oh, he faked me out and pitched well during the World Baseball Classic. But I had already fallen for the guy long before that. You see, I saw what was then a 24-year-old flamethrower who was striking out about one batter per inning while getting almost twice as many groundballs as flyballs. He flat out dominated RHB and looked as if he was a changeup away from working his magic against LHB, too.
On top of all that, the arrival of Leo Mazzone as the Baltimore Orioles pitching coach gave me added confidence that Cabrera was likely to take the next step in his burgeoning career. Instead, the Dominican walked seven batters in 1 1/3 IP in his opening start, then came back five days later and gave up nine free passes in 5 IP. He allowed no more than two runs in six of his next eight starts but was still having trouble commanding the strike zone, walking 25 batters over a stretch of 20 innings.
For the year, Cabrera has given up an unacceptably high 7.9 BB/9 (vs. 4.9/9 in 2005). He leads the majors with 75 walks and 13 wild pitches. Although Daniel's K/9 rate was up by seven-tenths of a point this year, his K/100P was essentially flat with last season.
Did I mention that I drafted Cabrera in my fantasy pool four rounds before Francisco Liriano was taken by my cousin's team? Darn. I was actually hoping to nab Liriano but thought I could float him a bit more. Double darn!
News item: Nomar Garciaparra wins All-Star "Final Vote" fan balloting.
Comment: I wasn't crazy about the Dodgers signing Garciaparra in the off-season. As a first baseman, I figured Nomar was no better than Shea Hillenbrand at this stage in his career. You know, a .290-.310 hitter with 18-20 HR. And that was assuming that he would stay healthy.
Garciaparra started the season on the DL and missed the first 16 games of the campaign. It looked like 2004-05 all over again (when he played in a combined total of 143 games). Little (so to speak) did I know that Nomar would come back and put up numbers reminiscent of 1999-2000. Second in the NL in AVG (.354), 5th in OBP (.421), 6th in SLG (.580), and 3rd in OPS (1.001).
I know we don't like to talk about such things, but Garciaparra has been nothing if not clutch for the Dodgers this year. The two-time batting champ is hitting .385/.468/.564 with runners in scoring position and .394/.475/.697 close and late. He is leading the team in RBI with 55. Nomar has walked (26) more often than he has struck out (17) and has stolen three bases without being caught. Garciaparra has also played a superb first base, making only one error while ranking in the top five at his position in the majors in range factor and zone rating.
I'm not going to doubt the soon-to-be 33-year-old Nomar. Well, at least not until the next organization signs him to what could easily be a 3 x $10+M contract this winter.
Comment: Hey, I picked the Tigers to finish fourth in the AL Central. Moreover, I was skeptical that the division could average 83 wins per team and said "No way the Tigers and Royals combine for 18 more victories."
Well, the five teams in the AL Central are on pace to average more than 86 wins, Kansas City is on track to match its 56 victories in 2005, and Detroit currently projects to win a whopping 110 games, or 39 (yes, THIRTY-NINE) more than last year. Yikes! I figured the Royals would wind up with about the same record but couldn't foresee the Tigers winning close to 90 games before the season began.
Detroit's pitching staff leads the majors with an ERA of 3.47. The Tigers rank first among all teams in defensive efficiency, fewest stolen bases allowed, and highest percentage of caught stealing.
The bottom line is that Jim Leyland's Tigers have been absolutely Grand(erson) this year.
While on the subject of teams, I must also confess to picking the Cincinnati Reds to finish last in the NL Central. Yes, you read that correctly. I thought the Reds would end up with an even worse record than the (cough) Pittsburgh Pirates. Here is what I said in early March in response to a comment about the Reds being "a few years away":
Oh, the Reds can be turned around. But it won't happen overnight, and it won't be easy. It's gonna take time and patience. Unfortunately, most of the talent at the big-league level is at the wrong end of the defensive spectrum, the pitching staff could be the worst in baseball, and the minor-league system is bereft of talent.
The good news is that I have Aaron Harang on my fantasy team. Reds fans can have second place if they want it. I'll take Harang.
Whew, it sure feels good to come clean. I mean, that was a heavy load to get off my chest. Now I can rest peacefully again. Sweet dreams!
| Designated Hitter | July 13, 2006 |
Empirical Analysis of Bunting
Baseball analysts have been near universal in their condemnation of the overuse of the sacrifice bunt. While acknowledging it as the correct strategy in a small number of cases, most feel that any gain in moving players around the bases is more than offset by giving up an out, the "clock" in baseball. Much of this disparagement of the sacrifice bunt derives from analysis based on expected runs tables (ERT). In this essay, I will introduce more detailed and targeted expected runs tables along with an empirical comparison with what happens when teams actually bunt.
In their seminal book, The Hidden Game of Baseball, John Thorn and Pete Palmer popularized the ERT. Although introduced in concept a number of years earlier, it was Palmer's baseball credentials, the authors' lucid highlighting of its numerous applications, and the book's popularity that led to the ERT gaining a more widespread usage. Essentially, an expected runs table provides the average runs scored over the remainder of the half-inning (i.e. the batting team) from any of the 24 possible base/out states (i.e. the number runners on base and outs).
By necessity, the original expected runs tables were mainly derived from computer simulation of baseball games. The more recent availability of game data through Retrosheet, however, allows for the ERT to be calculated from actual play-by-play information. The overall expected runs table derived from this play-by-play data (for the years 1977 through 1992) is shown in table 1. Because the designated hitter materially impacts scoring, separate tables are necessary for each league. As a technical note, although I refer to these tables as expected runs tables to conform to common terminology, they technically reflect averages. That is, the tables represent the total runs scored over the remainder of the half-inning starting from a particular base/out situation divided by the number of such situations.
TABLE 1 - Expected Run Table (1977-1992)
AL         0        1        2      NL        0        1        2
-----------------------------------------------------------------
---     .498     .266     .099     ---     .455     .239     .090
x--     .877     .522     .224     x--     .820     .490     .210
-x-    1.147     .693     .330     -x-    1.054     .650     .314
xx-    1.504     .922     .446     xx-    1.402     .863     .407
--x    1.373     .967     .385     --x    1.285     .907     .358
x-x    1.758    1.187     .507     x-x    1.650    1.123     .466
-xx    2.009    1.410     .592     -xx    1.864    1.320     .566
xxx    2.345    1.568     .775     xxx    2.188    1.487     .715
Where, for example, "xx-" means runners on first and second, third base empty. Thus if a team has runners on first and second with no outs, on average they will score 1.504 runs over the remainder of the half-inning; with one out, .922; and with two outs, .446.
Because it is always the first event of an inning, the no runners/no outs state (the top left corner) reflects the average number of runs that a team scores in an inning. As table 1 indicates, on average over the 16 year period, the AL scored .043 runs per inning more than the NL (almost entirely due to the DH). This translates to about 4/10 of a run per game.
One fairly common application of the ERT is the evaluation of various in-game strategies, such as the sacrifice bunt. For example, if an AL team has a runner on first base with no outs, the team can be expected to score .877 runs before the end of the inning. If the batter successfully executes a sacrifice, the team would find itself with a runner on second and one out. Based on the table, the expected runs in this latter situation is .693. In other words, according to the ERT executing a successful sacrifice bunt actually lowers the run expectation over the remainder of the inning by .184 runs (.877-.693), while a failed sacrifice lowers the expected runs by .255 (i.e. to a runner on first, one out).
In large part because of these expected runs tables, most baseball analysts have concluded that except in very rare instances, the sacrifice bunt is a poor strategic decision, and that managers use the bunt much more often than optimal. In fact, overuse of the bunt is one of the main criticisms baseball analysts level at the conventional baseball wisdom.
Of course there are many caveats that apply to conclusions based on an ERT. Most important, the table reflects an overall average; in many situations the actual run expectation may differ significantly than that identified by the table. For example, with a pitcher coming up, the expected runs are almost surely less than reflected in the table. On the other hand, with the heart of the order due up, the run expectation may materially exceed that indicated by the table.
Furthermore, late in games teams may be playing for one run, and increasing the overall run expectation may be secondary to simply scoring one run. To examine this topic, one really needs run probability tables to evaluate the probability of scoring at least one run in the various base-out situations. In this essay, I will use run probability tables as well as the ERT to evaluate bunting.
Recently several baseball researchers have further dug into the advisability of the sacrifice bunt by evaluating run potential based on a detailed probabilistic model of a specific sequence of batters and all possible outcomes. This research is valuable and suggests that bunting may not always be such a flawed strategy. But like the original expected runs tables, they are based on modeling outcomes, not on the outcomes themselves. With the availability of the Retrosheet files which include play-by-play data from games, one can begin to evaluate bunting strategies, not only from probabilistic models but from the results themselves.
A key drawback of the above expected runs tables is that they represent only overall league averages. Using the Retrosheet play-by-play output, though, allows for more finely parsing the data. As noted above, one of the problems with the overall ERT is that it takes no account of the ability of the hitter or the actual string of batters following him. One proxy for the quality of the batter and the following hitters is the batting order.
As readers of this essay likely know, the typical batting order follows rather orthodox principles. The leadoff hitter is usually good at getting on base and has some speed. The second place hitter has good "bat control", i.e. the ability to bunt or hit to the right side so as to move the runner along. A team often places its best overall hitter third, and its top power hitter in the cleanup position. The best remaining hitter with power typical hits fifth. The specific positioning of the remaining four hitters often depends on specific player abilities and managing philosophies, but very generally, these final four hitters typically bat in descending order of ability with the pitcher batting ninth in the National League.
By subdividing the data by lineup position, one can evaluate expected runs based on subsets that have different run potentials due to the average ability of the batter and immediately following sequence of hitters. Table 2 shows the expected runs based on lineup position for each league. For example, what does the expected runs table look like if the cleanup hitter is at bat? In other words, the ERT in table 2 reflects the expected runs over the remainder of the inning from each of the 24 base-out situations broken down by the nine lineup positions. To keep the data as pure as possible to reflect lineup position, appearances by pinch hitters in the identified lineup position are not included.
TABLE 2 - ERT by Lineup Position
AL					NL
  1	    0	    1	   2		  1	    0	    1	   2
---	 .553	 .291	.100		---	 .542	 .294	.102
x--	 .951	 .567	.210		x--	 .911	 .530	.213
-x-	1.263	 .753	.323		-x-	1.130	 .720	.342
xx-	1.614	 .966	.428		xx-	1.526	 .868	.418
--x	1.395	 .976	.399		--x	1.319	1.003	.399
x-x	1.840	1.242	.527		x-x	1.786	1.107	.506
-xx	2.182	1.456	.623		-xx	1.978	1.336	.621
xxx	2.365	1.621	.773		xxx	2.081	1.480	.722
  2	   0	    1	   2		  2	    0	    1	   2
---	 .543	 .297	.113		---	 .530	 .286	.104
x--	 .966	 .576	.253		x--	 .977	 .611	.251
-x-	1.214	 .752	.346		-x-	1.180	 .723	.333
xx-	1.599	1.028	.453		xx-	1.583	 .979	.450
--x	1.435	1.012	.432		--x	1.368	 .971	.394
x-x	1.865	1.286	.531		x-x	1.778	1.211	.523
-xx	2.100	1.487	.609		-xx	2.068	1.375	.570
xxx	2.434	1.685	.822		xxx	2.398	1.473	.732
  3	    0	    1	   2		  3	    0	    1	   2
---	 .536	 .305	.117		---	 .517	 .297	.118
x--	 .945	 .581	.268		x--	 .928	 .582	.278
-x-	1.192	 .740	.385		-x-	1.129	 .735	.395
xx-	1.609	1.002	.522		xx-	1.607	1.007	.518
--x	1.422	1.017	.400		--x	1.337	 .993	.401
x-x	1.820	1.249	.574		x-x	1.831	1.266	.562
-xx	2.052	1.534	.674		-xx	2.031	1.518	.715
xxx	2.468	1.699	.867		xxx	2.402	1.720	.817
  4	    0	    1	   2		  4	    0	    1	   2
---	 .488	 .293	.118		---	 .442	 .274	.115
x--	 .885	 .567	.252		x--	 .849	 .553	.261
-x-	1.160	 .711	.343		-x-	1.098	 .719	.350
xx-	1.501	 .962	.488		xx-	1.488	 .961	.532
--x	1.318	 .972	.412		--x	1.308	 .958	.390
x-x	1.816	1.230	.530		x-x	1.741	1.247	.559
-xx	1.950	1.445	.644		-xx	1.864	1.426	.596
xxx	2.345	1.616	.863		xxx	2.457	1.615	.867
  5	    0	    1	   2		  5	    0	    1	   2
---	 .452	 .254	.107		---	 .403	 .224	.103
x--	 .835	 .537	.245		x--	 .757	 .494	.220
-x-	1.110	 .706	.339		-x-	 .925	 .648	.340
xx-	1.453	 .930	.463		xx-	1.336	 .913	.452
--x	1.223	 .946	.373		--x	1.159	 .942	.389
x-x	1.674	1.200	.529		x-x	1.579	1.163	.496
-xx	1.900	1.353	.550		-xx	1.881	1.356	.607
xxx	2.301	1.601	.795		xxx	2.284	1.588	.775
  6	    0	    1	   2		  6	    0	    1	   2
---	 .446	 .231	.094		---	 .370	 .191	.079
x--	 .791	 .464	.220		x--	 .725	 .430	.210
-x-	1.059	 .646	.336		-x-	 .941	 .585	.309
xx-	1.415	 .905	.459		xx-	1.311	 .851	.404
--x	1.328	 .951	.367		--x	1.095	 .829	.342
x-x	1.712	1.129	.518		x-x	1.435	1.106	.452
-xx	2.016	1.340	.581		-xx	1.764	1.336	.531
xxx	2.200	1.532	.755		xxx	1.997	1.536	.726
  7	    0	    1	   2		  7	    0	    1	   2
---	 .439	 .225	.083		---	 .363	 .183	.061
x--	 .800	 .438	.201		x--	 .652	 .388	.176
-x-	1.076	 .617	.310		-x-	 .913	 .540	.261
xx-	1.408	 .836	.419		xx-	1.293	 .756	.385
--x	1.230	 .888	.354		--x	1.242	 .749	.327
x-x	1.625	1.107	.453		x-x	1.507	1.036	.419
-xx	1.852	1.360	.570		-xx	1.718	1.220	.469
xxx	2.337	1.480	.753		xxx	2.062	1.450	.717
  8	    0	    1	   2		  8	    0	    1	   2
---	 .474	 .226	.077		---	 .397	 .172	.054
x--	 .798	 .461	.179		x--	 .678	 .375	.127
-x-	1.039	 .609	.283		-x-	 .923	 .485	.230
xx-	1.431	 .804	.410		xx-	1.179	 .694	.321
--x	1.419	 .919	.347		--x	1.212	 .782	.274
x-x	1.674	1.105	.444		x-x	1.514	 .945	.429
-xx	1.962	1.322	.561		-xx	1.620	1.157	.495
xxx	2.289	1.465	.686		xxx	1.994	1.315	.661
  9	    0	    1	   2		  9	    0	    1	   2
---	 .519	 .263	.081		---	 .450	 .194	.050
x--	 .852	 .480	.182		x--	 .739	 .362	.125
-x-	1.128	 .641	.293		-x-	1.022	 .542	.181
xx-	1.475	 .927	.382		xx-	1.238	 .705	.230
--x	1.423	 .947	.341		--x	1.281	 .753	.236
x-x	1.725	1.145	.457		x-x	1.466	 .891	.269
-xx	2.108	1.396	.513		-xx	1.730	1.048	.387
xxx	2.386	1.533	.709		xxx	1.930	1.219	.470
Table 2 clearly illustrates the impact of batting order position on expected runs. In the AL with the leadoff hitter starting an inning, one can expect .553 runs to score. On the other hand, with the seventh place hitter leading off an inning, this falls to .439 runs. In the NL where the pitcher hits, the fall off is even more drastic, from .542 with the leadoff hitter starting an inning, to .363 for the seventh place hitter. This difference equates to over two runs per game.
One technical qualification to note is that the tables are derived from all events and include actual bunts in the calculation of their averages. A judgment was made, however, that this confounding effect was less significant than incorporating only those cases in which no bunt occurred. The latter involves significant self-selection: only the poorer hitters (and pitchers) bunt, resulting in a data set unrepresentative of the overall expectations.
Based on table 2, the sacrifice bunt still seems like a poor play in most runner on first, no out situations. The one exception, not surprisingly, is the NL pitcher spot, where a successful bunt reduces the expected runs by only .019 (.739 with the ninth place hitter up and a runner on first/no outs to .720 with a leadoff hitter up, a runner on second and one out). Given that these tables reflect overall averages of many teams over many seasons, it follows that a pitcher bunt would make sense in many specific instances.
However, one can now uncover an instance where a successful bunt actually increases the expected runs using the ERT. The run potential with runners on first and second with no outs and the pitcher hitting is 1.238. A successful sacrifice bunt brings up the leadoff hitter with runners on second and third and one out; a state with a run expectation of 1.336. Again, this needs caveats: not all bunts are successful, but clearly given that this is based on overall averages, one can imagine circumstances in which a bunt is the correct strategy.
One examination that researchers sometimes apply to the expected runs tables is that of breakeven percentages. That is, on what percentage of sacrifice attempts does one have to be successful to make the attempt at least a breakeven proposition with respect to the expected runs over the remainder of the inning. To take the example above: if the run potential without a bunt is 1.238 and with a bunt is 1.336, on what percentage of sacrifice attempts does one have to be successful to raise the run expectation above 1.238? Assuming an unsuccessful attempt results in no base runner advance and an out, the resulting run potential is .868. Thus the breakeven sacrifice percentage in this instance is 79% [(1.238-.868)/(1.336-.868)].
While mathematically these breakeven calculations appear helpful, I find them mostly irrelevant and avoid them for two reasons. First, more than two possible outcomes exist on any bunt attempt. For example an error would load the bases with no out: an increase to a run potential of 2.081. Other outcomes such as a double play could drastically reduce the run potential. While the probability of these and other potential outcomes remain small, they alter the run potential enough that any breakeven analysis that ignores them risks materially invalid conclusions.
But more basically, as I hope these tables begin to illustrate, the actual run potential in any situation is extremely dependent on the batter and hitter sequence following his at bat. A breakeven analysis offers value only after working out an accurate expected runs table. Until we have the ability to generate expected runs tables for each applicable batting sequence it does not really make sense to begin calculating a breakeven analysis, and only then if we can include probabilities for all the possible outcomes as discussed above.
The most interesting part of the analysis, however, is investigating the average results of actual bunts. While the ERT can help calculate the expected change in run potential given a successful or unsuccessful bunt, detailed analysis of the Retrosheet data provides an understanding of what actually happens on bunts. Managers want to win; therefore they may very well bunt in situations which offer a better run potential than average. To go back to the original example, a successful bunt with a runner on first and no outs in the AL appears to lower the run expectation by .184 runs; what happens in practice when teams bunt?
Table 3 provides the results of what actually happens when teams bunt. The analysis looks at all situations in which there were at least 200 bunt attempts and compares the results from bunting to all results. Unfortunately, Retrosheet does not make a specific notation for a sacrifice bunt attempt. From the data one can track either successful sacrifice bunts or all bunts (including those attempted for base hits). Fortunately, one can assume that few bunt attempts are for base hits and often occur with the bases empty.
As an example of how to interpret table 3, with no outs, a runner on second, and the eighth place hitter up in the American League, on average 1.039 runs will score over the remainder of the inning; this ties back to table 2. In those instances in which the batter executed a successful sacrifice bunt the expected runs over the remainder of the inning increased to 1.057. After any bunt, the expected runs over the remainder of the inning grew to 1.082.
Table 3 demonstrates that when teams actually bunt they sometimes do, in fact, increase the expected runs over the remainder of the inning, particularly late in the order with no outs and a runner on second or first and second. And this analysis aggregates all bunts: intelligent, ill-advised and those in between. The results imply that managers have at least some ability to recognize those situations in which bunts can increase run scoring. Bunting runners from first to second, except by the pitcher, still appears more problematic. But it must be remembered that the overall run potential of a base/out situation reflects the average of a large number of occurrences, and in many situations the expected runs are surely as low or lower than those that result from a bunt.
TABLE 3 - Results of Actual Bunts Compared to All Events
Lg      BOP	Runners	  All   SH Only  All Bunts
		No Outs
A	1	x--	 .951	 .848	 .899
A	1	-x-	1.263	1.062	1.203
A	1	xx-	1.614	1.635	1.676
A	2	x--	 .966	 .753	 .848
A	2	-x-	1.214	1.131	1.206
A	2	xx-	1.599	1.694	1.744
A	3	x--	 .945	 .769	 .818
A	5	x--	 .835	 .702	 .752
A	6	x--	 .791	 .642	 .643
A	6	xx-	1.415	1.416	1.388
A	7	x--	 .800	 .664	 .709
A	7	xx-	1.408	1.517	1.430
A	8	x--	 .798	 .714	 .715
A	8	-x-	1.039	1.057	1.082
A	8	xx-	1.431	1.575	1.496
A	9	x--	 .852	 .802	 .790
A	9	-x-	1.128	1.146	1.137
A	9	xx-	1.475	1.464	1.455
N	1	x--	 .911	 .878	 .909
N	2	x--	 .977	 .784	 .837
N	2	-x-	1.180	1.094	1.185
N	2	xx-	1.583	1.606	1.612
N	5	x--	 .757	 .800	 .714
N	6	x--	 .725	 .683	 .682
N	7	x--	 .652	 .575	 .587
N	8	x--	 .678	 .619	 .611
N	9	x--	 .739	 .769	 .724
N	9	-x-	1.022	1.159	1.137
N	9	xx-	1.238	1.404	1.325
		1 Out
N	9	x--	 .362	 .380	 .354
N	9	xx-	 .705	 .732	 .724
(Technical note: the "All" column does not include pinch hitting appearances, while the two bunt columns do)
Overall, table 3 highlights that, in general, when managers elect to bunt they produce results superior than that assumed by the expected runs tables. In the example above--AL: eighth place hitter up, runner on second, no outs--a successful bunt ought to reduce the run scoring potential for the remainder of the inning from 1.147 to .967 according to the overall ERT in table 1. Even the batting order subsets generated in table 2 suggests that a successful sacrifice bunt reduces the expected runs over the remainder of the inning declines from 1.039 to .947, a smaller reduction but a reduction nonetheless. Using the game generated data, however, illustrates that on average, managers use the bunt strategically enough to actually increase the run expectation over the remainder of the inning from 1.039 to 1.057.
Of course, when bunting, teams are often not as concerned about the overall run potential of an inning, but the probability of simply scoring one run. One of the terrific things about the Retrosheet play-by-play data is that one can also generate tables that contain the probability of scoring at least one run. Table 4 resembles the overall expected runs table in table 1, but the numbers reflect the probability of scoring at least one run as opposed to the expected runs over the remainder of the inning. For example, over all the games in the AL from 1977 through 1992, the probability of scoring at least one run with no out and a runner on second is .634.
TABLE 4 - One Run Probability Table (1977-1992)
AL	   0	   1	   2	NL	   0	   1	   2
---	.276	.161	.067	---	.261	.148	.061
x--	.432	.277	.129	x--	.424	.268	.124
-x-	.634	.414	.226	-x-	.609	.400	.216
xx-	.637	.430	.236	xx-	.622	.413	.220
--x	.839	.670	.279	--x	.814	.648	.267
x-x	.870	.656	.289	x-x	.847	.650	.275
-xx	.867	.689	.275	-xx	.838	.664	.267
xxx	.875	.679	.331	xxx	.860	.668	.315
Table 4 provides a little more evidence of why managers bunt. The probability of scoring a run decreases only from .432 with a runner on first and no outs to .414 with a runner on second and one out. As these values represent an overall average of all games, one can imagine that it many cases it surely increases the probability. Once again we can generate these tables by batting order position as a surrogate for the multiple batter sequences that can produce a huge variation in expected outcome.
TABLE 5 - One Run Probability Table by Lineup Position
AL				NL
  1	   0	   1	   2	  1	   0	   1	   2
---	.302	.170	.067	---	.301	.173	.066
x--	.458	.292	.121	x--	.426	.263	.120
-x-	.662	.436	.218	-x-	.606	.411	.232
xx-	.658	.427	.233	xx-	.653	.428	.228
--x	.827	.655	.295	--x	.794	.666	.284
x-x	.872	.672	.302	x-x	.864	.662	.305
-xx	.874	.691	.293	-xx	.852	.669	.290
xxx	.867	.696	.340	xxx	.829	.661	.338
  2	   0	   1	   2	  2	   0	   1	   2
---	.298	.176	.073	---	.300	.171	.065
x--	.483	.306	.148	x--	.497	.320	.146
-x-	.665	.433	.236	-x-	.659	.429	.223
xx-	.678	.466	.233	xx-	.653	.433	.232
--x	.870	.687	.294	--x	.846	.653	.276
x-x	.880	.671	.296	x-x	.855	.651	.299
-xx	.887	.725	.278	-xx	.847	.696	.268
xxx	.889	.700	.347	xxx	.882	.663	.323
  3	   0	   1	   2	  3	   0	   1	   2
---	.299	.185	.077	---	.301	.187	.078
x--	.457	.308	.150	x--	.470	.314	.156
-x-	.649	.439	.252	-x-	.644	.436	.254
xx-	.673	.460	.271	xx-	.668	.459	.262
--x	.842	.707	.288	--x	.854	.696	.291
x-x	.899	.688	.312	x-x	.889	.687	.302
-xx	.874	.731	.302	-xx	.888	.701	.315
xxx	.910	.702	.365	xxx	.879	.720	.350
  4	   0	   1	   2	  4	   0	   1	   2
---	.280	.182	.081	---	.271	.176	.083
x--	.433	.294	.141	x--	.444	.304	.149
-x-	.635	.427	.231	-x-	.632	.437	.234
xx-	.645	.445	.252	xx-	.638	.443	.260
--x	.830	.667	.290	--x	.811	.680	.278
x-x	.868	.668	.299	x-x	.866	.680	.308
-xx	.867	.706	.288	-xx	.862	.694	.268
xxx	.886	.682	.351	xxx	.908	.692	.352
  5	   0	   1	   2	  5	   0	   1	   2
---	.261	.163	.076	---	.245	.151	.073
x--	.405	.286	.136	x--	.396	.269	.132
-x-	.629	.416	.231	-x-	.581	.412	.235
xx-	.622	.435	.241	xx-	.630	.441	.236
--x	.842	.660	.263	--x	.794	.682	.288
x-x	.859	.654	.294	x-x	.855	.685	.284
-xx	.842	.672	.260	-xx	.853	.674	.278
xxx	.883	.691	.342	xxx	.878	.701	.326
  6	   0	   1	   2	  6	   0	   1	   2
---	.252	.148	.066	---	.221	.127	.060
x--	.394	.253	.128	x--	.383	.249	.128
-x-	.599	.405	.233	-x-	.559	.380	.218
xx-	.604	.427	.239	xx-	.606	.418	.224
--x	.793	.668	.270	--x	.756	.640	.266
x-x	.869	.636	.291	x-x	.832	.651	.278
-xx	.876	.654	.278	-xx	.838	.668	.261
xxx	.844	.668	.315	xxx	.848	.684	.307
  7	   0	   1	   2	  7	   0	   1	   2
---	.245	.140	.059	---	.211	.115	.046
x--	.394	.240	.117	x--	.350	.226	.113
-x-	.605	.380	.216	-x-	.556	.357	.200
xx-	.602	.403	.235	xx-	.592	.389	.222
--x	.814	.628	.266	--x	.784	.582	.267
x-x	.845	.643	.277	x-x	.830	.653	.257
-xx	.864	.690	.272	-xx	.815	.656	.236
xxx	.854	.668	.331	xxx	.831	.681	.322
  8	   0	   1	   2	  8	   0	   1	   2
---	.259	.134	.053	---	.220	.104	.038
x--	.393	.247	.106	x--	.360	.204	.082
-x-	.593	.379	.207	-x-	.537	.324	.168
xx-	.608	.392	.216	xx-	.549	.346	.194
--x	.855	.652	.262	--x	.759	.583	.222
x-x	.847	.627	.264	x-x	.810	.600	.286
-xx	.843	.651	.266	-xx	.727	.625	.248
xxx	.864	.656	.302	xxx	.840	.610	.306
  9	   0	   1	   2	  9	   0	   1	   2
---	.277	.154	.052	---	.240	.109	.030
x--	.423	.252	.108	x--	.397	.217	.072
-x-	.624	.386	.209	-x-	.585	.342	.133
xx-	.624	.425	.213	xx-	.580	.336	.136
--x	.822	.653	.266	--x	.781	.530	.194
x-x	.860	.646	.272	x-x	.734	.514	.165
-xx	.872	.678	.241	-xx	.770	.543	.197
xxx	.872	.662	.304	xxx	.808	.559	.218
Table 5 indicates a number of cases in which a successful bunt increases the probability of scoring a run. In the AL, when the ninth place batter bunts with a runner on first and no outs, the probability of scoring at least one run moves from .423 up to .441. The impact is even greater with a runner on second and no outs when playing for one run. For example, a successful bunt by the ninth place AL batter with runners on first and second increases the probability of scoring from .624 to .691. And this phenomenon is not limited to the bottom of the order. A successful sacrifice bunt by the second place hitter in this base/out situation raises the probability of scoring at least one run as well.
Again it needs to be emphasized that the batting order is simply a proxy for studying sequences of varying quality hitters. Even subdividing the data by the various lineup positions aggregates large amounts of data that mask many of the nuances in all the myriad possible sequences of batters. Thus, it certainly seems likely that many individual situations offer a much greater potential increase in the probability of scoring at least one run.
Table 6 compares the probability of scoring one run based on the overall run probability tables with what actually happens when teams bunt, using as reference the various lineup positions. As the table makes clear, when managers elect to bunt (on average) they typically increase the probability of scoring at least one run. In some cases the jump can be substantial. In the AL for example, if the number two hitter successfully sacrifices with a runner on second and no outs, the probability of scoring jumps from .665 to .736.
Once again the data underscores that managers employ the bunt much more advantageously than an arbitrary reading of the run probability table would suggest. Using the example above--AL: number two hitter at bat, runner on second, no out--a successful bunt should increase the probability of scoring from .634 to .670, based on the overall run probabilities in table 4. According to the lineup derived table 5, a successful sacrifice should increase the probability of scoring in the base/out example from .665 to .707 based. In fact, in those instances when managers chose to bunt, a successful sacrifice increased the probability of scoring to from .665 to .736.
TABLE 6 - Probability Results of Actual Bunts Compared to All Events
Lg      BOP	Runners	 All   SH Only  All Bunts
		No Outs
A	1	x--	.458	.476	.478
A	1	-x-	.662	.681	.692
A	1	xx-	.658	.766	.729
A	2	x--	.483	.455	.474
A	2	-x-	.665	.736	.726
A	2	xx-	.678	.757	.738
A	3	x--	.457	.448	.451
A	5	x--	.405	.405	.400
A	6	x--	.394	.386	.372
A	6	xx-	.604	.686	.667
A	7	x--	.394	.386	.395
A	7	xx-	.602	.715	.654
A	8	x--	.393	.421	.404
A	8	-x-	.593	.664	.646
A	8	xx-	.608	.714	.681
A	9	x--	.423	.454	.440
A	9	-x-	.624	.708	.693
A	9	xx-	.624	.703	.656
N	1	x--	.426	.457	.459
N	2	x--	.497	.461	.472
N	2	-x-	.659	.741	.735
N	2	xx-	.653	.686	.670
N	5	x--	.396	.454	.403
N	6	x--	.383	.417	.419
N	7	x--	.350	.401	.387
N	8	x--	.360	.384	.376
N	9	x--	.397	.432	.405
N	9	-x-	.585	.723	.663
N	9	xx-	.580	.678	.616
		1 Out
N	9	x--	.217	.247	.226
N	9	xx-	.336	.339	.342
(Technical note: the "All" column does not include pinch hitting appearances, while the two bunt columns do)
Over the past couple of decades baseball analysts have seemingly discredited the bunt in all but the most obvious situations. Much of their evidence is based on the use of an overall run expectation table that reveals a loss of run potential even with a successful sacrifice. These overall expected runs tables, however, fail to differentiate between the innumerable possible scenarios of the ability of the hitter at bat and those following in sequence. Subdividing the data by batting order position allows a look at more finely dissected sequences of player ability. Although most of this analysis still indicates a successful bunt does not increase the run potential, it certainly shows that it in certain base/out situations it is not as detrimental as commonly believed. In fact, disaggregating by batting order still averages over many different player ability sequences, suggesting that in a number of instances a bunt may actually increase the run potential.
The Retrosheet play-by-play data allows us to partially test this hypothesis that managers can outperform the run expectation tables by a selective employment of the bunt. While not conclusive, the data here is clearly suggestive: in some base/out situations teams do increase the run expectation with a sacrifice bunt beyond the overall run potential implied by the ERT. And furthermore, even in those cases in which the runs expected over the remainder of an inning after a sacrifice bunt are less than that derived from the ERT, the decrease is typically less than the derived value. In addition we can assume that a manager typically bunts in those situations in which the specific sequence of batters is inferior to the average reflected by the ERT.
It is in the case of playing for one run, however, that the overall aptitude of managerial decisions shows up most clearly. As table 6 reveals, when managers bunt they usually increase the likelihood of scoring at least one run in the inning. And this increase is materially greater than that suggested by simply looking at run probability tables. While the bunt should and will remain a controversial managerial decision, it is clear that managers use it more judiciously than a cursory analysis based on the run expectation and probability tables would suggest.
Dan Levitt is the co-author of Paths to Glory, winner of the 2004 Sporting News-SABR Baseball Research Award. He manages the capital markets for a national commercial real estate firm.
| WTNY | July 12, 2006 |
2006 WTNY Midseason 75
Without a question, this is a sandwich prospect year for pitching prospects. On the way out is one of the best classes ever, on the way in is a draft that seemed to only boast pitchers. Yesterday, in the unveiling of my prospect list, just three pitchers made the first tier, which encompassed 23 players.
Today, in the second and final part of this installment, you will read about more pitchers than hitters. In all, 42 hitters made the list, against 33 pitchers. While this seems fairly even, the lack of top-flight pitching prospects leaves the two groups on different levels. While the likes of Andrew Miller and Brad Lincoln should help even things this winter, this is truly the season where TINSTAPP holds the most water.
Five Diamondbacks made the top tier yesterday, and one more player from the organization will be discussed today. This gives the club the minors' premier farm system, and should make Mike Rizzo the top GM prospect on the market. Who else has constructed good systems and future job prospects? Read on, for the rest of my midseason top 75, to find out...
24. Colby Rasmus, of: Cardinals (A+)
I've reached a summer record of most minor league games seen in person this year, and I maintain Rasmus is the sweetest swing I have encountered. His ceiling is lower than the other freakish outfielders in his class, but Rasmus does everything with ease.
25. Joel Guzman, of/3b: Dodgers (AAA)
Slips out of the first tier because he hasn't taken the step forward that many others in the organization have. Guzman has a good future in baseball, but I believe his best development route would be the Major League school of hard knocks with a bad organization that could afford waiting him out.
26. Scott Elbert, lhsp: Dodgers (AA)
In contrast, Elbert has taken that step forward this season. Currently the best southpaw in the minor leagues, Elbert has electric stuff, as control is the only thing holding him back from elite status.
27. Yovani Gallardo, sp: Brewers (AA)
One of the season's best success stories, Gallardo offers excellent pitchability for a 20-year-old. The only question is whether his stuff will be enough to hang near the top of a rotation.
28. Humberto Sanchez, sp: Tigers (AAA)
For me, Sanchez was among the most impressive in the Futures Game, even if he showed the nation how large he really is. If Jim Leyland is serious about a 6-man rotation in the second half, Sanchez' presence in the Majors shouldn't slow Detroit down.
29. Dustin Pedroia, 2b: Red Sox (AAA)
After a slow start, Pedroia has come on strong, and appears ready for the Major Leagues. He'll get his chance in 2007, and should be a solid regular in the middle infield for years to come.
30. Matt Garza, sp: Twins (AA)
Garza's name this high on the list is testament to Mike Radcliffe, the game's best scouting director. Garza has slowed a bit in AA, but his dominance in AA showed big-time potential.
31. Jason Hirsh, sp: Astros (AAA)
Free Jason Hirsh!
32. Reid Brignac, ss: Devil Rays (A+)
The best success story of my breakout picks, Brignac has brought the power stick to Visalia. His high error total creates a questionable future, and we still need to see this away from the Pacific.
33. Brandon Erbe, sp: Orioles (A-)
In many ways, the Jay Bruce of the pitching class, as I would not be surprised (in the slightest), if Erbe is the top-ranked pitching prospect in a year. For now, we have to hope his arm doesn't break down even amidst the Orioles enviable coddling.
34. John Danks, lhsp: Rangers (AAA)
Another slow starter in the higher levels, Danks only slides a bit on my prospect list. Southpaw starters with high ceilings are a rare commodity, so the Rangers will execute a lot of patience with the one-time first rounder.
35. Felix Pie, of: Cubs (AAA)
This is the beginning of a freefall if Pie doesn't pick things up. The tools are all there, but since May 1, any type of performance has not. Things need to change in the second half.
36. Fernando Martinez, of: Mets (A-)
Like Tabata yesterday, I'm too scared to put him both any lower or any higher. Immensely talented, evaluating Martinez properly will be difficult until he has a long bill of health.
37. Micah Owings, sp: Diamondbacks (AAA)
Owings provides a lot of polish and has flown through the Arizona system. A late-season cup of coffee will complete a whirlwind two-year run for Owings.
38. Daric Barton, 1b/dh: Athletics (DL)
Like Jason Kubel last year, we can't really penalize Barton too much for getting injured. His early season struggles were worrisome, but only a real cynic would have soured on his bat already.
39. Nolan Reimold, of: Orioles (A+)
The rare raw college player, Reimold has a long way to go before he reaches his ceiling. However, he's shown a bit of everything in Frederick, leaving Orioles fans salivating.
40. Eric Hurley, sp: Rangers (A+)
It has been an awesome season for Hurley, pitching well across the board in the Cal League. His stuff is fantastic, and if he receives a late-summer promotion, don't be surprised if his ERA increases.
41. Edinson Volquez, sp: Rangers (AAA)
This is a cautious ranking, as Volquez has earned this position, I just don't have a lot of confidence in it. When I close my eyes and try to envision his career, I foresee a middle reliever every time.
42. Adam Miller, sp: Indians (AA)
Miller will have a hard time ever meeting the expectations laid out for him after flashing so much potential in the 2004 season. However, this season has been a step in the right direction for the Indians star righthander.
43. Trevor Crowe, of: Indians (A+)
Right behind Miller on the Indians prospect list is Crowe, who has shown a lot of skills in a lot of different areas this season. His walk rate is particularly exciting, as he could develop into an invaluable asset alongside Grady Sizemore. Perhaps he'll be the player everyone thought Franklin Gutierrez could be.
44. Hunter Pence, of: Astros (AA)
At some point, you have to give a guy credit if he continues to have success, despite the naysayers not going away. Pence has legitimate power, and is going to have some success in the Major Leagues. However, there's a gray line between some success and consistent success, and thanks to his BB/K rate, I can't see which side he's on quite yet.
45. Gio Gonzalez, lhsp: Phillies (AA)
Another cautious ranking, as I'm beginning to worry if Gonzalez is injured. Since June 1 the southpaw has an ERA north of 6, and has allowed home runs in each start. If the breaking ball isn't as crisp, is something wrong with the arm?
46. Eric Campbell, 3b: Braves (A-)
Doesn't receive the hype he should, as Campbell has hit for a fantastic amount of power in his full-season debut. While he doesn't quite walk enough yet, his great contact rate leaves all the makings for a future All-Star hitter.
47. Ryan Braun, 3b, Brewers (AA)
Braun seems to be among the minors most hot-and-cold hitters, especially when the third baseman reaches new levels. A future dynamite fantasy option, Braun has continued to impress after a promotion to Huntsville.
48. Andrew McCutchen, of: Pirates (A-)
My concern after seeing McCutchen is that he's just too skinny to ever develop good power. But for now, he can fly with the best of them, and with refinement should be a weapon in centerfield and at the top of a batting order.
49. Chuck Lofgren, lhsp: Indians (A+)
Athletic and polished, Lofgren has done even better than I could have imagined in March. The southpaw thrives on good pitchability, but also has the stuff to thrive at higher levels.
50. Wade Davis, sp: Devil Rays (A-)
A popular breakout candidate that I never backed, Davis has been fantastic in the Midwest League this season. The righthander has slowed down since a fantastic start, but he has the power stuff to move in a hurry.
51. Ricky Romero, lhsp: Blue Jays (AA)
The Blue Jays stayed cautious and allowed Romero to debut late, but he made up for lost time, dominating the Florida State League. He has struggled a bit in two AA starts, but Romero is not making the Blue Jays regret taking the safe route last June.
52. Adam Lind, of: Blue Jays (AA)
Just as I expected, Lind has seen many of his 2005 doubles clear the fence this season. A talented power hitter, I'm curious where his patience went since last season. A better walk rate the only improvement he needs to make offensively.
53. Troy Patton, lhsp: Astros (A+)
Patton moves up slowly in this list, basically staying stagnant with a season that falls short of some expectations. He has still showed a lot of the maturity that draws such high praise, but also has been hit harder at the new level. His next jump, the big one, will go a long way in determining the truth to his profile.
54. Kevin Slowey, sp: Twins (AA)
Put your guns down, people. Slowey has had an amazing season, even a historic one, but he just isn't the caliber of the guys in front of him. His continued success in the Eastern League is a good sign, but I don't see the ceiling that other people do with Slowey. However, another half like this one went, and he'll undoubtedly break the top 50.
55. Thomas Diamond, sp: Rangers (AA)
Losing your control at an age as old as Diamond is not, not, not a good thing. Diamond has shown improvement recently, but a half like he's had is worthy of the slide on this list that he's received.
56. Joey Votto, 1b: Reds (AA)
I was told a couple years ago by an industry executive that Votto would break out in 2005. It appears my information was a year early, as Votto has been fantastic this season, making Adam Dunn's non-move to 1B look genius. He should be manning the corner in Cincy by Opening Day 2008, at the latest.
57. Ubaldo Jimenez, sp: Rockies (AAA)
Big breakout first half, spotty record in the past, stuff that remains filthy and unrefined. Jimenez could go both directions, but the most likely destination remains a successful bullpen role.
58. Sean West, lhsp: Marlins (A-)
Pitching on a historic staff in Greensboro this summer, West has emerged as the best blend of stuff and pitchability of the rotation's four first rounders. Aaron Thompson can't match West's stuff, Ryan Tucker doesn't have anywhere near the pitchability. Chris Volstad is an anomaly; West is the best.
59. Neil Walker, c: Pirates (A+)
Dropping him this far is less an indictment of Walker's first half, and more an indictment of my winter ranking: it was too high. I took some late excitement about his power potential and pushed Walker to 44, which was setting the bar of expectations too high. His current performance is way below that, however, and he'll need to bounce back from his injury problems in a big way during the second half.
60. Scott Mathieson, sp: Phillies (AA)
Just like Humberto, Mathieson has continued upon a successful winter stint to pitch very well this season. His stuff really isn't in Sanchez' vicinity, but Mathieson looks like he definitely isn't far from being a #2/3 starter in the Majors. If so, even this ranking is too low.
61. George Kottaras, c: Padres (AA)
Has continued to improve after a 2005 season in which he turned heads but also showed flaws. Kottaras has the patience and gap power to succeed in PETCO, and he should be behind the plate for a long time. I'm coming around as a believer.
62. Jose Arredondo, sp: Angels (AA)
One of the most interesting stories on this list, Arredondo was an infielder just two seasons ago. While Carlos Marmol had a similar track catapult him to the big leagues, Arredondo is making his own push for Majors. Already on the 40-man, and as surprising as this is, a September call-up would no longer be too shocking.
63. Jacob Magee, lhsp: Devil Rays (A-)
The better statistic half of the D-Rays' low-level aces, Magee doesn't quite have the stuff of Wade Davis. However, his strikeout rate and handedness are both huge pluses, and Magee could take off with another good half-season.
64. Josh Fields, 3b: White Sox (AAA)
Fields has improved by leaps of bounds this year, showing one of the better power strokes in the minor leagues. Fields, however, has a lot of trouble making contact, and will need to continue to post high BABIP rates to succeed. His currently level is unsustainable, but if moved to left field, Fields can still be a valuable part of the White Sox in the near and long-term future.
65. Radhammes Liz, sp: Orioles (A+)
His statistics are amazing, consistently, but his age is damning. Liz has the fastball to move up the ladder, but the Orioles have been stubborn about promoting him. The time is now to see if Liz has a future beyond the bullpen.
66. Mike Bowden, sp: Red Sox (A-)
67. Clay Buchholz, sp: Red Sox (A-)
These two are extremely similar; picking between them is nothing more than intuition. I'm going with Bowden, who is younger and has been a bit better since struggling early in the season. Both are good prospects, and the Red Sox probably wouldn't mind if all their top prospects had clones.
68. Gaby Hernandez, sp: Marlins (A+)
Hernandez has continued to pitch like a solid middle-rotation guy this season, which means the Marlins got what they paid for. Actually, more ... we can all agree Lo Duca is overrated, no? Hernandez is just another pitching prospect in this organization, but whether they trade him or add him onto their young staff, he's definitely a valued commodity.
69. James Loney, 1b: Dodgers (AAA)
It's been a long road back for Loney, who has been fantastic in the PCL this season. He's great defensively, and his contact skills are as good as it gets. But his lack of power is worrisome, not just with a future in Dodger Stadium, but a future in the Major Leagues.
70. Glen Perkins, lhsp: Twins (AA)
Hasn't been fantastic, but Perkins has been a good incumbent in the New Britain rotation. A hometown Minnesota boy, Perkins might have more value to the Twins than your average #3/4 pitching prospect.
71. Jacobby Ellsbury, of: Red Sox (A+)
I went over his profile recently, but really, the Red Sox are getting a little less this season than what they bargained for last June. However, Ellsbury has still been great defensively and has continued to shown a lot of the skills necessary to be a future leadoff man.
72. Asdrubal Cabrera, mi: Indians (AAA)
I'm preaching patience with the bat here, and wincing in thoughts of how he might produce in the Majors if the Indians allow him to replace Ronnie Belliard at second next season (hint: not good). Cabrera's bat is a long-term project, but his defense is not. It's already a fantastic tool, good enough to move Jhonny Peralta to a new position (in a perfect world). He shouldn't have a full-time job in the Majors next season, but he is going to be good for a long time.
73. Cesar Carrillo, rhp: Padres (DL)
This ranking might be aggressive given his recent injury, but Carrillo was very good before the injury tarnished his first full season. A good rehab program could have Carrillo better than ever. Padres fans are just hoping his rehab program goes better than the Tim Stauffer route.
74. Dustin McGowan, rhp: Blue Jays (AAA)
Will the real Dustin McGowan please stand up?
75. Jarrod Saltalamacchia, c: Braves (AA)
I'm not ready to let go, yet. Salty has legitimately improved behind the plate this season, but that can be discounted when reminded how bad he's been with the bat. It's been awful. There was too much talent last year to close the book on him, but the day we can is not far away.
| WTNY | July 11, 2006 |
WTNY Midseason 75 (Top Tier)
It's hard to believe what a difference six months makes. Winter is a time for projection, for hope, a time where each prospect's cup is half-full. But thrown bats and extended slumps change everything, including the ranking of prospects.
As I have done in the past, I have once again compiled a ranking of the minors' best 75 prospects. While the name atop the list has not changed, it came with far less ease than in January. Below Delmon, everything remains in flux.
I have decided to make eligibility requirements subjective this season, opting to not include any player that should lose his prospect eligibility by season's end. Any player currently in the Majors was exempt, and many in the minors (read: Lastings Milledge) were taken off the list by my subjectivity. If, in fact, these players remain prospects for another season, you can expect they'll be back in another six months. And by then, I think we can agree, everything will be different all over again.
My thought process when ranking prospects works in tiers, and while I would normally reserve this day for a ranking of the top 25, I found it more educational to cut things off at the end of my first ranked tier of prospects. Enjoy...
1. Delmon Young, of: Devil Rays (AAA)
Following the Delmon Young press conference, I had decided Young would not be my top prospect at the midseason mark. It would be my way of not just indicting his bad showing of make-up, but his low walk and home run totals in AAA as well. Then I saw Young for the first time, the night of his first home run, and my mind was changed. The power is going to come, I promise. He's hitting .375 with seven extra-base hits and just 11 strikeouts in 19 games since returning. Minor league baseball has no better player.
2. Alex Gordon, 3b: Royals (AA)
Like I said, Young was not my first prospect three weeks ago, Gordon was. And if I had stayed with that decision, it would have been defensible. Gordon represents the best bet for success in the minor leagues; he has no discernible flaw. He's going to hit for average, a lot of power, draw plenty of walks, play steady defense, and steal enough bases to make his fantasy owners giddy. Suddenly his four figure baseball card is looking like a sound investment, no?
3. Howie Kendrick, 2b: Angels (AAA)
4. Brandon Wood, ss: Angels (AA)
Wood has done little for this order to be flip-flopped, continuing on a path to success after a ridiculous 2005. But this season it's Kendrick to take the full step forward, catapulting himself past Wood and into the top five.
Kendrick, I've said before, is a player with limited potential value. In other words, his ceiling has a roof. Confined by his own stature, there is a limit to the power Kendrick can develop in relation to Wood. However, Kendrick is nearly guaranteed to hit for a better average than Wood.
The ranking of these two players is a simple test of risk vs. reward. Kendrick offers no risk, but his reward is limited in comparison to Wood, whose ceiling is highest among current prospects.
5. Justin Upton, of: Diamondbacks (A-)
Watching Upton in person, the top overall pick from last year exudes an aura that doesn't usually follow teenagers. The aura was first evident in Spring Training, when Upton's build and bat were enough to hold his own in big league camp. He shined on the national stage, saving what some would call his best Cactus League game for a contest against the White Sox on WGN. Now far from the big stage, Upton is struggling a bit, but in seeing him, it's obvious there is more than the numbers tell us. Upton will come around, if not at the pace I thought, and when he does, sparks will fly.
6. Stephen Drew, ss: Diamondbacks (AAA)
If Drew began the season in the Arizona batting order, it would have surprised no one had he separated himself from the NL Rookie of the Year pack. Instead, the Diamondbacks chose the cautious route with their young shortstop, maintaining another year of mediocrity from the position for the betterment of their future. Good decision. Drew has progressed as expected in AAA, and he is on the right timetable to make a splash next season. A gifted offensive player, Drew has even more to show than what he has since signing in pro baseball.
7. Billy Butler, of: Royals (AA)
I have always believed in Butler's bat, and on Sunday, his performance in the Futures Game showed why this is a good idea. Butler is as good a hitter for his age as it gets, he's polished and powerful. His play in the field is a work in progress, but it's improving, even at a Carlos Lee-type rate. The most concerning blip on Butler's radar is a drastic home/road split that favors his time in Wichita. For all we know, it's nothing, but it's also worth keeping notice. Butler is going to hit in the Majors, and with Gordon, Dayton Moore's long-term vision is beginning to come in better focus.
8. Cameron Maybin, of: Tigers (A-)
There have been a lot of positives about Cameron Maybin's season, his full season debut. Any teenager holding his own in such a difficult league is worthy of praise. Maybin has also been lucky, striking out at a percentage too high to keep his batting line as high as it is. a true five-tool player, the North Carolina outfielder is far more raw than he has shown this season. But underneath it all, the Tigers - who landed the top rated player in the 2006 draft - may have landed the top player in 2005.
9. Phil Hughes, sp: Yankees (AA)
10. Homer Bailey, sp: Reds (AA)
Bailey was not an oversight in my listing of the top pitching prospects weeks ago, I told someone after that article that Bailey wouldn't rank high for me until he showed "consistent dominance." So, upon promotion, Bailey decided to go off, and currently has a 17 inning scoreless streak going at Double-A. He has earned his status as the game's 1A pitching prospect, especially after a dominating performance in Sunday's Futures Game.
Hughes was not as good on Sunday, but his stuff was solid, and you could see the makings of a very good player. Unlike Bailey he won't always necessarily amaze a scout, but his polish is pretty unique for a player his age. It's a good sign that Hughes has already turned a corner in AA, and at this pace, he should be up to New York at some point next season.
11. Jay Bruce, of: Reds (A-)
Earlier in the season, I did a study on teenage hitters in the Midwest League. Needless to say, the list of success stories was a short one; the expectation level for this group is (as a result) low. The type of season that Jay Bruce is having so far is unprecedented. Bruce is hitting for power at rates that even Prince Fielder did not at such an age. And he's doing so with a decent-enough strikeout rate. On the shortlist of people that wouldn't surprise me to be atop this list in a year.
12. Troy Tulowitzki, ss: Rockies (AA)
The best combination of offensive and pure shortstop ability on this list. Drew isn't a bad defender, but neither his range or arm can match Tulo up the middle. While Troy is not the same caliber hitter, he is in the ballpark. Tulowitzki offers good power for a middle infielder, and he has the patience learned from three big program collegiate years. Tulowitzki's problem is a strikeout rate that is too high, his one drawback from being complete as a hitter.
13. Andy Marte, 3b: Indians (AAA)
Things were a struggle for Marte much into the season; he was drawing poor reviews and his numbers followed. Marte was a mess; Atlanta and Boston could not have appeared smarter. While it's too early to say Marte has turned a corner, he's done enough to salvage his status as a first tier prospect. We continue to hope that Marte will eventually mold into a superstar, turn his promising young seasons into a star-studded future. Such a breakout may never happen, but color me surprised if Marte doesn't still build a solid career.
14. Carlos Quentin, of: Diamondbacks (AAA)
At this point, the fact that Quentin has not been given an extended trial in the big leagues is discouraging. In the winter, we asked what would by so wrong about Andy Marte to make two (good) organizations trade him. Now, Quentin is bringing up similar questions. Why are the D-Backs so reluctant to give Quentin the keys? At this point, the outfielder has shown patience (while continuing his high HBP totals), a very good contact rate and gap power. Quentin has polish all over his bat, and soon, teams will have to truly investigate what Arizona's asking price is on their #3 prospect.
15. Elijah Dukes, of: Devil Rays (AAA)
It's both a good and a bad sign when the only flaw in a prospect's resume is make-up. We can now say definitively that the Devil Rays did not assign enough value towards make up, but how important is it? The future of Dukes will go a long way in answering this question, he's truly a player whose progress will only be hindered by himself. I won't be surprised if Dukes ends up the best player on this list; I won't be surprised if he is a complete bust. With Elijah Dukes, only the middle would be a surprise.
16. Chris Young, of: Diamondbacks (AAA)
Undervalued before the 2005 season, I thought Young started to become overvalued this winter. He hit for power well, steals bases and plays very good defense, but batting average is a substantial limiting factor. With that being said, Young has struck out in just 18.3% of his at-bats this season, a very positive number. Look for Young's .282 BABIP to improve in the second half, and with it, his batting average. While we'd like it for Young to be showing more on the bases to call him a five tool talent, giving him credit for the "Hitting for Contact" tool is a big step in the right direction.
17. Andy LaRoche, 3b: Dodgers (AAA)
Three straight Bryan Smith pre-2005 breakout selections, sweet! LaRoche answered a lot of questions this season when he turned his Southern League struggles from last season around, looking like a much more complete player. While in AA, the third baseman walked in about 15% of his plate appearances, rarely struck out, and showed some of the power he had in Vero Beach a year before. I wouldn't be surprised if LaRoche struggles a bit as a rookie in 2007, and in the same league as David Wright and Ryan Zimmerman he might not make many All-Star teams, but he's a big chip in the Dodgers reconstruction.
18. Adam Jones, of: Mariners (AAA)
19. Jeff Clement, c: Mariners (AAA)
From a fantasy perspective, Jeff Clement is the Mariners best prospect. The list of power-hitting catchers at the Major League level is a short one, and a list Clement should be adding his name to by 2008. Despite his struggles coming back from injury in AAA, Clement has given the Mariners a lot of reason for optimism about their future backstop logjam. Given how quickly Clement should rise towards the top of any fantasy catcher list, keeper leaguers should have Clement ranked higher.
From a baseball standpoint, Jones is the better prospect. On the bases and in the field, Jones is superior. He brings a unique degree of athleticism to the game - his transition to the outfield has gone seamlessly. And if Jones joins Choo and Ichiro in a Major League outfield, it's quite possible baseball will have never seen three stronger arms in the same outfield. At the plate, Jones has improved as the season has progressed, showing more patience and better contact skills.
Jones shouldn't be a superstar on the Seattle Mariners, but he'll be a good one for a long time.
20. Carlos Gonzalez, of: Diamondbacks (A+)
The Diamondbacks have five prospects ranked higher than the top prospect of 19 organizations. Now really, is there any doubting that (scouting director) Mike Rizzo deserves a GM job somewhere? Gonzalez is not the best bet for success (Quentin) or player with the highest ceiling (Upton) in the organization, but he scores well in both categories. After hitting for solid power in the Midwest League last year, his huge slugging numbers in Lancaster should not come as a surprise. Gonzalez is better than the player he was last year, and not quite the player his numbers suggest currently. But with a few more walks and less strikeouts, the latter could very well change.
21. Jose Tabata, of: Yankees (A-)
Volatility. It scares me. If Tabata flames out, I look too quick to pull the trigger. But any lower, and you look stupid when he becomes a star. For now, his standing towards the back of the first tier will have to do, but it's a long way between now and 2009. Tabata has shown a solid contact rate, good doubles power, solid patience and good baserunning in his full season debut. And he's 17. Or is it, "But he's 17"?
22. Ian Stewart, 3b: Rockies (AA)
As you can tell, with his performance this season, I have dropped Felix Pie from the first tier. Ian Stewart, I have to say, is on the verge of getting the same treatment. While the third baseman is not posting Pie-type numbers in the Texas League, he has been pedestrian. For only so long can pedestrian be good enough. Eventually, we'll have to see that Stewart is going to turn those 26 doubles into home runs, and that he might be able to hit for average. For now, the hope of 2004 lingers enough to keep him in the top 25.
23. Nick Adenhart, sp: Angels (A+)
In a lot of ways, Adenhart is similar to Phil Hughes, a good blend of stuff and serious polish. Adenhart, for three months, has pitched far older than his age and level indicates. While he hasn't posted the double-digit-type K/9 numbers that many pitching prospects ranked higher and lower than him have, Adenhart offers poise that very few in the minors have ... for his age, only Hughes is close. The minor leagues continue to offer success story after success story for the Angels, who have quite the stable of young pitchers in Jered Weaver, Jose Arredondo and Adenhart to go with their accomplished pitching veterans.
Part Two, with 24-75, coming tomorrow...
| Baseball Beat | July 09, 2006 |
There's A New Sheriff in Town
Francisco Liriano pitched seven scoreless innings yesterday and is now eligible to be listed among the league leaders in rate stats such as ERA and one of our favorites, strikeouts per 100 pitches (or K/100P). The rookie southpaw allowed four hits and three walks while striking out seven batters in winning his 10th game and lowering his league-leading ERA to 1.83 Liriano's ERA is nearly a full run better than the #2 pitcher, teammate Johan Santana (2.76).
Among AL pitchers, Liriano ranks:
According to Elias, Liriano is the second rookie to head into the All-Star break with at least 10 wins and a sub-2.00 ERA. The other was Jerry Koosman of the New York Mets in 1968 when he was 11-4 with an ERA of 1.94. There is one big difference between these two seasons. Koosman's rookie campaign was the Year of the Pitcher. The league-wide ERA was 2.98. The Cincinnati Reds had the worst team ERA at 3.56. This year, on the other hand, the league-wide ERA is 4.56--or more than 50% higher!
Outside of the Mark Redman family, does anyone really believe that the fans of Kansas City would rather see the Royals veteran LHP than the Twins rookie LHP in the All-Star game?
Here are the K/100P totals for all qualified pitchers:
PLAYER          TEAM   K/100P
F. Liriano      Min     7.86
Johan Santana   Min     7.08
Pedro Martinez  NYM     7.04
Jake Peavy      SD      6.59
J. Bonderman    Det     6.50
Scott Kazmir    TB      6.37
C.C. Sabathia   Cle     5.91
Carlos Zambrano ChC     5.82
Felix Hernandez Sea     5.82
Mike Mussina    NYY     5.81
Chris Capuano   Mil     5.81
Aaron Harang    Cin     5.81
John Smoltz     Atl     5.78
Dave Bush       Mil     5.78
Curt Schilling  Bos     5.67
Chris Young     SD      5.61
O. Hernandez    NYM     5.52
Chris Carpenter StL     5.51
Ted Lilly       Tor     5.43
Jason Schmidt   SF      5.35
Brandon Webb    Ari     5.28
Josh Beckett    Bos     5.24
Randy Johnson   NYY     5.16
Vicente Padilla Tex     5.14
John Lackey     LAA     5.12
Dan Haren       Oak     4.99
Brett Myers     Phi     4.92
Cory Lidle      Phi     4.89
Ian Snell       Pit     4.84
Bronson Arroyo  Cin     4.79
Javier Vazquez  CWS     4.77
Jason Jennings  Col     4.74
Erik Bedard     Bal     4.73
Kelvim Escobar  LAA     4.67
Gil Meche       Sea     4.63
Brad Penny      LA      4.62
Chan Ho Park    SD      4.61
Roy Oswalt      Hou     4.59
Ervin Santana   LAA     4.54
Barry Zito      Oak     4.49
Nate Robertson  Det     4.48
Jose Contreras  CWS     4.43
Taylor Buchholz Hou     4.38
Kevin Millwood  Tex     4.37
Andy Pettitte   Hou     4.34
Doug Davis      Mil     4.24
Tom Glavine     NYM     4.23
Jeff Weaver     StL     4.19
Tim Wakefield   Bos     4.18
Tim Hudson      Atl     4.17
J. Verlander    Det     4.12
Greg Maddux     ChC     4.10
Roy Halladay    Tor     4.04
Sean Marshall   ChC     4.03
Cliff Lee       Cle     4.03
Jeff Francis    Col     3.94
D. Willis       Fla     3.83
Kenny Rogers    Det     3.78
Paul Maholm     Pit     3.78
Wandy Rodriguez Hou     3.76
Zach Duke       Pit     3.74
Matt Morris     SF      3.72
M. Hendrickson  LA      3.66
Miguel Batista  Ari     3.66
Paul Byrd       Cle     3.64
Freddy Garcia   CWS     3.62
Rodrigo Lopez   Bal     3.61
Mark Mulder     StL     3.53
Jamie Moyer     Sea     3.47
Jake Westbrook  Cle     3.44
Livan Hernandez Was     3.41
Clay Hensley    SD      3.37
Jarrod Washburn Sea     3.34
Joe Blanton     Oak     3.30
Ramon Ortiz     Was     3.28
Derek Lowe      LA      3.26
Jamey Wright    SF      3.23
Brad Radke      Min     3.20
Jon Garland     CWS     3.08
Aaron Cook      Col     3.05
Jason Marquis   StL     3.04
John Koronka    Tex     3.03
Kris Benson     Bal     3.01
Jeff Suppan     StL     3.00
Mark Buehrle    CWS     2.98
Josh Fogg       Col     2.92
Steve Trachsel  NYM     2.79
Carlos Silva    Min     2.77
Joel Pineiro    Sea     2.72
Scott Elarton   KC      2.60
Chien-Ming Wang NYY     2.41
Four of the top five pitchers in the AL--Liriano, Santana, Scott Kazmir, and C.C. Sabathia--are left-handers. The only other pitcher in the top five is right-hander Jeremy Bonderman, who is enjoying a breakout season.
I like to look for pitchers who combine the ability to strike out batters and induce groundballs. The top five pitchers in K/100P who also have a G/F ratio of at least 2.0 are Liriano (2.31), Bonderman (2.03), Felix Hernandez (2.18), Chris Carpenter (2.15), and Brandon Webb (3.84). All five pitchers rank in the top 21 in K/100P and top 13 in G/F.
On the other end of the spectrum, I dislike pitchers who allow an inordinate number of flyballs and are unable to miss bats. The bottom five in K/100P with G/F under 1.00 are Scott Elarton with the second-worst K/100P and G/F (0.58) in the majors, Steve Trachsel (0.95), Jarrod Washburn (0.98), Livan Hernandez (0.86), and Jamie Moyer (0.93). Of these pitchers, only Elarton is an extreme flyball type. I have no idea why the Royals keep throwing his glove out there and hereby nominate the 30-year-old right-hander as the worst "regular" starting pitcher in the big leagues.
Chien-Ming Wang (3.24 G/F), Aaron Cook (3.43), Jamey Wright (2.86), Derek Lowe (3.56), and Jake Westbrook (3.28) can get away with low K/100P rankings because they keep the ball on the ground and in the ballpark. However, Wright is walking too many batters (43 in 110 1/3 or 3.50 BB/9) to be effective, as evidenced by his 1.26 K/BB rate and 5.06 ERA.
Now it's also important to point out that pitchers don't have to induce grounders to be successful. Pedro Martinez, Jake Peavy, Mike Mussina, Curt Schilling, Chris Young, Jason Schmidt, and John Lackey have pitched well, despite allowing more flyballs than groundballs. Why? Because they all rank among the top 25 in K/100P.
Update: At reader and guest columnist Kent Bonham's request, here is a graph courtesy of Dave Studeman of The Hardball Times and Baseball Graphs, depicting K100P and GB % (rather than G/F).
| Baseball Beat | July 08, 2006 |
Don't Be Jaked By Peavy's Mainstream Stats
On the surface, it appears as if Jake Peavy is having a poor season. His record stands at 4-8 with a 4.46 ERA. So what's wrong with Peavy, you ask? Well, not much.
Let's compare his vital stats this year to those in 2004 when he led the National League in ERA:
        G  GS   W-L     IP    H   R  ER  HR  BB   SO   ERA   BR/9   H/9  BB/9   K/9   K/BB
2004   27  27  15-6  166.1  146  49  42  13  53  173  2.27  11.34  7.90  2.87  9.36   3.26
2006   17  17   4-8  107.0  102  53  53  14  26  118  4.46  10.98  8.58  2.19  9.93   4.54
Peavy is actually walking fewer batters (top left graph below) and striking out more (top right) per nine innings in 2006 than 2004, yet his ERA is more than TWO runs higher this year. That's almost impossible. How can that be? The obvious answer is that Jake is serving up more gopher balls (bottom left) this season (1.18 per 9 IP) than two years ago (0.70/9).
A closer examination shows that Peavy is giving up more flyballs (45.7% vs. 37.0%) and a greater percentage of those batted balls are leaving the ballpark (10.4% vs. 8.0%). But there are some other factors at play here. Consider that the 25-year-old right-hander has yet to allow an unearned run this year, whereas he gave up seven such runs in 2004. Furthermore, Jake's batting average on balls in play (BABIP) is a tad higher (.324) than it was two years ago (.310) despite the increase in flyballs and a decrease in groundballs.
Perhaps due to the reduction in grounders, Peavy is inducing fewer GIDP (0.34 per 9 IP vs. 0.92/9 in 2004). Jake is also allowing more stolen bases (1.26 SB/9 IP) than before (0.87).
Thanks to sites such as The Hardball Times and Fan Graphs, we can also ascertain one other important variable that gets little, if any, attention even among the stathead crowd. Peavy's LOB% was 84.0% in 2004 and is just 70.0% in 2006 (bottom right). That is an important difference. The 6-foot-1, 180-pounder was lights out with runners on base two years ago (.218/.311/.324) compared to the current campaign (.250/.315/.424).
With respect to the difference in Peavy's won-loss records, look no further than run support. When Peavy was 15-6 in 2004, the Padres averaged 6.44 runs per nine innings while he was the pitcher of record. His run support ranked 12th out of 86 qualified pitchers. This year, his teammates are scoring 4.21 runs per 9 IP, ranking him 82nd among 93 qualified pitchers.
The bottom line is that Peavy's Expected Fielding Independent Pitching (xFIP) is virtually the same this year (3.50) as it was in 2004 (3.56). In other words, the native of Mobile, Alabama hasn't lost much, if anything. He is basically the same pitcher. You just wouldn't know it by looking at his win-loss records and ERAs.
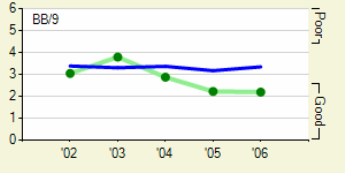
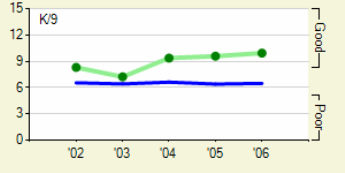
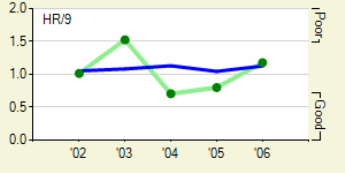
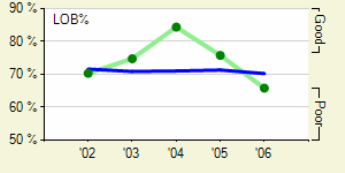
Graphs courtesy of Fan Graphs.
| WTNY | July 06, 2006 |
Mixing Youth
Is it too early to mention the word 'dynasty' in Chicago? With one championship already in tow, the Sox appear to be the near-favorites to repeat in 2007. Even if they fall up short, the White Sox recent run has put fans in the stands, money in the payroll, and wins on the scoreboard. At the least, the Sox need to be thinking in dynasty terms.
Kenny Williams now faces the difficult job of keeping the momentum going. He has set the bar high for himself and the organization, and the pressure will be on to continue winning games. This winter, he excelled in this role, taking chances that -- in the cases of Thome, Vazquez and Cintron -- are now paying off two-fold.
We all remember the New York Yankees dynasty in the 1990s, one built on homegrown success with players like Derek Jeter, Bernie Williams and Mariano Rivera. We have also seen the Yankees on a current world championship slide that I think every Sox fan would hope to avoid in a few years.
So what is it that the Yankees failed to do? Well, with all kinds of money, the Yankees went out and started buying. They bought the perceived best in everything, and forgot what earned them championships - player development. Meshing in youth with proven veterans became a philosophy Brian Cashman discarded.
I'm here to say the White Sox must avoid this trend. Kenny Williams must continue to fill certain slots with youth, making the difficult decisions of when to bring on a prospect, and when to trade him. Today, we'll look at the Sox Major League roster and minor league depth chart, and try to answer some of those questions.
As an outsider, I don't think it's a stretch to say the current White Sox have two weaknesses: Scott Podsednik and the bullpen. Pods is currently manning a .698 OPS, and his defense has drawn criticism from Ozzie himself. As far as the bullpen goes, I think an aggregate 4.43 ERA was not what the Sox had in mind. These are the first places to look into the farm system.
Williams toed the line of angering his team when he traded Aaron Rowand this winter, a good friend to many and a valued member of the clubhouse. Williams was lucky to have Brian Anderson ready and Jim Thome coming to lighten the blow, leaving no White Sox player too upset. However, along the backlash lines, I don't think the Sox can really afford to bench, trade or release Podsednik this season.
Surely, the current lineup has enough firepower to withstand Podsednik's offensive inadequacies. But in the future, the Sox can't afford to depend on that. Luckily, at the end of the season, Podsednik is a free agent. Williams will be making no public relations risk when allowing Podsednik to ride into the sunset. And with that, left field will be open.
Yes, the Sox will have money to potentially acquire a big name to fill Pod's small shoes. But since left field expectations are already low, and the Sox have potential replacements in Triple-A, I don't see the point. To me, this means Spring Training competition: Ryan Sweeney v. Jerry Owens v. Josh Fields.
Fields? Fields. As a pro, the former Cowboy has yet to play a single position besides third base. The Sox have let this ride up to Triple-A, up to Fields' breakout as a prospect. Third base is already manned by someone sub-30, and will continue to be as Joe Crede just entered arbitration in 2006.
One option is to trade Fields while his value is high, his prospect status seemingly at a pinnacle. But answer me this: if you were another GM, would you not see that Williams has a depth problem? If he leaves Fields at third base, he has no choice but to trade him, right? Wouldn't you then offer less for the 2004 first rounder?
My belief is that Fields should begin playing left field now, for the rest of the season, and continue to do so in the Arizona Fall League. Next season, Fields should compete with the other current members of the Knights outfield for the left field spot, which will have been vacated by Scott Podsednik's exit from the lineup.
Seeing as though defense is part of the White Sox brand, I can see you all wince at the thought of putting a never-before-outfielder in left. But we aren't talking CLee-type defense with Fields, to say that would be to underrate his athleticism. This was a Big 12 quarterback, my friends, and a player currently apt to steal a base. It would take him awhile to learn the reads, but with a half-season, the AFL, and Spring Training, I think he would be ready.
Some would argue his bat already is. Fields has both 33 extra-base hits and walks in Triple-A, both in just 243 at-bats. He has stolen 13 bags in 17 attempts (there's that athleticism, again), and is sporting a .957 OPS. The power and patience are there, and he would add another home run threat to a lineup in Chicago chock-full of them. The question mark is his contact ability.
With 78 strikeouts so far, Fields is whiffing in an atrocious 30+ percent of his at-bats. To maintain a .321 batting average, Fields has a ridiculous .448 batting average on balls in play. While his ability to hit the ball hard would indicate his BABIP should be higher than the average player, .448 is completely unsustainable. So, my concern about Josh Fields would be that in the Major Leagues, there's a good chance his batting average will look like Crede's did, in 2004.
If not Fields, the other options would be Sweeney or Owens. Sweeney has been an organizational darling since Spring Training 2004; the field in Tucson still wet from the Sox' organizational drool. His results in the power department, however, have been lacking. This season, Sweeney's ability to hit a single has continued. He remains a fantastic contact ability, though his current strikeout rate (16.2%) is nearly 30 percent higher than it was in 2004-2005 (12.5%).
Sweeney cannot, however, up his extra-base hit percentage. This season, Sweeney has continued to hit for more bases in about 6% of his at-bats, where Josh Fields is at 13.6%. Sweeney will likely be able to hit .280-.300 as a pro, but any slugging far above .400 would be a surprise. Given a walk rate that isn't bad but far from great, you're looking at about .280/.320/.380 next season. Note that I do think Sweeney has upside at this line, but it would take a philosophical change to learning to elevate the ball more that he has to undergo.
The eldest of the group, Jerry Owens, is having the most struggles with Charlotte. His current .241/.305/.314 line is far from a career .757 OPS. But really, our focus should be that career OPS, likely headed to about .720. Can we truly expect Owens to out-perform Podsednik when he has merely done so at lower levels? Like Sweeney, Owens is a gifted contact hitter, and also one that can draw a walk. Add on his ability to steal bases at an awesome rate, and you can see why the Sox like him.
But while Sweeney hits the ball hard, but into the ground, Owens doesn't really hit the ball hard at all. This explains a lower BABIP than Sweeney, and will be the cause of (far) lower 2006 predictions.
The answer, as we've seen it, is Josh Fields. His conversion to left field should begin now, and the Sox should also be preparing Sweeney as a back-up plan. Owens, in this case, is odd-man out. The only other option, in my mind, is trading for a left fielder using one of the already-established starters. But we'll deal with the pitching staff in part two.
Before I go, some quick thoughts on handling the rest of the offense:
| WTNY | July 05, 2006 |
Juggling Prospects
No Major League draft prospect is more coveted than the five tool player. While baseball's highest level is littered with success stories, athletic outfielders have been among the largest busts of the first round. Many in baseball claim teams should adopt a safer approach in regards to the draft, taking safer picks from the college ranks.
Rarely do these two paths intersect. And in the rare instances they do, the players are high commodities, with dreams of Barry Bonds dancing in the heads of scouting directors. This past June, Drew Stubbs was drafted in the top ten as the quintessential example of five-tool pipe dream mixed with collegiate intelligence.
The 2005 draft offered three of these players. A half season into their full season debuts, their success comes as a small surprise to many around baseball. Two first round picks and one third rounder, all three players were highly desired for their speed, their defense in center, their ability to bat around the top of the order. While not prodigious in one of the five tools -- power -- all offered some hope of projectablity.
All similar athletes with similar profiles, choosing an order is the perfect example of the difficulties -- and the silly subjectivity -- of ranking prospects. Gardner, Crowe, Ellsbury. Or is it Ellsbury, Gardner, Crowe? Today, we'll attempt to hash out which players belong in which order, and why.
THE EARLY YEARS
Athletic young outfielders are a commodity out of the preps, but to be a draft choice, there needs to be a ridiculous amount of tools or very good refinement. In 2002, Denard Span and Jeremy Hermida were examples of players that fit the bill. Trevor Crowe, Jacoby Ellsbury and Brett Gardner were not. All three players had strong college commitments, and these commitments were founded upon a lack of high interest from Major League organizations. Crowe and Ellsbury were both second day picks, in that order, while Gardner did not get drafted.
As far as college destinations go, the players picked programs that ranked in order of how they did in the draft. Crowe, the most talented of the group, went to Arizona. After not starting as a regular, Crowe ended his freshman season with 187 at-bats, and a .316 batting average. He didn't walk and showed little but gap power, but Crowe could steal bases and hit for average. He was exactly what the Wildcats bargained for.
Ellsbury became a regular quicker at Oregon State, and produced more. A .330/.427/.510 line his freshman season turned a lot of scouts' heads, and suddenly Ellsbury was on the map for the 2005 draft. A great defender in centerfield, teams were drooling. On the opposite end, Brett Gardner wasn't drawing any notice, struggling in his first season at College of Charleston. His .284 batting average and 28 steals were both good, but Gardner struck out 50 times and had just 11 extra-base hits in 215 at-bats.
As sophomores, Gardner and Crowe both did well in catching up to Ellsbury, and both owed their newfound success to the triple. Both players logged 9 triples on the year, as Crowe's slugging percentage went up to .576, Gardner just two points behind. Crowe also stole 26 bases in 27 chances, and showed an improved batting eye. He flew up follow lists. Gardner did the same, nearly hitting .400 in a fabulous display of future leadoff talents. While Gardner didn't boast the pedigree of Ellsbury and Crowe, all three entered their junior seasons separated by little.
BEFORE AND AFTER
It is not difficult to figure out why Trevor Crowe was the first of the three players drafted, taken 12th overall in 2005 by the Cleveland Indians. As a junior, Crowe exploded, jumping his triples total to 15, giving him 49 XBH in the small college season. His 36 walks showed a huge improvement in two seasons, and his 27 stolen bases with a career single season high. Crowe was for real, and the Indians loved the Oregon native.
In Crowe's home state, Ellsbury was making noise as the Beavers had a Cindarella run to Omaha. Much of the team's press went towards Ellsbury, who seemed to act as the soul behind the team. Ellsbury struck out just 21 times in the leadoff role as a junior, hitting .406 en route to a first round draft choice by the Red Sox.
Brett Gardner had the best numbers of the three players, but was not drafted until the end of the third round, by the Yankees. Playing in a worse conference, Gardner feasted on college pitching as a junior, hitting a ridiculous .447/.506/.571. Gardner also had great speed, stealing 38 bases. A quick look at his college numbers validated that the Yankees received good value on their choice.
After signing quickly, Gardner and Ellsbury would play against each other in the New York-Penn short-season league. Unsurprisingly, Ellsbury was better than his peer, stealing four more bases while boasting a .097 advantage in the OPS column. Crowe was struggling, but the Indians had been aggressive with him, pushing their first round pick to the Sally League. His .326 slugging percentage raised question marks, and many began to wonder if the patient Ellsbury was perhaps the best of the bunch.
GETTING HIGH-A
The most discouraging aspect of Ellsbury's season has been his abandonment of the base on balls. Consistently one of the group's most patient hitters with aluminum bats, Jacoby's walk totals have gone down as Crowe's have gone up. While no team could scoff at a .384 on-base percentage from the leadoff role, an extended time treading 50-70 points behind his athletic peers will leave him in the dust.
As mentioned, Crowe has turned things up this season. He is walking in nearly 20% of his plate appearances, which is more than a 15% increase since his freshman season at Arizona. In addition to his more patient approach, Crowe is also swiping more bags than ever. While not the fastest among the three players we are discussing, Crowe might be the most cognizant; his success rate is always among the highest.
Brett Gardner is the surprise of the season, vaulting himself from an afterthought in this discussion to a name we must consider. The Yankees have been more aggressive with him than the approach we've seen by the Red Sox or Indians; Gardner has been promoted to Double-A after a good half-season with Tampa. During that time, the College of Charleston outfielder hit .323, swiping 30 bags while walking 43 times. His only problems were the lack of extra-base hits, and a strikeout rate that he hasn't sniffed for years. Still, given his successful time in Tampa, Gardner has a claim to be the Yankees 3rd prospect.
CONCLUSIONS
In terms of ceiling, and upon further inspection, there is little question which prospect reigns supreme: Crowe. His substantial power edge, intelligent baserunning and enhanced patience leave an extremely intriguing product. while his contact skills grade out as the group's worst, his combination of line drives and quick feet should give him high enough annual BABIP numbers to offset his swing-and-miss disadvantage.
Conversely, Ellsbury is the contact hitter of the group. His 12.1 K% is fantastic, and down the road, should yield even higher batting averages than Ellsbury is even showing. The power has been the question mark with Ellsbury, no longer going extra bases with a wooden bat. This is a trait that is hard to project being a plus at this point, limiting Ellsbury to a leadoff role down the line. If he fails in leadoff, there is no real backdrop.
However, ranking prospects is about comparing a prospect's upside with the likelihood he reaches it. Where Ellsbury falls short in terms of ceiling, he may be the group's surest thing. One statement that I'm confident in making is that Brett Gardner is the largest question mark. This is no particular damnation of Gardner, he's up against two good bets.
My reasoning for saying this is that in terms of contact rates, Crowe and Gardner are toss-ups for who is worst. Both striking out at 21-22% rates this season, I mentioned Crowe as the worst contact hitter because he showed a higher aptitude for whiffs in most of college. Most, except a freshman season in which Gardner struck out 50 times. Plus, while Crowe leans back on his power as a trade-off, Gardner remains nothing more than a gap-power hitter.
Because of low power totals, it's difficult to project Ellsbury or Gardner hitting anywhere but atop an order. In comparing their skill sets, I have Ellsbury as the player more likely to hit for average (this season's difference be damned), while Gardner should make up for that with higher walk rates. Similar players both on the bases and in the field, it all comes down to a question of power. And for every season except their sophomore year, Ellsbury has showed more power than Gardner. Narrowly, he's the better prospect.
For the last four seasons, three prospects with one profile have been among high profile baseball circles. This season, as they enter prospect rankings, we know pretty much what most draft boards did a year ago (and recruiters years before that): Crowe, Ellsbury, Gardner.
| Baseball Beat | July 03, 2006 |
Lists, Lists, and More Lists (Part Two)
As a follow-up to yesterday's article, we present the pitching leaders in a number of special categories not widely publicized (all stats through Saturday, July 1):
PITCHING
Pitches Thrown
AL: Curt Schilling, 1823
NL: Carlos Zambrano, 1906
...and these numbers exclude Sunday's outing when Zambrano threw 112 more pitches. Oh, did I mention that Carlos has hit THREE home runs through Sunday?
Batting Average Allowed (BAA)
AL: John Lackey, .209 (81/388)
NL: Carlos Zambrano, .194 (78/403)
Lackey improved his league-leading mark on Sunday when he allowed only four hits in 6 2/3 innings of work vs. the Dodgers. He has become the ace of the staff and one of the best starters in the AL.
OBP Allowed
AL: Johan Santana, .253 (116/459)
NL: Pedro Martinez, .267 (108/405)
Are these the two best starters in baseball? They not only lead in OBP allowed but in K/100P (see the bottom of the sidebar to the left).
SLG Allowed
AL: John Lackey, .327 (127/388)
NL: Derek Lowe, .333 (142/426)
There's that Lackey guy again. Lowe has allowed only seven HR this year after giving up a career-high 28 in 2005. His worst season had been 17 in 2003 so it looks like last year was a fluke.
ERA at Home
AL: Scott Kazmir, 2.36 (11/42.0)
NL: Josh Johnson, 1.62 (8/44.1)
What is it about those Florida ballparks? Kazmir is third in K/100P in the AL. Johnson put up a solid line (7-4-3-3-4-5) against the Red Sox at home on Sunday. The 6-foot-7, 240-pound RHP needs to reduce his walk totals but looks as if he is here to stay.
ERA on the Road
AL: Justin Verlander, 2.25 (12/48.0)
NL: Aaron Harang, 1.57 (10/57.1)
Verlander is near the top in a number of pitching categories, including mainstays like wins (6th w/ 10) and ERA (3rd, 3.13). Harang is third in the NL in K/100P and among the league leaders in Wins (9), WPct (.643), IP (112.1), SO (109), ERA (3.45), and CG (3).
AVG vs LHB
AL: Fernando Rodney, .132 (7/53)
NL: Enrique Gonzalez, .113 (7/62)
Rodney throws gas and can pierce 100-mph on the radar gun. Gonzalez has pitched well against LHB and at home. It's too early to tell if he is the real deal or not.
AVG vs RHB
AL: Johan Santana, .200 (68/340)
NL: Carlos Zambrano, .142 (32/226)
A couple of familiar names. You gotta love it when a LHP like Santana has the best BAA vs. RHB. His outstanding changeup might have something to do with that.
AVG w/ Men on Base
AL: Rafael Soriano, .177 (14/79)
NL: Jason Isringhausen, .158 (9/57)
After pitching just 10 2/3 innings in 2004-05, Soriano has bounced back and become the dominant relief pitcher he was in 2003 when he fashioned a 1.53 ERA with 68 Ks in 53 IP.
AVG w/ RISP
AL: Scott Kazmir, .168 (17/101)
NL: Jason Schmidt, .111 (8/72)
Speaking of comebacks, Schmidt has once again become one of the best starting pitchers in the NL this season. He ranks in the top ten in IP (115.1), SO (99), ERA (2.73), WHIP (1.09), WPct (.667), CG (3), and BAA (.211).
Run Support Per 9 IP
AL: Javier Vazquez, 8.88 (100/101.1)
NL: Jeff Suppan, 7.41 (76/92.1)
Now you know why Vazquez is 8-4 despite a 5.15 ERA and Suppan 6-4 with a 5.17 ERA and 1.56 WHIP.
G/F Ratio
AL: Jake Westbrook, 3.19 (220/69)
NL: Brandon Webb, 3.82 (252/66)
Keep the ball on the ground, keep the ball in the yard. Westbrook has allowed only 8 HR in 103 innings, while Webb has given up just 9 dingers in 132 1/3 frames.
GIDP Induced
AL: Chien-Ming Wang, 18
NL: Miguel Batista, 18
    Roy Oswalt, 18
    Jamey Wright, 18
GIDP Induced/GIDP Situation
AL: Jason Johnson, .238 (15/63)
NL: Ray King, .333 (8/24)
Johnson should find Boston's infield defense to his liking. His K/9 rate (3.78) is abysmal but his BABIP (.349) is well above his career norm (.306). Johnson's FIP (5.00) this year is more than a run below his actual ERA (6.22), whereas his career FIP (4.96) matches his lifetime ERA (4.97).
Stolen Bases Allowed
AL: Freddy Garcia, 20
NL: Chris Young, 18
Caught Stealing Off
AL: Kelvim Escobar, 8
NL: Zach Duke, 8
The Pirates have two young southpaws who do a whale of a job in preventing baserunners from stealing. Scroll down to find out the name of the other lefty.
SB Att (1BH+BB+HBP)
AL: Kenny Rogers, .021 (2/95)
NL: Chris Capuano, .019 (2/108)
Pickoff Throws per Baserunner
AL: Kenny Rogers, 0.50 (66/132)
NL: Chris Capuano, 0.74 (111/149)
Maybe pickoff throws do indeed help in keeping runners close to the bag. Rogers and Capuano have attempted more pickoffs than any other pitcher and runners have responded by almost never running on them.
Pickoffs
AL: Justin Verlander, 5
NL: Paul Maholm, 6
Verlander is tough to hit but is also difficult to run against. He has picked off five runners and only allowed one stolen base. Pretty impressive for a rookie RHP.
% Inherited Runners Scored
AL: B.J. Ryan, 4.5 (1/22)
NL: Chad Bradford, 9.7 (3/31)
Ryan has been lights out this year. The Toronto closer has an ERA of 0.45 with 22 saves. His WHIP is 0.64 and BAA is .137. He has whiffed 51 batters in 40 1/3 IP, including all five outs vs. the Phillies on Saturday.
First Batter Efficiency
AL: Chris Britton, .045 (1/22)
NL: Tom Gordon, .133 (4/30)
Source: STATS LLC
| Baseball Beat | July 02, 2006 |
Lists, Lists, and More Lists
At the halfway point in the 2006 seaon, we present the leaders in special batting categories not widely publicized (all stats through Saturday, July 1):
BATTING
Fly/Pops Hit
AL: Orlando Cabrera, 126
NL: Carlos Lee, 127
    Alfonso Soriano, 127
This is the first year in which Cabrera has hit more balls in the air than on the ground. He has a lifetime 1.17 G/F ratio. Orlando's walk (.084 per PA) and BB/SO (1.22) rates are the highest ever. He is also putting up career bests in AVG (.299) and OBP (.361) and has a current streak of getting on-base in 58 consecutive games, the longest such skein since 1960.
% Flys/Pops Hit
AL: Jonny Gomes, 66.23% (100/151)
NL: Jason Lane, 64.08% (91/142)
Two players who are struggling. Gomes hit .203/.289/.392 in June and hasn't gone deep since slugging two vs. Kansas City three weeks ago. Lane hasn't hit for average at home (.226) or on the road (.187), vs. LHP (.226) or RHP (.200). To his credit, he has drawn 40 walks and ripped 11 HR.
Grounders Hit
AL: Ichiro Suzuki, 174
NL: Juan Pierre, 161
Suzuki is well on his way to his sixth consecutive 200-hit season. Only Willie Keeler (8, 1894-01) and Wade Boggs (7, 1983-89) have had longer streaks. Ichiro is 24 hits shy of matching his Japan total and now has 2,532 for his combined career.
% Grounders Hit
AL: Derek Jeter, 79.12 (144/182)
NL: Matt Murton, 74.39 (122/164)
In his first full season, Murton is looking more like a platoon or fourth outfielder. He is mashing LHP (.333/.410/.493) with 9 BB and 5 SO in 69 AB but is struggling vs. RHP (.234/.299/.304) with 13 BB and 31 SO in 158 AB.
Groundball/Flyball Ratio
AL: Derek Jeter, 3.79 (144/38)
NL: Matt Murton, 2.90 (122/42)
Always a groundball-type hitter (2.20 career G/F ratio), Jeter is banging them into the turf at a higher rate than ever before. Derek is hitting in the .330s for the first time since 2000 and is walking at the highest rate (.121) since 1999. He is a legitimate MVP candidate this year.
Pitches Seen
AL: Kevin Youkilis, 1533
NL: Bobby Abreu, 1550
Although Abreu's batting average and power are down, his OBP is the highest its been since 1999 when he hit .335 with 109 BB. Bobby has walked at least 100 times in each of the last seven seasons and is on pace to exceed 150 free passes this year.
Pitches Seen per PA
AL: Kevin Youkilis, 4.47 (1533/343)
NL: Bobby Abreu, 4.49 (1550/345)
The Greek God of Walks has seen more pitches in total and per plate appearance than any other batter in the AL this year. Youkilis slugged his 10th HR of the season on Sunday, raising more than a few eyebrows with his power. He has played first and third base and been the most valuable addition to Boston's starting lineup this year.
% Pitches Taken
AL: Jason Giambi, 66.3% (886/1337)
NL: Barry Bonds, 68.3% (670/981)
The names of Giambi and Bonds are usually not found in the same sentence because of the high percentage of pitches taken. These power hitters are as selective as they come when it comes to swinging at pitches. Both sport outstanding on-base and isolated power marks to more than offset suspect defense and baserunning.
% Swings That Missed
AL: Frank Catalanotto, 5.8% (21/364)
NL: Juan Pierre, 6.1%  (37/608)
Catalanotto is the best-kept secret in Canada. He is hitting .335/.439/.503 and now has a career batting average of .300. The left fielder has never walked more than he struck out, yet has 35 BB and just 15 SO this season. As a role player, Frank is much more valuable to the Blue Jays than to any fantasy owner and that may be why he has never quite gotten his due.
% Swings Put Into Play
AL: Placido Polanco, 60.2% (278/462)
NL: Scott Hatteberg, 61.4% (208/339)
Polanco has reverted to his prior career form with a batting average in the .280s after hitting .331 last year. He has always put the ball in play, striking out in fewer than 7% of his plate appearances.
% Strikes Taken
AL: Vladimir Guerrero, 8.2% 8.2 (57/698)
NL: Jeff Francoeur, 10.8% (82/758)
Guerrero and Francoeur have never met a pitch they didn't like (or wave at). Although there are a lot of similarities between the two right fielders, Guerrero has been much more productive when swinging at pitches. Vlad has hit for a higher average (.292 to .251) and more power (19.3 to 22.6 HR/AB) than his NL counterpart.
% Swung at 1st Pitch
AL: Johnny Damon, 10.1% (36/356)
NL: David Eckstein, 10.2% (36/352)
Two of the most patient lead-off hitters in the game. Damon and Eckstein work the pitcher by rarely swinging at the first offering. These "little things" aren't always appreciated among statheads but are valuable nonetheless.
Bunts In Play
AL: Corey Patterson, 28
NL: Juan Pierre, 37
Patterson and Pierre would have made better fast-pitch softball players than big leaguers. Slow pitch, no. Fast pitch, yes.
AVG w/ Men on Base
AL: Frank Catalanotto, .446 (37/83)
NL: Dan Uggla, .396 (42/106)
There's Catalanotto's name again. Uggla has been anything but ugly for Florida. After missing a week due to a sore hamstring, he was back in the starting lineup this weekend vs. Boston. The NL Rookie of the Year candidate is hitting .308 with 13 HR.
AVG RISP
AL: Kenji Johjima, .407 (22/54)
    Placido Polanco, .407 (22/54)
NL: Albert Pujols, .480 (24/50)
AVG Late & Close
AL: Reed Johnson, .609 (14/23)
NL: Nomar Garciaparra, .444 (12/27)
At the risk of small sample sizes, the players in the two categories above have hit well thus far with runners in scoring position or late and close. Call them clutch, call them lucky. Whatever you prefer. The numbers are what they are but also subject to huge swings between now and the end of the season.
AVG vs LHP
AL: Vladimir Guerrero, .418 (33/79)
NL: Freddy Sanchez, .500 (29/58)
Can you say breakout season? Sanchez is hitting .356/.390/.517 with 24 doubles and more than 40 runs and RBI in 79 games. He is also leading the league in OBP vs. LHP and batting average at home (see below).
OBP vs LHP
AL: Jermaine Dye, .495 (48/97)
NL: Freddy Sanchez, .531 (34/64)
Dye has already slugged 20 HR, including 8 in just 78 AB vs. LHP.
SLG vs LHP
AL: Jonny Gomes, .768 (53/69)
NL: Bill Hall, .833 (45/54)
Hall just may be the most underrated player in the game. With the injury to J.J. Hardy, the former utilityman has become Milwaukee's everyday shortstop. He has 40 extra-base hits in 72 games. The 26-year-old has also played second, third, and center this year.
AVG vs RHP
AL: Joe Mauer, .391 ( 70/179 )
NL: Miguel Cabrera, .352 (80/227)
What's most amazing about Mauer is that he is tattooing everybody everywhere. To wit, the #1 pick in the 2001 draft is hitting .393 vs. LHP, .391 vs. RHP, .380 at home, and .403 on the road. Consistent but, more importantly, just flat out awesome.
OBP vs RHP
AL: Joe Mauer, .469 (97/207)
NL: Nick Johnson, .442 (100/226)
Johnson is on pace to post career highs in AVG (.300), OBP (.429), and SLG (.533). When healthy, he is among the most productive hitters in the NL.
SLG vs RHP
AL: Jim Thome, .780 (124/159)
NL: Albert Pujols, .709 (117/165)
It takes more than great slugging vs. RHP to win the MVP but two of the leading candidates are doing just that.
AVG at Home
AL: Ichiro Suzuki, .387 (67/173)
NL: Freddy Sanchez, .396 (55/139)
If Safeco is a pitcher's park, how much does it really affect a player like Ichiro? A word to the wise: be wary of adjusted park data as a be all and end all to evaluating hitters.
AVG on the Road
AL: Joe Mauer, .403 (56/139)
NL: Scott Rolen, .391 (45/115)
Rolen is a lock to win Comeback Player of the Year in the NL. The way Scott is swinging the bat this year, one would never know he hit just .235 with 5 HR in 2005. He is on pace to reach career highs in AVG (.343) and OBP (.411) while SLG (.577) is only a tad shy of his best season in 2004.
SB Attempt (1BH+BB+HBP)
AL: Corey Patterson, .522 (35/67)
NL: Jose Reyes, .457 (43/94)
After reaching first base on a single, walk, or hit by pitch, Patterson and Reyes are attempting to steal second more often than anyone else.
Steals of Third
AL: Derek Jeter, 7
    Scott Podsednik, 7
NL: Alfonso Soriano, 8
Stealing third is an art in itself. Sure, it takes speed. But it also takes an even bigger lead and jump to swipe third than second. The best time to steal third is usually with one out as you don't want to make the first or last out of an inning at third.
GDP/GDP Situation
AL: Grady Sizemore, 0.0% (0/57)
NL: Craig Counsell, 0.0% (0/30)
Sizemore is an excellent all-round player. His stats speak for themselves. But here is one that gets almost no attention.
Extra Bases Taken as Runner
AL: Chone Figgins, 0.85 (22/26)
NL: Mike Cameron, 0.83 (19/23)
The above percentages are extraordinarily high. Always a great baserunner, Figgins took the extra base 62% of the time last year. His rate this year is worth an extra five or six bases vis-a-vis 2005. Cameron took the extra base 64% of the time last season without being thrown out, another important component to this baserunning stat.
Tomorrow: Special Pitching Stats
Source: STATS LLC