Rich Lederer • Baseball Beat
Patrick Sullivan • Change-Up
Jeremy Greenhouse • Touching Bases
Dave Allen • F/X Visualizations
Sky Andrecheck • Behind the Scoreboard
Marc Hulet • Around the Minors
Al Doyle • Past Times
Retired Uniforms:
Bryan Smith • WTNY
Joe Sheehan • Command Post
Jeff Albert • The Batter's Eye
RSS Feed
Home
*Examining the Past, Present, and Future*
Lineup Card
Recent Entries
» Putting Together a Reality Team
» Historical Hall of Fame Vote Comparisons: 2012
» An All-Christmas Team
» The New-Look Angels
» John Denny: The Forgotten Cy Young Award Winner
» Money Isn't Everything
» What Would It Take to Hit .400 in the 21st Century?
» Halos Heaven
» Brandon McCarthy's Breakout Season
» Link-o-Rama
» Historical Hall of Fame Vote Comparisons: 2012
» An All-Christmas Team
» The New-Look Angels
» John Denny: The Forgotten Cy Young Award Winner
» Money Isn't Everything
» What Would It Take to Hit .400 in the 21st Century?
» Halos Heaven
» Brandon McCarthy's Breakout Season
» Link-o-Rama
Best of Baseball Beat
Abstracts From the Abstracts
1977 Baseball Abstract
1978 Baseball Abstract
1979 Baseball Abstract
1980 Baseball Abstract
1981 Baseball Abstract
1982 Baseball Abstract
1983 Baseball Abstract
1984 Baseball Abstract
1985 Baseball Abstract
1986 Baseball Abstract
1987 Baseball Abstract
1988 Baseball Abstract
1978 Baseball Abstract
1979 Baseball Abstract
1980 Baseball Abstract
1981 Baseball Abstract
1982 Baseball Abstract
1983 Baseball Abstract
1984 Baseball Abstract
1985 Baseball Abstract
1986 Baseball Abstract
1987 Baseball Abstract
1988 Baseball Abstract
Bert Blyleven Series
Meeting Up and Hanging Out with Bert
The Results Are In And...
Aficionado Heavily Invested in Blyleven
Latest on Blyleven's Chances for the HOF
The Internet Zealot Responds
400 Down and 5 to Go...
Bert Be Home By Eleven?
Blyleven's Forgotten Season (1973)
HeyMan, Your Comments Don't Hold Water
The Waiting is the Hardest Part
Another Addition to the Blyleven Series
Search for the Truth
As Dominant as His HOF Contemporaries
Listen, Buster
A Larger Step for Blyleven
Answering the Naysayers (Part Two)
Another Small Step for Blyleven
Q&A: Blyleven on the Twins
The Majority Rules, Right?
It's All Dutch to Some
The Hall of Fame Case for Bert Blyleven
Q&A: Blyleven on Felix Hernandez
Clemens Rocketing Up Charts
Poz: An Interview With a KC Star
A HOF Chat with Tracy Ringolsby
Up Close and Personal
A Peek Into the Mind of a HOF Voter
Answering the Naysayers
It's That Time of the Year (Again)
"If Cooperstown is Calling..."
The Bert Alert
One Small Step for Blyleven...
Only the Lonely
Exclusive Interviews
Lee Sinins
Alex Belth
David Pinto
Will Carroll
Mike Carminati
Aaron Gleeman
Joe Sheehan
Jay Jaffe
Jeff Peek
Tracy Ringolsby
Joe Posnanski
Bill James Part I, II, III
Jon Lalonde
Chuck Tiffany
Dayn Perry
Fay Vincent
Nate Silver
Alex Belth
David Pinto
Will Carroll
Mike Carminati
Aaron Gleeman
Joe Sheehan
Jay Jaffe
Jeff Peek
Tracy Ringolsby
Joe Posnanski
Bill James Part I, II, III
Jon Lalonde
Chuck Tiffany
Dayn Perry
Fay Vincent
Nate Silver
Bullpen
Rich Lederer
The Odd Couple (with Alex Belth)
The MostUnder Over Underrated Player in Baseball (with Brian Gunn)
Three Wise Men (roundtable by Alex Belth)
Infrequently Asked Questions (interview with Matt Welch)
Interview (Orioles Think Tank)
Bernie and the Yanks (Bronx Banter)
Hope and Faith: How the LAA Win the World Series (Baseball Prospectus)
NL West (The Soul of Baseball)
Greatest Living Hitter? (Sports Illustrated)
Roundtable: 2008 HOF Ballot (Armchair GM)
The Most
Three Wise Men (roundtable by Alex Belth)
Infrequently Asked Questions (interview with Matt Welch)
Interview (Orioles Think Tank)
Bernie and the Yanks (Bronx Banter)
Hope and Faith: How the LAA Win the World Series (Baseball Prospectus)
NL West (The Soul of Baseball)
Greatest Living Hitter? (Sports Illustrated)
Roundtable: 2008 HOF Ballot (Armchair GM)
Patrick Sullivan
Designated Hitters
David Bromberg (Q&A: John Denny)
Mark Armour (H. Killebrew and Versatility)
Joe Lederer (Soundtrack of a Prospect)
David Bromberg (Clemente's Autograph)
David Bromberg (Woody Fryman)
D. Baumstein (WAR Against Age: Pitchers)
Doug Baumstein (The WAR Against Age)
Doug Baumstein (A Lifetime on the Road)
John Fraser (Pick Six)
Mark Armour (How to Score More Runs?)
Bill Parker (What Opening Day Tells Us)
Stan Opdyke (Pat Rispole)
Chris Jaffe (Evaluating Baseball's Mgrs)
Stan Opdyke (Baseball Radio in NYC, 1953)
A. Nathan (Performance of Baseball Bats)
Michael Weddell (Edgar Martinez/HOF)
Jon Weisman (100 Things Dodgers Fans...)
Stan Opdyke (Connie Mack and Vin Scully)
Eric Walker (Evaluating Run Production)
Brent Mayne (The Intangibles of Catching)
Chris Moore (Best Fastballs in Baseball)
Dave Baldwin (The Batter’s Brain)
Shawn Haviland (Ivy League to MLB)
Larry Granillo (Walking Off)
Rob Iracane (Solo HR Won't Break You)
Tommy Bennett (Charm of AM Radio)
Harry Pavlidis (Johan Santana's Fast Start)
John Walsh (WAR and Remembrance)
Eric Walker (Precisely Inaccurate)
Bob Timmermann (As They See 'Em)
Geoff Young (Unicycles and Delusions)
Baseball Analysis at Tufts (Groundballers)
Baseball Analysis at Tufts (GB Out Rates)
G. Rybarczyk ('09 Hit Tracker Projections)
Joe Lederer (Curt Schilling/HoF)
Conor Gallagher (Hall of Fallacies)
Chris Green (Jim Rice, HoF, the Numbers)
Shawn Hoffman (Baseball's Bear Mkt?)
Paul Anthony (Manny Syndrome)
Ross Roley (World Series Odds)
B. Timmermann (Catcher's Interference)
R.J. Anderson (Waiting the Hardest Part)
Maury Brown (Cubs, MLB, and Cuban...)
Myron Logan (Dee-Fense, Dee-Fense)
Craig Calcaterra (Frivolity, Part I, Part II)
Chad Finn (Ode to Baseball Cards)
David Cameron (Mariners Foibles)
Chris Dial (Chipper Jones)
Pat Lederer (Memory Lane)
David Appelman (Clutch Pitching)
Bob Rittner (DH)
Jonathan Mayo (Roger Clemens)
Lisa Winston (My Son-in-Law...)
Russ McQueen (The Yellow Hammer)
Bob Rittner (I'm OK, You're OK)
Mark Armour (In Defense of the HOF)
Pat Jordan (Friends)
Dan Levitt (Analysis of Terry Ryan)
Doug Baumstein (Trading Econ 101)
Ross Roley (Runner's Reluctance II)
Ross Roley (Runner's Reluctance I)
Mark Armour (No-Longer Lovable Sox)
Bruce Regal (Stealthy and Wise)
Brian Gunn (Roid Monster)
Current/McEvoy (Value of the SB)
John Rickert (Sinister Thefts)
Nate Silver (Sabermetrics)
David Vincent (Home Run Production)
Joe P. Sheehan (Enhanced Gameday II)
Mark Armour (An Ode to Sport)
David Gassko (All-Time Worm Burners)
Joe P. Sheehan (Enhanced Gameday)
John Walsh (When Titans Clash)
Fox/Williams (Quantifying Coaches II)
Fox/Williams (Quantifying Coaches I)
Jacob Luft (Bull Durham Rant)
Chad Finn (Strat-O-Matic)
Lisa Winston (Rotisserie Baseball)
Dave Studeman (Baseball Stats)
Steve Treder (Roger Craig)
Marc Normandin (Jeff Bagwell)
D. Appelman (Expanding Strike Zone)
Jeff Sackmann (Worst MiL Defenders)
Jeff Sackmann (Best MiL Defenders)
Maxwell Kates (Van Lingle Mungo)
David Appelman (Pitch Location)
Kent Bonham (Danny Ray Herrera)
Glenn Stout (Two Baseball Poems)
Bruce Regal (The Challenge Round)
Mark Lamster (Barry & Ty)
Geoff Young (NL West)
Tom Lederer (The Ryan Express)
Brian Erts (Great Leap Forward)
David Pinto (Parity and the N.L.)
Jacob Luft (Fathers and Daughters)
Jamey Newberg (Pete's Sake)
Jeff Albert (A. Jones Swing Analysis)
Jeff Albert (A-Rod Swing Analysis)
Keith Law (Death, Taxes, and Waivers)
Peter Abraham (Tales of Torre Tales)
Larry Borowsky (Let 'er Rip II)
Dan Levitt (Empirical Analysis of Bunting)
Jonah Keri (If I Met Warren Cromartie...)
Bob Klapisch (War Stories)
Bob Timmermann (John F. Kennedy HS)
Kent Bonham (Aluminum Adjustments)
Al Doyle (More Than Superstars)
Ross Roley (Instant Replay)
David Vincent (Barry Bonds Homers)
Chad Finn (Our Favorite Obscurities)
Bill Deane (1979 NL MVP)
Mark Armour (Rise/Fall of Artificial Turf)
Jeff Angus (Wally Moon Camp)
David Berri (Money and Baseball)
Larry Borowsky (Baseball w/o the #s)
Derek Zumsteg (The Irrational Market)
David Regan (Free Agent Contracts)
Peter Schmuck (Steroids and the HOF)
David Appelman (Pitchers, Pitch by Pitch)
Dan Fox (Swinging, Taking, Fouling, Etc)
Patrick Sullivan (Study of NYY CF/BOS LF)
Will Leitch (Baseball Journalism)
Jeff Sullivan (Pitcher Release Points)
Steve Treder ('69-'70 Giants)
Maury Brown (Charlie Finley)
John Brattain (Bob Johnson)
Bob Klapisch (The Case for Bert Blyleven)
Jeff Peek (Pride and Prejudice)
Dayn Perry (Bert and Warren)
Rob Neyer (If Don Sutton Was Great...)
Lisa Winston (Minor League Memories)
Alex Belth (Otis Redding Was Right)
David Cameron (Long Live the King)
Jeff Angus (Baserunning Study)
Bert Blyleven (Baseball Playoffs)
Boyd Nation (Not a Prospect List)
James Click (Batters-Baserunners Study)
Jeff Shaw (Why I Love Baseball)
David Gassko (BIP/BFP Fielding Study)
Jay Jaffe (Milwaukee Sausage Race)
Jamey Newberg (Remember When)
Bob Klapisch (Press Box to the Mound)
Dan Levitt (Predictive Value of BB)
David Vincent (Official Scorer)
Jon Weisman (Rick Monday)
Larry Borowsky (Let 'er Rip)
Will Carroll (Fictional Short Story)
Bob Timmermann (Japanese Baseball)
Cyril Morong (Best Pitching Seasons)
Sean Forman (Monte Carlo Win-Loss)
Brian Gunn (My Little Blue Book)
Joe Lederer (My Dad and Baseball)
Bill Deane (Bob Gibson, 1968)
Mark Armour (1977 Yankees)
Darren Viola (Retrosheet)
David Pinto (RFK)
Dayn Perry (Brave Heart)
Matt Welch (Dave Hansen)
Kevin Kernan (Jack McKeon)
Tom Lederer (Dodgers Road Trip)
Steve Lombardi (Slider)
Studes (Picturing Baseball)
Mike Carminati (Luck of the Drawl)
Eric Neel (Vin Scully)
J.C. Bradbury (Leo Mazzone)
John Sickels (Bill James)
Search Baseball Analysts
Archives
By Category:
Around the Majors Content Only
Around the Minors Content Only
Baseball Beat Content Only
Baseball Beat/Change-Up Content Only
Baseball Beat/WTNY Content Only
Behind the Scoreboard Content Only
Change-Up Content Only
Change-Up/Around the Majors Content Only
Command Post Content Only
Crunching the Numbers Content Only
Designated Hitter Content Only
F/X Visualizations Content Only
Past Times Content Only
Saber Talk Content Only
The Batter's Eye Content Only
Touching Bases Content Only
Weekend Blog Content Only
WTNY Content Only
By Month:
February 2012
January 2012
December 2011
October 2011
September 2011
August 2011
July 2011
June 2011
May 2011
April 2011
March 2011
February 2011
January 2011
December 2010
November 2010
October 2010
September 2010
August 2010
July 2010
June 2010
May 2010
April 2010
March 2010
February 2010
January 2010
December 2009
November 2009
October 2009
September 2009
August 2009
July 2009
June 2009
May 2009
April 2009
March 2009
February 2009
January 2009
December 2008
November 2008
October 2008
September 2008
August 2008
July 2008
June 2008
May 2008
April 2008
March 2008
February 2008
January 2008
December 2007
November 2007
October 2007
September 2007
August 2007
July 2007
June 2007
May 2007
April 2007
March 2007
February 2007
January 2007
December 2006
November 2006
October 2006
September 2006
August 2006
July 2006
June 2006
May 2006
April 2006
March 2006
February 2006
January 2006
December 2005
November 2005
October 2005
September 2005
August 2005
July 2005
June 2005
May 2005
April 2005
March 2005
February 2005
January 2005
December 2004
November 2004
October 2004
September 2004
August 2004
July 2004
June 2004
May 2004
April 2004
March 2004
February 2004
January 2004
December 2003
November 2003
October 2003
September 2003
August 2003
July 2003
June 2003
Reference
Organizational Stats
Arizona Diamondbacks Bat / Pitch
Atlanta Braves Bat / Pitch
Baltimore Orioles Bat / Pitch
Boston Red Sox Bat / Pitch
Chicago Cubs Bat / Pitch
Chicago White Sox Bat / Pitch
Cincinnati Reds Bat / Pitch
Cleveland Indians Bat / Pitch
Colorado Rockies Bat / Pitch
Detroit Tigers Bat / Pitch
Florida Marlins Bat / Pitch
Houston Astros Bat / Pitch
Kansas City Royals Bat / Pitch
Los Angeles Angels Bat / Pitch
Los Angeles Dodgers Bat / Pitch
Milwaukee Brewers Bat / Pitch
Minnesota Twins Bat / Pitch
New York Mets Bat / Pitch
New York Yankees Bat / Pitch
Oakland Athletics Bat / Pitch
Philadelphia Phillies Bat / Pitch
Pittsburgh Pirates Bat / Pitch
St. Louis Cardinals Bat / Pitch
San Diego Padres Bat / Pitch
San Francisco Giants Bat / Pitch
Seattle Mariners Bat / Pitch
Tampa Bay Devil Rays Bat / Pitch
Texas Rangers Bat / Pitch
Toronto Blue Jays Bat / Pitch
Washington Nationals Bat / Pitch
All-Star Links
Official Websites
News and Notes
Baseball News Blog
Baseball Newstand
ESPN Baseball
Fox Sports Baseball
Pro Sports Daily
Roto World
The Roto Times
USA Today Baseball
Baseball Newstand
ESPN Baseball
Fox Sports Baseball
Pro Sports Daily
Roto World
The Roto Times
USA Today Baseball
Reference and Analysis
Baseball Almanac
Baseball America
Baseball Archive
Baseball Contracts
Baseball Cube
Baseball Graphs
Baseball Library
Baseball Musings Player Database
Baseball Page
Baseball Primer
Baseball Prospectus
Baseball Reference
Baseball Statistics
Baseball Truth
Boxscore Central
Diamond Mind Baseball
Doug's Stats
FanGraphs
Fast Balls (pitchfx catalog)
Hardball Dollars
Hardball Times
Hit Tracker
Retrosheet
Rotobase/Rotoblog
Stat Corner
STATS
Tango on Baseball
Yahoo Sports MLB
Web Gems
Bill James Primer
Sabermetric Manifesto (Grabiner)
Pitching and Defense (McCracken)
Pitching and Defense (Tippett)
Transactions Primer (Neyer)
Baseball Stats (Batter's Box)
Prospect Report (Cameron)
Pitcher Workloads (Sheehan)
Goodbye to Old Baseball Ideas (Rickey)
Sabermetric Manifesto (Grabiner)
Pitching and Defense (McCracken)
Pitching and Defense (Tippett)
Transactions Primer (Neyer)
Baseball Stats (Batter's Box)
Prospect Report (Cameron)
Pitcher Workloads (Sheehan)
Goodbye to Old Baseball Ideas (Rickey)
Columnists
Baseball Blogs
Around the Majors
Athletics Nation
Baseball Crank
Baseball Musings
Baseball-Reference Blog
Batter's Box
Big League Stew
Bronx Banter
Catfish Stew
Cub Town
Dan Agonistes
Dodger Thoughts
DRays Bay
Ducksnorts
Futility Infielder
Halos Heaven
Inside the Rockies
It Might Be Dangerous
Knuckle Curve
LoHud Yankees Blog
Lookout Landing
Management by Baseball
Metaforian
Metsgeek
Mike's Baseball Rants
Only Baseball Matters
Redbird Nation
Red Reporter
Sabernomics (Braves)
Seth Speaks
ShysterBall
6-4-2 (Angels/Dodgers)
The Book
TheCubdom
The Cutting Edge
The House That Dewey Built
The View From The Bleachers
Tiger Blog
U.S.S. Mariner
Viva El Birdos
Where's Kernan
Minor Leagues
Arizona Fall League
BA Player Finder
Cal Leaguers
Jamey Newberg
JDM's Scoresheet Baseball
Minor League Baseball
Minor League Park Factors
Minor League Splits
No Pepper
Sickels' Minor League Ball
Warm October Nights
BA Player Finder
Cal Leaguers
Jamey Newberg
JDM's Scoresheet Baseball
Minor League Baseball
Minor League Park Factors
Minor League Splits
No Pepper
Sickels' Minor League Ball
Warm October Nights
Amateur
Boyd's World (College)
Cape Cod Baseball League
College Baseball Blog
College Baseball Insider
Collegiate Baseball Newspaper
College Splits
College Splits Blog
Dirtbags Baseball (Long Beach State)
NCAA Baseball
NCBWA
Team One Baseball (High School)
Texas A&M & Baseball
Cape Cod Baseball League
College Baseball Blog
College Baseball Insider
Collegiate Baseball Newspaper
College Splits
College Splits Blog
Dirtbags Baseball (Long Beach State)
NCAA Baseball
NCBWA
Team One Baseball (High School)
Texas A&M & Baseball
Historical
Cuban Baseball
House of David
Jim "Mudcat" Grant's Web Page
Negro League Baseball Players Assoc
Negro Leagues Baseball Museum
1919 Black Sox
Pacific Coast League
Philadelphia Athletics Historical Society
Shoeless Joe Jackson Society
SABR-L Archives
Walter O'Malley
House of David
Jim "Mudcat" Grant's Web Page
Negro League Baseball Players Assoc
Negro Leagues Baseball Museum
1919 Black Sox
Pacific Coast League
Philadelphia Athletics Historical Society
Shoeless Joe Jackson Society
SABR-L Archives
Walter O'Malley
Miscellaneous
Forums
Credits
Ticket Center
Tickets to Baseball -
Premium Red Sox Tickets - Tickets to Marlins Games - Cardinals Game Tickets - NY Yankee Tickets - Tickets Oakland Athletics - Dallas Cowboys Tickets - Arizona Cardinals Tickets - Tickets Seattle Seahawks - Buffalo Bills Tickets Online - Tickets to Dolphins Football
Buy Boston Red Sox tickets,
Philadelphia Phillies tix,
NY Yankees tickets,
NY Mets tickets, and
MLB All Star game tickets at ABC tickets
Not sure where to find the best online sportsbooks? Start your search with PlayersJet.
Get deals at SportsMemorabilia.com on baseball apparel, including Phillies jerseys and more for adults and children.
Shop the largest selection baseball equipment on sale at Sports Unlimited. Check out tons of baseball gloves, youth baseball gloves and catchers gear from Rawlings, Wilson, Nike & Under Armour.
2011 Draft Order
Courtesy of Baseball America
First-Round:
 1. Pirates (57-105)
 2. Mariners (61-101)
 3. Diamondbacks (65-97)
 4. Orioles (66-96)
 5. Royals (67-95)
 6. Nationals (69-93)
 7. Diamondbacks (for B. Loux)
 8. Indians (69-93)
 9. Cubs (75-87)
10. Padres (for Karsten Whitson)
11. Astros (76-86)
12. Brewers (77-85)
13. Mets (79-83)
14. Marlins (80-82)
15. Brewers (for Dylan Covey)
16. Dodgers (80-82)
17. Angels (80-82)
18. Athletics (81-81)
19. Red Sox (from DET for Martinez)
20. Rockies (83-79)
21. Blue Jays (85-77)
22. Cardinals (86-76)
23. Nationals (from CWS for Dunn)
24. Rays (from BOS for Crawford)
25. Padres (90-72)
26. Red Sox (from TEX for Beltre)
27. Reds (91-71)
28. Braves (91-71)
29. Giants (92-70)
30. Twins (94-68)
31. Rays (from NYY for Soriano)
32. Rays (96-66)
33. Rangers (from PHI for Lee)
Supplemental First Round:
34. Nationals (Dunn)
35. Blue Jays (Downs)
36. Red Sox (Martinez)
37. Rangers (Lee)
38. Rays (Crawford)
39. Phillies (Werth)
40. Red Sox (Beltre)
41. Rays (Soriano)
42. Rays (Balfour)
43. Diamondbacks (LaRoche)
44. Mets (Feliciano)
45. Rockies (Dotel)
46. Blue Jays (Buck)
47. White Sox (Putz)
48. Padres (Garland)
49. Giants (Uribe)
50. Twins (Hudson)
51. Yankees (Vazquez)
52. Rays (Benoit)
53. Blue Jays (Olivo)
54. Padres (Torrealba)
55. Twins (Crain)
56. Rays (Choate)
57. Blue Jays (Gregg)
58. Padres (Correia)
59. Rays (Hawpe)
| Command Post | August 31, 2007 |
And Now for Something Completely Different...
Rich wrote an article last week about Ryan Braun and included a link to Braun's hit chart on Fox Sports. MLB.com provides a similar chart, both of which show where the balls that Braun has put in play this year have landed. Both these charts only let you look at one stadium at a time for each player though, which doesn't give a complete picture of his spray patterns. If the player has enough at-bats in one park you can get a general idea of where he hits the ball, but it would be ideal to see where every ball he hit ended up. Another feature that would improve these hit charts would be an indication of how the ball was hit, either on the ground or in the air. MLB.com does have the ability to show fly-outs and ground-outs, but it doesn't split up the hits based on their flight path, which is important too.
I try not to complain unless I have a solution (yeah, right), and after Rich's article prompted me to start to playing around with the XML files that support MLB.com's hit chart, I made my own hit charts that added my features. I think adding these features will make the hit charts much more informative and valuable, and you can get an more accurate idea of a hitter's hitting pattern and potentially visualize some other cool things.
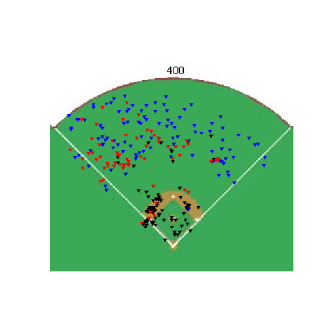
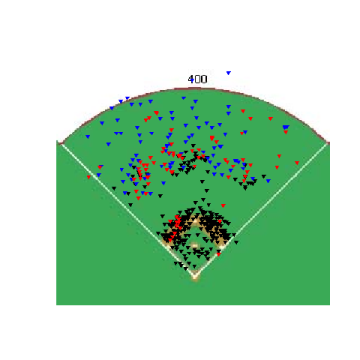
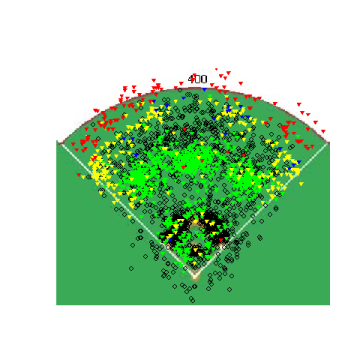
Looking at an individual player is a good place to begin examining the new hit charts and below are two charts for Kevin Millar. The chart on the left shows how each ball was hit, independent of if it was a hit or an out, with the black dots being ground balls, red being line drives, the blue representing fly balls. Millar has a reputation as a pull hitter, which is apparently well deserved judging from his line drives and deep fly balls to left field. He only has five line drives to the right side of the field, which makes you believe when he does hit to right, he isn't driving the ball at all.
The results of his at-bats, shown in the chart on the right, confirm that Millar doesn't have much success hitting to right field. On this chart, the black circles represent all outs, while the green dots are singles, the yellow dots are doubles, blue are triples, and red are home runs. You can see when he does go the other way, it is usually not very well hit, and results in an out. If there were ever a right-handed hitter to use an over-shift against, Millar is the perfect candidate. (I had a problem adding legends to the charts, so any chart using just red, blue and black dots is showing how each ball was hit, regardless of if it was a hit or not, while any graph with red, blue, yellow and green dots shows the result of a ball in play, such as a single or double.)
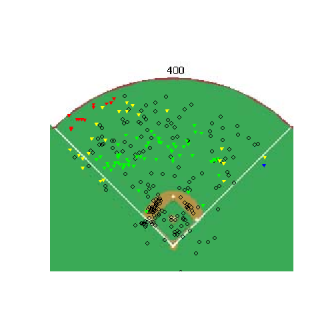
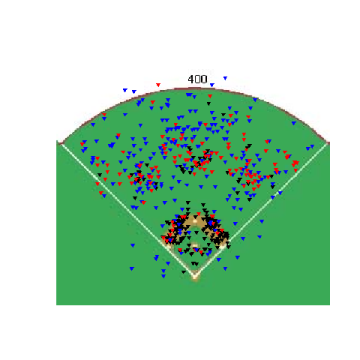
David Ortiz on the other hand, frequently faces an over-shift and still hits very well. Based on the locations where he hits balls, Ortiz seems to be almost a mirror image of Millar, although Ortiz hits to left more than Millar hits to right. The big difference between Ortiz and Millar is how they hit the ball the other way. While Ortiz hasn't hit many home runs to left, he does have a bunch of doubles that way. One reason for this difference is the Green Monster, but opposite field hitting/power is important for Ortiz, if for no other reason than to make teams slightly wary of using the shift. You can actually see some of the results of the shift, with an extra cluster of groundball outs behind where the 2nd baseman usually plays.
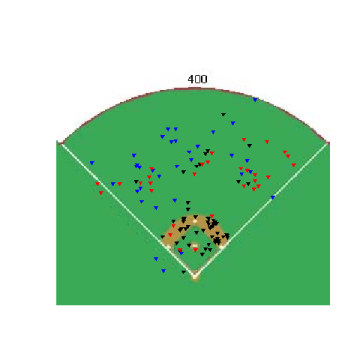
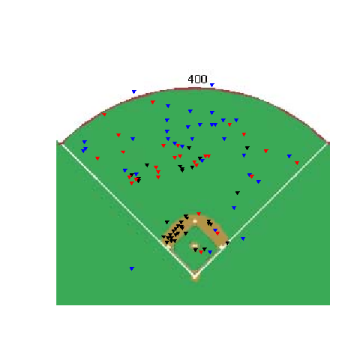
Moving on from batters, the same hit charts can be created for pitchers, in this case for teammates Fausto Carmona and Paul Byrd who, respectively, have the highest and 2nd lowest groundball percentages in the American League. Carmona and Byrd are as far apart as you can get in terms of how they get outs and their graphs reflect the differences in their styles, with Carmona relying heavily on infielders and Byrd mostly using his outfielders.
Carmona:

Byrd:
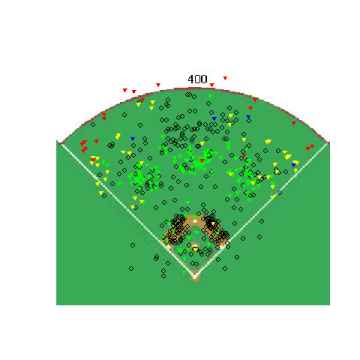
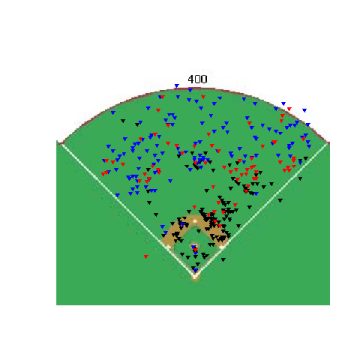
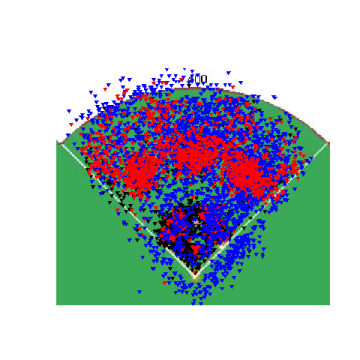
Another interesting thing to do with the hit charts is get a rough idea of the defensive ranges of players. Below is a chart showing every ball in play that Yankee pitchers have allowed at Yankee Stadium this year. You can actually see where the outfield wall should be, based on the location of the doubles and home runs and while it's tough to see fine details on a chart like this, you can almost make out the deeper fence in left field compared to right field.
Continuing to look at the outfield, you can get an idea of where the Yankees' defense has allowed hits this year. Using the outfield hits and outs as a guide, there appear to be three zones where hits don't occur in the outfield, one for each fielder. These areas are surrounded by hits of all types, which give a rough idea where the zones end. There is some overlap between the zones, caused by different outfielders being in the game, different positioning by the outfielders and probably the different scorekeepers tracking the balls, but even with these three problems you can get an idea of the range showed by Yankee outfielders. The only problem with those ranges is they don't really mean much for individual players, except in right field for Abreu, because the other positions have been manned by several players for the Yankees this season.
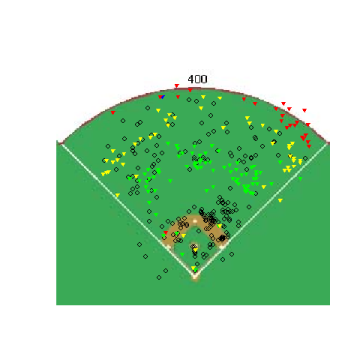
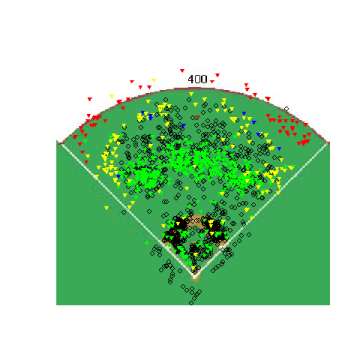
However, if you have a fielder who has played in all of his team's games, the ranges become meaningful on an individual level. Above is a chart showing every ball in play that Indians pitchers have allowed this year, and while the Indians have used several outfielders at the corner positions Grady Sizemore has been a fixture in center the whole year. Sizemore is a great defensive outfielder, which is shown several ways on the chart, most obviously that there are few hits to center field. This could be due to a scorer bias of somehow mis-marking hits (which I don't think is happening), but it seems that Sizemore simply covers a lot of ground, especially compared to the Indians' left fielders, where there appear to be some doubles and triples on balls that are hit right at them. The range of the right fielders appears to be slightly larger than that of the left fielders, but still smaller than Sizemore's. Another bit of evidence for Sizemore's defensive prowess is the lack of hits directly over his head. A ball hit over the head of an outfielder is one of the hardest plays to make, but Sizemore has made virtually all of those plays. (There is one possible explanation for the lack of hits behind Sizemore that is not related to his defensive skills but rather based on the two clumps of doubles at the wall, on either side of Sizemore. Because balls are marked where they are picked up and not where they land, these balls could have landed directly behind Sizemore and been picked up off to the side. With the current data, you can't really tell for certain which actually happened, but comparing Sizemore to Yankee Stadium, it seems like the mis-marking is happening to some degree.)
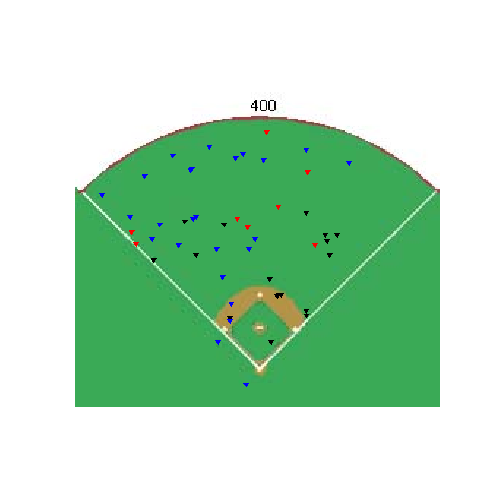
The next step in analyzing where balls are hit to is to look at what pitches were hit to certain areas. In order to answer this question I needed to merge my hit location database with my pitch database. With this "super-database", I can show hitting charts based on any conceivable split. Want to see how and where balls have been put in play against Paul Byrd when he has two strikes on a left-handed batter? Look no further. Below on the left is Byrd vs. left-handed batters with two strikes. The same situation for right-handed batters vs. Byrd is on the right. Neither graph is drastically different than what you would expect, with the more balls being pulled than hit to the opposite field. Balls that are hit the other way are not hit as far and tend to be fly balls as opposed to line drives.
Getting a little more in depth, how about looking where different pitches are hit? Below are charts for where Justin Verlander's fastball has been hit by left-handed hitters (on the left) and right-handed hitters (on the right). Generally when hitters pull his fastball it is on the ground, but if it is hit in the air, it goes to the opposite field. This distribution of flyballs and groundballs doesn't appear to be unique for Verlander.

Going a little further, here's a chart showing every fastball, thrown by right-handed pitchers, that has been put in play by a right-handed hitter.
This is overkill, and if you can read anything into this graph you're a better man than me. I don't have the ability to sort every pitch based on reaction distance yet, but using reaction distances would probably be a better solution than just using "fastballs" and "change-ups". Using static definitions of a pitch, you run into the problem of groupingJamie Moyer's 84 MPH fastball with Verlander's 95 MPH fastball. Hitters are going to react and hit those pitches differently and this chart doesn't show that.
There are some problems with the MLB.com hit location data, primarily that the balls are marked based on where they are picked up by a fielder, not where they first hit the ground or where they go through the infield. By marking where a ball was picked up, you lose the information about where it should have/could have been fielded. Knowing where an outfielder picked up a ground ball is nice, but knowing exactly where that ground ball went through the infield or where a fly ball actually landed would be better. Another possible problem with the data is the ability of the scorekeeper to really know where the ball landed. There aren't any landmarks in the outfield to gauge where a ball was picked up which makes it harder to accurately plot the data.
These hit charts can help create informative profiles on hitters, pitchers and stadiums and on a large scale they can even help visualize player's defensive ranges. One big advantage with the hit location data as opposed to the pitch data is that the hit chart data is complete for all stadiums for the whole year. Scorekeepers manually enter this information for every ball in play, and it even goes back for several years, allowing for possible comparisons across years.
| Baseball Beat | August 30, 2007 |
Open Chat: Left Sides of the Infield
The National League East boasts two of the youngest and best left sides of the infield in all of baseball. David Wright and Jose Reyes of the New York Mets and Miguel Cabrera and Hanley Ramirez of the Florida Marlins are about as good as it gets when it comes to third basemen and shortstops. All four players are also young still under the control of their teams, adding to their value.
A (strong) argument on behalf of the New York Yankees could be made that Alex Rodriguez and Derek Jeter form the best left side in baseball. However, ARod and Jetes are 32 and 33 years old, respectively. Rodriguez costs about $25 million per season, a salary that will zoom even higher for 2008 and beyond after he opts out of his current deal. Jeter is earning north of $20 million. Together, these two are making about 50% more than the entire payroll of the Marlins.
Questions:
1. If you were a GM, which left side would you pick for the remainder of the season, irrespective of cost?
2. As a fantasy owner, which left side would you pick for *next* season?
3. If you owned a MLB club, which left side would you pick, giving consideration to all factors, including age, contract status, free agency, etc.?
Your answers can come from the teams and players mentioned above or from any other pair not highlighted.
| Change-Up | August 29, 2007 |
Check 1-2, Check 1-2
Last night's slate featured the first place team against the second place team in five of the six Major League divisions. All five games were tightly contested with bullpens figuring prominently across the board. Without further ado, here's a brief recap of my takeaways from each matchup.
Presented without comment, Joba Chamberlain's Major League career numbers:
          IP   SO   BB   H   ERA
Joba     10.0  17   3    4   0.00
After Johnny Damon launched a 246 foot home run off of Daisuke Matsuzaka in the bottom of the seventh inning, Joba entered the game and despite giving up a walk and a base hit to Kevin Youkilis and Mike Lowell, looked as dominant as ever. I honestly cannot remember being more impressed with a pitcher's stuff than I am with Chamberlain's.
The offensive stars for each team were players that have been at the fore of this latest iteration of the Sox-Yanks rivalry. Manny Ramirez and Jason Varitek homered for Boston, while Derek Jeter and Damon did the same for New York. Jorge Posada continued his fantastic season, going 2-for-4 with a double.
Boston's lead is down to seven games. With 30 games remaining, that means that if the Sox go 15-15, New York would have to win 22 of their last 30. It's possible, but Boston fans should feel pretty comfortable about where they stand at the moment.
This one pissed Seattle fans off and I can't really blame them. J.J. Putz, inactive since August 24, never saw the light of day in a game that was tied at six after seven innings. Seattle's second best reliever George Sherrill pitched a perfect ninth, which was nice and all but unfortunately by that time the Halos had jumped out to a 10-6 lead.
Brandon Morrow was a defensible choice to start the eighth inning. He's good, though not as good as Putz and Sherrill. Bringing in Rick White to relieve Morrow after he struggled a bit was indefensible. When the eighth was said and done, the Angels had scored four runs on four hits and three walks. They also might have locked up the AL West, and there wasn't a damn thing J.J Putz was allowed to do about it.
The stars were out in Philadelphia. Tom Glavine threw seven shutout innings while Carlos Delgado supplied all of the Mets' offense with his two-run shot in the second. On the Phillies side, Jimmy Rollins and Ryan Howard paced the offense, while Brett Myers threw two perfect innings for the win. Howard ended the game off of Guillermo Mota in the 10th with a two-run homer of his own.
Philadelphia is now four games behind the Mets for the NL East lead and three back of the San Diego Padres for the Wild Card. Chase Utley is back but Cole Hamels is hurt. It will be interesting to see what this Phillies team can muster over the last month of the season. Fortunately for them, seven of their final ten are against the Washington Nationals.
Scott Linebrink came into last night's contest with a 97 ERA+ as a Brewer, entered with a 3-1 lead in the seventh (after all, Jeff Suppan had thrown 82 pitches) with a runner on first and nobody out and proceeded to give up two doubles, a single, made a throwing error and when it was all said and done, had allowed four runs to cross the plate. For this sort of performance, the Brewers gave up not one, not two, but three promising young pitchers on July 26. Here is how the trio has performed at various levels of pro ball in 2007.
                Age   K/9    K/BB
Joe Thatcher    25   11.67   5.58
Will Inman      20   10.00   3.04
Steve Garrison  20    6.33   3.06
The Brewers are now below .500 and in third place. From Doug Melvin on down, this team's performance has been just awful for a good three months now.
Speaking of the Padres, they took their second straight from Arizona last night - against the great Brandon Webb no less - to pull within one game of the NL West lead. Khalil Greene and Mike Cameron were the offensive stars for the Pads, while Justin Germano held his own to outduel Webb.
For the Snakes, Connor Jackson continued to flash the skills D-Backs fans had been waiting to see, going 3-for-3 with a home run, double, two RBI and a walk. He's hitting .321/.361/.538 in August.
======================
Tune back in tonight for some more exciting ball as all of these teams once again take to the field against one another. Weeks like these make the MLB Extra Innings package worth every penny.
| Baseball Beat | August 28, 2007 |
Kings of the Road
In yesterday's article, I identified the leading candidates for the Cy Young Awards and listed their qualifications with a focus on who *should* win rather than who *will* win.
The race for the American League CYA is wide open with at least five legitimate candidates while the National League has two pitchers who are equally worthy and a couple more who have an outside shot as the season approaches the Labor Day weekend.
What's interesting to me in the NL is that the two principal hopefuls pitch in ballparks that are distinctively different. Arizona's Brandon Webb pitches his home games in a hitter's park whereas San Diego's Jake Peavy performs home games in one of the most pitcher friendly environments in recent baseball history. Advantage Peavy, right?
Well, let's take a closer look at Webb's and Peavy's home and road splits:
Brandon Webb
          G   W-L    IP    H    R   ER  HR   BB   SO   ERA   AVG   OBP   SLG   OPS
Home     12   6-4   82.2  81   33   27   4   32   76  2.97  .258  .327  .369  .696
Away     15   8-4  109.0  83   35   29   5   26   90  2.39  .206  .258  .286  .544
Totals   27  14-8  191.7 164   68   56   9   58  166  2.63  .229  .288  .323  .611
Not surprisingly, Webb has bettered his home stats while pitching away from Chase Field. He has started three more games and thrown 26.1 additional innings on the road. I'm not sure if that is by design or sheer luck but Webb's adjusted stats may slightly overstate his pitching prowess this year if the formula assumes an equal number of starts at home and on the road.
Jake Peavy
          G   W-L    IP    H    R   ER  HR   BB   SO   ERA   AVG   OBP   SLG   OPS
Home     16   7-5  104.0  91   34   33   5   30  112  2.86  .236  .298  .329  .627
Away     11   8-0   73.2  42   13   10   2   24   85  1.22  .163  .235  .225  .460
Totals   27  15-5  177.2 133   47   43   7   54  197  2.18  .207  .273  .287  .558
Based on Peavy's away numbers, I think it is safe to say that his success is not a product of Petco Park. Sure, he is pitching well at home. But check out those road stats. Peavy is 8-0 with a 1.22 ERA outside of Petco. With an AVG/OBP/SLG against line of .163/.235/.225, he's making hitters long to be Nick Punto (.199/.290/.258), who has the lowest OPS of any regular player in baseball.
During Bob Gibson's CYA and MVP season in 1968 when he fashioned a 1.12 ERA during the Year of the Pitcher, opponents "hit" .184/.233/.236 against him. Gibson's OPS was .469 that year. Peavy's OPS on the road in 2007 has been .460. That's right, Peavy's road numbers are comparable to what Gibby put up in what some believe to be the best season ever by a pitcher. In fairness to the Hall of Famer, he tossed over 300 innings so his sample size is more than four times Peavy's. But the purpose of this exercise is to make sure voters don't discount Peavy's performance this year based on the fact that he pitches his home games at Yellowstone Petco Park.
Just as Webb's adjusted numbers may overstate his case, Peavy's adjusted totals may actually understate his success. Either way, the native of Mobile, Alabama is having a truly remarkable year. Excluding teammate Chris Young's current season, Roger Clemens (1.87 in 2005) is the only pitcher in the NL over the past ten years to forge a lower ERA than Peavy's current mark of 2.18.
NATIONAL LEAGUE
SINGLE SEASON ERA LEADERS
1998-2006
                              YEAR     ERA
 1   Roger Clemens            2005     1.87
 2   Greg Maddux              1998     2.22
 3   Jake Peavy               2004     2.27
 4   Randy Johnson            2002     2.32
 5   Jason Schmidt            2003     2.34
 6   Kevin Brown              1998     2.38
 7   Andy Pettitte            2005     2.39
 8   Kevin Brown              2003     2.39
 9   Mark Prior               2003     2.43
10   Al Leiter                1998     2.47
As shown, Peavy had a similar ERA in 2004 and his peripheral stats (save for HR) are comparable. However, Peavy is on pace to throw about 54 more innings this season.
          IP      ERA   ERA+   K/9   BB/9   HR/9
2002     97.2    4.52    85   8.29   3.04   1.01
2003    194.2    4.11    96   7.21   3.79   1.53
2004    166.1    2.27   177   9.36   2.87   0.70
2005    203.0    2.88   134   9.58   2.22   0.80
2006    202.1    4.09   103   9.56   2.76   1.02
2007    177.2    2.18   189   9.97   2.74   0.35
Source: FanGraphs
I'm not surprised in the least by Peavy's success. He pitched much better than most people realized in the first half last season when he was ridiculed for posting a 4-8 record with a 4.46 ERA. Peavy proceeded to go 7-6 with a 3.68 ERA in the second half even though his peripheral stats were roughly the same pre- and post- All-Star break.
Peavy beat Arizona 3-1 last night, enabling the Padres to pull within two games of the Diamondbacks for first place in the NL West. Jake allowed one run, three hits, and three walks in seven innings. He struck out 11 for the third consecutive start (including seven in a row at one point) and reached double digits for the eighth time this year, running his NL lead to 197.
Webb is scheduled to start tonight and could match Peavy's win total of 15 with a victory. He will be gunning for his seventh straight in the hopes of putting some distance between the D-Backs and the Padres.
As for the Cy Young Award, a strong case can be made for Peavy and an equally strong case can be made on behalf of Webb. It's so close, I would be comfortable giving the award to Brandon Peavy. Or maybe Jake Webb.
| Baseball Beat | August 27, 2007 |
The Denton True Young Awards
Y is for Young,
The magnificent Cy;
People batted against him,
But I never knew why.
- Ogden Nash (1902-1971), Lineup for Yesterday
Did you know that Cy Young's real name was Denton True Young? Yes, that's True.
Young was born in Gilmore, a farming community in eastern Ohio. He was known as Dent Young in his early years, then earned the nickname "Cyclone" in reference to the speed of his fastball as a young adult. His name was shortened to "Cy" a couple of years later and the pitching great was forever known as Cy Young.
By the time Young was old, he had won 511 games in his career, the most in the history of Major League Baseball. Young also holds the records for innings pitched (7,355), games started (815), and complete games (749). He wound up with the most losses (316), too.
Commissioner Ford Frick created the Cy Young Award in 1956 to honor the best pitcher in Major League Baseball. From 1956-1966, only one pitcher was selected by the Baseball Writers Association of America as the recipient of the award. Once Commissioner Frick retired, the rules were changed to honor the best pitcher from each league.
Who should win the AL and NL Cy Young Awards in 2007? Of course, the season is not over so it is premature to come up with anything definitive, but it might be instructive to at least study the candidates and what they bring to the table.
Let's take a look at the leaders in Runs Saved Above Average in both leagues as a starting point to develop a list of pitchers worthy of the award. RSAA equals the number of runs that a pitcher saved versus what an average pitcher would have allowed over the same number of innings with a home ballpark adjustment. It paints a similar picture as ERA+ but think of RSAA as the counting stat and ERA+ as the rate stat in terms of run prevention. One other minor difference is that RSAA uses runs whereas ERA+ is based on earned runs.
AL RSAA LEADERS
1    Kelvim Escobar        38
T2   Erik Bedard           30
T2   Fausto Carmona        30
T2   C.C. Sabathia         30
T5   Josh Beckett          28
T6   Dan Haren             27
T6   John Lackey           27
8    Johan Santana         24
Hideki Okajima (25) and Rafael Betancourt (23) are actually eighth and tenth, but I have excluded both because as non-starters and non-closers neither will receive a single vote for the award.
NL RSAA LEADERS
1    Brandon Webb          40
2    Brad Penny            36
3    Jake Peavy            32
4    Chris Young           27
5    John Smoltz           22
Source: Complete Baseball Encyclopedia
Tim Hudson is in sixth place but his RSAA falls all the way down to 20 or half of Brandon Webb's league-leading total. Cole Hamels and Derek Lowe round out the top eight (to put the NL on par with the AL).
Next, let's take a closer look at those in contention and examine some of the more important stats, including those which the pitcher has the most control over (such as strikeout, walk, and home run rates).
AMERICAN LEAGUE
              ERA   ERA+   K/9   BB/9   HR/9
Escobar      2.77   155   7.12   2.77   0.42
Bedard       3.16   140  10.93   2.82   0.94
Carmona      3.16   139   5.28   2.29   0.70
Sabathia     3.38   130   7.92   1.32   0.87
Beckett      3.21   141   8.55   1.86   0.56
Haren        2.72   160   7.62   2.23   0.92
Lackey       3.34   129   6.95   2.40   0.84
Santana      2.97   148   9.79   1.98   1.34
Kelvim Escobar may not be getting as much attention as a few other candidates but his numbers don't take a backseat to anyone. He leads the AL in RSAA and is second in ERA. In addition, his peripheral stats are solid, even spectacular in the case of his league-leading HR/9 rate. The 31-year-old righthander with a fastball that touches the mid-90s and a splitter that is one of the nastiest in the game is adept at inducing groundballs when necessary (25 GIDP, T2 in the AL) and keeping the ball in the yard.
Escobar's teammate John Lackey has the weakest case at this point. Among these eight candidates, Lackey fails to rank in the top three in any of the featured stats. He has been a good pitcher this year but not necessarily special. It would take a strong September for him to get serious consideration.
Aside from a superior walk rate, C.C. Sabathia's numbers are similar to Lackey's. As such, the Cleveland Indians ace is unlikely to gain much support. Like Lackey, the big southpaw has another member of his team's rotation that is more deserving of the honor. Yes, Fausto Carmona is – or at least should be – in the discussion for the AL CYA. The 23-year-old groundball specialist, who is leading the AL in GB % (64.5%) and GIDP (28), is tied for third in the league in quality starts with 20. It's almost hard to believe that Carmona spent time in the minors earlier this season.
Josh Beckett has the best combination of K, BB, and HR rates of any pitcher in the AL. As such, Boston's ace righthander is leading the league with a 2.79 Fielding Independent Pitching (FIP) mark. Beckett will also win over the hearts of voters with his MLB-leading win total (16, tied with teammate Tim Wakefield) and winning percentage (.762).
Dan Haren is leading the AL in ERA and is among the top three in IP (185.1), WHIP (1.11), and W-L % (.737). He has been consistently solid all year, as evidenced by his MLB-leading 25 quality starts (89% of his GS). However, with 13 unearned runs, his ERA may slightly overstate his pitching prowess this year. The 6-foot-5, 220-pound righthander is fourth in the league in RA (3.35), nearly one-third of a run behind Escobar.
Lost a bit in the shuffle has been two-time Cy Young Award winner Johan Santana. His stats are pretty much in line with the past two seasons. The only thing that has changed is the level of the competition. He is leading the league in WHIP (1.02) but is not blowing away the field in strikeouts or ERA as in years past. Santana has been hurt by the long ball, allowing a career-high 27 HR in 182 IP.
If you want strikeouts, then Erik Bedard is your man. The Baltimore Orioles lefthander is leading the majors in Ks (221) and K/9 (10.9). The power pitcher also gets an above-average number of groundballs (47.9%), making him a favorite of mine with his high K and GB rates.
NATIONAL LEAGUE
              ERA   ERA+   K/9   BB/9   HR/9
Webb         2.63   177   7.79   2.72   0.42
Penny        2.65   168   6.29   3.12   0.26
Peavy        2.21   186   9.81   2.69   0.32
Young        2.12   194   8.62   3.18   0.33
Smoltz       3.01   143   8.24   2.06   0.61
Unlike the American League, the Cy Young Award in the NL is really a two-horse race between Webb and Jake Peavy. Brad Penny, Chris Young, and John Smoltz have had stellar seasons but not on par with Webb and Peavy.
Webb has something in common with Cy Young, the Hall of Fame pitcher. Young once set the record for the most consecutive scoreless innings pitched with 45, which wasn't broken until 1968. Webb recently completed 42 consecutive shutout innings. The hottest pitcher in baseball has won six straight starts – including three complete-game shutouts – and has lowered his ERA from 3.38 to 2.63 in the process. As the ace of Arizona's staff with a MLB-leading 191.2 IP, the defending CYA winner may also get bonus points if the Diamondbacks win the NL West.
Despite Webb's emerging presence, Peavy remains a strong candidate to win his first Cy Young. The 26-year-old righthander is leading the NL in strikeouts (186) and K/9 (9.81). In addition, he is second in the league in ERA and ERA+. While Peavy may not get any credit from the voters for it, he has the best FIP (2.48) of any starter in baseball.
Penny has the third-best case and could become a factor with a strong stretch run. The 6-foot-4, 260-pound righthander has an impressive resumé as is, leading the league in quality starts (23) and placing second in wins (14) and winning percentage (.778). That said, it's difficult to argue on his behalf over Webb or Peavy.
Chris Young has been nothing short of fantastic this year but his stint on the DL has hurt his chance of winning the NL CYA. He is leading the majors in ERA and WHIP (1.01) but his bad back may prevent him from qualifying for the ERA title at season's end. A flyball pitcher, Young has benefited by pitching at Petco Park. In fact, it's almost hard to believe that he has only allowed five HR this season (vs. 28 in 2006). His rate stats have been outstanding, yet his counting stats have suffered from completing only 135.2 innings. The name fits the bill but the overall package comes up a bit shy.
Other Resources: Baseball-Reference.com, FanGraphs, The Hardball Times, and ESPN.com.
| Weekend Blog | August 25, 2007 |
Weekend Musings
      Player            HR Year Age
+----+-----------------+--+----+---+
    1 Micah Owings       4 2007  24
    2 Clint Hartung      4 1947  24
    3 Don Larsen         3 1953  23
    4 Ernie Wingard      3 1924  23
    5 Kerry Wood         2 1998  21
    6 John Montefusco    2 1974  24
    7 Don Durham         2 1972  23
    8 Tom Griffin        2 1969  21
    9 Ken Tatum          2 1969  25
   10 Eddie Watt         2 1966  25
   11 Sonny Siebert      2 1964  27
   12 Jack Curtis        2 1961  24
   13 Gary Blaylock      2 1959  27
   14 Babe Birrer        2 1955  25
   15 Arnold Carter      2 1944  26
   16 Clise Dudley       2 1929  25
   17 Chad Kimsey        2 1929  22
   18 Jess Doyle         2 1925  27
   19 Wayland Dean       2 1924  22
   20 Leo Dickerman      2 1923  26
   21 Doc Crandall       2 1908  20
   22 Tom Fisher         2 1904  23
Source: Baseball-Reference.com Play Index
Owings, who went yard twice in his last start vs. Atlanta on August 18, has now slugged four homers in the last month. He went 4-for-5 vs. the Braves while driving in six runs, scoring four times, and pitching three-hit ball through seven innings in a 12-6 victory.
The 6-foot-5, 220-pound RHP/RHB was a terrific two-way player for Tulane and Georgia Tech. Arizona drafted him in the third round in 2005. He went a combined 21-for-55 (.382) with a home run and 13 RBI with Tucson (AAA) and Tennessee (AA) in 2006. In his senior season in high school in 2002, Owings hit a single-season Georgia state record 25 home runs.
- Posted by Rich Lederer on 8/25/07 at 10:31 a.m. PT
SINGLE-SEASON LEADERS IN TRIPLES
MODERN ERA (1900-PRESENT)
                              YEAR       3B
1    Chief Wilson             1912       36
T2   Sam Crawford             1914       26
T2   Joe Jackson              1912       26
T2   Kiki Cuyler              1925       26
T5   Tom Long                 1915       25
T5   Sam Crawford             1903       25
T5   Larry Doyle              1911       25
T8   Ty Cobb                  1917       24
T8   Ty Cobb                  1911       24
T10  Ty Cobb                  1912       23
T10  Adam Comorosky           1930       23
T10  Earle Combs              1927       23
T10  Sam Crawford             1913       23
T10  Dale Mitchell            1949       23
Granderson has already tied for second in the post-World War II/Jackie Robinson era.
                              YEAR       3B
1    Dale Mitchell            1949       23
T2   Curtis Granderson        2007       21
T2   Lance Johnson            1996       21
T2   Willie Wilson            1985       21
T4   Stan Musial              1946       20
T4   Willie Mays              1957       20
T4   George Brett             1979       20
T4   Cristian Guzman          2000       20
T8   Garry Templeton          1979       19
T8   Ryne Sandberg            1984       19
T8   Juan Samuel              1984       19
T8   Carl Crawford            2004       19
The Detroit Tigers lead-off hitter is putting up some remarkable stats this year. With 32 doubles, 21 triples, and 16 home runs through Saturday's action, he is projected to produce 87 extra-base hits over the full season. Moreover, he has an outside shot at a 40-20-20 campaign. Here are the players who have accomplished this feat:
SINGLE SEASON
2B >= 40, 3B >= 20, HR >= 20
                              YEAR    XBH     2B      3B      HR
1    Jim Bottomley            1928     93     42      20      31
2    George Brett             1979     85     42      20      23
Source: Complete Baseball Encyclopedia
Granderson's splits are noteworthy. He is blistering righthanders but hasn't hit a lick against southpaws. He is also performing better on the road than at home.
           AVG   OBP   SLG   OPS
vs. RHP   .323  .383  .603  .986
vs. LHP   .154  .207  .269  .476
           AVG   OBP   SLG   OPS
Road      .307  .358  .582  .941
Home      .267  .336  .479  .815
Interestingly, while I was putting up this post, Granderson led off the NYY@DET game with an inside-the-park home run. He sliced a ball down the left field line that Hideki Matsui couldn't reach and the ball got past him and trickled into the corner, allowing the speedy Granderson to circle the bases for his 17th HR of the season.
- Posted by Rich Lederer, 8/26/07, 10:24 a.m. PT
Twenty-eight of the top 50 seasons took place during the 1980s. Six of the eight 100 SB marks (led by Henderson's 130 in 1982) also happened during the "Elusive Eighties."
- Posted by Rich Lederer, 8/26/07, 6:45 p.m. PT
| Command Post | August 24, 2007 |
Park Differences and Reaction Distances
If you have been following the PITCHf/x data this season, you've probably realized that the system has been implemented in more stadiums since the All-Star break, and is in 23 stadiums now. You've also probably noticed that the data provided from each stadium is slightly different. The velocity isn't very consistent between starts by the same pitcher in different stadiums, the movement of pitches seems to change and the release point has been shown to jump around as well.
The release point differences are the most important because as I learned last week, there are only nine parameters captured for each pitch. The three dimensional location of the ball, as well as acceleration and initial velocity, are all captured by the camera system, with the rest of the values that are shown, either in Gameday or the xml itself, being calculated from those nine values. Any discussion about how parks affect the speed or movement of pitches has to begin with a look at the data captured at release point. Below is a table that has the average release point height (in feet) for a team's staff, both at home and in all road stadiums. The way to read the table is that the average release height for all pitchers on the Red Sox while at Fenway was 5.30 feet, and was 6.08 feet for Red Sox pitchers on the road. One problem with using this method is that it doesn't use exactly the same group of pitchers for home and road, which is due to a lack of data, but it gives a rough idea of the release point height at each stadium.
Team    Home    Road     Home-Road
BOS     5.30    6.08    -0.78
SDN     5.61    5.83    -0.22
MIL     5.75    5.97    -0.21
CHA     5.61    5.81    -0.19
SLN     5.96    6.08    -0.12
CHN     6.20    6.31    -0.11
LAN     5.95    6.04    -0.09
SEA     5.81    5.89    -0.08
ARI     5.99    5.98     0.01
CLE     6.00    5.98     0.02
KCA     5.93    5.87     0.06
ATL     5.97    5.91     0.06
OAK     6.06    5.97     0.09
ANA     6.20    6.11     0.09
HOU     5.86    5.76     0.10
DET     6.03    5.91     0.12
TOR     5.79    5.65     0.14
TEX     6.43    6.29     0.14
CIN     6.32    6.17     0.16
PHI     6.33    6.11     0.23
MIN     6.18    5.95     0.23
COL     6.29    5.85     0.44
SFN     6.59    6.11     0.49
Most of the home heights are within .2 feet of their road data, with the exception of Boston, Colorado and San Francisco. However, even among these three stadiums, Fenway stands out, with the release point being .78 feet lower than the road. Every Red Sox pitcher had at least a .40 foot higher release point on road and looking at the average starting velocity of a pitch at each stadium, Red Sox pitchers throw 6.5 MPH faster on the road than at home. Clearly something is going on with the PITCHf/x system at Fenway and to a lesser extent at Coors and AT&T, and could be going on at other stadiums as well. Until we have confidence in the release points being tracked at every park, comparing data gathered at different stadiums without adjusting it will give misleading results.
Park	Name                Pit    pfx_x(")   pfx_z(")    x0(')     z0(')    vy0(ft/s)
Home    Josh Beckett        338   -4.19       3.47       -1.69      4.85     127.59
Road    Josh Beckett        106   -4.51       8.36       -1.95      5.37     134.55
Home    Manny Delcarmen     103   -5.93       7.28       -0.95      5.55     127.83
Road    Manny Delcarmen     35    -4.07       10.07      -1.34      6.12     136.95
Home    Eric Gagne          32    -2.14       3.01       -0.84      5.23     116.06
Road    Eric Gagne          48    -3.54       9.03       -0.78      5.82     131.21
Home    Jon Lester          97     0.96       4.27        2.98      5.66     117.52
Road    Jon Lester          192    1.76       6.15        2.57      6.29     128.25
Home    Daisuke Matsuzaka   314   -2.31       5.47       -2.08      5.14     123.67
Road    Daisuke Matsuzaka   111   -3.56       9.06       -2.31      5.54     134.94
Home    Hideki Okajima      71     2.60       8.02       -0.01      5.82     118.96
Road    Hideki Okajima      27     3.34       6.38       -0.37      6.59     120.71
Home    Jonathan Papelbon   64    -7.68       6.35       -2.28      4.98     132.33
Road    Jonathan Papelbon   31    -6.57       9.84       -2.65      5.48     138.27
Home    Kyle Snyder         87    -1.81       1.58       -1.51      6.22     112.67
Road    Kyle Snyder         39    -1.69       6.28       -1.73      6.73     123.94
Home    Julian Tavarez      248   -7.04       2.80       -1.70      5.16     122.88
Road    Julian Tavarez      41    -6.90       5.31       -2.03      6.12     127.34
Home    Mike Timlin         96    -3.50       6.91       -2.14      6.06     124.26
Road    Mike Timlin         63    -2.86       8.44       -2.56      6.71     130.85
Home    Tim Wakefield       316    0.88       1.98       -0.65      5.80      94.85
Road    Tim Wakefield       71     3.03       3.65       -0.84      6.67     103.41
Looking at individual pitchers for the Red Sox, you can see how Fenway's camera system impacts the different pitchers. X0 and z0 are the coordinates for the release point, measured as a distance from the pitcher's body and from the ground respectively, and the release point is lower at home for all the pitchers. Almost all of the pitchers also get a smaller pfx_z value at home, which would seem to indicate that their pitches have more sink at Fenway, but is actually a result of the lower release height combined with the fact that, overall, the average height when a pitch crosses the plate at Fenway is similar to the height at other parks. The initial velocity is vy0, measured in feet/second, and is slower in every case. I didn't break this chart up by pitch, which is fine for examining the release points, but when looking at the velocity it gives an average that doesn't really mean anything.
Getting back to making an adjustment, the z coordinates of the release points are all roughly 10% too small at Fenway. If the Fenway x values were increased by 10% they would be a closer match for the release points on the road. However, once you make that adjustment, you need to adjust each of the other 8 parameters so that they are "measuring" at the new, adjusted release point, rather than the low release point. If you say that Fenway lowers the release point for every pitcher by 10%, and apply these adjustments to every pitch thrown at Fenway, here's what happens for Josh Beckett.
Park    Name       Pit     x0      z0      vy0
Road    Beckett    106    -1.95    5.37    134.55
Fenway  Beckett    338    -1.69    4.85    127.59
Adj.    Beckett    338    -1.99    5.39    136.53
Even through the adjusted numbers match the road numbers, I'm not very confident in using this method to make large-scale adjustments. For one thing, the road numbers could be off too. For Beckett I'm looking at one road start, made in Safeco, so I could be making too big of an adjustment. The lack of a large sample of road starts for pitchers is a major weakness of the type of separation I used in the home/road charts, but once there are more starts made in stadiums with the pitch f/x system, that hopefully can change. I think any true park factors are going to need to wait until there is more data captured at all stadiums.
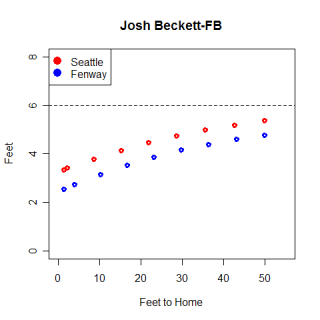
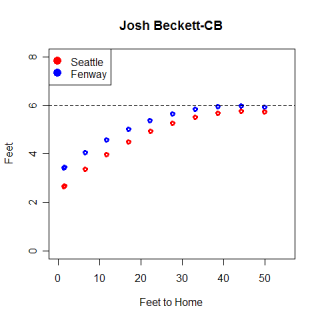
Here are two graphs of a randomly selected Beckett fastball and curveball at Fenway and Safeco, as viewed from the first base line. You can really see the difference that the release height makes from this view. There appear to be some differences in how the curveball moves at the different stadiums, but the fastball follows virtually the same path, just at different heights, in both cases. Each dot represents the ball's position in .05 second intervals, which segues nicely into my last section.
I received a comment yesterday on my article from last week that suggested a better way to quantify the speed of a pitch was to determine how far away the pitch is when the batter has to decide whether to swing. It probably is even more intuitive to think of it like this compared to how many seconds the ball takes to arrive, so I went ahead and calculated some distances.
You can test your reaction time here, and after some extensive research (emailing the link to five friends) I think a rough proxy for an MLB reaction time is around .2 seconds. If a pitch takes .513 seconds to reach the plate, as a Wakefield knuckleball does, then the hitter can let the pitch travel for .313 seconds out of Wakefield's hand before making a decision. The pitch is 19.75 feet from home plate at .313 seconds, so the hitter can wait until Wakefield's knuckleball is about 20 feet from him before making a decision. A hitter has to make a decision on a fastball on a Beckett fastball 27 feet from home, while on a Rich Hill curveball the hitter has to decide when the pitch is 21 feet from home.
The hard part of finding these numbers is determining the reaction time. The test above only involves clicking a mouse button, which is nearly instantaneous, but swinging a bat takes much longer. Even if the hitter had a reaction time of .2 seconds, once he recognized the pitch and reacted, actually swinging the bat would take some time as well. If you add on another .1 second to account for the swing, the distances are pushed back to 29 feet for Wakefield's knuckleball, 41 feet for Beckett's fastball, and 31 feet for Hill's curve.
I have no idea if the .1 second swing time is accurate, but at 41 feet from the plate most pitches look very similar. Hill's curveball hasn't began to break yet and it looks very similar to Beckett's fastball. If you had a reaction time of .2 seconds and a swing that lasts .2 seconds after the reaction time, you would need to artificially speed up your reaction time and decide whether to swing at Beckett's fastball before he even released his pitch. If he were throwing his curveball or changeup instead...well, Beckett does have 148 strikeouts this year. I believe there is some overlap on reaction time and when the swing begins, which lowers the overall time used, and I think there is also some element of "Blink" involved here, where good hitters "know" to swing at a pitch before they realize why they are swinging at it. Either way, hitting is hard.
| Change-Up | August 22, 2007 |
The Anatomy of a Slide
When play was said and done on May 13, the Milwaukee Brewers had a record of 25-12, good for a .676 win percentage. On June 22, they had an 8.5 game lead in the National League Central. Today, they trail the Chicago Cubs by one game in the NL Central, have gone 40-49 since May 13 and have just a .516 win percentage overall. Since June 22, they are 23-29. I will concede this is not the timeliest of pieces given that Milwaukee has taken two of three in Arizona from the D-Backs but I wanted to follow up Rich's effort on Monday featuring Ryan Braun with a look at the team as a whole.
How can a team be so good for a sustained stretch, and then so bad thereafter? Well check out the numbers below.
          4/1 - 5/13          5/14 - 8/21
Estrada  .304/.328/.461      .263/.282/.380
Weeks    .237/.344/.443      .204/.342/.306
Hardy    .325/.376/.616      .252/.304/.412
Jenkins  .323/.374/.616      .251/.327/.472
As for the pitchers most responsible for the slide, presented in the respective columns is the same chronological timeframe.
          ERA  K/9  K/BB    ERA  K/9  K/BB
Suppan   3.00  4.7  2.80   5.89  4.9  1.22
Capuano  2.93  7.0  2.20   6.59  8.8  2.89
Vargas   2.65  9.8  2.85   5.50  6.3  1.66
Cordero  0.54  12.4 3.29   4.50  11.6 4.00
It's not rocket science, but it helps to see it laid out in plain view. The Brewers have slid as far back as they have because eight players who were tremendous for them at the start of the season have been terrible since they topped out with their .676 win percentage.
What has gone wrong is that Johnny Estrada, Rickie Weeks, J.J. Hardy, Geoff Jenkins, Jeff Suppan, Chris Capuano, Claudio Vargas and Francisco Cordero - key players all - started off phenomenally, maybe above their heads, and have since played well short of their respective ability levels since. Ben Sheets had been pitching phenomenally when he went down and his absence had done the Brew Crew no favors.
All is not even close to lost for the Brewers, as they are demonstrating in the desert right now. Last season's American League representative in the fall classic, the Detroit Tigers, went 25-32 over their final 57 games. There's a reason they play 162 of these things. If Milwaukee, and specifically the players mentioned above (save Capuano, who is no longer with the Big Club), can play somewhere around their ability levels, I give them a good chance to make the post-season.
That's because those first 38 games counted, even though the weather was raw and the NBA and NHL playoffs might have diverted some attention from our national pastime. Still, the time is now for these Milwaukee Brewers and it will be fascinating to see if they can reverse course once again down the stretch.
**********
Thanks to Baseball Musings' Day By Day Database.
Also, for excellent Wisconsin sports coverage (something dear to my heart at the moment since I have a man-weekend trip to Madison for the Michigan-Wisconsin football game in November), be sure to check out The Wisconsin Sports Bar.
| Baseball Beat | August 21, 2007 |
Checking in on the First Round Draft Picks
Eighteen of the 30 first round draft picks have begun their professional careers, ranging from one game in the case of Tim Alderson to 51 games by early signee Beau Mills.
I thought it would be interesting to see how the first rounders are doing. I have compiled the stats for the pitchers first, followed by the position players. All listings are in the order of how players were drafted.
                      W  L   ERA   IP    H   R  ER  HR   BB  SO  WHIP   SO/9  K/BB
Moskos     asx,ROK    0  0  4.00   9.1  15   5   4   1    2   8  1.82   7.71  4.00
Detwiler   H-A,ROK    1  2  4.50  24.1  30  12  12   2    8  23  1.56   8.51  2.88
Weathers   L-A        0  0  3.80   9.2   3   4   4   1    4  16  0.72  14.90  4.00
Savery     asx        0  1  3.86   9.2  10   4   4   0    3   5  1.35   4.66  1.67
Withrow    ROK        0  0  5.60   8.0   5   5   5   0    4  12  1.13  13.50  3.00
Alderson   ROK        0  0  0.00   1.0   1   0   0   0    0   2  1.00  18.00  ----
Schmidt    L-A        0  1  6.43   7.0   8   5   5   0    6   6  2.00   7.71  1.00
Main       ROK,asx    1  1  3.70  20.0  16   8   8   2   10  28  1.30  12.60  2.80
Poreda     ROK        2  0  1.25  36.1  25   6   5   1    9  35  0.94   8.67  3.80
Simmons    AA         0  0  5.79  23.2  33  17  15   2    5  20  1.61   7.61  4.00
Aaron Poreda (2-0, 1.25 ERA, 0.94 WHIP, 3.80 K/BB), selected with the 25th overall pick by the Chicago White Sox, has performed the best of all the first round pitchers to date. However, recognize that the 20-year-old lefthander out of the University of San Francisco has worked his magic at Great Falls in the Pioneer League (Rookie). I wouldn't put much stock in his numbers until he makes the jump to at least Low-A, which is where most highly regarded college pitchers start their pro careers.
Casey Weathers (COL) has enjoyed success, allowing only three hits while striking out 16 batters in 9 2/3 innings for the Asheville Tourists of the South Atlantic League (Low-A). Chris Withrow (LAD) and Michael Main (TEX) have shown spurts of dominance, averaging well over one K per inning. Main has already been promoted to the Spokane Indians (Short Season).
                      G   AB   R   H 2B 3B HR RBI  BB  SO   AVG   OBP   SLG   OPS SB CS
LaPorta    L-A,ROK   17   66  10  18  7  0  4  12   5  20  .273  .324  .561  .885  0  0
Mills      L-A,asx   51  201  37  52 14  1  5  36  17  44  .259  .330  .413  .743  0  0
Heyward    ROK        4   16   1   6  4  0  1   3   2   4  .375  .444  .813 1.257  0  1
Mesoraco   ROK       34  116  14  25  3  0  1   7  14  22  .216  .316  .267  .583  2  0
Ahrens     ROK       43  147  14  33  5  0  3  18  23  41  .224  .337  .320  .657  3  0
Kozma      ROK       27   94  19  25  5  0  2   9  12  18  .266  .361  .383  .744  3  1
Arencibia  asx       48  175  24  45 12  0  3  21  11  44  .257  .305  .377  .682  0  0
Revere     ROK       45  173  41  55  5  9  0  22  10  17  .318  .372  .451  .823 19  8
Jason Heyward, chosen by the Atlanta Braves with the 14th overall pick, is off to a hot start. The 17-year-old outfielder has gone 6-for-16 with five XBH in his first four games for the GCL Braves of the Gulf Coast League (Rookie). Don't be surprised if he ends up as one of the top players out of the 2007 draft.
Ben Revere, the surprise first round choice of the Minnesota Twins, has put up some unusual numbers. The 5-foot-9 speester has hit 9 triples and stolen 19 bases in 45 games for the GCL Twins (Rookie). With only 10 BB and 17 SO, Revere has done little to convince me that he is not another Juan Pierre in the making. The outfielder has yet to go yard so I would discount those pre-draft reports in which he allegedly slugged a 450-foot homer.
Devin Mesoraco (CIN) has struggled the most, hitting just .216/.316/.267. His stock rose late last spring, and it's possible that he may have been a reach at #15. Toronto's first two selections – Kevin Ahrens and J.P. Arencibia – have combined to strike out 85 times in 322 at-bats.
Twelve first rounders have yet to play. In the order of how they were drafted, David Price (TB), Mike Moustakas (KC), Josh Vitters (CHC), Matt Wieters (BAL), Jarrod Parker (ARI), Madison Bumgarner (SF), Phillippe Aumont (SEA), Matt Dominguez (FLA), Blake Beavan (TEX), Rick Porcello (DET), Wendell Fairley (SF), and Andrew Brackman (NYY) are all signed but still awaiting their professional debuts. For the most part, the recent signees just reported to spring training facilities and many of them will not play until the instructional league opens in mid-September.
| Baseball Beat | August 20, 2007 |
Ryan Braun: Greatest First-Year Slugger Ever?
Ryan Braun led off the second inning yesterday with his 24th home run of the season to give Milwaukee an early 1-0 advantage although the Brewers later blew a five-run lead and lost 7-6 to the Cincinnati Reds. The Brew Crew has now dropped six of its last seven and 10 of 13 while slipping into second place in the National League Central, one game behind the Chicago Cubs.
Although the Brewers are only 35-42 since Braun made his MLB debut on May 25, nobody can blame Milwaukee's misfortunes on its rookie third baseman. The fifth overall pick in the 2005 draft is quietly having one of the greatest seasons ever for a first-year player.
Let's take a look at his year-to-date stats:
 G   AB   R   H   2B  3B  HR  RBI  BB  SO  SB  CS   AVG   OBP   SLG   OPS   OPS+
76  309  58  106  17   5  24   62  23  70  10   4  .343  .388  .663 1.051   168
Due to a late start to his season, Braun is 46 plate appearances short of qualifying for the league lead in batting average and other rate stats. If the 23-year-old sensation had met the minimum, he would sit atop the NL in batting average (.343) and slugging average (.663) and rank second to Barry Bonds in OPS (.1051 to 1.084). His AVG, SLG, and OPS are all higher than fellow third baseman Alex Rodriguez, who is in the midst of another great season.
By not appearing among the league leaders in the newspaper every day, the former University of Miami (FL) All-America has escaped the attention of the average fan. With 338 plate appearances and 38 games to go, Braun is on the bubble as to whether he will qualify for the batting and slugging crowns at season's end. If he continues to average 4.45 PA per game while missing no more than one contest, Braun will just meet the minimum threshold of 502 PA needed to qualify.
Should Braun fail short, he still could win the batting and slugging titles under a rule that was put in place in 1967 by figuring the remaining at-bats as hitless. If Braun's recalculated averages are superior to those who qualified, then he would be awarded the titles. According to Wikipedia, "this policy was invoked in 1981, securing Bill Madlock his third NL batting crown, and in 1996, when NL titlist Tony Gwynn finished the year with only 498 PAs."
In any event, to put Braun's numbers in historical perspective, he is on pace to produce the highest AVG, SLG, OPS, and OPS+ of any first-year player in the modern era. The 6-foot-2, 200-pound native of Southern California is in elite company with such greats as Joe DiMaggio, Johnny Mize, Albert Pujols, Frank Robinson, and Ted Williams.
   Player              SLG  Year  Age
 1 George Watkins     .621  1930   30
 2 Wally Berger       .614  1930   24
 3 Albert Pujols      .610  2001   21
 4 Ted Williams       .609  1939   20
 5 Dale Alexander     .580  1929   26
 6 Johnny Mize        .577  1936   23
 7 Joe DiMaggio       .576  1936   21
 8 Frank Robinson     .558  1956   20
 9 Zeke Bonura        .545  1934   25
10 Johnny Frederick   .545  1929   27
11 Del Bissonette     .543  1928   28
12 Buzz Arlett        .538  1931   32
13 Earl Averill       .538  1929   27
14 Paul Waner         .528  1926   23
15 Mitchell Page      .521  1977   25
16 Jimmie Hall        .521  1963   25
17 Wally Judnich      .520  1940   23
18 Bob Meusel         .517  1920   23
19 Johnny Rizzo       .514  1938   25
20 Orlando Cepeda     .512  1958   20
George Watkins was 30-years-old when he slugged .621 in 1930, the season with the highest AVG, SLG, and OPS in the history of baseball. With only 424 PA, the St. Louis Cardinals outfielder would have failed to qualify under today's rules, yet met the less stringent criteria of his day by playing in a minimum of 100 games.
Braun was mentioned in the same sentence as Pujols earlier this month when he hit his 20th HR in 64 games – the fastest to reach that mark since Albert did it in his 63rd game in 2001.
At 1.051, Braun's on-base plus slugging (OPS) would also rank #1 among all first-year players.
   Player              OPS  Year  Age
 1 Ted Williams      1.045  1939   20
 2 George Watkins    1.036  1930   30
 3 Albert Pujols     1.013  2001   21
 4 Wally Berger       .989  1930   24
 5 Johnny Mize        .979  1936   23
 6 Dale Alexander     .977  1929   26
 7 Paul Waner         .941  1926   23
 8 Del Bissonette     .939  1928   28
 9 Frank Robinson     .937  1956   20
10 Earl Averill       .936  1929   27
11 Joe DiMaggio       .928  1936   21
12 Mitchell Page      .926  1977   25
13 Zeke Bonura        .925  1934   25
14 Buzz Arlett        .925  1931   32
15 Johnny Frederick   .917  1929   27
16 Don Hurst          .899  1928   22
17 Bob Johnson        .892  1933   27
18 Alvin Davis        .888  1984   23
19 Wally Judnich      .888  1940   23
20 Johnny Rizzo       .882  1938   25
One has to sit up and take notice when a player is producing at the same level as The Splendid Splinter. However, Williams was only 20 when he broke in so it would be a stretch to suggest that Braun's initial season might portend a similar career path.
When we adjust for home ballpark and era, Braun's OPS+ of 168 would rank as the best first season in the annals of modern baseball.
   Player              OPS+ Year  Age
 1 Johnny Mize         161  1936   23
 2 Ted Williams        160  1939   20
 3 Albert Pujols       158  2001   21
 4 Mitchell Page       152  1977   25
 5 Dale Alexander      148  1929   26
 6 Paul Waner          147  1926   23
 7 Alvin Davis         146  1984   23
 8 Del Bissonette      144  1928   28
 9 Del Ennis           143  1946   21
10 George Watkins      143  1930   30
11 Frank Robinson      142  1956   20
12 Curt Blefary        139  1965   21
13 Johnny Rizzo        139  1938   25
14 Jeff Bagwell        138  1991   23
15 Buzz Arlett         138  1931   32
16 Wally Berger        137  1930   24
17 Jimmie Hall         136  1963   25
18 Cuckoo Christensen  136  1926   26
19 Gavvy Cravath       136  1908   27
20 Earl Averill        135  1929   27
If discussing Braun's place in history is a bit premature with more than a month to go, I believe it is safe to say that he is a virtual lock to win the NL Rookie of the Year. Braun has even been mentioned as an MVP candidate although it says here that he will have a difficult time beating out teammate Prince Fielder, who is leading the league in home runs with 38.
To Braun's credit, he has hit some big home runs this season. None was bigger than the game-winning, three-run homer he cranked against Brad Lidge on Saturday, August 11. Braun moved to the cleanup spot in the order last Tuesday and went 3-for-4 with a solo home run and two runs. With Fielder hitting in front of rather than behind Braun, it will be interesting to see if pitchers begin to work him differently. In the meantime, the man who wears #8 on his jersey is absolutely crushing lefthanders.
          AB  HR  BB  SO  AVG  OBP   SLG   OPS
vs. LHP   79  11  14  12 .468 .543 1.013 1.556
vs. RHP  230  13   9  58 .300 .328  .543  .864
Small sample size for sure but impressive nonetheless. While not eye popping, Braun's numbers vs. righthanders are solid. The only disconcerting split involves his BB/SO totals against righties. He has drawn five more walks vs. LHP in 151 fewer AB while striking out just 13% of the time as compared to 24% vs. RHP.
Braun is hitting at home (.321/.384/.648), on the road (.367/.391/.680), during the day (.339/.378/.621), and at night (.346/.394/.692 ). He ripped pitchers in the first half (.350/.391/.663 ) and is tearing 'em up in the second half (.336/.384/.664).
The only place in the strike zone where pitchers have had mediocre success is up and in where the righthanded-hitting slugger is batting .273. He is hitting .324 or better in all of the other zones, including .556 over the heart of the plate and waist high and .583 down the middle between the knees and the thighs. Braun also hits the ball with authority to all fields.
Braun is not without his weaknesses. He has made 19 errors in 75 games and his fielding percentage of .893 would rank as the 14th worst among 3B with 100 or more games since 1900.
FIELDING PERCENTAGE           YEAR      PCT       G
1    Charlie Hickman          1900     .842      120
2    Hunter Hill              1904     .864      127
3    Tommy Leach              1903     .879      127
4    Harry Wolverton          1900     .881      104
5    Otto Krueger             1901     .881      142
6    Bill Bradley             1900     .882      106
7    Joel Youngblood          1984     .887      117
8    Emil Batch               1905     .887      145
9    Doc Casey                1901     .887      127
10   Jim Delahanty            1904     .888      113
11   Jimmy Williams           1900     .889      103
12   Roy Hartzell             1906     .889      103
13   Sammy Strang             1902     .890      139
14   Fred Hartman             1901     .894      119
15   Jimmy Collins            1907     .895      139
16   Jap Barbeau              1909     .895      132
17   Nixey Callahan           1903     .895      102
18   Harry Lord               1912     .895      106
19   Heinie Zimmerman         1914     .897      118
20   Jimmy Burke              1904     .897      118
21   Charlie Pick             1916     .899      108
22   Butch Hobson             1978     .899      133
23   Gary Sheffield           1993     .899      133
Interestingly, only three other third sackers – Butch Hobson (1978), Joel Youngblood (1984), and Gary Sheffield (1993) – have had a fielding percentage below .900 since 1916.
After leading the Brewers with five home runs during spring training, Braun was assigned to Nashville of the Pacific Coast League primarily to work on his defensive footwork and throwing. Not surprisingly, the prized prospect dominated Triple-A pitchers to the tune of .342/.418/.701. Over the course of 110 combined major and minor league games, Braun has hit .343 with 34 HR.
Make sure you don't confuse Ryan Braun with the 27-year-old rookie pitcher for the KC Royals by the same name. Well, I guess it is confusing. But the key is not to be mistaken by the two. It might be helpful – and more accurate – to think of the Milwaukee Brewers slugger as none other than Ryan Brawn.
Sources for the above tables: Baseball-Reference Play Index and the Complete Baseball Encylopedia.
| Baseball Beat | August 18, 2007 |
The Wizard of Odds
I just returned from an overnight business trip to Las Vegas and thought I would share the baseball odds posted at Caesars Palace and all the other (Toby) Harrahs properties (such as Paris, Flamingo, Imperial Palace, Bally's, Harveys, and the Rio).
Odds to Win the 2007 World Series
                             Line
                       Opening   Current
Team                   10/9/06   8/16/07
New York Yankees         4/1        7/2
New York Mets            9/2        4/1
Chicago White Sox        5/1     2000/1
Minnesota Twins          6/1       40/1
Detroit Tigers           6/1        7/2
St. Louis Cardinals      7/1       25/1
Oakland A's              8/1      300/1
Los Angeles Dodgers     10/1       40/1
Boston Red Sox          12/1        5/2
Los Angeles Angels      12/1        4/1
Philadelphia Phillies   12/1       22/1
Florida Marlins         12/1      300/1
San Diego Padres        18/1       18/1
Toronto Blue Jays       20/1      250/1
Houston Astros          22/1      500/1
Cincinnati Reds         25/1      750/1
Atlanta Braves          35/1       15/1
Cleveland Indians       40/1        8/1
Colorado Rockies        50/1       45/1
Chicago Cubs            50/1        4/1
Texas Rangers           60/1     2500/1
San Francisco Giants    60/1     2500/1
Arizona Diamondbacks    75/1       12/1
Seattle Mariners        75/1       18/1
Baltimore Orioles       85/1     2000/1
Milwaukee Brewers       85/1       10/1
Washington Nationals   100/1     2000/1
Pittsburgh Pirates     150/1     2000/1
Kansas City Royals     200/1     5000/1
Tampa Bay Devil Rays   200/1     5000/1
None of the above lines are particularly appealing in my judgment. As with all futures bets, the odds are stacked against the bettor and in favor of the house. Assuming equal money is wagered on all teams, the book has about a 90% profit margin built into the cumulative lines (vs. a more typical 10-20% for individual games).
The Chicago White Sox have been the biggest disappointment in 2007, going from the team with the third-lowest odds in the opening line to 2000/1 with a month-and-a-half still to go. The Oakland A's have also failed to live up to expectations this year.
All has not been lost on the Windy City as the Chicago Cubs have arguably turned in the biggest positive surprise of any team in baseball, going from 50/1 longshots last October to a one-in-five chance as the season hits the three-quarters pole. Cleveland, Milwaukee, Arizona, Atlanta, and Seattle have outperformed initial expectations as well.
At 3/2, the New York Mets were favored to win the National League Championship. The line on the Cubs (8/5) seemed a bit short to me, probably reflecting the hope of the fans more than the sentiment of the professional bettor. The other teams with a reasonable shot include the Brewers (9/2), Diamondbacks (5/1), Braves (6/1), San Diego Padres (9/1), and the Philadelphia Phillies and St. Louis Cardinals (both 10/1).
Over in the American League, the Boston Red Sox (6/5) were almost odds-on to win the ALCS. The New York Yankees (9/5), Detroit Tigers (9/5), Los Angeles Angels (2/1), and Indians (3/1) were the only other clubs given much of a shot at winning the pennant. If the season ended yesterday, the Mariners (8/1) would be the Wild Card team and would have a one-in-four chance of representing the AL in the World Series if you believe, like Billy Beane, that the playoffs are nothing more than a crapshoot.
On the non-baseball side, you can bet $50 to win $20 on Roger Federer winning the U.S. Open Tennis Championship for the fourth consecutive time.
Get this, the AFC team is already a seven-point favorite to win the Super Bowl. Based on the odds to win the conference championships, the New England Patriots (6/5 to win the AFC and 5/2 to win the Super Bowl) and Chicago Bears (7/2 NFC, 7/1 Super Bowl) are favored to oppose each other in Glendale, Arizona on February 3, 2008. The over-under is 47.
For the patient, you can place a futures bet on the Men's NCAA basketball tournament (March 18-April 7) or the 2008 Masters golf tournament (April 10-13). The favorites? North Carolina at 7/2 and Tiger Woods at 9/5.
If you've got money to burn, Las Vegas stands ready to take it with the odds clearly stacked in favor of the house. Before you place that bet, take a deep breath and decide where your money could be better spent.
| Command Post | August 17, 2007 |
May I have Seconds?
Despite playing with the PITCHf/x data since the playoffs last season, I didn't have a very firm understanding on how the values were captured until earlier this week when I was alerted to Alan Nathan's fantastic website on the physics of baseball. The whole site is good, but I was particularly interested in the section on the PITCHf/x system. In addition to Nathan's analysis on pitch data, this section contains a treasure trove of general information about the system as well as specific definitions for each data field. Using several of Nathan's equations, I was able to quantify where a pitch is in space at any time from release until it reaches home, and using these locations, I was able visualize the entire trajectory of each pitch, similar to what is shown for each pitch in the Gameday window.
The equation for finding the x position of a pitch is x(t)=x0+vx0*t+0.5*ax*t^2, where t is time, vx0 is the pitch's initial velocity in the x direction and ax is it's acceleration in the x direction. Vx0 and ax are provided in the xml, so finding the x coordinate of a pitch is as easy as plugging in a value for t. The y and z coordinates of a pitch are found using the same equation, but with the appropriate initial velocity and acceleration values. Here's the path of a Rich Hill curveball from July 21st.
Time(s)   x       y        z
0.00      1.31    50.00    6.76
0.05      1.24    44.78    6.81
0.10      1.15    39.61    6.77
0.15      1.02    34.49    6.62
0.20      0.86    29.42    6.38
0.25      0.67    24.40    6.03
0.30      0.45    19.43    5.58
0.35      0.19    14.52    5.04
0.39     -0.01    10.87    4.56
0.45     -0.40    4.84     3.63
0.49     -0.64    1.42     3.03
If I were really good I would have a 3 dimensional graph here, but it looks the same as the path they show in Gameday for the pitch. Each coordinate is measured in feet, with 0,0,0 being the back part of home plate and y=1.42 being the front of home plate. X measures left and right, from the catchers perspective, with negative numbers being on his left, y is the distance from the pitchers mound to home plate and z is vertical distance from the ground. This curveball ended in the high, inside quadrant of the strike-zone for a right-handed hitter.
The first thing I noticed in the chart is that the pitch reached the front edge of home plate in .49 seconds. Using radar guns to measure the velocity of a pitch is established practice throughout baseball, however, the speed of a pitch varies based on where the gun is aimed, so saying a pitch is 71 MPH doesn't really mean anything. Was it 71 MPH out of the pitcher's hand? Crossing the plate? "Fast" gun? "Slow" gun? You could get four correct, but different radar readings for the same pitch. What really matters is the time a batter has to react to a pitch. Saying Hill's curveball takes .486 seconds to travel from release point to home (from y=50 to y=1.417) while his fastball takes .387 seconds shows a clear, tangible difference between the pitches. For a rough comparison, a Joel Zumaya fastball takes around .353 seconds and a Tim Wakefield knuckleball takes .544 seconds to make the journey. I'm not sure which is more amazing, that Zumaya's fastball gets to the plate so fast, or that Wakefield's knuckleball, the slowest pitch in baseball, still gets to the plate in half a second.
Here's a list of the 10 pitches that have reached home fastest this season, along with the corresponding release point radar reading. (For simplicity, I only used pitches that were tracked for 50 feet, which is why Zumaya does not appear on the list.) Looking at the list and the rest of the fast pitches in my database, it appears that there might be a little bit of a park factor involved with the results, although the names are who you would expect.
Player                Date       Time(s)  MPH
Justin Verlander      7/15	.3477     101.7
Matt Lindstrom        7/24      .3479     99.6
J.J. Putz             7/28      .3482     101.3
Jonathan Broxton      7/15      .3488     99.6
J.J. Putz             7/28      .3492     101.6
J.J. Putz             7/28      .3492     101.5
Matt Lindstrom        7/3       .3496     100.3
Justin Verlander      7/15      .3497     100.8
Matt Lindstrom        7/3       .3499     100.4
Matt Lindstrom       7/24      .3500     99.4
Getting back to Hill, graphing the trajectory of his fastball and curveball shows the differences in flight paths. This graph is drawn as if you were looking down from above, showing movement in the x-direction, with the release points at the top right of the graph and home plate in the bottom middle.
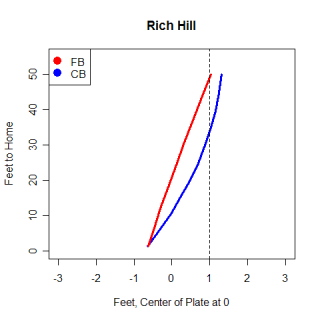
From the graph, you can see the different routes the pitches take. For the first 10 feet, Hill's curve looks very similar to his fastball, although after that the curve begins to break, moving away from left-handed hitters. The dotted line is a rough guess at the sight line for a left-handed hitter and illustrates how difficult it is for a left-handed hitter to hit a good curve from a left-handed pitcher. While both pitches begin at around the same location, the curveball actually goes behind a left-handed hitter's field of vision and appears that it will hit him for a split-second.
This graph is a side view of Hill's pitches, viewed from the first base line. Again the differences between the pitches are pretty clear to see, with the curveball taking a longer route to cover the same distance as the fastball. One thing to notice on this graph is that the curveball actually goes up after Hill releases it. It's not a big movement, but the pitch reaches it's maximum z-value .05 seconds after it has been released. On this graph the dotted line gives a rough idea of the eye level of a hitter and you can see that the curveball crosses the line much closer to home than the fastball does. I believe it is harder to look up and see a curveball that is above your eyes than it is to look down and see a fastball. Not only is the timing of a hitter thrown off by a curve, but where he's looking for the pitch is also thrown off.
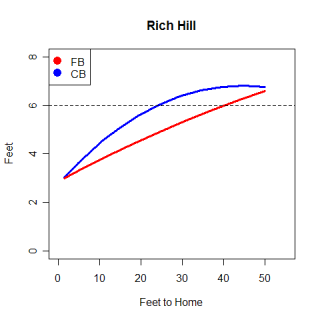
There has been research done that shows the release points measured by the PITCHf/x system are not very consistent for different stadiums, so any research that uses the release point information needs to take that into account. However, according to Dr. Nathan's website, the only values in the xml files that are observed directly are the accelerations and initial velocities and positions, all of which are based of the release point. Every other value in the xml, including where the pitch crosses the plate and the break values, are calculated from those nine observed values. This opens the door to all kinds of problems if the release points are still as inconsistent as they were at the beginning of the year. This could also help explain the park factor I mentioned with times, because if the release point is slightly off it will directly impact the time calculations.
There are a number of cases where pitches are badly tracked, and another problem with the system is that it occasionally picks up a ball transfer between the umpire and pitcher. I haven't done any digging into this, so this is pure speculation, but knowing more about how the values are calculated, I think perhaps these two problems are related. If the initial values are somehow wrong (they correspond with the ball exchange), the x,y coordinates for where the ball crosses the plate are going to be calculated correctly for the ball exchange, but will not match the reality of the pitch.
********************
I referred to Alan Nathan's website countless times while I was writing this article and his kinematic equations are the basis for this article. I also want to thank him for helping answer some questions I had about the data and his equations. I highly recommend checking out his site, particularly his analysis on the PITCHf/x data.
| Baseball Beat | August 16, 2007 |
A Recap of the First Round Signings (and More)
Major League Baseball's newly imposed draft deadline came and went yesterday without a lot of hitches. Teams and players had until midnight to reach agreements and all 30 first rounders inked contracts with their new clubs. Not surprisingly, a few signings (namely Michael Moustakas at #2, Josh Vitters at #3, and Matt Wieters at #6) were reached minutes before the deadline, adding an element of suspense to what would otherwise be termed business as usual.
According to Jim Callis of Baseball America, "the average first-round bonus went up" this summer despite MLB's efforts to reduce slot money by 10%. This year's average bonus of $2,098,083 compared to $1,933,333 in 2006 and marked the highest since 2002 ($2,106,793).
FIRST ROUND SIGNING BONUSES
1. Tampa Bay Devil Rays: David Price, LHP, Vanderbilt University - $5.6 million signing bonus as part of a six-year major league contract worth a guaranteed $8.5 million and as much as $11.25 million. Price's bonus was the second-largest in draft history when he signed, trailing only Justin Upton's $6.1 million as Arizona's No. 1 overall pick in the 2005 draft. The guaranteed value of Price’s contract is the third-highest in draft annals, trailing only Mark Prior ($10.5 million, Cubs) and Mark Teixeira ($9.5 million, Rangers) from the 2001 draft."
2. Kansas City Royals: Mike Moustakas, SS, Chatsworth HS (CA) - $4 million.
3. Chicago Cubs: Josh Vitters, 3B, Cypress HS (CA) - $3.2 million.
4. Pittsburgh Pirates: Daniel Moskos, LHP, Clemson University - $2.475 million.
5. Baltimore Orioles: Matt Wieters, C, Georgia Tech - $6 million (the largest up-front bonus in draft history).
6. Washington Nationals: Ross Detwiler, LHP, Missouri State University - $2.15 million.
7. Milwaukee Brewers: Matt LaPorta, 1B, University of Florida - $2 million.
8. Colorado Rockies: Casey Weathers, RHP, Vanderbilt University - $1.8 million.
9. Arizona Diamondbacks: Jarrod Parker, RHP, Norwell HS (IN) - $2.1 million.
10. San Francisco Giants: Madison Bumgarner, LHP, South Caldwell HS (NC) - $2 million.
11. Seattle Mariners: Phillippe Aumont, RHP, Ecole du Versant High School (CAN) - $1.9 million.
12. Florida Marlins: Matt Dominguez, 3B, Chatsworth High School (CA) - $1.8 million.
13. Cleveland Indians: Beau Mills, 1B-3B, Lewis-Clark State College - $1.575 million.
14. Atlanta Braves: Jason Heyward, OF, Henry County High School (GA) - $1.7 million.
15. Cincinnati Reds: Devin Mesoraco, C, Punxsatawney High School (PA) - $1.4 million.
16. Toronto Blue Jays: Kevin Ahrens, SS-3B, Memorial HS (TX) - $1.44 million.
17. Texas Rangers: Blake Beavan, RHP, Irving HS (TX) - $1.4975 million.
18. St. Louis Cardinals: Peter Kozma, SS, Owasso High School (OK) - $1.395 million.
19. Philadelphia Phillies: Joe Savery, LHP, Rice University - $1.3725 million.
20. Los Angeles Dodgers: Chris Withrow, RHP, Midland Christian High School (TX) - $1.35 million.
21. Toronto Blue Jays: J.P. Arencibia, C, University of Tennessee - $1.3275 million.
22. San Francisco Giants: Tim Alderson, RHP, Horizon High School (AZ) - $1.29 million.
23. San Diego Padres: Nick Schmidt, LHP, University of Arkansas - $1.26 million.
24. Texas Rangers: Michael Main, RHP/OF, DeLand HS (FL) - $1.2375 million.
25. Chicago White Sox: Aaron Poreda, LHP, University of San Francisco - $1.2 million.
26. Oakland Athletics: James Simmons, RHP, UC Riverside - $1.1925 million.
27. Detroit Tigers: Rich Porcello, RHP, Seton Hall Prep (NJ) - $3.58 million signing bonus as part of a $7.285 million four-year contract. Porcello will receive MLB salaries of $95,000 (prorated from $380,000) in 2007, $1.1M in 2008, $1.2M in 2009, and $1.025M in 2010. The Tigers have club options for $1.536M in 2011 and $1.344M in 2012.
28. Minnesota Twins: Ben Revere, OF, Lexington Catholic HS (KY) - $750,000.
29. San Francisco Giants: Wendell Fairley, OF, George County-Lucedale High School (MS) - $1 million.
30. New York Yankees: Andrew Brackman, RHP, North Carolina State - $3.35 million signing bonus (payable over six years) as part of a $4.55 million guaranteed major league contract that reportedly could be worth $13 million over seven years.
Brackman's contract is a total head scratcher, particularly in view of the fact that he is expected to have elbow ligament replacement surgery within the next few weeks. When healthy, the 6-foot-10 junior has been known to touch the upper-90s and as high as 100 on the radar guns. However, he has never thrown more than 78 innings in any season and his velocity dropped into the 80s last spring. The two-sport star is a high risk/high reward prospect.
Other notable signings:
New York Yankees: Brad Suttle, 3B, University of Texas - $1.3 million bonus (a record for the 4th round).
Baltimore Orioles: Jake Arrieta, RHP, TCU - $1.1 million bonus (a record for the 5th round).
Washington Nationals: Jack McGeary, LHP, Roxbury Latin HS (MA) - $1.8 million bonus (a record for the 6th round). According to Baseball America, "Washington will allow him to attend Stanford as a full-time student and play baseball in the summers until he graduates. The Nats are also picking up the cost of his education, with $200,000 via the college scholarship plan."
Detroit Tigers: Cale Iorg, 3B, Karns HS (TN) - $1.4975 million (6th round).
New York Yankees: Carmen Angelini, SS, Barbe HS (LA) - $1 million bonus (10th round).
Second rounders RHP Joshua Fields (Braves) and 1B Hunter Morris (Red Sox); third rounders RHP Brandon Workman (Phillies), 3B Derek Dietrich (Astros), RHP Tommy Toledo (Padres), and RHP Matt Harvey (Angels); fourth rounders 3B/OF Blake Stouffer (Reds), OF Garrett Nash (Rangers), RHP Brett Eibner (Astros), and OF Kyle Russell (Cardinals); and fifth rounders LHP John Gast (Rangers), RHP Kyle Blair (Dodgers), and RHP Nate Striz (Twins) did not sign. Fields and Harvey were represented by the Scott Boras Corporation. As a "reward" for failing to sign Fields and Morris, Atlanta and Boston will receive like compensation picks in the second round in the 2008 draft. Philadelphia, Houston, San Diego, and the Los Angeles Angels "earned" supplemental picks after the third round next year for not coming to terms with their third round selections this year.
Dietrich and Eibner were Houston's top two picks and apparently were looking for first and second round money which, if so, makes no sense. It is now safe to say that Houston had the worst draft of any organization with only three signees in the top eight rounds. Already ranked 22nd in terms of talent by Baseball America in the 2007 Prospect Handbook, the Astros may slip to the bottom when the new list is unveiled this winter.
Morris will attend Auburn, Workman is off to the University of Texas, Toledo is slated to become a member of the Florida Gators baseball program, Harvey and Striz head to the University of North Carolina, Nash will join the two-time defending NCAA champs at Oregon State, Gast is set to become a Florida State Seminole, and Blair is expected to enroll at the University of San Diego.
Fields will return to the University of Georgia today for his senior year. The hard-throwing closer was thought to be asking for a signing bonus well in excess of his slot money. All may not be lost, however, as Fields could pull a Casey Weathers, the Vanderbilt closer who elected not to sign last year. Weathers dramatically improved his draft status as a senior when he was selected by the Colorado Rockies with the eighth pick, earning a bonus of $1.8 million.
Much to the delight of Aggie fans, Stouffer will go back to College Station and complete his four-year career at Texas A&M.
Russell, a draft-eligible sophomore, will return to Texas for his junior season. He will re-enter the draft next June. The 2007 NCAA HR leader spent the summer in the California Collegiate League and hit .247 with four home runs while whiffing 34 times in 97 at-bats. He has had trouble hitting with a wood bat at every stop along the way.
For complete coverage, be sure to visit Baseball America's Draft Blog and Signing Bonus Chart (subscription required). You can learn more about each of the above first rounders via pre-draft coverage at Baseball America and Baseball Analysts.
| Change-Up | August 15, 2007 |
Consumer Sentiment
We find ourselves smack in the middle of the dog days of August right now. The pull-your-hair-out, hang-on-every-pitch intensity of the final two weeks of a close pennant race is still a month's off, and it seems like with football starting up, Tiger winning another major and other news stories coming from elsewhere in the sports world, baseball is just dragging a bit.
It shouldn't be. There are seven teams with a legitimate crack at the postseason in the American League, and another ten in the Senior Circuit. Just as the games counted back in early April, and just as they sure as hell will count in late September, some critical contests are being played right now. A trip around the blogosphere should serve to stave off late summer baseball fatigue and reignite the passion we all have for the game.
Things got interesting quickly in the American League East. Once 14.5 games out in front of the New York Yankees, the Boston Red Sox found themselves just four up yesterday. For just the second time all season long, the Red Sox pulled out a win when trailing after eight innings. Mike Lowell hit the game-tying home run with one out in the ninth and then with two outs, Jason Varitek doubled and Coco Crisp played Varitek on a single to right field to give Boston a 2-1 win. Randy Booth at Over the Monster is relieved to have an exciting one fall Boston's way for the first time in what has felt like a long while. Red from Surviving Grady agrees with the sentiment. He just expresses himself a bit, um, differently.
It's been far, far too long since we've had a dramatic, drop-yer-beers-and-grab-yer-balls finish like that.Jimmy from Dewey's House reminds us of the potential impact Clay Buchholz could have on matters should the Sox call him up like they are rumored to be considering.
At The Replacement Level Yankee Weblog, they take a pretty sober approach toward things. The Yankees are an excellent team, but even they will acknowledge they have been playing a bit over their heads. SG documented the believers and the non-believers, and noted chronologically the progress New York had made in a post that went up on Sunday. They also took time to remember Scooter.
Alex Belth is no stranger to these parts, and he and his co-writer Cliff Corcoran always keep close tabs on the Bombers at Bronx Banter. Cliff offered up his own Rizzuto memorial, and Alex, as only Alex can, offered up a post on Sunday with a title that captured the essence of a good run in baseball as well as any other statement I've seen. It was called, "When You're Hot, You Win."
After New York was trounced 12-0 last night by Baltimore, Boston gained a game and their lead now stands at 5. Though well back of a playoff spot, this post from Orioles Hangout will give you a decent sense for the vibes being felt in and around The Charm City. They took two of three from Boston in dramatic fashion over the weekend and then went into the Bronx and laid the 12-0 drubbing on the Yanks.
Toronto is doing their typical thing, hovering around .500, playing decent ball but not really threatening anybody. Not giving up hope just yet, Mike Green of Batters Box took a look at some past late-season comebacks. D-Rays Bay, God bless their souls, hangs in their with their team through thick and thin and their latest entry is an interesting look at Jonny Gomes. I imagine they might be refreshing their browsers a couple of times today for a David Price update.
In the Central, the Tribe and Tigers are locked in a fantastic race. The division has become much more crucial now that the Yankees are in the Wildcard fold. Neither team has played well of late but hey, they all count. There is plenty of time for both teams to get things squared away. Bill Ferris of Detroit Tigers Weblog is not letting his team's recent play dampen his enthusiasm for the critical stretch of games the Tigers have coming up.
Am I crazy for being geeked about this stretch of games? Given the way the Tigers have played lately I probably am, but I guess I’m anxious to see what the team is made of. I’m not going to take the position that the season will be decided over the next 2 weeks, that’s just silly. Unless the team is 4-9 or worse, or 9-4 or better, their status probably won’t really change. Still, the chance to see them take on the teams they are competing with for playoff spots should be exciting.
Brian of Tigerblog recaps last night's 6-2 win over the Tribe to take a one game lead in the division. James Pete recaps the game from the Cleveland perspective with an analysis of the contest. Let's just say he's not all that psyched with Joe Borowski.
Looking down-division in the Central, Aaron Gleeman offers a comprehensive take on how the Twins got to where they are now, and how they should approach the rest of the season. The Cheat from South Side Sox offered a stream-of-consciusness post on some Pale Hose related matters on Sunday. Rob and Rany checked in yesterday with a characteristically snarky and enjoyable offering on the state of the Royals.
Out west, the Angels hold a three game lead over the Mariners but as Rev Halofan points out, they have a helluva grind comin gup over the next two-plus weeks. Dave Cameron offered a nice look at a major reason for Seattle's solid play of late - Jeff Weaver's resurgence.
Here's a look from Athletic Nation on some of Oakland's unlikely sources of 2007 good play. In Arlington, you'll take what you can get at this point and signing two promising draft picks is just about as good as any other news Rangers fans can be receiving at this point.
The National League East has tightened up, with 3.5 games separating the New York Mets, Philadelphia Phillies and Atlanta Braves. Pedro Martinez could end up playing a major role in the 2007 baseball season, and Matthew Cerone of MetsBlog has a look at his latest rehab effort. A Citizen's Blog details Tadahito Iguchi's contributions to Philly since he came over. How many of you were like me and counted Philadelphia out when Chase Utley went down? Will Schaffer of Chop-n-Change has Chipper Jones coming up huge again for Atlanta on a night when both New York and Philadelphia won. I am not sure if you have noticed, but the Washington Nationals have been decent of late. Chris Needham provides a comprehensive take.
Nobody wants to win the Central. The Cubs are 3-7 in their last ten and Milwaukee continues to play mediocre ball. Jeff at Brew Crew Ball thinks it's time to pounce on a soft week in the schedule (of course the Cubs also get CIN and STL at home). Al at Bleed Cubbie Blue had a nice vent on Sunday addressing Chicago's crummy recent play.
Will Leitch has a great take on the phenomenon that is Rick Ankiel and St. Louis Cardinals fans. Charlie at Bucs Dugout laments Pittsburgh's lacking organizational depth. JD from Red Reporter pointed me to the SI article recapping Cincinnati's 1990 sweep of the Oakland Athletics. Rare in sports that a contest is at once a major upset and also just a total drubbing.
Stay with the Snake Pit in order to keep tabs on the team with the National League's best record. Geoff Young from Ducksnorts reminds Padres fans not to panic while Dan Lucero has things looking up in Denver. Jon Weisman offers up his own most embarassing moment in light of last night's Mark Sweeney gaffe, though I am not sure the new Dodger will take consolation - not with the Dodgers free-falling in the standings as they are. As you can imagine if you have read his past work, John Perricone has some opinions to share regarding Barry Bonds.
===============
So there you have it, a quick tour around the baseball blogosphere. Please post some other sites or good pieces from the web that you think capture fan sentiment in the comments section. We would love to check them out.
| Baseball Beat | August 13, 2007 |
Mark McGwire and Me
Let me set the stage. The date: October 1998. The New York Yankees had swept the San Diego Padres in the World Series. Although the Bronx Bombers had won 114 games during the regular season and went 11-2 during the post-season, the biggest story of the year was the home run race between Mark McGwire and Sammy Sosa.
McGwire and Sosa inspired us all during the summer months when they engaged in the greatest home run battle in 37 years. The sluggers were the first to hit 60 since Roger Maris outlasted Mickey Mantle and slammed 61 homers in '61 to break Babe Ruth's 34-year-old.
Who can forget Big Mac lifting his son Matthew high in the air at home plate just after he tied Maris' record or when he lifted him even higher the next night after he surpassed the back-to-back MVP winner? Who can't recall Sosa, who was playing right field at the time, running in and leaping into the arms of McGwire to congratulate his pal? Or how about when McGwire climbed into the seats near the first base dugout and exchanged hugs with the Maris family? All of these images were spine-tingling moments for those of us who were there in person or at home watching live on TV.
Living in Southern California, I wasn't one of the million people who now claim they were at Busch Stadium for one or more of these record-setting home runs. However, being a resident of Long Beach soon had its rewards.
 Shortly after the season ended, McGwire, who back then made Huntington Beach his home in the fall and winter, was in town to shoot a commercial for a toy bat that Hasbro was going to market in early 1999. My sister-in-law Teri, the field manager at Blair Field, learned that McGwire's stand-in hadn't shown up and volunteered my services when the producer asked if anyone knew a big guy who could pinch hit (so to speak). She called and asked if I was available, and I told her "yes" because I didn't have any appointments that day.
Teri put the producer on the telephone, and the lady explained what was taking place and what was needed. After getting my height and weight, she asked what my waist size was, and I told her, "42." The producer shot back, "Well, McGwire is a 38!" I thought to myself (but didn't quite have the audacity to say), "That's why he's making nine million dollars per year and why I'm managing money instead of playing."
Not knowing who else to turn to at the last minute, the producer asked me if I would be willing to work for scale. I asked her what that was, and she informed me that it was $200. That was a little more than I wanted to pay (just kidding), but I took the job anyway. After we agreed on the terms, she wanted to know how long it would take me to get to the ballpark. I said, "Oh, I could be there in about 15 to 20 minutes." She told me to hurry on over and to meet her in the big white motor home that was serving as the dressing room in the parking lot.
The producer introduced me to the person in charge of costumes and I was quickly handed a full uniform identical to what McGwire was wearing that day. It was meant to look like a Cardinals outfit but there were no team names, logos, or numbers on the jersey. However, the red hat, undershirt, belt, and high-top Nike shoes fit the bill.
I strolled out onto the field and quickly discovered that McGwire and I were the only ones in uniform. I was conspicuous in both size and dress. I found the director — or did he find me? — and we made our way over to where McGwire was standing. The director introduced me. After we shook hands, I was escorted to home plate where the film crew was anxiously awaiting me. Well, not me per se. But whoever was going to stand in for McGwire that day. It could have been any other tall, husky 43-year-old businessman from the area. Hey, someone had to do the job. Thanks to my sister-in-law, that someone just happened to be me that day.
Although I had played many games at Blair Field during my youth, I hadn't stepped foot on that field in a baseball uniform in more than 25 years. In no time, I actually found my feet in the batter's box holding the Vortex Power Bat in one hand while waiting for McGwire to make his way across the field and into the equivalent of a director's chair. It was my job to impersonate him while the production staff set up the lighting and the proper distance and angles of the cameras.
When everything was good to go, I simply handed the bat to McGwire and let him do his thing. I stood by and watched the man who had slugged 70 home runs that season rip some balls to the outfield grass but not one came close to leaving the yard. You see, Blair Field isn't known to yield many homers with aluminum bats, much less plastic bats and balls.
The filming went from mid-morning to early afternoon. We broke for lunch afterwards and the photo of me towering over McGwire was taken at that time. Mark, a fellow USC Trojan, was cooperative and reasonably friendly that day.
The Vortex Power Bat and Ball were invented by Mark Rappaport, who sold the idea to OddzOn, Inc., a division of Hasbro. The toy company hired McGwire and later Mike Piazza to endorse these products. The bat featured a pressurized, high-impact, oversized barrel with a large sweet spot that was similar in design to a 2-liter soft drink bottle. The sound and results of the bat striking the ball were enough to instill confidence in any youngster's swing.
I remember being surprised that the bat and ball were not available for the holiday season. The commercials of McGwire stroking a pitched ball from that day at Blair Field didn't hit the TV screens until the first of the year. I was nowhere to be found in those ads but was proud to have played a small part in their production.
My only regret is that there weren't any scouts or talent agents in the stands. A budding major league or movie career was put on hold. Nine years later, I'm still waiting with my bat on my shoulder. The good news is that I didn't quit my day job.
| Command Post | August 10, 2007 |
Makin' a Filter
Jamie Moyer and Josh Beckett both throw fastballs, but while Moyer's tops out around 85 MPH, Beckett's travels 10 MPH faster. Looking at each pitcher separately, it's easy to classify their fastball, but the only thing the two fastballs have in common with each other is that they are the fastest pitch each pitcher throws. In order to expand my examination of when pitchers throw certain pitches, I want to classify every pitch that has been tracked by the pitch f/x system as either a fastball or off-speed pitch. In order to effectively differentiate between the two groups of pitches, each pitcher has tobe compared to himself and not an outside standard that would classify Moyer's 85 MPH fastball as an off-speed pitch.
In each appearance by a pitcher, I found the average speed of his pitches as they crossed the plate, and then divided the velocity of each pitch in that appearance by the average, which gave me a value for each pitch, standardized for that day. I then classified each pitch as a fastball or off-speed, using only that standard value. Obviously this isn't a perfect method for classifying pitches, and there is some level of inaccuracy with the labels, but it's simple, relatively accurate for fastballs vs. off-speed pitches, and I think it's a good start in automating the classification process.
Testing the method on individual pitchers, the results generally agreed with a visual inspection of their pitch chart, but the algorithm I used to classify pitches had problems with certain types of off-speed pitches. To fix the problems I used a cut-off point of the standard value to separate fastballs from everything else. Generally speaking, a pitch that was faster than the average speed was usually a fastball and anything slower was off-speed. This was the case for every type of pitcher I examined, which will be important.
Some pitches are going to be improperly classified with this method as well, but the problem is smaller compared to using the algorithm and because of the similarity between different types of pitchers, this method worked better than the algorithm when classifying pitches for multiple pitchers. Here's a pitch chart from Roy Halladay to give a sense of where the distinction is being made between pitches.
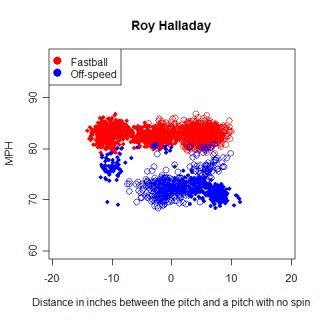
One thing to keep in mind, and it's shown clearly in Halladay's graph, is that I didn't make any attempt to separate 2-seam and 4-seam fastballs for pitchers that throw both pitches, which will slightly skew the results for those pitchers.
Once I was automatically classifying individual pitchers, I went back and classified every pitch in my database as either a fastball or an off-speed pitch. Before I looked at when pitches were thrown though, I needed to establish some baselines. Of all the pitches in my database, 62% have been fastballs. Some basic splits are in the table below.
Split     Fastball%   Total Pitches
Overall   62%         122072
RHP/RHH   63%         46849
RHP/LHH   61%         43197
LHP/RHH   61%         23415
LHP/LHH   63%         8611
It seems that pitchers throw more fastballs to same-side hitters, but overall 62% looks pretty good as an average. Here's a list of the 10 pitchers who throw the highest and lowest percentage of fastballs (min 100 pitches).
Name               FB%     Total Pitches
Scot Shields       75%     531
Todd Jones         75%     116
Darren Oliver      75%     357
Joakim Soria       75%     206
Alan Embree        73%     380
R. Betancourt      73%     173
Jay Marshall       73%     319
Mike Timlin        73%     146
Aaron Sele         72%     127
Macay McBride      72%     263
------------------------------
Cole Hamels        48%     341
Ian Snell          47%     285
Akinori Otsuka     46%     293
Tom Glavine        46%     324
Matt Wise          46%     121
C. Villanueva      45%     508
Royce Ring         44%     248
Kiko Calero        44%     314
Justin Speier      42%     363
Jamie Walker       37%     151
This list is pretty interesting and the full list it came from might be even more interesting. First of all, Jamie Walker throws a ridiculously small percentage of fastballs compared to the league average. 37% is more than 3 standard deviations from the mean, so he must have reasonably good off-speed pitches to rely on them so extensively. Comparing pitchers to each other gave me insight into some differences in pitch selection I was unaware of. I knew Hamels and Glavine relied heavily on pitches other than their fastballs, but I had no idea they threw their fastballs less than half the time. Similarly, I was surprised at how frequently the leaders threw their fastballs. Joel Zumaya missed the pitch limit cut-off, but he threw his fastball 84% of the time. Hitters essentially knew his fastball was coming, but there still wasn't much they could do with it. One other tidbit from this chart is regarding Beckett. He was subject to criticism last season that he was relying on his fastball too much. This season he has thrown it 65% of the time this season, which is above average, but not in the category of 'over-reliance'.
In a previous article, I examined the pitch selection of Jake Peavy and Dan Haren, based on the Leverage Index of the situation. I didn't have any baselines to compare their averages too, but now I do. Instead of using LI to separate situations, I took a suggestion from a comment by Tangotiger and created three groups of situations based on the run value of a strikeout vs. regular out. Using the win value of a strikeout vs. regular out would probably be a better distinction, but that's for another article. A strikeout is much more valuable than a regular out primarily when there are runners on third base and less than two outs, while the value of a regular out is higher than a strikeout if there is a runner on first or first and second, with one or no outs. The chart below shows the fastball percentages for each situation, split by the pitcher/batter matchup.
Split       High K     Low K      Everything Else
Overall     60%        64%        62%
RHP/RHH     62%        65%        63%
RHP/LHH     60%        64%        61%
LHP/RHH     58%        63%        61%
LHP/LHH     63%        64%        62%
In every case, the percentage of fastballs thrown is lower when the pitcher needs a strikeout, which is what we expected going in (and saw in the case of Peavy and Haren). The differences between situations aren't severe, but in the 'overall' case especially, the sample size is large enough that the differences are real.
Below is a table showing the pitchers who have thrown the highest and lowest percentage of fastballs when they need a strikeout (min 20 pitches). It is a little misleading to just compare the percentage of fastballs a pitcher throws when he needs a strikeout to the league average and say anything less than the league average (more breaking balls) is good while anything higher is bad. A pitcher should throw whatever pitch he has that can get the most swings-and-misses in a high K situation, and for some pitchers, their best swing-and-miss pitch happens to be their fastball. Pitchers rely on their fastballs generally, but certain pitchers should and do use it even more in situations where they need a strikeout.
Name             FB%      Total Pitches
Carlos Silva     88%      25
Matt Belisle     87%      23
Greg Maddux      84%      43
Chris Sampson    81%      21
Vicente Padilla  80%      111
Adam Eaton       79%      29
Manny Delcarmen  79%      33
Odalis Perez     77%      31
Scot Shields     77%      31
Jay Marshall     76%      34
-----------------------------------
Rudy Seanez      39%      28
Javier Lopez     39%      41
Vinnie Chulk     38%      21
Matt Cain        38%      29
Will Ohman       36%      22
C. Villanueva    36%      22
Mike MacDougal   35%      20
Kelvim Escobar   34%      62
Scott Baker      32%      25
Mike Thompson    32%      22
Manny Delcarmen is one of the pitchers who relies more on his fastball when he needs a strikeout and we can see whether he should be or not. Delcarmen gets a swinging strike 13% of the time he throws his fastball (in any situation), while he gets a swinging strike only 10% of the time with his off-speed pitches. If those ratios are real, and not the product of a small sample size so far, Delcarmen appears to be justified relying on his fastball more when he needs a strikeout. The downside to this is if hitters know a fastball is coming nearly 80% of the time with a runner on third and less than two outs, it would seem to lose some of it's swing-and-miss capabilities...unless it is such a good fastball that hitters can't hit it even when they know it's coming, in which case a pitcher should use it more heavily when he needs a strikeout. There should be some point where that circular loop ends and an equilibrium is reached between the amount a pitch is thrown and it's ability to cause swings-and-misses.
I've covered some of the flaws in the methodology I used to separate pitches, but overall I was quite happy with the results. When I compared the overall fastball percentages for individual pitchers to Inside Edge on ESPN and my own individual pitcher graphs, the percentages were close in all three cases. The next step in this type of analysis is to separate out the different off-speed pitches that I lumped together, which adds another layer of information about pitchers and pitch selection. A changeup and curveball are two very different pitches and could be used for very different purposes by a pitcher.
I'm going to close with one last table, this one showing the fastball percentage on extreme pitcher's counts (0&2 and 1&2) and extreme hitter's counts (3&0, 3&1).
Count             Fastball%     Total Pitches
3&0 and 3&1       83%           4340
0&2 and 1&2       54%           18091
I should have separated the 3 ball counts by the cost of a walk, but it seems amazing that pitchers are so afraid of walking a hitter in those counts that they become Zumaya-esque in terms of pitch selection, but without the amazing fastball to back it up. In a count that already favors the hitter, hitters see almost all fastballs, which is one big reason why hitters have a .630 SLG in 3&0 and 3&1 counts this year.
| Designated Hitter | August 08, 2007 |
Roid Monster (Or, How I Learned to Stop Worrying and Tolerate 756)
Let’s say you’re a PR director for a major-league baseball team. And you want to design your dream player, the guy who’ll look just perfect on the cover of a media guide or during a photo op at the hospital ward.
You want him to be a fun player – someone who plays with glee. You’d also want him to be a battler, maybe the type of guy who had to overcome a rough upbringing, or some physical deficit. He’d be selfless – kind to coaches and teammates, never showboating or yapping off. He’d be gritty, clutch, someone who always rises to the occasion and leaves it all on the field. And lastly, you’d want to make him… well, not white necessarily – that’s not essential these days – but someone who’s not about race, someone who makes his race a non-issue. What you’d end up with is someone who plays with a mix of joy and humility. You’d end up with Kirby Puckett, or Sean Casey, David Ortiz, Stan Musial.
What you would not want – the last thing in the world you’d want – is Barry Bonds. In fact, you could take just about every positive PR attribute I mentioned above, turn it on its head, and you’d have Barry Bonds. He’s not a team player. He comes from a privileged baseball background. He’s self-important and swaggering. He’s irritable. He badmouths his superiors. He plays the race card. He even, for a long time anyway, had a rep as a choke artist (think 1991 NLCS and his turkey-wing throw to try to get Sid Bream). And as for giving it 110% in the Gas House style of, say, Craig Biggio – well, let’s just say Bonds has thrown a lot of spotless uniforms onto the postgame laundry pile.
That Bonds is MLB Enemy #1 is not news. Hell, Rick Reilly owes at least half his weekly shtick to Bonds bashing, and every hack sportswriter (this includes you, Curt Schilling) has had a field day portraying Bonds, as Bill Maher once said, “like he’s the BTK Killer.”
Here’s the thing, though. I basically agree with those sportswriters. Sure, their methods are cheap, their thinking knee-jerk, but, like them, I absolutely loathe Barry Bonds. I hate how he adores his home runs and sometimes turns doubles off-the-wall into long singles. I hate how he comes across like every jock asshole you knew in high school. I hate how he paraded his son Nikolai before the media during spring training, 2005 – the kid was barely a teenager, clearly dying inside, but Bonds insisted on using him as a prop for his persecution complex, instructing photographers to take pictures of him “so you guys can see the pain you’re causing my family.”
But more than anything else about Bonds, I hate his voice. You don’t expect it from a guy of his stature. You expect something commanding, stentorian. Instead it comes out gentle and sedated. Or, more accurately, it comes out synthetic, as if he shared a soul with HAL 9000. It’s so out of character with everything else you know about the man that it creeps me out. It’s always reminding us, as Jeff Pearlman put it, that Bonds is “completely, undeniably 100% full of shit… Nothing he says holds any meaning.”
So yes, I hate Bonds. But truth be told, I don’t hate that he’s the new home run king. And I think it’s a complete waste of time to get exercised about 756. How come? Well, I can think of five reasons:
(1) No one has any idea how much Bonds has been helped by steroids.
Well, let me rephrase that: some people have some idea how much Bonds has been helped by steroids. But unfortunately they don’t form a consensus, and each of them would admit that he’s more or less playing Pin the Tail on the Donkey. Nate Silver estimated that steroids give position players 10 extra points of AVG, OBP, and SLG. J.C. Bradbury found that the benefits are negligible. Others – notably Patrick Hruby, who reckoned that about a hundred of Bonds’ homers can be chalked up to steroid use – fall more in line with popular thinking.
Even with these studies, we’re still left with a quagmire. How many other players were using steroids during Bonds’ home run spree? How much of an advantage was he getting? More to the point, how many pitchers were juiced up over the last ten years? (Oddly enough, Bonds hit #755 off of Clay Hensley, who, unlike Bonds, has actually failed a drug test.)
And did steroids make Bonds more durable or less durable as he got older? Sure, the evidence shows that Bonds hit more homers after age 35 than anyone in history, but evidence also shows that steroid use can lead to soft-tissue deterioration, tendon damage (particularly triceps tendon injuries, the kind that caused Bonds to miss 7 weeks in 1999), as well as the type of back and knee problems that have plagued Bonds the last few years. When you look at the shortened careers of known or alleged steroid users like Mark McGwire, Sammy Sosa, and Jason Giambi, you wonder if steroids gave Bonds a boost when it came to breaking short-term records, like the single-season home run record, but had mixed results when it came to toppling career records, like Aaron’s 755.
Of course, we’ll never know. And that’s precisely the point. Until we have good, solid data – as opposed to armchair theorizing – regarding the effects of steroid use on ballplayers, then I think it’s best to extend a bit of graciousness (the kind, incidentally, that often seems missing from Bonds himself) and give him the benefit of the doubt. Because the bottom line remains that Bonds was a great ballplayer – the best of our generation – before he supposedly began taking “the clear,” and he’s been a great ballplayer, one of the very best in the league, even after he presumably stopped using steroids. That’s no small feat for a man well into his 40’s.
And if nothing else, we can say that Bonds is truly the greatest steroids hitter in major league history. I know, I know, that’s a stupid statement, satisfying to no one… but then again, as Chuck Klosterman pointed out rather amusingly, the Beatles took performance-enhancing drugs (how else do you think they came up with side two of “Revolver”?), and no one holds it against them.
(2) Bonds is a product of his era, just as Aaron and Ruth were products of theirs.
A few weeks ago, baseball’s éminence grise, Bill James, was asked if players using performance-enhancing drugs should be treated differently by history. He replied:
I look at it this way. There's a rule in basketball against traveling but the NBA has pretty much stopped enforcing it. Well, they still call traveling but they will allow you to take about five steps without dribbling as you are running toward the basket. There was no "decision" not to enforce this rule; they just kind of lost track of it. They started not calling one step and progressed to not calling two steps, not calling three steps, and eventually they just kind of lost track of the rule. Should the players who took advantage of this failure to enforce the rule be banned from the NBA Hall of Fame? After all, aren't they cheating? They're not obeying the rules. Julius Erving, out. The Hall of Fame doesn't need cheaters like you. Kobe, Michael, get out. If you don't play by the rules the way Elgin Baylor did, you're not deserving.Or it is, rather, the responsibility of the LEAGUE to enforce the rule? It seems to me that it might be the responsibility of the league to enforce the rule rather than the responsibility of the media to punish those who didn't obey the rule that wasn't being enforced. I won't name any players, but there are a whole bunch of superstars who are now or are going to be involved in the PED accusations. We CAN'T start picking and choosing who we honor on that basis. It's hypocritical, and it's impractical. And it diminishes the game.
I think James’ analogy breaks down at some point. After all, lax traveling calls in the NBA are presumably applied equally to players of each era, whereas steroid-users gain an advantage over not just players from other eras, but against players in their own era, i.e., the ones not using PED’s. What’s more, in basketball, traveling is out in the open, so to speak. We can watch TV, judge who travels, who doesn’t, and make our historical adjustments accordingly. That’s not the case for baseball players who are hiding their drug use.
Nonetheless, I think James’ general point holds: that is, that Bonds is a product of a systemic set of values, a culture. It’s the same point Jesse Jackson made recently, when he told the Chicago Sun-Times, "My question is, if 400 guys tested positive, do you put asterisks by all their names? Do you put asterisks by [spitballer] Gaylord Perry's name? Do you put asterisks by guys who had the ultimate enhancement [by] denying others a chance to compete?" (Hat tip: Studes, for the link)
I forwarded these comments to a friend last week, and he emailed me back: “if pre-1947 ball was not ‘all it could be’ because of the color line (a theory I think everyone with a brain would agree with), and post-1980s ball is ‘tainted’ because some used steroids, does that mean we've only had 40-45 years of undisputed competition?” I wrote back that, in fact, every era has been tainted in some way, with statistics constantly subject to some distortion or other. One era might not allow people of color, another might be tainted by steroids or amphetamines, another by the height of the mound, another by the system of selecting and promoting players from foreign countries, another by primitive approaches to heath and recovery, another by using too much plate armor, another by weird strategies and shibboleths, like the one that says it’s unmanly to swing from the heels or take a walk now and again. Some of these are probably a stretch, but I really think people are naïve if they don’t think that every record carries with it some kind of implied asterisk.
At first blush this sounds like the biggest bummer of all time. Does this mean that we can’t trust any of our numbers? Does it mean that the subject of Bonds vs. Aaron will never be settled? This goes against the very grain of sports, the thing that most distinguishes it from our everyday lives – i.e., the fact that sports has clear-cut winners and losers. The closest analogy I can think of for Bonds’ home run chase is the 2003-2004 college football season, when USC and LSU split the national championship. Actually, a better analogy might be the 2000 presidential race, when I thought Bush won, you thought it was Gore, and all of us were both right and wrong. In this way 756 is a sign of our times, in which there are no longer any truths, only perspectives, opinions, fragments, and the kind of anti-foundational stuff that gave night tremors to Nietzsche, Foucault, et al.
And yet… and yet… Isn’t that, at least in part, what makes baseball so entertaining? Yes, baseball’s numbers are tainted – but imagine if the opposite were true. Imagine if every number were set in stone, static and inarguable. What a drag that would be! How much more fun to share a beer with a buddy and argue, say, how many home runs Ted Williams would’ve hit had he not been drafted. Or what would have happened to Jose Cruz if he hadn’t played in the Astrodome. Or if Johnny Beazley had been born after the advent of Tommy John surgery. Yes, we want baseball to be obvious and dependable, but it seems we are at least equally charmed by the game’s elusiveness. I find that rather encouraging.
(3) Bonds’ home run crown isn’t as bad for Hank Aaron as you might think.
I’m sure by now you’ve all seen footage of Bud Selig reacting to Bonds’ record-tying 755th career home run. He basically made an ass of himself, I thought – standing up only after he was prodded, putting his hands in his pockets, showing all the enthusiasm of an 8-year-old boy forced to sit through Sunday service. As Joe Sheehan pointed out, Selig’s enmity for Bonds stems from his reverence for the man he’s replacing atop the leaderboard, Hank Aaron. (Sheehan doesn’t offer any evidence for this connection, but it certainly rings true.)
Selig isn’t alone in sizing up Bonds vs. Aaron. To root for one, it seems, is to root against the other, just as folks back in 1974 tended to take sides for either Ruth or Aaron, but not both. If this is the case today, then surely Aaron is winning. In fact, the last few weeks have seen an outpouring of love letters to The Hammer, most notably a Sports Illustrated magazine cover, with the inside story declaring him “The People’s King.” (Incidentally, that’s as many SI covers as Bonds landed for the entire four-year period 2000-2003. I know Bonds notoriously froze out the magazine after they published a 1993 story about him entitled, “I’m Barry Bonds, and You’re Not,” but geez… Bonds was in the midst of the greatest hitting binge in major-league history and that’s all he got? One cover?)
Anyway, the point is that Aaron has been enjoying a renaissance lately, one that wouldn’t be possible without his purported nemesis, Mr. Bonds. The irony is that Hank Aaron was not especially beloved in his day, and I’m not just talking about the racist yokels who mailed him death threats in 1974 (the ones who caused Aaron’s mother to mistake the celebratory fireworks after her son’s 715th home run for sniper shots, of all things). I’m talking about good, respectable baseball folks who had nothing in particular against the Hammer, but never embraced him the way they embraced, say, Roy Campanella, or Willie Mays. Next to them Aaron seemed charmless and remote. And it was all too easy for people to mistake Aaron’s quiet reserve for something more sinister: laziness – surely a byproduct of the casual racial stereotypes of that time. (His first manager, Charlie Grimm, once asked about Aaron, “why doesn’t he sleep on his own time like everybody else?”)
But the years have been good to Aaron. Unlike DiMaggio, a beloved star who became a depressing figure in his final days (when we heard stories about his friendlessness, or the way he disowned his only son, leaving him to live in a junkyard trailer in northern California), and unlike Mark McGwire, who until recently was treated like a national savior, Aaron has only grown more likable with time. (Ironically enough, if Aaron played today, he’d probably be dogged by steroid rumors – look what a twig he was when he first came into the bigs, then look at the beefy guy who experienced a career high in home runs at age 37.)
The great sportswriter Jim Murray once wrote about Aaron, “He underplays like a British actor. Willie [Mays] attacks the game. Aaron just gets it to cooperate with him.” This whole flap about Bonds and steroids might be yet another way in which Hank just got the game to come to him.
(4) Bonds’ record will be broken anyway.
I read somewhere recently that DiMaggio’s 56-game hitting streak is so improbable, so statistically preposterous, that you’d have to replay the entire history of baseball something like eight times before it’s likely to happen again. Like Cy Young's 511 wins or Nap Lajoie's .426 single-season average, we probably won’t live long enough to see anyone match it.
Barry Bonds’ mark for career homers is not one of those records. Nate Silver wrote an article recently in which he gave Alex Rodriguez a 28% chance of hitting 800 jacks, and a 10% chance of hitting 900. Of course, that still means A-Rod will most likely fall short of the record. But he’s just one guy. What if you matched Bonds against the field?
Suddenly the record looks much iffier. If you use Bill James’ Favorite Toy (which, admittedly, is much less sophisticated than the PECOTA system Silver used), you’d find that Bonds is projected to hit 787 lifetimes bombs when all is said and done. Sounds reasonable. Here are his closest competitors, the active players with a non-zero chance of hitting 788:
A-Rod           32.3%
Pujols          21.3
Andruw Jones    14.7
Adam Dunn        8.5
Ryan Howard      1.4
Combine their chances and you get a 41% chance that none of them will hit 788, ergo, a 59% chance that at least one of them will.
And that’s just the names above. For as long as baseball is still around, players will have a crack at the record. Maybe one of those guys above will break it. Or maybe it’s some newbie, like Justin Upton. Or Justin Upton's child. Or grandchild. After all, Bonds was only nine years old when Aaron surpassed Ruth.
The bottom line: until someone enters Sadaharu Oh territory – 868 lifetime home runs – then I think the home run mark will remain very breakable.
(5) Admit it – you love that Bonds broke the record.
Sally Jenkins, who writes for the Washington Post, suggested recently that, when the moment came for Bonds to break the record, he should have laid down his bat and walked away from baseball, preserving the game’s dignity and turning himself into the greatest folk hero of all time.
Whatever. As I said earlier, I hate Bonds, but I like hating Bonds. He’s the perfect villain – our Voldemort, our Dr. Evil, our Galactus, Devourer of Worlds. I think it’s perfectly appropriate that he’s on top.
One thing that’s always irked me (and I’ve harped on this before, both here and here) is the idea that baseball should be a beacon of moral values, or that ballplayers should be “role models.” Honestly, what kind of idiot looks to a guy who wears cleats and hits baseballs as an exemplar of virtue? I like ballplayers because they’re entertaining. The game offers a rich panoply of characters, both good (Jim Eisenreich, Larry Walker) and bad (A.J. Pierzynski, Carl Everett), and we’d all be a little poorer without them. The truth is, Bonds’ home run chase is one of baseball’s all-time great stories, breathtaking and absurd at the same time.
Because I’ve talked a lot about steroids, I’ll close with my favorite quote on the subject, from one of baseball’s most breathtaking and absurd characters, Rickey Henderson. A reporter once asked him if Ken Caminiti’s estimate that 50% of big-league players were taking steroids was accurate. His response? “Well, Rickey’s not one of them, so that’s 49% right there.”
So let’s tip our caps to Barry Bonds, the best of that 49% – and really, let’s be honest, the best of the other 51% too.
Brian Gunn is a screenwriter living in Los Angeles who formerly headed up the baseball website Redbird Nation.
| Around the Minors | August 07, 2007 |
Draft Deadline Looms Large Pt. 2
Major League Baseball teams have just over a week to get their remaining 2007 draft picks signed, or they will lose all rights to those players.
Two weeks ago I took a look at the five teams who had, in my humble opinion, the best drafts. Those teams included Texas, Toronto, Arizona, Cincinnati and Washington.
Last week I analyzed the remaining American League teams to see who remained unsigned with the impending Aug. 15 signing deadline. This week I am taking a look at the remaining National League teams.
In just over a week there should be a frenzy of signings, as players who have agreed to over-slot deals come to terms with their new organizations. Most of the players signed on or just before Aug. 15 will likely begin their careers in the fall instructional camps and make their official debuts on the field next April.
| Baseball Beat | August 06, 2007 |
A Home Run Weekend
What a weekend for historic home runs. What a weekend for baseball.
You would have to be sleeping under a rock on Mars not to know that Barry Bonds and Alex Rodriguez reached important home run milestones on Saturday. Bonds tied Hank Aaron's major league record with his 755th HR while Rodriguez hit the 500th of his career.
Bonds is now one home run shy of becoming Major League Baseball's all-time home run king. Remarkably, the 43-year-old slugger has now hit 72 homers after his 40th birthday, tied with Carlton Fisk for the most among players in their fifth decade. Maybe Pudge knew something when he picked that uniform number.
After a 10-day drought, Rodriguez connected on the first pitch thrown to him on Saturday. At 32 years and 8 days, ARod became the youngest player in MLB history to hit 500 home runs, edging Jimmie Foxx (32 years, 338 days). He reached the milestone in the third-fewest games (1,855) ever with only Mark McGwire (1,639) and Babe Ruth (1,740) doing so in fewer contests.
Rodriguez is one of three players to have hit more than 100 HR with three teams. Darrell Evans (142 SF, 141 DET, 131 ATL) and Reggie Jackson (269 KC/OAK, 155 NYY, 123 CAL) are the other two. Reggie also hit 27 for the Orioles in his lone season in Baltimore in 1976.
Not on par with Bonds and Rodriguez for significance but Blue Jays DH Frank Thomas went yard twice on Saturday and passed Eddie Murray for 20th place on the all-time HR list with 505. Adam Dunn, who may be on his way to 500, ripped his 30th HR and is an odds-on favorite to go yard 40 times for the fourth consecutive year. Ryan Howard, the quickest player in terms of games to reach 100 career homers, blasted his 30th and now is nipping at NL leader Prince Fielder's heels. While far from historic, Fielder slugged his 32nd HR off Philadelphia's Tom Gordon in the bottom of the eighth inning to give the Milwaukee Brewers a 6-5 come-from-behind win over the Phillies on Saturday.
Hideki Matsui hit his 100th HR as a member of the New York Yankees on Sunday, the first Japanese-born player to reach that mark in the history of MLB. When breaking for a commercial at the end of the inning, YES analyst Bobby Murcer reported that Matsui had hit his "100th of the year." If that were the case, Hideki should have received a lot more publicity than he did. Matsui slugged 332 in Japan and could wind up with more than 500 HR for his combined career by 2010.
It's difficult to discuss home runs this past weekend without mentioning Padres left fielder Scott Hairston, who hit three consecutive dingers over two games. On Friday night, he hit one in the bottom of the 9th to tie the game and another in the 12th to end the game. His third was accomplished the following day when he went deep leading off the bottom of the first inning.
With the addition of Rodriguez, the 500 HR Club now has 22 members.
T1   Hank Aaron                  755
T1   Barry Bonds                 755
3    Babe Ruth                   714
4    Willie Mays                 660
5    Sammy Sosa                  604
6    Ken Griffey Jr.             589
7    Frank Robinson              586
8    Mark McGwire                583
9    Harmon Killebrew            573
10   Rafael Palmeiro             569
11   Reggie Jackson              563
12   Mike Schmidt                548
13   Mickey Mantle               536
14   Jimmie Foxx                 534
T15  Willie McCovey              521
T15  Ted Williams                521
T17  Ernie Banks                 512
T17  Eddie Mathews               512
19   Mel Ott                     511
20   Frank Thomas                505
21   Eddie Murray                504
22   Alex Rodriguez              500
Jim Thome (490) and Manny Ramirez (488) have an outside chance of joining the 500 HR Club this season. Gary Sheffield (478) is a good bet to make it next year. The Top 1000 All-Time HR Leaders can be found at Baseball-Reference.com. You can also view single-season, year-by-year, active, and progressive leaders.
In addition to becoming the youngest to hit 500, ARod is arguably one of only four players who can claim that they were also the best player in the game at the time of achieving that milestone. Ruth slugged his 500th in 1929 when he hit .345/.430/.697 and led the AL in HR (46), SLG, OPS (1.127), and OPS+ (194). Willie Mays jacked his 500th in 1965 when he produced a .317/.398/.645 season and led the league in HR (52), TB (360), OBP, SLG, OPS (1.043), and OPS+ (185) while earning Gold Glove honors and winning his second MVP award. Bonds hit his 500th in 2001 when he posted a .328/.515/.863 line while breaking McGwire's single-season record and earning the fourth of seven MVP awards.
Meanwhile, Rodriguez is hitting .301/.408/.632 in 2007 while leading the AL in HR (36), TOB (200), TB (256), R (101), RBI (108), SLG, OPS (1.040), and OPS+ (176). He appears to be on the way to winning his third MVP in the past five seasons.
Is it a coincidence that Ruth, Mays, Bonds, and Rodriguez are perhaps the four best players in the history of baseball?
Aaron was one of the top players in the game when he hit his 500th in 1968. Hammerin' Hank achieved his milestone during "The Year of the Pitcher" so his rate stats (.287/.354/.498) aren't comparable to any of the others. Aaron finished 12th in the NL MVP voting that season and still had two more campaigns ahead of him when he ended up third in the MVP race. Hank may have been the most dangerous hitter in the league through 1971, but it would be a stretch to argue that he was the best player.
Although Ted Williams didn't crank No. 500 until the final season of his career, he lost about 157 HR by my estimation due to serving nearly five years in World War II and the Korean War. Had he hit 37 HR (the average of his 1942 and 1946 seasons) each year from 1943-45 and 30 (the average of his 1951 and 1954 seasons) in both 1952-53 (rather than a total of 14), Teddy Ballgame would have reached 500 in 1954. Like Aaron, he probably wasn't the best player in the game at that point but may have been the most productive hitter.
In addition to the home run feats, all of us at Baseball Analysts salute Tom Glavine, who won his 300th game against the Chicago Cubs on ESPN's Sunday Night Baseball. Unless Randy Johnson returns from back surgery at the age of 44 and wins 16 more games, Glavine just may be the last 300-game winner for at least a decade, if not ever.
Our hats go off to Bonds, Rodriguez, and Glavine, and all the other greats who have hit 500 home runs or won 300 games. Congratulations.
| Baseball Beat | August 03, 2007 |
Foto Friday #7: Obscure Angels
No Dean Chances, Nolan Ryans, Frank Tananas, or Chuck Finleys here. No Jim Fregosis, Bobby Griches, Tim Salmons, or Garret Andersons either. Heck, these players are not even as well known as Rudy May or Tom Murphy.
The first pair were not only Angels teammates but are forever linked as part of something else. Name the players and the link.
A couple of former Dodgers...
You gotta love this guy's name...
Despite the name on the bat, this player is not Ken Berry...
Leave your answers in the comments section below. Enjoy!
| Change-Up | August 01, 2007 |
WTF?
It's 12:21 pacific time on deadline day in Brian Sabean's office at AT&T Park. He has determined that, come hell or high water, he is dealing expensive starter Matt Morris. In all likelihood it will be to a contender looking to stash an experienced arm on its depth chart. And because Morris is guaranteed another $3 million this year, $9.5 million next and a $1 million buyout for the 2009 season, Sabean is resigned to the fact that he will have to eat some of this dough in order to ship Morris.
The phone rings
Sabean: Brian Sabean here.
Dave Littlefield: Hi Brian, how's it going. I would chat but we don't have much time left. What do I have to do to make Morris a Buc?
Sabean: (covers phone mouthpiece and yells to his colleagues) Guys! It's Littlefield. He wants Morris!
Dick Tidrow: You're shitting me.
Sabean: (gets back on phone) Dave, what would your initial offer be for Morris?
Littlefield: Rajai Davis and a player to be named. Straight up. No money changes hands. He's the sort of veteran we could use around these parts and I think Davis and another player in our system is a fair offer.
Sabean: (once again holding mouthpiece of the phone) Oh my God.
Tidrow: What? What's the offer? And how much money would we take on?
Sabean: Hold on, Dave. (puts phone on hold) Rajai Davis and a player to be named, and he bears the all of the financial burden.
Tidrow: You're shitting me.
Sabean: Nope. (takes phone off hold) You have yourself a deal, Dave. Congrats, you will really like Matt. He didn't fit in with us but I think he will make a nice addition.
Littlefield: Pleasure doing business, Brian.
==========
In case there is any confusion, that is probably a pretty decent proxy for how yesterday's swap of Matt Morris and Rajai Davis between the San Francisco Giants and Pittsburgh Pirates played out. It's the most non-sensical, criminally damaging move I can remember seeing executed by a team. Pittsburgh, with a payroll just north of $38 million in 2007, has agreed to a $13.5 million commitment to Matt Morris.
Morris turns 33 next week and has not been even an average pitcher in four years. He will in all likelihood constitute a larger percentage of his team's 2008 payroll than just about any other player in baseball. After a smoke and mirrors start to the 2007 season, he has posted a 7.50 ERA or so since mid June. There is just no overstating, or even accurately putting into words, just how little sense this deal makes for Pittsburgh.
Rajai Davis is 26 years old, a good fielding center fielder and one of the fastest players in all of Major League Baseball. In over 600 Minor League contests, he has averaged about 65 steals per 162 games played, and at an exceptional success rate to boot. In July, he appeared to be turning a corner with his bat, as he hit .389/.450/.500 this past month in limited time. His ceiling is low, but he could conceivably be a decent MLB starting center fielder if he develops a bit more. On top of this, the Giants will get another player from Pittsburgh's system.
The worst part of this is the opportunity cost that their financial outlay to Morris will represent. Just think of some of the ways this money could have been better spent. No, the Bucs will never be playing at the high end of the free agent market and the middle of the market is usually bogged down with the, well, Matt Morris's of the world. But do you think Pirates fans would have preferred Matt Wieters or Rick Porcello to Daniel Moskos? What about Andrew Miller or Tim Lincecum in Brad Lincoln's stead?
There are a number of ways to leverage financial assets, and acquiring mediocrities (say hello Cesar Izturis, Sean Casey, Jeromy Burnitz, Matt Lawton et al) is a fool-proof way to ensure your small market franchise never competes, never excites your fanbase and never develops intriguing youngsters at the top-end of the amateur draft pool. Dave Littlefield's incompetence is well documented, but this latest deal is so criminal in its senselessness that it would warrant the most radical of actions from Pittsburgh fans.
Don't go to the ballpark. Don't buy another piece of memorabilia. Don't turn on your televisions to watch the games. Don't flip on the radio to listen in. Your team does not care about you, and you should not care about it. Not until ownership makes even a token gesture that it is committed to putting a viable product on the field should Buc fans reciprocate with any sort of commitment of their hard earned dollars.