Rich Lederer • Baseball Beat
Patrick Sullivan • Change-Up
Jeremy Greenhouse • Touching Bases
Dave Allen • F/X Visualizations
Sky Andrecheck • Behind the Scoreboard
Marc Hulet • Around the Minors
Al Doyle • Past Times
Retired Uniforms:
Bryan Smith • WTNY
Joe Sheehan • Command Post
Jeff Albert • The Batter's Eye
RSS Feed
Home
*Examining the Past, Present, and Future*
Lineup Card
Recent Entries
» Putting Together a Reality Team
» Historical Hall of Fame Vote Comparisons: 2012
» An All-Christmas Team
» The New-Look Angels
» John Denny: The Forgotten Cy Young Award Winner
» Money Isn't Everything
» What Would It Take to Hit .400 in the 21st Century?
» Halos Heaven
» Brandon McCarthy's Breakout Season
» Link-o-Rama
» Historical Hall of Fame Vote Comparisons: 2012
» An All-Christmas Team
» The New-Look Angels
» John Denny: The Forgotten Cy Young Award Winner
» Money Isn't Everything
» What Would It Take to Hit .400 in the 21st Century?
» Halos Heaven
» Brandon McCarthy's Breakout Season
» Link-o-Rama
Best of Baseball Beat
Abstracts From the Abstracts
1977 Baseball Abstract
1978 Baseball Abstract
1979 Baseball Abstract
1980 Baseball Abstract
1981 Baseball Abstract
1982 Baseball Abstract
1983 Baseball Abstract
1984 Baseball Abstract
1985 Baseball Abstract
1986 Baseball Abstract
1987 Baseball Abstract
1988 Baseball Abstract
1978 Baseball Abstract
1979 Baseball Abstract
1980 Baseball Abstract
1981 Baseball Abstract
1982 Baseball Abstract
1983 Baseball Abstract
1984 Baseball Abstract
1985 Baseball Abstract
1986 Baseball Abstract
1987 Baseball Abstract
1988 Baseball Abstract
Bert Blyleven Series
Meeting Up and Hanging Out with Bert
The Results Are In And...
Aficionado Heavily Invested in Blyleven
Latest on Blyleven's Chances for the HOF
The Internet Zealot Responds
400 Down and 5 to Go...
Bert Be Home By Eleven?
Blyleven's Forgotten Season (1973)
HeyMan, Your Comments Don't Hold Water
The Waiting is the Hardest Part
Another Addition to the Blyleven Series
Search for the Truth
As Dominant as His HOF Contemporaries
Listen, Buster
A Larger Step for Blyleven
Answering the Naysayers (Part Two)
Another Small Step for Blyleven
Q&A: Blyleven on the Twins
The Majority Rules, Right?
It's All Dutch to Some
The Hall of Fame Case for Bert Blyleven
Q&A: Blyleven on Felix Hernandez
Clemens Rocketing Up Charts
Poz: An Interview With a KC Star
A HOF Chat with Tracy Ringolsby
Up Close and Personal
A Peek Into the Mind of a HOF Voter
Answering the Naysayers
It's That Time of the Year (Again)
"If Cooperstown is Calling..."
The Bert Alert
One Small Step for Blyleven...
Only the Lonely
Exclusive Interviews
Lee Sinins
Alex Belth
David Pinto
Will Carroll
Mike Carminati
Aaron Gleeman
Joe Sheehan
Jay Jaffe
Jeff Peek
Tracy Ringolsby
Joe Posnanski
Bill James Part I, II, III
Jon Lalonde
Chuck Tiffany
Dayn Perry
Fay Vincent
Nate Silver
Alex Belth
David Pinto
Will Carroll
Mike Carminati
Aaron Gleeman
Joe Sheehan
Jay Jaffe
Jeff Peek
Tracy Ringolsby
Joe Posnanski
Bill James Part I, II, III
Jon Lalonde
Chuck Tiffany
Dayn Perry
Fay Vincent
Nate Silver
Bullpen
Rich Lederer
The Odd Couple (with Alex Belth)
The MostUnder Over Underrated Player in Baseball (with Brian Gunn)
Three Wise Men (roundtable by Alex Belth)
Infrequently Asked Questions (interview with Matt Welch)
Interview (Orioles Think Tank)
Bernie and the Yanks (Bronx Banter)
Hope and Faith: How the LAA Win the World Series (Baseball Prospectus)
NL West (The Soul of Baseball)
Greatest Living Hitter? (Sports Illustrated)
Roundtable: 2008 HOF Ballot (Armchair GM)
The Most
Three Wise Men (roundtable by Alex Belth)
Infrequently Asked Questions (interview with Matt Welch)
Interview (Orioles Think Tank)
Bernie and the Yanks (Bronx Banter)
Hope and Faith: How the LAA Win the World Series (Baseball Prospectus)
NL West (The Soul of Baseball)
Greatest Living Hitter? (Sports Illustrated)
Roundtable: 2008 HOF Ballot (Armchair GM)
Patrick Sullivan
Designated Hitters
David Bromberg (Q&A: John Denny)
Mark Armour (H. Killebrew and Versatility)
Joe Lederer (Soundtrack of a Prospect)
David Bromberg (Clemente's Autograph)
David Bromberg (Woody Fryman)
D. Baumstein (WAR Against Age: Pitchers)
Doug Baumstein (The WAR Against Age)
Doug Baumstein (A Lifetime on the Road)
John Fraser (Pick Six)
Mark Armour (How to Score More Runs?)
Bill Parker (What Opening Day Tells Us)
Stan Opdyke (Pat Rispole)
Chris Jaffe (Evaluating Baseball's Mgrs)
Stan Opdyke (Baseball Radio in NYC, 1953)
A. Nathan (Performance of Baseball Bats)
Michael Weddell (Edgar Martinez/HOF)
Jon Weisman (100 Things Dodgers Fans...)
Stan Opdyke (Connie Mack and Vin Scully)
Eric Walker (Evaluating Run Production)
Brent Mayne (The Intangibles of Catching)
Chris Moore (Best Fastballs in Baseball)
Dave Baldwin (The Batter’s Brain)
Shawn Haviland (Ivy League to MLB)
Larry Granillo (Walking Off)
Rob Iracane (Solo HR Won't Break You)
Tommy Bennett (Charm of AM Radio)
Harry Pavlidis (Johan Santana's Fast Start)
John Walsh (WAR and Remembrance)
Eric Walker (Precisely Inaccurate)
Bob Timmermann (As They See 'Em)
Geoff Young (Unicycles and Delusions)
Baseball Analysis at Tufts (Groundballers)
Baseball Analysis at Tufts (GB Out Rates)
G. Rybarczyk ('09 Hit Tracker Projections)
Joe Lederer (Curt Schilling/HoF)
Conor Gallagher (Hall of Fallacies)
Chris Green (Jim Rice, HoF, the Numbers)
Shawn Hoffman (Baseball's Bear Mkt?)
Paul Anthony (Manny Syndrome)
Ross Roley (World Series Odds)
B. Timmermann (Catcher's Interference)
R.J. Anderson (Waiting the Hardest Part)
Maury Brown (Cubs, MLB, and Cuban...)
Myron Logan (Dee-Fense, Dee-Fense)
Craig Calcaterra (Frivolity, Part I, Part II)
Chad Finn (Ode to Baseball Cards)
David Cameron (Mariners Foibles)
Chris Dial (Chipper Jones)
Pat Lederer (Memory Lane)
David Appelman (Clutch Pitching)
Bob Rittner (DH)
Jonathan Mayo (Roger Clemens)
Lisa Winston (My Son-in-Law...)
Russ McQueen (The Yellow Hammer)
Bob Rittner (I'm OK, You're OK)
Mark Armour (In Defense of the HOF)
Pat Jordan (Friends)
Dan Levitt (Analysis of Terry Ryan)
Doug Baumstein (Trading Econ 101)
Ross Roley (Runner's Reluctance II)
Ross Roley (Runner's Reluctance I)
Mark Armour (No-Longer Lovable Sox)
Bruce Regal (Stealthy and Wise)
Brian Gunn (Roid Monster)
Current/McEvoy (Value of the SB)
John Rickert (Sinister Thefts)
Nate Silver (Sabermetrics)
David Vincent (Home Run Production)
Joe P. Sheehan (Enhanced Gameday II)
Mark Armour (An Ode to Sport)
David Gassko (All-Time Worm Burners)
Joe P. Sheehan (Enhanced Gameday)
John Walsh (When Titans Clash)
Fox/Williams (Quantifying Coaches II)
Fox/Williams (Quantifying Coaches I)
Jacob Luft (Bull Durham Rant)
Chad Finn (Strat-O-Matic)
Lisa Winston (Rotisserie Baseball)
Dave Studeman (Baseball Stats)
Steve Treder (Roger Craig)
Marc Normandin (Jeff Bagwell)
D. Appelman (Expanding Strike Zone)
Jeff Sackmann (Worst MiL Defenders)
Jeff Sackmann (Best MiL Defenders)
Maxwell Kates (Van Lingle Mungo)
David Appelman (Pitch Location)
Kent Bonham (Danny Ray Herrera)
Glenn Stout (Two Baseball Poems)
Bruce Regal (The Challenge Round)
Mark Lamster (Barry & Ty)
Geoff Young (NL West)
Tom Lederer (The Ryan Express)
Brian Erts (Great Leap Forward)
David Pinto (Parity and the N.L.)
Jacob Luft (Fathers and Daughters)
Jamey Newberg (Pete's Sake)
Jeff Albert (A. Jones Swing Analysis)
Jeff Albert (A-Rod Swing Analysis)
Keith Law (Death, Taxes, and Waivers)
Peter Abraham (Tales of Torre Tales)
Larry Borowsky (Let 'er Rip II)
Dan Levitt (Empirical Analysis of Bunting)
Jonah Keri (If I Met Warren Cromartie...)
Bob Klapisch (War Stories)
Bob Timmermann (John F. Kennedy HS)
Kent Bonham (Aluminum Adjustments)
Al Doyle (More Than Superstars)
Ross Roley (Instant Replay)
David Vincent (Barry Bonds Homers)
Chad Finn (Our Favorite Obscurities)
Bill Deane (1979 NL MVP)
Mark Armour (Rise/Fall of Artificial Turf)
Jeff Angus (Wally Moon Camp)
David Berri (Money and Baseball)
Larry Borowsky (Baseball w/o the #s)
Derek Zumsteg (The Irrational Market)
David Regan (Free Agent Contracts)
Peter Schmuck (Steroids and the HOF)
David Appelman (Pitchers, Pitch by Pitch)
Dan Fox (Swinging, Taking, Fouling, Etc)
Patrick Sullivan (Study of NYY CF/BOS LF)
Will Leitch (Baseball Journalism)
Jeff Sullivan (Pitcher Release Points)
Steve Treder ('69-'70 Giants)
Maury Brown (Charlie Finley)
John Brattain (Bob Johnson)
Bob Klapisch (The Case for Bert Blyleven)
Jeff Peek (Pride and Prejudice)
Dayn Perry (Bert and Warren)
Rob Neyer (If Don Sutton Was Great...)
Lisa Winston (Minor League Memories)
Alex Belth (Otis Redding Was Right)
David Cameron (Long Live the King)
Jeff Angus (Baserunning Study)
Bert Blyleven (Baseball Playoffs)
Boyd Nation (Not a Prospect List)
James Click (Batters-Baserunners Study)
Jeff Shaw (Why I Love Baseball)
David Gassko (BIP/BFP Fielding Study)
Jay Jaffe (Milwaukee Sausage Race)
Jamey Newberg (Remember When)
Bob Klapisch (Press Box to the Mound)
Dan Levitt (Predictive Value of BB)
David Vincent (Official Scorer)
Jon Weisman (Rick Monday)
Larry Borowsky (Let 'er Rip)
Will Carroll (Fictional Short Story)
Bob Timmermann (Japanese Baseball)
Cyril Morong (Best Pitching Seasons)
Sean Forman (Monte Carlo Win-Loss)
Brian Gunn (My Little Blue Book)
Joe Lederer (My Dad and Baseball)
Bill Deane (Bob Gibson, 1968)
Mark Armour (1977 Yankees)
Darren Viola (Retrosheet)
David Pinto (RFK)
Dayn Perry (Brave Heart)
Matt Welch (Dave Hansen)
Kevin Kernan (Jack McKeon)
Tom Lederer (Dodgers Road Trip)
Steve Lombardi (Slider)
Studes (Picturing Baseball)
Mike Carminati (Luck of the Drawl)
Eric Neel (Vin Scully)
J.C. Bradbury (Leo Mazzone)
John Sickels (Bill James)
Search Baseball Analysts
Archives
By Category:
Around the Majors Content Only
Around the Minors Content Only
Baseball Beat Content Only
Baseball Beat/Change-Up Content Only
Baseball Beat/WTNY Content Only
Behind the Scoreboard Content Only
Change-Up Content Only
Change-Up/Around the Majors Content Only
Command Post Content Only
Crunching the Numbers Content Only
Designated Hitter Content Only
F/X Visualizations Content Only
Past Times Content Only
Saber Talk Content Only
The Batter's Eye Content Only
Touching Bases Content Only
Weekend Blog Content Only
WTNY Content Only
By Month:
February 2012
January 2012
December 2011
October 2011
September 2011
August 2011
July 2011
June 2011
May 2011
April 2011
March 2011
February 2011
January 2011
December 2010
November 2010
October 2010
September 2010
August 2010
July 2010
June 2010
May 2010
April 2010
March 2010
February 2010
January 2010
December 2009
November 2009
October 2009
September 2009
August 2009
July 2009
June 2009
May 2009
April 2009
March 2009
February 2009
January 2009
December 2008
November 2008
October 2008
September 2008
August 2008
July 2008
June 2008
May 2008
April 2008
March 2008
February 2008
January 2008
December 2007
November 2007
October 2007
September 2007
August 2007
July 2007
June 2007
May 2007
April 2007
March 2007
February 2007
January 2007
December 2006
November 2006
October 2006
September 2006
August 2006
July 2006
June 2006
May 2006
April 2006
March 2006
February 2006
January 2006
December 2005
November 2005
October 2005
September 2005
August 2005
July 2005
June 2005
May 2005
April 2005
March 2005
February 2005
January 2005
December 2004
November 2004
October 2004
September 2004
August 2004
July 2004
June 2004
May 2004
April 2004
March 2004
February 2004
January 2004
December 2003
November 2003
October 2003
September 2003
August 2003
July 2003
June 2003
Reference
Organizational Stats
Arizona Diamondbacks Bat / Pitch
Atlanta Braves Bat / Pitch
Baltimore Orioles Bat / Pitch
Boston Red Sox Bat / Pitch
Chicago Cubs Bat / Pitch
Chicago White Sox Bat / Pitch
Cincinnati Reds Bat / Pitch
Cleveland Indians Bat / Pitch
Colorado Rockies Bat / Pitch
Detroit Tigers Bat / Pitch
Florida Marlins Bat / Pitch
Houston Astros Bat / Pitch
Kansas City Royals Bat / Pitch
Los Angeles Angels Bat / Pitch
Los Angeles Dodgers Bat / Pitch
Milwaukee Brewers Bat / Pitch
Minnesota Twins Bat / Pitch
New York Mets Bat / Pitch
New York Yankees Bat / Pitch
Oakland Athletics Bat / Pitch
Philadelphia Phillies Bat / Pitch
Pittsburgh Pirates Bat / Pitch
St. Louis Cardinals Bat / Pitch
San Diego Padres Bat / Pitch
San Francisco Giants Bat / Pitch
Seattle Mariners Bat / Pitch
Tampa Bay Devil Rays Bat / Pitch
Texas Rangers Bat / Pitch
Toronto Blue Jays Bat / Pitch
Washington Nationals Bat / Pitch
All-Star Links
Official Websites
News and Notes
Baseball News Blog
Baseball Newstand
ESPN Baseball
Fox Sports Baseball
Pro Sports Daily
Roto World
The Roto Times
USA Today Baseball
Baseball Newstand
ESPN Baseball
Fox Sports Baseball
Pro Sports Daily
Roto World
The Roto Times
USA Today Baseball
Reference and Analysis
Baseball Almanac
Baseball America
Baseball Archive
Baseball Contracts
Baseball Cube
Baseball Graphs
Baseball Library
Baseball Musings Player Database
Baseball Page
Baseball Primer
Baseball Prospectus
Baseball Reference
Baseball Statistics
Baseball Truth
Boxscore Central
Diamond Mind Baseball
Doug's Stats
FanGraphs
Fast Balls (pitchfx catalog)
Hardball Dollars
Hardball Times
Hit Tracker
Retrosheet
Rotobase/Rotoblog
Stat Corner
STATS
Tango on Baseball
Yahoo Sports MLB
Web Gems
Bill James Primer
Sabermetric Manifesto (Grabiner)
Pitching and Defense (McCracken)
Pitching and Defense (Tippett)
Transactions Primer (Neyer)
Baseball Stats (Batter's Box)
Prospect Report (Cameron)
Pitcher Workloads (Sheehan)
Goodbye to Old Baseball Ideas (Rickey)
Sabermetric Manifesto (Grabiner)
Pitching and Defense (McCracken)
Pitching and Defense (Tippett)
Transactions Primer (Neyer)
Baseball Stats (Batter's Box)
Prospect Report (Cameron)
Pitcher Workloads (Sheehan)
Goodbye to Old Baseball Ideas (Rickey)
Columnists
Baseball Blogs
Around the Majors
Athletics Nation
Baseball Crank
Baseball Musings
Baseball-Reference Blog
Batter's Box
Big League Stew
Bronx Banter
Catfish Stew
Cub Town
Dan Agonistes
Dodger Thoughts
DRays Bay
Ducksnorts
Futility Infielder
Halos Heaven
Inside the Rockies
It Might Be Dangerous
Knuckle Curve
LoHud Yankees Blog
Lookout Landing
Management by Baseball
Metaforian
Metsgeek
Mike's Baseball Rants
Only Baseball Matters
Redbird Nation
Red Reporter
Sabernomics (Braves)
Seth Speaks
ShysterBall
6-4-2 (Angels/Dodgers)
The Book
TheCubdom
The Cutting Edge
The House That Dewey Built
The View From The Bleachers
Tiger Blog
U.S.S. Mariner
Viva El Birdos
Where's Kernan
Minor Leagues
Arizona Fall League
BA Player Finder
Cal Leaguers
Jamey Newberg
JDM's Scoresheet Baseball
Minor League Baseball
Minor League Park Factors
Minor League Splits
No Pepper
Sickels' Minor League Ball
Warm October Nights
BA Player Finder
Cal Leaguers
Jamey Newberg
JDM's Scoresheet Baseball
Minor League Baseball
Minor League Park Factors
Minor League Splits
No Pepper
Sickels' Minor League Ball
Warm October Nights
Amateur
Boyd's World (College)
Cape Cod Baseball League
College Baseball Blog
College Baseball Insider
Collegiate Baseball Newspaper
College Splits
College Splits Blog
Dirtbags Baseball (Long Beach State)
NCAA Baseball
NCBWA
Team One Baseball (High School)
Texas A&M & Baseball
Cape Cod Baseball League
College Baseball Blog
College Baseball Insider
Collegiate Baseball Newspaper
College Splits
College Splits Blog
Dirtbags Baseball (Long Beach State)
NCAA Baseball
NCBWA
Team One Baseball (High School)
Texas A&M & Baseball
Historical
Cuban Baseball
House of David
Jim "Mudcat" Grant's Web Page
Negro League Baseball Players Assoc
Negro Leagues Baseball Museum
1919 Black Sox
Pacific Coast League
Philadelphia Athletics Historical Society
Shoeless Joe Jackson Society
SABR-L Archives
Walter O'Malley
House of David
Jim "Mudcat" Grant's Web Page
Negro League Baseball Players Assoc
Negro Leagues Baseball Museum
1919 Black Sox
Pacific Coast League
Philadelphia Athletics Historical Society
Shoeless Joe Jackson Society
SABR-L Archives
Walter O'Malley
Miscellaneous
Forums
Credits
Ticket Center
Tickets to Baseball -
Premium Red Sox Tickets - Tickets to Marlins Games - Cardinals Game Tickets - NY Yankee Tickets - Tickets Oakland Athletics - Dallas Cowboys Tickets - Arizona Cardinals Tickets - Tickets Seattle Seahawks - Buffalo Bills Tickets Online - Tickets to Dolphins Football
Buy Boston Red Sox tickets,
Philadelphia Phillies tix,
NY Yankees tickets,
NY Mets tickets, and
MLB All Star game tickets at ABC tickets
Not sure where to find the best online sportsbooks? Start your search with PlayersJet.
Get deals at SportsMemorabilia.com on baseball apparel, including Phillies jerseys and more for adults and children.
Shop the largest selection baseball equipment on sale at Sports Unlimited. Check out tons of baseball gloves, youth baseball gloves and catchers gear from Rawlings, Wilson, Nike & Under Armour.
2011 Draft Order
Courtesy of Baseball America
First-Round:
 1. Pirates (57-105)
 2. Mariners (61-101)
 3. Diamondbacks (65-97)
 4. Orioles (66-96)
 5. Royals (67-95)
 6. Nationals (69-93)
 7. Diamondbacks (for B. Loux)
 8. Indians (69-93)
 9. Cubs (75-87)
10. Padres (for Karsten Whitson)
11. Astros (76-86)
12. Brewers (77-85)
13. Mets (79-83)
14. Marlins (80-82)
15. Brewers (for Dylan Covey)
16. Dodgers (80-82)
17. Angels (80-82)
18. Athletics (81-81)
19. Red Sox (from DET for Martinez)
20. Rockies (83-79)
21. Blue Jays (85-77)
22. Cardinals (86-76)
23. Nationals (from CWS for Dunn)
24. Rays (from BOS for Crawford)
25. Padres (90-72)
26. Red Sox (from TEX for Beltre)
27. Reds (91-71)
28. Braves (91-71)
29. Giants (92-70)
30. Twins (94-68)
31. Rays (from NYY for Soriano)
32. Rays (96-66)
33. Rangers (from PHI for Lee)
Supplemental First Round:
34. Nationals (Dunn)
35. Blue Jays (Downs)
36. Red Sox (Martinez)
37. Rangers (Lee)
38. Rays (Crawford)
39. Phillies (Werth)
40. Red Sox (Beltre)
41. Rays (Soriano)
42. Rays (Balfour)
43. Diamondbacks (LaRoche)
44. Mets (Feliciano)
45. Rockies (Dotel)
46. Blue Jays (Buck)
47. White Sox (Putz)
48. Padres (Garland)
49. Giants (Uribe)
50. Twins (Hudson)
51. Yankees (Vazquez)
52. Rays (Benoit)
53. Blue Jays (Olivo)
54. Padres (Torrealba)
55. Twins (Crain)
56. Rays (Choate)
57. Blue Jays (Gregg)
58. Padres (Correia)
59. Rays (Hawpe)
| Baseball Beat | September 29, 2006 |
Biggest Surprises of 2006
Every baseball season presents it surprises - both positive and negative. Teams and individual players. Booms and busts. It's the nature of the beast. And the reason why they play the games. If games were won or lost on paper, the Boston Red Sox would be preparing for the post-season rather than the winter meetings.
Which teams and players were this year's biggest surprises? This exercise is meant to be participatory. My job is to make suggestions. Yours is to provide the final word in the comments section below.
Here we go. . .
STANDINGS
HITTING
BATTING AVERAGE
ON BASE PERCENTAGE
SLUGGING AVERAGE
HOME RUNS
PITCHING
ERA
WINS
STRIKEOUTS
SAVES
Who were your biggest surprises? Have at it.
| Designated Hitter | September 28, 2006 |
Barry & Ty: Kindred Spirits
Barry Bonds hit his 734th career home run last week, a shot that lifted him over Hank Aaron as the National League's all-time home run king. Should he play another season, Aaron's all-time, Major League record would be well within his grasp.
If there is a Bonds home run that will be remembered this year, however, it will be #715, the clout that eclipsed the career mark of Babe Ruth. Indeed, Bonds's performance over the last half decade has challenged Ruth's historical status as the game's ultimate offensive force. Who was the better player? More dominant over his peers? Is Bonds's achievement even legitimate, given his alleged use of performance enhancing drugs? Is he worthy of baseball's Hall of Fame? How do we square the records of the recent "steroid era," a time of expanded biceps and shrunken ballparks, with previous periods in the game's history when the schedule was shorter, there were fewer teams, a dead ball, and--as Bonds has often pointed out--African-Americans were excluded from play?
It's certainly fun to compare players across eras; baseball's record book all but begs us to do so. But statistics, however sophisticated, can only tell us so much. Numbers mean little without context, and in this case, by themselves, they fail to properly illuminate Bonds's proper place in history. Read more deeply into baseball's history books and you'll find that, however intriguing a comparison of the two might be, Babe Ruth is probably not the best marker for Barry Bonds. It's more enlightening to think of him in relation to another controversial player who was similarly considered by his contemporaries to be the greatest ever to don a pair of spikes: Ty Cobb.
Certainly, their personalities bear some striking similarities. Look back over the nearly century-and-a-half history of professional baseball, and you'll have trouble finding two figures more reviled than Ty Cobb and Barry Bonds. Fans, journalists, teammates--their friends are few, their enemies many. Here, for example, is what Davy Jones, who played alongside Cobb in the Detroit outfield of the 1910s, told oral historian Lawrence Ritter about the Georgia Peach: "He had such a rotten disposition that it was damn hard to be his friend....He antagonized so many people that hardly anyone would speak to him, even among his own teammates....He was one of the greatest players who ever lived, and yet he had so few friends. I always felt sorry for him." And here's what David Justice--hardly a flamethrower--had to say to reporter Howard Bryant on the general feeling about Bonds in Major League clubhouses: "Nobody could stand him. But you know what? He was the truth on the baseball field."
Jerky clubhouse behavior is really the least of their transgressions. Cobb's racism is well documented; only his ability on the field kept him from prosecution over a series of vicious assaults on African-Americans. He womanized, drank to excess, and almost certainly gambled on baseball--the ultimate betrayal of the game. Similarly, in their bestselling exposé, Game of Shadows, Mark Feinaru-Wada and Lance Williams describe Bonds as a philanderer prone to domestic violence, a tax cheat, and a serial abuser of performance enhancing drugs. Jeff Pearlman, who conducted more than five hundred interviews in writing his own Bonds biography, Love Me, Hate Me, declares, quite simply, that Bonds is "evil." Ouch.
What it is that drives a man to such anti-social behavior is, to a large degree, unknowable. But it's probably not coincidental that both Cobb and Bonds have expressed a deeply felt sense of personal injustice, and that race, in each case, was a key component in the development of that feeling. Cobb, born in rural Georgia in 1886, was a product of the Jim Crow South, and carried with him the prejudices born of that place and time. "He always figured everyone was ganging up against him," said another Detroit teammate, Wahoo Sam Crawford. "He came up from the South, you know, and he was still fighting the Civil War. As far as he was concerned, we were all damned Yankees before he even met us." Bonds, by contrast, has made no secret of his belief that the career and his own relationship with his father, Bobby Bonds, was compromised by baseball's white establishment. Bonds's comments on the game's history reveal a lingering reservoir of bitterness over the difficult experience of professional African-American ballplayers.
Where the careers of Cobb and Bonds most obviously coincide is in their undoing: both men were undone by a Brobdingnagian hero of the long ball who returned the sport to prominence after a period of controversial decline.
For Cobb, that player was Babe Ruth. When Ruth set the single-season home run mark of 29, in 1919, Cobb was still in the prime of his career--he hit .384 that year, at the age of 32. From that time to his retirement, after the 1928 season, he never hit below .323, and in 1922 he hit .401 (it was his third time over the threshold). But for all his accomplishment, his performance was eclipsed by that of Ruth, who was bashing homer after homer out of American League ballparks, drawing in fans with his long clouts and great charm, in the process repairing the damage done by the ugly Black Sox scandal, which had come out in 1920. America loved Babe, but Ty Cobb most assuredly did not. He did not like Babe personally--he called him a "baboon," among other racist pejoratives; and he did not like Ruth's style of play. "The home run could wreck baseball," said Cobb. "It throws out a lot of the strategy and makes it fence ball." Whether the home run wrecked baseball is a matter of opinion. But there was little argument that Cobb's "scientific" style of play, of using speed and smarts to get ahead, had been superannuated. By 1951, according to Cobb anyway, it was gone. That year, just two decades after his retirement, he penned an essay for Life magazine titled: "They Don't Play Baseball Anymore." Gone with scientific ball was Cobb's reputation as the game's preeminent player. Perhaps a few old timers still considered him baseball's all-time king; but for most fans Babe Ruth had assumed that position.
Bonds, at the beginning of his career, was as close to a model practitioner of Cobb's scientific style as any modern ballplayer. He did everything well: hit for average, get on base, steal, defend. He hit for power, but not at the expense of his other talents. By his age 33 season, in 1998, he already had 3 MVP awards, and was a virtual lock for the Hall of Fame. But if we are to believe the accounts of Feinaru-Wada and Pearlman, he remained unsatisfied; not with his own accomplishments, but with their perception by the public at large. If 1998 was a magical season for baseball, it was thanks to the home run contest between Mark McGwire and Sammy Sosa--and not for Bonds's own typically brilliant campaign. Bonds naturally thought himself more gifted than McGwire, and the idea that he should exist in his shadow was hardly acceptable. And so, we are told, Bonds turned to performance enhancing drugs. An injury-plagued year followed, but after that, a new, more powerful Bonds--a Bonds that could challenge the records of Ruth--was born. In 2001 he hit 73 home runs.
Cobb never had access to the pharmaceutical tools available to the modern ballplayer--not that he would have used them. In lieu of the syringe, he used the press to argue for his baseball pre-eminence. Ten years after the appearance of that Life article and shortly before his death, Cobb published My Life in Baseball: The True Record. Three decades later, his ghostwriter, Al Stumpf, came out with a truer and far less flattering record, Cobb, later transformed into the film starring Tommy Lee Jones.
What, one wonders, will Barry Bonds be writing in twenty years?
Mark Lamster is the author of Spalding's World Tour: The Epic Adventure That Took Baseball Around the Globe - And Made It America's Game.
| Baseball Beat | September 26, 2006 |
Making Sense of Stats - Pitching
Just as hitters were the subject of yesterday's article, pitchers rule today. The pitchers are on a word count here . . . so let's get after it.
Halos Light Up Edinson
I went to the Rangers-Angels game last night and had a chance to witness first hand Edinson Volquez. The rookie entered the game with the following stats:
         G  GS  W  L    IP   H   R  ER  HR  BB  SO   ERA
Career  13  10  1  9  43.0  68  45  42   8  27  25  8.79
(The above numbers include a start vs. SEA last month in which the right-hander threw seven scoreless innings.)
He left the game with the following line: 3.0-9-5-5-0-1 (including two HR). His updated career stats now look like this:
         G  GS  W  L    IP   H   R  ER  HR  BB  SO   ERA
Career  14  11  1 10  46.0  77  50  47  10  27  26  9.20
Volquez's H/9 is 15.1. His K/9 and BB/9 are 5.09 and 5.28, respectively. Edinson's HR/9 is 1.96. I recognize the small sample size here, but I'm more than skeptical. His fastball (which sits at 92-93 and touched a high of 94 Monday night) may have been good enough to get minor leaguers out, but his command and secondary pitches aren't going to get the job done at the big league level.
Plurality Wins Out
While on the subject of young pitchers, don't mistake Jason Hammel for Cole Hamels.
         G  GS  W  L     IP   H   R  ER  HR  BB  SO   ERA
Hammel   7   7  0  4   34.2  43  27  27   6  18  21  7.01
Hamels  22  22  9  8  126.1 110  62  57  18  47 138  4.06
Sure, both pitchers are rookies. But the similarities stop right there. Hammel is ordinary (at best). Hamels is extraordinary.
Fantasy Tip of the Week
Eric Bedard is fast becoming one of the best pitchers in baseball. While his strikeout rate has been remarkably stable the past three seasons, he has been walking fewer and fewer batters. The reduced number of free passes has resulted in a successively lower WHIP and ERA.
       K/9   BB/9   WHIP    ERA   HR/9   GB%   FB%
2004  7.93   4.65   1.60   4.59   0.85  38.3  42.5
2005  7.94   3.62   1.38   4.00   0.64  40.0  36.8
2006  7.90   3.06   1.33   3.67   0.75  48.8  30.1
In the meantime, Bedard's current HR/9 rate is the 10th-lowest among all qualified pitchers. He's inducing more groundballs and fewer flyballs. Since late June, the Baltimore lefty is 9-4 with a MLB-best 2.27 ERA and 3.61 K/BB ratio. (Don't pay any attention to the guy with the third-best ERA during this period. You know, the one sandwiched between Roger Clemens and Johan Santana.)
A Buehrle ERA
During this same period (6/21/06-present), Mark Buehrle has had the second-worst ERA (6.69) in baseball. He has nobody to blame but himself. The Chisox southpaw is simply allowing too many balls in play. Buehrle has also been less successful due to giving up more home runs than ever.
       BABIP   K/9   HR/9   BAA    ERA
2004   .298   6.05   1.21  .271   3.89
2005   .298   5.67   0.76  .264   3.12
2006   .307   4.32   1.59  .300   4.99
Fewer strikeouts mean more balls in play. More balls in play equal more hits. More hits result in more runs. It's really no more complicated than that.
Here is a list of pitchers with K/9 rates below 4.50 (fewer than one whiff per two innings):
                         K/9
Paul Byrd        Cle    4.45
Kenny Rogers     Det    4.40
Jason Marquis    StL    4.40
Steve Trachsel   NYM    4.37
Kris Benson      Bal    4.34
Mark Buehrle     CWS    4.32
Mark Redman      KC     4.08
Aaron Cook       Col    3.84
Carlos Silva     Min    3.53
Chien-Ming Wang  NYY    3.06
Extreme groundball pitchers Chien-Ming Wang (3.04 G/F) and Aaron Cook (2.77) might be able to get away with K/9 rates below 4.0. Kenny Rogers, at the upper end of this group and with an above-average G/F rate of 1.62, has shown an ability to succeed as well. Aside from these three, I'm not at all sanguine about the prospects for the other pitchers on the above list.
By the way, did Mark Redman (5.83 ERA, 1.61 WHIP, 4.08 K/9) really make the All-Star team this year?
Raise Your Son to be a Left-Handed Pitcher
        K/9   BB/9   WHIP
2003   5.12   2.34   1.25
2004   5.18   2.41   1.33
2005   4.77   2.59   1.33
2006   4.96   2.65   1.35
The pitcher's ERA must have been about the same all four years, right? Wrong. Try 4.43, 4.64, 3.20, and 4.67. The pitcher in question is Jarrod Washburn. Fortunately for him, he put up the 3.20 ERA in his contract year and got Seattle's Bill Bavasi to bite on a four-year, $37.5 million contract.
Question: Do you think Washburn's ERA next year will be closer to 3.20 or 4.60? That's what I thought. A league-average pitcher at only $9.375M per year. What a country!
| Baseball Beat | September 25, 2006 |
Making Sense of Stats - Hitting
As the regular season winds down, I thought it would be instructive to take a close look at a number of players to see if their stats or trends might foretell us something about the future. Today, we start with hitters. Tomorrow, we will finish with a select group of pitchers.
Luke the Fluke?
Granted, Luke Scott has barely garnered 200 plate appearances this season but, get this, only seven players in the history of baseball have exceeded his .368/.454/.697 line this year.
SINGLE SEASON (MIN 200 PA)
AVG >= .368, OBP >= .454, SLG >= .697
                              YEAR      AVG      OBP      SLG
1    Ted Williams             1941     .406     .553     .735
2    Rogers Hornsby           1925     .403     .489     .756
3    Rogers Hornsby           1922     .401     .459     .722
4    Babe Ruth                1923     .393     .545     .764
5    Ted Williams             1957     .388     .526     .731
6    Larry Walker             1999     .379     .458     .710
7    Lou Gehrig               1930     .379     .473     .721
8    Babe Ruth                1924     .378     .513     .739
9    Babe Ruth                1921     .378     .512     .846
10   Babe Ruth                1920     .376     .532     .847
11   Lou Gehrig               1927     .373     .474     .765
12   Babe Ruth                1931     .373     .494     .700
13   Todd Helton              2000     .372     .463     .698
14   Babe Ruth                1926     .372     .516     .737
15   Barry Bonds              2002     .370     .582     .799
Source: Sabermetric Baseball Encyclopedia
Larry Walker and Todd Helton both benefited by playing their home games at Coors Field when it was hugely advantageous for hitters. The other five names? Ted Williams, Rogers Hornsby, Babe Ruth, Lou Gehrig, and Barry Bonds. Great Scott!
Another Bonds Controversy
Speaking of Bonds, with his 734th career home run, he (reportedly) broke Hank Aaron's National League record this past weekend. But did he really? Bonds may have hit more HR in a NL uniform than anyone else, but he has not slugged all of them against NL teams. As a result, one could argue that Aaron's record is still in tact, so help me interleague play.
Winn, Lose or Draw?
Randy Winn is a good example of the danger of extrapolating the past when it comes to older players. His age 28-31 seasons were pretty similar to one another. Anybody who expected Winn to put up his 2002-2005 averages of .296/.353/.453 in 2006 was badly mistaken as the switch-hitting outfielder has fallen to .262/.324/.399.
        AGE   AVG   OBP   SLG
2002     28  .298  .360  .461
2003     29  .295  .346  .425
2004     30  .286  .346  .427
2005     31  .306  .360  .499
2006 32 .262 .324 .399
But wait a minute. Is Winn's down season owing to his age or is it a statistical aberration? If the latter, is there something in the numbers that would give us confidence that he may not be headed southward? Well, let's take a look at his BABIP the past five years:
        BABIP
2002    .345
2003    .345
2004    .321
2005    .334
2006    .279
Hmmm. Could Winn's lower BABIP be a function of changing home ballparks following last year's trade that sent him from the Mariners to the Giants? Oh, it's possible, I suppose. But how do you account for his 2005 splits when he had a .306 BABIP for SEA and .385 for SF? Perhaps Winn, with his lowest SB total and success rate since 2000, has lost some speed and is legging out fewer hits--thereby negatively affecting his BABIP?
Thanks to FanGraphs, we can verify if the above is the case.
       IFH   IFH%    BU   BUH   BUH%
2002    31   13.7    14     7   50.0
2003    15    6.0    12     4   33.3
2004    17    6.2    17     2   11.8
2005    17    6.6    11     0    0.0
2006    12    4.9     4     0    0.0
Winn has been getting fewer infield hits (IFH) and bunt hits (BUH) than in prior seasons. Although his infield hit percentage (IFH/GB) and bunt hit percentage (BUH/BU) are down, they only account for a small portion of his lower BABIP.
Drilling down a bit further with respect to Winn's batted ball data, we can see that he isn't hitting as many line drives this year as he has in the past.
        LD%    GB%    FB%
2002   22.2   46.1   31.6
2003   20.2   51.0   28.8
2004   18.2   52.4   29.4
2005   22.0   49.1   29.0
2006   16.7   49.4   33.9
According to Dave Studemund of The Hardball Times, league-wide BABIP generally equals LD% + about .110 in the AL and .100 in the NL. Using Winn as an example, his predicted BABIP = .167 + .100 or .267. Scrolling back up, we can see that Winn's actual BABIP in 2006 is .279.
Best Young Hitter in Baseball
Here are Miguel Cabrera's yearly stat lines since he broke into the big leagues:
        AGE   AVG   OBP   SLG   OPS
2003     20  .268  .325  .468   793
2004     21  .294  .366  .512   879
2005     22  .323  .385  .561   947
2006     23  .336  .427  .567   994
Do you notice a trend here? Think Cabrera is likely to exceed his career averages (.310/.383/.536) next year? At some point, his stats will level out. However, I wouldn't want to make the bet that he will regress next year at age 24. If anything, I think Cabrera's HR and BB rates have room for further improvement. The only obstacle in the way of a 40-HR season might be his home ballpark. Gary Sheffield (42, 1996) is the only one who has ever gone yard more than 33 times in a season while playing for the Marlins.
Nonetheless, Cabrera has reverse splits this year, albeit not significant. He is hitting better at home and vs. right-handed pitchers (despite playing in a pitcher-friendly ballpark and being a RHB).
        AVG   OBP   SLG
Home   .350  .449  .600
Road   .324  .409  .543
RHP    .344  .427  .578
LHP    .310  .431  .540
Happy Holliday
Like Cabrera, Matt Holliday has been going up the elevator since his debut in 2004.
        AGE   AVG   OBP   SLG   OPS
2004     24  .290  .349  .488   837
2005     25  .307  .361  .505   866
2006     26  .332  .391  .592   983
Despite somewhat similar numbers, Holliday is no Cabrera. The Colorado outfielder benefits by playing in a friendlier hitting environment and is three years older than the Marlins third baseman. A good hitter for sure but unlikely to make his way into the great camp.
        AVG   OBP   SLG
Home   .376  .443  .681
Road   .288  .336  .492
Sweeney Todd
Holliday's teammate Todd Helton is going in the opposite direction.
        AGE   AVG   OBP   SLG   OPS
2004     30  .347  .469  .620  1088
2005     31  .320  .445  .534   979
2006     32  .307  .408  .487   895
Helton has gone from being Lou Gehrig to Mike Sweeney (at his best) to Mark Grace in a matter of a few years. What kind of line would you predict the former backup QB to Peyton Manning at the University of Tennessee to put up in his age 33 season? I'll suggest the mid-points within the following ranges: .290-.300/.380-.400/.450-.480. At $16.6M per year through 2010 and $19.1M in 2011 (with a $23M club option or $4.6M buyout for 2012), suffice it to say that Helton has become a liability for the Rockies.
More Powerful Than. . .A Chicago Cub Middle Infielder
Carlos Zambrano slugged his sixth home run of the campaign on Saturday. He ranks seventh on the club in homers, with twice as many jacks in a Cubs uniform as Neifi Perez (2), Tony Womack (1), Jerry Hairston Jr. (0), and Cesar Izturis (0) combined in 371 fewer AB.
Since 1900, only seven pitchers have hit more roundtrippers than Zambrano in a single season. Three of them--Wes Ferrell, Don Drysdale, and Earl Wilson--had two or more years in which they went yard at least seven times. Bob Lemon ripped seven in 1949 and six in 1950.
SINGLE SEASON HR BY PITCHERS
MODERN ERA (1900-2006)
                              YEAR       HR
1    Wes Ferrell              1931        9
T2   Bob Lemon                1949        7
T2   Don Drysdale             1965        7
T2   Wes Ferrell              1933        7
T2   Wes Ferrell              1935        7
T2   Mike Hampton             2001        7
T2   Don Drysdale             1958        7
T2   Brooks Kieschnick        2003        7
T2   Don Newcombe             1955        7
T2   Earl Wilson              1966        7
T2   Earl Wilson              1968        7
Source: Sabermetric Baseball Encyclopedia
Zambrano might become the most renowned Three True Outcomes pitcher at the plate (6 HR and 26 SO in 70 AB) and on the hill (first in the NL in BB and 2nd in SO).
| Baseball Beat | September 22, 2006 |
The Prospect Maven Returns
Have you wondered what Bryan Smith is up to these days? Well, my former partner has been busy selecting his Top 20 prospects in the Pioneer League. Bryan's picks can be accessed at BaseballAmerica.com. Subscribers can also read the man behind WTNY's scouting reports on all 20 players and participate in a chat with him at 3 p.m. ET.
Here is a sneak preview of Bryan's top 5:
1. Bryan Morris, rhp, Ogden (Dodgers)
2. Josh Bell, 3b, Ogden (Dodgers)
3. Hector Gomez, ss, Casper (Rockies)
4. Sean O'Sullivan, rhp, Orem (Angels)
5. Gerardo Parra, of, Missoula (Diamondbacks)
Morris was the 26th pick overall in the June draft. Here is what I had to say about him three months ago in Live Blogging the 2006 MLB Draft:
26. Los Angeles Dodgers: Bryan Morris, RHP (Motlow State CC, Tenn.)Callis correctly tabbed this pick in his Tuesday morning mock draft (although he later moved him all the way up to the Dodgers' first pick at #7). Morris may not be as well known as many college pitchers because he played for a community college in Tennessee. However, he earned Freshman of the Year and Pitcher of the Year honors while fashioning a 10-1 record with a 0.82 ERA, which included a no-hitter vs. Southwest Tennessee and a four-hit, complete-game shutout with 14 strikeouts vs. Hiwasee in the playoffs.
Morris is my type of pitcher. The 6-3, 200-pound RHP has a plus fastball and a power curve. Moreover, the freshman recorded 122 Ks in 88 IP (12.48 K/9) and induced nine groundouts (and only two flyouts) in that Hiwasee shutout last month. He was drafted in the third round by the Devil Rays out of high school last June. The two sides supposedly agreed on a $1.3 million bonus that greatly exceeded the slot money, but the deal was never consummated due to an inability on the part of ownership to pull the trigger. Morris chose to attend Motlow State and join his Dad, who is the assistant coach, for one year.
Without seeing him pitch before, I'm still going to give Logan White a big thumbs up on this draft pick.
Posted by Rich at 2:53 p.m. ET
As it turns out, Morris' stats (4-5, 5.13 ERA, 1.74 WHIP) weren't all that impressive this year. However, he struck out 79 batters in 59.2 IP (11.92 K/9) and only allowed three home runs (0.45 HR/9). He has good size and plus stuff. Like a lot of rookie pitchers, it appears as if he needs to work on his command more than anything else.
John Manuel named his top 20 Arizona League prospects and Alan Matthews did the same for the Gulf Coast League earlier in the week. The Dodgers and Angels are faring quite well to date. Bryan listed Bryan Morris as the #1 prospect in the Pioneer League on the heels of Angels catcher Hank Conger (Arizona) and Dodgers pitcher Clayton Kershaw (Gulf Coast) getting the nod in their respective leagues.
With respect to the latter, the following comments are excerpted from our draft coverage in June:
7. Los Angeles Dodgers: Clayton Kershaw, LHP (H.S./Dallas)Kershaw was the first high school player chosen in this year's draft. Highly coveted by the Dodgers, he got past the Tigers because Andrew Miller was still available when Detroit's turn came up. The 6-4, 215-pound LHP had a 13-0 record with a 0.77 ERA in his senior season. He has reportedly touched the mid-90s with his fastball and has a plus curveball. Improved mechanics have contributed to better command. Given his height, handedness, stuff, and track record, Kershaw has one of the highest ceilings among all draftees.
Posted by Rich at 3:25 p.m. ET
Kershaw was as good as advertised in his professional debut. The 18-year-old dominated the short-season GCL this summer, fashioning a record of 2-0 with an ERA of 1.95 and a WHIP of 0.89. He whiffed 54 batters in 37 innings (13.14 K/9) and walked only five hitters (for a K/BB ratio of 10.8). Furthermore, the southpaw did not give up a single home run among the 28 hits allowed.
For more on any of these (or other) prospects, be sure to check out Minor League Baseball's improved stats pages (which now include splits and recent game logs).
Oh, and don't forget to stop by and say "hi" to Bryan this afternoon.
| Designated Hitter | September 21, 2006 |
The NL West: A Bad Joke, or Marginally Funny?
As was the case in 2005, the NL West has been the punch line to many jokes this season -- despite the fact that, through games of Monday, September 18, the combined winning percentage in the division was a very respectable .498. It's not the stellar .523 mark of the AL West, but neither is it the NL Central's dismal .464. Stick the NL West's worst team, the Rockies, into the Central and three teams are looking up at them.
That combined .498 winning percentage is also a huge improvement over last year's .459. In fact, no other division in baseball has seen as big a jump from 2005 to 2006 as the NL West:
            2006   2005     Dif
AL East     .497   .507   -.010
AL Central  .521   .496   +.025
AL West     .523   .511   +.012
NL East     .507   .525   -.018
NL Central  .464   .503   -.039
NL West     .498   .459   +.039
Although the NL West clearly was the weakest division in baseball a year ago, it has yielded that title to the NL Central. What's interesting is that the improvement in the West hasn't been limited to just one or two teams. With 12-13 games remaining, two of the teams already have more wins in 2006 than they did in 2005, and the remaining three are within reach. The Padres need to win 5 of their final 13 to break last year's total, while the Giants need to go just 2-11, so there's a pretty solid chance that four teams in the division will have performed better this season than last. It's not even that much of a stretch to imagine Arizona winning 7 of its final 13 games to join the others.
Okay, so I've painted a pretty picture. But let's not confuse "improved" with "great"; the division stunk last year, so even an improvement only gets us so far. It gets us about as far as not being able to use the NL West as the punch line anymore, which is a start at least.
How Did They Do It?
So, how were all these teams able to upgrade themselves from "slightly lousy" to "mediocre, give or take a little" in the span of a year? Interestingly, each has gone about it a different way.
The Padres, who were ridiculed for winning the division in 2005, basically overhauled their roster to make it more athletic, particularly in the outfield (hello, Mike Cameron), and to strengthen the pitching staff (the club leads the NL with a 3.94 ERA this year after finishing seventh at 4.13 last season). They also made a couple key acquisitions, chief among them the deal that brought Adrian Gonzalez, Chris Young, and Terrmel Sledge from Texas for Akinori Otsuka and Adam Eaton, and the now-infamous Doug "Hooray, I Can Catch a Knuckleball" Mirabelli for Josh Bard, Cla Meredith, and cash swap with the Boston Red Sox.
The Diamondbacks, Dodgers, and Rockies all have committed to rebuilding from within. The early returns have been very encouraging for each, with youngsters such as Conor Jackson, Stephen Drew, Andre Ethier, Russell Martin, Jonathan Broxton, Chad Billingsley, Matt Holliday, Garrett Atkins, Brad Hawpe, and Jeff Francis establishing themselves as solid contributors.
The Giants are another animal altogether, and it's a bit puzzling that they've done as well as they have. Barry Bonds is a shadow of his former self, and beyond Jason Schmidt, the pitching staff looked pretty suspect coming into the season. But Ray Durham has had a career year, and Moises Alou has been solid when healthy. Perhaps most significantly, right-hander Matt Cain has emerged as a rising force. Put those together and somehow San Francisco has managed to stay close to the pack for much of the season.
Individual Performances
We've established that the NL West as a whole is stronger now than it was in 2005, and we've identified some general ways in which each of its inhabitants has contributed to that effort. Next we'll highlight a few key individual performances within the division. Actually, we'll do better than that; we'll build a divisional "All-Star" team and compare the best at each position in the NL West to others around the league:
C: Mike Piazza (.278/.338/.503), Russell Martin (.286/.355/.442). The Padres brought in Piazza as a free agent from New York, which had assumed that the veteran backstop was finished. Seems Piazza had other ideas, as he has been one of the most productive catchers in baseball this season -- among full-time starters in the NL, only Atlanta's Brian McCann and Chicago's Michael Barrett have posted better numbers; then again, neither of them has Josh Bard to pick up the slack on days off. Martin took an entirely different route, starting the year at Triple-A Las Vegas as the Dodgers' #4 prospect (according to Baseball America) before being recalled May 5 to replace the injured Dioner Navarro. Martin, who attended the same Montreal high school as teammate Eric Gagne, never relinquished the job, and Navarro ended up in Tampa Bay.
1B: Adrian Gonzalez (.296/.351/.492), Nomar Garciaparra (.305/.371/.507). First base is one of the weakest positions in the division. You won't find anyone here to compare with Albert Pujols, Ryan Howard, Nick Johnson, Carlos Delgado, or even Adam LaRoche. The best among the lot is probably Gonzalez, who wasn't expected to break camp with the big club. But Ryan Klesko's bad shoulder secured the former #1 overall pick's spot on the roster, and after his first full season, Gonzalez looks not only like a legitimate middle-of-the-order threat, but also a perennial Gold Glove candidate. Garciaparra has enjoyed a fine resurgence in his hometown of Los Angeles, playing more games this season than in the previous two combined. The downside is that he's still managed to miss a fair amount of time due to injury.
2B: Ray Durham (.296/.364/.540), Orlando Hudson (.292/.359/.468). Although he no longer is a running threat, Durham has taken the rest of his offensive game to unprecedented levels. His play at second base this season is one of the main reasons the Giants have remained in the hunt for so long. He's pretty much right there with Chase Utley and Dan Uggla at the top of this position in the NL. As for Hudson, his addition to the Diamondbacks has provided them with a solid overall offensive attack and a brilliant defender at the keystone corner.
3B: Garrett Atkins (.324/.399/.542), Chad Tracy (.276/.335/.436). In his second season, Atkins has taken his game to a new level. Already a solid contributor at the plate, Atkins has raised his batting average more than 30 points this year while increasing his walk rate and nearly doubling his homers. That's not quite enough to get him into Miguel Cabrera territory, but he can comfortably brush elbows with the likes of Chipper Jones, David Wright, Scott Rolen, and Aramis Ramirez -- no shame in that. Tracy is listed as Atkins' backup by default, as third base has been a very weak position in the division this year.
SS: Rafael Furcal (.297/.364/.439), Omar Vizquel (.303/.368/.401). Furcal's numbers look nice enough out of context, but when you realize what a slow start he got off to, they look even better. Since the All-Star break he's hitting .339/.392/.565, which means the Dodgers have been getting middle-of-the-order production from their leadoff hitter for the past couple of months and change. As for Vizquel, all I can say is that 39-year-old shortstops aren't supposed to be this good. In fact, they're not supposed to exist. I find myself having to rethink him as a Hall of Famer. Both of these guys are among the best at their position in the NL this year, although everyone will be looking up at Jose Reyes and Hanley Ramirez soon enough.
LF: Matt Holliday (.332/.386/.575), Barry Bonds (.262/.456/.532). Like Atkins, Holliday stepped his game up in a big way this season. He still doesn't draw walks, but when you hit .330 with 40+ doubles and 25-30 homers, who cares? Although Holliday benefits greatly from Coors Field (1108 OPS at home vs 828 on the road), he's not a zero away from it. He's been as good as any left fielder in the NL this year, including Jason Bay, Alfonso Soriano, Pat Burrell, and Adam Dunn. As for Bonds, it's pretty amazing that even hurt and presumably clean, he's still producing at a very high rate. Honorable mention goes to Andre Ethier.
CF: Mike Cameron (.266/.354/.477), Eric Byrnes (.270/.319/.489). Cameron has injected power and speed into a lineup that had little of either before his arrival. He's also improved the entire outfield defense in San Diego by allowing Dave Roberts to move to his natural left field and reducing the amount of ground Brian Giles has to cover in right. He's no Carlos Beltran (who is?), but Cameron and Andruw Jones head the second-tier at this position. Byrnes, meantime, quietly has put up a strong campaign for the Diamondbacks. Honorable mention goes to Kenny Lofton.
RF: J.D. Drew (.276/.385/.474), Brad Hawpe (.285/.375/.489). Hey, finally a position where the NL West really shines. These two guys have posted nearly identical numbers in radically different environments. The weird part is that Drew is hitting .290/.415/.522 at Dodger Stadium and .263/.356/.428 away from it, while Hawpe is hitting just .277/.369/.423 at Coors Field and .292/.381/.548 on the road. This was kind of a down year for right fielders in the NL overall. Jacque Jones and Jeff Francouer lead the pack in homers. Yuck.
SP: Brandon Webb (16-6, 2.92 ERA), Jason Jennings (8-12, 3.61 ERA). Okay, Webb is a no-brainer since he's a serious candidate for the Cy Young Award this year. He's right there with Chris Carpenter and Roy Oswalt at the top among NL starters. As for Jennings, his record isn't great but he gets extra credit for posting a 3.16 ERA over 13 starts at Coors Field. Honorable mentions go to Jason Schmidt, Chris Young, and Derek Lowe.
RP: Trevor Hoffman (0-2, 39 SV, 2.09 ERA), Takashi Saito (5-2, 7 HLD, 19 SV, 2.28 ERA). Hoffman has had a few hiccups, as you might expect from a 38-year-old with a mid-80s fastball, but he continues marching toward history with trademark efficiency. Saito was brought in from Japan to support Eric Gagne, but when Gagne went down and others faltered, Saito stepped in and took control. The right-hander has been lights out most of the year and has helped bring credibility to a previously suspect Dodgers bullpen. Billy Wagner probably has had a better year than Hoffman and Saito among NL relievers, but that's about it. Honorable mentions go to Cla Meredith and Jonathan Broxton.
Conclusion
The NL West hasn't been great in 2006, but it has been much stronger than it was a year ago. Sadly for those who tell them, the jokes that are still making the rounds no longer apply. Substitute NL Central, and the jokes might work. They won't necessarily be funny, but at least they'll be more accurate, and that counts for something.
Geoff Young is the author of Ducksnorts, a blog focused on the San Diego Padres, as well as Knuckle Curve, a general baseball blog. He lives in San Diego with his wife and two dogs, and enjoys eating Thai food, playing his guitar, and going for long walks around Petco Park.
| Baseball Beat | September 20, 2006 |
The Best 5-7 Pitcher in Baseball
While checking out the new leaderboards section at a favorite baseball site, FanGraphs, I discovered that Ben Sheets had one of the best Fielding Independent Pitching (FIP) ERAs among all starters this season. I've always liked Sheets but apparently hadn't paid much attention to him in 2006 because I was totally unaware just how well he was pitching.
Having thrown just 92 innings on the campaign, Sheets has flown under the radar screen despite a better FIP than Jered Weaver, Francisco Liriano, Roger Clemens, Johan Santana, Chris Carpenter, and Brandon Webb. FIP, like Defense Independent Pitching Stats (DIPS), is comprised of those measures for which a pitcher has responsibility--SO, BB, HBP, and HR.
Based on the FIP or DIPS metrics, Sheets has been nothing short of sensational. Although Ben has given up more than a hit per inning, he has kept the ball in the park and been downright stingy in allowing walks while striking out well over a batter a frame. With 7.51 K/100P, Sheets ranks second among all starting pitchers (behind only Liriano).
SEASON STATS
  IP   H   R   ER  HR  BB   SO   H/9   HR/9   BB/9    K/9    K/BB
92.0  93  45   43   9  10  103  9.10   0.88   0.98  10.08   10.30
One would think that the above stats would result in a win-loss record of better than .500, yet Sheets has been credited with only 5 Ws against 7 Ls. Don't let that record mislead you. He is the best 5-7 pitcher in the game. I know that's not saying much so let me rephrase that line. When healthy, Sheets is one of the best pitchers in the game. Period.
The operative words here are "when healthy." Sheets has spent more than his fair share of time on the DL during the past two years. He was a workhorse prior to 2005, averaging 225 IP the previous three seasons. Only Mark Buehrle, Livan Hernandez, and Bartolo Colon had logged more innings than Sheets from 2002-2004.
Sheets began 2006 on the disabled list with tendinitis in his right shoulder, was activated in mid-April, made four starts and then landed on the DL once again in early May. After sitting out 2 1/2 months, Ben returned on July 25 and hasn't missed a start since.
GAME LOG
DATE OPP    IP  H  R  ER  HR  BB  SO  GB  FB  TBF  #Pit  Dec.
9/19 StL   6.0 10  4   4   1   1   8   4   6   29   114  L(5-7)
9/13 @Pit  8.0  2  1   1   1   0  10   5   8   25   100  W(5-6)
9/08 Hou   6.2  7  2   2   0   1   6   5  10   28   112  --
9/02 Fla   7.0  4  3   3   2   1   8   5  12   27    96  --
8/28 @Fla  7.0  6  3   1   0   1   6   7   6   27    96  L(4-6)
8/23 Col   7.0  6  1   1   0   0   7   8   7   27    97  W(4-5)
8/17 Hou   7.0 10  7   7   2   2   6   9  10   33   103  L(3-5)
8/12 @Atl  7.0  6  5   5   0   0   8   9   8   27    86  W(3-4)
8/05 @StL  1.0  2  1   1   0   2   1   0   3    7    27  L(2-4)
7/30 Cin   8.0  7  2   2   1   1  10   8   7   30   101  W(2-3)
7/25 Pit   7.0  6  1   1   1   0   5  11  10   27    94  --
5/02 Hou   2.1  9  7   7   0   0   3   6   3   16    60  L(1-3)
4/26 Atl   6.0  6  2   2   0   1   9   6   3   24    92  W(1-2)
4/21 Cin   7.0  6  2   2   0   0  10   8   5   28    97  L(0-2)
4/16 @NYM  5.0  6  4   4   1   0   6   5   6   21    96  L(0-1)
Allowing 10 hits and 4 runs in 6 IP last night vs. the St. Louis Cardinals, Sheets had his worst outing in over a month. Nonetheless, the 6-foot-1, 220-pound RHP struck out 8 batters and yielded just 1 walk in a game that was somewhat of a microcosm of his season.
Sheets knows what it's like to pitch in tough luck. In 2004, he placed in the top five in the N.L. in GS (34), CG (5), IP (237), SO (264), ERA (2.70), WHIP (0.98), K/9 (10.03), BB/9 (1.22), and K/BB (8.25), yet had nothing more than a 12-14 record to show for his efforts. When a pitcher finishes among the league leaders in both K/9 and BB/9, you know he is pretty special.
Strikeouts, walks, and home runs. When it comes to evaluating pitchers, pay more attention to those numbers than wins and losses and, for that matter, ERA. In early July, I extolled the virtues of Jake Peavy for just these very reasons even though his oft-quoted stats were less than inspiring at that time. As it turns out, Peavy now has the 5th-lowest FIP among qualified starters in the N.L.
If you're looking for two pitchers to improve upon their W-L records and ERAs next year, look no further than Ben Sheets and Jake Peavy. Neither is without risk but, then again, who isn't?
| Baseball Beat | September 19, 2006 |
Ted Williams and the MVP Award
"It appears that the oldtimers must have checked out other metrics besides triple crowns as Cobb, Gehrig and Williams did not win the MVP for those years."
--Comment by Reader
In Supernatural, I presented a list of pitchers and hitters who led both leagues in their respective Triple Crown categories. As detailed, there have been seven hurlers (covering 12 different seasons) and four players who have won MLB's Triple Crown.
With respect to the comment, it should be noted that the MVP award wasn't in place when Ty Cobb led the majors in AVG, HR, and RBI in 1909. However, the reader was correct in stating that Lou Gehrig and Ted Williams were not named MVPs in their Triple Crown seasons.
Williams, in fact, is one of only two players--along with Rogers Hornsby--to win the Triple Crown twice. The Splendid Splinter led the A.L. in AVG, HR, and RBI in 1942 and 1947. Amazingly, the man some believe was the greatest hitter of all time was NOT named the Most Valuable Player in either of those two years.
In 1942, the writers saw fit to give the award to Joe Gordon. Five years later, the voters selected Joe DiMaggio. Williams was the runner-up both times.
Let's take a look at how Williams compared to Gordon in 1942 and DiMaggio in 1947.
1942
           G   AB   R   H  2B 3B  HR  RBI SB CS  BB  SO  AVG  OBP  SLG OPS+
Williams  150 522 141 186  34  5  36  137  3  2 145  51 .356 .499 .648 217
Gordon    147 538  88 173  29  4  18  103 12  6  79  95 .322 .409 .491 155
Williams led the league in everything. He won the traditional Triple Crown (AVG, HR, RBI) and swept the rate stats (AVG, OBP, SLG). He even captured to so-called Quad Award by leading the league in OBP, SLG, times on base (TOB), and total bases (TB). The Thumper also led in walks, extra-base hits, runs, runs created, and adjusted OPS (or OPS+).
Gordon, on the other hand, led the A.L. in two categories only. Strikeouts and Grounded Into Double Plays (GIDP). I'm not kidding!
Need more evidence that Williams got shafted? The Boston left fielder earned 46 Win Shares and the Yankee second baseman was credited with 31. In addition, Ted picked up 15.3 Wins Above Replacement Player (WARP3) and Joe had 10.9. By both measures, Williams was worth about 4-5 more wins than Gordon that year.
In the book Win Shares, Bill James wrote, "Ted's still mad about that one."
1947
           G   AB   R   H  2B 3B  HR  RBI SB CS  BB  SO  AVG  OBP  SLG OPS+
Williams 156  528 125 181  40  9  32  114  0  1 162  47 .343 .499 .634 205
DiMaggio 141  534  97 168  31 10  20   97  3  0  64  32 .315 .391 .522 154
Once again, let the record show that Williams led in every important offensive category. AVG, OBP, SLG, OPS, OPS+, R, HR, BB, R, RBI, TB, TOB, XBH, and RC. DiMaggio? He didn't lead the league in anything (other than MVP votes).
Williams had 44 Win Shares, DiMaggio had 30. The Kid had 13.5 WARP3, Joe D. 7.3. Therefore, Williams was worth about 5-6 more wins than DiMaggio that season.
James dubbed the balloting, "A famous controversy."
According to Baseball: The Biographical Encyclopedia, "Williams always blamed Boston writer Mel Webb for leaving him completely off the ballot, thereby costing him the award, but Webb didn't even have a vote that year--a writer in the Midwest had left Williams off the ballot instead. He collected only three first-place votes; had any of the 20 other writers who voted for Williams picked him even one place higher, he would have won the award."
Teddy Ballgame also led the A.L. in Win Shares in 1941, 1948, and 1951 without winning the MVP. Instead, he lost the award to DiMaggio, Lou Boudreau, and Yogi Berra, respectively. Yes, Williams had the most Win Shares in the league seven times, yet captured only two MVP trophies--neither of which took place in the years when he won the Triple Crown.
As it relates to the opening comment, I don't know what the "oldtimers" were considering when filling out their MVP ballots. It goes without saying that they certainly weren't impressed with Teddy's Triple Crowns. But I don't think one can say that they were checking out "other metrics" because, by almost any objective measure, Williams clearly was the Most Valuable Player in the A.L. in 1942 and 1947, and arguably in 1941, 1948, and 1951, too.
| Baseball Beat | September 18, 2006 |
Supernatural
Johan Santana currently leads all pitchers in ERA (2.77), wins (18), and strikeouts (237). If the 2004 Cy Young Award winner can maintain his position, he will be the first pitcher in over 20 years to capture the Major League Triple Crown. The last MLB Triple Crown winner? Dwight Gooden in 1985 for the New York Mets when he racked up 24 victories and 268 Ks along with the lowest single-season ERA (1.53) since 1968.
Randy Johnson was the last pitcher to lead his league in all three categories. The Big Unit struck out 334 batters while winning 24 games and fashioning a 2.32 ERA for Arizona in 2002. The American League's most recent Triple Crown winner was Pedro Martinez (2.07, 23, 313) of the Boston Red Sox in 1999.
There have been only seven pitchers (covering 12 different seasons) who have won MLB's Triple Crown of pitching.
MLB TRIPLE CROWN WINNERS - PITCHING
Year Pitcher            Team        ERA     W     SO
1913 Walter Johnson     WAS (AL)   1.09    36    243
1915 Grover Alexander   PHI (NL)   1.22    31    241
1917 Grover Alexander   PHI (NL)   1.86    30    201
1918 Walter Johnson     WAS (AL)   1.27    23    162
1924 Dazzy Vance        BRO (NL)   2.16    28    262
1930 Lefty Grove        PHI (AL)   2.54    28    209
1931 Lefty Grove        PHI (AL)   2.06    31    175
1945 Hal Newhouser      DET (AL)   1.81    25    212
1963 Sandy Koufax       LAD (NL)   1.88    25    306
1965 Sandy Koufax       LAD (NL)   2.04    26    382
1966 Sandy Koufax       LAD (NL)   1.73    27    317
1985 Dwight Gooden      NYM (NL)   1.53    24    268
As shown, Sandy Koufax performed this feat a record three times. Walter Johnson, Grover Cleveland Alexander, and Lefty Grove have two MLB Triple Crowns to their credit. Of note, Alexander led the N.L. in all three areas four times, including three consecutive seasons (1915-17).
Interestingly, five of the above pitchers also won their league's Most Valuable Player award - Johnson (1913), Dazzy Vance (1924), Grove (1931), Hal Newhouser (1945), and Koufax (1963). No N.L. MVP was named in Alexander's Triple Crown seasons and no A.L. award was presented in 1918.
The number of MVPs should bode well for Santana's chances. The operative word here is "should." The reality is that Johan will find it difficult to garner enough support among writers to finish first, irrespective of whether he leads the majors in wins, ERA, and Ks, much less WHIP (0.98), W-L % (.783), K/9 (9.67), and K/100P (7.27). Unfortunately, too many voters will either undervalue his contributions or leave him off their ballot because he doesn't play everyday. For validation, look no further than the fact that Roger Clemens (1986) is the only starting pitcher in the past 37 years to win the MVP award. I mean, when Willie McGee beats out Gooden in 1985 in a landslide, you know the odds are stacked in favor of position players and against pitchers.
The Twins are 26-6 in Santana's 32 starts. Minnesota is 62-55 in the games in which its ace hasn't pitched (including 11-5 when fellow southpaw Francisco Liriano has started). I would argue that Santana has been more valuable than teammates Joe Mauer and Justin Morneau and deserves to be given serious consideration for the A.L. MVP.
Topping the big leagues in ERA, wins, and Ks isn't quite as rare as leading in batting average, HR, and RBI but it is an impressive feat nonetheless. The fact that wins and RBI are team dependent may reduce the significance of the Triple Crown of pitching and batting in the eyes of modern-day statheads for sure. That said, I place credence on almost any list that produces such revered names as those who have led both leagues in the Triple Crown categories.
MLB TRIPLE CROWN WINNERS - HITTING
Year Batter             Team        AVG    HR    RBI
1909 Ty Cobb            DET (AL)   .377     9    107
1925 Rogers Hornsby     STL (NL)   .403    39    143
1934 Lou Gehrig         NYY (AL)   .363    49    165
1942 Ted Williams       BOS (AL)   .356    36    137
1956 Mickey Mantle      NYY (AL)   .353    52    130
If nothing else, Santana will join a rather exclusive group of pitchers who have won multiple Cy Young Awards. The list includes Roger Clemens (7); Randy Johnson (5); Steve Carlton and Greg Maddux (4 each); Sandy Koufax, Pedro Martinez, Jim Palmer, and Tom Seaver (3 each); Bob Gibson, Tom Glavine, Denny McLain, Gaylord Perry, and Bret Saberhagen (2 each). Winning a third CYA down the road would elevate Santana into a group that ranks among the top 15 or 20 pitchers in the history of the game.
But first things first. It may not be Smooth when it comes down to the actual voting but Santana ranks as this year's #1 hit single in the A.L. in my book.
| Baseball Beat | September 15, 2006 |
My Side of the Story
Yesterday's guest columnist admitted he couldn't throw as hard as Nolan Ryan, the subject of his article. A southpaw, he fancied himself as the next Sandy Koufax in his Pony League, Colt League, American Legion, Connie Mack, and high school playing days. But, like every left-hander before and after him, he fell short of such lofty aspirations.
Although my brother Tom never made it to the professional ranks, he was one heckuva pitcher in his youth. I'll admit, I'm biased when it comes to singing his praises. Hey, it's an easy thing to do. As Casey Stengel is famous for saying, "You can look it up."
As a 14-year-old, Tom was named to the Lakewood Pony League All-Stars. His team won the sectional, divisional, and regional tournaments and earned a berth in the 1966 Pony League World Series in Ralston, Nebraska. Tom, in fact, was the winning pitcher in the Western Regionals, throwing a four-hitter while striking out 12 in an 8-1 victory over Martinez, California.
Four years later, Tom and many of his Pony League All-Star teammates won the California Interscholastic Federation (CIF) Southern Schools championship. Tom was the winning pitcher in the CIF semi-finals and finals. I'll let the Los Angeles Times tell the story:
Tom finished his high school senior year with a record of 10-0 and an ERA of 1.53. He also had a batting average of .429. Tom earned first team All-CIF honors. Future major leaguers Fred Lynn (El Monte High School) and Eddie Bane (Westminster HS) were named to the second and third teams, respectively. The latter is now the Angels Director of Scouting.
The next step in Tom's baseball career was either the pros or college. The California Angels general manager Dick Walsh and farm and scouting director Roland Hemond huddled with my Dad to ask if Tom was leaning toward signing a pro baseball contract or pursuing his college education.
Long Beach Press-Telegram columnist Loel Schrader included the following recruiting information back in June 1970: "Lakewood High pitchers Tom Lederer and Russ McQueen are being courted by USC and Chapman. Lederer is interested in both. McQueen is pretty well committed to Chapman." Days later, Schrader provided P-T readers with an update in the Cuff Stuff section of his column: "Tom Lederer, winning pitcher in Lakewood's 5-4 victory in the CIF championship game with Ventura, appears headed for Chapman College . . . Check signals on Russ McQueen, another Lakewood pitcher. It was reported here last week that Chapman had the inside track on the Lancer righthander. But Justin Dedeaux, junior varsity baseball coach at USC, reports that McQueen told him this past Thursday that he'll join the Trojans."
Prior to attending Chapman College that fall, Tom played for the Anchorage Glacier Pilots, a summer collegiate league team that included several future major leaguers. Tom transferred to Long Beach City College the following spring after Paul Deese, the coach who recruited him to Chapman, resigned and founded the Alaskan Summer Baseball League.
Once again, I'll let the L.A. Times fill us in on the details: Deese Looks North to Alaska for Better Baseball Opportunity - "Behind him, Deese leaves a group of frosh stars at Chapman--Manny Estrada, CIF Player of the Year as a junior at Bishop Amat; Bob Blackledge of Foothill High, and Tom Lederer, 10-0 for Lakewood's CIF championship team."
Joining the talented LBCC baseball program a semester behind everyone else, Tom never received much of an opportunity his freshman year on a team that featured Dave Frost, who went on to win 16 games for the 1979 American League Western Division champion California Angels. Tom played for LBCC his sophomore year, then transferred to Long Beach State with the intention of playing for coach John Gonsalves in 1973 but opted out before workouts began the prior fall.
Retired from baseball at the age of 21, Tom earned his degree in Business Administration from Long Beach State and now manages sports and aquatics programs for the City of Lakewood, California, selected the number one Sportstown in California by Sports Illustrated. He has been married for over 25 years to his wife Jeannie and has two children, Brett, 22, and Kelsey, 20. Tom also has a younger brother who is very proud of his older sibling.
| Designated Hitter | September 14, 2006 |
Remembering the Ryan Express
"God gave Nolan the ability to throw a baseball faster than anybody else."
--Phil Garner, former Astros teammate
The recent rant from Joe Morgan regarding radar gun readings while watching Detroit Tigers rookie fireballer Joel Zumaya placed a spotlight on measuring the speed of fastballs and recognizing the fastest of the fastest. It's a debate for the ages, covering legends Walter Johnson, Bob Feller and Nolan Ryan and continuing to a seeming glut of would-be fastball kings in the game today.
"Who throws the fastest?" and "How fast does he throw?" are questions that undoubtedly date to the origins of the game. Baseball Almanac put together an interesting chronicle of "The Fastest Pitcher in Baseball History." The article details a variety of tests to measure fastballs over the years, with Johnson's recorded at 134 feet per second or 91.36 miles per hour. Feller's 98.6 mph entry was achieved using a speeding motorcycle. But Rapid Robert claimed to have been clocked as high as 107.9 in a 1946 demonstration.
One of the most famous of the fastball documentation events was Nolan Ryan's official "clocking" at 100.9 MPH in 1974. As the oldest son of George Lederer, the California Angels Director of Public Relations and Promotions, I had an opportunity to play a small role in the event.
As the summer of 1974 wore on, the Angels fell ever deeper into the American League West cellar. Attendance figures were taking a similar dive, as weeknight crowds often fell short of 10,000. What's a team to do beyond the scheduled bat nights and ball nights?
In this case, the attention was focused on their 27-year-old budding superstar, Nolan Ryan.
Acquired from the New York Mets in December 1971, Ryan quickly became known as a strikeout king, recording 329 in 1972 and breaking Sandy Koufax's major league record with 383 in 1973.
"He threw the ball harder than any pitcher I ever saw, including Sandy Koufax."
--Frank Robinson, fellow Hall of Famer and Angels teammate in 1973-74
Interest in the Ryan phenomenon was increasing and his fastball was quickly becoming legendary. Players generally agreed that Ryan's fastball was the fastest of active pitchers. With that acclaim, the natural questions were "How fast is fast?" and "How does Ryan's fastball compare to the legendary fastballs from bygone eras?" Measuring the speed of a Ryan fastball would be the only solution.
At the virtual dawn of what we now recognize as an era of tremendous technological advances, the answer was found just five miles from the then Anaheim Stadium. Dad discovered a team of scientists at Rockwell International -- a part of the aerospace industry that defined much of the Southern California landscape in the post-World War II era -- had developed a sophisticated but untested device that had the potential to accurately measure the speed of a Nolan Ryan fastball.
In August, as the quest to make an official clocking of Ryan's fastball was developing behind the scenes, Ryan was adding to his legend on the field. Following a 30-day period in July when he totaled 57 2/3 innings, Ryan began an incredible streak on August 7 in a game against the White Sox in Chicago. He entered the ninth inning seeking to throw his third career no-hitter but lost it and the game as the Sox managed three hits to produce two runs and a 2-1 victory. His 13-strikeout performance was followed by games with strikeout totals of 19, 9 and 19 -- 60 strikeouts over a stretch of four starts.
"He's faster than instant coffee."
--Hall of Famer Reggie Jackson (13-for-62 with 22 SO vs. Ryan)
Meanwhile, on an asphalt parking lot at the Rockwell International facility in Anaheim, the Rockwell engineers sought to test their device in a dry run before taking it to the stadium for an upcoming Ryan outing.
My father arranged for Angels catcher Charlie Sands, a disabled list victim for much of August, to assist in the test by catching a 22-year-old lefthander whose fastball would be the subject of the trial procedure. I was that lefthander. Although I had enjoyed success as a pitcher -- my high school career ended by winning the Southern California large schools championship and I played a summer for the Anchorage Glacier Pilots, a collegiate league team that included future major leaguers Randy Jones, Craig Swan, Jim Crawford and Bruce Bochte -- I was two years removed from my last competitive season.
Following a sufficient warm up on the moundless parking lot, the engineers announced that they were having trouble getting a reading. They explained that they didn't expect to have any trouble getting a reading on pitches that were at least 85 miles per hour. Upon hearing that, Sands could barely suppress his laughter. I clearly remember the incredulity in his voice as he said, "If this guy could throw 85 miles per hour, he wouldn't be out here pitching in the parking lot." So much for that career.
Attention for the project then turned to conducting the test during an upcoming home start for Ryan. If successful, an official clocking would be announced and turned into a promotional opportunity for a subsequent start at the Big A.
The experiment on August 20 vs. the Detroit Tigers worked and the plan was on to promote the official timing of Ryan's fastball at his next home start on Saturday, September 7 against the Chicago White Sox. To hype the interest, Dad developed a contest for fans to guess the results. Los Angeles Times columnist John Hall wrote the following in his September 6, 1974 column:
"We created a monster," groaned George Lederer of the Angels. He is the club promotion director in charge of the celebrated Nolan Ryan test and contest . . . The fireballing right-hander's speed will be measured Saturday night at home against the Chisox . . . Prizes are up for people guessing the right m.p.h. and number of pitches Ryan will make.Entries approach the 6,000 mark. Three secretaries have worked around the clock the past week checking the estimates . . . The Angels have heard from 250 communities in California as well as 20 other states, including New York, Minnesota and Connecticut.
Low guess is 48 m.p.h. . . . High 147.3 . . . One entry estimated only six pitches. Another said 358 (Ryan's average is 150 and he's made as many as 245 in nine innings) . . . "We never realized how much attention this would attract," sighed Lederer.
Dan Hafner's account in the L.A. Times on September 2 provides an excellent preview of the big night:
A device called a coherent infrared radar, developed by Rockwell International, will measure the velocity of Ryan's fastball. Other devices have clocked nine other major league fireballers and the fastest of the nine was Bob Feller, at 98.6 m.p.h. in 1946. The Cleveland star was 27, Ryan's age now.But the comparison will be exact. Rockwell International calls its device the most sophisticated ever used to measure the speed of a thrown baseball.
The machine will operate from the press box, making use of a phenomenon called the Doppler frequency shift.
The infrared beam from a low-power transmitter is aimed at a spot 9 or 10 feet in front of home plate. Because infrared wave lengths are 20 times longer than those of visible light waves, the beam cannot be seen.
As the ball crosses the beam, the waves are compressed by the motion of the ball and reflected back to the equipment. The returning waves have less spacing between them than when they were transmitted. The device measures that difference to determine the ball's speed.
There's no guarantee that Ryan's fastest pitch will be timed. The narrower the beam, the more accurate the measurement, so the beam will be narrowed to the width of home plate. Ryan, who is sometimes wild, may miss it with his best throw.
An interesting side note: Having played my bit part, I recall that the Rockwell device was described behind the scenes as using a "laser beam" as the primary technology. The relatively new and not-yet-understood laser technology created a public relations dilemma. Because it was feared the public may be frightened by an announced use of lasers, the decision was made to use an alternate name. Hence "coherent infrared radar" was a cover for what may have actually been coherent laser radar. Thankfully, there were no reports of severed limbs among the spectators.
On September 7, pitching against the Chicago White Sox, Ryan recorded the 18th of his 22 victories, and registered a fastball officially clocked at 100.8 mph. (See the highest inning-by-inning readings on the stadium scoreboard.) In Robert Goldman's book "Once They Were Angels," he describes the event as follows:
Notwithstanding the Angels' mediocre play, Ryan continued to break records and grab headlines. Much as Bo Belinsky had done a decade prior, Ryan was keeping the national spotlight on the Angels despite their losing ways. To capitalize on Ryan's growing reputation, Angels publicity director George Lederer arranged a scientific test to be conducted by Rockwell International to discover, once and for all, the true speed of "the Ryan Express." Unlike today's radar guns, the Rockwell machine was precisely calibrated to give an accurate, consistent reading. During a night game against the White Sox on September 7, 1974, an eighth-inning pitch (editor's note: it was actually a ninth-inning pitch) to Bee Bee Richard was clocked at 100.8 miles per hour, eclipsing Bob Feller's unofficial mark of 98.6. The Rockwell test naturally enhanced the Ryan mystique. If players didn't already have enough to worry about when facing the Angels ace, they now had to deal with the scientifically proven fact that they were facing the hardest-throwing pitcher in the history of Major League baseball.
Hafner's game account in the L.A. Times included:
Ryan and his batterymate, Tom Egan, felt that all the fanfare, the publicity and pre-game activity was largely responsible for the big pitcher losing his concentration and failing to come up with the velocity he expected."I've caught him when he threw harder than he did tonight," said Egan. "He didn't have his real stuff. All that activity took away from his concentration."
Ryan, who threw 159 pitches, did perk up in the seventh and eighth innings when he registered five strikeouts, but some of his fastest pitches in those innings were not recorded. The White Sox swung at them, but they weren't in the strike zone, the area that fell within the scope of the Rockwell International machine.
Following Ryan's next start on September 11, Dan Hafner quoted Ryan: "I had better than average speed tonight. Better than when they tested me. At least, I felt like it out there."
"Those were the best pitches I ever heard."
--Mickey Stanley (7-for-35 with 8 SO vs. Ryan)
So much fuss about one 100 mph fastball. Now, 30 years later, radar guns are recording speeds on virtually every pitch thrown in major league games. The Bill James Baseball Handbook 2006 reports that in 2005 23 pitchers threw a combined 135 pitches at 100+ mph. Baseball Almanac has a 100 MPH Club listing "In Order of Fastest Observed Speed." Two radar gun readings of 103 mph top the list -- by Mark Wohlers from a 1995 spring training game and by Joel Zumaya on July 4, 2006. The list does not include Zumaya's 103 mph reading thrown during the Joe Morgan rant on September 3, 2006. Little Joe adamantly questioned the reliability of radar guns.
The scientific precision of the Rockwell measurement creates a strong argument for officially recognizing the Ryan Express as the king of all fastballs. Despite all the fanfare of the 100.8 mph fastball to Bee Bee Richard on September 7, 1974, Nolan Ryan is officially recognized as holding the Guinness World Record at 100.9 mph for one pitch in the August 20 game against Detroit when the Rockwell engineers discreetly tested their system.
Contrary to his skepticism of Joel Zumaya's radar readings, perhaps Joe Morgan could be counted on to support his contemporary, Nolan Ryan. "I know a 100.9 mile per hour fastball when I see one and that was a 100.9 mile per hour fastball."
Tom Lederer is a former pitcher whose fastball was seen and not heard. His "On the Road With the Dodgers" guest column can be found here.
| Baseball Beat | September 13, 2006 |
Late Season Call-Ups
In the first of a three-part series, I'm going to spotlight a dozen of the most highly regarded August and September call-ups. Each player's position, age, height and weight, and bats/throws will be included, along with current year minor and major league stats, and my subjective takes on their pros, cons, best comp(s), and outlook.
Part one covers four hitters. Part two will highlight an additional quartet of position players. Part three will be reserved for pitchers only. The subjects are not presented in either alphabetical order or in terms of their rankings.
High School: Evergreen (CO)
College: University of Arkansas-Little Rock
Drafted: Selected by CLE in 6th Round (168th overall) in 2003
2006 STATS
     G  AB  R  H  2B  3B  HR  RBI  BB  SO  SB CS  AVG  OBP  SLG   OPS
AA  67 244 46 95  19   1  15   55  23  34   2  3 .389 .449 .660 1.109
AAA 27 102 22 36   9   0   7   20  10  12   2  1 .353 .409 .647 1.056
MLB  5  20  3  5   1   0   3    8   0   2   0  0 .250 .250 .750 1.000
Pros: Has always hit in the minors, including .379/.437/.656 with 22 homers in 94 games between AA and AAA this season. On 9/2/06, belted a grand slam on the first pitch he faced in the majors. Slugged three HR in 20 AB in the MLB.
Cons: Already 25 years old. Limited defensively. Chronic bad back.
Comp: Robb Quinlan. Kouzmanoff and Quinlan are both RHB and corner INF with similar builds. Xlnt track records vs. LHP.
Outlook: Part-time 1B/3B/DH. Stuck behind Ryan Garko, Andy Marte, and Travis Hafner. Valuable player off the bench.
High School: Camarillo (Camarillo,CA)
Drafted: Selected by TB in 1st Round (1st overall) iin 2003
2006 STATS
     G  AB  R   H  2B  3B  HR  RBI  BB  SO  SB CS  AVG  OBP  SLG   OPS
AAA 86 342 50 108  22   4   8   59  15  65  22  4 .316 .341 .474  .814
MLB 13  53 10  21   4   1   2    8   1   7   1  0 .396 .411 .623 1.034
Pros: Five-tool talent. Has been the best player at every stop along the way. Baseball America Youth Player of the Year in 2002, #1 overall draft pick in 2003, TB MiL POY in 2004, Minor League POY in 2005. Turns 21 tomorrow.
Cons: Makeup. Was suspended for 50 games for throwing a bat at the home plate umpire following a called third strike while playing for the Durham Bulls of the International League. Poor plate discipline.
Comp: Tommy Davis, circa 1962-1963. Davis led the NL in batting average in back-to-back years at the age of 23 and 24. Similar speed and power. Young, however, has a much better arm than the former Dodger. Among current players, Young profiles somewhere between Jeff Francoeur and Vladimir Guerrero.
Outlook: Will be an All-Star as is. Improved plate discipline could spark talk of a Gary Sheffield-type HOF career.
High School: Anderson Highland (IN)
College: University of South Alabama
Drafted: Selected by MIN in 8th Round (242nd overall) in 2002 and by TOR in 3rd Round (83rd overall) in 2004
2006 STATS
     G  AB  R   H  2B  3B  HR  RBI  BB  SO  SB CS  AVG  OBP  SLG   OPS
AA  91 348 43 108  24   0  19   71  25  87   2  1 .310 .357 .543  .900
AAA 34 109 20  43   7   0   5   18  23  18   1  0 .394 .496 .596 1.093
MLB  7  21  3   9   4   0   1    4   2   4   0  0 .429 .478 .762 1.240
Pros: One of the best-hitting prospects in the TOR organization. Was named the Eastern League's MVP even though he spent the final month of the season with Syracuse (AAA). At the time of his promotion, he led the Eastern League with 19 HR, 71 RBI, 43 XBH, and a .543 SLG.
Cons: Defensively challenged.
Comp: Clint Hurdle. Among active players, downside is of a less athletic Todd Hollandsworth. Upside is Luis Gonzalez (sans 2001).
Outlook: Likely starting LF next year. Could hit .280-.300 with 15-20 (or more) HR by 2008.
High School: St. Raphael (RI)
College: University of North Carolina
Drafted: Selected by COL in 4th Round (110th overall) in 2004
2006 STATS
     G  AB  R   H  2B  3B  HR  RBI  BB  SO  SB CS  AVG  OBP  SLG   OPS
AA  44 156 38  50  10   2  11   26  24  26   1  0 .321 .418 .622 1.040
AAA 47 151 23  53  11   2   3   22  24  29   0  0 .351 .447 .510  .957
MLB  9  33  5   7   0   0   1    5   2   7   0  1 .212 .278 .303  .581
Pros: .300./400/.500 hitter with xlnt strike-zone judgment in college and the minors. Strong defensive skills. Positive intangibles. Hit the first HR of his MLB career on Tuesday.
Cons: Not much to complain about for a young catcher.
Comp: Russell Martin with less speed and slightly more power.
Outlook: The future is now. Has the potential to become the best catcher in COL history.
| Baseball Beat | September 12, 2006 |
Bush's League
In the best performance of his career, Dave Bush threw a complete-game, five-hit shutout against the Houston Astros on Sunday. In the process, the Milwaukee right-hander whiffed 10 without allowing a single walk. He faced a total of 31 batters, recording 23 of the 27 outs via Ks or groundballs.
Bush has now struck out 41 and walked only four in his last nine starts. After yielding 23 homers in his first 25 games, Bush hasn't given up a roundtripper in his last four. During this period, the 26-year-old with a plus curve has induced 45 GB and 19 FB while striking out 6.32 batters per 100 pitches - a rate that would place him second in the N.L. over a full season.
For the year, Bush is tied for third in the league in WHIP (1.16). Importantly, the man with the pinpoint control has lowered his BB/9 (from 1.91 to 1.70) and HR/9 (1.32 to 1.09) and raised his K/9 (4.95 to 7.27) by nearly 50% from one season to the next. His Defense Independent Pitching (3.88) and Fielding Independent Pitching (3.85) are considerably better than his ERA (4.44). In fact, his DIPS and FIP rank 11th and 13th, respectively, while the difference between his FIP and ERA is the fourth highest in the league.
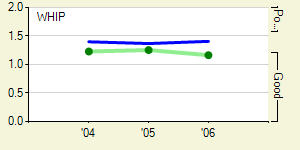
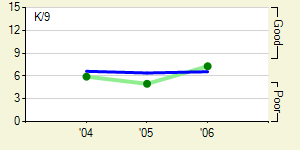
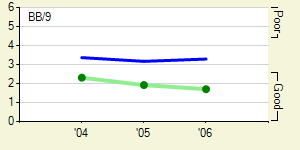
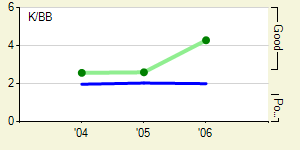
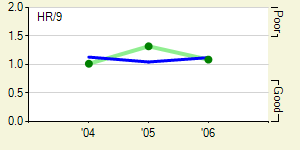
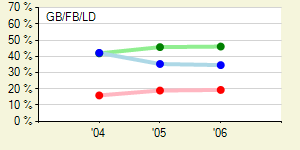
Source: FanGraphs
The three-year veteran is one of the most efficient pitchers in baseball. He has averaged just 14.5 pitches per inning, the fifth-lowest total in the majors. The top four? Greg Maddux, Roy Halladay, Chien-Ming Wang, and Brandon Webb.
Bush is arguably more like Chris Carpenter than not. They have two of the best Uncle Charlies in the game. Furthermore, these hurlers have similar K and BB rates. The main difference is that last year's Cy Young Award winner does an even better job of keeping the ball on the ground and in the ballpark. Nonetheless, Bush is more advanced than Carpenter at the same age. The latter didn't break out until his first year with the Cardinals when he was 29. Putting Bush in Carpenter's class may be a bit premature, but I believe it captures the younger hurler's upside. Based on his improved command and results of late, it wouldn't surprise me if Bush made a big push in narrowing whatever gap there exists within the next year.
A bird in the hand may be worth two in the bush. But a Bush in hand may be the best bet of 'em all.
| Baseball Beat | September 11, 2006 |
Leaving Las Vegas
Having spent the past couple days in Las Vegas, I'm heading home today. I'm not a huge fan of Vegas per se but can take the Entertainment Capital of the World in small doses from time to time.
Flying in the face of the adage, "What happens in Vegas stays in Vegas," I'm going to report on my long weekend in the largest U.S. city founded in the 20th century.
Rather than walking up and down The Strip looking for Pete Rose, my wife and I decided to spend virtually all of our time at The Venetian. I booked a room and purchased tickets to see Phantom of the Opera a couple of months ago. My tip of the week doesn't involve a sports bet. Instead, if you have a reason to be in Vegas, be sure to see the Phantom. The musical is a favorite of ours, having seen Andrew Lloyd Webber's hit three times when it was playing in Los Angeles (including all three Phantoms - Michael Crawford, Robert Guillaume, and Davis Gaines). In any event, I don't think you will be disappointed in the Vegas version of the longest running musical on Broadway.
Arriving at about the time of the Ohio State-Texas football game on Saturday evening, I decided to check out the Sports Book while my wife fed the slots. I learned that USC was 10/1 to win the Bowl Championship Series but was unable to place such a bet during the OSU-TEX game. When I returned the following morning, the line had dropped to 7/1. I passed. I'm not sure what USC did in the preceding 18 hours to get the linesmakers to reduce their odds, but I didn't think the Trojans were all that attractive at that price.
While everyone around me was placing bets on the NFL, I asked the gentleman at the window for updated lines on the American and National League pennants as well as the World Series. Here is the information directly from the pieces of thermal paper I was given:
ODDS TO WIN 2006 A.L. PENNANT
YANKEES     +120
RED SOX     50/1
WHITE SOX   +350
INDIANS    250/1
ANGELS      20/1
ATHLETICS   +500
RANGERS    100/1
ORIOLES      OFF
TWINS       +300
TIGERS      +200
BLUE JAYS   85/1
MARINERS   200/1
DEVIL RAYS   OFF
ROYALS       OFF
ODDS TO WIN 2006 N.L. PENNANT
CARDINALS   +400
BRAVES      90/1
ASTROS      +800
MARLINS     14/1
METS        EVEN
CUBS         OFF
PHILLIES    12/1
PADRES      12/1
GIANTS      12/1
DODGERS     +500
D'BACKS    100/1
BREWERS    150/1
NATIONALS    OFF
REDS        40/1
PIRATES      OFF
ROCKIES    150/1
ODDS TO WIN 2006 WORLD SERIES
YANKEES     +300
CARDINALS   12/1
RED SOX    125/1
WHITE SOX   +800
INDIANS    500/1
BRAVES     200/1
ASTROS      20/1
ANGELS      50/1
MARLINS     60/1
METS        +350
ATHLETICS   12/1
CUBS         OFF
PHILLIES    40/1
PADRES      30/1
GIANTS      35/1
DODGERS     12/1
RANGERS    250/1
ORIOLES      OFF
D'BACKS    250/1
TWINS       +700
TIGERS      +450
BLUE JAYS  200/1
BREWERS    350/1
MARINERS   500/1
NATIONALS    OFF
DEVIL RAYS   OFF
REDS       100/1
PIRATES      OFF
ROCKIES    350/1
ROYALS       OFF
Interestingly, the order of appearance was based on the opening lines last fall. The Yankees were the favorites back then and continue to be the team of choice as the season heads into the final three weeks. The Red Sox and Indians in the A.L. and the Braves and Cubs in the N.L. have been the biggest disappointments in 2006. On the other hand, the Twins and Tigers easily qualify as the greatest surprises of the season.
A few teams looked tempting to me even if the odds were a bit short across the board. To wit, if you add up all of the lines in the A.L., the book has about a 50% profit margin built in (assuming equal money is bet on all teams still on the board). At roughly 30%, the N.L. pennant and World Series odds aren't stacked against the bettor quite as much.
At -115, I actually bet the house on Jered Weaver and the Angels to beat Roy Halladay and the Blue Jays on Sunday. Just kidding. Besides, who needs two houses anyway? As it turned out, Weaver was the Angel of Music, striking out former Halo Troy Glaus with the bases loaded to escape a jam in the fifth. The rookie won his 11th game against just two losses as Los Angeles beat Toronto 4-3.
By the way, with respect to the title of this entry, Nicholas Cage is my least favorite "known" actor. My favorite? A tie for first between Robert De Niro and Edward Norton. If De Niro was the successor to Marlon Brando, then Norton is following in the former's footsteps in about the same manner. My first exposure to De Niro was as the dying MLB player in Bang the Drum Slowly (1973). Although De Niro would never pass for a big-league catcher, he made the part work in baseball's fictional version of Brian's Song (1971). Speaking of the latter film, to this day, I have never understood why Hollywood felt the need to do a remake. Give me James Caan and Billy Dee Williams anytime.
| Baseball Beat | September 09, 2006 |
Happy Days, Starring Ryan Howard
With another pair of home runs on Friday, Ryan Howard has now hit 56 this year and 80 for his career. According to Bill Deane, "no player had ever hit more than 76 home runs in his first 1,000 at bats" in the 130 years of major league baseball. Howard has 80 - and he still has 135 at-bats to go!
Deane's research uncovered the following all-time leaders:
80  Ryan Howard (in 865 at bats through 9/8/06)
76  Cecil Fielder
75  Jim Gentile
74  Rudy York
74  Ken Phelps
72  Eric Davis
71  Don Mincher
71  Bob Horner
71  Mark McGwire
68  Rob Deer
Interestingly, there is not one player who is in the Hall of Fame. One of the players not named Howard will be eligible for the first time in the coming election.
There are a lot of first basemen on the above list. Lots of slow first basemen. (Is that redundant?)
Excluding Eric Davis, the players in the group averaged 16 SB and 14 CS for their career. At the high end, Rob Deer stole 43 bases and Rudy York pilfered 38. At the low end, Howard has yet to steal a base while Cecil Fielder bagged two and Jim Gentile nabbed three.
There are a lot of feast or famine types, too. Howard has struck out 156 times in 514 at-bats this year. He has 269 SO in 865 AB for his career. The 26-year-old first baseman is on pace to K 179 times in 2006, which would tie him for 14th on the single-season list with. . .Rob Deer! The latter also had a season in which he struck out 186 times - good for sixth all-time.
STRIKEOUTS                 YEAR     SO     HR
1   Adam Dunn              2004    195     46
2   Bobby Bonds            1970    189     26
3   Jose Hernandez         2002    188     24
T4  Preston Wilson         2000    187     31
T4  Bobby Bonds            1969    187     32
6   Rob Deer               1987    186     28
T7  Jim Thome              2001    185     49
T7  Jose Hernandez         2001    185     25
T7  Pete Incaviglia        1986    185     30
T10 Jim Thome              2003    182     47
T10 Cecil Fielder          1990    182     51
12  Mo Vaughn              2000    181     36
13  Mike Schmidt           1975    180     38
14  Rob Deer               1986    179     33
15  Richie Sexson          2001    178     45
Source: Sabermetric Baseball Encyclopedia
Howard has blasted 24 HR in his last 154 AB. That works out to one every 6.4 AB. During this span, the native of St. Louis, Missouri has put up a batting line of .383/.513/.890 for an OPS of 1.402.
The slugger's home (.305/.409/.664) and road (.318/.402/.694) splits have been about the same for the season despite playing in hitter-friendly Citizens Bank. In fact, he has jerked exactly 28 HR at home and away in an almost identical number of AB (259 to 255, respectively).
If Howard has a weakness, it is definitely his ability to put the ball in play against left-handers. Although his overall production (.283/.344/.584) is quite acceptable vs. southpaws, he has struck out 60 times in 166 AB or once every 2.8x. Including BB (14) and HBP (2), Howard has still K'd in 33% of his plate appearances when facing portsiders. More alarming is the fact that he has a 4.3:1 ratio of SO to BB vs. LHP.
Howard's partner-in-crime, teammate Chase Utley, is maintaining a similar batting average against both lefties (.306) and righties (.302) but his home run prowess falls off the cliff vs. LHP (4 HR in 180 AB) as opposed to RHP (22 HR in 387 AB). As a team, the Phillies have had surprisingly good balance vs. left-handers (.256/.336/.442) and right-handers (.270/.348/.450). Bobby Abreu, who was traded to the New York Yankees in late July, had reverse splits with respect to AVG and SLG but had a slightly higher OBP vs. RHP due to an incredibly high BB rate (69 in 229 AB).
There are a lot of unanswered questions about Howard and the Phillies:
- Can he carry his team to a wild card berth in the final three weeks of the season?
- How many HR will he hit this year? How about for his career?
- *Will* Ryan Howard be named the National League's Most Valuable Player in 2006?
- *Should* Howard get the MVP nod?
- Who is Howard most like? Cecil Fielder? Jim Thome? Adam Dunn? David Ortiz? Or somebody else?
- If you were starting a team from scratch, would you take Howard or Utley?
- Can the Phillies compete for the NL East title next year?
While contemplating the answers to the above questions, be sure to do one thing: enjoy Ryan Howard for what he is - a slugger who is cranking home runs at a faster pace than anyone in the history of the game.
| Baseball Beat | September 08, 2006 |
Foto Friday #2
As a follow-up to the original Foto Friday three weeks ago, I am posting a black and white glossy from my Dad's files (which is date and time stamped on the back). As in the first contest, name the date, location, and subjects in the photo, as well as the special occasion.
Good luck!
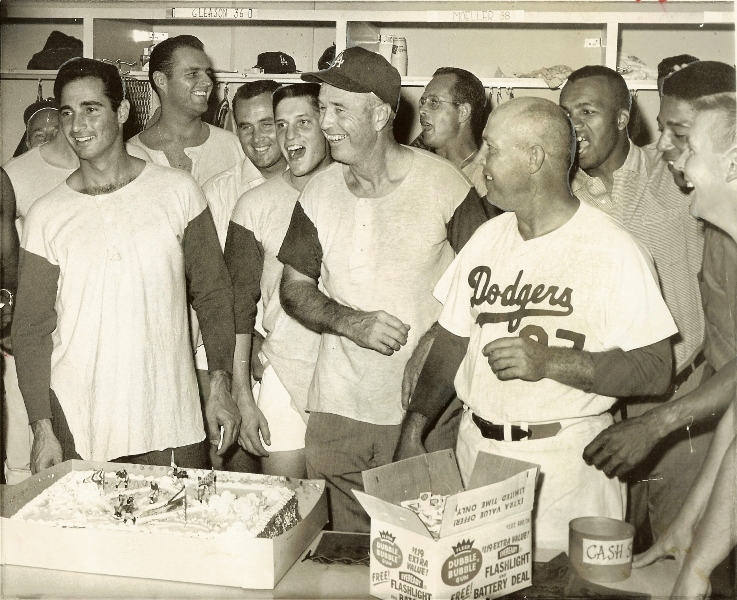
ANSWERS ADDED @ 10:00 p.m. PST
DATE: September 24, 1963.
LOCATION: Dodgers locker room at Dodger Stadium prior to an evening game vs. the New York Mets (which the Dodgers won 4-1).
SUBJECTS: (left to right) Sandy Koufax, Don Drysdale, Ron Perranoski, Pete Richert, manager Walt Alston, Lee Walls, coach Pete Reiser, Tommy Davis, Willie Davis, and Bob Miller.
LOCKERS IN BACKGROUND: Roy Gleason (#36) and Joe Moeller (#38). Gleason and Moeller were September call-ups. The former played eight games in his MLB career, all in September 1963. He had one at-bat and hit a double, retiring with a 1.000 batting average. Moeller did not appear in a game that year.
SPECIAL OCCASION: The Dodgers were celebrating the clinching of the N.L. pennant in 1963. The second-place St. Louis Cardinals lost to the Chicago Cubs earlier that day, thereby eliminating the Redbirds from contention.
| Designated Hitter | September 07, 2006 |
The Great Leap Forward
[Editor's note: This article was conceived a couple of weeks ago without knowledge that a similar article by Jim Baker was on the horizon at ESPN or the use of the same title would appear in Kevin Goldstein's Future Shock column yesterday at Baseball Prospectus.]
"Five-Year Plans lead not to pennants but only to new Five-Year Plans."
Bill Veeck
It's early September and the Tigers, Dodgers and even the Reds are in the midst of a pennant race. Granted, the Reds are puffing along like Homer Simpson chasing a donut across the kitchen floor, but they're within sniffing distance of something special, as are the Tigers and Dodgers.
Surprised?
Well, you should be. These improvements came much quicker than the pundits predicted. And with a division championship and perhaps a league championship - or even to dream BIG, a World Series Championship - comes entrance into a select club, a club full of legendary teams, forgotten teams, teams loaded with stars and some not so loaded. The one thing that ties all these teams together is that they were able to take the "Great Leap Forward" (GLF) in one season and traverse the terrain from losers to winners and in the process stun the baseball establishment. To gain entrance to this list a team must jump from a sub-.500 season to the championship of their respective league or division the next season.
In the past 99 non-interrupted seasons, 47 teams have achieved the feat, at least one in every decade. Of the 47 teams, some have climbed from the bottom of the standings, and still others have just leaped the short span that separated them from being a winning team. The advent of divisional play increased the number of teams who achieved the feat. Twenty eight of the 47 have occurred since 1969, and six of these teams have won it all. [corrected version]
So let's visit a few of them.
New Digs
YEAR  PLACE   W    L   PCT    GB
1958  7th     71   83  .461   21
1959  1st     88   68  .564   +2
"Naturally your ball club is always changing, and that's going to determine how you play your game."
Walter Alston
In the fall of 1957, the Dodgers announced they were heading west. Further shock was absorbed in Dodgerland when catcher Roy Campanella wrecked his car in January 1958, ending his career and paralyzing him for life. The move was marred with a major problem; the Pacific Coast League Park, Wrigley Field only held 21,000, not large enough for Walter O'Malley's taste. The team cut a deal to play in the Los Angeles Coliseum, a park that could hold 90K, but was flawed by a ridiculous distance of only 250 feet to left field (where a 40 foot screen was placed in hopes of legitimizing the field.) The centerfield fence was 425 feet away, and the right field line was 301 feet. Walter Alston said that all of Ebbets Field could be placed on the grass of the Coliseum, which despite its largeness was ill suited for the dimensions of a baseball diamond.
Aside from being in a transition year on the roster, Alston declared that the park was affecting the team's psyche and that the loss of Campanella denied the team of a key right-handed power hitter to exploit the short LF fence. Also affected was Don Drysdale, who shied away from his strength (pitching inside) to avoid the wall. This approach bloated Drysdale's early-season ERA, which didn't drop under 5.00 until August. Meanwhile, the rest of the team went south as well, and after 100 games the Dodgers sat at 46-54 and the locals were burning effigies of Alston in Ventura.
By season's end, it was the worst finish by a Dodger team since 1944.
Prior to the 1959 season the Dodgers attempted to take the field's quirks head on, first they redesigned the right field dimensions and targeted a hitter to attack the short LF wall. The man the Dodgers obtained was left-handed, opposite-field hitter Wally Moon. Moon's inside-out swing exploited the short distance to left, and his 14 HR's at the Coliseum led the team as did his robust .297/.397/.557 home. The league as a whole was weak that season and the Dodgers' 88 wins were the lowest for a champion since the Cubs won 89 in 1938. As with many turnarounds, the pitching was a major reason for success. The home ERA dropped 0.75 and the road 0.61. The man who carried the team on his back was Don Drysdale who logged 270 innings and a 2.97 home ERA. The age of Dodger pitching dominance essentially began that season. To wit, since 1959, the Dodgers team ERA is 0.42 above the league average, .031 above the next best team (Cardinals).
Amazing...
YEAR  PLACE   W     L    PCT    GB
1968  9th     73    89  .451    24
1969  1st    100    62  .617    +8
"The greatest mystery of the marvelous season is how 25 men playing an uncomplicated game with a bat and a ball can make a whole city happy."
Paul J. Montgomery: New York Times
In 1969, the GLF became mathematically more likely to occur when baseball went to 4 separate divisions. That season, the Braves jumped from a dead even .500 team to the NL West title. The Twins jumped from under .500 to the AL West championship. But no one saw the Mets winning it all, and to this day it is one of the greatest stories in the game.
But how'd they do it?
To start, they improved their hitting. 1968 was the year of the pitcher, but in New York the Mets were redefining inadequate with the stick. The Mets' .596 OPS ranks as second worst in the expansion era and 18th since 1900. The following season saw an increase in 44 hitting Win Shares for the Mets as Art Shamsky had a career year and Tommie Agee raised his OPS an impressive .244 points. The pair teamed with Cleon Jones to help the Mets lift their team OPS to .662.
                       ERA     IP      RSAA
Tom Seaver             2.21    273.1    40
Jerry Koosman          2.28    241      33
The Mets' real team strength was pitching, and they were able to boast of two aces (Tom Seaver & Jerry Koosman). With these aces and a strong bullpen, the Mets were one of two NL teams to have a team ERA below 3.00 that season. The team's pitching prowess was never more apparent then in the late months of the season when a 2.32 August ERA and a 2.15 September ERA propelled them past Chicago. The Cubs, who had led the Mets by 5 games early in September and trailed them by 8 games 1 month later, provided the yin of failure to the Mets yang of success; the Cubs' collapse was as amazing as the Mets rise from the ashes.
Feeling Lucky?
YEAR    PLACE   W    L    PCT   GB
1986    6th     71   91  .438   21
1987    1st     85   77  .525   +2
"The best you can hope for is to contend every year, play good baseball and put people in the stands. If you catch a break or two, and win a pennant every four or five years then that's pretty damn good."
Whitey Herzog
In 1987, the Cardinals experienced their first GLF. However, in the postseason they met their match in a team that was also experiencing a magic GLF year - the Minnesota Twins. (The Twins Franchise boasts five of the 35 GLF's in baseball history and three of the eight World Series wins). The Twins, who had finished last in the AL West in 1986, won the World Series in 1987 with the lowest winning percentage (.525) of any World Series champ ever. For the season, they raised their team OPS .003 points and dropped the team ERA down a mere .008 points. Good for only 11th in the league in team ERA and 8th in runs scored, The Twins were not a club that many should have been scared of, but instead a lucky team that took advantage of small things like having played out their schedule with the A's by early August and a timely late season surge in team ERA that helped hold off the Royals from achieving their very own GLF.
More a result of a weak division and timely pitching, the Twins GLF is perhaps more a miracle than the 1914 Braves achievement, more amazing then the 1969 Mets rise, and more shocking than "The shot heard 'round the world" way back in 1951. In 1991, the Twins performed the feat again when they matched up against the Braves (the team to jump the furthest in GLF history from a .401 winning % to a .580) Again, the Twins surprised the game when their pitching brought another championship.
Nasty
YEAR    PLACE   W    L    PCT   GB
1989    5th     75   87  .463   17
1990    1st     91   71  .562   +5
"We came back home 6 and 0 after sweeping the Astros and the Braves, and I remember standing in front of 55,000 screaming maniacs in Cincinnati and that made it even sweeter."
Joe Oliver
Prior to the divisional play the GLF was often an oddball event, one that was usually marked by outside forces, such as a war or rival league competition. Often the GLF is achieved by the emergence of a new manager. Twenty of the 47 of the GLF teams have had first- or second-year skippers, and 11 of the 47 were able to win the World Series, making their GLF an even sweeter ascent. The 1990 Reds are an example of a team that wallowed in turmoil one year and were reenergized by new blood, and were able to not only make the GLF, but also win it all. [corrected version]
On August 21, 1989, Pete Rose managed his last game for the Reds. Earlier that season, a rash of injuries (including an arm injury to Barry Larkin in a throwing contest at the All-Star game) further challenged the Reds, who were already immersed in a media circus that was following the Rose gambling investigation. The Reds quickly fell into the bottom of the division. By the end of August, Reds fans had seen enough of Scotti Madison, Jeff Richardson and Todd Benzinger, and they wouldn't be seeing much of Rose anymore. The gloom over the franchise was heavy, and change was needed. By early November, the Reds had a new General Manager (Bob Quinn) and a new manager (Lou Piniella). 1990 started askew for the Reds, since they started the season on the road for the first time since 1966. They also started the season in first place and didn't relinquish it for the rest of the season.
How'd they do it?
Staying healthy was the first trick. Adding players like Hal Morris, Glenn Braggs and Billy Hatcher helped as the season progressed. But the real key was pitching, a part of the game that isn't typically a strength in the Ohio River Valley. However, in 1990 the Reds pulled off one of their best pitching years in the post war era. Key to this transformation was an excellent relief ERA of 2.91, highlighted by Rob Dibble's 1.74 ERA and the now famous other "Nasty Boys."
                                ERA      IP       GS
1    Rob Dibble                 1.74     98        0
2    Randy Myers                2.08     86.2      0
3    Norm Charlton              2.74    154.1     16
The trio, along with rotation ace Jose Rijo, guided the Reds to the National League title, never leaving first place despite going 57-59 over the final 117 games of the season. Achieving this and the eventual World Series sweep was a tonic that the city needed, as it helped wash away the reality of Pete Rose's suspension and subsequent jail time. More importantly, it renewed the fans that were still shell shocked from the 1989 season.
The 2006 season brought new managers to the Reds, Tigers and Dodgers. The Dodgers and the Reds also brought in new GM's, men who obviously were not afraid to make moves to fix the problems they saw. Despite the weakened National League, the change of culture and a marked increase in team pitching has helped the Reds (until recently), while the Dodgers have found more offense and defense in their acquisitions and many of them have fueled their second-half surge. In Detroit, the infusion of young and veteran pitching plus the steady hand of Jim Leyland has been the key to the Tigers' run at the GLF. With one month left, all three of these franchises can be proud of what they have accomplished. But none will be totally satisfied unless they can finish the season on top. This would clearly place them in the family of those who have made the Great Leap Forward.
Note: Here is a complete listing of the GLF Teams since 1900.
Brian Erts is a Multimedia Developer, who lives in Portland, Oregon. He was introduced to the game by Ernie Harwell and known to try and mock Dick McAuliffe's stance back in the day. Enticed by Pete Rose's hairstyle, he jumped leagues and has been a Reds fan for the past 30 years. A member of SABR, he writes as much as his brain allows at Baseball Minutia, where you're likely to find more stuff about baseball that will probably never help you get a job.
| Baseball Beat | September 06, 2006 |
Boston's Theme
"If you get caught between the moon and New York City,
The best that you can do, the best that you can do, is finish second."
With apologies to Christopher Cross, the Boston Red Sox once again look as if they will finish behind their arch rivals in the American League East. If the division race plays out as expected, the New York Yankees will win their ninth AL East title in a row while the Sox will end up as the bridesmaid for a like number of consecutive years.
There are worse things in baseball than placing second every season. For confirmation, just ask the Tampa Bay Devil Rays. The cellar dwellers have been in the league for the same number of years as the Yanks and Sox have captured first and second, respectively. In these nine years (including 2006), the Devil Rays have finished last every time, save for 2004 when they. . .gasp, ended up in fourth, three games ahead of the Toronto Blue Jays.
Two-thousand-and-four is significant for one other minor reason. Boston just happened to win the World Series that year in a post-season for the ages. The Red Sox swept the then Anaheim Angels in the ALDS, then beat the Yanks four straight after falling behind three games to none in the ALCS. It's almost easy to forget for those of us who don't live, breathe, sleep, and eat the Sox that Boston had been outscored 32-16 in those three losses. The inhabitants of Fenway Park looked like they were dead in the water at that point. Nonetheless, the Red Sox came back and won four in a row, including back-to-back, extra-inning victories in games four and five. Then, in an almost anti-climatic World Series, the Sox got the brooms out and swept the St. Louis Cardinals, outscoring their counterparts 24-12 in the process.
Last year wasn't so bad either. . .well, at least with respect to the regular season. The Red Sox and Yankees finished with identical 95-67 records, leaving them in a tie for first. Or so some would like to think. But the reality of the matter is that New York was credited with the AL East title by virtue of winning their season series with the Red Sox ten to nine. Boston beat out the Cleveland Indians for the wild card by two games.
First, second. . .it doesn't really matter a whole lot as long as you qualify for the post-season. In fact, the World Series champ from 2002-2004 was none other the wild card. The Angels, Marlins, and, yes, the Red Sox all emerged victorious by sneaking into the playoffs and getting hot at the right time. It just so happened that there was an even hotter club last year. The Chicago White Sox led the American League with 99 victories, including five straight to end the campaign. The Pale Hose then swept the defending World Champs in the ALDS, beat the Angels four out of five in the ALCS, and completed their dream season by sweeping the Houston Astros in the Fall Classic.
Despite a disappointing post-season in 2005, the Red Sox were still the popular choice to win their division and even the league this year. At the All-Star break, Boston was three games in front of New York. A month later, the Red Sox were two games behind the Yankees. Fast forward to today and the team that has a bad case of "seconditis" finds itself eight games back of the Bronx Bombers. Moreover, Boston is six games behind in the wild card standings and looking as if it will be on the outside looking in come October for the first time since 2002.
EAST          W   L   PCT    GB   HOME   ROAD   RS   RA
NY Yankees   82  55  .599     -  43-25  39-30  776  646
Boston       75  64  .540   8.5  43-26  32-38  717  705
Toronto      72  67  .518  11.5  42-28  30-39  697  669
Baltimore    61  77  .442  21.5  36-34  25-43  661  759
Tampa Bay    55  84  .396  28.5  36-34  19-50  592  729
Interestingly, Boston's win-loss record is actually better than what one would expect, given its run differential. Having scored 717 runs and allowed 705, the team's Pythagorean record works out to approximately 71-68. The Yankees, by comparison, are playing right about in line with expectations based on runs scored and prevented.
Look, the Red Sox have nothing to be ashamed of - they just picked the wrong division. New York has won at least 87 games every year since 1996 and 95 or more in eight of the last nine. Boston, on the other hand, has garnered a minimum of 92 victories in six of the past eight seasons. The Red Sox have been good. Very good. The Yankees just have been great during this same period.
It hasn't always been this way though. Hard to believe but the Sox had a better record than the Yanks in 17 of the previous 30 seasons (1966-1995). The Bostonians also thoroughly dominated the New Yorkers from 1903-1918, topping them in 13 of those 16 campaigns while capturing five world championships. The real problem is what took place between those two stretches. Get this, from 1919-1965 - a span of 47 years - the Red Sox had the superior win total TWICE. Yep, Boston won more games in 1946 and 1948 and that was it. The Sox won the AL title in 1946 but lost to the Cardinals in the World Series in seven games.
The Red Sox have certainly closed the gap over the years but are finding it difficult to overcome their competitors to the south. If not for the World Series championship two years ago, I believe the disappointment in failing to win the division more often would be an even bigger deal.
This winter will likely be one of reflection from principal owner John Henry to president Larry Lucchino to general manager Theo Epstein to manager Terry Francona all the way down to the players. Sure, the team has suffered a number of injuries this season. But there have been a number of mistakes, too, including judgments in personnel and flawed in-game strategy. Who will be back and who won't will be part of the intrigue, yet the real question comes down to whether the Red Sox have what it takes to dethrone the Yankees - be it money, smarts, or players. Only time will tell.
| Baseball Beat | September 05, 2006 |
Back to School
If Labor Day has come and gone, it means only one thing for families with children. It's time to go back to school. Today and tomorrow will bring in the school year in many locales around the country.
My family's favorite "Back to School" story involves younger brother Gary. The following paragraph is excerpted from a column in the Long Beach Independent, Press-Telegram in 1969:
FARMED OUT: George Lederer covered the Dodgers for the Long Beach Independent, Press-Telegram from the time the team moved West until this season, when he moved to the Angels as director of promotions and public relations. It's understandable that his family has become baseball oriented. But Lederer was slightly shocked this past week when son Gary, 7, returned home from his first day in second grade and said: "Guess what? I've been traded." Upon further questioning, it was discovered Gary had been moved from the room in which he had been originally assigned to another room. Asked if the youngster had threatened to retire, Lederer replied: "He's been threatening to do that since kindergarten."
Gary turns 44 next week. Happy Birthday, Gary!
Speaking of going back to school, isn't there some way we could all chip in so ESPN's Joe Morgan would do just that? Well, I guess it wouldn't be going *back* to school in his case as I doubt he ever took any courses in broadcasting. You play 22 seasons in the big leagues and they just wind you up, give you a microphone, and let you have at it. I mean, Li'l Joe knows it all. If you don't think so, just ask him. Or maybe listen in to the following exchange between Morgan and play-by-play announcer Jon Miller in the Sunday night telecast of the Los Angeles Angels-Detroit Tigers game. It is vintage Morgan with Miller doing his best straight-man performance. (Thanks to my older brother Tom for transcribing it.)
Miller begins the seventh inning in full tease mode, setting up his sidekick:
Jon Miller: Back at Comerica Park in Detroit. Jon Miller, Joe Morgan, Bonnie Bernstein with you. 2-1 the Angels lead as we head into the late innings as Joel Zumaya, the young flame-throwing right hander comes into the game. And, Joe, you know, you were telling me all about this research you were doing, picking up all the background info and what not. And you told me there was like a huge event when Zumaya came into a game. So, we were all set. [Morgan chuckles] I had the camera on the gate and everything. It was like we were the only ones in the park who knew he was coming in.Joe Morgan:
They didn't know he was coming. Miller: They were running a commercial on the jumbo screen out there.
Morgan: They were listening to our interview with Leyland and he said he wanted one more from Ledezma.
[Meanwhile, Zumaya has thrown two fastballs, the first outside and the second on the outside corner. Miller then gets around to introducing Angels batter Erick Aybar as the third pitch creates a moderate, but audible, reaction from the crowd. To this point, there have been no radar readings on the ESPN graphics.]
Morgan: I guess they're saying he must have been close to 100. They're watching a radar gun on the scoreboard, I presume.
Miller: They listed it at 101, Joe. What happened to our radar gun? Did you forget to pack it?
[As Zumaya's fourth pitch is thrown far outside, the camera goes to the scoreboard display of the radar gun, showing 99.]
Morgan: Yeah, but I would trust mine better than I would the stadium's because they have a tendency to want to hype their players.
Miller: So, you think, what, he was only throwing 75?
Morgan: No, I don't think he was throwing 101. Maybe 100.
Miller: heh, heh, heh, heh
[The fifth pitch to Aybar is a strike as the count goes to three and two. For the first time, the ESPN graphic shows a radar reading: 99.]
[Speaking over each other:]
Miller: Here we go. We're getting 99.
Morgan: 99, see.
[The camera shows the scoreboard radar: 99.]
Miller: Now, they said 99 as well.
Morgan: OK.
[Miller briefly describes the action as the sixth pitch is thrown. Then Aybar swings and misses.]
Miller: 98 and out!
Morgan: One more thing. When the ball's down, it's not going to be as hard as when it's up. The high fastball is when you'll get the best reading. That was a good low fastball. This is more effective, but, see, it's down. When the pitch is down, you get more movement, yet you get less speed.
Miller: See, that looked like 98 to me. That got there pretty quickly.
[Jose Molina steps up, accompanied by some general commentary.]
Morgan: That's that old saying, Jon. I love hitting fastballs, but I like ice cream, too, but I don't like a gallon at a time. That's a little too much speed on the fastball.
Miller: But I've seen you - I've seen you eat a gallon of ice cream.
Morgan: hah, hah, hah, hah
[As Molina grounds to first base, the play is described and they go to a video review of Tigers starter Wilfedo Ledezma's performance. Reggie Willits steps into the box.]
Miller: [finishing up about Ledezma] . . . great change up, around 84, 85, 86 miles per hour. Now, here's a guy throwing 100.
[The first pitch to Willits registers 101 on the ESPN radar.]
Miller: 101. Now, we got him at 101, Joe.
[Scoreboard shows 101.]
Morgan: I would love . . . That can't be 101, right there, that last pitch. I'm just gonna tell you that.
Miller: Scoreboard got it . . .
Morgan: [talking over Miller] I don't care.
Miller: . . . we got it.
Morgan: That wasn't a 100 miles per hour fastball. I'd love to see Gary Sheffield hook up with him once just to see him swing.
[Second pitch to Willits is 100 on ESPN gun. The camera shows a close up of a fan wearing a t-shirt with the likeness of a highway speed limit sign "Zumaya Zone Speed Limit 102 MPH"]
Morgan: Now, there you go. Zumaya zone.
Miller: See, he gets him at 102.
Morgan: Yeah, I don't . . .
Miller: He feels like we're shorting him.
Morgan: Well, I've seen enough pitches to know 100 when I see it and 102.
Miller: When you played, they didn't have radar guns.
[Third pitch shows 103 on ESPN radar.]
Morgan: I've seen 102 and I've seen 100. I know the difference. [The camera is now trained on Miller and Morgan in the booth. Miller is laughing mildly.] As you know, we all know, they have different radar guns. Some of them are faster than others.
Miller: Yeah. [He smiles as the camera zooms in and produces a pronounced raising of his eyebrows.]
Morgan: I mean, I'm not saying he's not throwing 100, but that pitch you said was 101, wasn't 101. That was a sinker.
Miller: I was just reading the radar gun reading.
[Fourth pitch to Willits shows 100 on ESPN radar and is a fly ball to left field.]
Morgan: See, that might have been 100.
Miller: [tongue firmly in cheek] I thought that was only about 98.
[Miller describes the fly ball and the end of the inning.]
Now is that a beaut or what? If Morgan is unlikely to go back to (broadcasting) school, couldn't he at least threaten to retire - just like my brother Gary 37 years ago?
Update: Here is a video of the above conversation.
| Baseball Beat | September 03, 2006 |
Here, There, and Everywhere
With college football's opening day behind us (Is USC any good?), I'd like to direct readers to three sites for your Sunday and Monday reading pleasure.
All of this isn't meant as an argument for Thomas' place in Cooperstown - his status as a first-ballot Hall of Famer should not even be subject to debate.Anyone who sees him as anything less is hopelessly misguided.
Rather, it's a reminder of what a tremendous and rare performer we have in our midst. Thomas may be in the waning hours of his career, and that means it's time to reflect on what an amazing career it's been. Don't let his injuries or his occasional recalcitrance detract from that fact.
Frank Thomas has been a gift to baseball fans. He should be remembered for what he is: one of the greatest hitters ever to play the game.
Perry is also a Bert Blyleven-for-Hall-of-Fame supporter. If Dayn's not part of your regular reading, he should be. You can access his archives at Fox Sports here. Bookmark it and be sure to return often if your game is anything from prospects to astute analysis of MLB.
PA: What cap should Mike Piazza wear into the Hall of Fame and which one will he most likely enter with?RL: Boy, that is a tough call. It could go either way--and I'm not talking about the Marlins or Padres! New York fans may not agree with me, but I believe his best years were with the Dodgers. His career batting, on-base, and slugging averages are higher as a Dodger than as a Met. Furthermore, despite fewer plate appearances in L.A., Piazza generated more Runs Created Above Average (RCAA) and Runs Created Above Position (RCAP) as a Dodger (263 and 298, respectively) than a Met (177 and 235). Mike won five Silver Slugger awards for each team but picked up the N.L. Rookie of the Year in 1993 as a Dodger and finished in the top ten in the MVP voting five years in a row (including two seconds) out west, whereas he placed in the top ten in the MVP balloting just twice with a high of third as a Met.
There is one factor that might favor Piazza going in as a Met: the 2000 World Series. Mike played in the post-season twice with both teams but the only time he made it to the Fall Classic was as a Met. I would argue that he *should* go into the HOF as a Dodger, but I would not be surprised in the least if he winds up wearing a Mets cap. Mets fans really showed their appreciation earlier this month by giving Piazza multiple standing ovations when he returned to Shea Stadium as a Padre. Sadly, Mike never got that type of love in L.A. as his departure (via trade) was much more acrimonious than leaving N.Y. as a free agent.
[snip]
PA: Is OPS useful, or is Bill James right that SLG and OBP shouldn't be added?
RL: Yes and yes. OPS is quite useful in my book. It has an incredibly high correlation with runs scored. OPS is also intuitively easy to understand. I put a lot of value in both. But James is technically correct in that the two shouldn't be added together. In fact, multiplying OBP x SLG does an even better job of explaining runs scored. However, the difference isn't great enough to offset the simplicity in summing these two components.
Pat is doing a Q&A series with several writers, including David Pinto and Aaron Gleeman. Next up: J.C. Bradbury on Monday and Rob Neyer on Tuesday.
Quoting Forman directly from his B-R.com newsletter, player batting and pitching lines now end with a short note if the player was an All-Star or received MVP, CYA or RoY votes that year. And player debut information includes their performance in their debut game along with a link to the box score of that game (from the last 50 years or so).
Sean has also added handedness and place of birth reports, links to box scores and league standings, team schedules and head-to-head reports. In addition, B-R.com now offers franchise Hall of Fame registers, most games played with no post-season appearance and most rings won, updates to player birth and death dates, player transactions, player schools, and much, much, more, including a blog with in-depth information about the site.
Baseball-Reference.com depends upon page sponsorships to stay in business. If you use and like the site, please consider sponsoring a page to cover operating expenses and to allow Sean the ability to develop new features.
| Designated Hitter | September 01, 2006 |
Parity and the National League
I tend to think of parity in terms of the NFL. The definition I remember was that any team could beat any other team on a given Sunday. A more mathematical way of stating it would be all the teams have the same intrinsic winning percentage.
(Now, they don't have to be .500 clubs. The NL teams had a losing record to the AL in interleague play this year, indicating they all may be slightly less than .500 teams. But as long as they have about the same winning percentage, it works out the same. So for the purposes of this article, we'll assume parity exists when all teams have an intrinsic winning percentage of .500.)
What is an intrinsic winning percentage? It's the performance we'd expect from a team over a very large number of games. That is, if teams could play enough games to smooth out luck, the intrinsic winning percentage is the result we expect to see.
Now sometimes what looks like parity isn't. Here's a trivial example. Suppose all the teams in the NL played four games, and each team was 2-2. While that certainly looks like parity, it likely isn't. The binomial distribution tells us that after four games in a league in parity, we're most likely to get one team 4-0, four teams 3-1, six teams 2-2, four teams 1-3 and one team 0-4. Sixteen teams at 2-2 is a low probability event in a league in parity (.0004). So we can test for parity by looking at the distribution of wins in the league. So do we have a parity situation in the NL right now?
The average team in the NL has played about 132 games. If each team had the same intrinsic winning percentage, we'd expect there to be 13 teams with between 59 and 73 wins. In fact, there are 12 such teams in the NL. That's pretty close.
Another way of testing for parity is through simulations. There is such a simulator at Baseball Musings. Keep clicking enter, and you'll see very close wild card races, similar to what's going on now.
So we have two separate tests, each indicating that the National League is close to parity. Now, the Mets are really good and the Pirates and Cubs really bad, but otherwise the model holds. It's Pete Rozelle's dream.
Now, is this a good thing? On the pro side of the argument, lots of teams are in the race and that should keep more fans interested. People like to watch winners. If there's a high probability your team is going to lose on a regular basis, there's less of a chance of you going to the park (see Kansas City and Tampa Bay).
The downside is the quality of play, since there are no great teams. There's a certain artistry in watching a top flight club. I remember in the early 70's watching the Yankees play the Oakland A's. Oakland was a great team, winning three World Series in a row. The Yankees were getting better, but not the team they would become at the end of the decade. The A's came to town and dispatched New York easily. On defense, on offense, on the mound, the Athletics showed they were better. Teams could watch them play and learn how to go about playing baseball. They hit mistakes, they fielded cleanly, they made good pitches. They were winners and they knew it. Outside of the Mets this season, I don't think there's another National League team like that.
There's another kind of parity, one that we saw from the beginning of free agency to the end of the CBS TV contract and the strike. For lack of a better term, I'll call it revenue parity. The money from National TV was enough to even out the disparity in local revenue at that time. It was parity of opportunity vs. parity of outcome, if you will. All the teams had enough money to build a winner, and from 1978 to 1992 a different team won the World Series every year. The teams weren't evenly match, but the resources were.
This is the parity I prefer, where great teams are created, teams that others can strive to beat. Lousy teams come into being as well, teams from whose mistakes others can learn. It's tough to appreciate greatness without the corresponding failure. With revenue sharing and new National TV contracts, I hope we're getting there again.
David Pinto is the author of Baseball Musings. David worked for STATS, Inc. for eleven years, ten as the lead researcher for Baseball Tonight on ESPN. He's also hosted Baseball Tonight online at ESPN.com and is a former employee of Baseball Info Solutions.