Rich Lederer • Baseball Beat
Patrick Sullivan • Change-Up
Jeremy Greenhouse • Touching Bases
Dave Allen • F/X Visualizations
Sky Andrecheck • Behind the Scoreboard
Marc Hulet • Around the Minors
Al Doyle • Past Times
Retired Uniforms:
Bryan Smith • WTNY
Joe Sheehan • Command Post
Jeff Albert • The Batter's Eye
RSS Feed
Home
*Examining the Past, Present, and Future*
Lineup Card
Recent Entries
» Putting Together a Reality Team
» Historical Hall of Fame Vote Comparisons: 2012
» An All-Christmas Team
» The New-Look Angels
» John Denny: The Forgotten Cy Young Award Winner
» Money Isn't Everything
» What Would It Take to Hit .400 in the 21st Century?
» Halos Heaven
» Brandon McCarthy's Breakout Season
» Link-o-Rama
» Historical Hall of Fame Vote Comparisons: 2012
» An All-Christmas Team
» The New-Look Angels
» John Denny: The Forgotten Cy Young Award Winner
» Money Isn't Everything
» What Would It Take to Hit .400 in the 21st Century?
» Halos Heaven
» Brandon McCarthy's Breakout Season
» Link-o-Rama
Best of Baseball Beat
Abstracts From the Abstracts
1977 Baseball Abstract
1978 Baseball Abstract
1979 Baseball Abstract
1980 Baseball Abstract
1981 Baseball Abstract
1982 Baseball Abstract
1983 Baseball Abstract
1984 Baseball Abstract
1985 Baseball Abstract
1986 Baseball Abstract
1987 Baseball Abstract
1988 Baseball Abstract
1978 Baseball Abstract
1979 Baseball Abstract
1980 Baseball Abstract
1981 Baseball Abstract
1982 Baseball Abstract
1983 Baseball Abstract
1984 Baseball Abstract
1985 Baseball Abstract
1986 Baseball Abstract
1987 Baseball Abstract
1988 Baseball Abstract
Bert Blyleven Series
Meeting Up and Hanging Out with Bert
The Results Are In And...
Aficionado Heavily Invested in Blyleven
Latest on Blyleven's Chances for the HOF
The Internet Zealot Responds
400 Down and 5 to Go...
Bert Be Home By Eleven?
Blyleven's Forgotten Season (1973)
HeyMan, Your Comments Don't Hold Water
The Waiting is the Hardest Part
Another Addition to the Blyleven Series
Search for the Truth
As Dominant as His HOF Contemporaries
Listen, Buster
A Larger Step for Blyleven
Answering the Naysayers (Part Two)
Another Small Step for Blyleven
Q&A: Blyleven on the Twins
The Majority Rules, Right?
It's All Dutch to Some
The Hall of Fame Case for Bert Blyleven
Q&A: Blyleven on Felix Hernandez
Clemens Rocketing Up Charts
Poz: An Interview With a KC Star
A HOF Chat with Tracy Ringolsby
Up Close and Personal
A Peek Into the Mind of a HOF Voter
Answering the Naysayers
It's That Time of the Year (Again)
"If Cooperstown is Calling..."
The Bert Alert
One Small Step for Blyleven...
Only the Lonely
Exclusive Interviews
Lee Sinins
Alex Belth
David Pinto
Will Carroll
Mike Carminati
Aaron Gleeman
Joe Sheehan
Jay Jaffe
Jeff Peek
Tracy Ringolsby
Joe Posnanski
Bill James Part I, II, III
Jon Lalonde
Chuck Tiffany
Dayn Perry
Fay Vincent
Nate Silver
Alex Belth
David Pinto
Will Carroll
Mike Carminati
Aaron Gleeman
Joe Sheehan
Jay Jaffe
Jeff Peek
Tracy Ringolsby
Joe Posnanski
Bill James Part I, II, III
Jon Lalonde
Chuck Tiffany
Dayn Perry
Fay Vincent
Nate Silver
Bullpen
Rich Lederer
The Odd Couple (with Alex Belth)
The MostUnder Over Underrated Player in Baseball (with Brian Gunn)
Three Wise Men (roundtable by Alex Belth)
Infrequently Asked Questions (interview with Matt Welch)
Interview (Orioles Think Tank)
Bernie and the Yanks (Bronx Banter)
Hope and Faith: How the LAA Win the World Series (Baseball Prospectus)
NL West (The Soul of Baseball)
Greatest Living Hitter? (Sports Illustrated)
Roundtable: 2008 HOF Ballot (Armchair GM)
The Most
Three Wise Men (roundtable by Alex Belth)
Infrequently Asked Questions (interview with Matt Welch)
Interview (Orioles Think Tank)
Bernie and the Yanks (Bronx Banter)
Hope and Faith: How the LAA Win the World Series (Baseball Prospectus)
NL West (The Soul of Baseball)
Greatest Living Hitter? (Sports Illustrated)
Roundtable: 2008 HOF Ballot (Armchair GM)
Patrick Sullivan
Designated Hitters
David Bromberg (Q&A: John Denny)
Mark Armour (H. Killebrew and Versatility)
Joe Lederer (Soundtrack of a Prospect)
David Bromberg (Clemente's Autograph)
David Bromberg (Woody Fryman)
D. Baumstein (WAR Against Age: Pitchers)
Doug Baumstein (The WAR Against Age)
Doug Baumstein (A Lifetime on the Road)
John Fraser (Pick Six)
Mark Armour (How to Score More Runs?)
Bill Parker (What Opening Day Tells Us)
Stan Opdyke (Pat Rispole)
Chris Jaffe (Evaluating Baseball's Mgrs)
Stan Opdyke (Baseball Radio in NYC, 1953)
A. Nathan (Performance of Baseball Bats)
Michael Weddell (Edgar Martinez/HOF)
Jon Weisman (100 Things Dodgers Fans...)
Stan Opdyke (Connie Mack and Vin Scully)
Eric Walker (Evaluating Run Production)
Brent Mayne (The Intangibles of Catching)
Chris Moore (Best Fastballs in Baseball)
Dave Baldwin (The Batter’s Brain)
Shawn Haviland (Ivy League to MLB)
Larry Granillo (Walking Off)
Rob Iracane (Solo HR Won't Break You)
Tommy Bennett (Charm of AM Radio)
Harry Pavlidis (Johan Santana's Fast Start)
John Walsh (WAR and Remembrance)
Eric Walker (Precisely Inaccurate)
Bob Timmermann (As They See 'Em)
Geoff Young (Unicycles and Delusions)
Baseball Analysis at Tufts (Groundballers)
Baseball Analysis at Tufts (GB Out Rates)
G. Rybarczyk ('09 Hit Tracker Projections)
Joe Lederer (Curt Schilling/HoF)
Conor Gallagher (Hall of Fallacies)
Chris Green (Jim Rice, HoF, the Numbers)
Shawn Hoffman (Baseball's Bear Mkt?)
Paul Anthony (Manny Syndrome)
Ross Roley (World Series Odds)
B. Timmermann (Catcher's Interference)
R.J. Anderson (Waiting the Hardest Part)
Maury Brown (Cubs, MLB, and Cuban...)
Myron Logan (Dee-Fense, Dee-Fense)
Craig Calcaterra (Frivolity, Part I, Part II)
Chad Finn (Ode to Baseball Cards)
David Cameron (Mariners Foibles)
Chris Dial (Chipper Jones)
Pat Lederer (Memory Lane)
David Appelman (Clutch Pitching)
Bob Rittner (DH)
Jonathan Mayo (Roger Clemens)
Lisa Winston (My Son-in-Law...)
Russ McQueen (The Yellow Hammer)
Bob Rittner (I'm OK, You're OK)
Mark Armour (In Defense of the HOF)
Pat Jordan (Friends)
Dan Levitt (Analysis of Terry Ryan)
Doug Baumstein (Trading Econ 101)
Ross Roley (Runner's Reluctance II)
Ross Roley (Runner's Reluctance I)
Mark Armour (No-Longer Lovable Sox)
Bruce Regal (Stealthy and Wise)
Brian Gunn (Roid Monster)
Current/McEvoy (Value of the SB)
John Rickert (Sinister Thefts)
Nate Silver (Sabermetrics)
David Vincent (Home Run Production)
Joe P. Sheehan (Enhanced Gameday II)
Mark Armour (An Ode to Sport)
David Gassko (All-Time Worm Burners)
Joe P. Sheehan (Enhanced Gameday)
John Walsh (When Titans Clash)
Fox/Williams (Quantifying Coaches II)
Fox/Williams (Quantifying Coaches I)
Jacob Luft (Bull Durham Rant)
Chad Finn (Strat-O-Matic)
Lisa Winston (Rotisserie Baseball)
Dave Studeman (Baseball Stats)
Steve Treder (Roger Craig)
Marc Normandin (Jeff Bagwell)
D. Appelman (Expanding Strike Zone)
Jeff Sackmann (Worst MiL Defenders)
Jeff Sackmann (Best MiL Defenders)
Maxwell Kates (Van Lingle Mungo)
David Appelman (Pitch Location)
Kent Bonham (Danny Ray Herrera)
Glenn Stout (Two Baseball Poems)
Bruce Regal (The Challenge Round)
Mark Lamster (Barry & Ty)
Geoff Young (NL West)
Tom Lederer (The Ryan Express)
Brian Erts (Great Leap Forward)
David Pinto (Parity and the N.L.)
Jacob Luft (Fathers and Daughters)
Jamey Newberg (Pete's Sake)
Jeff Albert (A. Jones Swing Analysis)
Jeff Albert (A-Rod Swing Analysis)
Keith Law (Death, Taxes, and Waivers)
Peter Abraham (Tales of Torre Tales)
Larry Borowsky (Let 'er Rip II)
Dan Levitt (Empirical Analysis of Bunting)
Jonah Keri (If I Met Warren Cromartie...)
Bob Klapisch (War Stories)
Bob Timmermann (John F. Kennedy HS)
Kent Bonham (Aluminum Adjustments)
Al Doyle (More Than Superstars)
Ross Roley (Instant Replay)
David Vincent (Barry Bonds Homers)
Chad Finn (Our Favorite Obscurities)
Bill Deane (1979 NL MVP)
Mark Armour (Rise/Fall of Artificial Turf)
Jeff Angus (Wally Moon Camp)
David Berri (Money and Baseball)
Larry Borowsky (Baseball w/o the #s)
Derek Zumsteg (The Irrational Market)
David Regan (Free Agent Contracts)
Peter Schmuck (Steroids and the HOF)
David Appelman (Pitchers, Pitch by Pitch)
Dan Fox (Swinging, Taking, Fouling, Etc)
Patrick Sullivan (Study of NYY CF/BOS LF)
Will Leitch (Baseball Journalism)
Jeff Sullivan (Pitcher Release Points)
Steve Treder ('69-'70 Giants)
Maury Brown (Charlie Finley)
John Brattain (Bob Johnson)
Bob Klapisch (The Case for Bert Blyleven)
Jeff Peek (Pride and Prejudice)
Dayn Perry (Bert and Warren)
Rob Neyer (If Don Sutton Was Great...)
Lisa Winston (Minor League Memories)
Alex Belth (Otis Redding Was Right)
David Cameron (Long Live the King)
Jeff Angus (Baserunning Study)
Bert Blyleven (Baseball Playoffs)
Boyd Nation (Not a Prospect List)
James Click (Batters-Baserunners Study)
Jeff Shaw (Why I Love Baseball)
David Gassko (BIP/BFP Fielding Study)
Jay Jaffe (Milwaukee Sausage Race)
Jamey Newberg (Remember When)
Bob Klapisch (Press Box to the Mound)
Dan Levitt (Predictive Value of BB)
David Vincent (Official Scorer)
Jon Weisman (Rick Monday)
Larry Borowsky (Let 'er Rip)
Will Carroll (Fictional Short Story)
Bob Timmermann (Japanese Baseball)
Cyril Morong (Best Pitching Seasons)
Sean Forman (Monte Carlo Win-Loss)
Brian Gunn (My Little Blue Book)
Joe Lederer (My Dad and Baseball)
Bill Deane (Bob Gibson, 1968)
Mark Armour (1977 Yankees)
Darren Viola (Retrosheet)
David Pinto (RFK)
Dayn Perry (Brave Heart)
Matt Welch (Dave Hansen)
Kevin Kernan (Jack McKeon)
Tom Lederer (Dodgers Road Trip)
Steve Lombardi (Slider)
Studes (Picturing Baseball)
Mike Carminati (Luck of the Drawl)
Eric Neel (Vin Scully)
J.C. Bradbury (Leo Mazzone)
John Sickels (Bill James)
Search Baseball Analysts
Archives
By Category:
Around the Majors Content Only
Around the Minors Content Only
Baseball Beat Content Only
Baseball Beat/Change-Up Content Only
Baseball Beat/WTNY Content Only
Behind the Scoreboard Content Only
Change-Up Content Only
Change-Up/Around the Majors Content Only
Command Post Content Only
Crunching the Numbers Content Only
Designated Hitter Content Only
F/X Visualizations Content Only
Past Times Content Only
Saber Talk Content Only
The Batter's Eye Content Only
Touching Bases Content Only
Weekend Blog Content Only
WTNY Content Only
By Month:
February 2012
January 2012
December 2011
October 2011
September 2011
August 2011
July 2011
June 2011
May 2011
April 2011
March 2011
February 2011
January 2011
December 2010
November 2010
October 2010
September 2010
August 2010
July 2010
June 2010
May 2010
April 2010
March 2010
February 2010
January 2010
December 2009
November 2009
October 2009
September 2009
August 2009
July 2009
June 2009
May 2009
April 2009
March 2009
February 2009
January 2009
December 2008
November 2008
October 2008
September 2008
August 2008
July 2008
June 2008
May 2008
April 2008
March 2008
February 2008
January 2008
December 2007
November 2007
October 2007
September 2007
August 2007
July 2007
June 2007
May 2007
April 2007
March 2007
February 2007
January 2007
December 2006
November 2006
October 2006
September 2006
August 2006
July 2006
June 2006
May 2006
April 2006
March 2006
February 2006
January 2006
December 2005
November 2005
October 2005
September 2005
August 2005
July 2005
June 2005
May 2005
April 2005
March 2005
February 2005
January 2005
December 2004
November 2004
October 2004
September 2004
August 2004
July 2004
June 2004
May 2004
April 2004
March 2004
February 2004
January 2004
December 2003
November 2003
October 2003
September 2003
August 2003
July 2003
June 2003
Reference
Organizational Stats
Arizona Diamondbacks Bat / Pitch
Atlanta Braves Bat / Pitch
Baltimore Orioles Bat / Pitch
Boston Red Sox Bat / Pitch
Chicago Cubs Bat / Pitch
Chicago White Sox Bat / Pitch
Cincinnati Reds Bat / Pitch
Cleveland Indians Bat / Pitch
Colorado Rockies Bat / Pitch
Detroit Tigers Bat / Pitch
Florida Marlins Bat / Pitch
Houston Astros Bat / Pitch
Kansas City Royals Bat / Pitch
Los Angeles Angels Bat / Pitch
Los Angeles Dodgers Bat / Pitch
Milwaukee Brewers Bat / Pitch
Minnesota Twins Bat / Pitch
New York Mets Bat / Pitch
New York Yankees Bat / Pitch
Oakland Athletics Bat / Pitch
Philadelphia Phillies Bat / Pitch
Pittsburgh Pirates Bat / Pitch
St. Louis Cardinals Bat / Pitch
San Diego Padres Bat / Pitch
San Francisco Giants Bat / Pitch
Seattle Mariners Bat / Pitch
Tampa Bay Devil Rays Bat / Pitch
Texas Rangers Bat / Pitch
Toronto Blue Jays Bat / Pitch
Washington Nationals Bat / Pitch
All-Star Links
Official Websites
News and Notes
Baseball News Blog
Baseball Newstand
ESPN Baseball
Fox Sports Baseball
Pro Sports Daily
Roto World
The Roto Times
USA Today Baseball
Baseball Newstand
ESPN Baseball
Fox Sports Baseball
Pro Sports Daily
Roto World
The Roto Times
USA Today Baseball
Reference and Analysis
Baseball Almanac
Baseball America
Baseball Archive
Baseball Contracts
Baseball Cube
Baseball Graphs
Baseball Library
Baseball Musings Player Database
Baseball Page
Baseball Primer
Baseball Prospectus
Baseball Reference
Baseball Statistics
Baseball Truth
Boxscore Central
Diamond Mind Baseball
Doug's Stats
FanGraphs
Fast Balls (pitchfx catalog)
Hardball Dollars
Hardball Times
Hit Tracker
Retrosheet
Rotobase/Rotoblog
Stat Corner
STATS
Tango on Baseball
Yahoo Sports MLB
Web Gems
Bill James Primer
Sabermetric Manifesto (Grabiner)
Pitching and Defense (McCracken)
Pitching and Defense (Tippett)
Transactions Primer (Neyer)
Baseball Stats (Batter's Box)
Prospect Report (Cameron)
Pitcher Workloads (Sheehan)
Goodbye to Old Baseball Ideas (Rickey)
Sabermetric Manifesto (Grabiner)
Pitching and Defense (McCracken)
Pitching and Defense (Tippett)
Transactions Primer (Neyer)
Baseball Stats (Batter's Box)
Prospect Report (Cameron)
Pitcher Workloads (Sheehan)
Goodbye to Old Baseball Ideas (Rickey)
Columnists
Baseball Blogs
Around the Majors
Athletics Nation
Baseball Crank
Baseball Musings
Baseball-Reference Blog
Batter's Box
Big League Stew
Bronx Banter
Catfish Stew
Cub Town
Dan Agonistes
Dodger Thoughts
DRays Bay
Ducksnorts
Futility Infielder
Halos Heaven
Inside the Rockies
It Might Be Dangerous
Knuckle Curve
LoHud Yankees Blog
Lookout Landing
Management by Baseball
Metaforian
Metsgeek
Mike's Baseball Rants
Only Baseball Matters
Redbird Nation
Red Reporter
Sabernomics (Braves)
Seth Speaks
ShysterBall
6-4-2 (Angels/Dodgers)
The Book
TheCubdom
The Cutting Edge
The House That Dewey Built
The View From The Bleachers
Tiger Blog
U.S.S. Mariner
Viva El Birdos
Where's Kernan
Minor Leagues
Arizona Fall League
BA Player Finder
Cal Leaguers
Jamey Newberg
JDM's Scoresheet Baseball
Minor League Baseball
Minor League Park Factors
Minor League Splits
No Pepper
Sickels' Minor League Ball
Warm October Nights
BA Player Finder
Cal Leaguers
Jamey Newberg
JDM's Scoresheet Baseball
Minor League Baseball
Minor League Park Factors
Minor League Splits
No Pepper
Sickels' Minor League Ball
Warm October Nights
Amateur
Boyd's World (College)
Cape Cod Baseball League
College Baseball Blog
College Baseball Insider
Collegiate Baseball Newspaper
College Splits
College Splits Blog
Dirtbags Baseball (Long Beach State)
NCAA Baseball
NCBWA
Team One Baseball (High School)
Texas A&M & Baseball
Cape Cod Baseball League
College Baseball Blog
College Baseball Insider
Collegiate Baseball Newspaper
College Splits
College Splits Blog
Dirtbags Baseball (Long Beach State)
NCAA Baseball
NCBWA
Team One Baseball (High School)
Texas A&M & Baseball
Historical
Cuban Baseball
House of David
Jim "Mudcat" Grant's Web Page
Negro League Baseball Players Assoc
Negro Leagues Baseball Museum
1919 Black Sox
Pacific Coast League
Philadelphia Athletics Historical Society
Shoeless Joe Jackson Society
SABR-L Archives
Walter O'Malley
House of David
Jim "Mudcat" Grant's Web Page
Negro League Baseball Players Assoc
Negro Leagues Baseball Museum
1919 Black Sox
Pacific Coast League
Philadelphia Athletics Historical Society
Shoeless Joe Jackson Society
SABR-L Archives
Walter O'Malley
Miscellaneous
Forums
Credits
Ticket Center
Tickets to Baseball -
Premium Red Sox Tickets - Tickets to Marlins Games - Cardinals Game Tickets - NY Yankee Tickets - Tickets Oakland Athletics - Dallas Cowboys Tickets - Arizona Cardinals Tickets - Tickets Seattle Seahawks - Buffalo Bills Tickets Online - Tickets to Dolphins Football
Buy Boston Red Sox tickets,
Philadelphia Phillies tix,
NY Yankees tickets,
NY Mets tickets, and
MLB All Star game tickets at ABC tickets
Not sure where to find the best online sportsbooks? Start your search with PlayersJet.
Get deals at SportsMemorabilia.com on baseball apparel, including Phillies jerseys and more for adults and children.
Shop the largest selection baseball equipment on sale at Sports Unlimited. Check out tons of baseball gloves, youth baseball gloves and catchers gear from Rawlings, Wilson, Nike & Under Armour.
2011 Draft Order
Courtesy of Baseball America
First-Round:
 1. Pirates (57-105)
 2. Mariners (61-101)
 3. Diamondbacks (65-97)
 4. Orioles (66-96)
 5. Royals (67-95)
 6. Nationals (69-93)
 7. Diamondbacks (for B. Loux)
 8. Indians (69-93)
 9. Cubs (75-87)
10. Padres (for Karsten Whitson)
11. Astros (76-86)
12. Brewers (77-85)
13. Mets (79-83)
14. Marlins (80-82)
15. Brewers (for Dylan Covey)
16. Dodgers (80-82)
17. Angels (80-82)
18. Athletics (81-81)
19. Red Sox (from DET for Martinez)
20. Rockies (83-79)
21. Blue Jays (85-77)
22. Cardinals (86-76)
23. Nationals (from CWS for Dunn)
24. Rays (from BOS for Crawford)
25. Padres (90-72)
26. Red Sox (from TEX for Beltre)
27. Reds (91-71)
28. Braves (91-71)
29. Giants (92-70)
30. Twins (94-68)
31. Rays (from NYY for Soriano)
32. Rays (96-66)
33. Rangers (from PHI for Lee)
Supplemental First Round:
34. Nationals (Dunn)
35. Blue Jays (Downs)
36. Red Sox (Martinez)
37. Rangers (Lee)
38. Rays (Crawford)
39. Phillies (Werth)
40. Red Sox (Beltre)
41. Rays (Soriano)
42. Rays (Balfour)
43. Diamondbacks (LaRoche)
44. Mets (Feliciano)
45. Rockies (Dotel)
46. Blue Jays (Buck)
47. White Sox (Putz)
48. Padres (Garland)
49. Giants (Uribe)
50. Twins (Hudson)
51. Yankees (Vazquez)
52. Rays (Benoit)
53. Blue Jays (Olivo)
54. Padres (Torrealba)
55. Twins (Crain)
56. Rays (Choate)
57. Blue Jays (Gregg)
58. Padres (Correia)
59. Rays (Hawpe)
| Touching Bases | October 28, 2010 |
Three-Ball Strategies
The folks at Basketball Prospectus recently found that three-balls were undervalued. Does that mean that there's been an inefficiency in the accepted market inefficiency? I don't know. Commenter Guy also had ideas for how to study three-ball strategies.
Some batters never swing on 3-0 counts. Take the difference between the average 3-0 swing zone and strike zone.
 Overall, only 6% of those pitches are swung at. Of those 6%, I estimate 17% would be called balls. If batters never swung at 3-0, that means they would walk about 36% of the time on that pitch, as opposed to the current rate of 35%. Sounds negligible, and it's likely that if batters are able to do damage on 3-0, then they're right to swing at times.
Upon swinging, batters hit .390 with a .760 slugging average. That does not include the 54% of swings that either miss or result in fouls, thereby bringing the count to 3-1. Using linear weights, I estimate that batters currently add about a run per 100 pitches by swinging on 3-0 rather than always taking. I don't think the pure strategy "always take 3-0" is correct. That said, I also think that there are some pitchers who are so bad at throwing strikes or hitters so bad at hitting that such a strategy would be viable.
Along similar lines, batters are more likely to swing at full-count pitches than 2-2 pitches. What if we were to map out 2-2 strategies on 3-2 pitches? Well, I'm not entirely sure this makes sense, but I tried to do it.
I made the payoffs on 2-2 counts equal to those on 3-2 counts, then predicted run value while controlling for batter/pitcher handedness and pitch type. Mapping both predictions onto the 3-2 distribution, I found the overall difference in expected output to be similar to the difference I found between never swinging on 3-0 and the current strategy. Again, the current strategy proved more optimal. Unfortunately, graphing the differences didn't produce anything intelligible.
Decades of baseball evolution have brought us to the point where radical changes to current strategies can mostly be ruled out. But achieving equilibrium is a complicated process, and we would be doing the game of baseball and baseball players a disservice to think that there is no room for improvement. I'm more comfortable saying that batters might swing too often on three-ball counts than I am suggesting what their strategy should be.
| Baseball Beat | October 27, 2010 |
How We See the 2010 World Series
The 2010 World Series is upon us. Every baseball fan knows the main storyline: The Texas Rangers will appear in the World Series for the first time while the San Francisco Giants will be looking to win their first World Series since moving to the west coast in 1958.
If anyone had the Texas-San Francisco exacta at any point during the regular season, much less before the season, then you're either delusional, lucky, or in the wrong business. Send me your ticket from Las Vegas as proof. Copies not allowed.
The staff at Baseball Analysts weigh in below with our comments and predictions.
Rich: I believe Texas has the edge. The Rangers beat Tampa Bay and New York, the two best teams in baseball in the Division and Championship Series. The Rangers also have the best starting pitcher (Cliff Lee) and the best hitter (Josh Hamilton). San Francisco has strong pitching depth and home-field advantage, but the offense leaves a lot to be desired. I don't see Cody Ross, as an example, hitting three home runs in the World Series, like he did in the NLCS. While most World Series go six or seven games, I'll go out on a limb and say Texas in five with Lee winning the first game and the finale.
Jeremy: I think the difference between the American League and National League is understated. The Rangers are the better team. However, the Giants have home-field advantage. In my opinion, the National League has a natural edge in the World Series, given the difference in quality of pitcher hitting. I worry that Ron Washington will badly mismanage games in a National League park, for example failing to understand that C.J. Wilson, Colby Lewis, and Tommy Hunter should not pitch past the fifth or sixth innings. Still, the difference in talent between the two clubs appears overwhelming, so I'll take the Rangers in six.
Dave: I have to agree with Rich and Jeremy: the Rangers have the clear advantage in the lineup, and probably an advantage in starting pitching (mostly thanks to Lee), but the Giants have the advantage in bullpen (and Bruce Bochy seems more adept at playoff-bullpen management) and home-field advantage. The pluses for the Rangers outweigh those for the Giants, and so the Rangers are, rightly, slight favorites for the series (the betting line suggest they win it about 55% of the time). I will go with the Rangers in seven.
Rich: Do I hear Rangers in eight? What will it be, Sully?
Sully: I don't see the talent discrepancy between the two clubs as "overwhelming" as Jeremy. I think Andres Torres, Aubrey Huff, and Buster Posey are only a bit worse in aggregate than Hamilton, Nelson Cruz, and Ian Kinsler, the core position players for each team. I can't see much difference between the rotations and, like Dave, I think the Giants have a bullpen edge.
I'll go out on my own here and take the Giants. First, the home crowds at AT&T Park have been amazing and I think San Francisco really feeds off of it. Home field will be key, and I think particularly so this evening. The Phillies came into the NLCS with an air of infallibility thanks in large part to Roy Halladay's Division Series heroics. The Rangers are a complete team, but there's a similar dynamic at play with Lee. If the Giants take Game One like they did against Philadelphia, and then have Matt Cain, Jonathan Sanchez, and Madison Bumgarner lined up for Wilson, Lewis and Hunter, there's a clear path to victory for them. So I say Tim Lincecum carries the Giants tonight, and San Francisco goes on to win in six.
| Change-Up | October 26, 2010 |
The Jays Gamble on a Neophyte
John Farrell was named Manager of the Toronto Blue Jays yesterday, a great choice for a team with a young and promising pitching staff looking to compete in the brutal American League East. Sports Illustrated’s Jon Heyman felt differently, however, and took to his Twitter feed with the following:
new #bluejays manager farrell well-regarded but theyre gambling on neophyte in division with francona, girardi, showalter, maddon Jon Heyman
SI_JonHeyman
We have been tough on Heyman here at times, I admit it. We think he’s been pretty obtuse in his belief that Bert Blyleven doesn’t belong in Cooperstown, and Rich wrote the definitive Heyman takedown over his Scott Boras servitude. With this in mind, I want to try and be cordial towards Heyman despite my frustration with his reaction to Farrell's hiring.
First, there was Heyman's use of the term “neophyte.” A “neophyte” is a novice. One example someone used when I asked whether others on Twitter considered the term derogatory was that Meg Whitman is a political “neophyte”. That sounds right to me. It’s not necessarily derogatory in that light. It’s just a fact. But when applied to someone like Farrell, who has spent his life in baseball, I think it’s misapplied.
In the narrowest sense, yes, Farrell is a “neophyte” as it relates to Major League Baseball Managing. But he appeared in eight separate Major League seasons as a pitcher, so he’s capable of relating to the day-to-day life of a Big Leaguer. Players value that. He also spent six years heading up the Cleveland Indians’ Player Development organization from 2001 to 2006, a time during which they turned out some awfully good players. He’s an excellent evaluator, and has a track record of getting the most out of talent. Finally, in his latest gig, he’s been pitching coach for a team that has won 375 games in four seasons. Player, front office guy, coach. I’m not sure you could come up with a more seasoned professional to take the reins. As far as his overall baseball experience is concerned, he’s anything but a "neophyte".
My wife thought I was nitpicking by isolating that word, however. “A neophyte is someone who is new to something, and Farrell is new to Managing,” she reminded me. Fine, that’s true. We’ll set that aside. She then said, “it’s the world ‘gambling’ that would offend me if I were Farrell.”
As I think more about it, it’s a fantastic point. Who are the better, more experienced Managerial options for Toronto? Would Art Howe or Don Baylor or Jimy Williams or Mike Hargrove be better? And if so, why? Joe Girardi had all of 162 games of Manager experience before the Yankees hired him, and he ended up leading New York to a World Series title last year. That seemed to work out ok. So where exactly is the “gamble”? Who's to say Bobby Valentine wouldn't be a "gamble"?
I think Farrell's the perfect choice for the Jays, a team whose future hinges on its young pitching staff's continued improvement. Shaun Marcum, Ricky Romero, Brett Cecil, Brandon Morrow and Marc Rzepczynski will average 26 years old for the 2011 season. Kyle Drabek, Zach Stewart and Brad Mills aren't far behind. Farrell will be able to lean on all of his professional skills - his MLB player experience, player development expertise and pitching coach track record - to help strengthen Toronto's biggest asset, its young pitching.
There may be others like Farrell around the league, but I can’t imagine a better extended apprenticeship than the one Farrell has served leading up to this moment in his career. I don’t mean to pick on Heyman, but I found his remarks to be unfair. Farrell has too much experience in baseball to be considered a “neophyte” (except in the narrowest sense), and his hiring is both sound and the byproduct of a long and drawn-out process by the Jays. They’ve done their diligence. If only Heyman would do the same prior to taking to his keyboard.
| Baseball Beat | October 22, 2010 |
News and Views: Brandon Inge
News: The Tigers re-signed 3B Brandon Inge to a 2-year, $11.5 million contract, with an option for 2013. Inge would have been a free agent.
Views: What am I missing here? Most of Inge's value is tied to his defensive prowess at third base. However, his advanced fielding metrics have been in a steady decline since 2006 when he led the majors in Ultimate Zone Rating at 19.0. It fell to 11.2 in 2007, 4.1 in 2008 (when he also played C and CF), 6.6 in 2009, and 3.1 in 2010. While Inge is still above average, the trend is not your friend here. Nor is his age. He turns 34 next May.
Over the past five years, Inge has hit .236/.313/.405 with an OPS+ of 88. His OPS+ has only exceeded 100 one time — 109 in 2004 during his age-27 season. He strikes out at an alarmingly high rate at about once every four trips to the plate. The righthanded hitter has never hit for a high average on balls in play (career rate of .285 with a peak of .316 in 2004). His baserunning is nothing to write home about. To wit, he made 10 outs on the bases last year, excluding the three times he was caught stealing in seven attempts.
Shake it all up and it's difficult for me to see why Inge is worthy of such a contract. At best, Inge may add two wins above a replacement player. At $3M per win, he could be worth $6M (vs. an average annual salary of $5.75M). If you want to ascribe a higher value per win, be my guest. Either way, I believe the downside risk is greater than the upside reward. If Inge continues to lose range in the field, he could actually become a liability at the hot corner. In that case, Inge would be nothing more than a platoon player and pinch hitter (career .267/.342/.465 vs. LHP) and perhaps a positive influence on the bench and in the clubhouse.
The contract is not a disaster, but it's one that leaves me nonplussed.
For Joe Pawlikowski's take, be sure to read his analysis of Inge's contract at FanGraphs.
| Touching Bases | October 21, 2010 |
Count Oddities
I've been doing a lot of thinking about game theory and how it relates to pitch selection and swing rates. I finally decided to run some numbers to find the baselines for swinging, pitch selection, and strike throwing based on the ball/strike count.
The rate at which pitchers throw strikes aligns perfectly with the average run expectancy in each count. However, batters' swing rates are not likewise dictated by run expectancy. Instead, batters like to swing more the deeper they get in the count.
Batters swing 74% of the time on full counts, by far the highest percentage of any count. At the other end, they swing at only 6% of 3-0 pitches.
Pitchers simply aren't good enough at throwing strikes on 3-0 to warrant batters mixing their strategy between swinging and taking. Pitchers only hit the zone about 60% of the time 3-0, whereas they would need to hit it at least 70% of the time to make batters consider swinging I believe. Strangely, batters are eight times as likely to swing on 3-1 as they do 3-0. I think straight takes on 3-1 might be a viable strategy at times.
We already know and accept that batter's don't act completely rationally on the first pitch. Some players just don't like swinging 0-0, so they don't, and that's that. Yet they up their swing rates from 27% on 0-0 to 40% on 1-0, even though pitchers have similar pitch selections and locations and more importantly, the reward of taking is greater.
There is a 50/50 split between fastballs and off-speed pitches on 0-2 and 1-2 counts. Naturally, fastballs are thrown in the zone at a higher frequency. What's odd is that batters swing at more off-speed pitches on those counts.
The big question is, How much do batters learn from pitch to pitch? The deeper into his repertoire a pitcher must go, the greater the advantage is for the batter. There are probably advantages to taking pitches besides drawing balls. I don't think this applies to the full count, though, which might be why the swing rate is too damn high.
Here's the relevant data. I should note that I used the same strike zone model for all counts, which means that more pitches would be called strikes on 3-0 than listed as being in the zone, and fewer strikes would be called than listed on 0-2.
| Count | FB% | Zone% | Swing% |
|---|---|---|---|
| 3-0 | 95.2% | 58.5% | 6.6% |
| 3-1 | 85.0% | 57.5% | 54.3% |
| 2-0 | 81.6% | 55.3% | 40.0% |
| 3-2 | 69.4% | 54.0% | 73.7% |
| 2-1 | 68.5% | 52.6% | 58.7% |
| 1-0 | 68.6% | 52.0% | 40.7% |
| 0-0 | 68.1% | 50.2% | 26.7% |
| 1-1 | 56.4% | 46.5% | 52.9% |
| 2-2 | 54.0% | 43.8% | 65.4% |
| 0-1 | 55.3% | 41.8% | 46.1% |
| 1-2 | 49.2% | 35.7% | 57.8% |
| 0-2 | 52.4% | 29.0% | 49.4% |
| Change-Up | October 20, 2010 |
Best Position Player Postseason Performances Since 2000, WPA Edition
At Red Sox Beacon last weekend, I decided to see where J.D. Drew's performance in Game 5 of the 2008 ALCS stood on the all-time great Red Sox postseason performances. The metric I chose was Win Probability Added, and thanks to Baseball Reference's Play Index tool, I was able to sort through the best (and worst) games this way.
I thought I would do it here, but limit our search to the five best hitting performances by WPA since 2000. There are no World Series games on here, which sort of screams for a follow-up post as the Fall Classic is set to start. I will also take a look at pitcher performances. There are some forgotten names listed (Erubiel Durazo!), and some no-doubter Hall-of-Famers as well, a dynamic that makes the playoffs so much fun. Sure, Josh Hamilton was great last night. But Bengie Molina!
Top Five Hitting Performances
5) Adam Kennedy, 10-13-02, ALCS Game 5, .634 WPA
The Minnesota Twins had taken the first game of the series, but Anaheim ripped off three straight wins in Games Two through Four. Game Five was big because the series was set to head back to the Metrodome, a difficult place to win. This was the first playoff series for the Twins since the 1991 World Series, when the Atlanta Braves took a 3-2 lead back to the Homerdome. The same had happened in the 1987 World Series, too. St. Louis showed up in Minneapolis for Game 6 with a 3-2 lead. We know how those ended.
So, even though momentum was Anaheim's, they wanted to wrap things up in California. In the top of the 7th, the Twins took a 5-3 lead over the Halos, and according to B-Ref, had an 80% win expectancy at this point. In the bottom of the 7th, things would change. Adam Kennedy, having already homered twice, would hit his third of the game off of youngster Johan Santana, a three-run shot that would give the Angels the lead for good. They would tack on, oh, another seven runs that inning, and win the game 13-5.
4) Alex Rodriguez, 10-6-04, ALDS Game 2, .684 WPA
Again with the Twins! A-Rod gets a lot of heat for laying an egg in Games 4-7 of the 2004 ALCS, but the Yanks never would have had a chance to participate if not for his performance in the ALDS that season. He hit .421/.476/.737 in the 2004 Division Series, and came up huge in Game 2 after the Yanks had dropped the first game of the series. Incidentally, Rodriguez lays claim to games 4, 6 and 11 on the list of best (most clutch) postseason performances since 2000.
Game 2 was a back-and-forth affair, and things looked bleak for the Yanks after the Twins took a 6-5 lead in the top of the 12th. Mariano Rivera had already pitched. In the bottom of the 12th, Ron Gardenhire pushed things a bit by bringing Joe Nathan back for a 3rd inning of work. Nathan got John Olerud swinging to lead off the 12th but then issued walks to Miguel Cairo and Derek Jeter on 9 pitches. Gardenhire stuck with Nathan though, now 46 pitches into his outing, and A-Rod made him pay with a double that plated Cairo and sent Jeter to third. After an intentional pass to Gary Sheffield, J.C. Romero relieved Nathan but Hideki Matsui hit a sac fly on the very first pitch from the southpaw.
Rodriguez finished the game 4-6 with a home run, the key double, three RBI and two runs.
3) Erubiel Durazo, 10-1-03, ALDS Game 1, .701 WPA
I remember this one well. Durazo was a beast, going 2-4 with 3 RBI, 2 walks and a run scored. His double in the 3rd came off of Pedro Martinez, and plated two runs to give the A's a 2-1 lead. In the 9th inning, Grady Little panicked. Byung-Hyun Kim started the inning with a 4-3 lead and induced a fly ball out. He then walked Billy McMillon and hit Eric Byrnes with a pitch.
Well this was when Kim still had the 2001 Yankee Stadium meltdown choker stigma, and the Boston fans were tough on him when he blew a few games down the stretch. Still, he had been an excellent pitcher and was a perfectly viable option for the Red Sox in this spot. He demonstrated as much on the next batter, getting Mark Ellis to strike out. Two outs.
Now the panic. Little decided with two outs to go and get Kim and bring in lefty Alan Embree. Problem was, Kim was no worse than Embree against lefties and even worse, Durazo had a reverse split! He hit lefties better! Embree entered nonetheless, Durazo singled and the game was tied. In the 12th, Durazo worked a lead-off walk and the A's went on to win 5-4.
2) Ivan Rodriguez, 10-13-03, NLDS Game 3, .717 WPA
This one's not too hard to figure out. The Marlins won the game 4-3 and Pudge had all four RBI. The first two came on a home run in the opening frame off of Kirk Rueter. The last two, the game-winners, came with the Giants ahead by a run with two outs and the bases loaded. Pudge singled off of Tim Worrell to give the Fish a 2-1 Series lead.
1) Jimmy Rollins, 10-19-09, NLCS Game 4, .753 WPA
One moment can change everything in the playoffs. To get a sense for the drama in the bottom of the 9th in Game Four of last year's NLCS, scroll to the 13:45 mark or so of this video. When Rollins came to bat, his team had an 83% chance of losing, and that's before you factor how good Jonathan Broxton had been for the Dodgers in 2009.
But Rollins squared up a fastball, ripped it into the right-center field gap, two runs scored and the Phillies would go on to qualify for the World Series for the second time in as many seasons. In the first inning, Rollins had singled and scored on a Ryan Howard home run.
| Baseball Beat | October 19, 2010 |
You're the Manager
OK, you're Joe Girardi. I'd say you're Joe Girardi for a day but, if it was for a day only, you might think differently. So let's just say you're Joe Girardi, the manager of the New York Yankees. You know, the team that is down two games to one in the best-of-four American League Championship Series.
Your club beat the Texas Rangers in the first game by coming back from a 5-0 deficit to score six unanswered runs in the seventh and eighth innings to win 6-5 on the road. You got trounced in the second game of the series, 7-2.
No problem. You did what you had to do. Your team split on the road. Two games down, a maximum of five to go with three of them at home. You've got the AL West champions right where you want them. Except for one thing. You now have to face Cliff Lee. Yes, that Cliff Lee. The guy who knows his way around New York in terms of both the city and your lineup. The 2008 AL Cy Young Award winner throws eight scoreless innings on Monday night, allowing only two hits and one walk while striking out 13 batters in an 8-0 shutout.
Lee improved his postseason record to 7-0 with a 1.26 ERA in eight starts. The southpaw has now beaten the Yankees three times in October, including twice as the ace of the Philadelphia Phillies in the 2009 World Series. He is on one of the best runs in the history of the postseason. Not known as a strikeout pitcher, Lee is the first pitcher to whiff 10 or more batters three consecutive times in the same postseason and is now tied for the lead with Bob Gibson and Randy Johnson with five career postseason games of at least 10 Ks.
With Lee perfectly positioned to start the finale of this series, "the Yankees probably need to win this series in six games and avoid a Game 7" or so says Andrew Marchand. I can't say that I disagree.
As a result, one could argue that the Yankees cannot afford to lose another game in this series. It's not that Lee can't be beaten. It's just that you don't want to go into Game 7 having to beat Lee. To the credit of the Rangers, this is exactly why management traded for him in July. It's hard to believe that someone who has gone 48-25 with a 2.98 ERA and a 5.6 K/BB in the past three regular seasons and 7-0 with a 1.26 ERA and 9.6 K/BB in the past two postseasons has played for four teams (CLE, PHI, SEA, and TEX) during this stretch.
That brings us to Game 4. Your team is now down two games to one. Do you go with AJ Burnett as previously announced or do you pitch CC Sabathia on three days' rest? If you opt for Sabathia, that means you either have to ask both Phil Hughes and Andy Pettitte to pitch on short rest or stick AJ in there for Game 5 on Wednesday or Game 6 on Friday. Should you decide on Burnett for Tuesday night, then you won't be able to start CC three times or in the final game vs. Lee in what would be an epic battle of two of the best lefthanders in baseball.
Here are the facts with respect to Burnett:
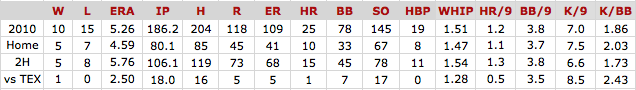
Remember, you're Joe Girardi. It's your call. Do you stick with Burnett in Game 4 or do you change it up? Sabathia threw just 93 pitches in Game 1. He is 3-1 with a 1.01 ERA and extraordinarily strong peripherals working on three days' rest during the regular season throughout his career. Moreover, don't forget the fact that you asked CC to pitch on short rest against the Los Angeles Angels in the ALCS last year and it worked out pretty darn well. He won both games, fashioning a line of 16-9-2-2-3-12. The big guy started Game 1 on Friday and Game 4 on Tuesday. Sound familiar?
What will it be, Joe?
| Touching Bases | October 16, 2010 |
A Look at Optimal Swing Rates
There's been some discussion over at The Book Blog on whether or not batters swing too often at full count pitches. For me, this line of thought started when I read Dave Allen's research that showed that batters are more likely to swing 3-2 than 2-2. I'll get back to Dave's work in a moment, but first an aside on my theoretical understanding of the situation.
In equilibrium, pitchers want to throw strikes at such a rate that batters are indifferent toward swinging. The way I've figured it, and I really might have figured it wrong, that means that on 0-2 and 1-2 counts, pitchers want to throw at least 80% balls, while on 3-0 and 3-1 counts, they want to throw at least 70% strikes. In turn, that means that batters want to swing at 0-2 and 1-2 counts when they are at least 20% sure that a pitch is a strike and take on 3-0 and 3-1 when they are at least 30% sure that a pitch is a ball. The benefit of taking a pitch on 3-2 is obviously much greater than it is on 2-2, as the reward of a ball is a walk. What I've found unique about the 3-2 count, and again, my theoretical prediction might be off, is that it is the only hitter's count that dictates that pitchers throw more balls than strikes and that batters swing at pitches that are probably balls.
Back to Dave's work, because it turns out that he did a followup study asking, "do batters swing too often in a full count?" Dave showed the difference in value between taking a pitch and swinging at a pitch based on pitch location. The area in which batters are just as well off swinging as they are if they were to take should also be the area where batters swing 50% of the time. However, on a full count, batters swing 75% of the time in that area, according to Dave's research. I really like his methodology, and to me it is proof that batters do swing too often on full counts. Unless I'm missing some flaw, which is why I tried to repeat Dave's process at the player level.
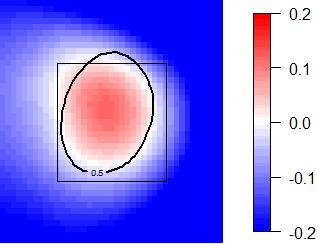
The first player I tried was Albert Pujols, and he proved to be a good test case.
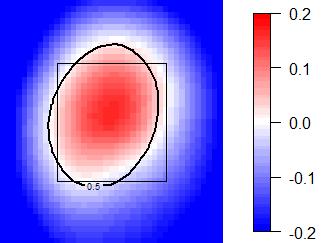
Red means swing, blue means take, and white means indifference. The black contour line estimates the player's 50% swing rate.
The best hitter in the game seems to know exactly when he should be indecisive, so to speak.
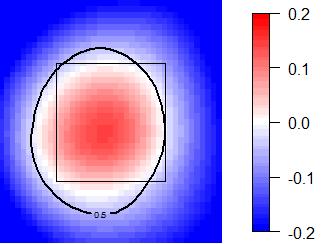
My hope was that this type of analysis would vindicate guys like Vladimir Guerrero and Brett Gardner, above average hitters with unique hitting styles. Unfortunately, the data indicate that Vlad swings at too many pitches out of the zone and Gardner at too few. It's easy to say that Jeff Francoeur should learn to take a pitch, but to offer such advice to Vlad is tricky, and probably wrong. And if umpires didn't call such an absurd strike zone to Gardner, it's possible that he would be correct to swing so little.
One hitter who never swings, and correctly so, is Elvis Andrus. He must recognize his historic lack of power.
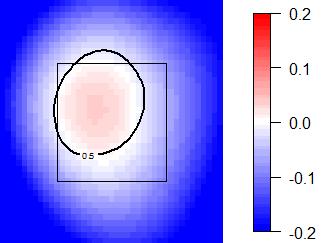
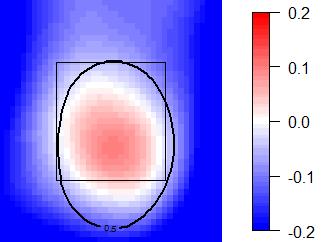
And J.D. Drew knows where his bread is buttered.
It was difficult to find evidence of any batter who should swing at pitches out of the strike zone. I was hoping that would be the case with Vlad. Miguel Cabrera is one such batter who might have good reason to be a free swinger.
And lastly, Colby Rasmus is the most extreme low-ball swinger in the league, and this type of graph shows that he's also a low-ball hitter.
I like the type of information that these charts display. Using it as a prescriptive tool to say how often a specific batter should swing would be wrong, but I continue to think that on a league-wide level, batters swing too often on full counts.
| Touching Bases | October 14, 2010 |
Two Potential Reasons for Lower Scoring
This year, scoring is down by almost a quarter of a run per game.
At the beginning of the season, Mike Fast showed that fastball velocities were rising. FanGraphs data indicates a continued upward trend. I spotted only two pitchers from 2009 who threw 96 MPH and were out of the league in 2010 (Juan Morillo and Tyler Yates), while there were about a dozen rookies who came in throwing that (Aroldis Chapman, Jordan Walden, Stephen Strasburg, Dan Cortes, Andrew Cashner, Alexi Ogando, Joe Bisenius, Jhan Martinez, Chris Sale, Greg Holland, Sergio Santos, Gregory Infante). I suppose it's normal for there to be more hard-throwing rookies entering the league than hard-throwing veterans retiring. Still, only 30 pitchers averaged 96, and that nearly half of them were rookies sounds exceptional.
Also, I checked to see whether the strike zone has changed. Red zones indicate a higher rate of called strikes, and blue lower.
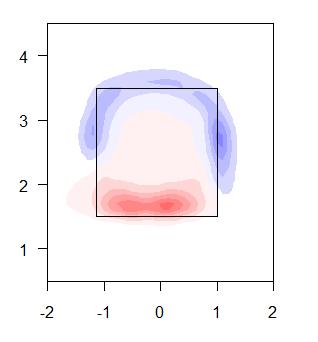
I'm not too confident in drawing any conclusions from this, but it appears that umpires might have gotten better at calling strikes on pitches at the knees.
| Change-Up | October 13, 2010 |
Comparing the Rangers & Yankees
Cliff Lee and the Texas Rangers dropped the Tampa Bay Rays in Game 5 of the American League Division Series last night, setting up an enticing matchup with the defending World Series champions.
The Rangers and Yankees respective run prevention units profile similarly. Each features a dominant ace, capable depth rounding out their rotations, and good bullpens where all roads lead to their shut-down Closers. Defensively, both teams are good, too. The Yankees probably have the outfield advantage with Curtis Granderson and Brett Gardner patrolling, while the Rangers enjoy the infield edge thanks to their stud middle infield of Elvis Andrus and Ian Kinsler.
Offensively, it’s an entirely different story. They’re both very good with the bats – the Yanks led the AL in runs and the Rangers were fourth – but they go about their work at the plate in different styles. Lineup anchors for Texas like Mike Young, Josh Hamilton and Kinsler all see fewer pitchers per plate appearance than the league average. And of course, one of the great all-time free swingers in baseball history is Vladimir Guerrero. He’s in the mix too, although he has struggled over the second half of the season. Only the Baltimore Orioles saw fewer pitchers per plate appearance than the AL West champions.
On the other hand, New York saw the most pitchers per plate appearances in the American League other than Boston or Tampa Bay. It’s really only Robinson Cano that will hack away for the Bombers, and it’s not like his approach needs tweaking. He makes it work to the tune of MVP candidacy. Even more troubling for Rangers pitching, not only can the Yanks get ahead in the count, but they hit better than any other team in baseball once there.
This contrast in hitting styles is where the ALCS will hinge. Right off the bat, the Yanks will have a chance to leverage their patience. C.J. Wilson had a nice year, but his traditional numbers outpace his peripherals. The biggest blemish on Wilson’s performance record is his high walk rate, 4.10 per 9 innings. He also throws his first pitch for a strike and induces swinging strikes on pitches outside the zone at a below average rate. Grooving the first one and forcing otherwise patient batters to chase bad balls are two tools the high-walk pitcher can turn to, but Wilson seems to have neither. The Yankees will be a test for him.
As you might imagine, Wilson struggled in three starts against New York this season, pitching just 14.1 innings and walking 5.65 guys per 9 innings. But Wilson’s smart (follow @str8edgeracer on twitter), and he doubtless knows his weakness and his opponent’s strength. In Tampa Bay for Game 2 of the ALDS, he limited his walk total to just two while facing a team even more patient than the Yankees. He’s a good pitcher with great make-up. I’m not counting him out by a long shot.
While Wilson could be a problem for Texas, Lee is the prototype to combat a patient offense. He walks nobody, and pounds the zone with pitches that move every which way. He goes in Game 3 for the Rangers at Yankee Stadium.
For the Yankees, their pitchers will have some latitude to expand the zone thanks to the Rangers’ approach. This is a risky game, however, because the Rangers righty-stacked lineup will crush mistakes from lefties. Vlad, Nelson Cruz, Kinsler and Young all murder southpaws, and if C.C. Sabathia or Andy Pettitte decide they want to get Texas to chase and they don’t bite, the Rangers’ righties should see some nice pitches to hit.
The pitcher-batter match-ups in this series should be terrific, a study in Game Theory from start to finish. I give the edge to the Yankees because of their superior approach at the plate. But it’s close, and if Sabathia and Pettitte are off even the slightest bit, it’s not hard to envision a scenario in which the Yankees head home to face Cliff Lee down 2-0. Watch individual pitches, match-ups, strategies and yes, umpiring within each plate appearance. It promises to be fascinating, and it's where this series will be won.
| Baseball Beat | October 12, 2010 |
Pitching in on the Division Championship Series
With a no-hitter and four shutouts in the League Division Series and no team scoring more than seven runs in any single game, it seems as if pitching has dominated the postseason thus far. Perhaps it has but not to the extent that I thought before checking the numbers.
Through the first 14 games, the eight teams have combined to score 89 runs, an average of 6.36 per game. Don't get me wrong. Run prevention is down from the regular season. Way down. As in 38 percent down. But runs per game are off just 19 percent vs. the 2009 LDS and only 11 percent excluding the two contests in Colorado. Meaningful but not off the charts.
Like this year, no team scored more than seven runs in any LDS last fall. John Lackey and Darren Oliver combined to throw the lone shutout in Game One against Boston. In 2010, Oliver once again was part of a combined shutout, completing the final 2 1/3 innings to preserve the 6-0 whitewash for C.J. Wilson and Darren O'Day in Game Two against Tampa Bay.
Roy Halladay threw the most talked-about game of all, tossing only the second no-hitter in the history of the postseason. Halladay walked one and struck out eight while facing only one batter over the minimum as Philadelphia beat Cincinnati to set the tone in Game One in what became a three-game sweep. Teammate Cole Hamels closed out the series with another shutout, allowing just five hits and no walks while fanning nine Reds.
As impressive as those shutouts were, Tim Lincecum pitched the most dominating game of them all in terms of Game Score. The Freak pitched a complete-game shutout, striking out 14 while giving up only two hits and one walk.
Both Halladay and Lincecum will be well rested when they square off in Game One of the NLCS on Saturday. Neither starter will have thrown a pitch in competition in at least nine days. At first blush, it would seem as if the long rest may benefit the 5-foot-11, 170-pound Lincecum slightly more than the 6-6, 230-pound Halladay. However, it should be noted that the latter threw his no-no nine days after his final regular season start, which incidentally was a two-hit, no-walk, complete-game shutout on longer than normal rest.
Over in the ALCS, the New York Yankees have to be loving the fact that Cliff Lee and David Price will be facing one another tonight, meaning neither starter is likely to face the Bronx Bombers until Game Three on Monday. That said, the winner of tonight's rubber match will have their ace ready to go in the finale on four days' rest should the ALCS go the distance.
But first things first as there will be no ALCS for the losing team tonight. Only golf clubs and fishing rods.
| Change-Up | October 12, 2010 |
Joe Mauer & Barry Bonds
It's hard to remember sometimes but Barry Bonds had just an awful reputation for failing to come through in the postseason by the time his stint with the Pittsburgh Pirates ended. This excerpt from a 2001 article for Slate that Ben McGrath wrote captures the sentiment well, though it incorporates some of his playoff failures as a Giant, too.
In five playoff series for the Pirates and Giants—all losing efforts—Bonds has batted .196 with just one home run and six RBIs over a span of nearly 100 at-bats. In 1997, the San Francisco Examiner declared, "Barry Bonds continues to struggle in clutch situations, to the point where failures now are almost expected." Last month, the New York Times' Murray Chass quipped, "If Bonds had played for the Yankees, George Steinbrenner would have called him Mr. O, not for October but for zero."
At the end of the 1992 season - Bonds's seventh in Major League Baseball, Bonds had won two MVP awards and was in line for an enormously lucrative free agent contract. Still, in 83 postseason plate appearances he had hit just .191/.349/.265. His Pirates had lost three consecutive National League Championship Series and time and again, when a key Bonds hit might have made all the difference, he came up short.
At the end of the 2010 season - Joe Mauer's seventh in Major League Baseball, Mauer has won an MVP award and should have a second. He's arguably off to the best start of any catcher in Major League Baseball history. His power stroke comes and goes, but that part of his game is just icing. He's phenomenal with or without hefty slugging totals. The Minnesota Twins rewarded Mauer with a $184 million extension this season.
Like Bonds, Mauer has been awful in the postseason. He's never won a game in the playoffs and is a career .286/.359/.314 hitter in 35 plate appearances. This past American League Division Series, Mauer hit .250/.308/.250. He came up short again.
It's interesting to contrast the way fans and media treated Bonds to the way they treat Mauer. Both were/are superstars en route to Hall of Fame careers who failed miserably under the brightest spotlight. Aside from a corner here or there of the internet, there doesn't seem to be much anger or ridicule towards Mauer. The same could hardly be said of Bonds. His detractors reveled in his high-profile failures.
That may be for any number of reasons. I'd like to think it's because we know postseason performance deviating from career norms to the upside or down is most likely due to the sample size than some innate character trait in the player in question. A more informed fanbase and media set are much more likely to cut the guy who falls short some slack. It happens, or so we've learned as the SABR movement has made its way mainstream.
One could also attribute this phenomenon to their respective dispositions. Bonds, by many accounts, was a jerk. Mauer, on the other hand, has a great reputation as an individual.
There's another potential explanation, of course. And while I don't want to use this space for social or political commentary, I'd urge you to consider alternative reasons why Mauer seems to escape media criticism while so many took such great joy in Bonds's struggles.
| Baseball Beat | October 11, 2010 |
Long Beach State Produced the Most MLB Players in 2010
According to Press-Telegram columnist Bob Keisser, 17 former Long Beach State baseball players performed in the major leagues this year. "No other college team can boast of having that many players in the majors in 2010."
Known as Dirtbags during their college years, the group is headlined by three All-Stars, namely American League Most Valuable Player candidate Evan Longoria, National League Player of the Month for September Troy Tulowitzki, and MLB strikeout leader Jered Weaver. There isn't a university in the country that came close to duplicating the feats of this trio.
Tulowitzki and Weaver were college teammates in 2003 and 2004. Tulo and Longoria played side-by-side in the infield on the 2005 club. All three players were drafted in the first round by their respective teams: Weaver in 2004 by the Los Angeles Angels, Tulowitzki in 2005 by the Colorado Rockies, and Longoria in 2006 by the Tampa Bay Rays.
Longoria hit .294/.372/.507 with 46 2B, 5 3B, 22 HR, 72 BB, 96 R, 104 RBI, and 15 SB in 20 attempts for the Rays this season. He was the AL Rookie of the Year in 2008 and has been named to the All-Star team in each of his first three MLB seasons while being the recipient of a Gold Glove and a Silver Slugger in 2009. Longoria, who turned 25 last week, led the AL and NL with 7.7 Wins Above Replacement (brWAR) in 2010.
Tulowitzki posted career highs in AVG (.315), OBP (.381), and SLG (.568) this season. He hit 15 HR during the final month, including 14 in a 15-game stretch when the Colorado Rockies won 13 times to climb within one game of the NL West lead. The slick-fielding shortstop missed 33 games with a fractured wrist in June and July but still managed to jack 27 HR in only 122 G and 529 PA. He turned 26 yesterday.
In addition to leading the majors in Ks, Weaver topped the AL in GS (34); finished second in K/BB (4.315); third in IP (224.1), K/9 (9.35), and WHIP (1.07); fifth in ERA (3.01), ERA+ (135), and FIP (3.06); seventh in H/9 (7.50); and ninth in BB/9 (2.17). The 6-foot-7 righthander ranked second among pitchers in brWAR (5.4) and fifth in fgWAR (5.9). He pitched six or more innings in 31 of his 34 starts, ranking second in quality starts with 27. Unfortunately, Weave had the 10th-worst run support among 43 qualified starters, which negatively affected his W-L record (13-12). The five-year veteran turned 28 last week. Unsigned beyond 2010, he will be entering the second of his three arbitration seasons in 2011.
Longoria and Tulowitzki have two of the most team-friendly contracts in baseball. It's hard to believe but Longo made only $950,000 this year and will earn just $2 million in 2011, $4.5M in 2012, and $6M in 2013. The Rays have a $7.5M team option with a $3M buyout in 2014, an $11M option in 2015, and an $11.5M option in 2016. According to Cot's Baseball Contracts, the latter option may increase to $14M based on rankings in the MVP voting. Tulo, meanwhile, will earn $5.5M in 2011, $8.25M in 2012, and $10M in 2013. The Rockies have a $15M team option with a $2M buyout in 2014. At signing, Troy's deal was the largest ever for a player with less than two years of MLB service.
In alphabetical order, the following ex-Dirtbags also competed in the big leagues this year (with years at Long Beach State in parentheses): John Bowker (2002-04), Andrew Carpenter (2006), Bobby Cramer (2000-01), Bobby Crosby (1999-2001), Brad Davis 2002-04), Greg Dobbs (1999), Danny Espinosa (2006-08), Marco Estrada (2005), Jason Giambi (1990-92), Paul McAnulty (2002), Cesar Ramos (2003-05), Jeremy Reed (2000-02), Jason Vargas (2004), and Vance Worley (2006-08).
Crosby was a first-round draft pick (25th overall) by the Oakland A's in 2001. The shortstop was named the AL Rookie of the Year in 2004 when he hit .239/.319/.426 with 34 2B and 22 HR in 151 games and 623 plate appearances. Giambi, a second-round pick by the A's in 1992, won the AL MVP in 2000 when he hit .333/.476/.647 with 43 HR, 137 BB, and 137 RBI. The lefthanded slugger led the league in OBP, BB, and OPS+ (187). He placed second in the MVP voting the following season after topping the circuit in OBP (.477), SLG (.660), OPS (1.137), OPS+ (198), 2B (47), and BB (129).
After Longoria, Tulowitzki, and Weaver, the next most valuable player in 2010 as measured by WAR was Vargas. The Seattle Mariners southpaw started 31 games, tossed 192.2 innings, and produced a 2.15 K/BB ratio, 1.25 WHIP, and a 3.78 ERA. The 27-year old succeeded by throwing strikes and keeping the ball in the park. Nearly 90 percent of his pitches were either fastballs or changeups.
Look for Espinosa and Worley to make a bigger splash in the NL East in 2011. Espinosa played shortstop at Long Beach State and in his three years in the minors but was primarily a second baseman after the Washington Nationals called him up when rosters were expanded on September 1. He belted three homers in his first 15 plate appearances and slugged six for the month. The combination of striking out too often (30 times in 112 PA) and hitting only .239 on balls in play reduced his batting average to .214 but a slugging average of .447 was more in-line with his MiLB production (.455). Espinosa, a member of the U.S. team in the Futures Game in 2009 and 2010, figures to compete for the second base job for the Nats next spring. At worst, he should make the team as a backup middle infielder.
Worley was drafted by the Philadelphia Phillies in the 20th round out of McClatchy HS (Sacramento, CA) in 2005 and the third round after his junior year at Long Beach State in 2008. He signed and combined to go 3-2 with a 7.57 K/BB ratio, 1.07 WHIP, and a 2.66 ERA in 11 GS and 61 IP in the New York Penn League (Short-Season A) and South Atlantic League (Low Class A) that summer. Worley struggled in 2009 at Double A Reading (7-12, 2.04 K/BB, 1.38 WHIP, and 5.34 ERA) but bounced back in 2010 (10-7, 2.59 K/BB, 1.30 WHIP, and 3.36 ERA) while earning a trip to the big leagues this summer before making his Triple A debut for Lehigh Valley. The bespectacled righthander went 1-1 with a 1.38 ERA for the Phillies, highlighted by five scoreless innings against the Atlanta Braves one week after his 23rd birthday in the second-to-last game of the season. He should get a good look next spring.
Since former Long Beach head coach Dave Snow's arrival in 1989, at least two players from every Dirtbags team reached the major leagues. I'll let Keisser, who also serves as the Press-Telegram's beat writer for Long Beach State, take it from here.
The 1989 team sent Kyle Abbott, Darrell Sherman and Tom Urbani to the majors.Between 1999 and 2006, at least four players from every team has reached the majors, topped by a stunning eight players from the 2002 team - Abe Alvarez, John Bowker, Brad Davis, Chris Demaria, Paul McAnulty, Carlos Muniz, Jeremy Reed and Jered Weaver.
The 2004 team that came an inning away from a College World Series berth sent six players to the majors and all six were active this season - Bowker, Davis, Cesar Ramos, Troy Tulowitzki, Jason Vargas and Weaver.
It isn't a stretch to say the parade won't stop any time soon, either. Third baseman Adam Heether, outfielder Shane Peterson, shortstop Devin Lohman, and pitchers Jared Hughes, Nick Vincent, Andrew Liebel, Bryan Shaw, Adam Wilk, Charlie Ruiz and Jake Thompson are all performing well enough in the minors to warrant an eventual shot at the majors.
Mike Weathers succeeded Snow in 2001 and resigned after the 2010 season. He turned the program over to Troy Buckley, who served as the school's pitching coach from 2001-2007 and associate head coach in 2010. He was the minor league pitching coordinator with the Pittsburgh Pirates in 2008 and 2009. Buckley worked with Carpenter, Cramer, Estrada, Ramos, Vargas, Weaver, and Worley in his previous stint at Long Beach State. It will be interesting to see if he can be as successful at producing position players as the two previous head coaches.
As Keisser concludes, "It's about the foundation that's been built, one that includes a ramp to the majors."
| Around the Minors | October 08, 2010 |
NL Prospect Values: Climbing the Depth Chart
The 2010 minor league baseball regular season has come to an end. As with every season, we've seen a lot of prospect values both increase and decrease over the long season. Pre-2010 Top 10 prospect lists are sadly out of date and prospect mavens are madly starting to update their rankings for the off-season, which will see a fresh batch of indispensable lists from the likes of Baseball America, Kevin Goldstein, Keith Law, John Sickels, and FanGraphs.
It's still a little too early to talk Top 10 lists, but let's peruse the National League organizations for some prospects that have significantly increased their values over the course of the 2010 season. Recently, we looked at the American League prospects.
Paul Goldschmidt, 1B, A+
Experience: 2 years
Age: 23
Goldschmidt did exactly what a first base prospect has to done: He slugged his brains out with an overall triple-slash line of .314/.384/.606 in 525 at-bats. He posted an impressive .291 ISO and has massive raw power. On the down side to Goldschmidt's profile, he was playing in a very potent offensive league. He also posted a 30.7% strikeout rate, with a modest walk rate of just 9.5%. With those kind of rates - along with a BABIP of .385 - he doesn't project to hit for average at higher levels... unless he can make some adjustments.
Jordan Pacheco, C, A+/AA
Experience: 4 years
Age: 24
Originally a utility infielder, Pacheco's prospect value took a huge increase when he moved behind the plate in 2008. He made huge strides behind the plate in '10 but still struggles a bit with his receiving skills and allowed 14 passed balls this season. His throwing is improved and he nailed 36% of base runners in high-A ball. Offensively, Pacheco projects to be at least average offensively for a catcher. He hits for a good average, and shows patience at the plate. Unfortunately, he doesn't have much power (.123 ISO). His overall triple-slash line at high-A was .321/.407/.444.
Trayvon Robinson, OF, AA
Experience: 6 years
Age: 23
At worst, Robinson should develop into a fine fourth outfielder. He he can trim his strikeout rate (28.7%), though, he could develop into a solid regular at the MLB level. The .401 OBP is extremely attractive for a leadoff-type. The walk rate has improved from 6.7 in '08 to 9.5 to 14.0% in '10. His power numbers dropped from an ISO rate of .194 to .138, which suggests (along with the increase in OBP) that he's buying into his profile.
Drew Cumberland, SS, A+/AA
Experience: 4 years
Age: 21
Not surprisingly, Cumberland enjoyed playing in the offense-boosting California League in 2010. His .177 ISO was and .365 batting average were definitely impacted by the environment (and his .398 BABIP) so don't expect those numbers to continue. Still, scouts like his actions in the field - including his range - and his bat should be at least average. Cumberland has the potential to steal 15-20 bases at the MLB level.
Brandon Belt, 1B, A+/AA/AAA
Experience: 1 year
Age: 22
An adjustment to his batting stance led to massively-improved numbers in 2010. Belt zoomed through the minors after beginning the year in high-A with a triple-slash line of .381/.491/.626 in 270 at-bats. His batting averages at high-A and double-A were aided by high BABIPs. He showed massive power (.260 ISO rate) and kept his strikeout rate below 20%. There are not many holes in his offensive game right now, although he hit just .229/.393/.563 in a 13-game trial at triple-A. He could be in the Majors by mid-2011.
Devin Mesoraco, C, A+/AA/AAA
Experience: 4 years
Age: 22
Mesoraco entered 2010 hanging by a thread over the Prospect Bust Pit. He made adjustments and flew through three levels of the minors. He posted a .449 ISO in high-A and .421 in double-A. He slumped a bit at triple-A with a triple-slash line of .231/.310/.462. The 26 homers shows that Mesoraco has a lot of power, but he also shows some good patience. The organization will soon have a very good problem on its hands when 2010 No. 1 draft pick (and fellow catcher) Yasmani Grandal reaches the upper levels of the minor (which shouldn't take too long).
Joe Kelly, RHP, A
Experience: 2 years
Age: 22
There is nothing I love more than a pitcher with solid ground-ball rates and Kelly backs that up with a fastball that can hit the mid-90s. He simply needs to improve upon his secondary pitches if he's going to remain in the starting rotation. If not, he could make a dominating closer. It's a little surprising that the organization left the 22-year-old hurler in A-ball all season but his ERA did look a little mis-leading at 4.62 (3.31 FIP). Ground-ball pitchers tend to struggle in the low minors - especially in terms of hits allowed - because they put so many balls into play with poor defenders (and fields) behind them. Kelly also needs to improve his control (3.92 BB/9).
Jake Odorizzi, RHP, A
Experience: 3 years
Age: 20
The organization has used kids' gloves with Odorizzi, who spent two years in rookie ball and then a full season in low-A despite some good success. The right-hander saw his strikeout rate jump to 10.07 K/0 while his walk rate remained respectable at 2.98 BB/9. He posted an average ground-ball rate at 46% and his overall numbers were aided slightly by a BABIP of .299. Odorizzi has the makings of a No. 2 starter.
Tanner Bushue, RHP, A
Experience: 2 years
Age: 19
Bushue is a highly-projectable pitcher who has tons of potential. He struggled with the long ball (1.21 HR/9) but had a respectable strikeout rate (7.68 K/9) and walk rate (3.23 BB/9). Still, a ground-ball rate of 39% needs to improve if he's going to have success in the upper levels of pro ball. Age is on his side.
Bryan Morris, RHP, A+/AA
Experience: 5 years
Age: 23
Injuries and make-up issues have marred Morris' career to this point but he seemingly turned the corner with the Pirates organization in 2010. The right-hander projects as a solid No. 3 starter, which is welcomed news for a club that has struggled with pitching depth for years. At double-A in 2010, Morris posted a 3.87 FIP with a +50% ground-ball rate in 89.0 innings. I'd like to see Morris continue to pitch well in 2011 at triple-A before I truly buy into his turnaround.
Chris Archer, RHP, A+/AA
Experience: 5 years
Age: 22
A former Indians draft pick, Archer has struggled with both his command and control throughout his career, which has caused him to move slowly through the system. His game took a big step forward in 2010. His control was improved in high-A when he posted a 2.85 FIP. Unfortunately, it rose from 3.24 to 5.01 BB/9 with a promotion to double-A. There is work to be done but all the pieces are coming together.
Brandon Beachy, RHP, AA/AAA/MLB
Experience: 3 years
Age: 24
Beachy has gotten a lot of press for his impressive season but the hype is a little unjustified right now. Yes, he had a very good minor league season but his overall repertoire is fairly average and he dominated minor league hitters with good command and control of his stuff. His ground-ball rate is also a tick below average. He'd probably be a middle reliever in the American League but will probably survive as a No. 3 or 4 starter in the National League.
Cesar Puello, OF, A
Experience: 3 years
Age: 19
Puello produced promising numbers for a teen-aged speedster in 2010. The right-handed batter produced a triple-slash line of .292/.375/.359 in 404 at-bats, while also stealing 45 bases. He continues to make adjustments and his walk rate has improved in each of his three seasons and was at 6.8% in 2010, which is OK but not great. Although he hasn't shown much power in his ISO rate, Puello has seen his line-drive rate increase dramatically since 2008 (9 to 13 to 15%). Defensively, he made some over-aggressive errors but shows good range.
Brad Peacock, RHP, A+/AA
Experience: 4 years
Age: 22
A position player college, it's taken Peacock some time to get his feet underneath him on the mound in pro ball. He has a solid fastball that can touch the mid-90s and his secondary pitches are developing nicely. His strikeout rate jumped to 10.28 K/9 in 103.1 high-A innings. His walk rate was good at 2.18 BB/9 but it jumped to 5.12 BB/9 in 38.2 double-A innings. Peacock has shown flashes of an above-average ground-ball rate but it was average in 2010.
Trevor May, RHP, A/A+
Experience: 3 years
Age: 21
May had a very nice beginning to the season with a FIP of 1.94 in 65.0 A-ball innings. He moved up to high-A and saw his FIP jump to 4.76, mainly due to a walk rate that skyrocketed to 7.74 BB/9 despite a strikeout rate of 11.57 K/9. If May can get the ball over the plate consistently, he could be a dominating starter thanks to a mid-90s fastball and two other solid pitches (curve, changeup).
Brad Hand, LHP, A+/AA
Experience: 3 years
Age: 20
Hand isn't flashy (although his fastball velocity is above-average for a southpaw) but he reached double-A at the age of 20. He posted a 3.37 FIP in 140.2 high-A innings despite a .352 BABIP. His walk rate of 3.14 BB/9 was solid and improved over '09's rate of 4.65 BB/9. He projects to be a No. 3 starter who can provide a lot of innings.
| Touching Bases | October 07, 2010 |
Searching for Unusual Pitch Selections
Michael Lewis and Bill Simmons have written that "baseball is an individual sport masquerading as a team one." Some have reasoned that this is why baseball lends itself to statistical analysis, but I don't think that's the reason. Sure, some individual sports, like tennis, are great for analysis, but with others like boxing, I wouldn't know where to begin. I believe that what sets baseball apart from other team sports is that it can better be classified as a sequential game as opposed to a simultaneous one.
Basketball, hockey, and soccer are good examples of simultaneous games, as concurrent player interaction makes it extremely difficult to isolate any single event from the play as a whole. Football is difficult to categorize, as there are ten minutes of high-octane game action which I'd call simultaneous play, but the rest of the game involves more discreet decision-making. Play calling lends itself beautifully to analytics. As for baseball, most of the game is played in turns. Each defender positions himself, the pitcher chooses a pitch type and location, and the batter decides whether or not to swing. The rest is a matter of execution.
David Gassko wrote an awesome article using game theory to explore the batter pitcher match-up. In his analysis of pitch selection, he used Brad Lidge as his example. Lidge throws a fastball and a slider. Really good ones at that. His task is to mix his pitches in such a way that the batter cannot gain an advantage by anticipating one way or the other. That mix will depend on the batter (it's often convenient to assume that pitchers have perfect information with regards to the batter; they do not.), the park, the umpire, and a bunch of other stuff. I'm going to focus on the count. The count should only matter in determining the rate at which he chooses to throw strikes. Now, there's strong evidence to suggest that baseball players don't act rationally with regards to the count. Dave Allen has shown that batters swing more often 3-2 than they do 2-2. But most pitchers will follow the count in the sense that they throw more fastballs when they need strikes and mix in their harder-to-control off-speed pitches when they can afford balls. Here is Lidge's pitch mix for his career, data courtesy of FanGraphs.
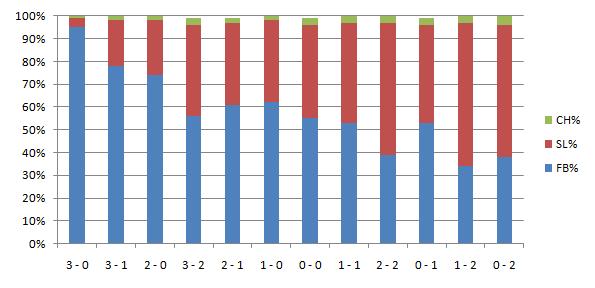
That seems fine to me. I ordered the ball/strike count from from highest run expectancy to lowest, which should theoretically follow with highest fastball percentage to lowest.
A.J. Burnett, like Lidge, mainly sticks to two pitches. He might even adhere more strictly to the count than Lidge. When he falls behind, he refuses to throw a breaking ball. He hasn't thrown a 3-0 curveball since 2008. But when he has two strikes, he relies heavily on it.
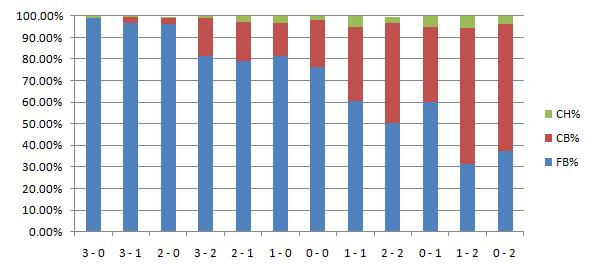
And the best example of pitch selection based almost entirely on the count comes from Tim Wakefield.
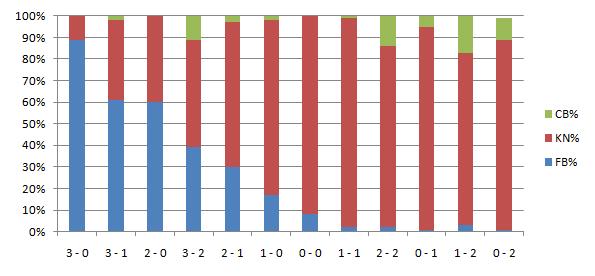
I wanted to find a few pitchers who defy this trend. "Pitching backwards" is a common way to describe such an approach. I looked at a fair number of pitchers, and while some guys depend less on the count in selecting pitches than others, I didn't think I would find anybody who truly "pitched backwards." I e-mailed Rich Lederer, and he suggested I look into Bronson Arroyo. You should too.
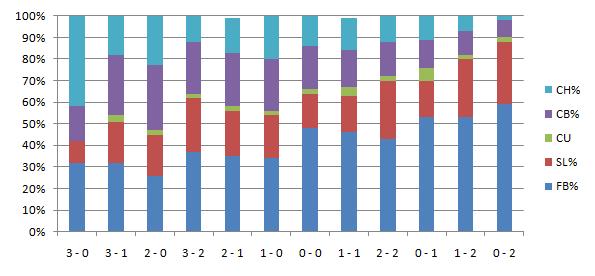
I would guess that something funky's going on here. Arroyo's changeup probably isn't like your normal change. But since 2002, Baseball Info Solutions video scouts have been consistent in calling that pitch -- whatever it is -- a changeup. I don't know what to make of that. Still, how can he throw his curveball 30% of the time on a 2-0 count and 8% on an 0-2 count? Has Arroyo ever given an interview explaining his thought process? Are there any other pitchers at all similar to Arroyo?
The other way that pitchers can defy convention, other than by pitching backwards, is by not following a trend at all. Certain pitchers will only employ a certain pitch in certain counts.
Bobby Jenks has embraced the idea of the "out pitch." He’s a fastball-slider pitcher early in the count. When he gets to three balls, he’ll use the fastball exclusively. But when Jenks gets the count to 0-2 or 1-2, he busts out a curve nearly half the time. He neglects the pitch on other counts, but it’s this huge weapon in these scenarios.
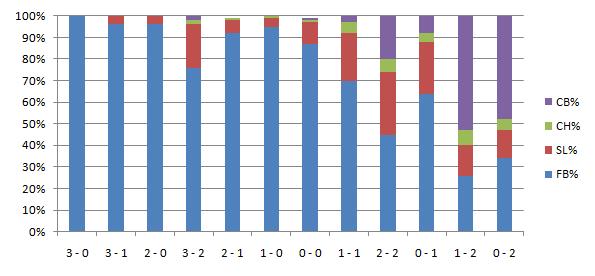
Jenks isn’t alone. Another A.L. Central Closer who embraces his curveball as an out pitch is Joakim Soria. Soria, a four-pitch pitcher, mixes his fastball, slider and change regularly. His curveball, however, he keeps in his pocket until he gets to two strikes at which point it enters the hitters mind.
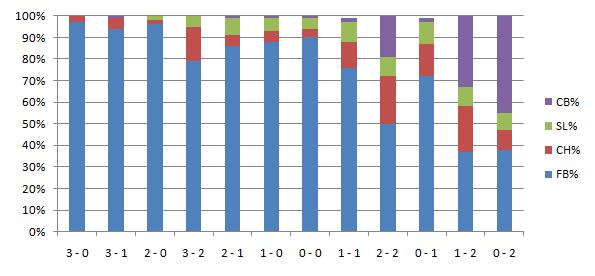
If you can think of any pitcher whose pitch selection puzzles you, please let me hear them.
| Change-Up | October 06, 2010 |
Playoff Primer
There is no shortage of great sites where you can catch LDS previews. Baseball Prospectus and Fangraphs are both running in-depth previews of each series. Team-oriented sites like The Process Report, River Avenue Blues, Pinstriped Bible, Aaron Gleeman, Lonestar Ball, Crashburn Alley, Red Leg Nation, Red Reporter, McCovey Chronicles and Capitol Avenue Club also have you covered.
I thought we could take a different approach here and just pull out a handful of thematic storylines running through the 2011 post-season and have a look. For starters, let's look at two of the better rookies in recent memory set to square off out in San Francisco for the National League Division Series.
Jason Heyward wasted no time making a name for himself in 2010, homering in his first career plate appearance off of Chicago's Carlos Zambrano. If you don't think he's captivated the Atlanta faithful, I urge you to check this out:
It's with good reason, too. Heyward is the most promising player his age to come along in decades. Below is a look at the five best 20-year old seasons in terms of OPS+ since 1946 (65 years). Minimum 300 plate appearances:
| Num | Year | OPS+ | |
|---|---|---|---|
| 1 | Frank Robinson | 1956 | 142 |
| 2 | Jason Heyward | 2010 | 131 |
| 3 | Vada Pinson | 1959 | 128 |
| 4 | Orlando Cepeda | 1958 | 125 |
| 5 | Bob Horner | 1978 | 124 |
On its own, that's compelling but with names like Pinson and Horner on there, are there any guarantees that Heyward will become a superstar? Well there are no guarantees, but this next table tells you why Heyward stands out from the bunch at this stage. It's all about his approach.
| Year | BB% | |
|---|---|---|
| Frank Robinson | 1956 | 9.6 |
| Jason Heyward | 2010 | 14.6 |
| Vada Pinson | 1959 | 7.8 |
| Orlando Cepeda | 1958 | 4.5 |
| Bob Horner | 1978 | 6.7 |
Heyward's walk rate stands way above the others on that list, which bodes extrardinarily well for his future.
In the NLDS Heyward and the Braves face the San Francisco Giants and their standout rookie, Buster Posey. Here are the best OPS+ seasons by a catcher 23 and under with 300 plate appearances since 1961 (50 years):
| Num | Year | OPS+ | |
|---|---|---|---|
| 1 | Brian McCann | 2006 | 143 |
| 2 | Johnny Bench | 1970 | 141 |
| 3 | Joe Torre | 1964 | 140 |
| 4 | Gary Carter | 1977 | 137 |
| 5 | Buster Posey | 2010 | 128 |
Posey and Heyward play critical roles on their respective teams, too. Heyward trails only McCann among Braves position players in Fangraphs WAR. Posey trails only Andres Torres and Aubrey Huff on the Giants.
==========
New Digs
From the entirely non-predictive department, the last two teams to qualify for the playoffs in their first season in a new ballpark won the World Series. Both the 2009 New York Yankees and 2006 St. Louis Cardinals won the Fall Classic their first year in new Yankee and Busch Stadiums, respectively.
This year, the Twins will give it a go. It's been an incredible debut year for Minnesota at Target Field, as they have posted a home record of 53-28. The Twins will be without the services of Justin Morneau, one of the very best players in baseball, but they're used to it at this point. Since Morneau played his last game on July 7th, the Twins actually improved their record, going 49-29 to close the season. Over that same span, the Yankees were 41-36.
==========
2002 K-Rod Candidates
Jeff Fletcher has a good piece on Aroldis Chapman today, and how his presence to the Reds could be what Francisco Rodriguez was to the 2002 Angels. I agree with Fletcher, but there are others who fit that category too.
For one, there's AL Rookie of the Year candidate Neftali Feliz. The Rangers could expand their Closer's role to include additional high-leverage work. Remember, Feliz came up through the Minors as a starter. He could handle additional innings here and there.
There's also Craig Kimbrel of the Atlanta Braves, who has 40 strikeouts in just 20.2 innings of Big League work. He'll have to improve his control if he is going to dominate the way Atlanta might like him to. Kimbrel has 16 walks to go along with those 40 punch-outs. At the same time, the Braves won't need to lean too heavily on him given their relief depth, should Kimbrel struggle.
==========
Lefties Reign in the AL
Top-5 American League playoff starters by Fangraphs WAR:
| Num | Pitcher | fWAR |
|---|---|---|
| 1 | Cliff Lee | 7.0 |
| 2 | Francisco Liriano | 6.0 |
| 3 | C.C. Sabathia | 5.2 |
| 4 | C.J. Wilson | 5.1 |
| 5 | David Price | 4.3 |
Notice any commonality there?
The top righty was Carl Pavano of the Twins.
==========
Things You Should Read
This Dave Cameron piece on how Dusty Baker should deploy his pitching staff in Game One. Sure, the schedule allows Philly the chance to deploy its big-3, but it also allows the Reds to keep their outstanding bullpen fresh.
This guest post by Mike Fast on David Price on The Process Report was outstanding. Jeremy will really appreciate it, I think.
Joe Pawlikowski's take on A.J. Burnett's move to the Yankee bullpen is terrific, too.
So you want to dabble in the free agent pitching market, huh? Sure you might net yourself a gem like C.C. Sabathia. But how about Barry Zito, Javier Vazquez and Burnett? Where would the Red Sox be had John Lackey and Josh Beckett pitched the way Boston had hoped? In Zito, Vazquez, Burnett, Lackey and Beckett, that's $76.5 million doled out to starters who will not be taking a playoff rotation turn.
| October 05, 2010 |
The Baseball Analysts 2010 Award Winners
With the regular season behind us and the postseason still a day away, we wanted to take this opportunity to name our 2010 award winners. While none of us have an official vote, we took the task at hand seriously. Importantly, we're not predicting who will win. Instead, we voted as to who we believe should win.
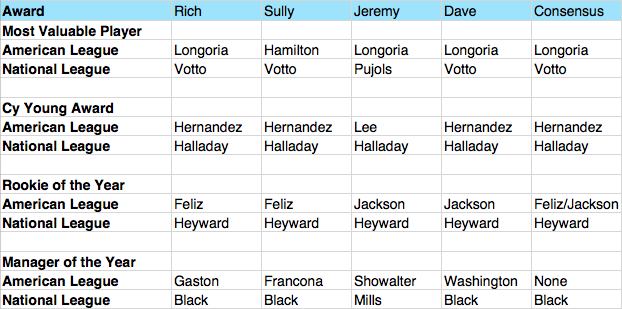
Rich: For me, the AL MVP came down to Josh Hamilton and Evan Longoria with Adrian Beltre, Miguel Cabrera, and Robinson Cano (not necessarily in that order) filling out the top five. Justin Morneau (.345/.437/.618) produced at a MVP rate through the first half but missed the last three months of the season. As to who deserves it more between Hamilton and Longoria, I believe it is all about playing time (which favors the latter) and how one values defense. Hamilton grades out as a plus CF by Ultimate Zone Rating and below average by Total Zone whereas Longoria is viewed positively by both measures.
In the NL, I believe a case could be made for both Albert Pujols and Joey Votto. Six of one, half dozen of the other. As it relates to Wins Above Replacement, Baseball-Reference likes Pujols and Fangraphs likes Votto. The latter has slightly better rate stats and the former has slightly better counting stats. Both play first base. I don't think the difference in defense or baserunning is enough to separate the two. The tie, in my opinion, should go to the player whose team beat the other in the same division. Therefore, Votto is my choice here.
With respect to Cy Young, I have to go with the two pitchers — Felix Hernandez and Roy Halladay — with the best combination of quality and quantity. A case could perhaps be made for Cliff Lee based on his near-record K/BB ratio (10.28), but I don't see how voters could prefer David Price or CC Sabathia as Felix beats them both across the board in IP, K/BB, ERA, and ERA+. By the same token, Halladay bests Ubaldo Jimenez, his main competition, in all four measures.
Jason Heyward and Buster Posey are 1-2 in the NL ROY. Over in the AL, Wade Davis and Brian Matusz are more alike than not, leading me in the direction of Neftali Feliz for how he closed games for Texas while setting the rookie saves record with 40.
Manager of the Year? Who knows. I guess I would go with Cito Gaston and Bud Black as Toronto and San Diego surpassed my expectations the most. I could also understand the case for Joe Maddon and Charlie Manuel who led their teams to the best records in their respective leagues or for Buck Showalter in turning around a club with the worst record in baseball when he took it over.
Sully: Even though he missed time late in the season, I can’t overlook .359/.411/.633 from someone playing very good defense at a premium defensive position. For me, Josh Hamilton is the AL MVP.
I am a sucker for personal stories like Joey Votto’s. He’s managed his anxiety troubles to the point where he is one of the best players in baseball, and in the process has led the resurrection of one of Major League Baseball’s classic franchises. He deserves it on his performance alone, too, but those other things push him comfortably ahead on my fake ballot.
It’s a shame that the C.C. versus King Felix debate obscured the performances of guys like Jered Weaver, Jon Lester, Justin Verlander, Francisco Liriano, and even studs like Cliff Lee and Zack Greinke. But in the end, it’s Hernandez’s 249+ innings that leap off the page for me. There were a number of qualified American League Cy Young Award candidates, and the difference for me was workload. Hernandez it is.
National League Cy Young: Roy Halladay. See AL Cy Young rationale, and then remove the stiff competition.
I liked Keith Law’s logic for giving the nod to Brian Matusz, who battled his way through a brutal 2010 rookie campaign in the AL East to finish excellently. But unlike Law, I am more moved by the job Neftali Feliz did nailing down games for the Texas Rangers. He was superb (3.94 K/BB) for a division winner.
Buster Posey made an excellent late push, but the nod goes to Jason Heyward. Really, we’re all the winners since the two play in the NLDS against one another. But it’s Heyward’s approach beyond his years, solid defense and playing time advantage that tip the scales in favor of the Atlanta right fielder.
AL Manager of the Year: Call me biased but I give Terry Francona the nod. Had Francona been supplied adequate bullpen personnel, I think he would have been able to lead this team to the post-season despite devastating injuries to key players all over the roster.
NL Manager of the Year: I like Bud Black here, but wouldn’t argue with other choices. It’s pretty simple, really. Look at the Padres roster and look at their record. To the extent that it’s the Manager’s job to get the most out of his team’s talent, I think Black has to be the guy.
Jeremy: I have nothing interesting to say. I think Logoria, Pujols, Halladay, and Lee are the best players in their respective leagues, and this year nobody stood out from them. I've always been underwhelmed by Hamilton's defense, and I don't really like the guy. Pujols was Pujols and Halladay was Halladay. AL Cy was my toughest choice because there are about six great pitchers in that league. Lee had a substantial edge in StatCorner WAR. I don't find Rookie of the Year voting interesting. And I have no idea how to evaluate managing. Like I mean none. But I heard Orioles players say they loved playing under Schowalter, and it's entirely possible something changed that sparked their 34-23 run. The Astros were oddly clutch this year, which could mean Mills pulled the right levers. I don't know.
Dave: AL Cy Young: Felix Hernandez -- based on number and quality of innings I think he is the clear choice.
NL Cy Young: Roy Halladay -- Here the choice is even more than above.
AL MVP: Evan Longoria -- Don't be fooled by his 22 HRs, he still had an amazing year.
NL MVP: Joey Votto -- Monster year from him.
AL ROY: Austin Jackson -- A full season of good offense and good defense from a CFer does it for me.
NL ROY: Jayson Heyward -- In my mind Heyward's extra 180 PAs and 20 games outweigh Posey's positional advantage (catcher versus RF), but that it too bad because it penalizes Posey for the Giants not playing him earlier.
AL Manager: Ron Washington -- I really have no clue how to evaluate managers, so I just went with the manager of the team that seemed to 'overachieve' the most.
NL Manager: Bud Black -- see above.
How would you vote?
| Baseball Beat | October 04, 2010 |
Six Months Down, One to Go
The staff of the Baseball Analysts made predictions before the season began and, as it turns out, did very well. Our consensus picked five of the eight teams that qualified for the postseason, missing only on Tampa Bay in the American League and Cincinnati and San Francisco in the National League.
The Giants befuddled us the most as no one placed the NL West champions higher than third in the division. We narrowly missed on the Rays with three staffers choosing Boston as the AL Wild Card entry and two going with Tampa Bay. The Rays, of course, won the AL East, edging the Yankees by one game. Four of five analysts tabbed the Reds to finish second in the NL Central with all five of us incorrectly projecting St. Louis to take the division.
All eight postseason teams had run differentials of +100 or more. No other club in the majors had a differential that high. The Yankees led in runs scored (859) and in run differential (166). The San Diego Padres allowed the fewest runs (581).
AMERICAN LEAGUE EAST
TEAM         W    L   PCT  GB
Rays         96   66  .593  -
Yankees      95   67  .586   1
Red Sox      89   73  .549   7
Blue Jays    85   77  .525  11
Orioles      66   96  .407  30
Toronto was clearly the biggest positive surprise in the AL East, if not the entire league, in manager Cito Gaston's final season. Forget the fact that the Blue Jays finished in fourth place. Winning 85 games in a tough division and finishing much closer to first than last place made for a highly successful season for MLB's lone club north of the border. Led by Jose Bautista's major league-leading 54 HR, Toronto tied the 1996 Baltimore Orioles with 257 homers, the third-most in the history of baseball.
AMERICAN LEAGUE CENTRAL
TEAM         W    L   PCT  GB
Twins        94   68  .580  -
White Sox    88   74  .543   6
Tigers       81   81  .500  13
Indians      69   93  .426  25
Royals       67   95  .414  27
The AL Central played pretty much to form with Minnesota winning its second consecutive division title. The Twins have now won six of the last nine division crowns. Unfortunately, Minnesota has been bumped in four straight League Division Series, never winning more than one game in any of these match-ups.
AMERICAN LEAGUE WEST
TEAM         W    L   PCT  GB
Rangers      90   72  .556  -
A's          81   81  .500   9
Angels       80   82  .494  10
Mariners     61  101  .377  29
Texas finished atop the AL West for the first time this century. The Rangers have increased their win total from 75 in Ron Washington's first season in 2007 to 79 in 2008 to 87 in 2009 and 90 in 2010. Pitching and defense have been the key with Texas allowing 280 fewer runs this year vs. two seasons ago. Meanwhile, the Seattle Mariners may have been the most disappointing team in baseball, losing more games than any team not named the Pittsburgh Pirates.
NATIONAL LEAGUE EAST
TEAM         W    L   PCT  GB
Phillies     97   65  .599  -
Braves       91   71  .562   6
Marlins      80   82  .494  17
Mets         79   83  .488  18
Nationals    69   93  .426  28
Philadelphia captured its fourth consecutive NL East title, winning the most games in the majors. The 2008 World Series champions have increased the number of regular season wins in each of the past four campaigns. Roy Halladay, Roy Oswalt, and Cole Hamels, perhaps the most formidable Big Three in the postseason, will be seeking to take the Phillies to the World Series for the third straight October.
In his final season at the helm, Bobby Cox is leading Atlanta into the postseason for the 15th time in the past 20 years but the first since 2005. However, it has been nine years since the Braves won a postseason series. The Hall of Fame-bound manager will be looking to win his second World Series and the first since 1995. He is 1-4 in his previous five attempts.
NATIONAL LEAGUE CENTRAL
TEAM         W    L   PCT  GB
Reds         91   71  .562  -
Cardinals    86   76  .531   5
Brewers      77   85  .475  14
Astros       76   86  .469  15
Cubs         75   87  .463  16
Pirates      57  105  .352  34
Joey Votto, the favorite to win the NL MVP, and Jay Bruce (.388/.474/.925 with 12 HR in his final 22 games) combined to lead Cincinnati into the postseason for the first time since 1995. A healthy Edinson Volquez (27.2-17-6-6-8-31, 1.95 ERA in September) will be the key to a pitching staff that lacks a proven stopper.
NATIONAL LEAGUE WEST
TEAM         W    L   PCT  GB
Giants       92   70  .568  -
Padres       90   72  .556   2
Rockies      83   79  .512   9
Dodgers      80   82  .494  12
Diamondbacks 65   97  .401  27
If you knew Pablo Sandoval was going to hit .268 with 13 HR, would you have believed that San Francisco would have won the NL West? Instead, rookie Buster Posey (.305/.357/.505) and newcomers Aubrey Huff (.290/.385/.506) and Pat Burrell (.266/.364/.509) combined with a stellar starting rotation and bullpen to beat back San Diego on the final day of the season.
| F/X Visualizations | October 01, 2010 |
Robinson Cano's Walks
Earlier in the week I was looking at the AL WAR leader board I was taken aback by Robinson Cano's position. I knew he was having a good year, but not such a great one. Digging into it I saw he had nearly doubled his walk rate. It looks like someone else also took note and as I was planning this post on it I read Albert Lyu's FanGraphs piece. Here I will take a slightly different angle than Albert to present a complimentary picture of Cano's walk rate.
Like Albert I was struck by the fact that Cano had such a higher walk rate in spite of his higher 2010 Swing% (and especially for out-of-the-zone pitches: 37% this year compared to 31% last year). That is from FanGraphs who get the data from BIS. The pitchf/x data sees a similar, though not as extreme, increase from 32% to 34%.
So where are the extra walks coming from? Part of the reason is a slight drop in Contact%. As Albert points out, less contact obviously means more strikes (and thus more strikeouts), but it also makes at-bats last longer, potentially leading to more walks. But the biggest reason seems to be a drop in Zone%. The BIS numbers see a drop from 50% in 2009 to 43% in 2010; Pitchf/x saw 51% in the zone in 2009 and 44% in 2010.
This was my jumping off point: what is the difference in pitches Cano saw in 2010 compared to 2009, and what was the difference in which he swung at? To do that I took all the pitches he saw in 2009 and 2010, binned them, color-coded the bins by number of pitches (darker is more), and separated by year and pitcher handedness. On top of that I plotted Cano's 50% swing contour. Pitches inside the curve Cano swung at more often than not, while pitches outside the curve Cano took more often than not.
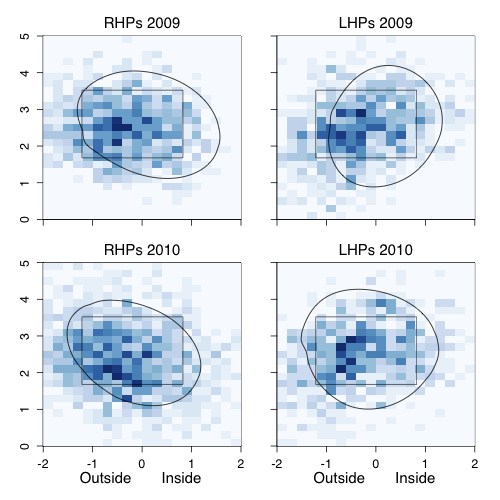
Looking first against RHPs you can see that there is a much greater spread of pitches in 2010 compared to 2009, with fewer pitches in the strike zone. Particularly he saw more pitches away and down. And even within the zone he saw more pitches in the bottom corner, which might not be called as strikes anyway because the zone is called more like an oval than a rectangle. His 50% swing contour against RHPs in 2010 is shifted slightly away and maybe a little bit smaller
Against LHPs again there are fewer pitches in the strike zone. But in this case Cano is clearly swinging more often, with his 50% swing contour almost entirely out of the rectangular zone.
These data suggest that a part of Cano's increased walk rate seems to be that he is seeing fewer pitches in the strike zone. This could be because of his better power numbers in 2009 and 2010 -- making pitchers wary of giving him good pitches to hit. Thus the walks seem to be as much a result of pitchers' changing approach to facing Cano as Cano's changing plate discipline. But either way they have come about, those walks, combined with his low K-rate and solid power at second base, make him a very valuable baseball player.