Rich Lederer • Baseball Beat
Patrick Sullivan • Change-Up
Jeremy Greenhouse • Touching Bases
Dave Allen • F/X Visualizations
Sky Andrecheck • Behind the Scoreboard
Marc Hulet • Around the Minors
Al Doyle • Past Times
Retired Uniforms:
Bryan Smith • WTNY
Joe Sheehan • Command Post
Jeff Albert • The Batter's Eye
RSS Feed
Home
*Examining the Past, Present, and Future*
Lineup Card
Recent Entries
» Putting Together a Reality Team
» Historical Hall of Fame Vote Comparisons: 2012
» An All-Christmas Team
» The New-Look Angels
» John Denny: The Forgotten Cy Young Award Winner
» Money Isn't Everything
» What Would It Take to Hit .400 in the 21st Century?
» Halos Heaven
» Brandon McCarthy's Breakout Season
» Link-o-Rama
» Historical Hall of Fame Vote Comparisons: 2012
» An All-Christmas Team
» The New-Look Angels
» John Denny: The Forgotten Cy Young Award Winner
» Money Isn't Everything
» What Would It Take to Hit .400 in the 21st Century?
» Halos Heaven
» Brandon McCarthy's Breakout Season
» Link-o-Rama
Best of Baseball Beat
Abstracts From the Abstracts
1977 Baseball Abstract
1978 Baseball Abstract
1979 Baseball Abstract
1980 Baseball Abstract
1981 Baseball Abstract
1982 Baseball Abstract
1983 Baseball Abstract
1984 Baseball Abstract
1985 Baseball Abstract
1986 Baseball Abstract
1987 Baseball Abstract
1988 Baseball Abstract
1978 Baseball Abstract
1979 Baseball Abstract
1980 Baseball Abstract
1981 Baseball Abstract
1982 Baseball Abstract
1983 Baseball Abstract
1984 Baseball Abstract
1985 Baseball Abstract
1986 Baseball Abstract
1987 Baseball Abstract
1988 Baseball Abstract
Bert Blyleven Series
Meeting Up and Hanging Out with Bert
The Results Are In And...
Aficionado Heavily Invested in Blyleven
Latest on Blyleven's Chances for the HOF
The Internet Zealot Responds
400 Down and 5 to Go...
Bert Be Home By Eleven?
Blyleven's Forgotten Season (1973)
HeyMan, Your Comments Don't Hold Water
The Waiting is the Hardest Part
Another Addition to the Blyleven Series
Search for the Truth
As Dominant as His HOF Contemporaries
Listen, Buster
A Larger Step for Blyleven
Answering the Naysayers (Part Two)
Another Small Step for Blyleven
Q&A: Blyleven on the Twins
The Majority Rules, Right?
It's All Dutch to Some
The Hall of Fame Case for Bert Blyleven
Q&A: Blyleven on Felix Hernandez
Clemens Rocketing Up Charts
Poz: An Interview With a KC Star
A HOF Chat with Tracy Ringolsby
Up Close and Personal
A Peek Into the Mind of a HOF Voter
Answering the Naysayers
It's That Time of the Year (Again)
"If Cooperstown is Calling..."
The Bert Alert
One Small Step for Blyleven...
Only the Lonely
Exclusive Interviews
Lee Sinins
Alex Belth
David Pinto
Will Carroll
Mike Carminati
Aaron Gleeman
Joe Sheehan
Jay Jaffe
Jeff Peek
Tracy Ringolsby
Joe Posnanski
Bill James Part I, II, III
Jon Lalonde
Chuck Tiffany
Dayn Perry
Fay Vincent
Nate Silver
Alex Belth
David Pinto
Will Carroll
Mike Carminati
Aaron Gleeman
Joe Sheehan
Jay Jaffe
Jeff Peek
Tracy Ringolsby
Joe Posnanski
Bill James Part I, II, III
Jon Lalonde
Chuck Tiffany
Dayn Perry
Fay Vincent
Nate Silver
Bullpen
Rich Lederer
The Odd Couple (with Alex Belth)
The MostUnder Over Underrated Player in Baseball (with Brian Gunn)
Three Wise Men (roundtable by Alex Belth)
Infrequently Asked Questions (interview with Matt Welch)
Interview (Orioles Think Tank)
Bernie and the Yanks (Bronx Banter)
Hope and Faith: How the LAA Win the World Series (Baseball Prospectus)
NL West (The Soul of Baseball)
Greatest Living Hitter? (Sports Illustrated)
Roundtable: 2008 HOF Ballot (Armchair GM)
The Most
Three Wise Men (roundtable by Alex Belth)
Infrequently Asked Questions (interview with Matt Welch)
Interview (Orioles Think Tank)
Bernie and the Yanks (Bronx Banter)
Hope and Faith: How the LAA Win the World Series (Baseball Prospectus)
NL West (The Soul of Baseball)
Greatest Living Hitter? (Sports Illustrated)
Roundtable: 2008 HOF Ballot (Armchair GM)
Patrick Sullivan
Designated Hitters
David Bromberg (Q&A: John Denny)
Mark Armour (H. Killebrew and Versatility)
Joe Lederer (Soundtrack of a Prospect)
David Bromberg (Clemente's Autograph)
David Bromberg (Woody Fryman)
D. Baumstein (WAR Against Age: Pitchers)
Doug Baumstein (The WAR Against Age)
Doug Baumstein (A Lifetime on the Road)
John Fraser (Pick Six)
Mark Armour (How to Score More Runs?)
Bill Parker (What Opening Day Tells Us)
Stan Opdyke (Pat Rispole)
Chris Jaffe (Evaluating Baseball's Mgrs)
Stan Opdyke (Baseball Radio in NYC, 1953)
A. Nathan (Performance of Baseball Bats)
Michael Weddell (Edgar Martinez/HOF)
Jon Weisman (100 Things Dodgers Fans...)
Stan Opdyke (Connie Mack and Vin Scully)
Eric Walker (Evaluating Run Production)
Brent Mayne (The Intangibles of Catching)
Chris Moore (Best Fastballs in Baseball)
Dave Baldwin (The Batter’s Brain)
Shawn Haviland (Ivy League to MLB)
Larry Granillo (Walking Off)
Rob Iracane (Solo HR Won't Break You)
Tommy Bennett (Charm of AM Radio)
Harry Pavlidis (Johan Santana's Fast Start)
John Walsh (WAR and Remembrance)
Eric Walker (Precisely Inaccurate)
Bob Timmermann (As They See 'Em)
Geoff Young (Unicycles and Delusions)
Baseball Analysis at Tufts (Groundballers)
Baseball Analysis at Tufts (GB Out Rates)
G. Rybarczyk ('09 Hit Tracker Projections)
Joe Lederer (Curt Schilling/HoF)
Conor Gallagher (Hall of Fallacies)
Chris Green (Jim Rice, HoF, the Numbers)
Shawn Hoffman (Baseball's Bear Mkt?)
Paul Anthony (Manny Syndrome)
Ross Roley (World Series Odds)
B. Timmermann (Catcher's Interference)
R.J. Anderson (Waiting the Hardest Part)
Maury Brown (Cubs, MLB, and Cuban...)
Myron Logan (Dee-Fense, Dee-Fense)
Craig Calcaterra (Frivolity, Part I, Part II)
Chad Finn (Ode to Baseball Cards)
David Cameron (Mariners Foibles)
Chris Dial (Chipper Jones)
Pat Lederer (Memory Lane)
David Appelman (Clutch Pitching)
Bob Rittner (DH)
Jonathan Mayo (Roger Clemens)
Lisa Winston (My Son-in-Law...)
Russ McQueen (The Yellow Hammer)
Bob Rittner (I'm OK, You're OK)
Mark Armour (In Defense of the HOF)
Pat Jordan (Friends)
Dan Levitt (Analysis of Terry Ryan)
Doug Baumstein (Trading Econ 101)
Ross Roley (Runner's Reluctance II)
Ross Roley (Runner's Reluctance I)
Mark Armour (No-Longer Lovable Sox)
Bruce Regal (Stealthy and Wise)
Brian Gunn (Roid Monster)
Current/McEvoy (Value of the SB)
John Rickert (Sinister Thefts)
Nate Silver (Sabermetrics)
David Vincent (Home Run Production)
Joe P. Sheehan (Enhanced Gameday II)
Mark Armour (An Ode to Sport)
David Gassko (All-Time Worm Burners)
Joe P. Sheehan (Enhanced Gameday)
John Walsh (When Titans Clash)
Fox/Williams (Quantifying Coaches II)
Fox/Williams (Quantifying Coaches I)
Jacob Luft (Bull Durham Rant)
Chad Finn (Strat-O-Matic)
Lisa Winston (Rotisserie Baseball)
Dave Studeman (Baseball Stats)
Steve Treder (Roger Craig)
Marc Normandin (Jeff Bagwell)
D. Appelman (Expanding Strike Zone)
Jeff Sackmann (Worst MiL Defenders)
Jeff Sackmann (Best MiL Defenders)
Maxwell Kates (Van Lingle Mungo)
David Appelman (Pitch Location)
Kent Bonham (Danny Ray Herrera)
Glenn Stout (Two Baseball Poems)
Bruce Regal (The Challenge Round)
Mark Lamster (Barry & Ty)
Geoff Young (NL West)
Tom Lederer (The Ryan Express)
Brian Erts (Great Leap Forward)
David Pinto (Parity and the N.L.)
Jacob Luft (Fathers and Daughters)
Jamey Newberg (Pete's Sake)
Jeff Albert (A. Jones Swing Analysis)
Jeff Albert (A-Rod Swing Analysis)
Keith Law (Death, Taxes, and Waivers)
Peter Abraham (Tales of Torre Tales)
Larry Borowsky (Let 'er Rip II)
Dan Levitt (Empirical Analysis of Bunting)
Jonah Keri (If I Met Warren Cromartie...)
Bob Klapisch (War Stories)
Bob Timmermann (John F. Kennedy HS)
Kent Bonham (Aluminum Adjustments)
Al Doyle (More Than Superstars)
Ross Roley (Instant Replay)
David Vincent (Barry Bonds Homers)
Chad Finn (Our Favorite Obscurities)
Bill Deane (1979 NL MVP)
Mark Armour (Rise/Fall of Artificial Turf)
Jeff Angus (Wally Moon Camp)
David Berri (Money and Baseball)
Larry Borowsky (Baseball w/o the #s)
Derek Zumsteg (The Irrational Market)
David Regan (Free Agent Contracts)
Peter Schmuck (Steroids and the HOF)
David Appelman (Pitchers, Pitch by Pitch)
Dan Fox (Swinging, Taking, Fouling, Etc)
Patrick Sullivan (Study of NYY CF/BOS LF)
Will Leitch (Baseball Journalism)
Jeff Sullivan (Pitcher Release Points)
Steve Treder ('69-'70 Giants)
Maury Brown (Charlie Finley)
John Brattain (Bob Johnson)
Bob Klapisch (The Case for Bert Blyleven)
Jeff Peek (Pride and Prejudice)
Dayn Perry (Bert and Warren)
Rob Neyer (If Don Sutton Was Great...)
Lisa Winston (Minor League Memories)
Alex Belth (Otis Redding Was Right)
David Cameron (Long Live the King)
Jeff Angus (Baserunning Study)
Bert Blyleven (Baseball Playoffs)
Boyd Nation (Not a Prospect List)
James Click (Batters-Baserunners Study)
Jeff Shaw (Why I Love Baseball)
David Gassko (BIP/BFP Fielding Study)
Jay Jaffe (Milwaukee Sausage Race)
Jamey Newberg (Remember When)
Bob Klapisch (Press Box to the Mound)
Dan Levitt (Predictive Value of BB)
David Vincent (Official Scorer)
Jon Weisman (Rick Monday)
Larry Borowsky (Let 'er Rip)
Will Carroll (Fictional Short Story)
Bob Timmermann (Japanese Baseball)
Cyril Morong (Best Pitching Seasons)
Sean Forman (Monte Carlo Win-Loss)
Brian Gunn (My Little Blue Book)
Joe Lederer (My Dad and Baseball)
Bill Deane (Bob Gibson, 1968)
Mark Armour (1977 Yankees)
Darren Viola (Retrosheet)
David Pinto (RFK)
Dayn Perry (Brave Heart)
Matt Welch (Dave Hansen)
Kevin Kernan (Jack McKeon)
Tom Lederer (Dodgers Road Trip)
Steve Lombardi (Slider)
Studes (Picturing Baseball)
Mike Carminati (Luck of the Drawl)
Eric Neel (Vin Scully)
J.C. Bradbury (Leo Mazzone)
John Sickels (Bill James)
Search Baseball Analysts
Archives
By Category:
Around the Majors Content Only
Around the Minors Content Only
Baseball Beat Content Only
Baseball Beat/Change-Up Content Only
Baseball Beat/WTNY Content Only
Behind the Scoreboard Content Only
Change-Up Content Only
Change-Up/Around the Majors Content Only
Command Post Content Only
Crunching the Numbers Content Only
Designated Hitter Content Only
F/X Visualizations Content Only
Past Times Content Only
Saber Talk Content Only
The Batter's Eye Content Only
Touching Bases Content Only
Weekend Blog Content Only
WTNY Content Only
By Month:
February 2012
January 2012
December 2011
October 2011
September 2011
August 2011
July 2011
June 2011
May 2011
April 2011
March 2011
February 2011
January 2011
December 2010
November 2010
October 2010
September 2010
August 2010
July 2010
June 2010
May 2010
April 2010
March 2010
February 2010
January 2010
December 2009
November 2009
October 2009
September 2009
August 2009
July 2009
June 2009
May 2009
April 2009
March 2009
February 2009
January 2009
December 2008
November 2008
October 2008
September 2008
August 2008
July 2008
June 2008
May 2008
April 2008
March 2008
February 2008
January 2008
December 2007
November 2007
October 2007
September 2007
August 2007
July 2007
June 2007
May 2007
April 2007
March 2007
February 2007
January 2007
December 2006
November 2006
October 2006
September 2006
August 2006
July 2006
June 2006
May 2006
April 2006
March 2006
February 2006
January 2006
December 2005
November 2005
October 2005
September 2005
August 2005
July 2005
June 2005
May 2005
April 2005
March 2005
February 2005
January 2005
December 2004
November 2004
October 2004
September 2004
August 2004
July 2004
June 2004
May 2004
April 2004
March 2004
February 2004
January 2004
December 2003
November 2003
October 2003
September 2003
August 2003
July 2003
June 2003
Reference
Organizational Stats
Arizona Diamondbacks Bat / Pitch
Atlanta Braves Bat / Pitch
Baltimore Orioles Bat / Pitch
Boston Red Sox Bat / Pitch
Chicago Cubs Bat / Pitch
Chicago White Sox Bat / Pitch
Cincinnati Reds Bat / Pitch
Cleveland Indians Bat / Pitch
Colorado Rockies Bat / Pitch
Detroit Tigers Bat / Pitch
Florida Marlins Bat / Pitch
Houston Astros Bat / Pitch
Kansas City Royals Bat / Pitch
Los Angeles Angels Bat / Pitch
Los Angeles Dodgers Bat / Pitch
Milwaukee Brewers Bat / Pitch
Minnesota Twins Bat / Pitch
New York Mets Bat / Pitch
New York Yankees Bat / Pitch
Oakland Athletics Bat / Pitch
Philadelphia Phillies Bat / Pitch
Pittsburgh Pirates Bat / Pitch
St. Louis Cardinals Bat / Pitch
San Diego Padres Bat / Pitch
San Francisco Giants Bat / Pitch
Seattle Mariners Bat / Pitch
Tampa Bay Devil Rays Bat / Pitch
Texas Rangers Bat / Pitch
Toronto Blue Jays Bat / Pitch
Washington Nationals Bat / Pitch
All-Star Links
Official Websites
News and Notes
Baseball News Blog
Baseball Newstand
ESPN Baseball
Fox Sports Baseball
Pro Sports Daily
Roto World
The Roto Times
USA Today Baseball
Baseball Newstand
ESPN Baseball
Fox Sports Baseball
Pro Sports Daily
Roto World
The Roto Times
USA Today Baseball
Reference and Analysis
Baseball Almanac
Baseball America
Baseball Archive
Baseball Contracts
Baseball Cube
Baseball Graphs
Baseball Library
Baseball Musings Player Database
Baseball Page
Baseball Primer
Baseball Prospectus
Baseball Reference
Baseball Statistics
Baseball Truth
Boxscore Central
Diamond Mind Baseball
Doug's Stats
FanGraphs
Fast Balls (pitchfx catalog)
Hardball Dollars
Hardball Times
Hit Tracker
Retrosheet
Rotobase/Rotoblog
Stat Corner
STATS
Tango on Baseball
Yahoo Sports MLB
Web Gems
Bill James Primer
Sabermetric Manifesto (Grabiner)
Pitching and Defense (McCracken)
Pitching and Defense (Tippett)
Transactions Primer (Neyer)
Baseball Stats (Batter's Box)
Prospect Report (Cameron)
Pitcher Workloads (Sheehan)
Goodbye to Old Baseball Ideas (Rickey)
Sabermetric Manifesto (Grabiner)
Pitching and Defense (McCracken)
Pitching and Defense (Tippett)
Transactions Primer (Neyer)
Baseball Stats (Batter's Box)
Prospect Report (Cameron)
Pitcher Workloads (Sheehan)
Goodbye to Old Baseball Ideas (Rickey)
Columnists
Baseball Blogs
Around the Majors
Athletics Nation
Baseball Crank
Baseball Musings
Baseball-Reference Blog
Batter's Box
Big League Stew
Bronx Banter
Catfish Stew
Cub Town
Dan Agonistes
Dodger Thoughts
DRays Bay
Ducksnorts
Futility Infielder
Halos Heaven
Inside the Rockies
It Might Be Dangerous
Knuckle Curve
LoHud Yankees Blog
Lookout Landing
Management by Baseball
Metaforian
Metsgeek
Mike's Baseball Rants
Only Baseball Matters
Redbird Nation
Red Reporter
Sabernomics (Braves)
Seth Speaks
ShysterBall
6-4-2 (Angels/Dodgers)
The Book
TheCubdom
The Cutting Edge
The House That Dewey Built
The View From The Bleachers
Tiger Blog
U.S.S. Mariner
Viva El Birdos
Where's Kernan
Minor Leagues
Arizona Fall League
BA Player Finder
Cal Leaguers
Jamey Newberg
JDM's Scoresheet Baseball
Minor League Baseball
Minor League Park Factors
Minor League Splits
No Pepper
Sickels' Minor League Ball
Warm October Nights
BA Player Finder
Cal Leaguers
Jamey Newberg
JDM's Scoresheet Baseball
Minor League Baseball
Minor League Park Factors
Minor League Splits
No Pepper
Sickels' Minor League Ball
Warm October Nights
Amateur
Boyd's World (College)
Cape Cod Baseball League
College Baseball Blog
College Baseball Insider
Collegiate Baseball Newspaper
College Splits
College Splits Blog
Dirtbags Baseball (Long Beach State)
NCAA Baseball
NCBWA
Team One Baseball (High School)
Texas A&M & Baseball
Cape Cod Baseball League
College Baseball Blog
College Baseball Insider
Collegiate Baseball Newspaper
College Splits
College Splits Blog
Dirtbags Baseball (Long Beach State)
NCAA Baseball
NCBWA
Team One Baseball (High School)
Texas A&M & Baseball
Historical
Cuban Baseball
House of David
Jim "Mudcat" Grant's Web Page
Negro League Baseball Players Assoc
Negro Leagues Baseball Museum
1919 Black Sox
Pacific Coast League
Philadelphia Athletics Historical Society
Shoeless Joe Jackson Society
SABR-L Archives
Walter O'Malley
House of David
Jim "Mudcat" Grant's Web Page
Negro League Baseball Players Assoc
Negro Leagues Baseball Museum
1919 Black Sox
Pacific Coast League
Philadelphia Athletics Historical Society
Shoeless Joe Jackson Society
SABR-L Archives
Walter O'Malley
Miscellaneous
Forums
Credits
Ticket Center
Tickets to Baseball -
Premium Red Sox Tickets - Tickets to Marlins Games - Cardinals Game Tickets - NY Yankee Tickets - Tickets Oakland Athletics - Dallas Cowboys Tickets - Arizona Cardinals Tickets - Tickets Seattle Seahawks - Buffalo Bills Tickets Online - Tickets to Dolphins Football
Buy Boston Red Sox tickets,
Philadelphia Phillies tix,
NY Yankees tickets,
NY Mets tickets, and
MLB All Star game tickets at ABC tickets
Not sure where to find the best online sportsbooks? Start your search with PlayersJet.
Get deals at SportsMemorabilia.com on baseball apparel, including Phillies jerseys and more for adults and children.
Shop the largest selection baseball equipment on sale at Sports Unlimited. Check out tons of baseball gloves, youth baseball gloves and catchers gear from Rawlings, Wilson, Nike & Under Armour.
2011 Draft Order
Courtesy of Baseball America
First-Round:
 1. Pirates (57-105)
 2. Mariners (61-101)
 3. Diamondbacks (65-97)
 4. Orioles (66-96)
 5. Royals (67-95)
 6. Nationals (69-93)
 7. Diamondbacks (for B. Loux)
 8. Indians (69-93)
 9. Cubs (75-87)
10. Padres (for Karsten Whitson)
11. Astros (76-86)
12. Brewers (77-85)
13. Mets (79-83)
14. Marlins (80-82)
15. Brewers (for Dylan Covey)
16. Dodgers (80-82)
17. Angels (80-82)
18. Athletics (81-81)
19. Red Sox (from DET for Martinez)
20. Rockies (83-79)
21. Blue Jays (85-77)
22. Cardinals (86-76)
23. Nationals (from CWS for Dunn)
24. Rays (from BOS for Crawford)
25. Padres (90-72)
26. Red Sox (from TEX for Beltre)
27. Reds (91-71)
28. Braves (91-71)
29. Giants (92-70)
30. Twins (94-68)
31. Rays (from NYY for Soriano)
32. Rays (96-66)
33. Rangers (from PHI for Lee)
Supplemental First Round:
34. Nationals (Dunn)
35. Blue Jays (Downs)
36. Red Sox (Martinez)
37. Rangers (Lee)
38. Rays (Crawford)
39. Phillies (Werth)
40. Red Sox (Beltre)
41. Rays (Soriano)
42. Rays (Balfour)
43. Diamondbacks (LaRoche)
44. Mets (Feliciano)
45. Rockies (Dotel)
46. Blue Jays (Buck)
47. White Sox (Putz)
48. Padres (Garland)
49. Giants (Uribe)
50. Twins (Hudson)
51. Yankees (Vazquez)
52. Rays (Benoit)
53. Blue Jays (Olivo)
54. Padres (Torrealba)
55. Twins (Crain)
56. Rays (Choate)
57. Blue Jays (Gregg)
58. Padres (Correia)
59. Rays (Hawpe)
| Change-Up | March 31, 2010 |
Stakeholders - Tampa Bay Rays
From now through the beginning of the regular season, we will not be posting in-depth round-tables previewing each division like we have in years past. Instead we will feature brief back-and-forths with "stakeholders" from all 30 teams. A collection of bloggers, analysts, mainstream writers and senior front office personnel will join us to discuss a specific team's hopes for 2010. Some will be in-depth, some light, some analytical, some less so but they should all be fun to read and we are thrilled about the lineup of guests we have teed up. Today it's R.J. Anderson on the Tampa Bay Rays.
 Patrick Sullivan: I know it's a bit trite at this point but since we touched on it in the Yanks and Sox previews, I figure we might as well get it out of the way. Talk about the AL East and what it takes for a team like the Rays to compete.
R.J. Anderson: Luck is the most important factor besides talent. Look at the 2008 Rays and compare them to some of those teams the Blue Jays featured; that Rays team was better, but those Jays teams were nothing to sneeze at, and yet they only finished above third once in their entire run. Even the Yankees need some good luck in the sense that they need to avoid bad luck. Variability comes into play and -- if I may borrow a tired cliché – that’s why we play the games.
The most given answer is money. Not necessarily payroll, after all, the Rays are sporting a franchise high amount of it right now, but revenue. The truth is the Rays will never compete with the revenue streams that Boston and New York has. And part of that is natural. They don’t need a top five revenue stream to compete most years; they just need their market to come through for them. That leads to another often asked question: If the Tampa Bay area won’t back one of the best-ran organizations in all of sports producing a winning product in the toughest division in baseball, then what will they support?
PS: The Rays look excellent again in 2010, but to me that's because I think there are some real improvement candidates and some younger players who figure to be bigger impact guys. They also will probably play closer in line with their pythag. But with all that said, what did you think of their off-season? Did they leave an opportunity or two to make bigger improvements on the table? Or, Rafael Soriano aside, was more or less sitting tight a wise move given all the talent in the organization?
RA: It seems most previews dismiss the Rays’ off-season as a bunch of nothing. Their main non-Rafael Soriano addition was Kelly Shoppach. Not a sexy name, but he’s a league average hitter at catcher and turns into Albert Pujols against lefties. They also re-signed the ever useful Gabe Kapler, and added Hank Blalock and Joaquin Benoit on minor league deals.
There were talks with just about every left-handed designated hitter type on the market. From Johnny Damon to Russell Branyan to Jim Thome; Blalock won out, probably because he came on a minor league deal, but obviously they held interest in adding someone just in case Pat Burrell continued his exodus to the island of replacement level players.
Clearly the front office felt comfortable rolling with what they have. Why not? The 2009 team was better than their record suggests. There’ s also the depth that you reference. How many teams would be able to trade Scott Kazmir, Edwin Jackson, Jason Hammel, and Mitch Talbot within a calendar year and still have a well above average rotation?
PS: B.J. Upton and Pat Burrell. What do you expect of them in 2010?
RA: Boy, that’s a tough one.
Upton has looked fantastic in spring training, not statistically, but taking the ball the opposite way and avoiding pitchforks and hatchets from the locals. Really, people are concerned about whether he’s going to spend this season pouting about losing in arbitration and it’s ridiculous. After his outstanding 2007 season, the Rays actually lowered his salary and how did he respond? By posting his best career WAR, and doing it with a torn labrum. He’s become Tampa Bay’s version of J.D. Drew, only with “thug” undertones. Totally looking forward to when Upton signs a huge free agent deal and then gets slammed by the locals for being greedy and money hungry.
As for Burrell, you’d have to think he’s going to regress against lefties if not overall. He was also dealing with a neck injury for most of the season and boy, let’s hope that neck injury really took its toll. I guess the good news, is that even if he doesn’t, the Rays do have some alternative options. Blalock will pound righties, although he’s nothing special. There’s always the option of having someone like Matt Joyce DH while Ben Zobrist and Sean Rodriguez (or Kapler) play the field.
Plus they have players like Ryan Shealy and Dan Johnson sitting around in Durham. Make no mistake, these aren’t options of Frank Thomas or Edgar Martinez stature, but there’s enough of them laying around that someone might play the role of 2008’s Eric Hinske or, select your deity willing, 2007’s Carlos Pena. They might be run by Wall Street alumni, but they don’t follow the Black-Scholes model on risk assessment.
As for expectations, I think Upton returns to his four win self and gets chastised for not smiling enough. Conservatively, I’m just hoping Burrell turns into league average hitter.
PS: Understanding you can't know what will happen on the injury front, what will the starting rotation be on September 1st?
RA: Presumably the same as it will be on April 5th. Jeremy Hellickson will warrant a spot eventually, but who do you bump for him? Between Jeff Niemann injury history and unlikelihood to replicate 2009 he seems like the ugly duckling of the bunch. James Shields is going nowhere, maybe Matt Garza if he gets too expensive, but that seems a little ways out. Wade Davis and David Price seem unlikely to be dealt too. Plus Niemann makes Steve Trachsel look decisive and quick-paced on the mound. There’s a reason he’s called the Big Nyquil.
PS: Finally, talk about the near and long-term picture for the Rays. How much will their financial situation hurt them? Is there enough talent stockpiled so that it doesn't matter? Do you think a World Series window closes this year, or can they compete at a 95-win level - seemingly what it takes in the AL East, for years to come?
RA: The ludicrous thing about the Rays is that they’ll probably lose Rafael Soriano, Carlos Pena, and Carl Crawford this off-season. And when they do and replace them with Alex Torres, Matthew Sweeney (or whomever), and Desmond Jennings, they will project to be an above .500 team. Lots of things can change in a matter of 12 weeks, so trying to project what happens in 12 months is futile.
Even so, I think I can go on record and suggest that 95 wins is more likely to occur in 2010 than 2011, but I don’t know. They have $40 million coming off the books, and yeah, payroll will drop, but of course it will. They can take half of that freed cash and sign a first baseman who gets frozen out of the market and you might be looking at a 83-85 win team that still has upside and has enough cash to make a splash when they feel the time is right.
Even when this team is down, it won’t be in the cellar. The player development and scouting departments are simply too good to produce teams of that quality anytime soon.
PS: Thanks a lot, R.J.
R.J. Anderson writes for FanGraphs and Bloomberg Sports and can be found on Twitter @r_j_anderson. He endorses DRaysBay as the home to analysis of all things Rays.
| Behind the Scoreboard | March 30, 2010 |
Hitter Scouting Reports
One of the interesting statistics that can be found over at Fangraphs is how hitters perform against different types of pitches. Presumably using this data, we can see how well hitters handle various pitches, be it fastballs, sliders, curves, cutters, etc. The statistic of interest is the Runs Above Average per 100 pitches statistic (for instance, for fastballs, the stat is wFB/C, denoting the runs above average the player contributed per 100 fastballs).
At first blush it would seem that we could identify the best fastball hitting players in baseball from this statistic. Likewise, with curveballs, sliders, change-ups, etc. However, one of the big problems with this data is it is very noisy. One year, a player may appear to hit best against fastballs, while the next year it may be curveballs. For instance, in 2007 it appeared that Aramis Ramirez hit very well against curveballs (wCB/C of 5.09), while the next year he hit curveballs very poorly (wCB/C of -2.53). This past year, he appeared to be about average. One of the key questions is whether these fluctuations are real, and whether these stats, in general, can be trusted.
For this analysis, I looked at five pitches: the fastball, the slider, the cutter, the curveball, and the changeup. For each of these pitches I gathered data for all 212 players with 400 or more PA's in the 2008 season.
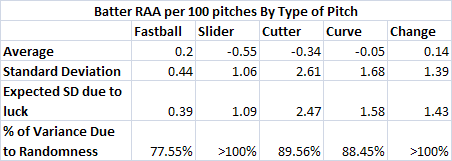
Here's how the basics broke down: Relative to their overall abilities, hitters did best against fastballs (.20 RAA per 100 pitches) and change-ups (.14 RAA per 100 pitches), about average against curveballs (-.05 RAA per 100 pitches), and worse against cutters (-.34 RAA per 100 pitches) and sliders (-.55 RAA per 100 pitches).
These averages are fine, although what I'm really interested in is how individual batters varied. Are some hitters really better at hitting the fastball? And what's the spread of the distribution?
As a first step I subtracted each hitter's RAA per 100 pitches for each pitch by their overall average RAA per 100 pitches. Obviously someone like Albert Pujols hits well against pretty much all pitches, but I'm interested in which pitches he hits best. This adjustment takes care of that.
More interesting is the distribution of talent regarding the ability to hit each type of pitch. The standard deviation of hitter abilities for each pitch (weighted by the number of plate appearances) is the following:
Fastball: .444
Slider: 1.06
Cutter: 2.61
Curve: 1.68
Change: 1.39
Again, at first glance, it appears that the fastball has the smallest variation in the ability to hit them, while cutters have the least. But of course, a lot of this variation is due to chance alone. Not that many cutters are thrown, so of course the variation on RAA per 100 pitches will be fairly high.
What we can do is to calculate the expected variance due to chance alone. Knowing that the standard error for RAA on a typical 600 PA season is 10.75 runs, we can work backwards and find that the standard deviation for RAA on a single pitch is .2243 (10.75/(600*3.83)^.5). Knowing this, we get the following estimates for amount of variability that is expected to occur just by chance:
Fastball: .391
Slider: 1.09
Cutter: 2.47
Curve: 1.58
Change: 1.43
As you can see by comparing these figures to the ones above, most of the variability in performance against various pitches can be explained by chance alone. In some cases (change-ups, sliders), the variability expected by chance even slightly exceeds the actual variability in the data. This indicates that basically there is no "real" difference between batters in the ability to hit the change-ups and sliders thrown to them (more on this in a moment).
For the other pitches, the ratio of the variances tells us how much we need to regress each hitter's data. For fastballs, we have to regress 77%, while cutters and curves must each be regressed 89%. Most of the variability is due to chance alone. For instance, in 2008, Adam Dunn had an RAA that was 1.11 runs per 100 pitches better than his average production. However, when we regress based on the above, we get than Dunn was just .43 runs per 100 pitches better against fastballs - not all that much different than a normal hitter, who was .22 runs better against fastballs.
With luck accounting for so much of the variability in the above data, the RAA per 100 pitches figures for Fangraphs are fairly limited in their use. In fact, for all pitches except for fastballs, the observed variability was not significantly different from the variability expected by chance, leading one to believe that there may not be any true talent difference at all.
So what does this all mean? We've all seen players who "can't hit the curveball" or are "great fastball hitters". Does this analysis show that these players don't exist at all. Not so fast. While it does show that the players don't seem to actually hit pitches differently, we are ignoring another extremely important factor - how often the batter sees each pitch.
It stands to reason that pitchers would throw more curveballs to the player who "can't hit the curve" and less fastballs to great fastball hitters. And presumably they'll throw fewer and fewer fastballs and more and more curveballs until the batter starts to expect the curve and his efficacy against the curveball actually begins to match his ability against the fastball. In a game theory sense, the game would reach an equilibrium when expected RAA was the same for each pitch. A batter may be a truly better fastball hitter and a weak curveball hitter, but as pitchers throw fewer fastballs, their fastballs become tougher to hit because the batter sees them less often. Likewise if the pitcher throws mostly curveballs, the batter can sit on the curve and he will begin to hit better against that pitch. In a nutshell, pitchers throw fastball hitters fewer fastballs, making them more of a surprise and tougher to hit, and as a result, the batter's RAA per fastball decreases. At least, that's my theory.
So, an important follow-up is whether some hitters do indeed see fewer fastballs than others. The average and standard deviations of how often hitters see each type of pitch can be seen below.
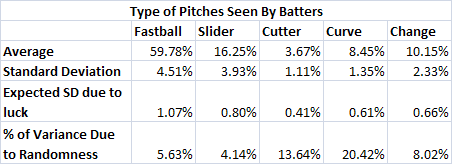
As you can see, very little of the variation in the types of pitches seen is due to chance. This means that there is a reason that some batters see more of one type of pitch than others. Presumably, the reason is due to scouting reports which indicate how to best pitch particular hitters. Alexi Ramirez saw a fastball a league-low 47% of the time. Meanwhile, Juan Pierre saw a fastball over 70% of the time. Those differences are no fluke. Unlike the RAA per pitch data, these percentages are stable. Ramirez was pitched fastballs just 50% of the time in 2009, while Pierre has seen about 70% fastballs in each year of his career.
So, given that there are very little "true" differences in the actual RAA per pitch, but there are significant and consistent differences in the way that hitters are actually pitched, this leads me to believe that the best indicator of a hitters strengths is the proportion of pitches thrown to him. RAA per pitch, while a cool stat, has so much variability that it's rendered nearly useless. The percentage of fastballs (or other pitches seen) is a much more stable and reliable indicator of a batter's strengths and weaknesses. In essence, the advance scouts have already done our work for us in identifying a batter's abilities. To find a hitter's strengths and weaknesses, all we have to do is watch how teams pitch to him.
A last look at this subject is examining the relationship between RAA per 100 pitches and the percentage of each type of pitch seen. If my game theory presumption were true, we would see basically no relationship between the two variables. The graphs below show the relationships.
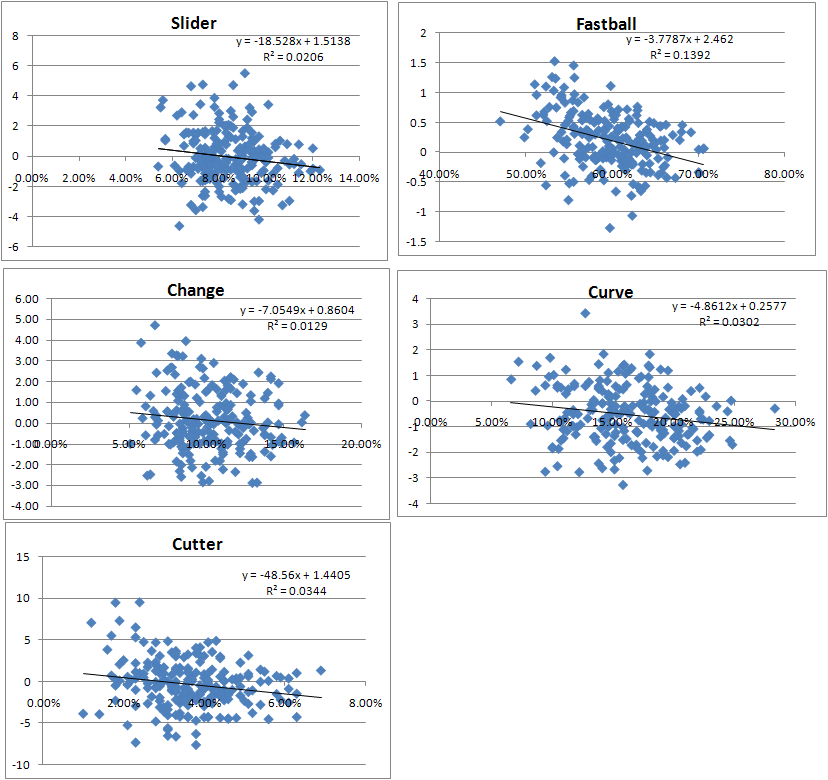
As you can see, the RAA per 100 pitches and the percentage of pitches seen have basically no relationship for sliders, cutters, change-ups, or curve balls. For fastballs there is a weak relationship, showing that hitters who get fewer fastballs are better at hitting them. From a game theory perspective it shows that pitchers could throw even fewer fastballs than they do already to good fastball hitters (there may be other factors to consider besides just optimizing the outcome of each individual pitch, however, so there may be other good reasons why pitchers would continue to throw fastballs to a good fastball hitter).
Overall, this has been a somewhat sprawling piece on a tricky topic, so I'll sum up. Looking at the evidence, it appears that when trying to identify a hitter's strengths and weaknesses against particular pitches, looking at how he actually did against those pitches is not a particular useful measure. More indicative is the frequency which a batter was thrown each pitch. The better a hitter is against a particular pitch, they less often he will see it. This entire issue of selection bias is an important one to consider, especially when doing pitch f/x analysis or other pitch-by-pitch studies.
| Baseball Beat | March 29, 2010 |
Up (Hey)Ward and On (Hey)Ward
The Atlanta Braves announced on Friday that Jason Heyward, the consensus No. 1 prospect in baseball, will be the team's right fielder on Opening Day. Bobby Cox, in his last season as the club's manager, told the 20-year old in a three-minute meeting in the clubhouse, "I'm delighted to tell you you're on the team, Jason, simply because you make us a better team."
Cox told the media, "He's as good a player as I've seen all spring—our team, any other team."
What should we expect from the superstar-in-the-making in his rookie season in the majors? To get a better handle on that question, I turned to some of the most well-known projection systems as shown below:
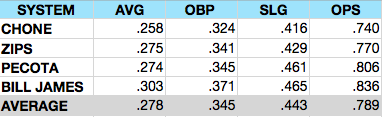
On average, the projection systems believe Heyward will hit .278/.345/.443. For perspective, that line is virtually identical to the following seven players over the past three years:
While Heyward's projected stats may be impressive for a young man who was playing high school baseball in Georgia three years ago, they look rather pedestrian from the standpoint of comparable players. However, if he were to match Bill James' projections or BP's 70th percentile (.290/.362/.497), then you would have something a bit more special as comps such as Andre Ethier, Nick Markakis, Andrew McCutchen, Victor Martinez, and Troy Tulowitzki come into play.
In the real world, Heyward hit a combined .323/.408/.555 at three minor-league levels (A+/AA/AAA) last year. He hit for average and power while drawing 51 walks and striking out only 51 times. His plate discipline is unusual for someone his age. Furthermore, the 6-foot-5, 240-pound lefthanded hitter is 17-for-49 (.347/.467/.490) with four doubles and one home run in 18 games and 58 plate appearances this spring. He has walked and struck out nine times each. Heyward has stolen four bases in five attempts, which is in line with his MiLB rate (26 SB and 5 CS).
Heyward was scratched from Sunday's game against the Nationals with left shin splints. He is expected to sit out the next few days but should be good to go when the Braves open the season at home on Monday, April 5 vs. the Chicago Cubs. The game is scheduled to be televised on ESPN.
| Designated Hitter | March 27, 2010 |
Pat Rispole and the 1957 Brooklyn Dodgers
Author's Note: While it is safe to say anyone who visits this blog knows something about the Brooklyn Dodgers, few people know anything about Pat Rispole. Pat lived in Schenectady, New York. He taped an astounding number of baseball games during his lifetime. In 1957 Pat taped Brooklyn Dodger broadcasts. After the Dodgers moved to Los Angeles, he taped Yankee games. Beginning in 1962, Pat taped New York Met games. He taped many World Series broadcasts. Pat also recruited people from around the country to tape baseball games. Pat traded reel-to-reel tapes he had from his extensive sports and non-sports collection to people who taped baseball broadcasts for him. Pat Rispole died at the age of 53 on June 10, 1979. A portion of Pat's enormous audio collection was sold after his death to John Miley, who purchased many of Pat's sports tapes, and to Phil Gries, who purchased many of Pat's non-sports tapes. Phil has catalogued the tapes he purchased from Pat's collection and the numbers are amazing. Phil has 3,131 audio broadcasts from the years 1957 to 1977, mostly consisting of TV shows, with a few radio broadcasts mixed in. A few dozen Met and Yankee radio broadcasts from 1972 that somehow were not included in the sports tapes sold to John Miley were included in the tapes sold to Phil Gries. Pat Rispole left us with audio treasures that live on long after his death. I hope this article will inspire someone to write a more detailed article about Pat and the recordings he made.
On April 16, 1957, Pat Rispole tuned in Albany radio station WOKO, threaded a tape onto his reel-to-reel tape recorder, and pushed the record button before the Phillies Robin Roberts delivered the first pitch of the game and season to Brooklyn Dodger lead-off hitter Jim Gilliam. Twelve innings later, after a 7-6 Dodger victory, Pat had a complete-game broadcast preserved on tape. Clem Labine got the win that night, but Pat Rispole deserves credit for the save.
Twelve 1957 Brooklyn Dodger radio broadcasts, including the season opener mentioned above, are currently available for sale to the public. Years ago John Miley transferred the 1957 Brooklyn Dodger broadcasts discussed in this article from Pat Rispole's reel-to-reel tapes to cassette tapes and then later, as technology changed, to CD's. John sold the cassettes and CD's to the public through the Miley Collection. John had former Boston Red Sox broadcaster Ken Coleman put a brief statement on each cassette and CD that he sold. In every Miley Collection recording I have heard, Ken Coleman's opening remark is the same: "This is Ken Coleman speaking. We present for you another complete game broadcast from the Miley Collection. We hope that you enjoy." Well, that's good enough for me. I hope you enjoy what follows.
April 21, 1957 Pirates/Dodgers at Ebbets Field
The Dodgers brought a 3-0 season record into the first game of an Easter Sunday doubleheader against the Pittsburgh Pirates. This game, recorded by Pat, was the first Dodger loss of 1957. When the season ended, there would be sixty-nine others to add to it. Brooklyn won eighty-four games in 1957, so the Bums had a good year.
Don Newcombe was hit hard and often in this 6-3 loss to the Pirates. In the third inning, Newcombe gave up back-to-back-to-back solo homeruns to Frank Thomas, Paul Smith and Dick Groat. Newcombe was removed with one out in the third, after giving up four earned runs and seven hits. Rene Valdes pitched effectively in relief, going 3 2/3 scoreless innings before being replaced by pinch-hitter Sandy Amoros. The final Pirate runs were scored on a two-run homerun by Bob Skinner off of Sandy Koufax.
Brooklyn was held to two hits by the pitching of Vern Law, Bob Purkey and Roy Face. The Dodger runs were scored in the ninth on a three-run homerun by Carl Furillo. The only other Dodger hit was a fifth inning single by Gil Hodges.
May 7, 1957 Reds/Dodgers at Ebbets Field
A Dodger fan might not want to hear what was preserved on Pat's tape. The Cincinnati Reds won 9-2, although the game was not as lopsided as the score indicated. Going into the top of the ninth, the Dodgers trailed 4-2. Dodger relief pitchers Ed Roebuck and Ken Lehman were hit hard in the ninth, and the Reds turned a close game into a rout. Hal Jeffcoat pitched a complete game for the Reds, allowing six hits, three walks, and two unearned runs.
The major baseball headline that night was not the Dodger loss. In the second inning of the broadcast, Dodger announcer Al Helfer relayed the sad news that in the Cleveland-New York game young Indians pitcher Herb Score was hit in the face by a line drive and carried from the field on a stretcher. The injury cut short what looked to be a brilliant career.
May 14, 1957 Dodgers/Braves at County Stadium
This broadcast recorded by Pat Rispole must be heard to be believed. In 6 2/3 innings, Milwaukee starter Bob Buhl walked nine, gave up five hits, and came away with a 3-2 victory. In the sixth inning, Buhl walked the bases loaded with none out. Roy Campanella lifted a fly ball to Braves' right fielder Hank Aaron for the first out of the inning. Carl Furillo, the Dodger runner at third, was anchored to the bag even though Hank Aaron's throw was to third base. Vin Scully, mentioning to his listeners that the Dodgers had squandered a gift run, described Furillo angrily kicking the third base bag after the play was over. The baserunning gaffe was highlighted when Buhl struck out Don Zimmer and retired Don Newcombe on a pop fly to shortstop Johnny Logan to end the inning. The Dodgers scored two runs in the seventh, but the squandered chance in the sixth proved costly in a 3-2 Dodger defeat. Newcombe pitched effectively, but got the loss.
May 30, 1957 Dodgers/Pirates at Forbes Field
This first game of a Memorial Day doubleheader, recorded by Pat, was a 4-3 Dodger victory. The Dodgers won behind the pitching of Sal Maglie. Brooklyn scored its runs in the middle innings against Pirate starter Vern Law. In the fourth, Duke Snider singled in Gino Cimoli; in the fifth, Don Zimmer hit a sacrifice fly that scored Roy Campanella; and in the sixth, Duke Snider hit a two-run homerun. Clem Labine preserved the Dodger victory with 1 1/3 innings of shutout relief.
June 4, 1957 Cubs/Dodgers at Ebbets Field
To the delight of everyone who has heard this game, Pat Rispole recorded an absolute gem of a broadcast. Sandy Koufax was the Dodger starter, and as was the case so often, the combination of Koufax and Vin Scully was sensational. Read the words, but try to imagine Vin saying them:
"Just the start of things, so pull up a comfortable chair. If you want to take your shoes off, go ahead, wiggle your toes, and we hope you'll have a cold Schafer or two throughout the evening. Dodgers and Cubs opening the homestand.""1 and 2 pitch, fast ball got him swinging, and that thing was moving, so maybe Koufax is starting to loosen up a little bit. He wasn't very fast to Morgan or Speake, but that last strike to Ernie Banks had something on it."
"The runners go, the 3-2 is cut on and fouled away down the right field line on top of the roof and out of the ballpark. So the kids that are listening to the ballgame on the soda-pop stands outside, you'll run that one down, almost to Bedford Avenue."
"Koufax ready, now the 1-1 pitch, fastball cut on and missed and that was moving, 1 and 2. So one thing I'm pretty sure about this stage of the game now, Koufax has loosened up. He appeared to be a little stiff pitching to Morgan, even though he struck him out. Pin-wheeled his arm around, did a couple of knee bends, now he's starting to pitch with a loose motion."
"We understand at the agency, that we now have a young girl writing commercial copy. And I'll bet ya her fine hand was in that last one, 'sunlight on a drift of snow.' Well, all right. (In the background, Jerry Doggett is heard saying, 'Thanks Vin.') (Vin laughing lightly) Zimmer batting .229. (The commercial played between innings and read by Jerry Doggett included the line, 'And when you lift a glass of Schaefer, man it's like sunlight on a drift of snow.')"
"And the strike one pitch, fastball cut on, there is a high foul to the right of the plate. Neeman coming back, right to the lip of the dugout, and can't make it. The ball lands on the roof. And somebody makes a great catch by the name of Barney Stein. Barney who takes great sports photos for the New York Post, he's also the Brooklyn Dodger official photographer. And that thing kangarooed from the dugout roof right up into the camera booth, and there was Barney to grab it. He dropped a nine thousand dollar camera in the process. No, not really."
"I might have said earlier, with the first two batters up there, that Koufax appeared not to be loose. But now he is firing. He struck out the side in the second inning."
Koufax no-hit the Cubs through 5 1/3 innings, striking out eight batters in the process. With Bobby Morgan on base via a walk, Bob Speake broke up the no-hitter and shutout with a homerun. The Dodgers, leading 7-2, allowed Sandy to pitch into the eighth inning, when he ran into trouble again. A single by Bobby Morgan and a walk to Bob Speake brought Ernie Banks to the plate with one out. Banks belted a three run homerun to narrow the Dodger lead to 7-5. Koufax retired Lee Walls, but when Frank Ernaga doubled, Walt Alston lifted Koufax for relief ace Clem Labine. In 7 2/3 innings, Koufax walked five, struck out twelve, and gave up five earned runs on four hits. Labine pitched out of trouble in the eighth and ninth innings to secure the Dodger victory.
The Dodger offense got started early with three first inning runs. The big hit in the inning was a two RBI double by Roy Campanella off the Schaefer scoreboard in right. Brooklyn scored three more in the third to break the game open. The final Dodger run was a fifth inning solo homer by Gil Hodges against pitcher/author Jim Brosnan.
July 14, 1957 Braves/Dodgers at Ebbets Field
A come from behind victory is always fun if your team gets the win. The Dodgers trailed 2-1 going to the bottom of the ninth in this game recorded by Pat. In the ninth, Gino Cimoli reached on a leadoff walk. Gil Hodges then belted the first pitch he saw from Braves starter Bob Buhl over the left field wall. Gil's homerun made Johnny Podres, pitching in relief of Sal Maglie, a winner by a 3-2 score.
At the close of play on July 14th the Dodgers were tied for fourth place with the Reds. The Dodgers were only 2 1/2 games behind the first place Cardinals. The sixth place Giants were nine games out.
July 20, 1957 Cubs/Dodgers at Ebbets Field
Twenty-one year old Don Drysdale was the starter and winner in this 7-5 Dodger victory recorded by Pat. The Dodgers scored four runs in the first to overcome a first inning Cub run. Ex-Cub Randy Jackson's solo homer in the sixth gave the Dodgers a 5-1 lead. The Cubs were able to make the game uncomfortably close with three unearned runs in the seventh inning. Clem Labine secured the Dodger victory with 2 1/3 innings of one run relief pitching.
After the July 20th victory, Brooklyn was in second place, 1 game behind Milwaukee. Only three games separated the top five teams in the league. The sixth place Giants were 11 games behind the Braves.
July 28, 1957 Dodgers/Reds at Crosley Field
Johnny Podres and Carl Furillo were the pitching and hitting stars in this 7-2 Brooklyn victory recorded by Pat. Podres was a masterful pitcher on the road all season long, and this two run complete game performance against the Reds was no exception. Podres fell behind 1-0 in the first after giving up a RBI single to Frank Robinson. The Dodgers tied it in the third, and then in the fourth Carl Furillo hit a grandslam against Reds starter Brooks Lawrence. The Dodgers scored two in the eighth and the Reds answered in the bottom of the inning with a Ted Kluszewski pinch hit solo homerun to finish the scoring for both teams.
At the close of play on July 28th the National League pennant race was tightly bunched at the top. The first place Braves were 1 1/2 games ahead of the third place Dodgers, and only 3 games ahead of the fifth place Phillies.
August 5, 1957 Giants/Dodgers at Ebbets Field
This game recorded by Pat was the opener of a four game series against the Giants. Don Drysdale pitched 8 2/3 innings to earn his ninth victory of the season in a 5-2 Dodger win. Clem Labine got a one out save by retiring Willie Mays on a ground ball to shortstop Charlie Neal to end the game and strand two Giant runners on base The Dodgers scored single runs in the second, third and fifth to take a 3-2 lead. Two insurance runs in the seventh made a nervous ninth inning easier to bear.
The Dodgers lost the next three games of the series to the Giants. The August 7th loss was crushing. Brooklyn gave up five runs in the ninth inning to turn a 5-3 lead into a heartbreaking 8-5 loss in a game played at Roosevelt Stadium in Jersey City, NJ. The three defeats sent Brooklyn into a tailspin that coincided with a hot streak for Milwaukee. From August 6th to August 18th, the Dodgers played exclusively against two second divisions teams, the Pirates and Giants. During that stretch Brooklyn went 5-9. The Braves during that same stretch went 10-3 playing against two first division teams, the Reds and Cardinals. At the close of play on August 18th, Brooklyn was in third place, 7 1/2 games behind first place Milwaukee. Brooklyn was still in a pennant race, but things were not looking good.
August 31, 1957 Giants/Dodgers at Ebbets Field
This 7-5 Dodger victory recorded by Pat was the next to last game ever played between the Dodgers and Giants at Ebbets Field. Ed Roebuck was the pitching and hitting star. Roebuck pitched 3 1/3 innings of shutout relief and hit a solo homerun. The Dodgers took a 4-2 lead in the fifth inning on a two run homerun by Gil Hodges. The Giants took the lead away in the sixth on three unearned runs. With two outs and none on in the bottom of the sixth, Roebuck singled to start a two run rally that gave the Dodgers the lead. Roebuck added an insurance run with his homerun in the eighth.
Brooklyn was in second place after the victory, 7 games behind Milwaukee. A doubleheader loss to the Phillies at Ebbets Field a few days later on Labor Day all but eliminated the Dodgers in the pennant race. The double defeat dropped the Dodgers to third place, 10 games behind the Braves.
September 8, 1957 Dodgers/Giants at the Polo Grounds
This Sunday afternoon game is the last game of the season currently available to the public from the recordings Pat Rispole made of 1957 Brooklyn Dodger broadcasts. Any baseball fan with a sense of history should listen to it. The game, the last meeting ever between the historic New York rivals, was won by the Giants, 3-2. Jerry Doggett broadcast the first four innings and a somber Vin Scully took over in the top of the fifth. Vin, contemplating the likely departure of the Dodgers and Giants from New York at the end of the season, was at his brilliant best:
"I don't know how you feel about it at the other end of these microphones, whether you are sitting at home, or driving a car, on the beach or anywhere, but I know sitting here watching the Giants and Dodgers apparently playing for the last time at the Polo Grounds, you want them to take their time, 2-0 pitch is low ball three, you just feel like saying: Now don't run off the field so fast fellas, let's take it easy, we just want to take one last lingering look at both of you.""Yes, the Giants and the Dodgers, baseball's greatest rivalry, being played for perhaps the last time at the Polo Grounds. And it doesn't make you feel very good."
"Well it's funny, but being a kid raised in New York and you sit here watching this ballgame and looking at the Polo Grounds, and your memories go wild. Strike one pitch to Gino is down low. Not just baseball, they had some great football games, and great stars who played here at the P.G. You can almost see them running around out there...... Did you ever see a Fordham-St, Mary's football game, years ago before the war? That's something you remember."
"We roll to the last of the sixth inning in this ballgame, the last time these two teams will play at the Polo Grounds. Memories, memories."
"And so to the ninth inning, what very well may be the last inning ever played here at the Polo Grounds between the Giants and the Dodgers."
"So if it is the last inning of the last game to ever be played between the Giants and the Dodgers here at the Polo Grounds, if time is going to slam the door on this great rivalry over here, then Sandy Amoros has the privilege of being the fellow with his foot in the door, trying to keep it open. Amoros hitting for Eddie Roebuck."
"Marv [Grissom] ready, the 1-1 pitch to Amoros, cut on and bounced down to O'Connell, Danny up with it, he throws, that does it. The New York Giants saying good-bye to the Dodgers and vice-versa here at the Polo Grounds and the Giants win it 3-2. We'd be remiss [not] to say it's kind of a sad day for everybody concerned, if this will be the final game played here."
"And you just kind of say good-bye and let it go at that. I guess everybody has his own thoughts, and that will do it. Final score 3-2 New York."
Although the September 8th Dodger-Giant game is the last recording made by Pat from the 1957 Dodger season that is currently available for sale to the public, one other game, the last game ever played by the Brooklyn Dodgers, is so significant that I would like to review it briefly. No article about the Dodgers final year in Brooklyn would be complete without it.
On September 29th the Brooklyn Dodgers ended the 1957 season at Connie Mack Stadium against the Philadelphia Phillies. Ed Bouchee hit a two-run homerun to give Philadelphia the only runs they needed in a 2-1 victory. Brooklyn born Sandy Koufax was the last pitcher to throw a pitch for the Brooklyn Dodgers when he retired Willie Jones on a strikeout. The catcher who caught Sandy's last pitch was Brooklyn-born Joe Pignatano. In the ninth, Bob Kennedy hit a fly ball to Phillies centerfielder Richie Ashburn for the final out of the game and season.
The next Dodger regular season home game was played in Los Angeles. The 1958 Dodger home opener was not broadcast on an upstate New York radio station. If it had been, Pat Rispole probably would have recorded it.
*******************
Sources and notes:
Retrosheet was on my computer almost constantly while I wrote this article. What a fantastic website. The information on Retrosheet is free and copyrighted by Retrosheet. Interested parties may contact Retrosheet at www.retrosheet.org.
The broadcasts recorded by Pat Rispole were the other main source I used in writing this article. John Miley has released some of Pat's many baseball recordings, including all the Brooklyn Dodger radio broadcasts I have discussed in this article, in his Miley Collection. I have been a customer of John since basically forever. He has never failed to provide quick and reliable shipment of the orders I have placed with him. I thank John for a lengthy phone conversation I had with him several years ago. I didn't take any notes about the conversation at the time, but notes weren't needed. What John told me was so interesting I could not forget it. I am not sure I would have written this article unless I had that conversation with John Miley.
Phil Gries has been very helpful to me from my first email to him. Phil purchased many of Pat Rispole's non-sports tapes. I thank him for some very interesting emails. Phil attended the July 4, 1957 doubleheader at Ebbets Field against the Pirates. How I envy him; I wish I had seen a game at Ebbets Field. Phil lived in Brooklyn on Bedford Avenue, which makes him a legend in my book.
I spoke on the phone to John Furman, a friend of Pat, for about twenty minutes on February 15, 2010. I thank him for an interesting conversation about his friend. I also thank Paul Thompson, who sent me informative emails about taping baseball games for Pat and getting tapes from Pat in return.
Thanks, too, to Donald from Detroit, AKA Polo Grounds 1957, whose last name I do not know and whose internet comment years ago made me aware for the first time of the name of the fellow who taped all the games that I enjoyed hearing so very much.
I also thank Pat Rispole. RIP. In my phone conversation with John Furman, John described Pat as being quiet, articulate, kind, and generous. Anyone who enjoys listening to baseball broadcasts from the 1950's and 60's should join me in thanking Pat, for he is the person most responsible for the rich audio history we have of baseball radio broadcasts from that era. I have enjoyed writing about him. I hope the readers of this blog have enjoyed learning a little about someone who did so much to preserve an important part of baseball history.
Update (4/16/10): Stan received his wish as Jennifer Gish of the timesunion.com wrote a "more detailed article about Pat and the recordings he made." Congrats to Stan and Pat.
| F/X Visualizations | March 26, 2010 |
Comparing Division Projections
Last week I did a statistical comparison of a handful of system's team win totals. Here I am going to take a division-by-division graphical approach to highlight: the amount of agreement between they systems in each division, which teams are the favorites within each division, and the relative spread in talent within each division. I use the same six projection systems from last week.
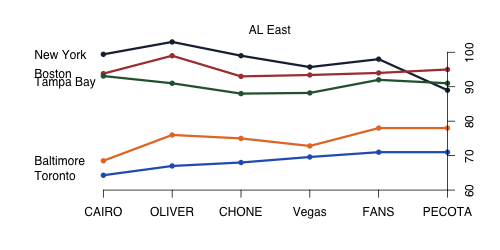
The AL East, unsurprisingly, has two tiers that are separated by a big gap. Three 90-win teams and two sub-80 win teams. No other division has quite the spread. All the projection systems see these two tiers, and all the systems but PECOTA project the same NY-BOS-TB-BAL-TOR ordering. This is the most consistently-predicted division, with only PECOTA as a slight outlier. CAIRO and OLIVER see the biggest spread between the two tiers.
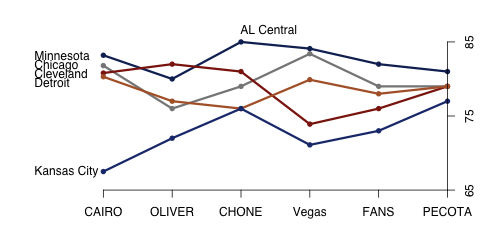
I readjust the y-axis for each division, so even though the spread between the lines looks similar in this case it is much less than in the AL East. And ignoring Kansas City most of the projection systems see not much separating the top-four teams. Even so Minnesota seems to be the team to beat with only OLIVER not projecting the most wins for Minnesota, and OLIVER has them a close second to Cleveland. Again CAIRO and OLIVER has the biggest spread, in this case between Kansas City and everyone else. Vegas, the FANS and PECOTA all have the same ordering.
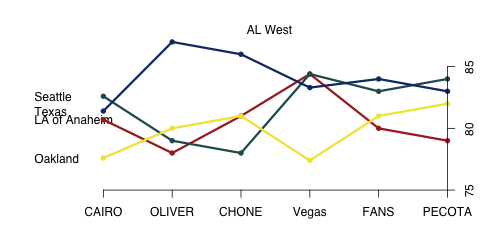
First note that the scale here is very small, there is little variation in the number of wins projected across teams in this division. Because the range of win projections is small the differences in win totals across projection systems result in very different orderings. OLIVER and CHONE like Texas, but don't think much of anyone else in the division. The other systems are pretty high on Seattle, while only Vegas thinks much of LA (Rich can take solace in at least someone respecting the Angels). But again because just 5 or 10 wins separates every team in every system there is broad consensus that the division is anyone's to win.
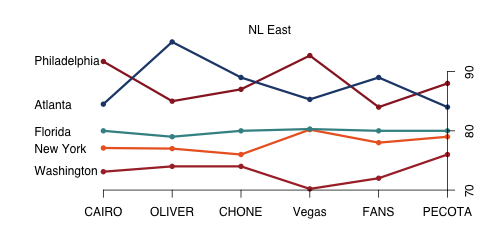
The NL East has, like the AL East, has a large spread in talent and board consensus over the ordering of teams, although not as a clear front-runner like the Yankees in the AL East. Three systems like Philadelphia the best and three Atlanta. After that all the systems see a pretty clear ordering of Florida, then New York, then Washington.
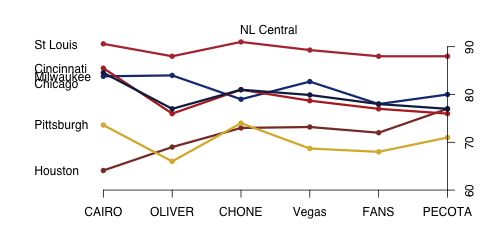
Here we have our first, and only, division with the same team projected at the top by all systems (although the Yankees were very close). After St Louis, there is a general consensus that Cincinnati, Milwaukee (dark blue) and Chicago (light blue) form a second tier and then Pittsburgh and Houston a third. The spread in talent between St Louis, at the top, and Pittsburgh and Houston, at the bottom, is quite large and seen across the six systems.
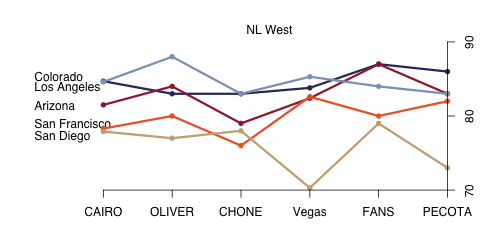
The NL West, like the AL West, is fairly muddled. Each system sees either Colorado (dark purple) or Los Angeles (light blue) as the top team, although the FANS like Arizona too. In any case each system sees the top teams fairly tightly clustered. Vegas and PECOTA see less than five games difference in talent between the top four teams. These two are also fairly down on the fifth team, San Diego.
All of this will, of course, be moot in a little over a week when the season actually starts and we can watch some baseball again.
| Touching Bases | March 25, 2010 |
Most Impvoved PITCHf/x Pitches of 2009
At Fangraphs, you can find the most valuable pitches in baseball. FanGraphs uses Baseball Info Solutions data and assigns pitches a run value based on the results of each pitch. Tim Lincecum's changeup comes out on top. A couple weeks ago, I tried my hand at finding the best pitches of 2009 by using PITCHf/x data and assigning each pitch a run value based on the pitch's physical characteristics. I didn't grant a winner, but gun to my head,* I'd have to say Matt Thornton's four-seamer or Zack Greinke's slider. As I learned in 8th-grade tee ball, no award series is complete without handing out trophies for the most improved. (Thanks again Coach Hover!)
*Actually, gun to my head, I'd have to say, "Please stop holding a gun to my head." I can't imagine anyone would be willing to use lethal force to obtain my opinion on this matter.
A quick-and-dirty, yet effective, way to tell whether or not a pitcher has improved in a given year is to simply find the difference in his fastball velocity from the previous year. Check out Dave Allen's take from this time last year. In 2009, Homer Bailey, Carl Pavano, Barry Zito, Justin Verlander, and Jon Lester all exceeded expectations. Their success could be tracked back to substantial increases in fastball velocity. I'm hoping that by looking at differences in "fxRV," which incorporates measures of velocity as well as movement and location, I will be able to find some pitchers who improved their fastballs by sacrificing velocity in favor of movement or command. Here are the top five most improved fastballs of 2009. The velocity delta is represented in terms of miles per hour and the fxRV delta in units of run value per 100 pitches.
| Pitcher | Pitch Type | Velo Delta | fxRV Delta |
|---|---|---|---|
| Mark Lowe | F4 | 1.66 | -0.87 |
| Wandy Rodriguez | F2 | 0.87 | -0.69 |
| Joel Pineiro | F2 | -0.65 | -0.60 |
| Scott Feldman | FC | 0.91 | -0.55 |
| David Aardsma | F4 | -0.57 | -0.50 |
Mark Lowe's fastball jumped from Jon Garland to Jonathan Broxton quality. Velocity was evidently the trick for Lowe, who upped his pre-2009 four-seam velocity from 94.6 MPH to 96.2 MPH. Wandy Rodriguez also greatly benefited from a boost in velo, but at the same time, he managed to add sink to his two-seamer. That's a tough task to pull off. Scott Feldman's cutter was one of the most valuable pitches in baseball last year, and there's good reason why. He broke the 90-MPH threshold with the cutter while generating an extra inch of horizontal movement. He threw it about twice as often in 2009 as he did in 2008. It wasn't the best cutter in the game—we know who that belongs to—but it was easily the most improved.
And then there's Joel Pineiro and David Aardsma. I'm not sure what I can possibly add to the discussion concerning Joel Pineiro and his sinker. I love that the numbers back up the excessive number of stories. Pineiro traded velocity for movement and command, and it made his sinker a better pitch that yielded better results. Pineiro's fastball was thrown 71% of the time last year as compared to sub-60% in years past, and its effectiveness went from 20 runs below average to 20 runs above average. I think that PITCHf/x data can be an aid to coaches in that the data can show what pitchers might want to focus on in terms of release point, velocity, movement, or location. I think Dave Duncan might inherently possess this knowledge. There's an adage that sinkerballers with tired arms throw heavier and better sinkers. PITCHf/x data can determine if the adage holds water.
Aardsma threw the highest rate of fastballs in the league last year at 87%, and he did so because he traded in velocity for overall quality. And like Pineiro's sinker, Aardsma's impressive four-seamer was well chronicled. Geoff Baker doesn't miss a beat.
The other key was Wetteland, pitching coach Rick Adair and manager Don Wakamatsu convincing Aardsma he didn't have to blow hitters away by overthrowing. They told him his fastball could still get hitters out if he took a little off it in order to hit his targets more consistently."If your strength is a fastball, then your strength is a fastball," Wetteland said. "Just work on where you can control it to all spots of the zone. Get the control down to the point where you can do what you do best..."
The key to me was, if I was already beating them with my fastball, don't try to throw it any harder," Aardsma said. "Whenever I get in trouble, it isn't because I'm throwing fastballs, it's because I'm getting behind in the count with them.
In addition, Dave Allen found reason for Aardsma's four-seam improvement.
At the other end, Rich Hill's four-seamer was the antithesis to Lowe's. Pre-2009, both pitchers' fastballs were mediocre. Lowe's became one of the best in baseball whereas Hill's became possibly the worst.
As for the most improved breaking balls...
| Pitcher | Pitch Type | Velo Delta | fxRV Delta |
|---|---|---|---|
| Ubaldo Jimenez | SL | 0.24 | -0.66 |
| Erik Bedard | CB | 0.23 | -0.62 |
| Justin Verlander | CB | -0.28 | -0.62 |
| Barry Zito | CB | 2.42 | -0.59 |
| Zach Duke | CB | 0.25 | -0.57 |
Ubaldo Jimenez found his slider last year, and he didn't shy away from it. In 2008, Ubaldo ran his fastball at 94.9 miles per hour. Even though no starting pitcher threw harder than his 96.1 MPH in 2009, Ubaldo actually dropped his fastball usage to 62.7% in 2009 against 69.8% in 2008. That's because his slider was his most improved pitch. I'm having trouble pinpointing exactly what Jimenez changed, but I think it was just a matter of throwing more strikes. Justin Verlander's curve was an entirely different animal last year. Same velocity, but twice as much movement. Erik Bedard's curve has always been really, really good. It was possibly the most unhittable pitch in baseball last year, though.
Meanwhile, Cole Hamels' curveball regressed so badly last year that he might want to rethink the pitch. He didn't throw it for strikes, he didn't get any swings, he didn't get any whiffs. I'm not sure what he was trying to accomplish with the curve last year, but he didn't get it done. Buster Olney reports that Hamels is indeed working on his curve.
I'm skeptical that the fxRV system adds any value to measuring the effectiveness of changeups and other off-speed pitches, since they're mainly built on deception and sequencing. Anyway, as compared to past years, Justin Verlander's change had better fading action, and Ryan Dempster's splitter had better bottom.
| Change-Up | March 24, 2010 |
Stakeholders - Boston Red Sox
From now through the beginning of the regular season, we will not be posting in-depth round-tables previewing each division like we have in years past. Instead we will feature brief back-and-forths with "stakeholders" from all 30 teams. A collection of bloggers, analysts, mainstream writers and senior front office personnel will join us to discuss a specific team's hopes for 2010. Some will be in-depth, some light, some analytical, some less so but they should all be fun to read and we are thrilled about the lineup of guests we have teed up. Today it's Boston Red Sox Assistant Director of Baseball Operations, Zack Scott.
 Patrick Sullivan: How many running jokes do you guys have going in the office about the meme that you have somehow chosen defense over offense? If you were to read some of the Boston press, you would think that you guys were going to struggle to score 600 runs this year.
Zack Scott: It’s all about expectations. Our 2003-05 clubs set the bar high by leading the league in scoring each year, averaging 940 runs per season. Although we haven’t maintained that level of production, we had top 3 offenses in each of the last three seasons and I don’t see why we can’t have similar results in 2010. Jason Bay was one of our best hitters and replacing his offense will be a challenge, but Mike Cameron and Jeremy Hermida will give us back some of that production and we hope that the upgrade to Marco Scutaro at short and a full season of Victor Martinez make up for any remaining difference. I’m guessing that I just set myself up for some “Jose Offerman will replace Mo Vaughn’s OBP” jokes in the comments section.
It is funny to me that some members of the media forget or just ignore the fact that we won a championship in ’07 with a team that finished 3rd in runs scored and 1st in runs allowed. That club pretty much went wire to wire because we were a balanced team and we’re striving for that again in 2010.
PS: The 2007 comp is one I have tried to make a few times. Sure there was a totally unconscious David Ortiz pacing that lineup, but the 2009 versions of Kevin Youkilis, Victor Martinez and J.D. Drew would have been the 2nd, 3rd and 4th best hitters in that World Series winning lineup.
Speaking of 2007, one of the keys to that team's formula was a total shut-down bullpen. Understanding that these things can be difficult to project, what do you think of the 2010 relief corps? If I can be candid, for the first time in recent memory I think there are some legitimate questions out there. There seem to be enough solid arms in the organization for it to work itself out as the season progresses but in the interim, the onus is on Tito to figure out his bullpen personnel by trial. What are your impressions of the relief corps? Do the steps back that guys like Jonathan Papelbon, Hideki Okajima, Manny Delcarmen and Ramon Ramirez took in 2009 concern you?
ZS: It’s ironic that you praised our ’07 pen while expressing concern about this year’s group. Heading into the ’07 season we felt good about our lineup and starting rotation but didn’t quite know what to expect from guys like Okajima and Delcarmen.
Regarding our 2010 bullpen, I expect it to be a strength and think there are only a few teams that can match it. I realize that there were some performance blips but we have a good mix of power and experience. It will be especially interesting to watch the ongoing development of Daniel Bard. I also think that we improved our depth from a year ago by bringing in guys like Boof Bonser, Scott Atchison, and some solid minor league free agents.
PS: When you say you expect the bullpen to be a "strength", do you think that relative to your MLB competition? Or do you mean relative to other components of the club like your starting pitching, hitting or defense?
ZS: As I said before, I think that we are well-rounded team that’s strong in all areas, but our pen is especially strong relative to our competition. If you look at the top 4 or 5 relievers on each club, it’s hard to find a group that’s clearly better. I’m not saying that we’re a slam dunk to lead the league in all relevant categories or that we don’t have questions, but I have confidence in our core group of guys at this point.
PS: Got it. Right now, things look pretty set for your roster and how playing time figures to break down. I understand that any number of things can happen over the course of a season that impact playing time, but is there something that might not be on Red Sox' fans radars that might be a pleasant surprise? Maybe Bonser proves he's healthy and contributes in a 2008 Justin Masterson sort of role? Maybe Jed Lowrie regains his form when given the opportunity? Anything along those lines come to mind?
ZS: It’s difficult to anticipate surprises (oxymoron?), but I’m curious to see how Boof responds to our training staff’s shoulder strengthening program and working with John Farrell. He has always showed good stuff but is working to improve his consistency. Boof was drafted out of high school and was quickly regarded as a top prospect with the Giants, so it feels like he has been around for a long time. It’s hard to remember that he’s still only 28.
I’m also interested to see how Bill Hall adjusts to his role with us. His athleticism and versatility allow him to protect us in the infield and outfield. He has obviously struggled at the plate in recent seasons, but Tito will be able to put Bill in a better position to succeed and perhaps his new role relieves some pressure to perform.
PS: Want to discuss life in the AL East in 2010? Seems pretty hard out there....
ZS: The Yankees and Rays are two of the best teams in the game so we definitely have a tough road ahead, but this is nothing new since ’08. Assuming good health I expect all three of us to compete for a spot in the post-season which means it will be a long winter for one of us. The Orioles are on the right track and although the Jays may take a step back this year, they made some solid moves this winter that will help them in the future. I expect this division to be one of the toughest for many years.
PS: What about two players whose performance analysis can be challenging, Jacoby Ellsbury and Clay Buchholz. In Ellsbury's case, I had become resigned to lesser expectations after 2008. He would be a good player, a starter on a championship level club but not much better. But then he stole 70 bases last year without being caught very often and now he moves to left field where he figures to offer more defensive value. Can he continue to swipe bases like he did last year? Can he tack on more power? What about his defense?
In Buchholz's case, to put it simply, his Major League numbers just haven't translated from his dominant Minor League career. I understand that he's young and should get better with experience, but how do you regard Clay Buchholz? How good is he and how good can he be?
ZS: We obviously hope that both players continue to develop and improve with more experience. Jacoby is already an elite base stealer so I don’t see why he can’t continue to perform at that level as long as he’s healthy. At the plate he had success immediately and then struggled when opposing pitchers got a better feel for his strengths and weaknesses. Like most young players, it was then up to Jacoby to make the appropriate adjustments and he did just that. He’ll need to continue doing that in order to take another step forward. If you’ve ever seen Jacoby take bp, he puts on a pretty good show and definitely has above average raw power. He has it in him to hit more home runs but I think we’ll be happy if he improves his ability to get on base and continues to impact the game with his speed on the bases and in the field. Much was made about his move to LF with some members of the media implying that we don’t think he’s a good CF. That is far from the truth. He’s an above average outfielder who will continue to improve. Playing Mike Cameron is center is more about how we feel about Mike’s ability and experience and what outfield configuration makes sense collectively for our guys. I’m sure Jacoby will get some time in center this year and we don’t think playing LF will have a negative impact on his long-term development in center.
Clay’s path has been similar to Jacoby’s – he was dominant in the minors and had early big league success but struggled the following season. Clay didn’t turn things around as quickly as Jacoby, but he took a significant step forward in ’09. After experiencing failure for the first time in his career in ‘08, he improved his fastball command and slider and gained confidence in all of his pitches. Regarding his future potential, Clay certainly has an impressive repertoire of pitches and he’s still learning how to attack Major League hitters. It’s great that we have guys like Beckett, Lackey, and Lester to take some of the pressure off pitchers with less experience but also to create a competitive and educational environment. These guys are great resources for young pitchers and Clay knows that he has a unique opportunity to benefit from their presence. I expect Clay to continue to mature as a pitcher and take another step forward in 2010.
PS: Ok, I will end with a question about your top prospect. When I was in Fort Myers a week and a half ago, your colleagues I asked about Casey Kelly strained to speak in measured terms about their excitement over him. I had a chance to watch him work in a B-Game and he looked phenomenal. Want to take your own shot at saying all the right things and not pumping up your team's prospect?
ZS: When you watch Casey pitch, it’s hard to remember that he’s only 20 years old and has less than 100 professional innings under his belt. He has a very simple and repeatable delivery that leads to impressive control and fastball command, especially for such an inexperienced pitcher. He also shows the ability to have three above average pitches (fastball, curve, change) in the future, so it’s easy to get excited about his potential. But it’s important to temper that excitement because he still has plenty of work ahead. Now that he’s fully committed to pitching, Casey will experience his first full workload on the mound and that may present new challenges. And like Buchholz and Ellsbury early in their pro careers, Casey has yet to fail and will likely need to experience some adversity before he can reach his potential.
PS: Thanks a lot, Zack, and good luck to you and the Boston Red Sox in 2010.
| Baseball Beat | March 23, 2010 |
Checking in on Bryce Harper
After watching Bryce Harper in the Area Code Games following his freshman year in high school, I wrote an article titled Remember This Name in August 2008 whereby I boldly proclaimed that the then 15-year old would be the No. 1 draft pick in 2011.
Well, as it turns out, I am going to miss with my prediction. No, not because Harper didn't pan out. And not due to any injury. You see, Harper skipped his junior and senior years in high school, earned his GED, and enrolled at the College of Southern Nevada last fall at the age of 17. As a result, Harper will be eligible for the 2010 MLB Draft and is likely to be the No. 1 choice a year earlier than I forecasted.
How is Harper faring in his college debut, you ask? Just fine, thank you. He has put up a .420/.514/.864 line with 8 HR and 27 RBI through his first 27 games. In addition, the lefthanded-hitting catcher/third baseman/outfielder has drawn 18 walks and struck out only 19 times. He is leading the No. 3-ranked junior college team in the country (23-5) in AVG, OBP, SLG, H (37), R (32), RBI, 2B (13), HR, and TB (76) and is second in BB and SB (6 of 8). [Complete stats here.]
I revisited Harper in January 2009 after he pulled a Josh Hamilton at the third annual International Power Showcase High School Home Run Derby at St. Petersburg's Tropicana Field. I displayed his sophomore year stats (.626/.723/1.339) in a follow-up last May, linked to Tom Verducci's Sports Illustrated article a month later, and reported that he left high school early and registered for college last June.
For the Washington Nationals (16-45), possessors of the worst record in baseball this year, it now means having the opportunity to draft the top two amateur prospects in the first 11 years of the 21st century. The franchise won the Stephen Strasburg lottery this year and appears destined to win the Bryce Harper lottery next year. Strasburg and Harper could be the most hyped pitcher-catcher duo in decades, if not ever, should they wind up playing for the Nats. If nothing else, the two Scott Boras-advised players will be the richest signees in the history of the game.
MLB's Jonathan Mayo, a former guest columnist for Baseball Analysts, has the latest goods on Harper. In an extensive interview with the confident teenager, Harper says "I could care less about the Draft. If I could come back next year and play here, I'd come back next year and play here." Bryce is probably right. Given how important playing professional baseball has always been to him, he probably "could" care less about the draft. However, I doubt if he "couldn't" care less, which is the point he was trying to make with Mayo.
With only 2 1/2 months to go before the draft, Harper's wait won't be long. In the meantime, you can watch Harper hitting his second and third home runs this season, as well as a third round tripper that also includes a slow-motion clip of his swing. In all cases, Harper is using a wood bat as College of Southern Nevada plays in a wood bat conference.
Believe the hype and be sure to remember this name.
| Behind the Scoreboard | March 23, 2010 |
Stakeholders - Kansas City Royals
From now through the beginning of the regular season, we will not be posting in-depth round-tables previewing each division like we have in years past. Instead we will feature brief back-and-forths with "stakeholders" from all 30 teams. A collection of bloggers, analysts, mainstream writers and senior front office personnel will join us to discuss a specific team's hopes for 2010. Some will be in-depth, some light, some analytical, some less so but they should all be fun to read and we are thrilled about the lineup of guests we have teed up. Today it's Joe Posnanski on the Kansas City Royals.
Sky: Honestly, how difficult is it to be a Royals fan right now? They've been arguably the least successful franchise over the past 15-20 years, and they aren't showing a ton of upside right now either. Additionally, being someone who appreciates that sabermetric side of the game, how frustrating is it to watch the Royals continue to make moves which seem to run counter to that style of thinking? Of course anything can happen in baseball, but do you see Dayton Moore ever turning this ship around?
Poz: OK, let's see here ... I think it's pretty difficult being a Royals fan right now, but I'm not sure that it's easy to separate how much more or less difficult than it has been the last decade or more. The bad tends to blur together. It has been youth movement followed by veteran leadership followed by youth movement followed by veteran leadership for about as far back as most people in Kansas City care to remember. The Royals are currently in the "veteran leadership" stage of their development, and they hope to follow that in the next couple of years with another "youth movement." So, it at this point it all just feels like it's part of the natural cycle of things.
I think that is disappointing for people -- the hope really was that Dayton Moore would turn things around. And he may. The Dayton Moore plan, unquestionably, revolves around acquiring talent and developing it in the minor leagues. Good scouts. Good instructors. The Royals have spent a lot of money on the draft the last couple of years, and they have been real players in signing top young guys in Latin America. They spent 7 million -- an almost unfathomable amount of money in Kansas City -- to sign Cuban pitcher Noel Arguelles. That speaks most directly to the Dayton Moore plan.
Unfortunately, not one of those young players has emerged quickly ... so people keep HEARING about the plan (or "the process" as people have bitterly started to call it) but they're not SEEING any improvement. While the Royals believe their future is strong with prospects like Eric Hosmer and Mike Montgomery and Aaron Crow and several other young pitchers, the fans are seeing the team sign retreads like Jason Kendall and Scott Podsednik and even Rick Ankiel. It's just hard to convince anyone that you're heading in the right direction when you are spending spring training trying to figure out what Jose Guillen's role is for the team. I think Dayton Moore has proven, pretty convincingly, that he is not overly gifted at the miracle work of building a major league roster with dazzling trades and brilliant free agent pickups. But that's not really his reputation nor his purpose. He's a draft and develop guy. And, a lot of people I talk with like what the Royals have done there, even if it hasn't yet paid off.
I think the sabermetric thing with the Royals is interesting ... it DOES seem, with Rob Neyer and Rany Jazayerli and, of course, Bill James, that the Royals fan base has a higher percentage than its share of saber-inclined fans. I don't know if that's really true, but it seems that way. And the Royals have been rather openly hostile toward some saber ideas such as the idea that defensive value can be quantified. So it does seem like there's a clash there ... I have written about how difficult it is to root for a team, in any sport, that has a philosophy that goes counter toward your own as a fan. But I think, more than anything, the Royals are just treading water and have been for some time now. Prospects, real prospects, do seem to be on the way. The launch dates for those propsects should begin later this season and in earnest at the beginning of next season. Until then, I'm not really sure anything really counts.
Sky: That's a great take. Even if you blow a few free agent signings like Guillen, it's easy to paper over those mistakes if you've got a great drafts and a great farm system. We'll see if those guys develop. One of those guys DID develop, in the form of Cy Young Zack Greinke. Do you see him as a future Hall of Fame-type pitcher? And do you see him wearing a Royals cap? He's signed to a very reasonable deal through 2012, after which he'll be a free agent. If the Royals can't reasonably contend before then, is there any scenario in which you consider dealing him?
Poz: Well, I'm one of the world's leading exporters of Greinke tributes, so I suspect I'm not the most unbiased source on the subject. I predicted he would win the American League Cy Young Award last year, which has to go down as one of my best-ever predictions. By the way, I'm picking Colorado's Ubaldo Jiminez to win the N.L. Cy Young this year -- not as much of a reach, probably, but I see many of the same things.
Anyway, Greinke -- with his stuff and his pitching mind, I think he can be a big star year after year after year. He has a flawless delivery, a mid-90s fastball, an assortment of great secondary pitches and spectacular command. A lot of people around the country seem to misunderstand him ... they think, because of the issues he has had with social anxiety, that he is somehow unconfident or unmotivated or something. Nothing could be further from the truth -- I think of the great line Richard Ben Cramer line on Ted Williams, something to the effect of: "The roar with which he speaks has nothing to do with his hearing. It's your hearing he's worried about." So it is with Greinke; he doesn't have any doubts about his own ability; it's other people who irk him. He's extremely confident, extremely competitive and extremely driven. His change-up showed new life at the end of last year; with a good change-up, Greinke is just scary good.
The question about him staying with the Royals is an interesting one ... here's my take. I think Greinke would be perfectly content to stay with the Royals his whole career if the team was winning. I think he's comfortable with Kansas City, comfortable with the media setup, comfortable with the people in town. He signed an extension with Kansas City -- and at what now looks like a very reasonably price-- because if he has his choice, he would prefer to stay in town. I suspect he has no real interest in pitching for the Yankees no matter how much money they offer.
But he absolutely will not stay if the Royals don't show some real, tangible signs of improvement. I know that's true. Losing wears on him. I know there were some people around the country who thought that he should have been docked Cy Young points because he didn't pitch in meaningful games. But I think if he HAD pitched in meaningful games, he would have been even better. I think he craves pressure and enjoys the big moments. So, if the Royals are looking hopeless in 2011 and 2012, then yeah, I would expect him to leave. The Royals have to prove to him that they're on the right track.
If it becomes clear that the plan has failed and that Greinke is leaving then, sure, a trade might be the only viable option. But the Royals have not done well in those trades. What they really need is for their young talent to start performing, for their old talent to move on, and for this team to start looking like a blossoming young team like the Rays a couple of years ago. If that happens, I think Greinke would stay.
Sky: You bring up a great point about Greinke's past and how that would make him likely unwilling to pitch for a big market, media-intense team like the Yankees. Statheads sometimes tend to ignore the mental aspect of the game, be it dealing with the media, "chemistry" with the other players, pressure from fans, etc. I do think that stuff is often overused by the media as to explain away variation in player performances, but in a case like Greinke's it can be a real factor. As someone who's been in and around MLB clubhouses for years, but also appreciates the statistical angle of the game, what's your take on how strongly the mental aspects of the game can affect player performance?
Poz: My basic take on it is that for so long -- for SOOOO long -- baseball fans have been hammered with a whole lot of the mental stories from sports. And I suspect a lot of them were pretty specious. Of course, there's a whole lot to the importance of a players mental approach, but for years and years all you ever seemed to read was that players were successful because they were somehow superior human beings, teams were successful because they were marvels of chemistry and so on. I mean, that was pretty much you read about baseball anywhere for about 80 years.
So, I think it was revolutionary -- and a great thing for baseball fans -- when Bill James and others came along to ask what now appear to be obvious questions. Who says pitching is 75% of baseball? How do we come up with that number? Is it really possible for hitters consistently to be better in clutch situations than they are in non-clutch situations? And, if so, what does that say about them? (It was actually John Updike who asked this question first, I believe). Do the players on the best teams really get along better than the worst teams? And if they do, is that why they are successful? Why does batting average exclude walks? Why are starting pitchers credited with entire team victories? Do they really win the games? If they don't win, is it because of their own failings? And so on and so on and so on. And I think that as the answers came back -- and many the answers seemed pretty lacking -- that more questions came in and more unconvincing answers came out and so on.
Now, people do wonder if it has swung too far the other way ... have people started to discount entirely the mental aspect of baseball, the chemistry aspect of a clubhouse, the importance of a players approach, and so on. In some ways, I think it's probably true. You can't say the word "leadership" without making a whole segment of baseball fans laugh -- and I fall for this myself from time to time -- and yet I think we all believe that there IS something to leadership. These obviously are human beings involved with the various strengths, frailties, overconfidence, doubts that we all have. I have seen that in the clubhouses, I know it's true. And I think the mental aspect of baseball is extremely important and fascinating ...
I guess I think the problem for me is that people tend to oversimplify things -- tour search for easy answers. This guy failed because he couldn't handle the pressure. That guy succeeded because he's got great intestinal fortitude. This other guy couldn't handle the pressures of New York. That other guy hits better when there's no pressure. And all the vice versas. I just think it's a lot more involved than that.
Sky: I think you put it nicely. Like many things (like clutch hitting, etc.) sabermetrics has shown that the effect of those things is a lot smaller than people used to think, but though the effect is small, I really don't think it's zero.
Moving on to someone who has no problem with the mental aspect of the game, let's talk about one of your favorite players, Brian Bannister. He's probably one of the most sabermetrically inclined players in the majors. Do you see players like him becoming more widespread and how much do you think his style of thinking helps in actually playing the game?
Poz: I do think more and more players will study their own advanced stats because players always have and always will look for an edge. And it's possible that studying your own stats will tell you something about your game that you did not know. There is actually quite a long history of players who studied their own stats closely. Steve Garvey, for instance, had this rather involved formula he used in order to get 200 hits -- which, at the time, was viewed as some sort of holy grail. Pete Rose could always tell you his numbers -- against lefties, righties, night, day, on turf and so on. Baseball is such a mental game and such a confidence game ... I think it's likely that as the advanced stats become more circulated, players will use them to build up their confidence.
With Banny, it's interesting, a lot of people think that his statistical study actually hurts him, that he thinks too much on the mound. He's a tinkerer by nature, and the feeling among those critics is that he needs to think less and throw more -- the Nuke Laloosh style. My own feeling is that there's a balance between thinking and doing -- I do think Brian tied himself up in knots in 2008 -- but I remain convinced that Brian Bannister is pitching in the big leagues because of his mind. He doesn't throw hard and doesn't have great secondary pitches and his arm tends to tire late in the year. But he has some good late-breaking movement on his fastball, and he has good command, and he's constantly breaking down things so he comes into games with a good plan and a good sense of what he's doing. The guy's really smart. He pitched very well his first 20 starts in 2009 before he started to wear down ... he has spent a lot of time in the off-season working on his conditioning. That's what I think he does with his study of advanced stats -- see a problem, attack the problem, see a weakness, develop a counter strength. In the end, you need talent to play baseball at the Major League level -- no doubt about that. But I think studying the numbers the way Brian does can certainly bridge the talent gap.
Sky: This has been great Joe. Thanks a lot for taking the time to answer so thoughtfully. One last question - it may be the most challenging: Is there even one silver lining in having Yuniesky Betancourt in the line-up this season?
Poz: Silver lining with Yuni. No.
Ha ha, I jest. If there's one thing that you can say about Yuniesky, it is that until last season he had been very durable. I know that sounds like faint praise, but I don't mean it that way. He played in 153-plus games three years in a row ... even last year, with his issues, he played in 134 games. That means the last four years, he has played in 599 games at shortstop -- only six shortstops in the game have played in more (believe it or not, Orlando Cabrera has actually played in the most games at shortstop the last four years).
So what does this mean? It means that for all Betancourt's failings -- his statuesque range to his left, his pathological need to swing at anything he sees, his unique ability to put outs in play, and his occasional lapses into daydream land -- history suggests he will be out there playing every day. And because he will be out there playing every day, he will do some good things -- bang 8 to 10 home runs, maybe, make a few dazzling plays, put enough balls in play to hit .275 or .280, come through in the clutch now and then. And because he will do some good things, people will say, "Hey, he's not that bad." And because people will say "Hey, he's not that bad," the Royals will be able to keep him out there without too much grief while they wait for one of their young players to develop.
That's the important thing to remember about the Royals: They are not trying to win this year. Oh, they are trying not to lose -- that's what the Betancourt trade was about, that's what the signing of veterans like Podesdnik, Ankiel and Kendall was about -- but trying not to lose is not the same thing as trying to win. The Royals future is tied up in a wave of prospects that should be hitting Class AA this year. They Royals would like to believe that with the veteran experience they've brought in -- and Betancourt is part of that -- they can win 75-81 games and take a step forward. Well, 75 wins is on the high end of my projection scale, but the larger point remains: This year is a holding pattern year. Yuniesky Betancourt is a holding pattern player. I was (quite demonstrably) peeved when the Royals traded for him because he was possibly/probably the worst every day player in the American League in 2009. But my feeling now is that the Royals just need to GET THROUGH the 2010 season, and Betancourt should help them do that.
I wonder if that comes across sounding like a silver lining argument.
Sky: Thanks again Joe. Best of luck to you and the Royals in the 2010 season.
Joe Posnanski is a Senior Writer at Sports Illustrated. He was sports columnist at The Kansas City Star from 1996 to 2009, and during that time he was twice named the best sports columnist in America by The Associated Press Sports Editors.
| Baseball Beat | March 22, 2010 |
Categorizing Starting Pitchers By K, BB, and GB Rates: 2007-2009
More than a decade ago, Defense Independent Pitching Stats (DIPS) introduced the idea that pitchers are mostly responsible for their strikeout, walk, and home run rates but have little or no control over batted balls in play. By focusing on K, BB, and HR rates only, Fielding Independent Pitching (FIP) has become increasingly accepted as a better tool than more traditional methods such as ERA to evaluate the effectiveness (and predictability of future results) of pitchers.
Playing off DIPS and FIP, I began to categorize and graph pitchers by strikeout and groundball rates in 2007 (based on 2006 stats). I broke pitchers into quadrants with the Northeast Quadrant home for those with above-average K and GB rates and the Southwest Quadrant the opposite. I have continued to publish this series annually, adding walks and even Z-scores last year.
By substituting groundballs for home runs, my methodology is more analogous to xFIP than FIP. The bottom line is that the best pitchers miss bats (K), throw strikes (BB), and keep batted balls in the park (GB).
As I demonstrated last year, strikeouts have the greatest impact on ERA and RA, followed by walks, and groundballs. As a result, K+ BB+ GB+ > K+ BB+ GB- > K+ BB- GB+ > K+ BB- GB- > K- BB+ GB+ > K- BB+ GB- > K- BB- GB+ > K- BB- GB-.
I have combined the strikeout and walk components this year by using (K-BB)/BF. In the past, I had graphed K/BF on the x-axis and GB% on the y-axis. This year, I am using (K-BB)/BF on the x-axis and GB% on the y-axis. While not three dimensional, the graph below includes the three most important variables whereas it had only focused on K and GB rates previously.
In addition, I've added a new wrinkle by using the past three years combined stats rather than the prior year only. This change has increased the number of pitchers as well as the size of the data points. I could have weighted the numbers in a 3-2-1 format to place additional emphasis on the more recent results but chose not to for simplicity. I could have added HBP to BB given the fact that the former is generally as much in the control of the pitcher as the latter. That said, I don't believe excluding HBP had much of an effect on the outcomes.
There were 173 active starting pitchers who met my requirements of 120 or more innings during the 2007-2009 period. Among these qualifiers, the average (K-BB)/BF rate was 9.87% and the average GB rate was 43.56%. The mean K-BB and GB rates are highlighted in red in the graph below. These averages separate the starting pitchers into four quadrants.
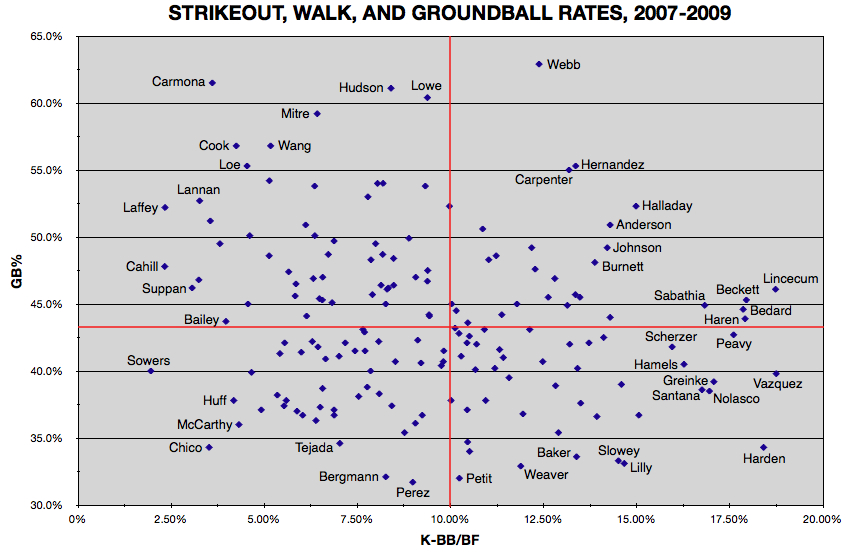
I always highlight the outliers and have identified 43 this time or more than twice the number in the previous graphs. The diamond just to the right of the average K-BB rate and ever so slightly below the average GB rate is Boof Bonser, who wins our award for being Mr. Average. He was signed by the Boston Red Sox to a one-year, $650,000 contract after being designated for assignment by the Minnesota Twins in December. A first round draft choice of the San Francisco Giants in 2000, Bonser missed the 2009 season after undergoing arthroscopic surgery to repair partial tears to the labrum and rotator cuff in his right shoulder. With Boston's starters in place and Tim Wakefield around to serve as the backup, Boof is likely to break camp as a long reliever but could be moved in a trade to a team looking to bolster its starting rotation.
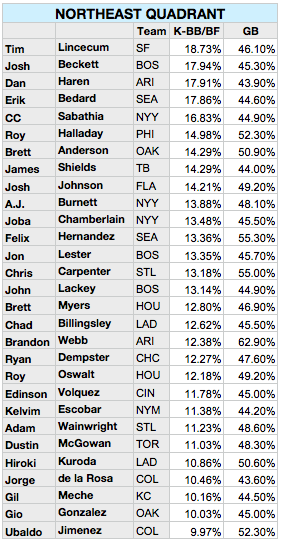
Tim Lincecum, coming off two consecutive Cy Young Award seasons, has compiled the highest K-BB rate in the majors over the past three years among those pitchers who induce more groundballs than the league average. After signing a two-year, $23 million contract in February, Lincecum has struggled this spring but threw 5 2/3 shutout innings against San Francisco's minor leaguers on Sunday. According to Fangraphs, his fastball velocity dropped 1.7 mph last year, and it has reportedly been sitting mostly at 89-91 in March. If his heater continues to recede, he may rely increasingly on his breaking balls and outstanding changeup for his "out" pitches.
The Northeast Quadrant also features former Cy Young winners CC Sabathia, Roy Halladay, Chris Carpenter, and Brandon Webb. The latter, working his way back from shoulder surgery after pitching just one game in 2009, is aiming to return to the rotation in late April. Meanwhile, Halladay will be pitching for a National League club for the first time in his 11-year career.
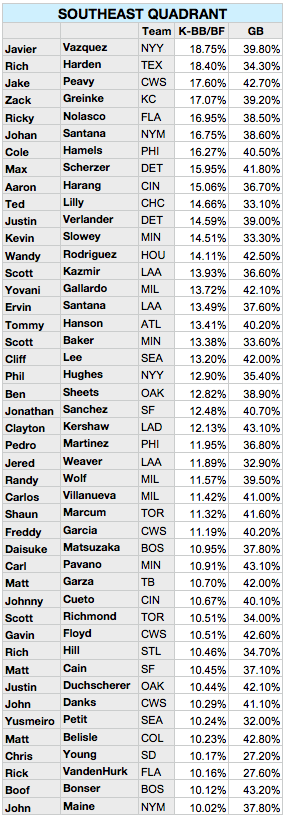
Javier Vazquez, not Lincecum, has produced the No. 1 K-BB rate in the majors over the past three seasons. He missed out on the Northeast Quadrant due to a lower-than-average groundball rate. The 33-year-old righthander will once again be pitching for the New York Yankees. Vazquez was 14-10 with a 4.91 ERA in his lone season with the Bronx Bombers in 2004. His career ERA is half a run higher in the AL (4.52) than the NL (4.02).
The Southeast Quadrant has its share of former Cy Young Award winners as well. Jake Peavy, Zack Greinke, Johan Santana (2x), Cliff Lee, and Pedro Martinez (3x) have won a combined eight CYA. Greinke (16-8 with a MLB-leading 2.16 ERA and 242 Ks and 51 BB in 229.1 IP) is coming off his best season ever. Among active pitchers, only Martinez (1997, 1999, 2000, and 2003), has bested his ERA+ of 205. Pedro, who signed with the Phillies last summer and went 5-1 with a 3.63 ERA and started three times during the postseason, is currently a free agent.
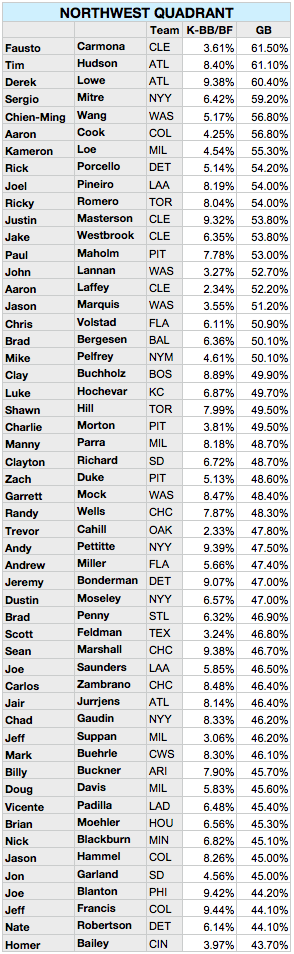
While the Northwest Quadrant doesn't sport any former CYA winners, it finds Tim Hudson, Derek Lowe, Andy Pettitte, Carlos Zambrano, and Mark Buehrle among its worm-burning residents. Lowe's (K-BB)/BF missed the Northeast Quadrant by less than 0.50%. As shown, he is one of only four starters with a groundball rate over 60 percent. The other three are Northwest inhabitants Hudson and Fausto Carmona plus Webb.
Hudson sat out the first five months in 2009 after undergoing Tommy John surgery in 2008. He started seven games and compiled a 2-1 record with a 3.61 ERA, then signed a three-year, $28 million contract with the Atlanta Braves last November. Carmona had a 19-8 record with an ERA of 3.06 in 2007 but has gone 13-19 with a 5.89 ERA while allowing more BB (140) than SO (137) over the past two campaigns. The 26-year-old righthander is owed $11 million for 2010 and 2011 so he is likely to get another shot with the Indians this season.
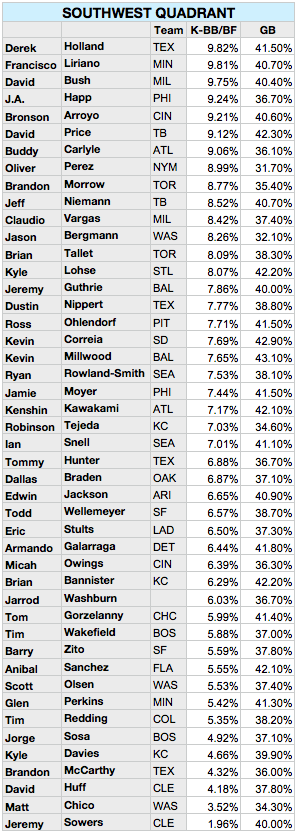
Although the Southwest Quadrant consists of several young arms that have potential, it has an even greater number of veterans and journeymen who have settled into nothing more than mediocrity. I wouldn't expect much success from those in the bottom half with groundball rates below 40 percent.
Jeremy Sowers (1.96%) had the lowest K-BB rate in the majors over the past three years. He and fellow soft-tossing lefty teammates David Huff (4.18%) and Aaron Laffey (2.34%) own three of the twelve-worst K-BB rates among the 173 qualified starting pitchers. I don't like Cleveland's chances this year if these three southpaws wind up starting half of the team's games, especially if Carmona pitches more like he did in 2008 and 2009 than 2007.
| F/X Visualizations | March 19, 2010 |
Comparing Team-Win Projections
I love preseason projections: the fact that so many smart people put some much work into it, the promise of the season to come, thinking about my own ideas for the season, and comparing across projections. I hope you will indulge my impulse to do this last one.
Here I am going to compare the projected win totals -- but it would be very cool to do the same for player projections -- across six different projections systems. First the projected win totals based on the FAN projections as fangraphs; BPro's PECOTA; THT's OLIVER; Rally's CHONE; RLYW's CAIRO and, though it is not a projection per se, the Vegas over/under lines.
Here are the RMSE between each of the six projections systems.
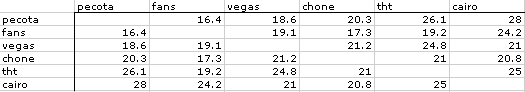
Interestingly the FANS are the closest to the other projection systems. PECOTA's, CHONE's and THT's most similar projection system is the FANs. On the other end CAIRO is often the most dissimilar, with PECOTA, the FANS and THT all having CAIRO as the most dissimilar projection. That is not to say that makes the FANS 'right' and CAIRO 'wrong.' I don't think similarity to other projection systems makes it any more or less likely to be right, just an interesting thing to notice.
Another way of analyzing this is to use principal component analysis (PCA). Picture each projection system as a 30-valued vector. You could plot each of the six systems in 30-space and see how close they are to each other, but, unfortunately, I cannot display 30-space on the computer screen. PCA is a tool to reduce the dimensionality of a data set. As an example if all the systems projection projected the same number of wins for all teams expect the Yankees and Red Sox, we could just look at their projections for the Yankees and Red Sox and get all of the information of the variation between the systems. In this case it is not as neat, but we can still find the teams which account for the most variation between the systems. By reducing dimensionality you lose some information, but the hope is the information lost is largely correlated (redundant) and much of the variation can be reduced to a handful of dimensions.
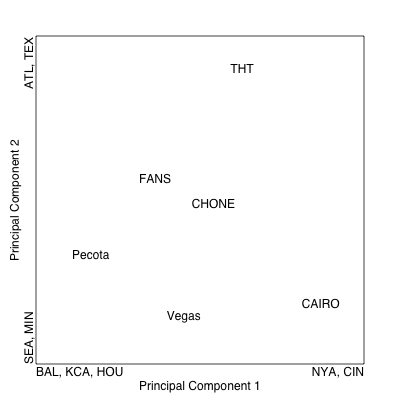
Each principal component is a linear combination weighting the importance of each team's projection, so in the example above all teams except the Red Sox and Yankees would be weighted as zero. Principal component one is the component that accounts for the greatest amount of variation. The most heavily weighted teams are the ones that drive each projection's score on the component and are most responsible for producing the variation in the projections. In this case projections that score high on component one project lots of wins for the Yankees and Reds, while those that score low on component one project lots of wins for the Orioles, Royals and Astros.
Here you can see the FANS and CHONE clustering out relatively closely, with Vegas and PECOTA not that far off. Then THT and CAIRO falling out far away. CAIRO because of its love of the Reds, Twins and Mariners, while THT for its love of the Braves and Rangers, and to a lesser extent the Yankees. Again it would be very cool to do this for player projections and see whether the principal components to fall out as particular player types.
Finally I wanted to see which teams had the most disagreement or consensus. Here is the average pair-wise disagreement for each team.
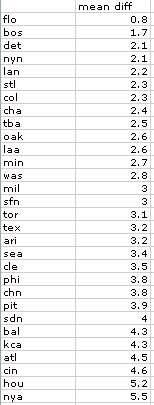
Florida has almost no variation. THT likes them to win 78 games, but everyone else sees them winning 80. On the other end of the spectrum the Yankees' difference is driven by THT, 103 wins, and PECOTA, 89 wins.
| Touching Bases | March 18, 2010 |
Kevin Jepsen: Sleeper
He's got Brian Wilson's fastball/slider combo plus A.J. Burnett's curve. Kevin Jepsen's stuff is that good.
I first noticed Jepsen when he topped my "Stuff" leaderboard back in September. He had only thrown 330 pitches on the year at that point, so I didn't make much of it, but the numbers ranked him right up there with Wilson.
He then burst upon my radar in the ALCS last year when his stuff blew away a couple Yankees as well as Carson Cistulli and myself. In 2002, Francisco Rodriguez was the Halo rookie who made waves in the playoffs. In 2008, Jose Arredondo captured some of that K-Rod magic. Now I'm not saying Jepsen will have the subsequent success of K-Rod or the sophomore slide of Arredondo. But I'm thinking he's closer to the former than the latter.
Jepsen had allowed 5.4 walks per nine innings before being called up to the Majors in 2008. Since then, he's proven that he can harness his electric stuff in 63 regular season innings. His career MLB BB/9 is 3.3, better than both Wilson's and Burnett's. His strikeout rate has been somewhat lower than expected, though at nearly eight Ks per nine, it's nothing to sneeze at. Kept the ball on the ground? Check. Career 55% ground ball rate. So what's with that glaring 4.86 ERA that's holding him back from being widely regarded as a potential breakout candidate in 2010? A .360 BABIP and 61.9% strand rate. Gotta love it when bad-luck indicators line up like that. Jepsen's career 2.86 FIP is a full two runs lower than his ERA. In the last two years, Damaso Marte's ERA-FIP of 1.32 is the next closest to Jepsen's among relievers with at least 60 innings pitched.
PECOTA and ZiPS project Jepsen for an earned run average well north of five. CHONE is more bullish, projecting an ERA of 4.14. Still, every projection system forecasts major regression in 2010 from last year, which is fair, considering he has outperformed in MLB compared to his Minor League numbers. Why should you believe that Jepsen can continue to outdo his pre-2008 track record?
On the PITCHf/x front, The Orange County Register's Sam Miller's got you covered. The whole article is worth a read, but allow me to quote heavily from it.
Here’s what changed:The first photo shows Jepsen’s pitch movement (from the catcher’s perspective) in April and June. The second one is his pitch movement from July 1 on.
In the first photo, Jepsen basically has two pitches — a fastball that usually bores in on righties, and a curveball with downward movement. In the second photo, allllll that space in between them is filled with the green pitch. It’s labeled a slider, and it behaves like a hard slider — 89 mph, with movement away from the right-hander — but is perhaps best called a cutter. The LA Times quoted the Angels as saying it’s a cutter that Mike Butcher taught Jepsen in early July. Later in the season, Jepsen seems to refer to it as his slider. Cutters and sliders aren’t that different, and the label isn’t as important as how well it worked.
When hitters swung at it from Aug. 1 on, they got nothing but air 55 percent of the time. Zack Greinke’s slider might be the best in the game, and he got whiffs on 42 percent of swings. Frankie Rodriguez gets whiffs on 28 percent. Billy Wagner, 37 percent. Mariano Rivera’s cutter: 25 percent. It was, for Jepsen, a massively good pitch. (Here’s a not-very-good example of it.)


There's not really much to add to that. Miller concludes that Jepsen "now projects as a possible future closer. Maybe by the end of this year." I'm inclined to agree. Brian Fuentes wavered down the stretch last season, which cast a seed of doubt in manager Mike Scioscia's mind. Pre-All-Star break, Fuentes added 1.4 WPA, but from the midsummer classic on, he lost -0.5 WPA.
"Both guys have been an important part of the back end of the bullpen," Scioscia told Brittany Ghiroli in mid-September. "But if there are some matches that could be advantageous [to use Jepsen], we will try to take advantage of [them]."
Fuentes had the lowest fastball velocity of his career since he inherited the Closer role. His 19.7% whiff rate fell well short of his 26.4% career average. He also threw only 47.7% of his pitches in the strike zone compared to a 51.95% career rate. While Jepsen's FIP has fallen short of his ERA, Fuentes pitched to better results than his peripherals would suggest. His tentative hold on the ninth inning job is slipping. If you're playing fantasy baseball, I doubt you'd even need to draft Kevin Jepsen to own him. But be ready to scoop him up off the waiver wire, because I have a feeling that once the season starts and he gets another chance to show everybody his stuff, he's going to pick up helium.
| Change-Up | March 17, 2010 |
Stakeholders - New York Yankees
From now through the beginning of the regular season, we will not be posting in-depth round-tables previewing each division like we have in years past. Instead we will feature brief back-and-forths with "stakeholders" from all 30 teams. A collection of bloggers, analysts, mainstream writers and senior front office personnel will join us to discuss a specific team's hopes for 2010. Some will be in-depth, some light, some analytical, some less so but they should all be fun to read and we are thrilled about the lineup of guests we have teed up. Today it's Cliff Corcoran on the New York Yankees.
![]() Patrick Sullivan: The Yankees just won the World Series and had a terrific off-season. I know championships are the goal but in some ways, it seems like we are in the midst of the true Golden Age of New York Yankees management. They seem to draft well, make good trades, understand defense and on-base and they selectively leverage their financial heft. Candidly, as a Red Sox fan it sucks. Can we kick things off with a brief State of the Franchise on the Yankees?
Patrick Sullivan: The Yankees just won the World Series and had a terrific off-season. I know championships are the goal but in some ways, it seems like we are in the midst of the true Golden Age of New York Yankees management. They seem to draft well, make good trades, understand defense and on-base and they selectively leverage their financial heft. Candidly, as a Red Sox fan it sucks. Can we kick things off with a brief State of the Franchise on the Yankees?
Cliff Corcoran: Coming off a world championship, the Yankees have brought in Javier Vazquez, who finished fourth in the NL Cy Young voting last year, to replace the 6.92 ERA they got out of the fifth spot in the rotation last year. They have also replaced the 36-year-old Johnny Damon, who had become a butcher in the field, with the 29-year-old Curtis Granderson, who is no worse than average in the outfield. They traded a handful of prospects to get those two players, but still have the best pure hitting prospect in the game, Jesus Montero, ready to start the year at Triple-A, a few solid catching prospects on the way up should the defensively-challenged Montero not stick behind the plate, and a still-solid supply of pitching talent throughout the system topped by blue-chippers Joba Chamberlain and Phil Hughes who will battle this spring for the final major league rotation spot. The Yankees lack organizational depth behind their starting lineup, but with Granderson, Mark Teixeira, Robinson Cano, Nick Swisher, and Brett Gardner, the majority of their every-day starters will be in their 20s on Opening Day (though Teixeira turns 30 in mid-April), and with CC Sabathia, Chamberlain, Hughes, David Robertson, Alfredo Aceves, and their organizational depth, they have their share of young pitching as well. Most importantly, as you say, the organization, led by Brian Cashman and Hal Steinbrenner, is finally putting smarts behind its spending, exploiting not just their financial wherewithal on the free agent and trade markets, but the draft and amateur international markets, waiver wire, independent and international leagues, and doing so with a heady mixture of scouting and performance analysis. The Yankees as an organization still have their flaws, and Cashman has made his share of mistakes, but they are getting fewer and farther between as the impulsive, reckless, and fractured operating methods of the George Steinbrenner era fade into the past. The only things standing between the current Yankees and another dynasty are the similarly well-run Red Sox and Rays.
PS: Let's discuss Vazquez. His peripherals are almost always excellent. His stuff is awesome. He is coming off just a ridiculous 2009. And yet between his first stint with the Yanks and some comments his onetime manager Ozzie Guillen made about him, there seems to be some basis to question how well he will perform under pressure, and in particular in the AL East for the Yanks this year. I tend to put less stock in such things than most but in Vazquez's case, there seems to be a little something to it. What do you think?
CC: I don't put much stock in that sort of thing either. It's important to remember that Vazquez's only All-Star appearance came as a Yankee in 2004 after he went 10-5 with a 3.56 ERA in the first half of the 2004 season. He had shoulder problems in the latter half of that season, but didn't tell anyone until years later. Perhaps his decision to hide his injury was a response to the pressure he felt having just signed a four-year, $45 million extension that positioned him as the future Yankee ace, but that's conjecture. Returning to the Yankees this year, he's the fourth starter in Joe Girardi's rotation and is playing out the final year of a deal he signed with the White Sox two years ago for a team that just won the World Series without him. There's was probably more pressure on him in Atlanta last year, where he was a central part of the Braves' misguided attempt to contend ahead of schedule.
I'm less concerned about Vazquez's response to pressure than I am about the disconnect between his stuff/peripherals and his results. In his 2010 Gold Mine, Bill James posits that Vazquez's inconsistency is due to his heavy reliance on his changeup, a pitch which can result in a lot of missed bats but gets hit hard when the hitter knows its coming (Yankee fans, think Edwar Ramirez). It's an interesting theory, and might be cause for some concern given the fact that the Yankee staff seems to have changeup fever with A.J. Burnett and Phil Hughes trying to develop the pitch this spring, but James' pitch frequency statistics are suspect. James' numbers disagree with Fangraphs', which isn't necessarily damning in and of itself, but another item in James' Yankee chapter says that Hughes didn't throw a single cutter in 2008, when I know for a fact he featured the pitch in his last start of that season. Vazquez does seem to be something less than the sum of his parts in a typical season, and I certainly don't expect him to repeat the career year he had in the weaker league last year, but as a mid-rotation starter, he's a major asset, and, as I said before, replacing what he's replacing, he's a huge upgrade.
As for Ozzie Guillen, he didn't like Nick Swisher either . . .
PS: One of the fascinating stories about the World Champion 2009 New York Yankees was the bounce-back production they got from older players. It would have been hard to predict the seasons that Hideki Matsui, Derek Jeter, Jorge Posada and Johnny Damon managed. Damon and Matsui move on, Granderson and Johnson enter the fold, but is there any concern about drop-off this year? Even a guy like Nick Swisher had a career year. Are the additions of Granderson and Johnson (and Vazquez and Winn, for that matter) enough to compensate for the guys who figure to fall back? Or is this wishful thinking from a Red Sox fan, and Jeter, Posada, Swisher and others will pick up right where they left off in 2009? I guess this is all a very long-winded way of asking if the 2010 Yanks are better or worse than the 2009 edition.
CC: There will be some regression, no doubt, but I think it will be minimal. I expect the outfield to break even. Swisher hit .226 with a .394 slugging percentage in the new Yankee Stadium last year. That should correct itself and thus balance any regression in his .585 road slugging percentage. Brett Gardner and/or Randy Winn should be able to do what Gardner and Melky Cabrera did last year, if not more. Curtis Granderson, because of the big upgrade he represents on defense, should break even with Damon even before you factor in a potential rebound from his weak 2009 production, which is a distinct possibility given his his move to a ballpark that's not only friendlier to hitters overall, but much friendlier to left-handed power hitters. Mark Teixeira's 2009 was typical for him, and Robinson Cano just now rounding into the player he should be for the next five years or so.
The real concerns are Jeter, who will be 36 in June and is coming of one of his best seasons, Posada, who at 38 is coming off one of the best seasons ever by a catcher 37 or older, and DH, where the Yankees replaced a solid season from Hideki Matsui with the fragile Nick Johnson, whose power or lack thereof is also something of a concern. However, they should have an extra month of Alex Rodriguez to compensate for that, the bullpen should be at least as good, and if everyone stays healthy in the rotation (a big if with A.J. Burnett in there), they could make up for the rest of that regression if not more than that with the addition of Vazquez.
There's no doubt that the 2009 Yankees won it all because a lot of their coins came up heads, but I think they have far fewer question marks going into this season and thus stand a good chance to be almost as good if not even slightly better than they were in their championship year.
PS: Good or bad, is there anything about the 2010 edition of the Yanks that will surprise? Think Brett Gardner will start to be more appreciated? Things seem pretty set in terms of the makeup of that roster but since you follow the team more closely, I wanted to ask you if there is anything the rest of us should be on the lookout for.
CC: Well, there's a distinct possibility that Curtis Granderson could become a platoon left fielder who hits in the bottom half of the order, which might surprise a lot of people who generally regard him as an All-Star centerfielder and leadoff man. I'm pretty sure he'll hit in the fifth, sixth, or seventh spot for most of the season, or at least until Johnson goes down with an injury, and I think there's a very good chance he'll be shifted to left in deference to Gardner's superior defense. The platoon thing is less likely, but definitely possible if he continues to struggle against lefties in the early going, especially if he's in left field and Marcus Thames makes the team (which I think he will). As a full-time center fielder, Gardner could steal 50 to 60 bases and win a Gold Glove, though the latter is much less likely with Franklin Gutierrez in the league. Beyond that, I think David Robertson and Mark Melancon will emerge as a formidable, homegrown short relief duo by the end of the year, which might surprise those who don't pay much attention to non-closer relief prospects. Beyond that, I don't think there's much potential for surprise. The team's assets and liabilities are pretty well known outside of New York.
PS: Well this has been great, Cliff. Want to wrap with an AL East prediction?
CC: I think the Red Sox are baseball's most improved team heading into the 2010 season. Not only did they add the ace of the other team to reach last year's ALCS to an already strong rotation, but they've improved six positions with the additions of third baseman Adrian Beltre, center fielder Mike Cameron, and shortstop Marco Scutaro, a full-season of Victor Martinez behind the plate, the defensive upgrade of Jacoby Ellsbury in left field, and the ability to platoon Mike Lowell with David Ortiz at designated hitter. Add in a full season of Clay Buchholz, a possible rebound by Daisuke Matsuzaka, and a full season of Daniel Bard in the bullpen, and the Red Sox have the potential for a staggering amount of improvement over a team that won 93 games a year ago. Given the Yankees' potential for regression and injury, particularly with Derek Jeter, Jorge Posada, and Nick Johnson, I think all of that improvement will allow the Red Sox to edge the Yankees in the division (followed by the Rays, Orioles, and Blue Jays in that order), but the race should be close enough that a bit of fortune, good or bad for either team, could tip the balance.
That's, generally speaking, the same prediction I made last year: Sox win division, meet Yanks in ALCS, so take that for what you will.
PS: Thanks, Cliff.
Cliff Corcoran is the co-author of Bronx Banter on the SNY.tv blog network and also writes for SportsIllustrated.com and Baseball Prospectus books.
| Behind the Scoreboard | March 16, 2010 |
Franchise Strengh Index History for All 30 Teams
Apologies for the short post today. Recently, I presented a model of predicting attendance for major league teams. Last week, I presented "Franchise Strength Index", an index measuring the strength of the franchise controlling for the quality of the team on the field, new ballparks, playoff appearances, etc. Essentially, the Franchise Strength Index is just the residuals of the attendance model. A Franchise Strength Index of greater than 1 indicates the team draws better than one would expect, while an index less than one indicates a weaker franchise that is drawing fewer fans than expected.
In response to some readers, I've decided to present graphs of every MLB team's Franchise Strength Index throughout their history. What follows are the graphs, followed by a few brief comments. Last week many commenters made some great observations concerning the expansion era moves and I encourage people to do the same here.
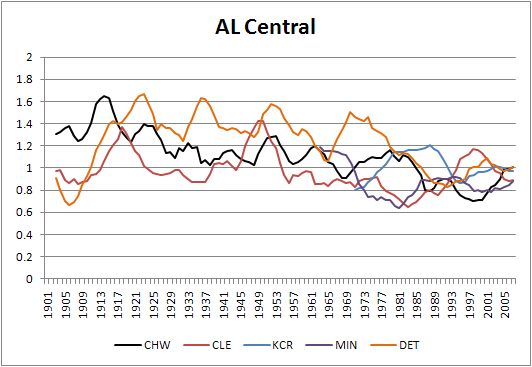
Notes:
- The Tigers used to be one of the power franchises in the MLB. Now, even though they are sometimes considered "small-market", they rate as about average.
- The last few years aside, the White Sox have franchise strength has steadily declined since the Black Sox era.
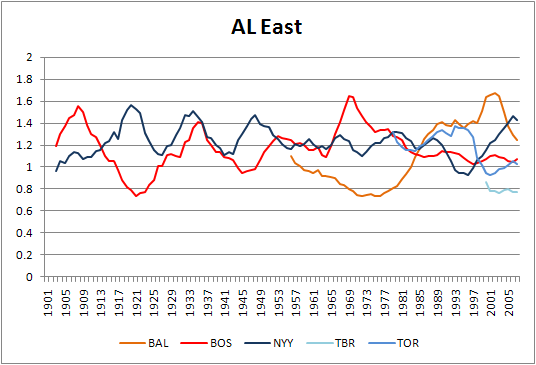
Interesting Notes:
- The Orioles were actually the AL East's strongest franchise during the 1990's and 2000's.
- The Red Sox actually haven't been all that strong throughout their history (recent history should be disregarded however, since the Red Sox have a small ballpark that has reached capacity).
- The Yankees brand actually fell below average in the early 1990's.
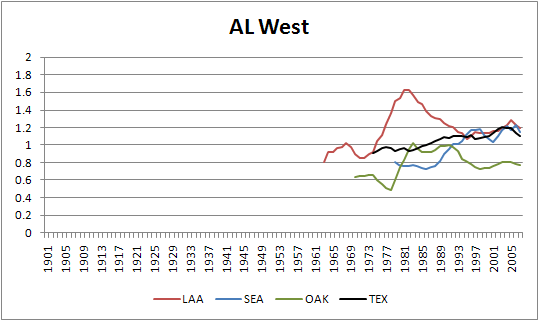
Interesting Notes:
- Despite playing second fiddle to the Dodgers, the Angels are still a tremendously strong franchise.
- The Mariners popularity increased dramatically with the presence of Ken Griffey Jr. and was further cemented by the 1995 team.
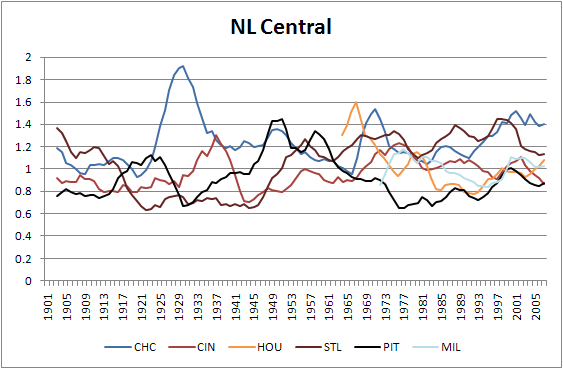
Interesting Notes:
- The Cubs are the strongest they have been since the 1920's.
- The Cardinals franchise benefited tremendously from the St. Louis Browns leaving town.
- The Pirates are actually in a stronger position now than they were when they were winning in the 1970's.
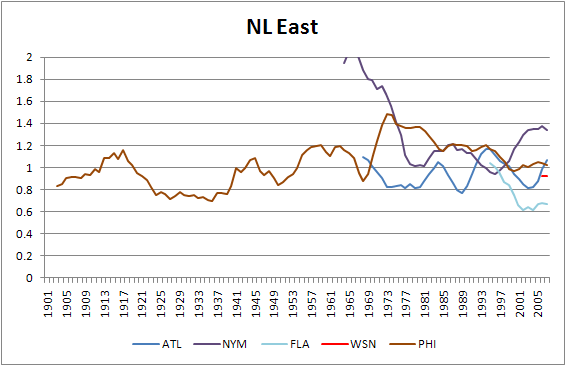
Interesting Notes:
- The Mets of the 1960's were baseball's most popular team ever relative to their performance.
- Despite their big market reputation, the Phillies don't have tremendous attendance. Veteran's Stadium was one of the biggest ballpark boosts ever received.
- Florida's in real trouble and has been for some time.
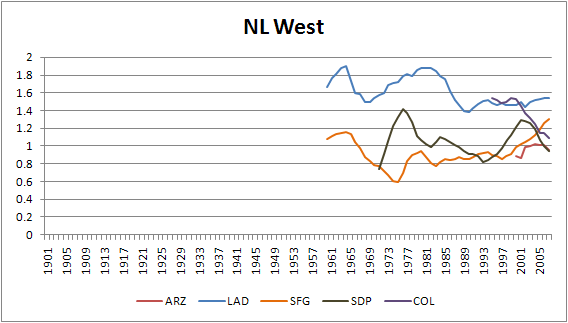
Notes:
- The Dodgers are bar-none baseball's strongest franchise.
- The Rockies started as one of baseball's strongest expansion teams, but have fallen considerably.
Thoughts?
| Baseball Beat | March 15, 2010 |
Remembering Willie Davis and Merlin Olsen
While I was out of the country last week, two Los Angeles sports stars of my youth — Dodgers center fielder Willie Davis and Rams defensive tackle Merlin Olsen — passed away. Both were 69.
Growing up in Long Beach, I have fond memories of Davis and Olsen. If not for their age and overlapping athletic careers in L.A., these two men would have little, if anything, in common.
The following photos were taken by Frank Finch of the Los Angeles Times. He donated them to the Dodgers and Mark Langill, team historian and publications editor, was kind enough to share them with me a few years ago.
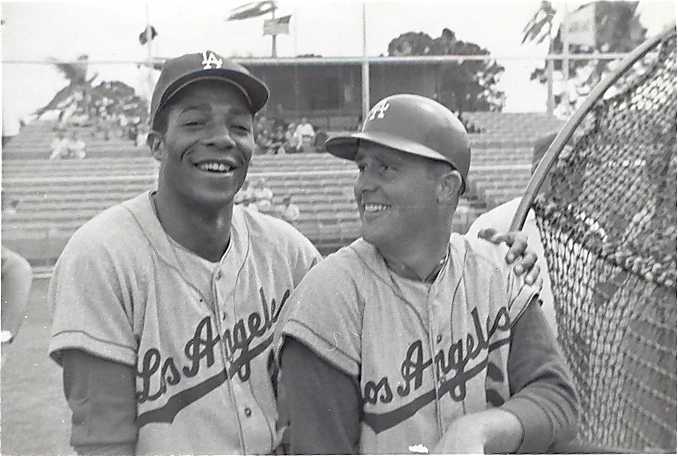
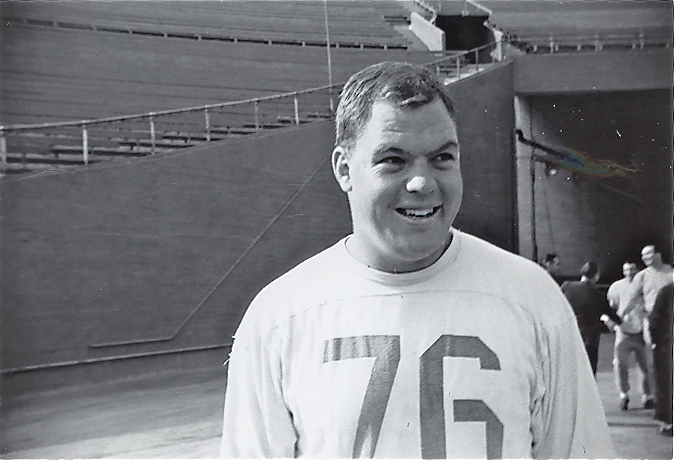
Davis (above left, standing next to Ron Fairly at a batting cage in spring training) was born in Mineral Springs, Arkansas on April 15, 1940, seven years before Jackie Robinson broke the color barrier in Major League Baseball. His family moved to Los Angeles when he was a youngster. Tall and slender, Davis lettered in baseball, basketball and track & field at Roosevelt High School. He ran a 9.5-second 100-yard dash and set a city record in the long jump of 25 feet, 5 inches. Dodgers scout Kenny Myers signed Willie after he graduated from Roosevelt HS in 1958.
Myers converted Davis into a left-handed hitter to take advantage of his speed. The scout and his protege starred in "The Willie Davis Story," a black and white made-for-television movie that I remember airing back in the early 1960s. John Herbold, a legendary high school baseball coach at Long Beach Poly and Lakewood and former scout with the Dodgers and Angels, wrote a terrific column about Myers for the Collegiate Baseball Newspaper several years ago. I had the privilege of playing for Herbold and he taught us several fundamentals that he learned from Myers, whom he called "the greatest baseball teacher and thinker I ever met."
Davis played 18 seasons in the majors (plus two years in Japan) and was a member of two World Series championship teams in Los Angeles in 1963 and 1965. He produced 2,561 hits (82nd all time) and stole 398 bases (68th). Davis also won three consecutive Gold Gloves from 1971-73 although Dodgers fans may remember him more for the record three errors on two consecutive plays in the fifth inning of Game Two of the 1966 Fall Classic against the Baltimore Orioles (which happened to be the last game that Sandy Koufax pitched). Willie's nickname was "Three Dog," not for the errors or what sometimes appeared to be his lackadaisical play in the field but rather for the number he wore on the back of his uniform. His 31-game hitting streak in 1969 broke Zack Wheat's franchise record of 29 in 1916.
The three-time All-Star fell upon hard times during the 1990s. He abused alcohol and drugs and was arrested at his parents' home in Gardena for allegedly threatening to kill them and burn down their house unless they gave him $5,000. The Dodgers subsequently reached out to Davis and hired him to work in their speakers bureau. I last saw and spoke to him at a game three years ago and am thankful for that opportunity. He recalled my Dad, who covered the Dodgers from 1958-1968. Davis looked frail to me, but he seemed to be in good spirits. I will always remember him for his positive contributions to my favorite team while growing up.
Olsen (in the photo on the right, standing near the tunnel of the Coliseum prior to the 1964 Pro Bowl game) was born in Logan, Utah on September 15, 1940. He was exactly five months younger than Davis. Olsen was the oldest son in a large Mormon family. He attended Utah State University and graduated summa cum laude and Sigma Chi with a degree in finance in 1962. Merlin was a three-time academic All-American and an All-American defensive tackle, winning the outland Trophy in his senior season.
Drafted by the Rams in the first round in 1962, Olsen played his entire 15-year career with the the team and was elected to the Pro Bowl a record-tying 14 times. He was named the NFL's Rookie of the Year and first-team All-Pro in 1964 and from 1966-1970. Olsen is a member of both the College Football and Pro Football Halls of Fame.
Although Olsen is wearing 76 in the photo above, he may be the most famous player associated with the number 74 in the history of pro football. He was a member of "The Fearsome Foursome," the Rams' defensive line that consisted of Olsen and Rosey Grier at the tackle positions and Deacon Jones and Lamar Lundy on the ends. Olsen and Jones may have been the best defensive tackle and defensive end in the game for several years during the 1960s.
A gentle giant off the field, Olsen was smart and articulate. After his playing days were over, he was a noted broadcaster, actor, and businessman. Olsen starred in Little House on the Prairie, Father Murphy, and Aaron's Way. He teamed with Dick Enberg on NBC's coverage of the AFC throughout the 1980s and was one of my favorite color commentators. Olsen also served as a pitchman for FTD Florists for a number of years.
Olsen was diagnosed with mesothelioma in 2009 and underwent three courses of chemotherapy. He died on March 11, 2010 at City of Hope Hospital in Duarte, California, two days after Davis passed away at his home in Burbank.
Davis and Olsen will be missed by their families, friends, teammates, and fans. Rest in peace.
| Behind the Scoreboard | March 10, 2010 |
Moves of the Expansion Era
Last week I wrote a piece explaining a model of major league attendance through history. The important drivers of fan attendance turned out to be the team's winning percentage over the past three years, as well as its recent playoff experiences. Being an expansion team or having a new ballpark helped as well. Not surprisingly, even when accounting for these factors, there was still a fair amount of variation between teams - the Pirates and Yankees don't draw the same even when all other factors are equal.
Looking at a team's innate ability to draw fans apart from it's success on the field was one of the impetuses for coming up with the model. I was curious to look at how teams' attendance fared compared to their predictions. Teams which consistently outdraw their predictions based on WPCT, playoff appearances, etc are obviously very healthy clubs with strong fan bases. Teams which consistently draw fewer than they should are teams which are struggling as a franchise.
I created an Franchise Strength Index based on the residuals of the model. The index was defined as Actual Attendance/Predicted Attendance. The index attempts to tease out the strength of the fan base while controlling for factors such as whether the current ballclub is good or bad. Teams that drew more than expected are strong franchises and have an index greater than one, while weak teams have an index less than one. The graphs below are of the 5-year moving average of the Franchise Index.
Using this index, I'll look back and rate the franchise relocations which took place during the expansion era. Did moving the Dodgers from Brooklyn really make the team more prosperous? How about when the A's moved out of Philadelphia? Without further ado, here are MLB's moves and how they've fared.
1957: Brooklyn Dodgers move to Los Angeles
In one of the most maligned franchise relocations of all-time, Walter O'Malley broke hearts all over Brooklyn when he demolished Ebbets Field and moved the Dodgers to the west coast. To hear old Dodgers fans talk, one would think that Brooklyn sold out every game and that there was no reason for the move. A look at the graph below shows that after a mediocre first 20 years as a franchise, the Dodgers did become one of the premier draws in the National League through WWII, despite being a fairly poor team for much of that time. During this period, Brooklyn drew nearly 50% more fans than a comparable team would have. However, after the war, for whatever reason, attendance dropped. The team was very good, but attendance was not as high as one would expect. During the 1950's Brooklyn drew only about 90% of their expected attendance.
Hence, the move west. The move was a smashing success as the Dodgers - according to the Franchise Index - currently enjoy the best fan base of any team, including the Yankees. During their time in LA, they've drawn over 70% better than a comparable team in another city would draw. Today, that figure has dropped to 50%, but it's still the best in the baseball.
Had O'Malley decided to stay in Brooklyn, the closest comparable team would be the New York Mets. The Mets clearly draw better than average and they currently draw about 40% better than the average team - one of the best in baseball. It's clear the Dodgers likely could have continued to have success in New York, but as the graph shows, the LA market is an even better place to be.
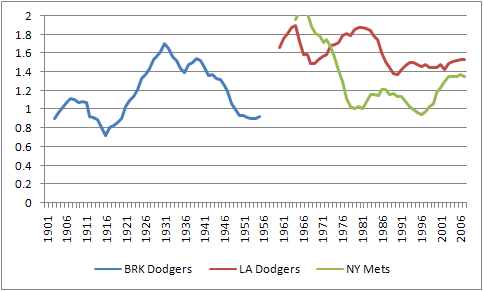
Verdict: Great Success
1957 New York Giants to San Francisco
Of course, the Dodgers move was accompanied by the Giants, who moved to San Francisco that same year. The Giants were a consistently popular team through WWII, drawing 20-40% better than the average club. However, like the Dodgers, their attendance strangely dropped after World War II. During the 1950's the Giants were a good ballclub, but their attendance didn't seem to get the boost you would expect (does anyone have any ideas on why New York baseball experienced a drop in popularity during this era?). For the first time in their history, the Giants became a below average gate draw relative to their performance. It was enough to make them move to westward.
Did the Giants move have the same success as their fellow New York team? Not nearly. Until the past few years, the Giants have consistently underperformed at the gate. Throughout most of its history, the San Francisco Giants have drawn more poorly than even the darkest days in the New York era. Pac Bell seems to have helped remedy that (and I'm sure the end of Candlestick Park played no small role in that as well) and the Giants are now a strong market. Still, compared to what might have been had they stayed in New York, the Giants did not do well for themselves. Compared to New York's new National League team, the Giants have clearly performed much worse.
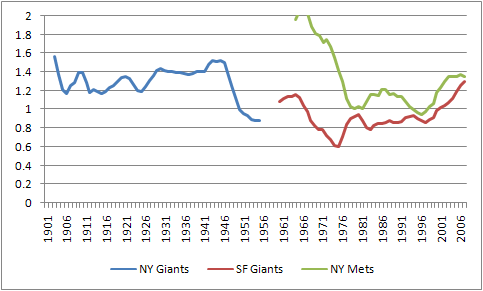
Verdict: Major Mistake
1953: Boston Braves move to Milwaukee
In 1953, the Boston Braves, long one of baseball's sorriest teams, moved west to Milwaukee. Except for a brief period in which they managed to draw decently despite being terrible in the 1930's, the Braves consistently underperformed at the box office, with an Franchise Index of just .80. Being bad so long, doesn't do wonders for morale, however things didn't change after winning the NL pennant in 1948. By 1952, they were drawing just 70% of expected attendance.
Fans in Milwaukee were thrilled to get a new team, and the Milwaukee Braves were wildly popular, drawing 40% more fans in their first years than expected. However, this quickly wore off, and despite going to back-to-back World Series in 1957 and 1958, they began underperforming. Still, the situation was never dire. The year before they left, their attendance index was .90, worse than average, but still respectable. When the team announced they would be leaving for Atlanta the following season, fans boycotted the team and their attendance predictably plummeted. The Braves popularity in Milwaukee had surely declined as time went on, but they were still a respectable franchise. In all, the Braves time in Milwaukee was far more successful than it had been in Boston, making the move a good one.
Verdict: Success
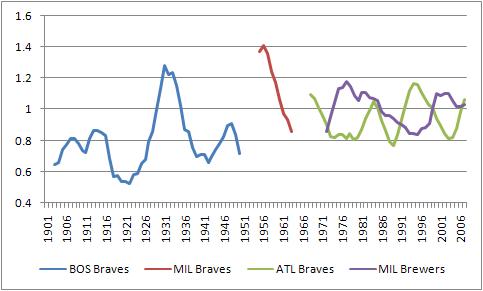
1966: Milwaukee Braves move to Atlanta
Much to the ire of Bud Selig, in 1966, the Braves moved to Atlanta. Since the Braves were still doing well in Milwaukee, it was a risky move. Did it pay off? The graph above shows mixed results. The Braves, by and large, have been less successful than they were in Milwaukee. They've fluctuated largely between drawing about average, which they did at their high points in the early 1980's and early 1990's, to drawing about 80% of expected. Despite dominating the National League for over a decade, Braves fans didn't turn out in droves like you would expect.
We can see what might have been by looking at the success of the Milwaukee Brewers. In all, the Brewers and Braves have had about the same franchise strength over the past 40 years, each having a Franchise Index either fluctuating between 1.0 and 0.8 during course of their histories. Overall, the move was probably a wash, with Milwaukee debatably being a slightly better market.
Verdict: Wash
1961 Washington Senators Move to Minnesota
The Washington Senators were never one of baseball's premier clubs. A look at the graph below shows that they always were one of baseball's lower drawing clubs, consistently drawing only about 80-90% of what other teams would have done. After World War II, the situation got worse, and attendance dropped to just 70-80% of the expected gate. So, in 1961, the team's owners decided to pack up and leave for greener pastures, heading to Minnesota and renaming the franchise the Twins. The move started as a great success. The Twins drew better than most new teams, and it looked as though the move to Minnesota might pay big dividends, especially when the team went to the World Series in 1965. It wasn't long however, before the city became bored of the team and attendance once again dropped to just 70% of the expected gate. Recently, the Franchise Index has increased to .80 or .90, but Minnesota is still a struggling market. The overall effect of the move was negligible. Aside from the first few big years, the team drew about the same as it had in Washington. The new Washington team has drawn better in its first five years than the Twins franchise, leading one to wonder if they shouldn't have just stayed there all along. Overall, the move was pretty much a wash.
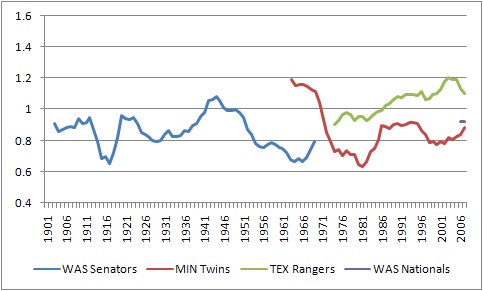
Verdict: Wash
1973 Washington Senators Move to Texas
In one of the stranger moves of all-time, baseball allowed the Senators to move to Minnesota, but then thought enough of the Washington market to allow them an expansion team. As it turned out, the new Senators drew about as well as the old Senators. Who knew? Still, drawing just 80% of expected attendance is probably not what the new owners had in mind. So, the team packed up for Texas, to become the Rangers. As you can see from the graph above, the Rangers became quite a strong market team, despite not winning a lot of games. After a slow start, they've consistently drawn more fans than expected. Currently, they're certainly in a better position than the Washington Nationals, and are clearly in much better shape than when they left Washington in 1973.
Verdict: Success
1955: Philadelphia A's to Kansas City
The Philadelphia A's were one of baseball's more successful teams. The franchise had its ups and downs (interestingly, the team drew worse than expected when they were winning, but better than expected when they were losing), but overall tended to draw better than the average team. They certainly drew better than their cross-town rival Phillies. However, after WWII, their attendance began to plummet. By the mid-1950's they were drawing just 60% of their expected attendance. With Connie Mack running the franchise into the ground, the team was moved to Kansas City. When the team moved to KC, they were more successful than most new teams. Even after the newness wore off, Kansas City remained at least an average market for a major league club - a vast improvement over their abysmal gates in Philadelphia. The move certainly had to be deemed a success, though proper management in Philly probably shouldn't have made the move necessary at all.
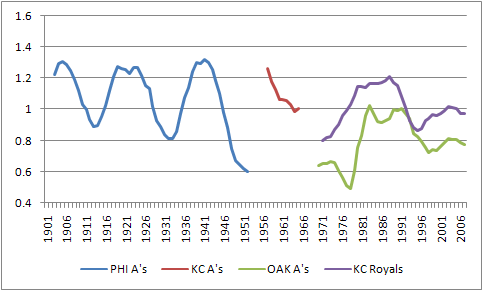
Verdict: Success
1968: Kansas City A's to Oakland
Apparently, being an average market team wasn't enough. Once in Kansas City, the Charlie O. Finley started looking around for a new home which would earn them even more revenue. Perhaps he had not seen that the San Francisco Giants were struggling at a below average clip themselves. It wouldn't take a genius to see that adding another team to that market wouldn't be the smartest of all ideas. But nevertheless, the White Elephants moved westward once again. Oakland did indeed prove to be a tough market. Throughout much of their time there, they have hovered at around 80% of a typical team's gate. They stand today as the team with the 2nd worst fan base (behind the Florida Marlins). Meanwhile, the Royals are about at the middle of the pack. KC hasn't put a good product on the field for quite some time, but once we account for that, the fans come out at an average rate. Overall, the A's would have been much better off staying in Kansas City, and perhaps even sticking it out in Philadelphia rather than moving to the already saturated San Francisco market.
Verdict: Major Mistake
1954: St. Louis Browns to Baltimore
The St. Louis Browns hold the distinction of being the saddest team of all time, but this wasn't always the case. St. Louis was actually a "Browns Town" for the first 20 years of the 20th century and they were a more popular than average team. However, after the Cardinals success in the 1920's the Browns popularity faded tremendously. By the 1930's they were drawing just 40% of their expected attendance. It's surprising that the team stayed as long as it did. An NL Pennant in 1944 was nice for long suffering fans, but there were too few of them to make a difference. By 1954, it was time to move east to Baltimore.
The Orioles started off slowly, and for a while it looked as though the Orioles might become just as unpopular as the Browns. Despite having a good ballclub, during the 1970's they drew just 70% of what most teams would have drawn. However, the championship 1983 team with Cal Ripken put them back on a popular path. Since then they've become one of baseball's strongest and most popular teams, drawing 40% more than one would expect. However, Peter Angelos may have had a legitimate point when protesting the Washington Nationals move from Montreal. Since the Nats came to town, the Orioles' Franchise Index has dropped to 1.2. This still makes them one of the most popular teams in baseball, but they're now at the lowest point since the early 1980's.
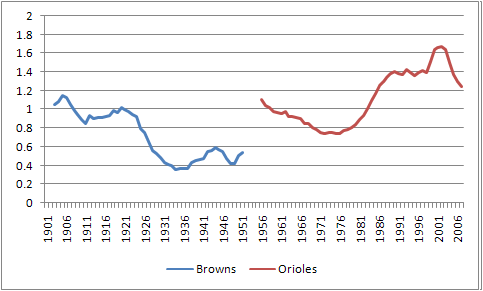
Verdict: Major Success
2005: Montreal Expos to Washington
When the Expos started in Montreal, they were one of baseball's hottest teams. Drawing better than most expansion teams, they slowly declined under poor ownership. They were still a stronger than average team through the mid-1980's but went downhill fast from there. Their attendance slowly declined from there until hitting the low point at just 50% of expected attendance in their final years in the league. With an attendance index of just 50%, they were the second least successful team in the history of baseball, falling behind only the St. Louis Browns. Obviously something had to be done, and playing in Puerto Rico was not a long-term solution. The move brought baseball back to Washington. While the Nationals attendance has been worse than average thus far, the franchise is far healthier than it was in Montreal. This move was a success - not because Washington has been so wonderful, but simply because the team needed to get out of Montreal.
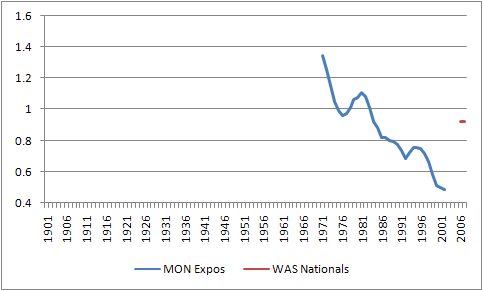
Verdict: Success
Who's next?
Which team might be next? The average Franchise Index of a relocated team was .78 at the time of departure. Do any of today's teams meet this threshold? The Florida Marlins currently have the lowest Franchise Index at .67, meaning they draw just 67% of what a team in a comparable position might draw. They've been below 70% for the past 7 years, indicating major trouble in Florida. They are not yet in St. Louis Browns or Montreal Expos territory, but they do have similarities to the Boston Braves or Philadelphia A's. To be fair there have been other teams in nearly as much trouble that have survived. The Giants and Orioles in the 1970's, the Pirates in the 1990's, and the White Sox in the early 2000's are a few such examples. The Giants and Orioles are now quite popular and the White Sox are averagely so. So there is hope.
When Florida gets its new stadium, it will be interesting to see if they get the expected attendance boost or whether they continue to fade into obscurity. The next most troublesome teams are the Oakland A's and Tampa Bay Rays, which each are currently drawing 78% of expected attendance. While this is probably out of the danger zone, it's not great news for these teams either. Rounding out the bottom 5 are the Cincinnati Reds and the Pittsburgh Pirates, though they are drawing 86% and 88% of attendance, which is certainly respectable.
| Change-Up | March 09, 2010 |
Stakeholders - Oakland Athletics
From now through the beginning of the regular season, we will not be posting in-depth round-tables previewing each division like we have in years past. Instead we will feature brief back-and-forths with "stakeholders" from all 30 teams. A collection of bloggers, analysts, mainstream writers and senior front office personnel will join us to discuss a specific team's hopes for 2010. Some will be in-depth, some light, some analytical, some less so but they should all be fun to read and we are thrilled about the lineup of guests we have teed up. Today it's Oakland Athletics Assistant General Manager, David Forst.
![]() Patrick Sullivan: Well David, the bad news for 2009 was that you were a last place club. But a 17-10 record in September, just a -2 run differential for the year and a lot of young talent say to me that there's reason for optimism in Oakland . Are you guys comfortable with how you're currently positioned?
Patrick Sullivan: Well David, the bad news for 2009 was that you were a last place club. But a 17-10 record in September, just a -2 run differential for the year and a lot of young talent say to me that there's reason for optimism in Oakland . Are you guys comfortable with how you're currently positioned?
David Forst: Well, I think the nature of this job is such that you’re never comfortable where you’re at and that you’re always looking for a way to improve. Having said that, I think we were all happy with the way the team performed over the last two months of the 2009 season and particularly how some of our individual young players progressed at the Major League level. That’s not to say that we don’t still have a lot of work to do as an organization - we play in a division that has the potential to be the most evenly-matched from top to bottom in the game. And, despite having added some important veteran pieces (Ben Sheets, Coco Crisp, Kevin Kouzmanoff, et al) this winter, we are still a young team. But, it’s a young team that we’re excited about seeing on the field in 2010 and certainly beyond that.
PS: The AL West is getting ridiculous. Texas comes off 87 wins, adds Vladimir Guerrero and Rich Harden, and develops/graduates yet more top homegrown talent. Everyone knows about what Seattle has done this off-season, and I am convinced that the Angels one way or another will never again win less than 85 games. I can't imagine it changes your approach, you always want to be as good as you can be, but can you speak to the competitive dynamics taking shape in your division?
DF: You’re right – it doesn’t change our approach. We just don’t have the resources to react to every move our competition makes the way some of the teams in the AL East do. But, it’s also not like we got caught by surprise by the fact that there are other teams in our division who have money to spend and have smart people making the decisions on how to spend it. And that’s why we had to be somewhat pro-active this offseason in identifying pieces that fit what we’re trying to do and then be aggressive in pursuing them. Some of them worked out; Jake Fox, Coco Crisp, and Adam Rosales were all players we had discussed even before 2009 ended as guys we wanted to find a way to acquire. Some of them didn’t happen; it’s no secret we pursued players like Marco Scutaro, Adrian Beltre, and Aroldis Chapman, only to lose out after making what we thought were very competitive offers. But, the other piece of that puzzle was being in a position to pursue a guy like Ben Sheets. We’ve spent a few years now developing young, major league-ready players to fill our roster so that, when the time came to outbid everyone on a top of the rotation guy like Ben, we’d have the financial flexibility to do it. So, to answer your original question – we definitely know what a competitive and evenly matched division the AL West is going to be, not just in 2010, but in the years beyond, and we’re constantly doing what we can to be competitive for the long term.
PS: Without venturing into the proprietary or confidential, can you talk about Ben's medicals? What ultimately gave you guys the comfort to pull the trigger there?
DF: First of all, any time you’re talking about pitchers, there’s no such thing as a guarantee when it comes to medicals. Plenty of pitchers who have been healthy for years are just one throw away from something that’s going to force them to miss time. So, it’s all degrees of confidence and certainty when you’re talking about investing significant dollars in a pitcher. In Ben’s case, we were obviously comfortable enough with what we read and what we saw to make the financial offer that we did. Without getting too much into details, we sent two people (Billy Owens, our Director of Player Personnel, and Gil Patterson , our Minor League Pitching Coordinator) to see Ben throw only after our trainers and doctors had read his medical file and signed off on it to that point (almost 11 months post-op). What we were hoping to see was a workout that matched what we were reading on paper, and that was part of why we sent Gil. He has as much experience with rehab, both as a pitcher himself coming up in the Yankees system and as a coach who has helped numerous pitchers come back from surgery over the past 25 years, as anyone in the game. What we saw on video and got back in the form of a report was that, what Ben was able to do off the mound that day in Monroe was just as good an indicator of how healthy is he as the written medical files were. Add to that a positive exam and MRI with our orthopedist in Oakland , and we were as comfortable as we could possibly be with Ben. Like I said earlier, all you can do with pitchers is just be as certain as possible. The next person who comes up with a fool-proof way of predicting every injury will be the first.
PS: Can we talk about your outfield? Would you have traded Aaron Cunningham without Coco Crisp in the fold? What are you guys thinking about for a Michael Taylor ETA? Whither Travis Buck? How pissed will you be if even one fly ball lands on the outfield grass? I imagine you guys are excited about your outfield defense with Rajai Davis and Ryan Sweeney flanking Coco. I'm throwing a lot at you, but just some general thoughts about the state of the A's outfield would be great.
DF: Well, I will admit, it certainly looks crowded out there right now. But, as we’ve found out the last few years, these things have a way of sorting themselves out. There’s no doubt that outfield defense (and defense in general) was a priority for us of late, and with the possibility of Sweeney, Crisp, and Davis out there at the same time, we feel really good about the prospects of turning some doubles into outs. The rest of the candidates out there are no slouches either – we think Taylor has a chance to be an above average corner guy, Travis has put a lot of effort into his defense over the last year and made a lot of improvement, and Gabe Gross has always done a good job at all 3 OF spots. Bob has a lot of good options when it comes to the outfield, and we always say that having too many good, healthy major league players is never a problem.
PS: Thanks a lot, David. To wrap things up, could you just discuss what, if any, overarching goals the A's Baseball Ops staff has on a year to year basis? I am from Boston and a lifelong Red Sox fan, and we hear Theo discuss the goal of putting a product on the field every year capable of winning 95 games. Understanding you don't have Boston's resources at your disposal, 95 wins annually may be too much of a stretch. But what is it that you guys are trying to do year in and year out?
DF: Without sounding incredibly boring and cliché, our goal every year is to win the division. That’s what we get paid to do and that’s what our fans expect. Last time I checked, they don’t hand out trophies for Best Trade or Best Looking Prospects or Most Marginal Wins by Payroll (trust me, we’ve tried on that one). At the same time, we are aware of our resources and the balancing act that needs to be done so that we’re not sacrificing the success of future teams. Every front office in the game wants to have a team that is competitive each and every season. But, in a market like ours, if we misread where our club is in the “Success Cycle,” we run the risk of setting the franchise back years. So, we’re constantly assessing the current club, the options available to us to make improvements for the “now” and for the future, and having to decide what gives the A’s the best chance to be successful for an extended period of time. I hope that helps explain at least a little bit what we’re “trying to do year in and year out.”
PS: Thanks again, David, and good luck to the A's in 2010.
| Change-Up | March 08, 2010 |
A Quick Note on Josh Beckett & John Lackey
Some of the rationale for extending Josh Beckett that I have come across hinges on comparing Beckett to his new teammate, John Lackey. This makes sense, since they are just about the same age and are similar pitchers in many regards. The conclusion most often drawn, however, looks off-base to me. Yes, the Beckett decision has a lot to do with Lackey. No, the Red Sox should not sign Josh Beckett because they signed John Lackey.
 Each off-season presents its own set of challenges and opportunities. This off-season, the Red Sox thought that allocating a large chunk of their free-agent spend towards a marquee starting pitcher on the wrong side of 30 was a good idea. Since Beckett is probably a tick better than John Lackey and is himself set to enter free agency after the 2010 season, one school of thought is that the Red Sox’ logic would somehow be inconsistent were they to choose to let Beckett walk just one season after bringing aboard Lackey. It’s a dream storyline for talk radio, and you can be sure they’ll be ready to pounce in 2011 and beyond should Lackey falter and Beckett excel wearing some other uniform.
All a front office sets out to do is maximize their team’s chances for short term and long term success. And as I noted the last time I addressed the topic of a possible Beckett extension, signing pitchers over the age of 30 to long-term contracts is risky. Signing two of them, having as much as 25% of your annual payroll tied up in two aging starters, is even more risky. Should Beckett walk, it’s no indictment of his pitching. Instead, it will have simply been the wrong time for the Red Sox and Beckett to strike a long-term deal. Given a choice of Beckett or Lackey for the next five seasons, maybe Boston would have chosen Beckett if he was a free agent after 2009. But he wasn’t, Lackey was, the Red Sox wanted another pitcher and Lackey was available. Now Boston must manage their longer-term prudently, which could mean letting Beckett go.
And so while the sports radio guys salivate at the chance to tell you that “YOU HAVE TO SIGN BECKETT IF YOU SIGN LACKEY”, the reality goes something more like this. If you sign Lackey, you had better think long and hard before you decide two aging starting pitchers should account for 20-25% of your payroll. As Craig Calcaterra said on the topic, “it’s just business.”
| Around the Minors | March 07, 2010 |
Year of the Rookie: The 2010 AL Edition
Last week, we took a look at the Rookie of the Year candidates in the National League. This week, we're looking at the top MLB-ready (or almost ready) prospects in the American League. There are some impressive players on the cusp on the Major Leagues for 2010 so it should be an exciting race in the season to come.
Early 2010 Rookie Favorites
Brian Matusz, LHP, Baltimore
2009 Peak Level: Majors
2010 Roadblock: David Hernandez
One of the top 2008 draft picks, Matusz more than held his own in an eight-game trial at the Major League level in '09. He posted a 4.08 FIP in 44.2 innings. The southpaw showed solid control with a walk rate of 2.82 BB/9 and he missed some bats (7.66 K/9). On the downside, he allowed a lot of hits (52) and produced a low ground-ball rate (31.2%), which led to a HR/9 rate of 1.21. With that said, he's well positioned to take over the No. 4 starter spot - right behind Brad Bergesen and one spot ahead of sophomore Chris Tillman - in the Orioles rotation in 2010.
Scott Sizemore, 2B, Detroit
2009 Peak Level: Triple-A
2010 Roadblock: Ramon Santiago
The Tigers organization has not afforded many opportunities to rookies over the past few years but Sizemore is one of two prospects that should see regular playing time in the field. The 25-year-old second baseman will be making his MLB debut if he makes the club out of spring training as expected. Last season, he split the year between double-A and triple-A. At the senior level, he hit .308/.378/.473 in 292 at-bats. Overall, he slammed 17 homers and stole 21 bases (in 25 tries) on the year. Sizemore saw an increase in both his power and speed numbers in '09 so we must be cautious in our expectations: a .270 batting average with 10 homers and 15 steals is probably a good start.
Austin Jackson, OF, Detroit
2009 Peak Level: Triple-A
2010 Roadblock: Clete Thomas
Part of the loot for Curtis Granderson, the 23-year-old outfielder spent all of '09 in triple-A but would have reached the Majors in '09 for most clubs. Jackson hit .300/.354/.405 in 504 at-bats. His power numbers were down last year (.105 ISO) but he showed good speed on the base paths and nabbed 24 bases in 28 attempts. On the downside of Jackson's game, he doesn't walk enough for a top-of-the-order hitter (7.2%) and he strikes out too much for his modest power (24.4%). Defensively, he has good range in center field.
Wade Davis, RHP, Tampa Bay
2009 Peak Level: Majors
2010 Roadblock: Andy Sonnanstine
Davis, 24, impressed a lot of people with his first six MLB starts. In 36.1 innings of work, he allowed 33 hits and posted a walk rate of 3.22 BB/9. He also had a solid strikeout rate at 8.92 K/9 and his FIP was 2.90. There is some concern around the fact that he allowed a 25% line-drive rate and he'll likely need to use his secondary pitches a little more in '09 after favoring his heater (74.2% of the time). When he used it, his curveball was a valuable pitch. The Rays have an exciting, young rotation with James Shields, Matt Garza, Jeff Niemann, David Price, and Davis. Right-hander Jeremy Hellickson is also not far away.
Neftali Feliz, RHP, Texas
2009 Peak Level: Majors
2010 Roadblock: Tommy Hunter
After a lights-out debut as a reliver in '09, there has been some talk that the Rangers should just leave Feliz, 21, in the 'pen so he can dominate hitters. Luckily, the club has decided not to do that, though. Feliz' ceiling is even higher than Joba Chamberlain (who has been in a similar situation with the Yankees) but the Rangers organization desperately needs reliable starting pitching. In '09, Feliz gave up just 13 hits in 31.0 innings and showed good control for his experience level (2.32 BB/9). Along with a .129 batting-average-against, the right-hander posted a strikeout rate of 11.32 K/9 and had a tiny line-drive rate of just 4.6%.
The Sleepers
Michael Brantley, OF, Cleveland
2009 Peak Level: Majors
2010 Roadblock: Matt LaPorta/Russell Branyan
The recent signing of Russell Branyan hurts Brantley. The outfielder could now lose playing time to Matt LaPorta (a natural first baseman) who will likely get at-bats in left field in 2010, like he did in '09. Brantley will certainly not push Grady Sizemore out of center or Shin-Soo Choo out of right. As the fourth outfielder, though, Brantley could still be a valuable player and is one injury away from significant playing time. The rookie is a rare young player who truly understands his game. With zero power (.094 ISO in triple-A), Brantley's game is to get on base and use his legs (46 steals in 51 tries). He's done a nice job of actually walking more than he strikes out in his minor league career (1.23 BB/K in '09).
Michael Taylor, OF, Oakland
2009 Peak Level: Triple-A
2010 Roadblock: Rajai Davis
Taylor was busy this past winter, going from Philadelphia to Toronto to Oakland during the Roy Halladay trade (He was flipped from Oakland in a rare prospect-for-prospect trade that saw Brett Wallace land in Canada). The 24-year-old outfielder spent much of the '09 season in double-A where he hit .333/.408/.569 in 318 at-bats. He also appeared in 30 games in triple-A and he was a 20-20 player on the year. Taylor has the potential to be a very good player but he's currently blocked at the MLB level by both Rajai Davis and Ryan Sweeney - two inferior players. Expect Taylor to break through sooner rather than later.
The Second-Half Reinforcements
Brett Wallace, 1B/3B, Toronto
2009 Peak Level: Triple-A
2010 Roadblock: Lyle Overbay
Toronto tried unsuccessfully to trade incumbent first baseman Lyle Overbay during the off-season. However, he's in the last year of a multi-year deal so it's possible that the rebuilding Jays will be able to find a taker in the second half of the season. Wallace has the potential to be a .280-.300 hitter with 20-plus homers. He's definitely not a third baseman so first base (or DH) is his future destination.
Kyle Drabek, RHP, Toronto
2009 Peak Level: Double-A
2010 Roadblock: Various
With the trade of Roy Halladay, the Jays club has few proven arms in the starting rotation, which will benefit Drabek as he attempts to break through to the Majors. On the downside, he's low man on the totem pole with quite a few arms ahead of him, including Marc Rzepczynski, Brett Cecil, Brad Mills, David Purcey, Zach Stewart, etc. Drabek's fastball/curveball combination could help him reach the ceiling of a No. 2 or 3 starter.
Carlos Santana, C, Cleveland
2009 Peak Level: Double-A
2010 Roadblock: Lou Marson
The talented Santana will not be held off for long by fellow rookie Lou Marson. Santana is an offensive juggernaut with the ability to hit .300 with 20+ homers. He's also a proven run producer (97 or more RBI in the past two seasons) and he gets on base at a crazy rate thanks, in part, to his walk rates of 15-16%. The only hole in his game right now is his defense, as he was converted to catcher just a few years ago.
Tyler Flowers, C, Chicago
2009 Peak Level: Majors
2010 Roadblock: A.J. Pierzynski
Another offense-first catcher, Flowers received his first taste of MLB action in '09. Veteran A.J. Pierzynski is signed through 2010, which is really the only thing keeping this prospect from blooming in the Majors this season. The slugger is similar to Carlos Santana in the fact that he gets on base a lot (18.0% in double-A) with power (.246 ISO) but he's not going to hit .300 in the Majors. The Braves organization will likely regret trading Flowers more than Jarrod Saltalamacchia.
Jesus Montero, C/DH, New York
2009 Peak Level: Double-A
2010 Roadblock: Jorge Posada
As scary as it is to consider, Montero's bat may be MLB-ready right now. And that's keeping in mind that he has just 44 games above A-ball and he's just 20 years old. With that said, his defense behind the plate is definitely not ready. As such, and considering that the club is not desperately in need of offense right now, there is no harm in keeping Montero is the minors where the organization can only hope his defense improves enough to make him a future backstop in the Majors.
Chris Carter, 1B, Oakland
2009 Peak Level: Triple-A
2010 Roadblock: Daric Barton/Jack Cust
Another slugger, Carter is suffering the same fate as Michael Taylor; the first baseman has no where to play right now, although he may be MLB ready. Carter can only hope that Daric Barton (or Jack Cust) will have a slow start to the season. A .250-.270 projected hitter in the Majors, the former White Sox prospect could hit 30-40 homers with massive strikeout numbers.
Desmond Jennings, OF, Tampa Bay
2009 Peak Level: Triple-A
2010 Roadblock: Matt Joyce
Jennings is a step behind Matt Joyce, who already has his own sabermetric fan club. However, a slow start could mean disaster as Jennings is all but ready for a MLB shot. The prospect showed improved power in '09 while also hitting above .320 with 52 steals (in 57 tries). If Jennings makes it to the Majors and shares the outfield with B.J. Upton and Carl Crawford, the Rays may have one of the best defensive (and speediest) outfields in all of Major League Baseball.
Jeremy Hellickson, RHP, Tampa Bay
2009 Peak Level: Triple-A
2010 Roadblock: Wade Davis
The future sure is bright in Tampa Bay. Hellickson is another Rays prospect that is blocked by other young players. Just 22, he's shown consistently-good control throughout his career and he posted a walk rate of 2.35 BB/9 in nine triple-A starts in '09. He also managed a strikeout rate of 10.99 K/9. On the year, right-handed hitters batted just .164 against Hellickson. One thing he needs to work on, though, is his ground-ball rate, which was just 39.9% combined between double-A and triple-A.
Justin Smoak, 1B, Texas
2009 Peak Level: Double-A
2010 Roadblock: Chris Davis
Smoak got off to a good start in double-A in '09 and he hit .328/.449/.481 in 183 at-bats. He also produced an outstanding walk rate of 17.2%. When he moved up to triple-A, Smoak found the pitching a little more challenging and his triple-slash line dropped to .244/.363/.360 in 197 at-bats. His BABIP went from .375 to .293. Once he shows a little more pop against southpaws (.214 average vs LHP, .326 vs RHP), the smooth-fielding Smoak should take over first base.
| F/X Visualizations | March 05, 2010 |
How Can I Get My Hands on the Pitchf/x Data?
I often get emails from my readers here and at fangraphs asking how they can access the Pitchf/x and batted-ball location data I use in my posts. In the past couple months a host of new tools have become available online that make the data much more accessible. So in this post I thought I would highlight these new, and the longstanding, online tools for accessing the data.
The Basics
First off Major League Baseball Advanced Baseball (MLBAM) releases the GameDay data (pitchf/x, batted ball, boxscore, etc.) every day in .xml files. For the casual fan it is a bit tricky to find these data. And even once they do each game has its own series of files so pulling out all the data by hand would be a Herculean task. And finally once you have all the data, over a million pitches each with tens of values (start speed, end speed, break, pfx_x, pfx_z, the nine fit parameters,…) it is just too much data to handle in excel, so a database is necessary.So let's look at the online tools to address each of these potential stumbling blocks. First off actually finding the .xml files and making sense of them. The best place for this is Alan Nathan's tutorial. He directs you to the site and then clearly defines each of the values in the pitchf/x data set.
Web Tools
Still this .xml file might not be of the most use to everyone. If you want to look at one pitcher's pitchf/x numbers over the course of a single game there is a great tool that has been around for while. Brooks Baseball displays pitch statistics, pitch speed over the course of a pitcher's appearance, a strikezone plot, and a number of pitch identification (movement vs speed) plots. The site makes if very easy to see, and download, an individual pitcher's data for a single game.Another easy resource are the pitcher pages at FanGraphs. Each pitcher page has a 'PitchFX' section that, like Brooks Baseball, gives charts for individual games (they do not have the strike zone plots like Brooks but add a release point chart). Beyond the individual game section they have an overview section with the percentage thrown, average velocity, and horizontal and vertical spin deflection for each pitch the pitcher throws. Finally they have season-long velocity charts for each pitch type. So you can see, for example, how Jon Lester gained speed on his fastball through 2008 and kept those gains in 2009.
Recently two new tools allow you to slice the data a little finer. The F/X tool by TexasLeaguers allows you to split out any pitcher's data by batter handedness, count, and date range. They produce similar plots as Brooks (pitch location, horizontal by vertical spin deflection, also release point and pitch trajectory) but for the range of dates considered rather than a single game. In addition it gives results (percent swing, whiff, in play) for each pitch type. This site also has pitch data for batters: percentage of each pitch type seen and statistics against them each of them. For batters it also creates graphs with batted ball locations and swing/take/called strike zone charts. Again you can split out by pitcher handedness, count and date range.
But if you would rather get the data in excel and create your own charts or do your own statistics you can use Joe Lefkowitz's pitchf/x tool. Here you can slice and dice the data in innumerable ways (pitcher, batter, pitching team, batting team, umpire, date, pitch type, runners on …) and then choose which pitchf/x numbers you want spit out into an excel file.
Another new tool to view the batted ball data (whose locations are from the MLBAM's gameday) including the ability to overlay an individual player's or park's locations on a different park's outline can be found here here. Peter Jensen showed that these batted-ball locations are not terribly out of line from BIS and STATS's, which unlike the MLB's are not free. But that does not mean we should take them as gospel, there is a great discussion of the limitations of this type of overlaying of data over at the Book Blog, particularly germane are the concerns of Nick Steiner and Greg Rybarczyk. Still a very cool site that promises more in the future.
Getting the Raw Data
Still some people are going to want even more unfettered access to the data, and if that is you, you will most likely need computer skills beyond the ability to use excel and a web browser. If so you could head over to Darrell Zimmerman's Pitchf/x database. It is in MySQL (a very popular open source database system) format. This way you get all the data in a nice database without having to scrape it off MLBAM's site yourself.Still if you want to have the data updated daily you need to scrape it for yourself. So that brings us to Mike Fast's instructions to scrape the data using a perl script and then get it into a MySQL database. These are an incredibly helpful set of instructions have been around since almost the beginning of the pitch/x era and helped many current, including this one, get access to the data. Nick Steiner used them as a guide to show how to do it with a Mac.
Finally as of just days ago Josh Hermsmeyer, who brought us the injury database, has a pitchf/x and MILB data extractor for Mac users. The extractor is built on PHP rather than perl and has GUI interface that probably makes it easier to use that command-line based systems. I have not tried it yet, but it looks great to me and would love to hear how it works.
Anyway I hope that helps. If there are any other tools I am missing please mention them in the comments and if I have incorrectly stated what one of these data sources offers people email me or tell me in the comments to I can correct it.
| Touching Bases | March 04, 2010 |
Best PITCHf/x Pitches of 2009
The PITCHf/x system uses two cameras to track pitches between pitcher and batter, determining the coordinates of the ball x(t), y(t), z(t) at times t in 1/60-sec intervals. The resulting trajectory is a nine-parameter (or 9P) fit corresponding to constant acceleration in each of the three coordinates. The 9P fit is an approximate solution to the exact equations of motion. All quantities reported in the PITCHf/x data base, such as the pitch speed, the location of the pitch as it crosses the plate, the break (or pfx) of the pitch, etc., are derived from the fitted trajectory rather than from the original data. -- Alan Nathan
Velocity, movement, location, release point are age old-terms in the baseball lexicon that have been quantified thanks to pitchf/x. Chris Moore in August published a groundbreaking study ranking the best fastballs in baseball using factors given by pitchf/x including velocity, horizontal location, vertical location, horizontal movement, and vertical movement. I will try my hand at a similar analysis. The goal is to measure a pitch's quality using only the inputs provided by pitchf/x. I've decided to use the same five parameters as Moore, also opting against adjusting for release point, and instead simply excluding all pitchers I classified as sidearm. I've tried to control for count and handedness as well. I'm calling the metric fxRV, as its units are in terms of run value.
Top Five Fastballs
| Player | Type | Pitches | Usage | rv100 | fxRV100 | Velocity |
|---|---|---|---|---|---|---|
| Matt Thornton | F4 | 857 | 75.04% | -1.42 | -1.27 | 95.74 |
| Lance Cormier | FC | 617 | 51.25% | -1.68 | -1.11 | 87.46 |
| Cliff Lee | FC | 587 | 15.31% | -0.38 | -0.96 | 85.85 |
| Justin Verlander | F4 | 2220 | 57.05% | -1.29 | -0.81 | 95.99 |
| Jason Motte | F4 | 634 | 68.32% | 0.04 | -0.77 | 96.17 |
Matt Thornton has top five stuff of any reliever in baseball and Justin Verlander has top five stuff of any starter. That type of velocity from a respective lefty and starter is unparalleled. Clayton Kershawas a left-handed starter will be entering that territory soon with his 94-MPH fastball. Verlander elevates his fastball more than just about anyone in the game with the exception of Kevin Millwood. According to FanGraphs, Lance Cormier has increased his cutter percentage each of the last four years to the point that he is now throwing it over half of the time. And looking at his pitch type values, he might want to entirely scrap his four-seam fastball, since it has never been an above average pitch while his cutter was fantastic last year. I'm puzzled by Motte's poor run value on his fastball. He's too good to fail as a reliever. Patience, TLR.
My numbers say that Danys Baez' fastball is in line for some regression this year, despite successful results. At the other end of the spectrum, Baez' teammate Chris Tillman has a quality fastball, even though it was ten runs below average last year. And Barry Zito's fastball is aggressively bad.
Top Five Breaking Balls
| Player | Type | Pitches | Usage | rv100 | fxRV100 | Velocity |
|---|---|---|---|---|---|---|
| Erik Bedard | CB | 438 | 32.57% | -1.50 | -1.85 | 77.67 |
| Zack Greinke | SL | 765 | 22.12% | -2.90 | -1.57 | 85.63 |
| Gio Gonzalez | CB | 515 | 28.61% | -1.41 | -1.48 | 78.68 |
| Bronson Arroyo | CB1 | 596 | 17.85% | -2.00 | -1.47 | 75.00 |
| Daniel Bard | CB | 221 | 25.46% | -2.12 | -1.46 | 83.93 |
Erik Bedard* and Gio Gonzalez both have big yakkers. Watching these guys on TV is fun, since a sweeping curveball from a left-handed pitcher as viewed from the off-center center field camera appears to be heading right for a left-handed batter's skull only to break over the inside part of the plate, hopefully as the batter's knee buckles: the old Barry Zito phenomenon. Joe Posnanski has called Zack Greinke's slider "devastating," "the best in the American League", and "his "God-given gift." It's a good pitch. Bronson Arroyo is to pitch classification systems as Bronson Arroyo's name is to Tim McCarver's brain. Nevertheless, his curveball(s?) are good pitches.
Kevin Jepsen didn't qualify for the leaderboard, but his curveball is superb. It gets similar movement to Bedard's curve, but comes in six miles per hour faster, albeit from the right side. Jepsen gets his curve down in the zone very well, too. He also throws a 96 MPH fastball and 90 MPH slider. I'm very, very high on Kevin Jepsen. Jonathan Broxton's four-seam fastball and slider were both within a spot of the top five. Daniel Cabrera? Yeah, he's bad.
*Ironically**, there's also a Canadian speed skater named Eric Bedard. If short track were regularly televised, I swear I would watch.
**I find it ironic that I don't know what irony means.
Top Five Off-Speed Pitches
| Player | Type | Pitches | Usage | rv100 | fxRV100 | Velocity |
|---|---|---|---|---|---|---|
| Burke Badenhop | CH | 142 | 12.40% | -1.88 | -1.09 | 82.19 |
| Bronson Arroyo | CH | 518 | 15.51% | -1.98 | -0.92 | 79.29 |
| Jered Weaver | CH | 594 | 16.56% | -1.36 | -0.84 | 80.21 |
| Brandon League | SF | 181 | 16.54% | -2.32 | -0.80 | 85.22 |
| Sean O'Sullivan | CH | 145 | 16.08% | -3.56 | -0.78 | 76.13 |
The four pitchers besides Brandon League are all on this list because they can command their off-speed pitches. Nothing in my system accounts for the deception of a change. League's splitter, however, was labeled by Matthew Carruth as the toughest pitch in the league to hit because of its 35% whiff rate. Burke Badenhop does a terrific job of getting his changeup down and away from opposite-handed hitters, and his pitch has a lot of "sink." Jered Weaver and Sean O'Sullivan generate a lot of "rise" on their changeups, though that's not necessarily a good thing, since Clayton Kershaw gets the second most rise on his change in the league, but it's a highly crude pitch. He can't locate it either.
Interestingly, Jonathan Papelbon had one of the worst splitters in baseball last year. He rarely threw it in the strike zone. I was happy to see that Daniel Ray Herrera's screwball was listed as a quality off-speed pitch. The world needs more screwballs.
| Behind the Scoreboard | March 02, 2010 |
What Puts Fans In the Seats?
One of the important questions to team management is how to put fans in the stands. Obviously winning ballgames helps, but the question is how much and in what way? Using data going back to 1950, I set out to create a model to help answer this question.
Attendance has varied wildly from baseball's inception. In 1950, the St. Louis Browns drew just 3,300 fans per game. Meanwhile, teams now routinely draw more than 10 times that amount. Clearly the shape of this data is not going to be linear. To deal with this, I transformed the data by taking the log of the per game attendance and used that to build my models.
There were several things I wanted to test out. For one, what is the relationship between attendance and WPCT in a particular year? What relationship is there for the previous year? Did it matter if the team made the playoffs? How about if they made the playoffs the year before? How about if they had recently won the World Series? How much did a new park affect attendance, and how long did it take before this effect wore off? Likewise with a team that just moved to a new city?
These were all questions I wanted to find out. I decided to get a little more rigorous than usual and create a mixed model to tackle some of the assumptions that might be broken by using a plain old general linear model. Obviously attendance varies by team as well as by the factors above. However, to get at the questions above we don't really care exactly what the effect sizes are for each team. The mixed model allows us to model this "random effect" of different attendance baselines by team. The mixed model also accounts for the fact that the errors are likely to be correlated from year to year by team. By accounting for this autocorrelation, we can get a better model. These changes have the advantage of more properly estimating the variance and standard errors of each of the variables that we care about.
So enough with the stats, what was important?
Winning Games
For one, not surprisingly, team winning percentage is very important. The average .500, non-playoff team that does not have a new park or any other advantages draws about 24,500 fans. Every extra game won adds about 300 fans per game. Of course, the relationship is not linear, but that's an approximate estimate. All else being equal, a .400 team will draw about 20,100 fans, while a .600 team will draw 29,900 - difference of about 10,000 fans per game. Obviously, winning teams draw more fans and the effect is quite large.
But, that's not even the half of it. As you might expect, the team WPCT from the year before also has a very large effect. This effect is not as large, but a .500 team who was a .400 team the year before draws 22,700, while a .500 team who was a .600 team the year before draws 26,400. This "year before" effect makes sense. At the beginning of the season, fans don't really have an idea if their team will be good, so it makes sense that they use last year's performance as a guide. The previous season's success draws fans back to the park, even if that success isn't repeated the following year.
The effect of winning continues up to two seasons later. As you would expect, however, the effect is smaller. Having a .600 team three seasons ago only puts about an extra 500-600 fans in the seats per game. However, this effect is statistically significant.
The chart below shows how the modeled effect of a team's WPCT is diminished as time goes on. The chart assumes that the team went .500 in all other years and that the team did not make the playoffs.
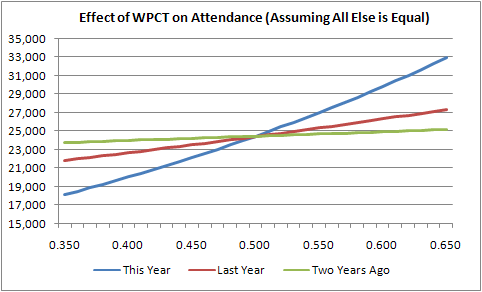
While WPCT obviously helped attendance overall, I was also curious to see if the slope of the lines changed depending on whether the team was over or under .500? Did an extra win provide different attendance value to a .450 team vs. a .550 team? I refit the model to test this out and found there was no significant difference. The relationship between WPCT and attendance was the same whether the team was good or bad. While of course an extra few wins won't help a poor team get any closer to a championship, it will help at the box office, and the attendance effect of those wins is just as important to poor teams as to good teams. Next time you deride a bad team for "wasting" their money by signing a free agent when they have no chance of winning anything, realize that the difference between stinky and mediocre can have a strong effect at the box office, even if it won't win any flags.
Making the Playoffs
Of course, that's without accounting for the attendance draw of being a playoff team. How does making the playoffs affect attendance? In general, a .550 team which did not make the playoffs will expect to draw 27,000, while a .550 team who did make the playoffs can expect to draw an extra 1,800 fans. Of course, this isn't an exact correlation. Whether a team makes the playoffs on the last day of the season has little effect on their average attendance for the year. However, the playoff effect is a proxy for the excitement surrounding the team being involved in a pennant race, and that's why it's included in the model.
How about the effect of making the playoffs the year before? As you might think, that has an even greater effect. Making the playoffs the year before raises a .500 team's attendance by about 3,000 fans per game - a major boost. Obviously making the playoffs raises hype around the team, and this appears to manifest itself in the form of increased attendance.
There are also significant interaction effects surround making the playoffs. Here we see evidence of a significant diminishing returns for playoff appearances. If you made the playoffs last year, making the playoffs this year won't create the same excitement as it might have had the team been experiencing success for the first time. The graph below shows expected attendance depending on when teams made the playoffs.
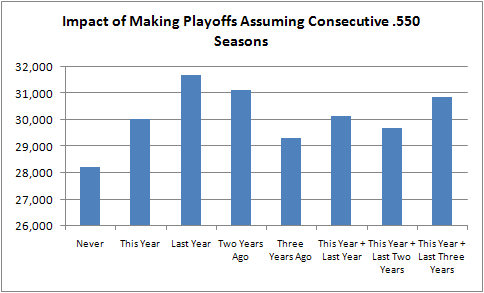
The first four bars on the graph above gives expected results. The effect of having made the playoffs diminishes over time. However, when teams make the playoffs multiple times in a short span, the results can be counterintuitive. The biggest oddity is that among teams who made the playoffs last year, attendance is higher for teams who miss rather than make the playoffs the following year. To me this doesn't make a lot of sense. The only explanation I can come up with is that a team coasting to a second straight playoff appearance might draw less because its fans will think "I'll watch 'em in the postseason", while fans may be more apt to come support a contender who fights for, but ultimately fails to earn a postseason spot. However, this explanation seems like a reach.
While I'm skeptical that making the playoffs can actually ever be a hindrance to attendance, the data definitely support the conclusion that multiple playoff appearances don't help attendance much more than just one playoff appearance. Simply put, making the playoffs isn't such a big deal after it's been done already. The data are an indication that fans can become bored with persistent winners (are you listening Braves?) and that excitement reaches a kind of maximum level which can't be exceeded no matter how successful the team has been in recent years. Of course, winning multiple years in a row is still better than never making the playoffs at all, as the chart above shows.
Winning the World Series
Winning the World Series has an effect, but it's not as strong as you might think. A .500 team which finished with a .600 WPCT last year and made the playoffs is expected to draw 28,100 fans. If that team also won the World Series last year, the expected attendance increases to 29,700. This increase of about 1,600 fans is significant, but it won't make or break the franchise. Additionally, the World Series effect lasts only for the year directly following the World Series victory. While winning a championship is every team's ultimate goal, it appears that making the playoffs has a stronger attendance effect than actually winning it all. As for appearing in the World Series, but not winning it, no statistically significant effect was found. Likewise for advancing beyond the first round of the playoffs.
A New Ballpark
None of these effects are as large however, as the new park effect. A look at its effect on attendance shows why every team has been clamoring for a new stadium. A regular, .500, non-playoff team usually draws 24,500. When the same team gets a new stadium, their expected attendance increases to 33,600. That's nearly a 10,000 fan per game increase! It's also a gift that keeps giving. The new park effect has a statistically significant effect for the next 10 years. The graph below shows the new park's effect on attendance. Adding all of the expected attendance increases over 10 years shows that the new park boosts attendance by about 4.5 million visitors. No wonder Selig and company have been so obsessed about building new ballparks.
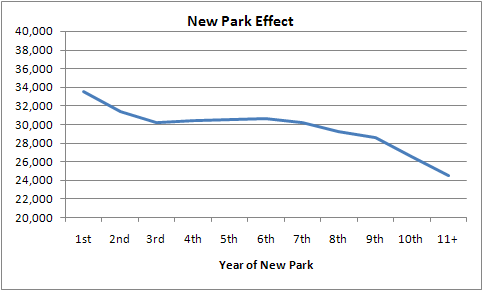
One other caveat is that the effect of the winning is diminished during the first year of a new ballpark. Fans are apt to come out to see the park no matter whether the team is good or bad, and the effect of winning (or losing) games is only about half as important as usual.
A New Team
The effect is even larger for being a new expansion team (or a team moving to a new city). A .500 expansion team can expect an increase of over 10,000 fans more than what another .500 team would expect to draw. However, the expansion effect lasts a bit shorter than the new park effect, lasting about four or five years before the novelty wears off. The chart below shows the expansion effects.
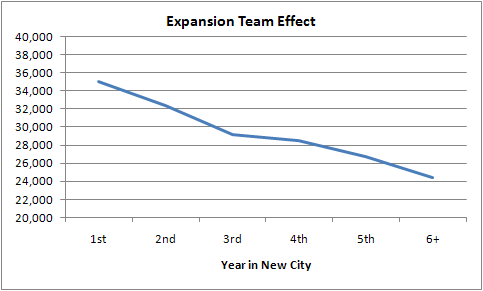
The Team Brand
Another important factor is the team "brand". The mixed model modeled the team itself as a random effect. In essence, it assumed that there may be differences between teams inherent abilities to draw fans. For instance, the Dodgers and Pirates may draw very different crowds even if the product on the field is the same. The model assumed that this core ability to draw crowds was a random, normally distributed variable. One of the tests the model performed was whether or not there really was a difference in inherent ability to draw fans between teams.
As you would expect, the model did indeed identify that this was the case. This inherent difference could be due to factors such as the team history, the city itself, the type of fans it has, the market size, and how well run the team is.
According to the model, the average team playing .500 ball, not making the playoffs, etc would draw 24,500 fans. However, some teams have an inherent ability to draw better than others. Teams that are one standard deviation better in this regard will have a "base" attendance level of 28,700. Teams two standard deviations above the norm have a base drawing level of 33,800. On the other end of the spectrum, teams one SD below the norm draw 20,700, while teams two SD's below the norm draw 17,500. As you can see this inherent difference in team brand can have a major effect on the attendance. Even when all other factors are equal, the actual team playing makes a big difference. Next week I'll be delving into specific teams and whether they are over or underperforming with regards to fan attendance.
Another team-specific factor we might be interested in is whether the effects of winning differ by team. By making team WPCT a random effect rather than a fixed effect, we can test this out. Do some fans respond to winning better than others? In Chicago, it's thought that Cubs fans come out no matter how the team is playing, while White Sox fans are more apt to support the team in proportion to its success. Do we really find this kind of varying effect of team success? The model finds no such thing. Each team's fans are about the same "fair-weatheredness", and each city responds to winning and losing in about the same way. How about when we do this same test for the "playoff" variable? Again, no effect. Each teams' fans seem to respond to making the playoffs in about the same way.
Conclusions
The conclusions have significant implications on team building strategies as well as what teams should expect at the gate. While its every team's goal to win a World Series, teams must turn a profit and keep their fans happy as well. Attendance certainly drives the bottom line and is also a key measure of fan happiness. Hopefully this model sheds some light on the what the main drivers of attendance happen to be. The full model is at the link below. If there's interest, hopefully I can publish a little calculator that can be used to predict attendance based on the key variables.
![]()
| Touching Bases | March 02, 2010 |
Stakeholders - Pittsburgh Pirates
From now through the beginning of the regular season, we will not be posting in-depth round-tables previewing each division like we have in years past. Instead we will feature brief back-and-forths with "stakeholders" from all 30 teams. A collection of bloggers, analysts, mainstream writers and senior front office personnel will join us to discuss a specific team's hopes for 2010. Some will be in-depth, some light, some analytical, some less so but they should all be fun to read and we are thrilled about the lineup of guests we have teed up. Today it's Joe P. Sheehan on the Pittsburgh Pirates.
![]() Jeremy Greenhouse: As an alumnus of Baseball Analysts, is it difficult dealing with the constant presence of fans and media?
Jeremy Greenhouse: As an alumnus of Baseball Analysts, is it difficult dealing with the constant presence of fans and media?
Joe Sheehan: No, but I get confused with the other Joe Sheehan a lot.
JG: Can you describe Neal Huntington's style as general manager, and if you'd like, you can also compare him to a character from "The Wire."
JS: I've never really seen "The Wire."
JG: I recommend it.
JS: I really don’t have anything to compare him to. He’s been very open to different ideas. I don’t work directly with him, though. It appears he listens to the different sides of an argument whether it’s what (director, baseball systems development) Dan Fox has to say or a scout. It seems as if he’s not wedded to one side or the other. I don’t want to over-state what I do, as I only have a slightly closer perspective than an outsider. I don’t want to make it sound like I know what Neal’s doing. It appears he’s doing what we would expect—using all forms of information he can get to make informed decisions. Some work out, some aren’t 100%, but that's the nature of decisions. It's very comforting to know that the process appears to be sound.
JG: Turning to baseball, I'm most interested in a Pirates' outfield that has a lot of potential. Can you talk about your expectations for all of them?
JS: Andrew McCutchen is great. Watching him last year come up from the minors without missing a beat to replace a lot of the production we were getting from Nate McLouth was exciting. He handles himself really well. His style defensively is fun to watch. He hit a couple triples that when watching the game, it’s like, "Oh my God. He hit another gear going second to third." Garrett Jones, I don’t want to say came out of nowhere, since we liked him as a minor league free agent, but I don’t think anybody expected him to do what he did this year at the start of last year. Even though he was old for a rookie, he has a shot of building on what he did last year. As for Lastings Milledge, for a long time Milledge was known with Cole Hamels for their facts, but he's coming along. I’m not really that connected with the player development side, but everything you hear since we've acquired him, the work he's put in, everything was positive. He's still on the younger side. While he hasn’t had the tremendous success at the Majors that he has at AAA, we hope that he can continue some of that minor league success going forward. Ryan Church is solid, and he'll find some at bats. And our Rule 5 pick John Raynor is going to contribute, and we've got Brian Myrow banging on the door at AAA too, depending on whether he plays first base or the outfield.
JG: I assume you still work with pitchf/x data, so what minor league pitcher do you most look forward to pitchf/xing?
JS: This year, probably Brad Lincoln because he’s the closest out of our minor leaguers. Rudy Owens is another interesting guy, but in terms of guys who are close, I’d probably say Lincoln. Rudy was in A-Ball this year, so he's further away. In the future, I'm looking forward to seeing all the high school pitchers we drafted last year.
JG: I was doing some pitchf/x work of my own and I noticed that Ryan Doumit can’t layoff pitches below his knees. He probably already knows he doesn't have the best plate discipline, but if you find something like that, will you approach the player or how does the team go about doing that? What's that process like?
JS: I haven’t interacted with any players. It’s a little tough to go to a player with very specific instructions, because it's almost like you don’t want to make them over-think things. If you tell any player that a pitcher is throwing 55% fastballs, 40% something else, 5% something else, then the right play is to wait for the fastball. But if you tell that to the player, and he doesn't get fastballs for two at bats, then he’s not going to trust you anymore. Over a huge timeline you would be right, and you’d come out ahead, but if for two at bats he’s listening to you and you get bad luck, you lose some trust and he'll think you don’t know what you’re talking about.
JG: So do you filter information through the coaching staff?
JS: That’s primarily where the interaction will take place. Dan or an advanced scout, there's something they might see, and they might communicate it to (pitching coach) Joe Kerrigan or (batting coach) Don Long. You can tell the coaching staff different stuff you can't tell players because if you're overwhelming the player, it's slowing their at bat down, and they're missing pitches. So you can talk to the coaching staff in more detail. I would think that that’s more the way the process happens.
JG: What are your and the Pirates' goals for this season?
JS: It’s to improve. It's to be better than we were last year. That's the goal for every team every year. I don’t know if there’s a number you want to say if you don’t win "x" games, you fail, and if you win "x" games you succeed. We want to get better. We want to improve our depth at the minor league level and get better at the major league level. I want to get better at my job. Everyone wants to get better at their jobs. If we do that for a good stretch of the season, the talent, wins and results will come.
Joe P. Sheehan is the Baseball Operations Data Analyst for the Pittsburgh Pirates. Before that, he wrote the Command Post column for Baseball Analysts.