Rich Lederer • Baseball Beat
Patrick Sullivan • Change-Up
Jeremy Greenhouse • Touching Bases
Dave Allen • F/X Visualizations
Sky Andrecheck • Behind the Scoreboard
Marc Hulet • Around the Minors
Al Doyle • Past Times
Retired Uniforms:
Bryan Smith • WTNY
Joe Sheehan • Command Post
Jeff Albert • The Batter's Eye
RSS Feed
Home
*Examining the Past, Present, and Future*
Lineup Card
Recent Entries
» Putting Together a Reality Team
» Historical Hall of Fame Vote Comparisons: 2012
» An All-Christmas Team
» The New-Look Angels
» John Denny: The Forgotten Cy Young Award Winner
» Money Isn't Everything
» What Would It Take to Hit .400 in the 21st Century?
» Halos Heaven
» Brandon McCarthy's Breakout Season
» Link-o-Rama
» Historical Hall of Fame Vote Comparisons: 2012
» An All-Christmas Team
» The New-Look Angels
» John Denny: The Forgotten Cy Young Award Winner
» Money Isn't Everything
» What Would It Take to Hit .400 in the 21st Century?
» Halos Heaven
» Brandon McCarthy's Breakout Season
» Link-o-Rama
Best of Baseball Beat
Abstracts From the Abstracts
1977 Baseball Abstract
1978 Baseball Abstract
1979 Baseball Abstract
1980 Baseball Abstract
1981 Baseball Abstract
1982 Baseball Abstract
1983 Baseball Abstract
1984 Baseball Abstract
1985 Baseball Abstract
1986 Baseball Abstract
1987 Baseball Abstract
1988 Baseball Abstract
1978 Baseball Abstract
1979 Baseball Abstract
1980 Baseball Abstract
1981 Baseball Abstract
1982 Baseball Abstract
1983 Baseball Abstract
1984 Baseball Abstract
1985 Baseball Abstract
1986 Baseball Abstract
1987 Baseball Abstract
1988 Baseball Abstract
Bert Blyleven Series
Meeting Up and Hanging Out with Bert
The Results Are In And...
Aficionado Heavily Invested in Blyleven
Latest on Blyleven's Chances for the HOF
The Internet Zealot Responds
400 Down and 5 to Go...
Bert Be Home By Eleven?
Blyleven's Forgotten Season (1973)
HeyMan, Your Comments Don't Hold Water
The Waiting is the Hardest Part
Another Addition to the Blyleven Series
Search for the Truth
As Dominant as His HOF Contemporaries
Listen, Buster
A Larger Step for Blyleven
Answering the Naysayers (Part Two)
Another Small Step for Blyleven
Q&A: Blyleven on the Twins
The Majority Rules, Right?
It's All Dutch to Some
The Hall of Fame Case for Bert Blyleven
Q&A: Blyleven on Felix Hernandez
Clemens Rocketing Up Charts
Poz: An Interview With a KC Star
A HOF Chat with Tracy Ringolsby
Up Close and Personal
A Peek Into the Mind of a HOF Voter
Answering the Naysayers
It's That Time of the Year (Again)
"If Cooperstown is Calling..."
The Bert Alert
One Small Step for Blyleven...
Only the Lonely
Exclusive Interviews
Lee Sinins
Alex Belth
David Pinto
Will Carroll
Mike Carminati
Aaron Gleeman
Joe Sheehan
Jay Jaffe
Jeff Peek
Tracy Ringolsby
Joe Posnanski
Bill James Part I, II, III
Jon Lalonde
Chuck Tiffany
Dayn Perry
Fay Vincent
Nate Silver
Alex Belth
David Pinto
Will Carroll
Mike Carminati
Aaron Gleeman
Joe Sheehan
Jay Jaffe
Jeff Peek
Tracy Ringolsby
Joe Posnanski
Bill James Part I, II, III
Jon Lalonde
Chuck Tiffany
Dayn Perry
Fay Vincent
Nate Silver
Bullpen
Rich Lederer
The Odd Couple (with Alex Belth)
The MostUnder Over Underrated Player in Baseball (with Brian Gunn)
Three Wise Men (roundtable by Alex Belth)
Infrequently Asked Questions (interview with Matt Welch)
Interview (Orioles Think Tank)
Bernie and the Yanks (Bronx Banter)
Hope and Faith: How the LAA Win the World Series (Baseball Prospectus)
NL West (The Soul of Baseball)
Greatest Living Hitter? (Sports Illustrated)
Roundtable: 2008 HOF Ballot (Armchair GM)
The Most
Three Wise Men (roundtable by Alex Belth)
Infrequently Asked Questions (interview with Matt Welch)
Interview (Orioles Think Tank)
Bernie and the Yanks (Bronx Banter)
Hope and Faith: How the LAA Win the World Series (Baseball Prospectus)
NL West (The Soul of Baseball)
Greatest Living Hitter? (Sports Illustrated)
Roundtable: 2008 HOF Ballot (Armchair GM)
Patrick Sullivan
Designated Hitters
David Bromberg (Q&A: John Denny)
Mark Armour (H. Killebrew and Versatility)
Joe Lederer (Soundtrack of a Prospect)
David Bromberg (Clemente's Autograph)
David Bromberg (Woody Fryman)
D. Baumstein (WAR Against Age: Pitchers)
Doug Baumstein (The WAR Against Age)
Doug Baumstein (A Lifetime on the Road)
John Fraser (Pick Six)
Mark Armour (How to Score More Runs?)
Bill Parker (What Opening Day Tells Us)
Stan Opdyke (Pat Rispole)
Chris Jaffe (Evaluating Baseball's Mgrs)
Stan Opdyke (Baseball Radio in NYC, 1953)
A. Nathan (Performance of Baseball Bats)
Michael Weddell (Edgar Martinez/HOF)
Jon Weisman (100 Things Dodgers Fans...)
Stan Opdyke (Connie Mack and Vin Scully)
Eric Walker (Evaluating Run Production)
Brent Mayne (The Intangibles of Catching)
Chris Moore (Best Fastballs in Baseball)
Dave Baldwin (The Batter’s Brain)
Shawn Haviland (Ivy League to MLB)
Larry Granillo (Walking Off)
Rob Iracane (Solo HR Won't Break You)
Tommy Bennett (Charm of AM Radio)
Harry Pavlidis (Johan Santana's Fast Start)
John Walsh (WAR and Remembrance)
Eric Walker (Precisely Inaccurate)
Bob Timmermann (As They See 'Em)
Geoff Young (Unicycles and Delusions)
Baseball Analysis at Tufts (Groundballers)
Baseball Analysis at Tufts (GB Out Rates)
G. Rybarczyk ('09 Hit Tracker Projections)
Joe Lederer (Curt Schilling/HoF)
Conor Gallagher (Hall of Fallacies)
Chris Green (Jim Rice, HoF, the Numbers)
Shawn Hoffman (Baseball's Bear Mkt?)
Paul Anthony (Manny Syndrome)
Ross Roley (World Series Odds)
B. Timmermann (Catcher's Interference)
R.J. Anderson (Waiting the Hardest Part)
Maury Brown (Cubs, MLB, and Cuban...)
Myron Logan (Dee-Fense, Dee-Fense)
Craig Calcaterra (Frivolity, Part I, Part II)
Chad Finn (Ode to Baseball Cards)
David Cameron (Mariners Foibles)
Chris Dial (Chipper Jones)
Pat Lederer (Memory Lane)
David Appelman (Clutch Pitching)
Bob Rittner (DH)
Jonathan Mayo (Roger Clemens)
Lisa Winston (My Son-in-Law...)
Russ McQueen (The Yellow Hammer)
Bob Rittner (I'm OK, You're OK)
Mark Armour (In Defense of the HOF)
Pat Jordan (Friends)
Dan Levitt (Analysis of Terry Ryan)
Doug Baumstein (Trading Econ 101)
Ross Roley (Runner's Reluctance II)
Ross Roley (Runner's Reluctance I)
Mark Armour (No-Longer Lovable Sox)
Bruce Regal (Stealthy and Wise)
Brian Gunn (Roid Monster)
Current/McEvoy (Value of the SB)
John Rickert (Sinister Thefts)
Nate Silver (Sabermetrics)
David Vincent (Home Run Production)
Joe P. Sheehan (Enhanced Gameday II)
Mark Armour (An Ode to Sport)
David Gassko (All-Time Worm Burners)
Joe P. Sheehan (Enhanced Gameday)
John Walsh (When Titans Clash)
Fox/Williams (Quantifying Coaches II)
Fox/Williams (Quantifying Coaches I)
Jacob Luft (Bull Durham Rant)
Chad Finn (Strat-O-Matic)
Lisa Winston (Rotisserie Baseball)
Dave Studeman (Baseball Stats)
Steve Treder (Roger Craig)
Marc Normandin (Jeff Bagwell)
D. Appelman (Expanding Strike Zone)
Jeff Sackmann (Worst MiL Defenders)
Jeff Sackmann (Best MiL Defenders)
Maxwell Kates (Van Lingle Mungo)
David Appelman (Pitch Location)
Kent Bonham (Danny Ray Herrera)
Glenn Stout (Two Baseball Poems)
Bruce Regal (The Challenge Round)
Mark Lamster (Barry & Ty)
Geoff Young (NL West)
Tom Lederer (The Ryan Express)
Brian Erts (Great Leap Forward)
David Pinto (Parity and the N.L.)
Jacob Luft (Fathers and Daughters)
Jamey Newberg (Pete's Sake)
Jeff Albert (A. Jones Swing Analysis)
Jeff Albert (A-Rod Swing Analysis)
Keith Law (Death, Taxes, and Waivers)
Peter Abraham (Tales of Torre Tales)
Larry Borowsky (Let 'er Rip II)
Dan Levitt (Empirical Analysis of Bunting)
Jonah Keri (If I Met Warren Cromartie...)
Bob Klapisch (War Stories)
Bob Timmermann (John F. Kennedy HS)
Kent Bonham (Aluminum Adjustments)
Al Doyle (More Than Superstars)
Ross Roley (Instant Replay)
David Vincent (Barry Bonds Homers)
Chad Finn (Our Favorite Obscurities)
Bill Deane (1979 NL MVP)
Mark Armour (Rise/Fall of Artificial Turf)
Jeff Angus (Wally Moon Camp)
David Berri (Money and Baseball)
Larry Borowsky (Baseball w/o the #s)
Derek Zumsteg (The Irrational Market)
David Regan (Free Agent Contracts)
Peter Schmuck (Steroids and the HOF)
David Appelman (Pitchers, Pitch by Pitch)
Dan Fox (Swinging, Taking, Fouling, Etc)
Patrick Sullivan (Study of NYY CF/BOS LF)
Will Leitch (Baseball Journalism)
Jeff Sullivan (Pitcher Release Points)
Steve Treder ('69-'70 Giants)
Maury Brown (Charlie Finley)
John Brattain (Bob Johnson)
Bob Klapisch (The Case for Bert Blyleven)
Jeff Peek (Pride and Prejudice)
Dayn Perry (Bert and Warren)
Rob Neyer (If Don Sutton Was Great...)
Lisa Winston (Minor League Memories)
Alex Belth (Otis Redding Was Right)
David Cameron (Long Live the King)
Jeff Angus (Baserunning Study)
Bert Blyleven (Baseball Playoffs)
Boyd Nation (Not a Prospect List)
James Click (Batters-Baserunners Study)
Jeff Shaw (Why I Love Baseball)
David Gassko (BIP/BFP Fielding Study)
Jay Jaffe (Milwaukee Sausage Race)
Jamey Newberg (Remember When)
Bob Klapisch (Press Box to the Mound)
Dan Levitt (Predictive Value of BB)
David Vincent (Official Scorer)
Jon Weisman (Rick Monday)
Larry Borowsky (Let 'er Rip)
Will Carroll (Fictional Short Story)
Bob Timmermann (Japanese Baseball)
Cyril Morong (Best Pitching Seasons)
Sean Forman (Monte Carlo Win-Loss)
Brian Gunn (My Little Blue Book)
Joe Lederer (My Dad and Baseball)
Bill Deane (Bob Gibson, 1968)
Mark Armour (1977 Yankees)
Darren Viola (Retrosheet)
David Pinto (RFK)
Dayn Perry (Brave Heart)
Matt Welch (Dave Hansen)
Kevin Kernan (Jack McKeon)
Tom Lederer (Dodgers Road Trip)
Steve Lombardi (Slider)
Studes (Picturing Baseball)
Mike Carminati (Luck of the Drawl)
Eric Neel (Vin Scully)
J.C. Bradbury (Leo Mazzone)
John Sickels (Bill James)
Search Baseball Analysts
Archives
By Category:
Around the Majors Content Only
Around the Minors Content Only
Baseball Beat Content Only
Baseball Beat/Change-Up Content Only
Baseball Beat/WTNY Content Only
Behind the Scoreboard Content Only
Change-Up Content Only
Change-Up/Around the Majors Content Only
Command Post Content Only
Crunching the Numbers Content Only
Designated Hitter Content Only
F/X Visualizations Content Only
Past Times Content Only
Saber Talk Content Only
The Batter's Eye Content Only
Touching Bases Content Only
Weekend Blog Content Only
WTNY Content Only
By Month:
February 2012
January 2012
December 2011
October 2011
September 2011
August 2011
July 2011
June 2011
May 2011
April 2011
March 2011
February 2011
January 2011
December 2010
November 2010
October 2010
September 2010
August 2010
July 2010
June 2010
May 2010
April 2010
March 2010
February 2010
January 2010
December 2009
November 2009
October 2009
September 2009
August 2009
July 2009
June 2009
May 2009
April 2009
March 2009
February 2009
January 2009
December 2008
November 2008
October 2008
September 2008
August 2008
July 2008
June 2008
May 2008
April 2008
March 2008
February 2008
January 2008
December 2007
November 2007
October 2007
September 2007
August 2007
July 2007
June 2007
May 2007
April 2007
March 2007
February 2007
January 2007
December 2006
November 2006
October 2006
September 2006
August 2006
July 2006
June 2006
May 2006
April 2006
March 2006
February 2006
January 2006
December 2005
November 2005
October 2005
September 2005
August 2005
July 2005
June 2005
May 2005
April 2005
March 2005
February 2005
January 2005
December 2004
November 2004
October 2004
September 2004
August 2004
July 2004
June 2004
May 2004
April 2004
March 2004
February 2004
January 2004
December 2003
November 2003
October 2003
September 2003
August 2003
July 2003
June 2003
Reference
Organizational Stats
Arizona Diamondbacks Bat / Pitch
Atlanta Braves Bat / Pitch
Baltimore Orioles Bat / Pitch
Boston Red Sox Bat / Pitch
Chicago Cubs Bat / Pitch
Chicago White Sox Bat / Pitch
Cincinnati Reds Bat / Pitch
Cleveland Indians Bat / Pitch
Colorado Rockies Bat / Pitch
Detroit Tigers Bat / Pitch
Florida Marlins Bat / Pitch
Houston Astros Bat / Pitch
Kansas City Royals Bat / Pitch
Los Angeles Angels Bat / Pitch
Los Angeles Dodgers Bat / Pitch
Milwaukee Brewers Bat / Pitch
Minnesota Twins Bat / Pitch
New York Mets Bat / Pitch
New York Yankees Bat / Pitch
Oakland Athletics Bat / Pitch
Philadelphia Phillies Bat / Pitch
Pittsburgh Pirates Bat / Pitch
St. Louis Cardinals Bat / Pitch
San Diego Padres Bat / Pitch
San Francisco Giants Bat / Pitch
Seattle Mariners Bat / Pitch
Tampa Bay Devil Rays Bat / Pitch
Texas Rangers Bat / Pitch
Toronto Blue Jays Bat / Pitch
Washington Nationals Bat / Pitch
All-Star Links
Official Websites
News and Notes
Baseball News Blog
Baseball Newstand
ESPN Baseball
Fox Sports Baseball
Pro Sports Daily
Roto World
The Roto Times
USA Today Baseball
Baseball Newstand
ESPN Baseball
Fox Sports Baseball
Pro Sports Daily
Roto World
The Roto Times
USA Today Baseball
Reference and Analysis
Baseball Almanac
Baseball America
Baseball Archive
Baseball Contracts
Baseball Cube
Baseball Graphs
Baseball Library
Baseball Musings Player Database
Baseball Page
Baseball Primer
Baseball Prospectus
Baseball Reference
Baseball Statistics
Baseball Truth
Boxscore Central
Diamond Mind Baseball
Doug's Stats
FanGraphs
Fast Balls (pitchfx catalog)
Hardball Dollars
Hardball Times
Hit Tracker
Retrosheet
Rotobase/Rotoblog
Stat Corner
STATS
Tango on Baseball
Yahoo Sports MLB
Web Gems
Bill James Primer
Sabermetric Manifesto (Grabiner)
Pitching and Defense (McCracken)
Pitching and Defense (Tippett)
Transactions Primer (Neyer)
Baseball Stats (Batter's Box)
Prospect Report (Cameron)
Pitcher Workloads (Sheehan)
Goodbye to Old Baseball Ideas (Rickey)
Sabermetric Manifesto (Grabiner)
Pitching and Defense (McCracken)
Pitching and Defense (Tippett)
Transactions Primer (Neyer)
Baseball Stats (Batter's Box)
Prospect Report (Cameron)
Pitcher Workloads (Sheehan)
Goodbye to Old Baseball Ideas (Rickey)
Columnists
Baseball Blogs
Around the Majors
Athletics Nation
Baseball Crank
Baseball Musings
Baseball-Reference Blog
Batter's Box
Big League Stew
Bronx Banter
Catfish Stew
Cub Town
Dan Agonistes
Dodger Thoughts
DRays Bay
Ducksnorts
Futility Infielder
Halos Heaven
Inside the Rockies
It Might Be Dangerous
Knuckle Curve
LoHud Yankees Blog
Lookout Landing
Management by Baseball
Metaforian
Metsgeek
Mike's Baseball Rants
Only Baseball Matters
Redbird Nation
Red Reporter
Sabernomics (Braves)
Seth Speaks
ShysterBall
6-4-2 (Angels/Dodgers)
The Book
TheCubdom
The Cutting Edge
The House That Dewey Built
The View From The Bleachers
Tiger Blog
U.S.S. Mariner
Viva El Birdos
Where's Kernan
Minor Leagues
Arizona Fall League
BA Player Finder
Cal Leaguers
Jamey Newberg
JDM's Scoresheet Baseball
Minor League Baseball
Minor League Park Factors
Minor League Splits
No Pepper
Sickels' Minor League Ball
Warm October Nights
BA Player Finder
Cal Leaguers
Jamey Newberg
JDM's Scoresheet Baseball
Minor League Baseball
Minor League Park Factors
Minor League Splits
No Pepper
Sickels' Minor League Ball
Warm October Nights
Amateur
Boyd's World (College)
Cape Cod Baseball League
College Baseball Blog
College Baseball Insider
Collegiate Baseball Newspaper
College Splits
College Splits Blog
Dirtbags Baseball (Long Beach State)
NCAA Baseball
NCBWA
Team One Baseball (High School)
Texas A&M & Baseball
Cape Cod Baseball League
College Baseball Blog
College Baseball Insider
Collegiate Baseball Newspaper
College Splits
College Splits Blog
Dirtbags Baseball (Long Beach State)
NCAA Baseball
NCBWA
Team One Baseball (High School)
Texas A&M & Baseball
Historical
Cuban Baseball
House of David
Jim "Mudcat" Grant's Web Page
Negro League Baseball Players Assoc
Negro Leagues Baseball Museum
1919 Black Sox
Pacific Coast League
Philadelphia Athletics Historical Society
Shoeless Joe Jackson Society
SABR-L Archives
Walter O'Malley
House of David
Jim "Mudcat" Grant's Web Page
Negro League Baseball Players Assoc
Negro Leagues Baseball Museum
1919 Black Sox
Pacific Coast League
Philadelphia Athletics Historical Society
Shoeless Joe Jackson Society
SABR-L Archives
Walter O'Malley
Miscellaneous
Forums
Credits
Ticket Center
Tickets to Baseball -
Premium Red Sox Tickets - Tickets to Marlins Games - Cardinals Game Tickets - NY Yankee Tickets - Tickets Oakland Athletics - Dallas Cowboys Tickets - Arizona Cardinals Tickets - Tickets Seattle Seahawks - Buffalo Bills Tickets Online - Tickets to Dolphins Football
Buy Boston Red Sox tickets,
Philadelphia Phillies tix,
NY Yankees tickets,
NY Mets tickets, and
MLB All Star game tickets at ABC tickets
Not sure where to find the best online sportsbooks? Start your search with PlayersJet.
Get deals at SportsMemorabilia.com on baseball apparel, including Phillies jerseys and more for adults and children.
Shop the largest selection baseball equipment on sale at Sports Unlimited. Check out tons of baseball gloves, youth baseball gloves and catchers gear from Rawlings, Wilson, Nike & Under Armour.
2011 Draft Order
Courtesy of Baseball America
First-Round:
 1. Pirates (57-105)
 2. Mariners (61-101)
 3. Diamondbacks (65-97)
 4. Orioles (66-96)
 5. Royals (67-95)
 6. Nationals (69-93)
 7. Diamondbacks (for B. Loux)
 8. Indians (69-93)
 9. Cubs (75-87)
10. Padres (for Karsten Whitson)
11. Astros (76-86)
12. Brewers (77-85)
13. Mets (79-83)
14. Marlins (80-82)
15. Brewers (for Dylan Covey)
16. Dodgers (80-82)
17. Angels (80-82)
18. Athletics (81-81)
19. Red Sox (from DET for Martinez)
20. Rockies (83-79)
21. Blue Jays (85-77)
22. Cardinals (86-76)
23. Nationals (from CWS for Dunn)
24. Rays (from BOS for Crawford)
25. Padres (90-72)
26. Red Sox (from TEX for Beltre)
27. Reds (91-71)
28. Braves (91-71)
29. Giants (92-70)
30. Twins (94-68)
31. Rays (from NYY for Soriano)
32. Rays (96-66)
33. Rangers (from PHI for Lee)
Supplemental First Round:
34. Nationals (Dunn)
35. Blue Jays (Downs)
36. Red Sox (Martinez)
37. Rangers (Lee)
38. Rays (Crawford)
39. Phillies (Werth)
40. Red Sox (Beltre)
41. Rays (Soriano)
42. Rays (Balfour)
43. Diamondbacks (LaRoche)
44. Mets (Feliciano)
45. Rockies (Dotel)
46. Blue Jays (Buck)
47. White Sox (Putz)
48. Padres (Garland)
49. Giants (Uribe)
50. Twins (Hudson)
51. Yankees (Vazquez)
52. Rays (Benoit)
53. Blue Jays (Olivo)
54. Padres (Torrealba)
55. Twins (Crain)
56. Rays (Choate)
57. Blue Jays (Gregg)
58. Padres (Correia)
59. Rays (Hawpe)
| Touching Bases | December 31, 2009 |
Pitch Counts and Pitchf/x
I remember Randy Johnson throwing 99 to finish a complete game. Back in their day, Nolan Ryan and Bob Feller probably did that on a regular basis (if you were to ask them). There's a lengthy list of early 20th century pitchers who pitched complete games in both ends of a doubleheader. So what's the driving force behind the pitch count craze? Are we going soft?
I don't think there's some grand scheme to baby pitchers. I do think that pitchers nowadays exert exponentially more effort on each pitch than pitchers of yesteryear, but our contemporaries could still probably hold up past the hundred pitch mark. The main reason pitchers get pulled before they reach their limit is because there's little incentive not to pull them. Take a look at baseball reference's splits. Pitchers allow a .726 OPS the first time through the order, then the OPS jumps 40 points the next time through and another 40 points after that. So managers make the correct decision to insert a reliever who has the advantage of facing batters for the first time. With eight-man bullpens, there's no reason not to go to a reliever early. So the question becomes not if, in the current environment, we should continue to adhere to pitch counts, but why? Does the pitcher lose effectiveness, or does the batter adjust to even the fastest of fastballs having already seen in in his three previous plate appearances?
With pitchf/x data, you can tease out the pitcher's part in the pitcher/batter matchup. A pitcher really controls five things:
-Where the ball is released
-Where the ball lands
-How hard the ball is thrown
-How much the ball spins
-What direction the ball spins
Here, I will concern myself with the final three components, which I believe define what we call a pitcher's "stuff." For example, the average fastball from a right-handed pitcher (92 MPH, nine inches of rise, seven inches of run) is worth about half a run below average per 100 pitches. I will call that its StuffRV. The following graph demonstrates the average StuffRV (per 100) and a smoothed out actual run value (per 100).
There's a lot going on here.
-Our main concern is with a pitcher's endurance with regards to his stuff. The takeaway from this graph, then, is that from a pitcher's 10th pitch to his 60th pitch, his stuff will deteriorate by about a 10th of a run per 100 pitches.
-My methodology grades out fastballs as inferior to breaking balls. You can tell by looking at the very first mark on the graph. A pitcher's first pitch of the day is a fastball about 80% of the time, while in total, pitchers throw fastballs 60% of the time. On an 0-0 count otherwise, pitchers throw fastballs just under three quarters of the time. Same as on pitches two through ten: 70-75%. For some reason, pitchers like to start their outings off with a fastball.
-A pitcher's success is, of course, largely dependent on the batter, and you can see when each lineup spot tends to hit by following the true run value curve. Pitchers face the eighth and ninth batters in the order generally during their 25th to 35th pitches and again their 60th to 70th pitches. The two peaks of the True RV line occur when starting pitchers are generally facing the 4th and 5th batters in the lineup.
-Relievers have better stuff than starters. The section from 1-15 pitches is composed mostly of relievers, and that's the lowest trough in the StuffRV curve.
-Those pitchers who managers leave in past the 100-pitch mark are well above average, and their stuff continues to be above average. I'll account for this survivor bias another time. For now, I'd rather do brief case studies of one pitcher who maintains his stuff throughout the game, and another who does not.
I correlated every pitcher's pitch count with his StuffRV on that pitch. Brett Anderson seems to pick up steam the deeper he goes into a game. I classified his pitches into four clusters: fastball, slider. changeup, curveball So the first thing I did was look to see trends in his velocity and movement. Well, nothing really stood out. His slider gains almost an inch in movement by the end of the game, but I don't think that's it. Then I remembered that Anderson's slider was the most valuable slider in baseball last year, and it edges out Zack Greinke's as the *nastiest* starter's slider in baseball by my rankings.
| Pitches | FB | SL | CH | CU |
|---|---|---|---|---|
| 1-25 | 67% | 23% | 6% | 4% |
| 26-50 | 51% | 28% | 14% | 8% |
| 51-75 | 43% | 31% | 12% | 14% |
| 75+ | 39% | 38% | 11% | 12% |
So there you go. He challenges hitters with fastballs the first time through the lineup and then switches to mainly off-speed pitches, which are his bread and butter. Hence, you might say, he improves his stuff as the game goes on.
Jered Weaver, on the other hand, has worse stuff by my calculation as the game goes on. Weaver throws his fastball 68% of the time in his first 25 pitches, compared to 52% from his 51st pitch on, and in exchange his changeup usage increases from 10% to 23%. Not only is there a difference in Weaver's pitch selection, but there's also a notable change in his pitch quality. Here are the characteristics of his fastball as the game goes on:
| Pitches | Velocity | StuffRV | True RV |
|---|---|---|---|
| 1-25 | 90.0 | -0.19 | -0.29 |
| 26-50 | 89.7 | -0.13 | 0.06 |
| 51-75 | 89.2 | -0.10 | 0.63 |
| 75 | 89.0 | -0.07 | 0.16 |
But pitchers who have a changeup as good as Weaver's don't rely on stuff to get by. Weaver's all about deception. And that stuff I don't know how to measure.
| Change-Up | December 30, 2009 |
J.D. Drew, Bargain
Engage a J.D. Drew detractor, try and dissuade him, try and convince him Drew might be a good player, and the conversation will go something like this:
Supporter: J.D. Drew is very good at baseball.
Detractor: Drew is hurt all the time, doesn’t hit many home runs and doesn’t drive anybody in. What am I missing?
Supporter: Well, you’re missing that he is on base all the time, that he hits with quite a bit of power and that given the type of player he is, one that puts the ball in play more seldom than most, he’s bound to have smallish RBI totals. Also, he plays great defense.
Detractor: Fine, fine. Maybe it’s his demeanor that gets me. But you have to admit, he’s overpaid.
And it’s right about there that the legions of Drew supporters – and they’re out there – lose their energy. It seems we have arrived at a place on Drew where fans who think he’s not a very good player have come around on that front while the olive branch from the pro-J.D. side is to concede that Drew may be overpaid. To get a good sense for the mindset of the Drew detractor, check out this August piece from Bleacher Report. Keep in mind that Bleacher Report is all bloggy and of the intertubes and forward thinking and part of the future. Drew hate is not limited to the broadsheets and tabloids. Here’s a little taste:
The Red Sox are probably wishing that Victor Martinez was a right fielder so they could sit Drew and his $14 million salary for the rest of the season.Instead the Red Sox will keep trotting Drew out to right field while Martinez will have to check the lineup everyday to see if he is catching, playing first base, DHing or sitting on the bench.
The Red Sox front office is probably counting the days till Drew’s contract ends in 2011. Until then they are liable for the $28 million they still owe Drew.
Drew and Boras are probably laughing all the way to the bank thinking of how they duped the Red Sox into thinking Drew would actually earn the money they are paying him.
This is nothing new, either. Here is something called JT the Brick responding to news of Drew’s signing in Boston:
Christmas has come early to every member of the Boston sports media as J.D. Drew has agreed to a new five-year, $70 million contract. There is no doubt in my mind that Drew will eventually get run out of Beantown by the Red Sox fans and several members of the media after they figure out what he is all about.Drew comes to Boston as one of the most hated players in the modern history of the game and with a reputation as a player who always gets hurt and rarely smiles.
Boston sports media institution Bob Ryan wasted no time, saying to Theo Epstein on a conference call announcing the Drew acquisition, "“On behalf of an eager constituency, let’s hope the rumor is not true" before Epstein could even speak. Boston Dirt Dogs, in one of its characteristically bland posts lacking any sort of wit or creativity, described Drew's role this way:
Media Gathers In Anticipation of Press Conference to Introduce the Man Who Would Replace Trot Nixon at Five Times the Salary
Oh, how Steve Silva loves him some Trot Nixon. Anyway, you see the point. Many do not like J.D. Drew. Those who concede he might be decent at baseball will complain of his injuries or how much money he makes. That he's hit .276/.390/.485 since joining the Red Sox, or that he's a terrific defensive player, are no matter.
I imagine those reading this are familiar with the Fangraphs practice of assigning a dollar value to each Win Above Replacement (WAR). Baseball Analysts’ Sky Andrecheck has his own methodology as well. Dave Cameron at Fangraphs has already addressed the question of whether or not Drew is overpaid (he's not). This piece will not set out to determine whether or not Drew was worth the money per se – that discussion is subject to countless variables which are specific to individual team needs and budgets, and even how one assigns a dollar value to a player's performance.
Instead, we will just have a look at how his performance has stacked up against the other free agents in his class. After all, given the CBA, there is no sense in comparing Drew to a pre-arb player like Matt Kemp or guys who have never been unrestricted like Matt Holliday or Albert Pujols. By the same token, it’s not fair to evaluate Boston’s choice to ink Drew to a 5-year, $70M contract by pointing out cheaper players that might have put up comparable value. Unrestricted free agents are paid differently, and we should evaluate Drew vis-a-vis this peer group in determining to what extent he has “earned” his money. The Red Sox needed an outfielder heading into the 2007 season, had nobody they felt could fill the role internally and did not wish to make a trade. They turned to the free agent market.
So let’s see how Drew compares to his 2006-2007 free agent class. Then we can assess whether the Red Sox made a good decision, and if Drew has held up his end of the bargain. We will start first with a look at every free agent that signed a contract for a total value of more than $9.5 million in the off-season preceding the 2007 campaign. For Kei Igawa and Daisuke Matsuzaka, I have included posting fees in their respective total contract values. "Duration" is in years and "Total $" in millions of dollars.
Player	        POS    Duration	  Total $ Value
Soriano, A.	OF	  8	       136
Zito, B.	SP	  7            126
Matsuzaka, D.	SP	  6	       103.1
Lee, C. 	OF        6            100
Ramirez, A.	3B	  5	        75
Drew, J.D.	OF        5     	70
Meche, Gil	SP        5     	55
Matthews, Jr.	OF	  5     	50
Schmidt, J.	SP        3	        47
Igawa, K.	SP	  5	        46
Pierre, J.	OF        5      	44
Suppan, J.	SP	  4	        42
Lilly, T.	SP	  4	        40
Lugo, J.	SS	  4	        36
Padilla, V.	SP	  3	        33.75
Batista, M.	SP        3	        25
Eaton, A.	SP	  3	        24.5
Mussina, M.	SP	  2	        23
Marquis, J.	SP	  3             21
Huff, A.	1B        3     	20
Edmonds, J. 	OF        2             19
Baez, D.        RP        3             19
Garciaparra, N.	1B	  2	        18.5
Thomas, F.	DH	  2	        18.12
Roberts. D.	OF        3	        18
Speier, J.	RP        4	        18
Molina, B.	C	  3	        16
Pettitte, A.	SP	  1	        16
Bonds, B.	OF        1	        15.8
Gonzalez, Alex	SS	  3	        14
Durham Ray	2B        2             14
DeRosa, Mark	3B        3	        13
Catalanotto, F.	OF	  3	        13
Mulder, Mark	SP	  2	        13
Williams, W.	SP	  2	        12.5
Hernandez, O.	SP        2	        12
Walker, J.	RP	  3	        12
Dellucci, D.	OF	  3	        11.5
Schoenweis, S.	RP        3             10.8
Bradford, C.	RP	  3	        10.5
Glavine, T.	SP	  1	        10.5
Maddux, G.	SP        1	        10
Kennedy, A.	2B	  3	        10
Payton, J.	OF	  2	         9.5
Prior to the 2007 season, Drew signed the 6th richest free agent contract as reflected by total value over the life of the deal. Bob Ryan was aghast. I recall LA Times columnist T.J. Simers booked solid for a full week on Boston sports radio to rail against Drew.
I want to frame Drew's relative value as clearly as I can here, so I will next present a list of players who have provided negative or no value at all - replacement level value or worse - over the life of their respective deals signed. Let's try and contextualize the term overpaid as it relates to Major League Baseball players for folks like JT the Brick. We will use Fangraphs' Wins Above Replacement to measure on-field contribution.
Player     POS  Duration  Total $   WAR since '07
Schoenweis  RP	   3	   10.8	        -1.5
Dellucci    OF	   3	   11.5	        -1.5
Matthews    OF	   5	    50	        -1.1
Walker      RP	   3        12	        -0.6
Baez        RP	   3	    19	        -0.5
Mulder      SP	   2	    13	        -0.4
Igawa       SP	   5	    46	        -0.2
Speier      RP	   4	    18	        -0.2
Garciaparra 1B	   2	   18.5	        -0.2
Williams    SP	   2	   12.5	        -0.1
Roberts     OF	   3	    18	        -0.1
Catalanotto OF	   3	    13	        -0.1
Schmidt     SP	   3	    47  	 0
Eaton  	    SP	   3	   24.5          0
That's $313.8 million (!) paid out to players that have provided less value than your typical AAAA Minor League veteran kicking around just about any organization. You see that list right above this paragraph? THOSE guys are overpaid. Prior to the 2007 season, Ned Colletti saw fit to guarantee Nomar Garciaparra $18.5 million, in part to replace the offense J.D. Drew had provided. The Nomar deal was a masterstroke in comparison to his signing of Jason Schmidt. The Dodgers had decided they did not want to try and re-sign Drew once he decided he wanted to exercise his opt-out. Said Colletti:
"He wants out, he can have out. He's moving on, we're moving on. We'll find players who like playing here. If he doesn't want to be here, he has the right to leave, and he's exercising that right."
But Drew didn't necessarily want to leave Los Angeles. He just wanted more guaranteed money, and had every right to exercise the option in his contract. Here's Drew's agent, Scott Boras from the same ESPN article:
"J.D. was very happy in Los Angeles. He liked the players. He liked the team. & He's not opposed to going back," Boras said. "We let the Dodgers know we're interested in returning and discussing a new contract. Obviously, it was something we had to do in free agency."
Losing J.D. Drew is the best thing to happen to the Dodgers since they lost Milton Bradley...They can take the $33 million that he just dropped in their pockets -- $11 million annually -- and use it to get stronger and tougher and better.
So instead of entertaining re-signing Drew, how did the Dodgers address their roster prior to the 2007 campaign? They dished out $109.5 million to Nomar, Schmidt and Juan Pierre, three players who contributed a combined 3.4 wins in three seasons. You don't need to be Tom Tango or Sky Andrecheck to figure out that $32 million per win is not great value.
Ok, so we know there were a bunch of atrocious contracts handed out in the 2006-2007 off-season, by the Dodgers and plenty of other teams, so right off the bat we know Drew is going to be looking better than those that provided negative or no value. Well what if we set aside money for a moment and just try and assess who the best players of that class have been since the beginning of the 2007 season?
Player     POS  Duration  Total $   WAR since '07
Ramirez     3B	   5	    75	        12.3
Meche       SP     5        55          10.9
Drew        OF     5        70          10.3
Lilly       SP     4        40          10.0
Mussina     SP     2        23           8.2
DeRosa      IF     3        13           8.1
Soriano     OF     8       136           8.0
Matsuzaka   SP     6       103           7.7
Marquis     SP     2        21           7.3
If WAR is to be believed, J.D. Drew has been the third most productive player of his class since 2007, just behind Gil Meche and a ways behind Aramis Ramirez, who is just a terrific baseball player. Since we know he signed the sixth largest contract that off-season, checking in as the third most productive player suggests Drew has offered the Red Sox considerable value. To distill his peer group even further, how about we look at other outfielders, this time with a cost per win calculation included.
Player	Duration Total $  WAR	$ per win
Bonds	    1	  15.8	  3.9	4.05
Drew	    5	  70	  10.3	4.07
Lee	    6	  100	  9.2	5.43
Pierre	    5	  44	  3.6	7.33
Edmonds	    2	  19	  1.9	10.00
Payton	    2	  9.5	  0.7	13.57
Dellucci    3	  11.5	 -1.5	NA
Matthews    5	  50	 -1.1	NA
Roberts     3	  18	 -0.1	NA
Catalanotto 3	  13	 -0.1	NA
This list tells us that, outside of Barry Bonds and the one-year deal he signed in his last season, no team that signed a free agent outfielder before the 2007 season has enjoyed a better bargain on a per-season basis than the Red Sox have in paying for Drew's services.
Successfully negotiating the free agent market is a critical component of Major League Baseball roster composition. You can promote from within your organization, you can make a splashy trade, you can lock up your pre-arb players and buy out a year or two of their free agency. But you also must dabble in the free agent market in order to assemble a championship caliber club. Given this fact of life for MLB General Managers, it is useful to evaluate the "value" of a certain deal vis-a-vis other free agents and more specifically, other free agents that were available that year. Supply matters when evaluating value. And if you think of the J.D. Drew contract in this light, not only has his contract turned out to be a worthwhile one for the Red Sox, but it's been a full-fledged bargain.
| Behind the Scoreboard | December 29, 2009 |
Comparing the Hall Candidates
With the Hall of Fame selections approaching rapidly, I thought I would take a look at how some of the top candidates compare.
Given that the Hall of Fame is supposed to recognize a player's career accomplishments, Wins Above Replacement is the perfect stat to look at when comparing players' careers.
There are 133 Major League players that have been elected into the Hall of Fame via either the baseball writers (BBWAA) or the Old-Timers commission which selected 19th century and dead-ball stars for inclusion back in the 1940's. Of course, there are countless more players who have been elected by the Veterans Committee, but it would be a slippery slope to lower the BBWAA standards down the the threshold necessary for the Veterans Committee, so I'm going to ignore those players for now.
So how many WAR did the 133rd best player who is eligible for the Hall of Fame earn? 58 WAR. If we use 58 WAR as our starting cut-point, who among the players looking for induction meets that criteria?
Of perhaps the 13 most qualified, or at least the 13 most talked about candidates up for election this year, here's how it breaks down:
1. (90) Blyleven
2. (69) Larkin
3. (67) Martinez
4. (67) Trammell
5. (65) Raines
6. (64) Alomar
7. (63) McGwire
8. (57) Dawson
9. (56) Ventura
10. (51) McGriff
11. (50) Appier
12. (44) Murphy
13. (39) Morris
As we can see, there are a number of borderline candidates. The one slam dunk candidate, according to WAR, is Bert Blyleven, who toiled in relative anonymity for most of his career. The one candidate nowhere near Hall of Fame caliber is Jack Morris, who racked up just 39 WAR throughout his career.
However, there are 9 candidates within 10 WAR of the magic 58 cutoff. The list doesn't likely jibe with the opinions of the voters. Of the following list, Larkin and Alomar are probably the only new players who will get significant support, while voters are likely to underrate Martinez and have already shown a propensity to overrate Jack Morris.
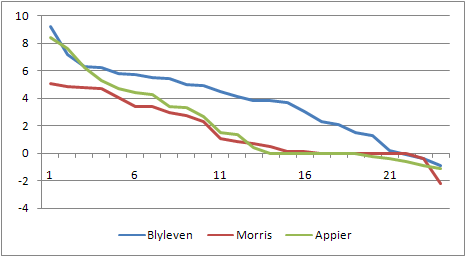
Of course, it's simplifying a bit to simply look at one number to determine a player's value. More useful, might be to look at how a player's career progressed. Below are a series of graphs which show a player's WAR sorted from his best year to worst year. From these graphs we can differentiate a player who had a strong peak, or a long career.
The Pitchers
First let's take a look at the pitchers. Looking at Blyleven, Morris, and Appier together, it's no question that Blyleven is head and shoulders above the other two. While Appier's best seasons matched Blyleven's best, Blyleven showed incredible consistency, being nearly a 4 WAR player even in his 15th best season. In contrast, both Appier and Morris were pretty much useless in by their 12th best season.
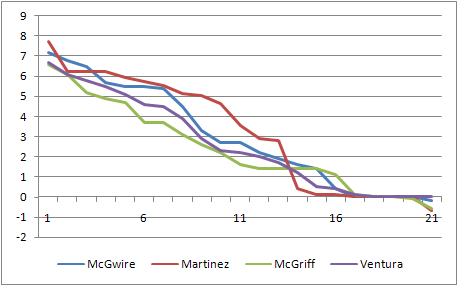
Corner Infielders
Now let's take a look at the corner infielders. Through their best 13 seasons, Edgar Martinez was clearly the best of the field, besting the other in every year but two. After that, however, Martinez was a rather useless player, giving him a short but brilliant career. Michael Weddell here at Baseball Analysts went over the case for Martinez in detail yesterday and I largely agree. Still, I have the nagging feeling that Martinez doesn't "feel" like a Hall of Famer. However, this can simply be attributed to his toiling in Seattle for all those years, playing a non-defensive position, and most importantly, drawing a ton of walks - a skill which was undervalued at the time he played. Martinez may not feel like a Hall of Famer, but he is one. Moving on down, the graphs pretty clearly show McGwire as a better player than Ventura, and Ventura as a better player than McGriff. My "gut" says McGwire is a Hall of Famer and Ventura and McGriff are not, and my gut agrees with WAR. However, with McGwire only 5 WAR above the threshold, a case could be made not to include him, given his alleged steroid use.
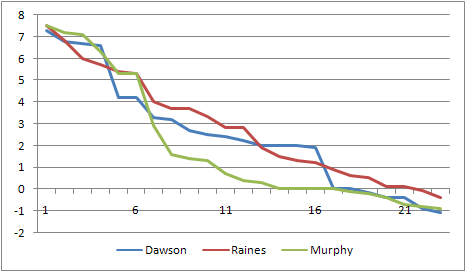
Now, we'll go to the outfield, where we compare Dawson, Raines and Murphy. Dale Murphy had the peak of a Hall of Famer, but didn't have the rest of the career. In his best six years Murphy was right there with the Hawk and Rock, but he quickly fell to earth. While Murphy's peak was good, it's not good enough to compensate for just 44 career WAR when 58 WAR is the standard. In the stat-oriented blogosphere, there's been a fair amount of cheering on of Raines and bashing of Dawson, but they really are not too far apart. While I'll agree that Dawson is probably a bit over-rated by the mainstream and Raines is underrated, as players there's not a huge difference. Raines is slightly better, but not by a lot. If you factor in Dawson's considerable leadership, the difference becomes even closer. In my opinion, both players are worthy of induction.
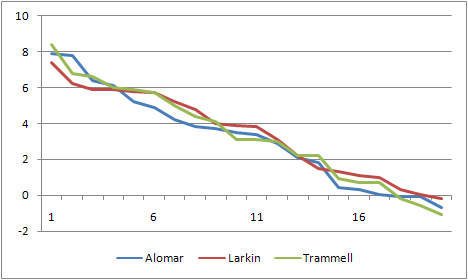
In a final comparison, we'll go to the middle infield, and boy there is little to choose from. Alomar, Larkin, and Trammell all had pretty much the same career with respect to WAR. Larkin, with the overall most WAR, had a lower peak, but a more productive rest of his career. Between Trammell and Alomar, their paths are virtually indistinguishable. In the mainstream, the Alomar and Larkin are sure to get more love than Trammell has thus far. One factor in Alomar's favor is that he has a reputation as a great defensive player (including 10 Gold Gloves), despite the fact that WAR and other advanced metrics show his defense as average or below average. If you pay attention to the Gold Gloves rather than the stats, he'll be ahead of both Larkin and Trammell, and that's likely how he'll be percieved by the Hall of Fame voters. I think all three players are deserving of the Hall, though it wouldn't bother me terribly if none of them got in.
In a year with many and new borderline candidates, it will be interesting to see which directions the voters go in 2010. There are very few open and shut cases (and the one open and shut player is teetering on his 13th year of eligibility!), but there are a lot of maybes, should-bes, and could-bes in this year's crop of Hall of Fame contenders. I can't wait until January 6th to see how it all shakes down.
| Designated Hitter | December 28, 2009 |
Edgar Martinez and the Hall of Fame
Edgar Martinez is listed for the first time on this year’s Hall of Fame ballot. While Martinez is a very long shot for actually earning 75% of the writers’ votes in his first year of eligibility, I believe that Martinez meets the historical standards for Hall of Fame entry and should earn one’s vote.
Evaluating Edgar Martinez’ career presents some fairly unique challenges.
- Martinez played the majority of his career at DH, eventually finishing third behind Harold Baines and Hal McRae in career games played at DH. How do we evaluate a player who made no defensive contributions for most of his career?
- If one votes for Edgar Martinez, does that open the door for too many other candidates, such as Fred McGriff who also makes his debut on this year’s Hall of Fame ballot?
- Martinez had a somewhat short overall career compared to other Hall of Fame caliber players. How does he compare to position players with roughly comparable career length?
- Even measuring Martinez’ offensive contributions can be a bit tricky because he excelled at getting on-base and hitting doubles during an era better known for home run hitting.
Let’s start with that last challenge, and then we’ll work our way backwards through the remaining challenges.
First a Detour: wOPS+
I love using the OPS+ statistic (called adjusted on-base + slugging percentages) compiled at www.baseball-reference.com. It does most of the heavy lifting for us since it is adjusted for ballpark effects and the offensive context of the league and year. It’s readily accessible, because one can easily sort and filter based on it. The scale is also easy to grasp: 100 is average, and OPS+ scores above 100 are better than average.
The problem with OPS+ is that using on-base percentage plus slugging percentage just isn’t very accurate to start with. On-base percentage is considerably more important for creating runs. How much more important? Well, there’s no need to reinvent the wheel here. Tom Tango wrote recently that one can greatly improve OPS+ by weighting the on-base percentage by 1.2 and the slugging percentage by 0.8. We’ll call it weighted OPS+ or wOPS+. To be precise, we’ll define it as:
This will give us a statistic adjusted for offensive levels and home ballpark, is an accurate reflection of offensive contributions toward creating runs, and is still fairly easy to compute. We use just four pieces of input data, all of which are readily available in the Special Batting section of player batting data on baseball-reference.com.
We’ve got our shiny new hammer. Now let’s go find some nails.
Edgar’s Moderately Short Career
One objection to Edgar Martinez’ possible Hall of Fame credentials is that his career was a bit short by Hall of Fame standards. Martinez totaled 8,672 plate appearances, which isn’t too short. Let’s look at those with 7,500 – 9,500 plate appearances who played since 1901 and see where Martinez’ career batting quality ranks among those with similar career lengths.
| Name | wOPS+ |
|---|---|
| Rogers Hornsby | 171 |
| Mark McGwire | 157 |
| Manny Ramirez | 152 |
| Joe DiMaggio | 149 |
| Jeff Bagwell | 147 |
| Edgar Martinez | 147 |
| Harry Heilmann | 145 |
| Jim Thome | 145 |
| Alex Rodriguez | 144 |
| Jason Giambi | 142 |
| Chipper Jones | 142 |
| Willie Stargell | 141 |
| Brian Giles | 139 |
| Mike Piazza | 139 |
| Larry Walker | 137 |
| Duke Snider | 137 |
| Arky Vaughn | 136 |
| Norm Cash | 136 |
| Will Clark | 136 |
| Jack Clark | 136 |
These are the best batters in baseball history with career lengths roughly similar to Edgar Martinez’ career length. Obviously, it includes active players, with statistics through 2009, many of whom will retire with longer careers but with somewhat lower wOPS+ as they complete their decline phases.
Where’s the cutoff between the Hall of Famers and the non-Hall of Famers? If we ignore steroid problems, everyone above Brian Giles appears to be a Hall of Famer, although others may read the data differently. Jason Giambi’s Hall of Fame credentials are questionable, but he had a very high peak, with three consecutive top 5 MVP ballot finishes.
Below Brian Giles on that last table, one can still be a clear Hall of Famer by batting well and playing a premium defensive position, such as Piazza and Vaughn did, but we start to enter a gray area. There are many, many Hall of Famers below the top twenty that I listed, but it’s a dicey proposition the further down one goes. Incidentally, new Hall of Famer Jim Rice has a career wOPS+ of 124 on this list, not that he represents the dividing line between whether a guy comfortably fits into the Hall of Fame.
Edgar ranks sixth, surrounded by Hall of Fame caliber players. Here’s our starting point, that Edgar Martinez had a Hall of Fame caliber career based on the quality of his batting.
Edgar versus Crime Dog
Another worthy objection to letting Edgar Martinez into the Hall of Fame is that we end up with far too many modern batters in the Hall. Edgar wasn’t really that special, right? For example, looking just at the newcomers for next year’s 2010 ballot, if one votes for Edgar, doesn’t one first have to vote for Fred McGriff?
Not necessarily.
Comparing career wOPS+ totals shows a clear advantage to Martinez. However, now that we are comparing McGriff, a guy with a much longer career, that may not be a fair comparison. Edgar had an unusual career progression, with his early years spent clobbering minor league pitching and a short decline phase at the end of his career. Let’s instead look at individual years to see, in their best seasons, which player was a better batter. Here are all of their seasons where they had enough plate appearances to qualify for the batting title (502 in most years, but less for 1994-95 due to shortened seasons):
| Name | Year | wOPS+ |
|---|---|---|
| Edgar Martinez | 1995 | 184 |
| Edgar Martinez | 1997 | 166 |
| Edgar Martinez | 1996 | 166 |
| Fred McGriff | 1989 | 163 |
| Fred McGriff | 1992 | 161 |
| Edgar Martinez | 1992 | 161 |
| Edgar Martinez | 2001 | 160 |
| Edgar Martinez | 1998 | 157 |
| Edgar Martinez | 2000 | 155 |
| Edgar Martinez | 1999 | 153 |
| Fred McGriff | 1988 | 152 |
| Fred McGriff | 1994 | 151 |
| Fred McGriff | 1990 | 150 |
| Fred McGriff | 1991 | 146 |
| Edgar Martinez | 2003 | 142 |
| Fred McGriff | 2001 | 141 |
| Fred McGriff | 1999 | 140 |
| Edgar Martinez | 1991 | 139 |
| Fred McGriff | 1993 | 139 |
| Edgar Martinez | 1990 | 134 |
| Fred McGriff | 2002 | 122 |
| Edgar Martinez | 1994 | 121 |
| Fred McGriff | 1995 | 118 |
| Fred McGriff | 1996 | 117 |
| Fred McGriff | 1998 | 112 |
| Fred McGriff | 2000 | 110 |
| Fred McGriff | 1997 | 106 |
| Edgar Martinez | 2004 | 95 |
I don’t know whether Fred McGriff will eventually be in the Hall of Fame or not, but this table rather clearly shows that Edgar was the better hitter, with 8 of the 10 best seasons between the two of them. Martinez shouldn’t have to wait in line behind McGriff on anyone’s Hall of Fame ballot.
Stop Ignoring the 600-Pound Gorilla in the Room!
Probably the biggest objection to voting Edgar Martinez into the Hall of Fame is one that I’ve ignored so far: he spent the bulk of his career as a designated hitter.
How much is a player with no defensive value worth? According to Tom Tango’s positional adjustments, which are used for the Win Value metrics on Fangraphs.com, a DH is 22.5 runs per season worse than the average non-DH position player. However, Tango added back in another 5 runs for the difficulty of batting as a DH, resulting in a -17.5 runs per season positional adjustment.
What is so difficult about being a DH? It’s a little bit like having to be a permanent pinch hitter, and we all recognize that it is more difficult to perform well as a pinch hitter coming in cold off the bench. As summarized on p. 113 of The Book by Tango, Lichtman and Dolphin:
Players also lose effectiveness when being used as a designated hitter; the DH penalty is about half that of the PH penalty. This does vary significantly from player to player – some players hit as well as a DH as they do otherwise, while others perform as badly as pinch hitters.
So there can be a unique skill at batting well as a DH.
The result is that an average DH is worth about five runs per season less than an average fielding first baseman. Yes, that’s a disadvantage, but it isn’t huge. A DH can be more valuable than a below average first baseman with comparable batting statistics because the difficulty of batting as a DH partially offsets the defensive value of a below average fielding first baseman.
Being a DH is a negative marker for a Hall of Fame candidate, but, viewed rationally, it shouldn’t be an impossible hurdle.
Comparing Edgar to Other DHs
Perhaps the easiest way to evaluate Edgar is to just compare him to other DHs. We have to have some designated hitters in the Hall of Fame, right? Paul Molitor is already there and a plurality of his games played, including most of his best seasons, were when Molitor played primarily as a DH. Frank Thomas played over half of his career as a DH and he’ll be in the Hall eventually. It’s not unreasonable to think that we ought to have a couple of Hall of Fame DHs considering that the American League has had designated hitters since 1973, a span of over 35 years.
So here’s a list of the top 20 seasons for designated hitters, again using our wOPS+ rate statistic:
| Name | Year | wOPS+ |
|---|---|---|
| Edgar Martinez | 1995 | 184 |
| Frank Thomas | 1991 | 180 |
| David Ortiz | 2007 | 169 |
| Edgar Martinez | 1997 | 166 |
| Edgar Martinez | 1996 | 166 |
| Travis Hafner | 2005 | 164 |
| Milton Bradley | 2008 | 163 |
| Frank Thomas | 2000 | 160 |
| Edgar Martinez | 2001 | 160 |
| Travis Hafner | 2004 | 159 |
| Travis Hafner | 2006 | 159 |
| Edgar Martinez | 1998 | 157 |
| Manny Ramirez | 2001 | 157 |
| David Ortiz | 2006 | 157 |
| Edgar Martinez | 2000 | 155 |
| Rafael Palmeiro | 1999 | 154 |
| David Ortiz | 2005 | 153 |
| Edgar Martinez | 1999 | 153 |
| Hal McRae | 1976 | 153 |
| Jim Thome | 2006 | 152 |
These are very fine seasons. You may remember that Milton Bradley led the American League in raw OPS in 2008, yet his season ranks only seventh on this list.
I don’t have any trouble eyeballing this list and concluding that Edgar Martinez has had the best career as a DH of any player in history so far. The best DH in history is not Hall of Famer Paul Molitor, nor future Hall of Famer Frank Thomas. It’s not Harold Baines, the longevity leader, or David Ortiz, the popular current star at DH. It’s Edgar Martinez.
That’s a Hall of Famer.
Other Considerations
According to the Hall of Fame:
Voting shall be based upon the player's record, playing ability, integrity, sportsmanship, character, and contributions to the team(s) on which the player played.
As far as integrity, sportsmanship and character go, let’s point out that Edgar Martinez was once honored with the Roberto Clemente Award for charitable contributions to his community. I also am unaware of any claims that Martinez used performance-enhancing drugs, for those inclined to go there. I don’t see much room for debate: character issues will not hurt Martinez’ candidacy.
While I would be surprised if the BBWAA membership agrees with me, in my opinion, Edgar Martinez is a Hall of Fame caliber player and should be voted in.
Michael Weddell is one of the Research & Analysis columnists for the fantasy baseball website www.BaseballHQ.com and a contributor to Ron Shandler’s Baseball Forecaster: 2010 Edition. Michael roots for the Tigers with his wife and adult children in metropolitan Detroit.
| Touching Bases | December 26, 2009 |
Batted Ball Location Leaderboards
My first post on this site in February borrowed the main idea of Dave Studeman's batted ball reports, except instead of looking at the trajectory of batted balls, I grouped them by vector. A full season has passed, so who were the best pull hitters in baseball this year?
Value of Pulled Batted Balls
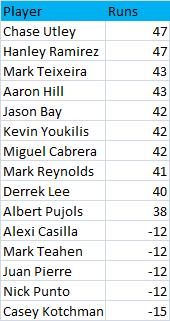
Chase Utley and Hanley Ramirez were both worth about 40-45 runs above average with the bat on the year. Utley got some value out of walking and taking his HBPs, but the bulk of their value at the plate came from them pulling balls. Reading John Walsh's piece in this year's Hardball Times Annual, I realized that Utley and Hanley weren't fully appreciated because their contributions outside the batter's box were equally valuable. Their baserunning, position, fielding value, and ability to stay on the field add another 40-45 runs to their value.
Albert Pujols and Kevin Youkilis returned from last year's top ten, while Dan Uggla, second last year, finishes one spot outside the top ten.
I think part of the reason that Youk and Jason Bay are listed is that they play get to take advantage of the Green Monster. I'm not trying to discredit them, since they're both excellent right-handed hitters, but I am trying to discredit Dustin Pedroia and Mike Lowell. Here is the average run value of pulled fly balls and line drives for Boston's four main RHBs since 2008.
| Player | Home | Away | Diff |
|---|---|---|---|
| Kevin Youkilis | 0.58 | 0.48 | 0.10 |
| Jason Bay | 0.52 | 0.43 | 0.09 |
| Mike Lowell | 0.47 | 0.26 | 0.21 |
| Dustin Pedroia | 0.40 | 0.22 | 0.18 |
Lowell pulls half his balls in play, too, so I doubt there's any park that he'd rather play in than Fenway. As for Pedroia, he has a career .332/.391/.505 line at home. On the road, he hits .283/.350/.406. He has never hit a 400-foot home run in his career according to Hit Tracker. I doubt anybody is more suited for his home park than Pedroia is for Fenway.
At the bottom of the list is Casey Kotchman, who I believe is the only first baseman to have totaled a negative value on pulled balls. Over a quarter of Kotchman’s balls in play were pulled groundballs, and he hit .073 on those. In 2008, a whopping third of his balls in play were pulled grounders, though he managed to hit .154 on them, so it's possible defenses have figured him out.
Value of Center Field Batted Balls
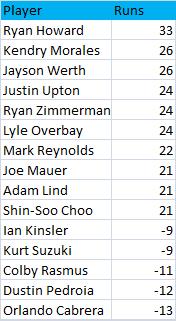
Both Phillies repeat on this leaderboard from last year, while O-Cab and Pedroia again prove their ineptitude at hitting the ball up the middle.
Ryan Howard focused his prodigious power to center this year. Previously, Howard hit the plurality of his home runs the opposite way three times in his career, and in 2007, he had pulled the highest share of his homers, but this year, he hit a remarkable 21 of his 45 homers to center. Mark Reynolds came closest to matching Howard with 17 home runs to center.
Value of Opposite Field Batted Balls
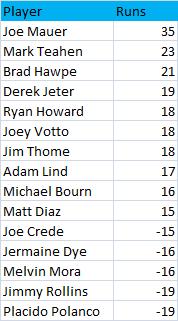
Joe Mauer’s 35-run total is absurd. He was worth 13 runs going the other way last year and his -10 runs on pulled balls actually was a league low. Now, he's cracked both the center field and opposite field top ten, and his futility pulling the ball was skimmed down to -5 runs. Mauer hit 34% of his balls to the opposite field, while the league average is 27%. His backup Mike Redmond hits the highest rate of balls the other way in the league.
Only Adrian Gonzalez hit more opposite-field homers than Joe Mauer this year. Adrian Gonzalez in Fenway Park would be scary. Derek Jeter, who’s always had opposite field power, hit the most home runs to right field batting right handed this year, possibly rejuvenated by the even shorter short porch at the New Yankee Stadium. In 2008, Jeter had better luck going the other way with his fly balls when he was on the road than he did when he was at home. That split did not continue in 2009. Jeter produced slightly better results on flies to right in the New Yankee Stadium than he did while playing on the road.
Jimmy Rollins' batted ball profile continues to perplex. He hit an anemic .200 on grounders this year, below his already mediocre .231 career average. Though speed is important for batters to reach base safely on grounders, spraying the ball to all fields might be even more weighty. Rollins hit only 7% of his groundballs the other way, which allows defenses to shift their fielders to one side of the field, and signifies that he's rolling over on the ball when he hits grounders. Placido Polanco, Jermaine Dye, and Joe Crede all hit over a third of their flies to the opposite field, but under 5% of those balls fall for hits.
A spreadsheet containing the full results can be found here. Batted ball location data via MLBAM. The field was partitioned equally into thirds to classify right/center/left.
| Baseball Beat | December 24, 2009 |
BBWAA 2010 Hall of Fame Ballot
Fifteen new candidates are among the 26 players listed on the 2010 Hall of Fame ballot mailed to more than 575 voting members of the Baseball Writers Association of America late last month. The newcomers include Roberto Alomar, Barry Larkin, Edgar Martinez, and Fred McGriff, as well as Kevin Appier, Ellis Burks, Andres Galarraga, Pat Hentgen, Mike Jackson, Eric Karros, Ray Lankford, Shane Reynolds, David Segui, Robin Ventura, and Todd Zeile.
Among the 11 holdovers, Andre Dawson (67.0%) and Bert Blyleven (62.7%) were the only players named on more than half of the 539 ballots cast last year. Candidates need 75 percent to gain entry into the National Baseball Hall of Fame in Cooperstown, New York. Among players not currently on the BBWAA ballot, Gil Hodges is the only candidate to receive over 60 percent and not eventually be elected to the Hall of Fame.
The other returnees are Harold Baines, Don Mattingly, Mark McGwire, Jack Morris, Dale Murphy, Dave Parker, Tim Raines, Lee Smith, and Alan Trammell. Candidates remain under consideration for up to 15 years as long as they are named on at least five percent of the ballots cast.
The BBWAA election rules detail the authorization, electors, eligible candidates, method of election, voting, time of election, and certification of election results. The electors, consisting of active and honorary members of the BBWAA with 10 or more consecutive years' experience, may vote for up to 10 eligible candidates deemed worthy of election. Write-in votes are not permitted. Ballots must be postmarked no later than December 31. Results will be announced Wednesday, January 6, 2010, on the web sites of the Hall of Fame and the BBWAA. The Induction Ceremonies will take place in Cooperstown on Sunday, July 25, 2010.
The Hall of Fame features 291 members, including 2010 Veterans Committee electees Doug Harvey and Whitey Herzog. Included are 202 former Major League players, 35 Negro Leaguers, 26 executives or pioneers, 19 managers and nine umpires. The BBWAA has elected 108 former players while the Hall of Fame Committee on Baseball Veterans has chosen 157 candidates. The defunct Committee on Negro Leagues selected nine members between 1971-1977 and the Special Committee on the Negro Leagues in 2006 elected 17 Negro Leaguers.
Here is a copy of the 2010 Hall of Fame Ballot that was mailed to the voting members of the Baseball Writers Association of America.
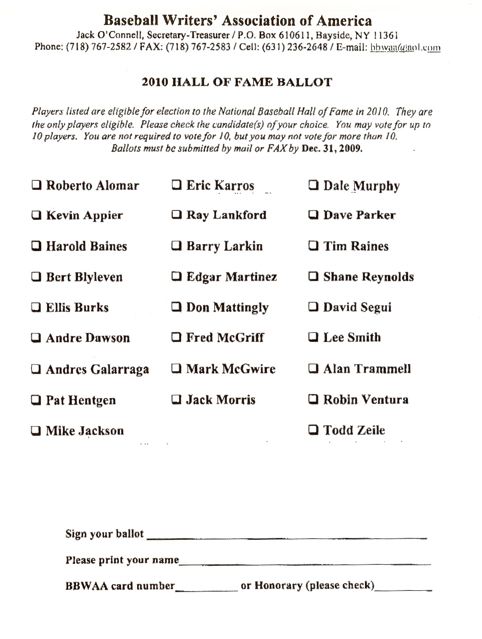
A summary of the players' records and accomplishments accompanied the ballot. The players were listed in alphabetical order, starting with Alomar and ending with Zeile. The following page, which includes Blyleven, Burks, Dawson, and Galarraga, serves as an example of the information provided to the electorate.

If I had the privilege of voting, I would have placed a check next to the names of Alomar, Blyleven, Larkin, Martinez, McGwire, Raines, and Trammell. It's well known that I'm most partial to Blyleven, who ranks THIRTEENTH (13th) among all pitchers and TENTH (10th) among eligible pitchers in Wins Above Replacement. Every pitcher in the top 23 is either in the Hall of Fame or should be five years after their retirement except Only the Lonely himself. For those who prefer more traditional measurements, Blyleven ranks fifth in career strikeouts, ninth in shutouts, and 27th in wins (top 20 since 1900). No matter how you like your numbers, Blyleven should have been voted into the HOF many, many years ago. He is, by far, the most deserving player on this year's ballot.
In addition to Blyleven, I believe Raines has been grossly overlooked. I supported 30 Rock's candidacy two years ago when he first appeared on the ballot. Raines is one of the greatest lead-off batters in the history of the game, ranking 41st all-time in getting on base (hits + walks + hit by pitch), 50th in runs scored, and 5th in stolen bases (with the second-highest success rate among those with 300 or more SB). He has more Win Shares (390) than any player up for election.
I believe Alomar, Larkin, and Trammell are more comparable than not. All three middle infielders belong in the Hall of Fame. In 2001, Bill James ranked each of them in the top ten of their positions in his New Historical Baseball Abstract. They were five-tool players who could hit for average, hit for power for their positions, run, field, and throw. In addition, Alomar (1,032 BB/1,140 SO), Larkin (939 BB/817 SO), and Trammell (850/874 SO) displayed terrific bat control and plate discipline.
Alomar (.300/.371/.443, 116 OPS+, 474 SB/81%) ranks in the top 80 all time in runs, hits, doubles, total bases, times on base, runs created, and stolen bases—remarkable achievements for a second baseman who won 10 Gold Gloves. Larkin (.295/.371/.444, 116 OPS+, 379 SB/83%), who was the first shortstop to hit 30 HR and steal 30 bases in the same season, has the 1995 NL MVP Award and three Gold Gloves in his trophy case. James called him "one of the ten most complete players in baseball history." Trammell (.285/.352/.415, 110 OPS+, 236 SB/68%) won four Gold Gloves and should have been named the AL MVP in 1987 when the shortstop hit .343/.402/.551 but lost out to left fielder George Bell (.308/.352/.605), a one-dimensional player, when voters were fixated on RBI rather than overall performance and value.
The main argument against Martinez is that he was a designated hitter and failed to get 3,000 hits or even 400 home runs. Well, Jim Rice DH'd for a quarter of his career and came up short of those two milestones, yet was voted into the HOF last year. The biggest difference between Martinez and Rice isn't in their counting stats but in their rate stats. Martinez hit .312/.418/.515 with an OPS+ of 147. Rice hit .298/.352/.502 with an OPS+ of 128. Edgar had a higher AVG, OBP, SLG, OPS, and OPS+ than James Edward. Martinez played in an era more suited to hitters while Rice benefited from a more friendly home ballpark.
Martinez had an OPS+ of 132 or higher in every season in which he had 400 or more plate appearances, other than in his final year in 2004. The righthanded hitter was an on-base and doubles machine, leading the league three times in OBP and twice in 2B while ranking 22nd and 41st in these two categories all time. He also ranks in the top 50 in BB, OPS, and OPS+. Like Rice, Martinez wasn't much in the field or on the bases, but he was a more productive hitter and a superior offensive player.
By any objective standard, McGwire is a clear-cut Hall of Famer. Big Mac ranks 8th in HR (583), 9th in SLG (.588), 11th in OPS (.982), 12th in OPS+ (162), and FIRST in AB per HR (10.6). He led the league in HR four times, including a then single-season record of 70 in 1998. McGwire (.299/.470/.752 with 41 Win Shares) inexplicably wasn't voted NL MVP that season, receiving just two first-place votes vs. 30 for Sammy Sosa (.308/.377/.647, 35 Win Shares).
Importantly, McGwire wasn't suspended nor expelled from the game. He has never admitted to or been convicted of any steroid use and wasn't even named in The Mitchell Report. In 1998, Big Mac acknowledged taking androstenedione, an over-the-counter product that was legal at the time under U.S. law and for use in MLB. It wasn't considered an anabolic steroid until three years after his retirement. If enough revisionist historians want to exclude McGwire from the Hall of Fame, I guess they will sadly win out.
Although I'm not in favor of Dawson's candidacy, I can understand why writers would vote for him. He combined power, speed, and defense in a career that resulted in 438 home runs, 314 stolen bases, and eight Gold Gloves. My beef with Dawson is that he simply made too many outs for my tastes (and many others). That said, it wouldn't be the biggest injustice if the Hawk gained entry into the Hall of Fame (unless, of course, he makes it and Raines never does).
McGriff is a borderline candidate, perhaps more suited to the Hall of the Very Good than the Hall of Fame. At a minimum, I'm hopeful that he will get at least five percent of the vote and remain on the ballot for another year. Falling seven home runs short of 500 for his career, the Crime Dog might not resonate with voters who may have forgotten just how good he was in the late-1980s and early-1990s. To wit, from 1988-1994, McGriff ranked in the top five in HR and OPS every season. That's right, for seven straight years, he finished either first, second, third, fourth, or fifth in his league in those two slugging categories. He could get on base, too, placing in the top four in OBP for four consecutive campaigns.
If peak value was the sole criteria, I could get behind Mattingly, Murphy, and Parker. Donnie Baseball may have been the preeminent hitter in the game from 1984-1986 when he hit .340 and averaged 219 hits, 48 doubles, and 30 home runs while leading the majors in total bases in '85 and '86. He could also field, picking up nine Gold Gloves at first base along the way. Murphy, who didn't miss a game from 1982-1985 when he was one of the best position players in baseball, was named NL MVP in back-to-back seasons and was a five-time recipient of the Gold Glove Award. Parker broke out in 1975 and was the man from 1977-1979 when he won an MVP, two batting titles, and three Gold Gloves. He and Rice had parallel careers, and it is my belief that the Cobra was nearly the same hitter and a much better fielder and baserunner at the height of their careers. All three candidates have loyal backers and will likely remain on the ballot for their entire 15 years of eligibility, yet none has ever received as much as 30 percent of the vote.
Morris and Smith have their fans but both seem stuck in the low-40s in terms of their overall support. It's rare to stumble across an endorsement of Morris without reading about his postseason pitching prowess. While Jack's 10-inning, complete-game shutout in Game 7 of the 1991 World Series is undoubtedly one of the best pitching performances in the history of the Fall Classic, his overall postseason record (7-4, 3.80 ERA, 1.25 WHIP, 2.00 K/BB) pales in comparison to Blyleven's (5-1, 2.47 ERA, 1.08 WHIP, 4.50 K/BB). As Joe Posnanski covered in detail earlier this week, Blyleven beat Morris head-to-head in the 1987 ALCS and returned on three days' rest to win the clincher before helping the Twins overtake the Cardinals in the World Series.
Meanwhile, Baines, who Buster Olney somehow likened to Blyleven, runs the risk of dropping off the ballot after three years of picking up more than five percent but less than six percent of the vote.
First timers Appier, Burks, and Ventura are worthy of some love but unlikely to secure five percent of the vote. Galarraga, Hentgen, and Lankford all had their moments but fall well short of consideration. I'm not sure how Jackson, Reynolds, Segui, and Zeile got past the screening committee and, along with Karros, will be surprised if any of these players receives a single vote.
| Touching Bases | December 23, 2009 |
Aybar vs. Greinke
Marc Topkin of the St. Petersburg Times on July 18:
Manager Joe Maddon had his reasons for starting Willy Aybar on Saturday.Some he could explain, such as wanting to keep Aybar fresh for his primary duties as the Rays' top pinch-hitter. And some Maddon couldn't, and wouldn't, derived from extensive research and data analysis by the Rays front office staff that deduced Aybar would be a prime weapon against Royals ace Zack Greinke…
"Free Willy," Maddon said. "This is something we do back at the office, and we really crunch numbers, just so many different things. And Willy came out on top vs. Greinke, so we had to throw him out there."
The research is based on what Maddon called "an esoteric system" and had to be thorough and complex because Aybar had never faced Greinke. And it went beyond the more visual "swing planes" they have discussed before in arranging matchups.
It is also proprietary, Maddon said, joking that revealing it would carry the potential penalty of banishment to semipro ball back in eastern Pennsylvania.
"I would probably end up managing the Japan-Jeddo Stars," he said.
Aybar went 3 for 3 off Greinke.
On December 7, Tommy Rancel of DRaysBay published this exchange he had with Tampa Bay Rays coordinator of baseball operations James Click:
TR: what does Willy Aybar know about Zack Greinke?JC: Whatever it is, I hope he's told our other hitters.
I’m intrigued.
The Idea
Use pitchf/x data to create a projection system for individual batter/pitcher matchups.
The Qualifications
I have none. The idea is overly ambitious, and I quickly realized I'm not the man for the job.
The Method
Chris Moore rather brilliantly ranked the best fastballs in baseball using five parameters: horizontal location, vertical location, velocity, vertical movement, and horizontal movement. Zack Greinke unsurprisingly came out on top.
Chris only looked at fastballs from right-handed pitchers against right-handed batters. If Chris were to have looked at RHP vs. LHB matchups, I’m sure Greinke would not have come out ahead, and instead Mariano Rivera would have topped the list. But what about RHPs against only Willy Aybar?
So I came up with a way to predict Aybar’s performance given certain pitch tendencies. For example, Aybar does best against slow fastballs around 90 MPH and he likes the ball down the middle. Plots to illustrate these points.
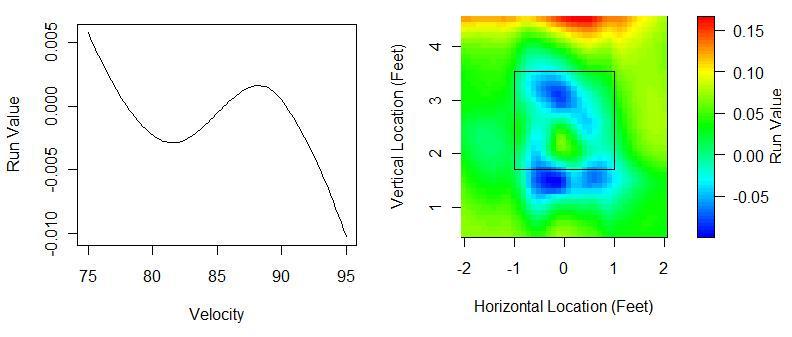
You can't plot all five dimensions together, but the point is that I made a model using all five variables. I then predicted that model onto a data set containing only Greinke pitches. So the model doesn't have any idea how Greinke would pitch Aybar, but it knows that Greinke likes to throw 94 MPH fastballs on the outer part of the plate, and it knows that Aybar likes to hit 88 MPH fastballs down the middle. After some regression to the mean, you have yourself a projection.
The Technical Details
My first data set consisted of all pitches Aybar faced from 2008 to July 18, 2009, and I tried to limit my sample further to only non-sidearming/knuckleballing RHPs. I ran a local regression to predict run values, weighing recent data the most heavily. My second data set contained all pitches from Greinke to LHBs over the same time span. I predicted my model onto that data set. Next, I regressed the expected run values for Aybar against Greinke toward the actual run values of Greinke vs. all LHBs he faced. I then regressed my projection even further to the the average performance of switch-hitting LHBs against RHPs, which I found to be around the league average .330 wOBA.
The Results
I predict Aybar to be precisely league average against Greinke.
My analysis gleans hardly any new insight into player projections. Aybar is below average against RHPs, but Greinke isn’t a world-beater himself against LHBs, having allowed an .824 OPS against LHBs in 2008.
Pretty much, I don’t think you’re going to get enough data from 1,000 pitches from hitters to beat out traditional projection systems. (For pitchers, however, any amount of pitchf/x data adds significant value.) So I guess I'm not on the same track as Friedman, Click, Kalk and the rest of whatever the Rays have going on in baseball ops.
I actually projected Aybar against all RHPs, and for what it's worth, I predict Aybar will do well against Pedro Martinez and poorly against Mariano Rivera. My model tells me Aybar will do surprisingly well against Roy Oswalt and surprisingly poorly against Armando Galarraga. It's not worth much.
The Loosely-Related Tim McCarver Quote
"I said it was Izturis who didn't get the bunt down last year. It was actually Manny Aybar. Excuse me, Erick Aybar, not his younger brother Manny who plays for Tampa Bay."
| Behind the Scoreboard | December 22, 2009 |
The Bradley Effect
This past week, the Cubs finally dealt the ever-cranky, overpaid, outfielder known as Milton Bradley. Bradley, who was owed $22 million over the next two years, was a massive disappointment in Chicago. While, he actually ended up hitting for a league average OPS, the bigger problem was his attitude. When he didn't hit early on, his mood soured, the fans and media turned on him, and he became the dreaded "clubhouse cancer".
While Cubs fans everywhere rejoiced at the departure of Bradley, the Cubs didn't exactly get much for him. Jim Hendry ended up taking on an even bigger albatross, as the Cubs took on Carlos Silva and his bloated contract, which is actually worth more than Bradley's. As you'll recall Silva was a decent pitcher in Seattle, before totally tanking the last two years with ERA's of 6.46 and 8.60, spending a lot of last year on the disabled list. While Silva is basically a replacement level pitcher these days - a guy who could make a turnaround, but who in his current state is not a major leaguer - Milton Bradley is still an above average hitting outfielder. With the Mariners transfer of $9 million to the Cubs and the fact that Silva was owed $3 million more than Bradley, the calculus on the trade was the following:
2 years of Bradley = 2 years of Silva + $6 million
or, if you prefer,
2 years of Bradley - 2 years of Silva = $6 million
If we assume that Silva is now a replacement level pitcher who would sign for league minimum on the open market, that would place Bradley's effective value at $3 or $4 million per year. But surely, Bradley is worth more than that. Even if he repeats his disappointing 2009 performance, in which Bradley earned just 1 WAR, he still would be a bargain considering that the average team had to pay $6.5 million to net a 1 WAR player last year. Given that the Mariners will be paying an effective salary of $3 million, Bradley is a steal.
So why were both teams happy about the deal?
Back in September, I talked about Bradley in an article about clubhouse chemistry, and calculated that teams seemed to consider an extreme clubhouse cancer's attitude worth about -1.5 WAR at max. Given this, the Cubs placed Bradley's value at around zero. Getting $6 million bucks for a player you consider worthless isn't a bad move at all.
However, it's likely that Bradley's attitude is valued very differently by the Cubs than the Mariners. With the Cubs, he's already shown he can't fit in with the other players, the front office, and the media - hence the -1.5 WAR attitude. Meanwhile, Bradley's attitude is an unknown for Seattle. Perhaps he will fit in fine and his attitude won't be a major problem. Or perhaps, he will be as big of a problem as he was in Chicago. But given that it's an unknown, Seattle probably values Bradley's head at -.5 WAR rather than -1.5 WAR. This gives Bradley more value to the Mariners than the Cubs and allows both teams to be happy with the deal. The Cubs unloaded a worthless player (to them) for $6 million, and the Mariners got a good hitting outfielder for a song.
Supposedly, Seattle has all of the things he needs to thrive - a small market media with a large clubhouse. However, the biggest determinant of Bradley's attitude is likely to be Bradley's own production. If after two months, Bradley's numbers resemble what he did in Texas, look for the media and Seattle fans to laud him for how much he has matured and improved his attitude. If his numbers look like they did in Chicago, then it will be a stormy tenure in Seattle.
While the Cubs may be happy with the deal, it seems that they should have gotten more for Bradley. Seattle got a good player for very little, and it's surprising that other teams didn't bid up the value for Bradley to give the Cubs a better deal. Part of the problem, was that given Hendry's handling of Bradley at the end of last year, they absolutely had to move him and everybody knew it. Hendry saw chance to gain cash for Bradley and he took it. However, Seattle is getting a steal of a deal. How Bradley performs this April and May may well determine how much of deal they actually get.
| Crunching the Numbers | December 20, 2009 |
Defending Jacoby Ellsbury
In 2008, Jacoby Ellsbury was rated by Baseball America as the best defensive outfielder in Boston's minor league system. He made good on that prediction in 2008, impressing UZR and posting a 16.8 fielding RAA, 6.9 of which in centerfield.
In 2009, in the season Ellsbury was voted the Defensive Player of the Year by MLB.com, he was ranked by FanGraphs as having the worst defensive year of any center fielder, -18.6 runs. So which is it? Is he the best in the league or the worst in the league? Perhaps the MLB.com award was simply a popularity contest biased by a few web gems; there are a whole lot of Sox fans out there. That's possible, but I'm not quite willing to label Ellsbury the Derek Jeter of center field so quickly. Perhaps UZR isn't properly taking into account the peculiarities of Fenway? This isn't likely, given his rating in 2008 and that of Covelius in 2007.
It's been argued that Ellsbury is Jeter reborn: a poor defensive player who makes up for his deficiencies with flashy plays. The argument is that he makes poor reads off the bat and a poor initial step but makes up for it with his speed and a late diving catch. It's certainly possible, but looking over the video evidence, that's not my read. Some seem ready to dismiss Ellsbury on the basis of his UZR stat alone, but most fans don't seem to be so easily swayed. The fan scouting report over at The Book in 2008 and 2009 lists him as having an above average first step and average instincts (unlike Coco, who amusingly has incredible instincts, but the arm strength of a Girl Scout after a massive stroke).
On the other side, it's been argued that Ellsbury illustrates how meaningless defensive statistics are. No one has ever argued that defensive statistics are as definitive and meaningful as batting or pitching statistics, but to ignore them completely seems unwise. Theo Epstein seems to agree, given his moves to ship Mike Lowell--and his awful 2009 UZR--off to the Rangers while Boston pays his salary. I think the most honest observers have to admit that they just don't know how to reconcile the statistics with the widespread perception that Ellsbury is a good defensive player.
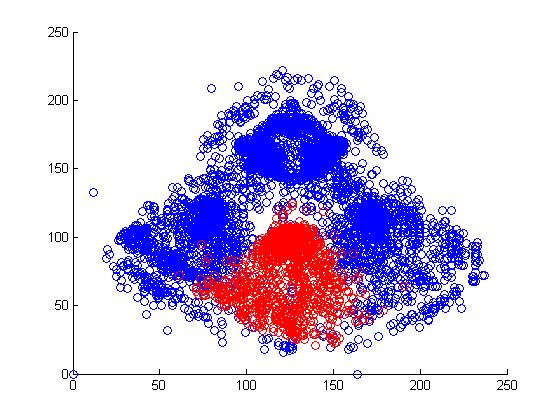
I looked at the pitch f/x data from 2008 and 2009 to get a sense of why Jacoby was being treated so poorly by UZR. Above is a plot of the 6500 plays at Fenway Park in which the x and y coordinates of the hit location was recorded. In red, I've highlighted all plays that involved the center fielder (each of these plays included the CF actually fielding the ball, either before or after it hit the turf. If the CF dove and missed, that isn't recorded by gameday). In each of the two years, we can look at the distribution of hits and outs that were fielded by all centerfielders playing in Fenway.
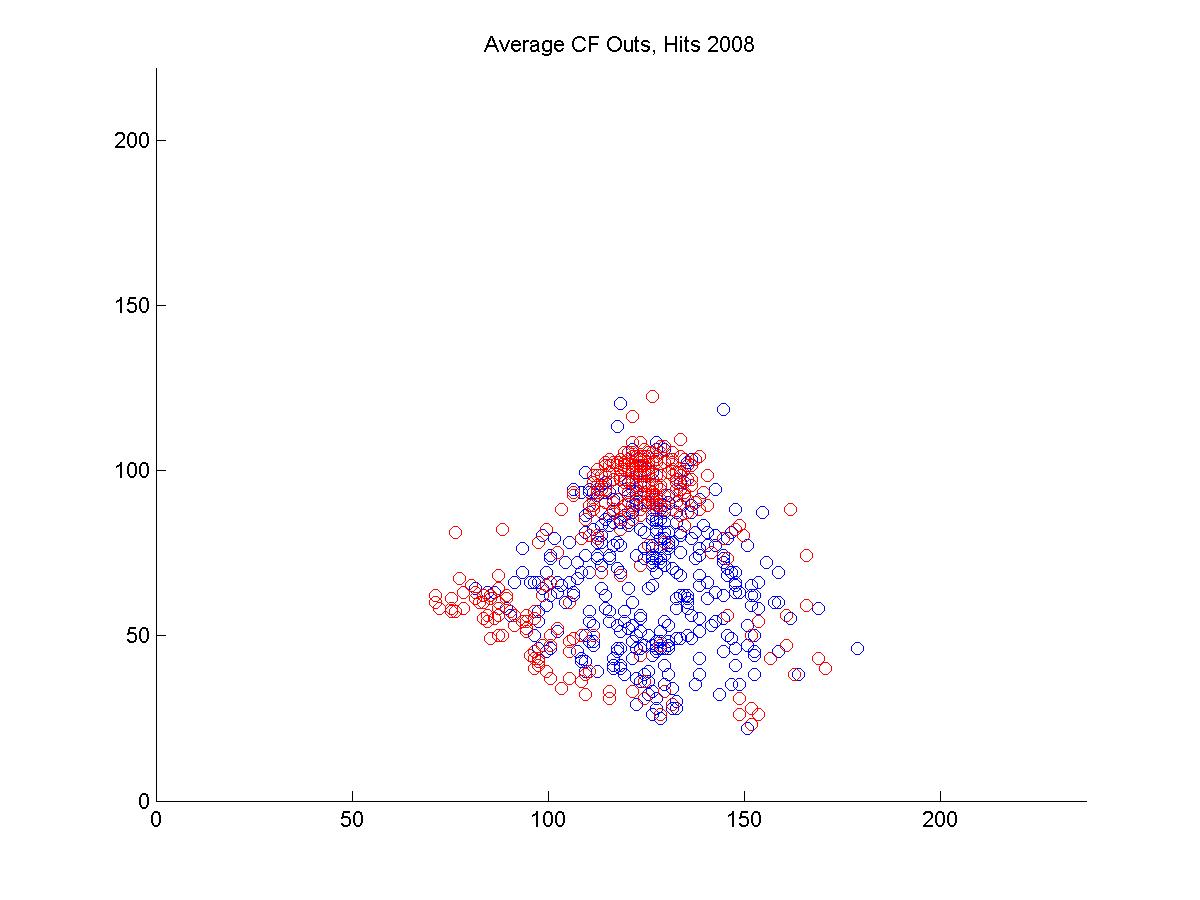
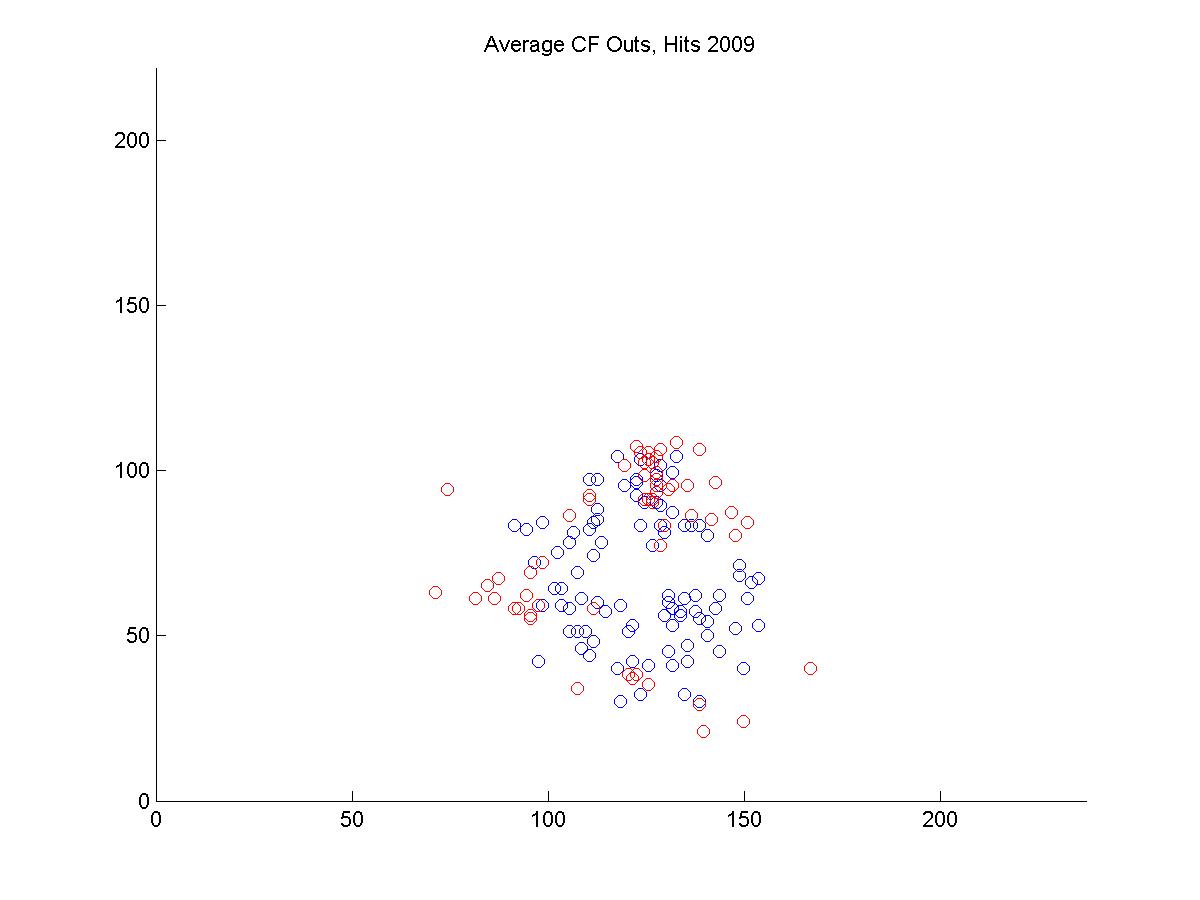
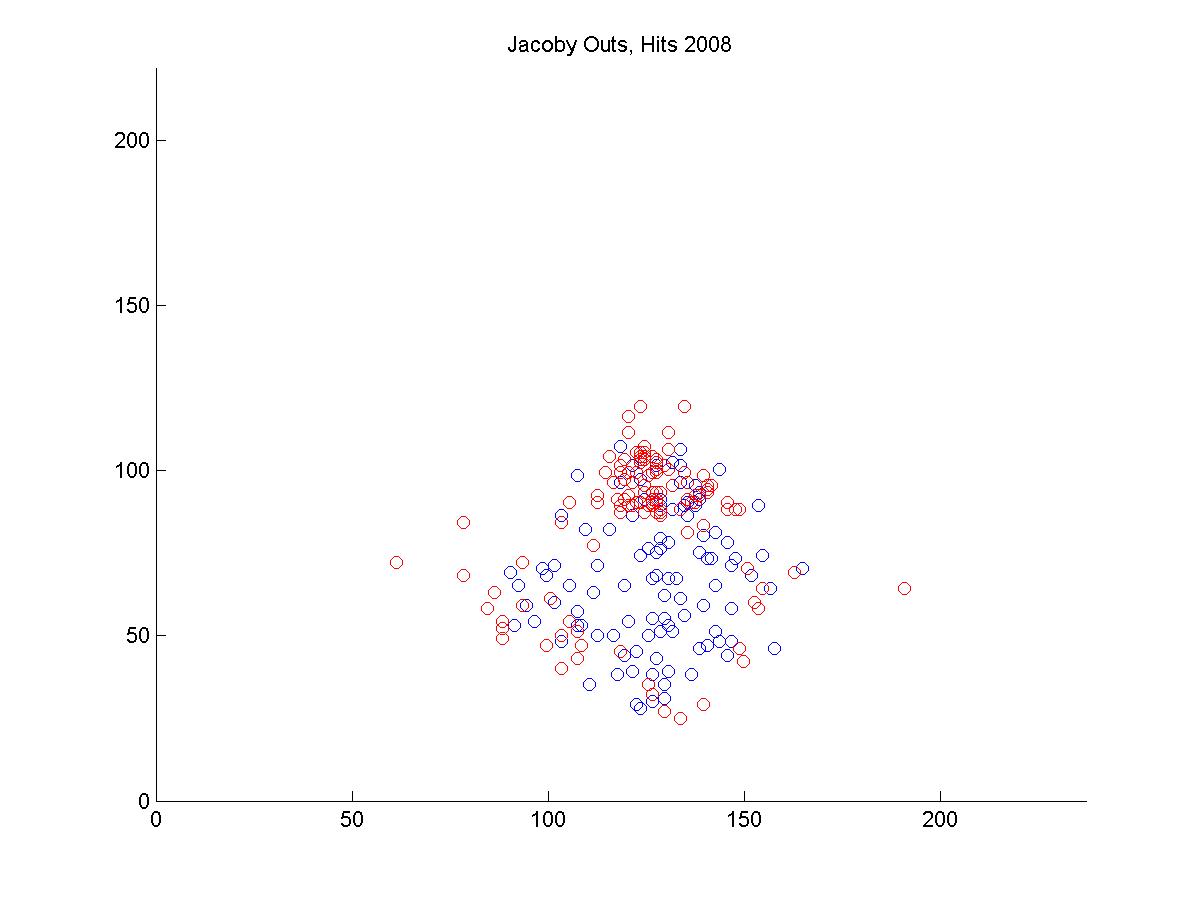
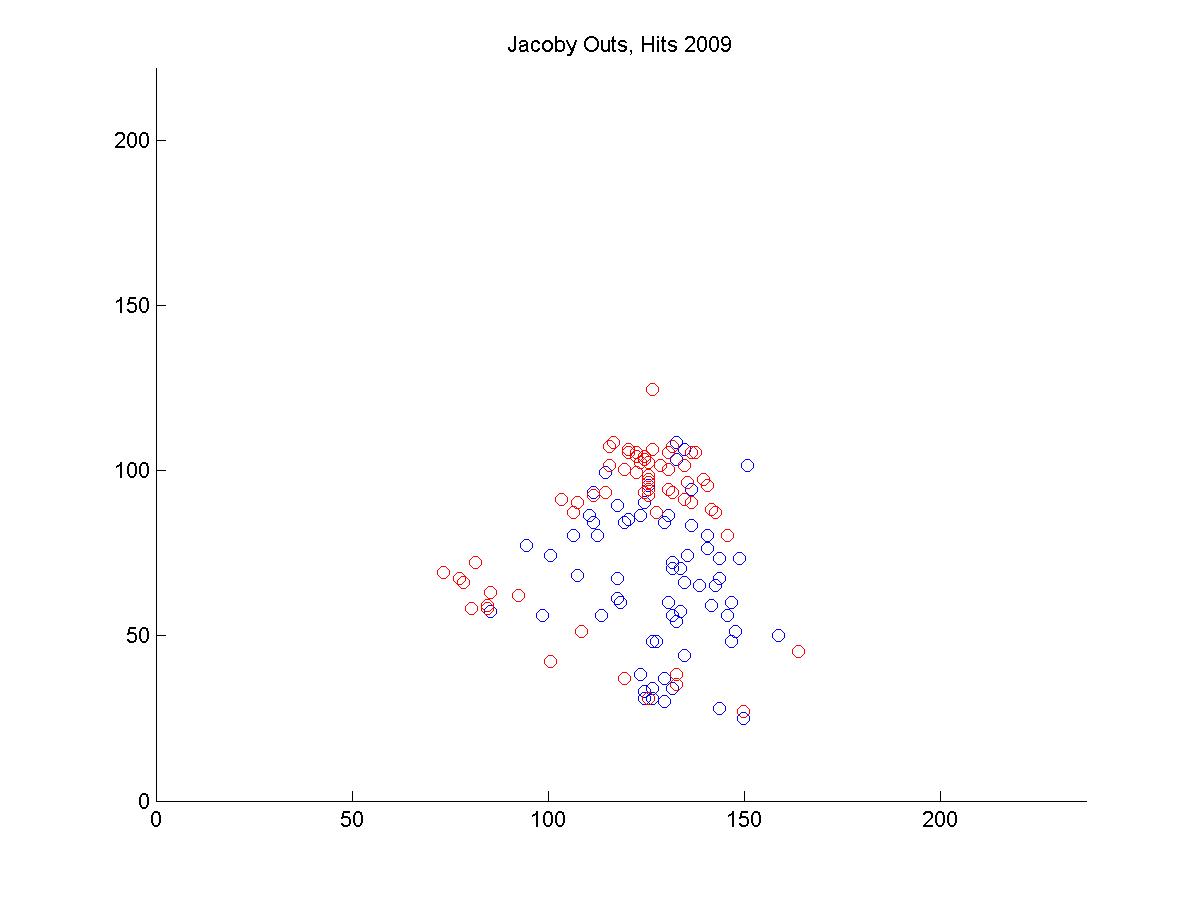
It's pretty hard to look to interpret these raw data, so I used a kernel density estimator to estimate the likelihood of each hit being turned into an out by either Ellsbury or the average CF playing in Fenway.
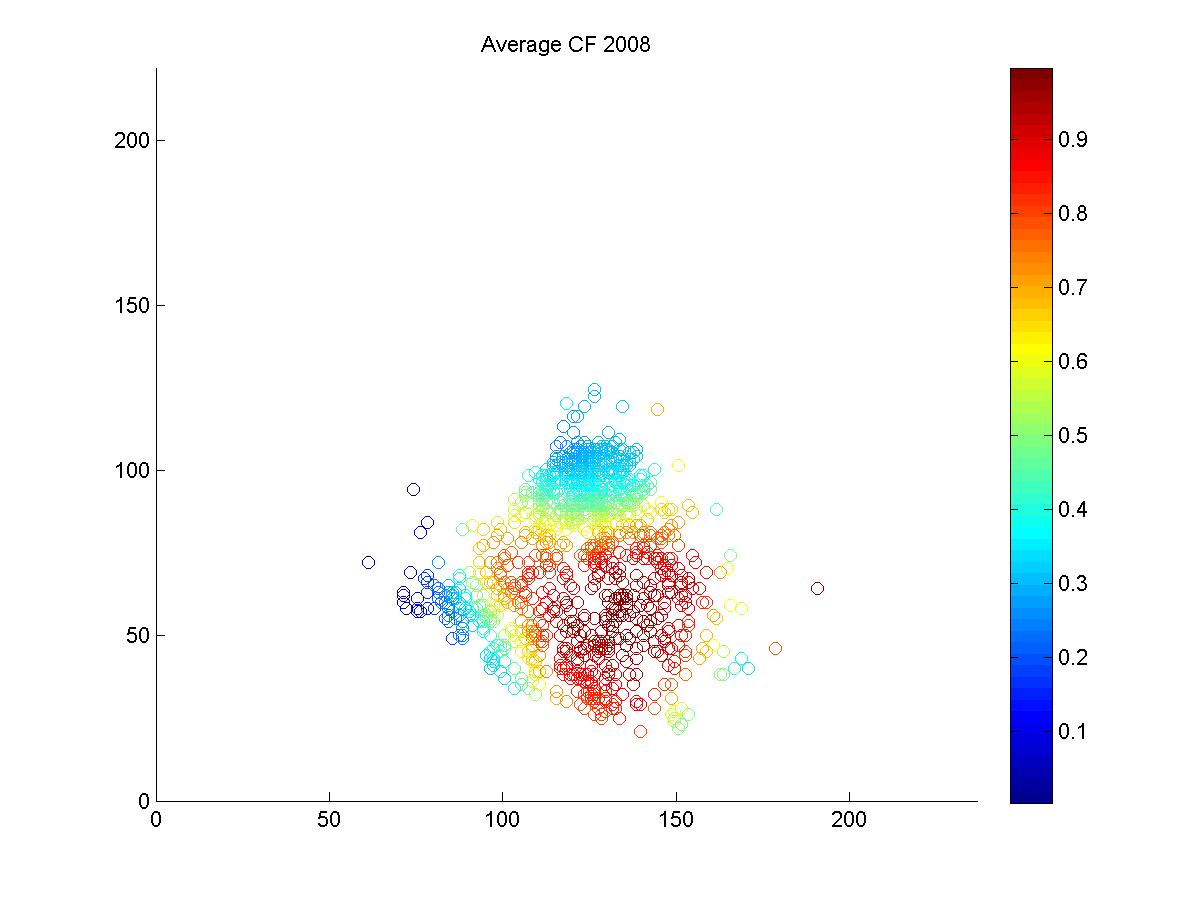
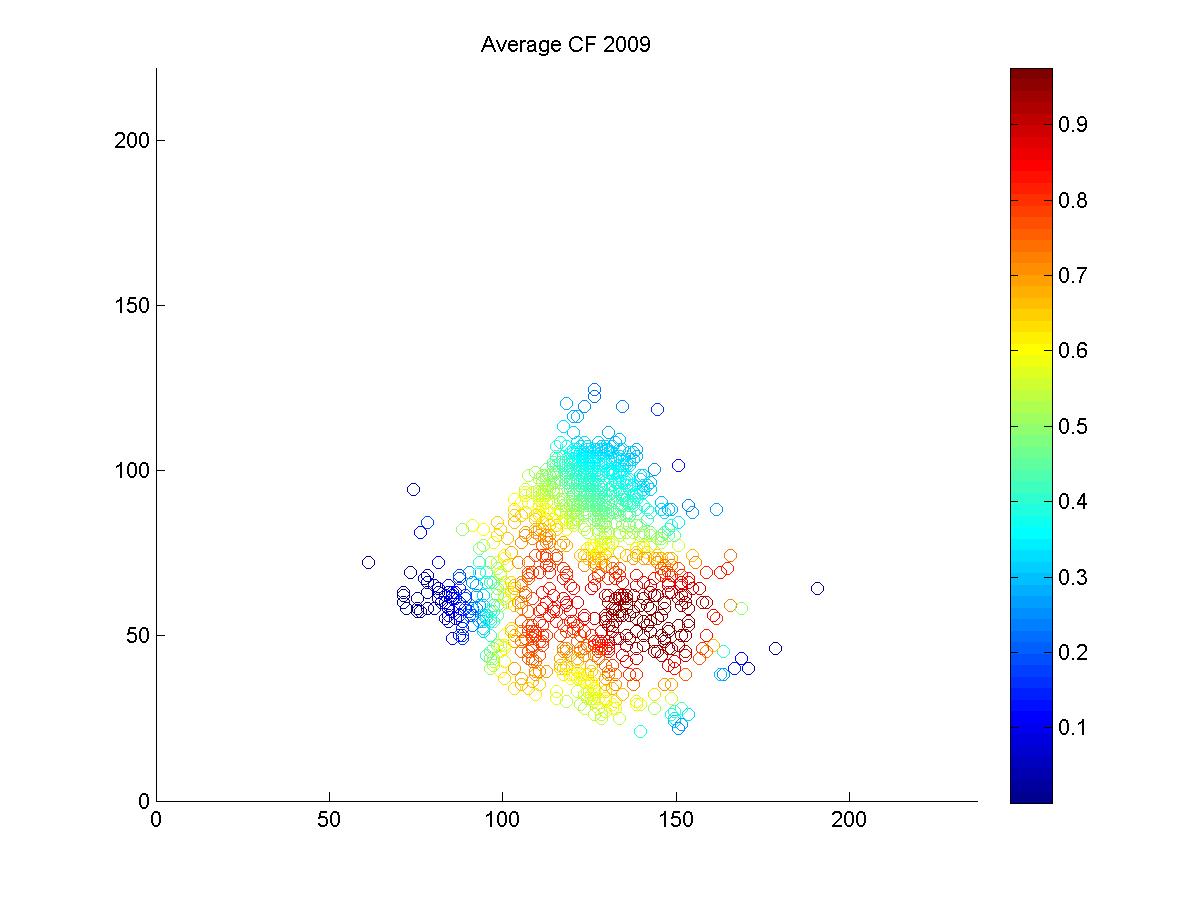
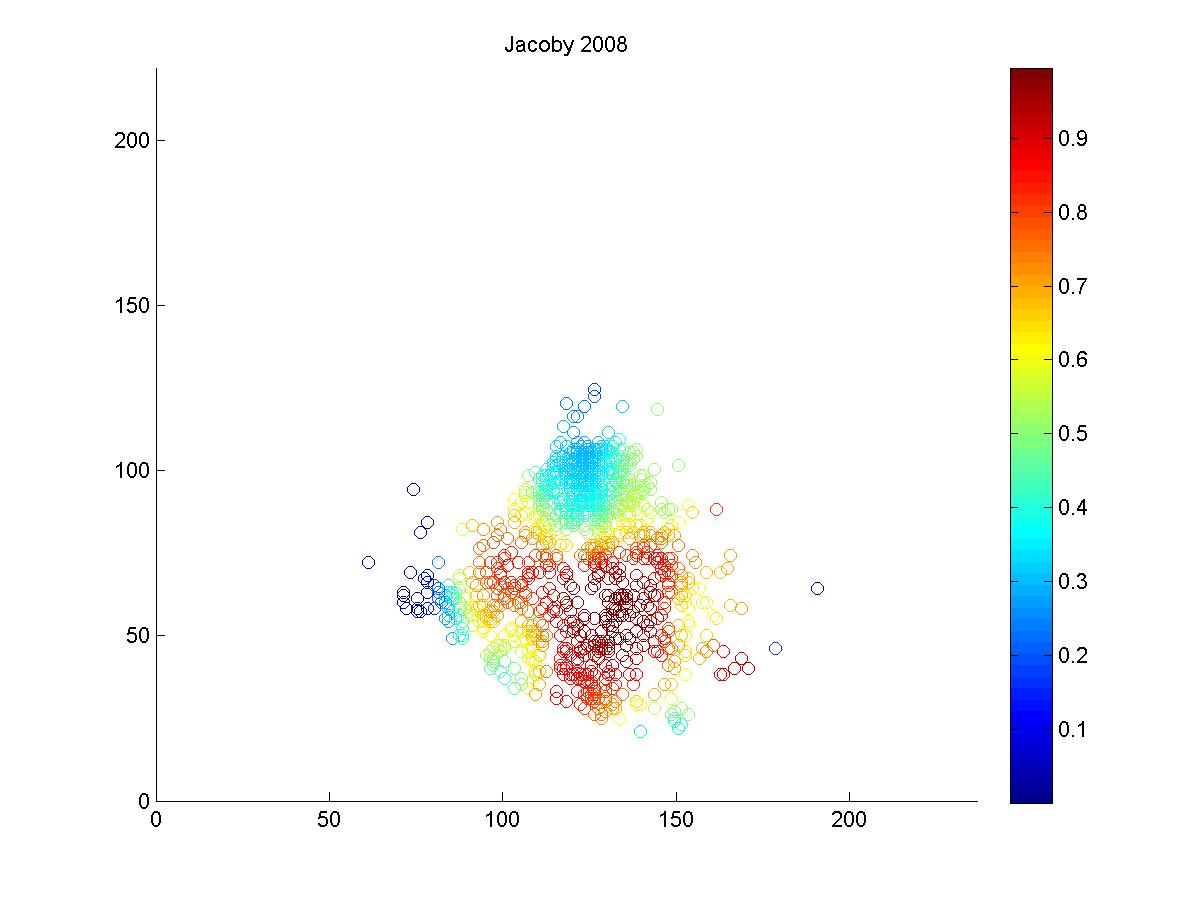
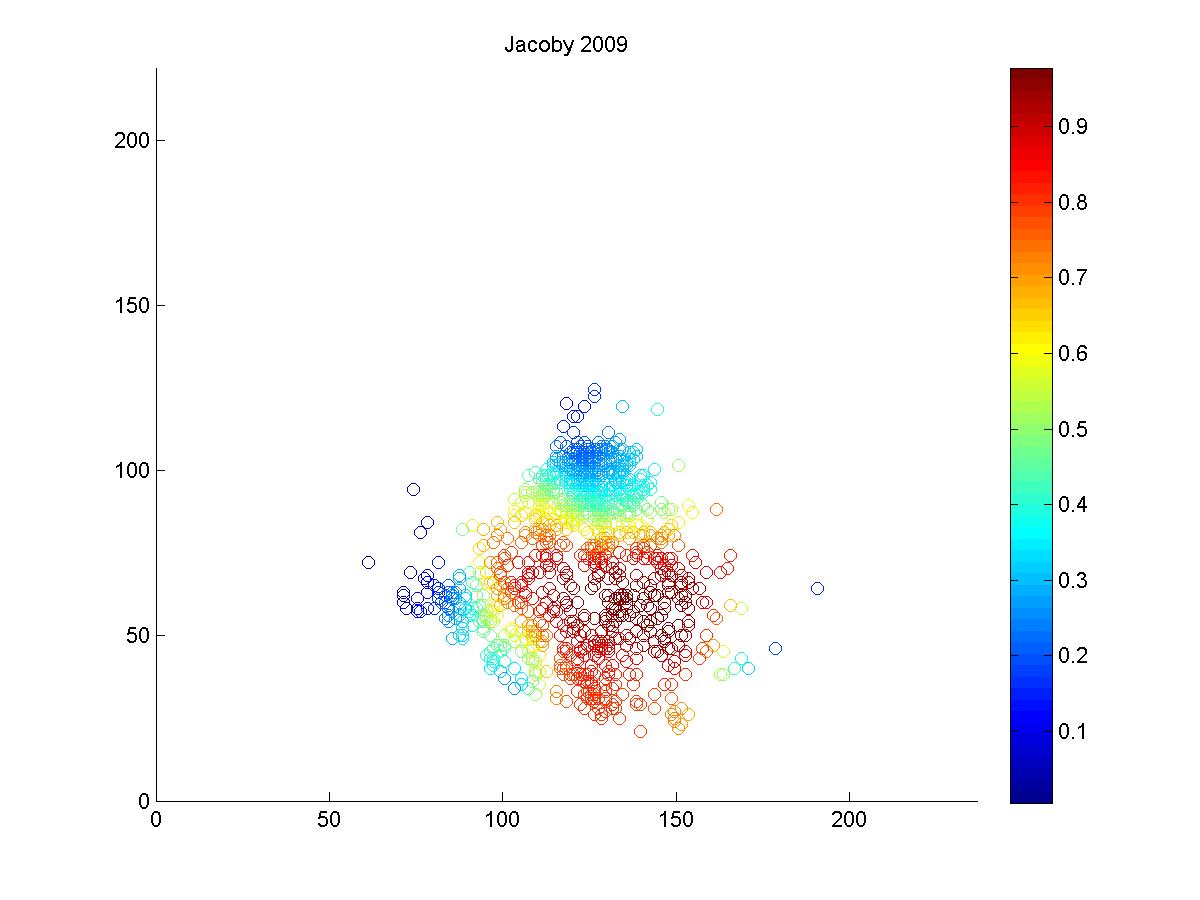
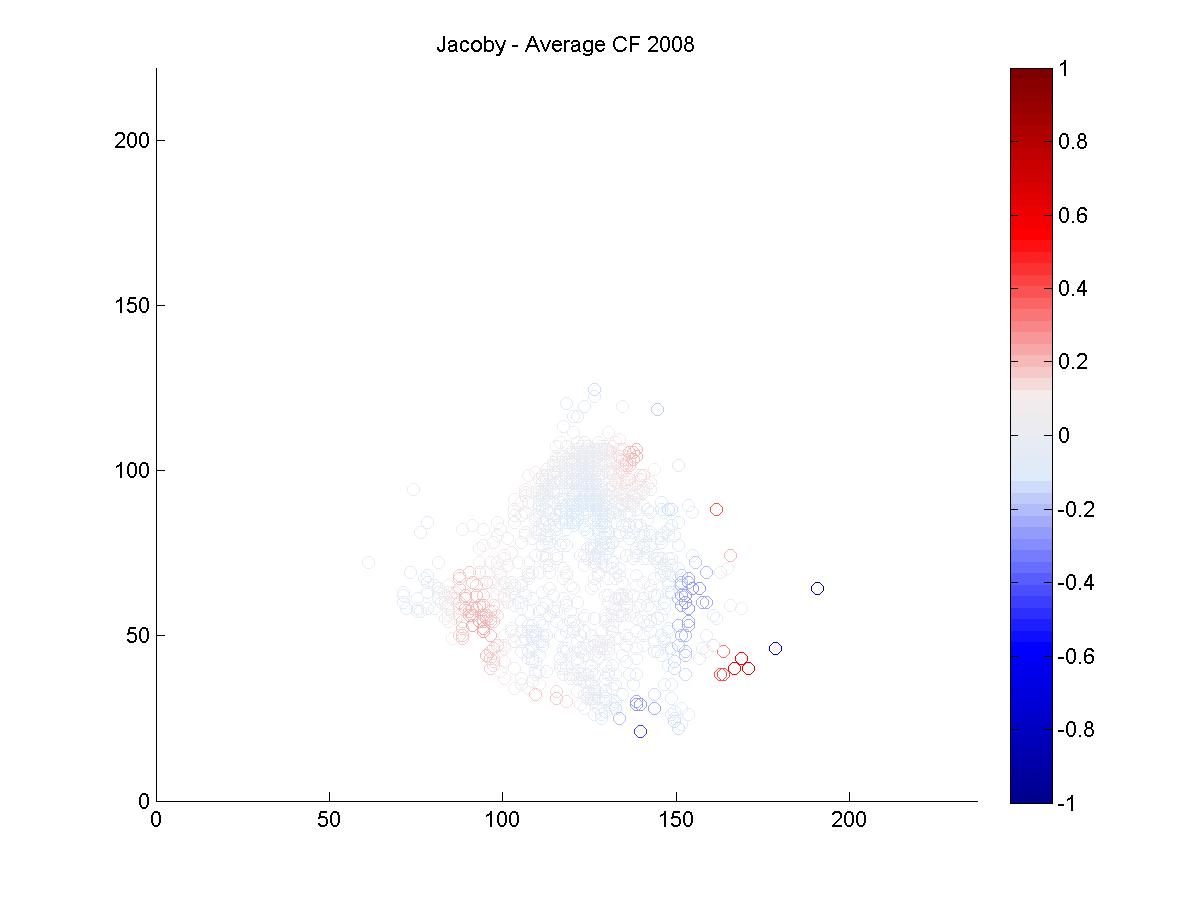
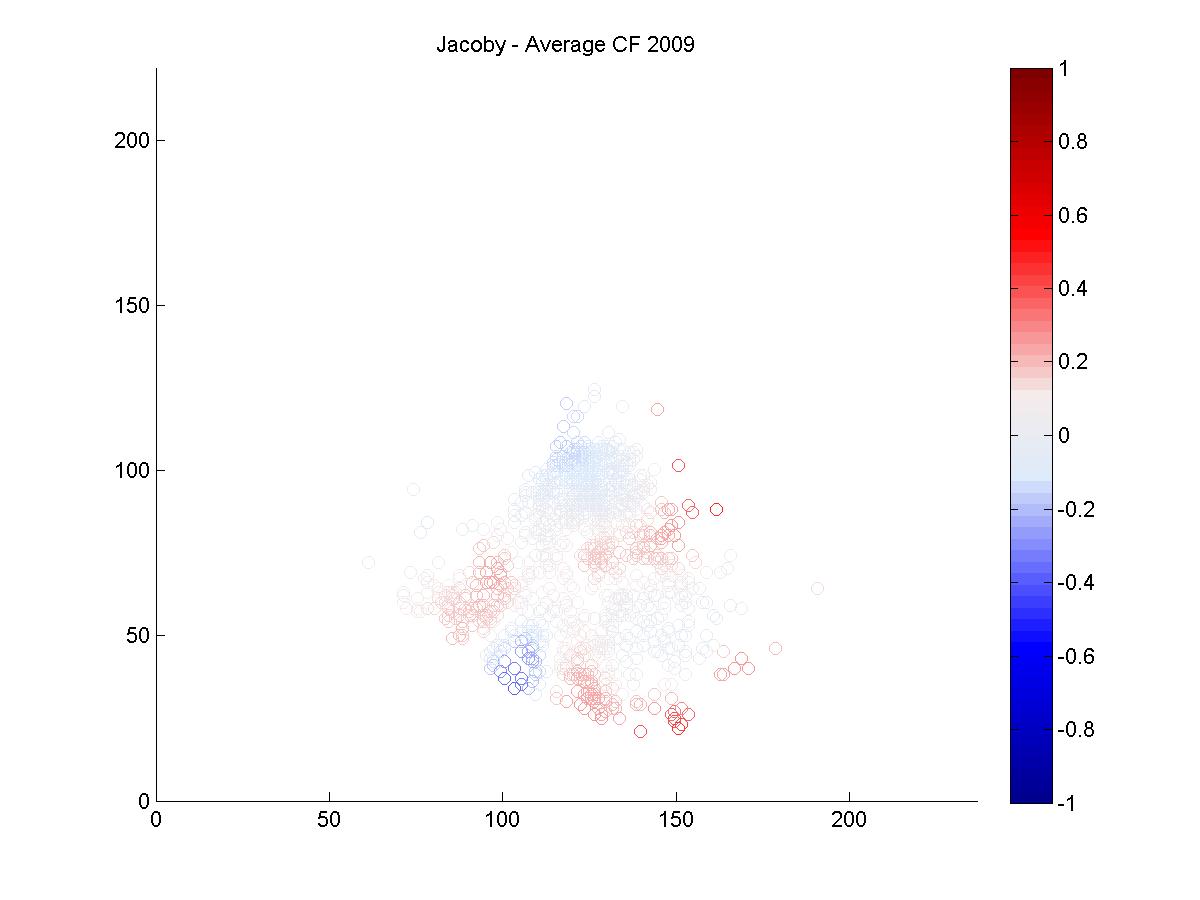
The blue circles in the scatter plots show hit locations from 2008 and 2009 that Ellsbury would have been less likely to have turned into outs; red circles show the locations Ellsbury would be more likely to turn into outs. Many of the circles are nearly white because there is no difference between Ellsbury and the average CF.
Gameday recorded a small minority of the actual hit locations, so it would be difficult to say anything conclusively even if there were strong patterns in the data (it's also unclear to me how many at-bats had zones recorded in the data that is used to calculate UZR. Retrosheet is missing hit locations for a vast majority of 2009 in Fenway). But it looks like Ellsbury didn't differ significantly from the average CF in 2008. In 2009, it looks like he may have been weaker at coming in on balls dropping in front of him, but there's no way to tell if that's pure noise. But what we absolutely don't see is the gaping hole you would expect to see in the range of the games worst centerfielder. Ellsbury seems to miss the plays that any CF would have missed, and seems to make the plays that any CF would have made. If I were a betting man, I would guess that Ellsbury's UZR will be league average next year.
| F/X Visualizations | December 18, 2009 |
The Pitchers of the Next 'Big Trade'
Last week I looked at the pitchers involved in the Winter Meetings's 'big trade,' and then this week an even bigger trade went down. The Blue Jays sent the Phillies Roy Halladay for a package of three prospects. The Phillies then turned around and sent Cliff Lee to the Mariners for slightly lesser group of three prospects. By now there has been extensive analysis of the trade, but the emerging consensus is: the Blue Jays needed to trade Halladay before he became a free agent after failing to do so last season; the Phillies took a slight hit to their farm system for an upgraded ace willing to sign a long-term deal rather than test the free agent waters; and the Mariners, looking to compete for the AL West title in 2010, picked up one of the game's best pitchers.
As I did last week, I am going to take a pitchf/x look at the major league pitchers in the deal. They are two of the best pitchers in baseball. Over the past two years they are two of just seven starters to post an ERA below three. They did so throwing 482 (Halladay) and 455 (Lee) innings, only CC Sabathia has thrown more over that period. They rank one and two in lowest BB/9 and one and three for the highest K/BB ratio over that period. Halladay adds the third leg to the stool, by also inducing over 50% GB per BIP, which makes him a little bit better than Lee. Still these are two of the best pitchers in the game. Additionally by limiting walks they are able to go deep in games, which helps their teams by reducing bullpen strain.
Roy Halladay
I have written two articles at FanGraphs looking at Halladay's pitchfx numbers. The first broke down his pitches to RHB and LHB. It showed that he has a very even pitch distribution, throwing one of three pitches -- two-seam fastball, cutter or curve -- often to both LHBs and RHBs.
+-------------------+------+------+
|                   | vRHB | vLHB |
+-------------------+------+------+
| Two-Seam Fastball | 0.34 | 0.31 |
| Cutter            | 0.39 | 0.43 |
| Curveball         | 0.26 | 0.20 |
| Changeup          | 0.01 | 0.06 |
+-------------------+------+------+
Batters cannot go up and expect one specific pitch over 60% of the time like they do with against some pitchers.
The second post showed that he uses his cutter and two-seam fastball to give him a pitch to go inside and outside against both LHBs and RHBs. His two-seam fastball used inside against RHBs and outside against LHBs, and his cutter is the opposite. This allows him to avoid the middle of the plate, while varying the location of his pitches -- inside and outside -- to both RHBs and LHBs.
This helps explain his strike outs and walks, but whence the grounders? The obvious place to look is pitch height. Here Halladay's pitches are in red and the average in gray.
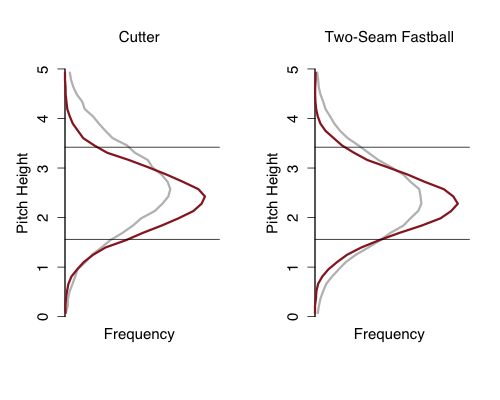
His cutter is much lower in the zone than the average cutter, probably leading to his great groundball rate. His two-seam fastball is not that much lower than average, rather much more often in the zone, further reason for his low walk rate.
Cliff Lee
Over the past two years -- since Lee really emerged as a dominant pitcher -- no pitcher has a had a more successful fastball, which is a surprising fact. Part of this is that no one is better than Lee at getting his pitches, and his fastball particularly, in the zone.
To look at this in a spatially explicit manner I broke the strike zone and area around in into a number of bins. I calculated the frequency of Lee's fastballs in each bin and than compared that to the frequency for the average lefty's fastaball. Bins in which Lee had a higher frequency than the average lefty were red and a lower frequency blue. The intensity of the color indicates the size of the difference. As always the images are from the catcher's perspective, so RHBs stand at -2 and LHBs at 2.
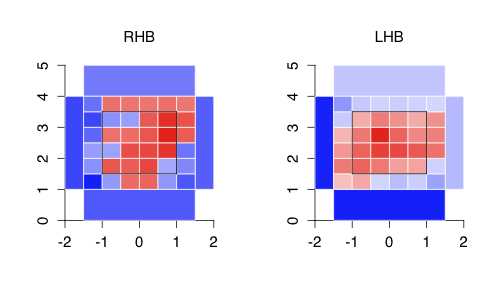
Against RHBs Lee locations his pitches more up and away than average, and as a whole more in the zone and just out of the zone than average. This is as expected. Against LHBs the pattern is even more extreme. In every strike zone bin he has a higher frequency than average, and is much lower in the farthest away from the zone bins.
Overall it was another exciting week. The Blue Jays cashed in on Halladay and to continue their rebuilding process. The Phillies got one of the best pitchers in the game, whose grounders should play very well in their small park and locked him up for years. And the Mariners picked a great pitcher, who as a lefty mitigates opposing LHBs's advantage at Safeco, as they look to compete in 2010.
| Change-Up | December 18, 2009 |
Boston Sports Journo Tries Hand at Logic, Irony Ensues
Cameron, while not as big a star as Lackey, is a top-tier defensive outfielder who has some power and can steal a base. General manager Theo Epstein did overdo it with the superlatives, saying, “He’ll get his 20 to 25 home runs every year, play outstanding defense, sees a lot of pitches at the plate. We just think he’s an underrated offensive player.”Well . . . no. He is not an underrated player. He is a guy who does hit 20-25 home runs a year, and who has a career .250 batting average and .340 on-base percentage. Offensively, he’s rated right where he should be: Average.
-Steve Buckley in the December 17 Boston Herald
You could force Steve Buckley to stare at that second paragraph for hours on end, just have him read it over and over, and the irony would not hit him. Yes, Mike Cameron has a career .250 batting average and yes he has a career .340 on-base percentage. If you choose not to take the time to understand more about his specific skill-set or you decide to ignore context, then sure, Cameron will look as though he's been an average offensive player to you. What's great about Buckley presenting those stats as his evidence that Cameron is average and not underrated is that it's precisely BECAUSE of those (and other) numbers that Cameron IS underrated.
Cameron's career OPS+ is 107, comfortably above average. 7 center fielders eclipsed the mark in 2009, 10 in 2008, 7 in 2007. wRC+ paints an even better picture, as it takes into account stolen bases and appropriately weights on-base versus slugging. His career 114 mark is better than Jermaine Dye, Johnny Damon or Joe Carter. Think Buckley would refer to any of those three as "average"?
Like his new teammate JD Drew, Cameron does not put the ball in play as often as most big league hitters. Since 1999, only Jim Thome has struck out more times. Over that same time period, however, Cameron ranks 21st in bases on balls, ahead of Damon, Carlos Beltran, Derrek Lee and Derek Jeter. Not bad at all, but also not the skill set that will grab the attention of the Steve Buckleys of the world.
Finally, Cameron has toiled for much of his career in Safeco and Petco and Shea, tough hitters parks all. Mike Cameron may turn out to be merely average in 2010. He is 37 now, after all. But with Buckley making the case simply by highlighting Cameron's career batting average and on base, I thought some additional context and reasoning were in order.
| Designated Hitter | December 17, 2009 |
100 Things Dodgers Fans Should Know & Do Before They Die
[Editor's note: In conjunction with Stan Opdyke's guest column on Connie Mack and Vin Scully, author Jon Weisman has granted us permission to publish "Vin," the number two item in 100 Things Dodgers Fans Should Know & Do Before They Die. As a lifelong Dodgers fan, Jon has listened to Scully broadcast games for four decades. In his wonderful book, he covers (among other topics) Vin, Jackie, 32, Fernandomania, Ebbets Field, The Move, Coliseum Carnival, Chavez Ravine, 'The Worst Club Ever to Win a World Series,' Walter Alston, Campy, Piazza, Dodger Dogs, Roseboro & Marichal, Arrive Late/Leave Early, Branch Rickey, Dodgertown, Nightline, The First High Five, and a section on Maury Wills that Weisman aptly named 'Go. Go. Go. Go. Go' after the chant that I can remember echoing throughout Dodger Stadium in 1962 when I was seven years old. This book is not only a must own for Dodgers fans but an entertaining and enjoyable read for baseball fans in general.]
He’s an artist. Of course he’s an artist. You don’t need a book to tell you that, to tell you that the man could broadcast paint drying and turn it into something worthy of Michelangelo, to tell you that his voice is a cozy quilt on a cold morning, a cool breeze on a blistering day; that he’s more than someone you listen to, that he’s someone you feel.
But saying he’s an artist is not meant as a cliché or as a convenient way to sum him up. It’s meant to stress that spoken words at a baseball game are themselves an art form, and, sure, sometimes they’re the equivalent of dogs playing poker, but when Vin Scully strings words together (and he’s done so at Dodger games — extemporaneously, mind you — for 25,000 hours or more), they’ll carry you away on wings.
If it weren’t so satisfying, it could make you weep.
 But it’s not as if Scully – and at this point, it’s hard to resist referring to him by his first name, so vital and personal is the Dodger fan’s relationship with him – sets out to construct pieces for the Smithsonian. His principal goal has always only to simply tell you what’s going on. He’ll never miss a pitch. He will make a mistake here and there, and in that respect he’s like everyone else on the planet. But he never, ever loses sight of his task.
He is prepared with background on the players and the teams he covers. He has a knack for sifting out what’s interesting about the men on the field, and an infectious childlike enthusiasm for what he discovers. Reflecting his desire not to leave any listeners or viewers in the dark, he’ll repeat stories on different nights of the same series, but as long as you know that’s part of the deal, there’s no issue.
“One of the biggest reasons that I prepare is because I don’t want to seem like a horse’s fanny, as if I’m talking about something I don’t know,” Scully said in an interview. “So in a sense you could say I prepare out of fear. That’s really what you do. I think I’ve always done that since grammar school.”
That may be equal parts humility and truth. Scully’s utter genius, however, is the way he reacts when the moment takes him beyond preparation, the way he offers the lyrical when other broadcasters remain stuck in the trite. He offers bon mots covering pedestrian occurrences: Who else could deliver baseball play-by-play’s timeless philosophical comment: “Andre Dawson has a bruised knee and is listed as day-to-day. … Aren’t we all?” His work during Sandy Koufax’s perfect game, Hank Aaron’s 715th home run, Bill Buckner’s error and everything in between are all unforced majesty.
As far as rising to the occasion, Scully’s landmark call of Kirk Gibson’s showstopping, history-making homer in Game 1 of the 1988 World Series was practically its equivalent from a broadcasting perspective, minus the gimpiness. “In a year that has been so improbable, the impossible has happened” ranks with Al Michaels’ “Do you believe in miracles? Yes!” among the most memorable lines in sportscasting history for spontaneously summing up a moment. And yet, could anyone have been less surprised that Scully came up with such a wonderful remark? His broadcasts have been dotted with them ever since he joined the Brooklyn Dodger broadcast team in 1950 as a recent Fordham college graduate who had been singularly dreaming of such a job since boyhood.
“When I was 8 years old, I wrote a composition for the nuns saying I wanted to be a sports announcer,” Scully said. “That would mean nothing today – everybody watches TV and radio – but in those days, back in New York the only thing we really had was college football on Saturday afternoons on the radio. Where the boys in grammar school wanted to be policemen and firemen and the girls wanted to be ballet dancers and nurses, here’s this kid saying, ‘I want to be a sports announcer.’ I mean it was really out of the blue.
“The big reason was that I was intoxicated by the roar of the crowd coming out of the radio. And after that one thing led to another, and I eventually got the job as third announcer in Brooklyn. And I never thought about anything except the first year or two not making some terrible mistake is all. I worked alongside two wonderful men in Red Barber and Connie Desmond, but I never thought about becoming great. … All I wanted to do was do the game as best I could. And to this day that’s all I think about.”
Lots of people try to do their best, and for that they all deserve praise. But the best of some is better than the best of others, and even though he can’t bring himself to say it, we know into which of those categories Scully fits. Regardless of how intense or carefree one’s love for the game might be, Scully measures up to it and redoubles it. The Dodgers’ play-by-play man is an American Master.
Jon Weisman is the founder and writer of the Los Angeles Times blog Dodger Thoughts, the leading website providing commentary on the Los Angeles Dodgers. For more than 20 years, he has written for the Los Angeles Times, Los Angeles Daily News, SportsIllustrated.com, The Hardball Times, and other publications about baseball and virtually every other high school, college and professional sport. He has also written live-action and animation television scripts for shows including So Weird, W.I.T.C.H., Starship Troopers, Men in Black, and Disney's Hercules, and is currently Associate Editor, Features for Variety. A holder of degrees from Stanford and Georgetown, Weisman lives in Los Angeles with his wife and three children.
| Designated Hitter | December 17, 2009 |
Connie Mack and Vin Scully
At an inconsequential Spring Training game in Florida in 1950 the torch was passed. In the broadcast booth for the Brooklyn Dodgers was a nervous youngster who at the ripe old age of 22 was about to begin his big league broadcasting career. On the field below him was a very old man who was about to begin his final year in major league baseball. The old man stepped down as manager of the Philadelphia A's after that season. Sixty years later, the young man in the broadcast booth is still the broadcaster for the Dodgers.
The major league careers of Connie Mack and Vin Scully intersected at the midpoint of the 20th century. Connie Mack was born Cornelius Alexander McGillicuddy in 1862, before the Emancipation Proclamation was issued, at a time when Abraham Lincoln was President and America was engaged in the Civil War. Today, Vin Scully is broadcasting for the Los Angeles Dodgers at a time when a black man is President.
Connie Mack began his major league career in 1886 as a catcher for the Washington Senators of the National League. He played with the Senators for four seasons. In 1890, Connie, along with many of his fellow players, bolted the National League to form the Players League. Unfortunately for Connie and his fellow players, the Players League folded after just one season.
In 1891, after the demise of the Players League, National League owners assigned Connie's contract to Pittsburgh. During the 1894 season Connie took over as playing manager for the Pirates. After a poor finish in 1896, Connie was fired by the Pittsburgh owner.
Connie's dismissal proved to be a blessing. In 1897, Connie left the National League to join Ban Johnson's Western League as a manager, part-time player, and part owner of the Milwaukee franchise. When Johnson transformed his Western League into the American League at the turn of the century, Connie Mack was poised to resume his major league career, this time as a manager and an owner.
In 1901, Ban Johnson sent Connie to Philadelphia to establish an American League franchise in that city. Connie built a strong team and in 1905 his Philadelphia Athletics played and lost in the World Series to John McGraw's New York Giants. Connie's teams remained powerful through the 1914 season. When the A's lost the 1914 World Series to Boston's "Miracle Braves," Connie jettisoned the team he had developed, much like the Florida Marlins would do after the 1997 World Series. Like the Marlins, the Philadelphia A's sank to the bottom of the standings.
In the mid-1920s, Connie began building a team to rival the accomplishments of his earlier championship A's teams. In the latter part of the roaring 20s and the early years of the Great Depression, Connie's A's defeated powerful New York Yankee teams that featured Babe Ruth and Lou Gehrig. The Great Depression led Connie to dismantle his team. Once more, the Philadelphia A's went to the bottom of the American League standings.
Connie was unable to build another championship team; the A's did not win another World Series title until the franchise shifted to Oakland. Connie Mack remained as manager of the Philadelphia A's throughout all the last place finishes the franchise endured. No doubt Connie's ownership of the team saved him from the fate that inevitably befalls managers of losing franchises.
Age and infirmity caused Connie to step down as manager after the 1950 season. Shortly thereafter, amid rising debt, the Mack family lost control of the franchise. The team relocated to Kansas City after the 1954 season.
As Connie Mack's career was coming to a close, Vin Scully began an amazing broadcasting career that is still in progress today. Vin attended college at Fordham and worked on the campus FM radio station. After graduation, in search of a broadcasting job, Vin sent his resume to radio stations both near and far from his New York home. Vin's letter writing bore fruit; he was hired as a temporary summer replacement announcer at WTOP in Washington, DC, the same city where Connie Mack made his big league debut in 1886.
Vin has said that going from a college FM station to an on-air job with the CBS affiliate in the Nation's Capitol was like going from the campus to the big leagues. Vin's stay in the big league atmosphere of WTOP was short lived; the management at WTOP told him that though they liked his work, they had no permanent job for him. Vin left Washington with vague promises of possible future employment at WTOP, but when he returned to his New York home he had no broadcasting job.
Vin's career took off after a meeting with Red Barber, who would become his mentor. Red hired Vin for a radio broadcast of a college football game in Boston for the CBS football roundup show. In a 1982 radio interview, Barber told Larry King about the circumstances that led to Vin being hired by the Dodgers (thanks to Jon Weisman for permission to quote from his transcription):
I was out at the end of the football season, doing a California-Stanford football game. And at halftime, the engineer handed me a note and said, "Ernie Harwell has joined Russ Hodges at the Polo Grounds. So flying back to New York, I kept thinking, "Who are we gonna get? Who are we gonna get for the third man?" Then I said, "That red-headed fellow that went up to Boston did a good job." So I sent for him, and talked to him for a bit. And then I said, "Would you be interested?"Well, his eyes got as big as teacups. So I said, "You'll have to talk to Mr. Rickey." Well, in about an hour Mr. Rickey called back, and he said, "Walter"—he always called me Walter—"Walter, you've found the right man."
I cannot imagine any baseball fan who would dispute Mr. Rickey's assessment. Red Barber and Branch Rickey provided Vin with his initial opportunity, but the youngster had to make the most of it. Vin reported to Spring Training in 1950 with as much pressure to make good as any big league player looking to earn a job.
A few years ago in a 2006 interview on a Seattle Mariners pregame radio show, Vin was asked by Mariner broadcaster Rick Rizzs to recall his first broadcast for the Brooklyn Dodgers. Vin responded:
Well, I think the very first one was an exhibition game and we were playing the Philadelphia Athletics and the manager that year was Connie Mack. Now the next year Jimmy Dykes became the official manager but my first broadcast was with the A's in Vero Beach with Mr. Mack right there in the black suit, and the celluloid collar, and the straw hat. So, I remember in that game I think Ferris Fain was the first baseman and it seems to me there was a triple play which Red Barber called and I remember sitting there thinking, "He made it sound so easy," and I was scared to death.
Vin's career after that Spring Training game has made him an eye witness to some of the most memorable moments in baseball history. Vin was in the same radio booth as Red Barber when Red had the unfortunate duty to describe Bobby Thompson's home run in the third game of the 1951 National League playoffs. Vin was on the air for a much more joyous occasion, the final out of the 1955 World Series that brought Brooklyn its only world championship. A year later, Vin, along with Mel Allen, broadcast Don Larsen's World Series perfect game. On September 29, 1957, Vin was at Philadelphia's Connie Mack Stadium to broadcast the last game in the franchise history of the Brooklyn Dodgers. In 1958, he broadcast the first game played by the Los Angeles Dodgers. Vin also brilliantly called the last inning of Sandy Koufax' perfect game in 1965, a call that can be heard here thanks to Rob McMillin. He was in Atlanta in 1974 for the radio call of Hank Aaron's historic 715th career home run. In 1986, he was on national television at the World Series to call a little ground ball that went through Bill Buckner's legs. In 1988, he was at Dodger Stadium to make a memorable call ("In a year that has been so improbable, the impossible has happened") of Kirk Gibson's dramatic pinch hit World Series home run.
On the radio show where he reminisced about his first big league broadcast, Vin was asked, "Vinnie, how long do you want to do this?" Vin's answer was, "I don't know, but I can tell you a favorite expression of mine: If you want to see God smile, tell Him your plans."
After 60 years in the broadcast booth, Vin is nearing the end of his extraordinary broadcasting career. When Vin is in his final year, whenever that may be, I hope that some youngster will be in the first year of a six-decade long baseball career. If that happens, and if that person is a worthy successor to Connie Mack and Vin Scully, more than 60 years from now a postscript to this story can be written.
Stan Opdyke was a Dodgers fan as a kid during the Sandy Koufax, Don Drysdale, and Maury Wills era. His biggest baseball thrill was watching Koufax pitch the Dodgers to the National League pennant on the last day of the season at Connie Mack Stadium in 1966. He also got Vin Scully's autograph at Connie Mack Stadium in the mid-1960s. Vin was standing in the dugout before the game, and he called out his name and asked him to sign his autograph book. Scully graciously did. Meanwhile, the other kids looked at him like he was nuts. Why would he want an autograph of someone who looked and dressed like their father?
| Change-Up | December 16, 2009 |
Getting Defensive
“We talked about this a lot at the end of the year, that we’re kind of in a bridge period,’’ he said. “We still think that if we push some of the right buttons, we can be competitive at the very highest levels for the next two years. But we don’t want to compromise too much of the future for that competitiveness during the bridge period, but we all don’t want to sacrifice our competitiveness during the bridge just for the future. So we’re just trying to balance both those issues.’’
-Theo Epstein, as excerpted in Amalie Benjamin's December 9th Boston Globe report
John Henry and Theo Epstein are preparing you for the Big Slide. While they continue to raise ticket prices and drain every dollar out of Fenway, they are telling you to put your expectations on the shelf. No more “championship-driven’’ campaign for your Red Sox. The Sox are building a “bridge’’ for the future. They are giving up on competing with those big, bad Yankees.
-Dan Shaughnessy, December 10th Globe column
The Sox still need a couple of bats. They still need one or two guys like Jason Bay, Matt Holliday, Adrian Gonzalez, or Miguel Cabrera. But Boston’s loyal fans should be happy that the Sox are spending money and going for Lackey. It demonstrates that the brass is still trying to compete with the Yankees, still willing to commit big dollars in the quest for a championship.
Boston was due for a good old-fashioned Red Sox media sh*tstorm. After all, things have been pretty quiet over years around here. What is there to say about a team that has qualified for the playoffs in six of the past seven seasons, including two World Series titles and two ALCS Game 7 losses? There are only so many times the fan base can bitch about J.D. Drew when the team they're rooting for is winning 60% of the time. But, you know, Theo Epstein had the audacity to use the word "bridge" and if you think Dan Shaughnessy was going to show any sort of restraint or understanding or maturity or sobriety in handling that remark, well, you're not a Boston sports journalism enthusiast.
If you read the first quote above, it's pretty evident what Theo was saying. The Red Sox front office is really excited over their low-minors talent and, according to John Sickels, with good reason. Having graduated Jon Lester, Clay Buchholz, Jonathan Papelbon, Dustin Pedroia, Jacoby Ellsbury, Daniel Bard and others over the last few seasons, the high-minors cupboard, understandably, is looking somewhat bare. This means that the Red Sox need to be thoughtful about how they operate as they look to link up their current core to the 2011 and 2012 ETA's.
Maybe he could have worded Boston's situation differently or better anticipated the backlash that might ensue from the word "bridge" (really, you can't imagine how up in arms folks here were over the comment), but all Epstein said was that he would not compromise the Red Sox bright future for short-term gains. There would be no ridiculous package being sent away for Roy Halladay, no long-term free agent signing that might hamper the team down the road and/or block a better, cheaper option that might emerge in 2011 or 2012. While Shaughnessy might prefer a press conference jointly announcing the additions of Matt Holliday, Jason Bay, Adrian Gonzalez, Lackey, Cameron, Halladay, Jim Rice, Nick Esasky and a new book deal for a certain curly haired Boston scribe, as a fan, I'm thankful for Epstein's approach.
With regard to the third quote listed above, let's leave aside for a moment that Shaughnessy convinced himself that Boston's brass succumbed to pressure he applied in the December 10th column. Rather, let's focus on his assertion that, even after the additions of Lackey and Cameron, Boston needs "one or two guys like Jason Bay, Matt Holliday, Adrian Gonzalez, or Miguel Cabrera." The specific contention is obviously nuts - that a team that won 95 games last year and just added two very good baseball players NEEDS two of the 20 best hitters in the game - but I think a more tempered iteration might go something like this; "Who's gonna hit for this team?". It's a fair question.
Offensively, replacing Bay with Mike Cameron will hurt. Bay hit .274/.380/.534 as a Red Sox, while Cameron turns 37 soon and has managed a .350 on-base just once in the last eight seasons. Mike Lowell hit .290/.337/.474 in 2009, a batting line his replacement in the 2010 Red Sox lineup at this point, Casey Kotchman, will in all likelihood struggle to match. Kevin Youkilis will be 31 and is coming off of a career year. Will Drew be able to play 137 games again? You get the picture. There are some questions surrounding the Red Sox offense.
There also is some good news. Marco Scutaro, however much regression you factor in for him coming off of a career year in 2009, will serve as an upgrade at shortstop. In 2009, Red Sox shortstops combined to hit just .235/.297/.358. In addition, Victor Martinez will play a full season in a Red Sox uniform. Most of that time will be behind the plate, but the Red Sox also have a nifty little platoon option at their disposal. Jason Varitek, who OPS'd .807 against southpaws last year, could move Victor to first base against lefties, spell Kotchman and give Martinez a break from behind the dish. Thankfully, CHONE projects significant improvement for David Ortiz.
Losing Bay is a big hit, so you net it all out and I think we can expect some regression for the Red Sox offense. The question is, does it matter? Wins are wins, and if you can make up for a spotty offense with top-notch pitching and defense, maybe you can keep enough runs off the board to grade out as a better overall team. So let's look at the run prevention side of the ledger for the Red Sox.
In looking at the offense, we started with swapping Bay out for Cameron so we'll start there defensively, too. As David Cameron's prescient analysis pointed out, the gap in their defensive ability makes up for Bay's significant edge at the plate. If UZR is to be trusted, the Red Sox could be looking at a 20-run defensive improvement simply by playing Cameron instead of Bay. Cameron's been one of the best outfielders in the game over the last decade. Bay is one of baseball's very worst.
Elsewhere on the defensive side, Mike Lowell and Jacoby Ellsbury showed as two of the worst defensive players in baseball last season. Kevin Youkilis should be an upgrade over Lowell while Ellsbury, whether he is in left field or center, figures to improve considerably. There seems to be a consensus out there that his 2009 defensive performance was anomalous. Even if the Red Sox decided not to make one change on their pitching staff, by virtue of defensive improvements alone, I think the Red Sox might have made up for their lost offensive output.
But of course the Red Sox HAVE made changes to the pitching staff. Cliff Corcoran summed it up nicely in his recent piece for SI.com:
The Red Sox rotation behind Jon Lester and Josh Beckett struggled mightily in 2009. In the 98 games not started by Lester or Beckett this past season, Red Sox starters went 36-36 with a 5.40 ERA, and 1.57 WHIP. With Clay Buchholz having emerged as a legitimate mid-rotation starter in August and Daisuke Matsuzaka having made a strong comeback in mid-September, the Red Sox already had hope for improvement in their rotation heading into 2010, but the addition of Lackey, easily the best starting pitcher in a weak free agent market, ramps that improvement up from modest to drastic.
If you want a model for how the Red Sox can succeed without "one or two guys like Jason Bay, Matt Holliday, Adrian Gonzalez, or Miguel Cabrera", just look to 2007. Listed below are where the Red Sox ranked in 2007 and 2009 in a bunch of different offensive and defensive categories.
      RS  OPS+  RA  ERA+  DER  BABIP  UZR
2007   3   3     1    1    1     2     4
2009   3   3     3    3   13    14     7
*DER is Defensive Efficiency Rating, BABIP is batting average on balls in play, UZR is ultimate zone rating.
With their pitching and defense improvements, the Red Sox look like the 2007 run prevention unit once again. Fans waiting for the other shoe to drop in the form of a deal for Adrian Gonzalez might be disappointed, but the Red Sox could wrap for the off-season, take this team to Fort Myers and have every reason to believe they will once again be in the thick of things. If their offense can hold somewhat steady from 2009 to 2010, the pitching and defense improvements should be more than enough to help them blow right through their annual goal of 95 wins.
| Behind the Scoreboard | December 14, 2009 |
Wins Above Replacement vs. Salaries in 2009
A couple of weeks ago, I did an analysis of the the wins provided per dollar in Major League Baseball for free agent eligible players, arbitration eligible players, and players under team control. I did this using a regression using Rally's WAR data as well as salary data from the Lahman database. After a rousing and lengthy discussion over at the Book Blog over the dollar per win value of free agent eligible players (defined as any player with 6 or more years of service), my 2008 estimate of about $6 million dollars per win, was shown to be a bit higher than the commonly held $4.5 million mark that is usually used. However, since Rally gives out fewer WAR than Fangraphs, this was cited as one possible reason for the difference. Additionally, the fact that I estimated service time and the fact that contracts could be backloaded were other potential sources of bias.
For the 2009 season, I took different data, this time using contract data from Cot's Contracts and getting the WAR data from Fangraphs. Cot's data lists the deal the player is currently in, including the length of the contract as well as the overall contract value. Cot's Contracts also gives the exact service time for the 2009 season. Wins Above Replacement was gleaned from Fangraphs, since it is the mostly widely used form of WAR.
Here I look at only at players with over 6 years of MLB service to try to determine this same fact for 2009. To account for contracts potentially being backloaded or frontloaded, I used the average yearly salary over the life of the contract, rather than the actual salary given to the player in 2009. Another data caveat was that I threw out all players who had signed contracts before they were actually free agents. Since their average salary would include years when they were only arbitration-eligible, simply using the average salary of these players would be artificially low. Additionally, these players were never eligible on the open market, so they are not really in the population we are interested in.
Running the regression on this data set I expected to find a dollar per win value around $5 million or so. What I found was vastly different. The equation for the number of WAR expected to be gained for each million dollars spent is below:
WAR = .216 + .138*(Salary)
This translates to a whopping $7.25 million per win spent on free agents in 2009. This means that a free agent with a $20 million average contract would be expected to produce only 3 WAR while a player with a $2 million average contract would be expected to produce 0.5 WAR. This seems surprising, but the data points seem to back up the analysis as you can see below.
There is an argument to be made that the intercept should be locked in to zero to represent the fact that a player earning zero dollars should be expected to produce zero WAR. This is also reasonable, and here I do the same equation fitting the regression with no intercept.
WAR = .156*(Salary)
While this brings down the dollars per win value slightly, it still translates to $6.4 million per win, far higher than the common $4.5 million figure.
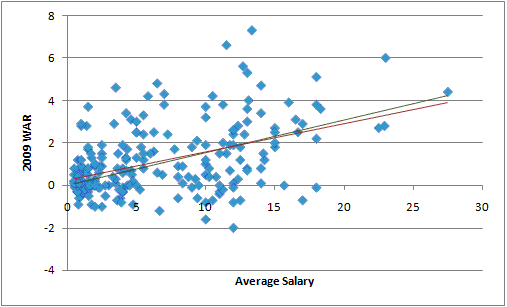
Perhaps the relationship between dollars and wins would show more strongly if other factors were accounted for. For instance, someone in the first year of a long term contract will probably be expected to produce more WAR than someone in the last year of a long term contract, even at the same salary. Here I tried accounting for average salary as well as the length of the contract and how many years into the contract the player was. I also included an interaction term of salary*length to account for the fact that the salary-to-WAR slope might be different for longer contract lengths.
I came up with this model:
WAR = .456 + .118*(Salary) + .029*(Length of Contract) - .171*(Year of Contract) + .005*(Salary)*(Length)
Unfortunately, while the theory may have been good, the data didn't back it up. With the exception of average salary, none of the terms in the model were significant. The p-value for the Year of Contract variable was the closest to being significant at .16. Paring down the model or adding other interactions were also futile, and as a result, attempts to include only significant terms leads right back to the basic salary-to-WAR model, though the Year of Contract variable was close to signficant. If more data were available, I would guess this would be a factor. In any case, controlling for these other terms does not strongly change the amount of dollars paid per WAR of free agents.
As a final attempt, I looked at only players who were in their first year of their contracts in 2009. These are players who were actually available on the free agent market in 2009 (as opposed to the other analyses which included all players who would be eligible based on service time, whether they were actually free agents or not). As you might expect, the value of these players were higher than those who were still working off of old contracts. However, the change was not huge. Controlling for whether the player had signed a multi-year contract or not, I got the following formula:
WAR = .277 + .184*(Salary) - .407*(MultiYear)
The dollar per win mark here was lower at just $5.4 million, however, this doesn't capture the true cost, since players signing mult-year contracts will likely be worse at the end of their contract than during the first year studied here. Even with this bias, the $5.4 million mark is far more than the usual $4.5 million mark. An additional counterintuitive finding is that players signing multi-year contracts tended to perform worse than their single-year contract contemporaries. This multi-year term was not significant, however, so the result isn't generalizable. Still, it was surprising to find the effect going in the opposite direction than what one would expect in 2009.
While 2009 could have been just a bad year for free agents - this is further evidence that the $4.5 million per win mark commonly used may be, if not wrong, at least obsolete. Using this 2009 data from two different data sources, again shows the dollars per win value above $6 million. While estimates based on projected WAR may yield a different figure, the reality is that teams are paying much more than that (or at least they did in 2009). Interestingly, 2009 was seen at the time as being a depressed free agent market, where teams could pick up relatively cheap bargains. At $6.5 to $7 million per win, there were very few bargains to be had.
Update: I had a few missing players in my dataset and the numbers have been changed to reflect that. However, the difference with these players added was very slight.
| Baseball Beat | December 14, 2009 |
Bert Be Home By Eleven?
Despite ranking fifth in career strikeouts, ninth in shutouts and 27th in wins, Bert Blyleven inexplicably remains on the outside of Cooperstown looking in.
 I have been knocking on the doors of the Hall of Fame since December 2003. Blyleven's voting percentage has climbed from 29% that year to 41% in 2005, 48% in 2007, and 63% in 2009. He is trending well but still needs to get to the 75% threshold to receive his just due.
According to Sky Andrecheck, "No player in the last 25 years has seen his vote totals rise so sharply and not been enshrined in the Hall. I wouldn't bet on Blyleven being the first."
Let's hope Sky is right. In the meantime, the two most widely heard arguments against Blyleven's qualifications for the Hall of Fame involve his lack of All-Star Game appearances and poor showings in the Cy Young Award balloting. While I have refuted both of these concerns many times in the past (see multiple links to the Bert Blyleven Series in the sidebar to the left), I am going to take another shot at it today, asking questions and providing answers (including an excerpt from what I wrote in December 2006).
How many times did the All-Star Game manager pick nine or ten *starting* pitchers during Blyleven's career? I might be wrong, but I would be surprised if ten starters (without double counting injured and replacements) were ever selected for a single ASG during his career. A few nines but mostly six, seven, or eight by my count.
Of those six, seven, or eight, how many pitchers did those managers select from their own teams? Do you think that is an objective measure? How many times did they pick a starting pitcher as the lone representative from that player's team? When your teammates are named Killebrew, Oliva, Carew, Stargell, and Parker, you're never going to be selected as the lone player from your club.
Was Blyleven ever passed over because he had pitched the weekend before the All-Star game? Moreover, don't you think managers were as "guilty" as the writers when making these selections by focusing on win-loss records as much or more than other stats that a pitcher has more control over? If so, can we agree that W-L records are not the best measure of a pitcher's performance?
For example, in 1972, Blyleven's ERA was 2.85 over, get this, 170.2 innings at the All-Star break. He wasn't selected because his W-L record was 9-12. He pitched like an All-Star but was penalized because his W-L record was under .500. Manager Earl Weaver went with Blyleven's teammate Jim Perry, who was 8-9 with a 3.21 ERA at the break, rather than with Bert. Think the fact that Perry was a 14-year veteran and Blyleven was in his second full season had anything to do with that injustice? How about Weaver choosing Marty Pattin (8-8, 3.75 ERA) over Blyleven?
In 1977, Blyleven had an ERA of 2.61 with outstanding peripherals at the All-Star break. Why do you suppose he wasn't named to the All-Star team? Do you think the fact that his W-L record was 8-9 had anything to do with it? Instead of selecting Blyleven as one of the seven starting pitchers, Billy Martin chose Bert Campaneris to represent the Texas Rangers. Campaneris was hitting .256/.317/.352 with 13 SB and 15 CS at the break.
In 1989, Blyleven was 8-2 with a 2.15 ERA in 125.2 IP, yet once again was passed over as one of the six pitchers Tony La Russa chose, two of whom were from his own A's team, including Dave Stewart, who "earned" the right to start the game due to his 13-4 record despite posting an ERA of 3.24 (more than a full run higher than Blyleven) while allowing more hits than innings and producing a K/BB ratio of less than 2.
Re the All-Star Game, here is what I wrote (along with breaking out his first and second half career stats) in Answering the Naysayers (Part Two) in December 2006:
As it relates to the number of All-Star Game appearances, Blyleven generally pitched better in the second half of the season than in the first half. Unfortunately, All-Star selections are based on how players perform during April, May, and June rather than July, August, and September.W L PCT ERA IP H R ER HR BB SO 1st Half 150 140 .517 3.47 2738 2620 1167 1056 258 726 2046 2nd Half 137 110 .555 3.12 2232 2012 862 774 172 596 1655Given that W-L records and ERAs are the stats most heavily considered by managers when it comes to picking All-Star starting pitchers, it follows that Blyleven would have been viewed more favorably had this honor taken place at the end of the season rather than in the middle.
If anything, Blyleven's splits should be viewed in a positive light. He did his best work in August and September (and in the postseason).
            W   L    ERA    IP      H     R    ER   HR    BB    SO
April/Mar.  30  36   3.61   680.2  661   301   273   69   199   487
May         50  41   3.40   858.1  800   360   324   72   220   689
June        49  46   3.37   803    773   337   301   78   212   596
July        48  44   3.70   873    831   390   359   88   240   613
August      59  36   2.89   863    770   313   277   62   222   645
Sept./Oct.  51  47   2.99   892    797   328   296   61   229   671
Postseason   5   1   2.47    47.1   43    15    13    5     8    36
Blyleven performed like an All-Star in 1971, 1973, 1974, 1975, 1976, 1977, 1981, 1984, 1985, 1986, and 1989. For example, in his first full season in 1971, Bert led the league in strikeouts-to-walks (3.80), ranked third in Runs Saved Against Average (26), fourth in strikeouts (224) and adjusted ERA+ (127), fifth in ERA (2.81) and shutouts (5), eighth in complete games (17), and ninth in innings pitched (278 1/3), yet he wasn't an All-Star. Blyleven rightfully made the team in 1973 when he was arguably the best pitcher in the AL.
In 1974, Blyleven was 2nd in K (249), K/BB (3.23), and ERA+ (142); 4th in ERA (2.66), WHIP (1.14), and RSAA (32); and 10th in CG (19), yet failed to earn All-Star honors once again.
One year later, Bert ended up 2nd in K (233), 3rd in WHIP (1.10) and RSAA (34), 4th in K/BB (2.77), 5th in CG (20) and ERA+ (129), 6th in ERA (3.00), 7th in IP (275 2/3), and 9th in SHO (3) and, lo and behold, didn't make the All-Star team.
In 1976, Blyleven was 2nd in SHO (6), 3rd in K (219), 4th in IP (297 2/3), 5th in K/BB (2.70), 7th in RSAA (23), 8th in ERA+ (125), and 9th in ERA (2.87) and CG (18) but took another mini-vacation in July.
Bert may have been the best pitcher in the AL once again in 1977. He led the league in WHIP (1.07) and RSAA (39); was 2nd in ERA (2.72), ERA+ (151), and shutouts (5); 7th in K (182); 8th in K/BB (2.64); and 10th in CG (15), yet had nothing to show for it in terms of being an All-Star.
In the strike-shortened 1981 season, Blyleven ranked 3rd in K (107) and K/BB (2.67); 8th in WHIP (1.16) and ERA (2.88); 9th in ERA+ (126) and CG (9); and 10th in W (11). He watched the ASG from home.
In 1984, Bert led the league in RSAA (40); placed 2nd in W (19), WHIP (1.13), and ERA+ (142); 3rd in ERA (2.87) and SHO (4); 4th in K (170) and CG (12); and 8th in K/BB (2.30) despite playing for a team with a 75-87 record that ended up sixth in a seven-team division. He must have been an All-Star that year, right? Nope, he was left off the team again.
Blyleven made the All-Star team in 1985 for the second time in his career. However, he was ignored the following year when he led the league in IP (271 2/3) as well as in K/BB (3.71); placed 2nd in CG (16), 4th in K (215) and SHO (3), 6th in W (17), 7th in WHIP (1.18), and 10th in RSAA (19).
In 1989, the 38-year-old led the league in SHO (5); ranked 3rd in WHIP (1.12) and RSAA (28); 4th in ERA (2.73), ERA+ (140), and CG (8); 5th in K/BB (2.98); 6th in W (17); and 7th in IP (241), yet missed out on being an All-Star. Go figure.
As demonstrated, the fact that Blyleven was only named an All-Star twice is more a function of the system than a reflection on how well he pitched.
Importantly, the above breakdown also works just as well, if not even better, with respect to how Blyleven should have ranked in the CYA voting.
Speaking of which, I can't help but wonder if Blyleven's candidacy wouldn't be viewed more favorably today had the Baseball Writers Association of America implemented its new policy by expanding the Cy Young ballot from three to five spots 40 years ago?
Moreover, if the voters back then evaluated pitching performance more like today, perhaps Blyleven would have won the Cy Young Award in 1973? While Blyleven may not have quite put up a season equal to the likes of Zack Greinke or Tim Lincecum in 2009, it was a lot closer than what he was given credit for in the balloting that year. With more emphasis on K/BB, WHIP, FIP, and other measures besides wins and losses, Blyleven's dominance would be more notable today than how it has been perceived by many naysayers in the past.
There's plenty of room inside the Hall of Fame for Blyleven's plaque. The writers only have 2010, 2011, and 2012 to get it right as Bert drops off the ballot in three years. I anticipate further progress this year with an enshrinement date set for July 2011.
| Baseball Beat | December 12, 2009 |
A Recap of the Winter Meetings
We debut Baseball Analysts Radio today. While not technically radio, it is our attempt to provide audio content to supplement the daily articles written by analysts Dave Allen, Sky Andrecheck, Jeremy Greenhouse, Marc Hulet, Chris Moore, Patrick Sullivan, and me, as well as special guest columnists that have included many established and up-and-coming voices in the baseball world.
The first segment covers the just concluded Winter Meetings. I detail more than 15 trades and free agent signings, offering both news and views on these transactions. I'm planning to add more commentary on the three-way trade among the Yankees, Tigers, and Diamondbacks, plus the Chone Figgins signing in our next episodes.
We hope you enjoy this new feature at Baseball Analysts.
| F/X Visualizations | December 11, 2009 |
The Pitchers of the 'Big Trade'
In terms of excitement the Winter Meetings were underwhelming, particularly compared to their intense coverage. But, for three teams there was excitement in spades. As you surely know the Tigers, Diamondbacks and Yankees pulled off a big trade. Here I will give a pitchf/x-based look at some of the pitchers in the trade as an introduction to their new fans.
Edwin Jackson
Jackson had a breakout year in 2009. For the first time he got his BB/9 below three, and also for the first time the value was below league average. He was probably the beneficiary of some BABIP based luck, but he still was a very good pitcher.He is, for the most part, a two-pitch pitcher.
+-------------+-----+-----+
| Pitch Type  | RHB | LHB |
+-------------+-----+-----+
| Fastball    | 60% | 67% |
| Slider      | 37% | 20% |
| Curve       |  2% |  4% |
| Change      |  1% |  9% |
+-------------+-----+-----+
Righties see the slider or fastball 97% of the time, and lefties 87% of the time. That is what you can do if you throw your fastball in the mid-90s and have a devastating slider.
It looks to me that the big step forward for Jackson was the out-of-zone swing rate on his fastballs. In 2007 the rate was 21%, then 25% in 2008 and now 28% in 2009. Swings at out of zone pitches turns balls into strikes or weak contact. Jackson's in zone percentage did not change much this year, so I think the decrease in walks was from batters swinging at his out of zone fastballs at a greater rate. It would take a little more digging to see why exactly they did that.
Ian Kennedy
In his 60 MLB innings Kennedy has not lived up to his incredible minor league numbers; Jeff Sackmann's Minor League Splits gives him a major league equivalent FIP of 3.83 based on his minor league career. The refrain is that his meager stuff can get the job done in the minors, but will not translate directly to the Bigs. But just 60 innings is not enough to make such a designation and, anyway, the Diamondbacks would be happy with a lot worse than a 3.83 FIP.
Kennedy throws a fastball that averages just south of 90 mph, a slider, curve and change that is about 10mph slower than his fastball. In limited time in the majors he did a good job of keeping his fastball away to LHBs and the change down and away.
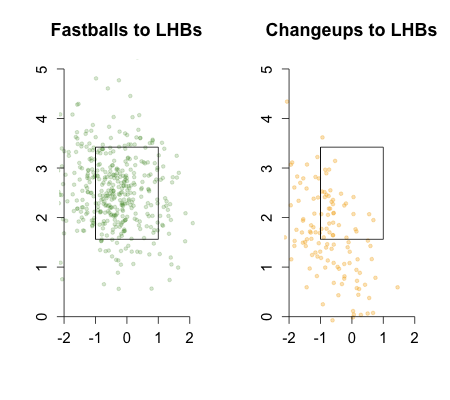
In Arizona he should get a solid shot to establish himself as a starter on a longer leash than when he was in New York.
Max Scherzer
Scherzer is an exciting pitcher, striking out over a batter an inning while walking just 3.34 per nine. At 25 he is one of the game's top young pitchers. The consensus is that Arizona was concerned about his long-term health and wanted to cash in on him while he is still healthy.
He throws three pitches.
+-------------+-----+-----+
| Pitch Type  | RHB | LHB |
+-------------+-----+-----+
| Fastball    | 70% | 72% |
| Slider      | 20% |  7% |
| Change      | 10% | 21% |
+-------------+-----+-----+
Scherzer's fastball works in the mid-90s. His secondary pitch is a slider to RHBs and a change to LHBs. What make Scherzer an exciting and potentially elite pitcher is his ablity to miss bats, as evidence by his strike out per inning and also by his bottom 15 contact rate (in other words top 15 whiff rate). The extra whiffs come courtesy of his excellent fastball.
Whiff Rate
+-------------+-----+-----+
| Pitch Type  | Sch.| Ave.|
+-------------+-----+-----+
| Fastball    | 20% | 14% |
| Slider      | 26% | 27% |
| Change      | 26% | 29% |
+-------------+-----+-----+
You can see that the only place Schzerer is better than average is with his fastball. But because most pitchers, Schzerer included, throw mostly fastballs, so having a fastball that is far above average is going to lead to tons of strikeouts.
Daniel Schlereth
Schlereth is an electric reliever, over the course of his minor league career he averaged 12.8 K/9, but also 4.9 BB/9. He joined the Diamondbacks pen part way through and pitched about how one expect, 22 Ks and 15 BBs in just 18 innings. If he can cut down on the walks while keeping the big strikeouts he will be an elite reliever.
The most interesting thing about Schlereth's usage so far, and be warned this is based on just 18 innings, is he throws curveballs over 40% of the time. No full time reliever threw that many curves in 2009 . The curve is nasty with a 40% whiff rate. It will be interesting to see his pitch usage over a full year coming out Detroit's bullpen.
Both Detroit and Arizona have two very interesting new pitchers to follow next year. In addition we recently heard that Detroit might try Phil Coke as a starter, which is another intriguing aspect of the trade.
| Around the Minors | December 11, 2009 |
Reviewing the 2009 Rule 5 Draft
It was a pretty lackluster Rule 5 draft this past Thursday, which was to be expected. Since October 2006, when Major League Baseball increased the 40-man roster addition requirements from three years of pro experience to four (for players signed at age 19 and above) and four years to five (for players signed at age 18 and below), it's given teams more time to evaluate their in-house talent. You can find the rules for the draft HERE.
Of the 17 players selected in the '09 Rule 5 draft, 14 were pitchers (six left-handers, eight right-handers). Two outfielders were taken (with the first and second picks) and a third baseman was also selected (eighth overall).
In 2008, the Rule 5 draft saw four of the 21 players selected stick in the Majors in '09: shortstop Everth Cabrera (San Diego from Colorado, third overall pick), left-hander Donald Veal (Pittsburgh from Chicago NL, fourth overall pick), right-hander Luis Perdomo (San Francisco, later claimed on waivers by San Diego, from St. Louis, sixth overall pick), and right-hander Darren O'Day (New York NL, later claimed off waivers by Texas, from Los Angeles AL, 15th overall pick).
In 2007, 18 players were selected. Perhaps the biggest name selected was right-hander Randy Wells, who went from the Chicago Cubs to the Toronto Blue Jays. He actually made Toronto's opening day roster, but had just one appearance before being offered back. In '09, he was called up to the Majors by the Cubs and was one the best rookie starters in the National League.
During the 2006 draft, two significant diamonds in the rough were uncovered: right-hander Joakim Soria (Kansas City from San Diego, second overall), and outfielder Josh Hamilton (Cincinnati via Chicago NL, from Tampa Bay, third overall). Catcher Jesus Flores (Washington from New York NL, sixth overall) has also shown promising, although he's been bitten by the injury bug.
The Intriguing Picks
Ben Snyder | LHP | Texas via Baltimore, from San Francisco
A former fourth-round pick out of Ball State, Snyder is a left-hander with good stuff, and above-average command (although his control has slipped a bit since leaving A-ball). He'd probably be more successful in the National League than in Texas, but the 24-year-old southpaw has a chance to contribute out of the 'pen if he can keep the ball down. Unfortunately, his 37.1% ground-ball rate suggests he didn't do that overly well at double-A in '09. He has nice splits against left-handers: .178 average, 1.71 BB/9, 10.65 K/9. With C.J. Wilson as the only guaranteed left-hander in the bullpen in 2010 (and possibly the recently-acquired Clay Rapada), it was smart of the club to target some southpaw depth.
Bobby Cassevah | RHP | Oakland from Los Angeles (AL)
If you're a ground-ball freak like me, then Cassevah is your man. The 24-year-old right-hander spent the '09 season in double-A and posted a ground-ball rate of 70% on the season, which is borderline ridiculous. Over the past four seasons, he's allowed just four homers. Aside from the sink, his stuff is otherwise ordinary (velo, break, etc.). His control could get him into trouble in the Majors (4.54 BB/9) and his strikeout rate has dropped each of the past three seasons, but he's a good gamble. Cassevah adds some depth to an inexperienced bullpen, but it remains to be seen just how good the A's infield defense is going to be in 2010.
Hector Ambriz | RHP | Cleveland from Arizona
A solid starting pitcher at UCLA for four seasons, Ambriz' stuff does not play as well in pro ball, thanks to his below-average heater. He did have some nice results in triple-A in '09, though, despite the 5.57 ERA. His FIP was just 3.80 and he suffered from a .372 BABIP, so you can explain away some of those 164 hits in 127.2 innings. He has always shown good control (2.82 BB/9 in '09) and he misses enough bats (7.26 K/9). Career-wise, he has pretty even numbers against right-handed and left-handed hitters. Despite making just three relief appearances over the past three minor league seasons, Ambriz is not an option to start in the Majors (especially the AL), but he could provide innings out of the inexperienced 'pen.
Steven Johnson | RHP | San Francisco from Baltimore
Part of the loot in the mid-2009 trade of closer George Sherrill to the Dodgers, Johnson made just seven starts for his new organization before heading back to the NL West. The right-hander has average stuff, but he has good command/control and posted a strikeout rate of 9.43 K/9 on the season. Although he struggles with his control against left-handed hitters (4.83 BB/9), Johnson handles them well otherwise: .219 average, 10.28 K/9. The club basically traded Snyder for Johnson, which was a pretty good move, especially considering the organization already has pretty solid left-handed depth. And Johnson has a chance to pitch out of the starting rotation down the road.
Kanekoa Texeira | RHP | Seattle from New York (AL)
The better of the two Te(i)xeiras to lose, Texeira was acquired from the White Sox prior to the '09 season. Given the organization's reputation for trading pitchers who then fall victim to injuries, New York may have just been happy to get one healthy season from the reliever. In 101.1 double-A innings, the durable righty allowed 90 hits and posted a walk rate of 3.82 BB/9. His strikeout rate of 7.82 K/9 was solid, as was his 61.2% ground-ball rate. He certainly won't benefit much from Seattle's excellent outfield defense. Oddly, his strikeout rate was 10.69 against left-handed batters and just 4.25 against right-handed batters. With the likes of Sean White, Jason Vargas, and Garrett Olson vying for spots in the bullpen, Texeira has a good shot at making the opening day roster.
Why Bother?
Jamie Hoffmann | OF | New York (AL) via Washington, from Los Angeles (NL)
This choice was puzzling... and made even more so by the fact that the Yankees traded up to get Hoffman. Yes, the 40-man roster boasted just four outfielders prior to the Rule 5 draft, but the club does not need to pinch pennies in effort to build its bench. As well, if Hoffmann is such a desirable commodity, why didn't the Yankees grab him on waivers when he was designated for assignment by the Dodgers just three months ago on Sept. 1/09? He'd have more value in that scenario because he has minor-league options remaining, which cannot be utilized as a Rule 5 pick. Most of Hoffmann's player value is in his defense, as well as his willingness to take a walk (11.1% in triple-A) and his base running (15+ steal capability in regular playing time).
John Raynor | OF | Pittsburgh from Florida
Raynor is an interesting pick for the Pirates organization, which actually has a fair bit of depth at the position with the likes of Andrew McCutchen, Jose Tabata, Lastings Milledge, Brandon Moss, and Delwyn Young (as well as Garrett Jones) kicking around. Raynor brings some speed (18 steals in 26 attempts) and the ability to play all three outfield positions. He had an off-year in '09 by hitting just .255/.326/.357 (.336 BABIP) after back-to-back seasons of hitting .312+, but he also had BABIPs of .404 in each of those two seasons. As a result, his '09 numbers appear far more realistic. Raynor needs to curb his strikeouts (27.0%).
Chuck Lofgren | LHP | Milwaukee from Cleveland
Another interesting pick-up, Lofgren was considered one of Cleveland's top pitching prospects as recently as 2007. His stuff has gone backwards since then, but he still has an above-average breaking ball that could make him an OK LOOGY reliever in the Brewers 'pen (He has modest left/right splits. At double-A in '09, Lofgren allowed 94 hits in 98.1 innings, while posting a walk rate of 3.02 BB/9 and a strikeout rate of 5.67 K/9. If either Mitch Stetter or Chris Narveson falter, Lofgren should be ready to step in.
Edgar Osuna | LHP | Kansas City from Atlanta
With just one left-hander (Dusty Hughes) on the 40-man roster prior to the selection of Osuna, the organization clearly needed some southpaw depth. The 22-year-old hurler reached double-A in '09 where he allowed 74 hits in 77.1 innings and posted a walk rate of 2.44 BB/9. While his control rates have remained fairly static over his career, Osuna's strikeout rate has dropped rather significantly since he left low-A ball and bottomed out at 5.70 K/9 in double-A. His career 40% ground-ball rate is nothing to write home about. You also have to hope the Royals are not looking to him as a LOOGY. His career splits are not favorable: .285 average/7.05 K/9 vs lefties and .242/8.90 vs righties.
Jorge Jimenez | 3B | Florida via Houston, from Boston
There is honestly nothing about Jimenez that really suggests he's going to be even an average big-league third baseman. The left-handed hitter is a platoon waiting to happen, with a double-A OPS of .600 against southpaws. Overall, he hit just .289/.366/.424 in 498 at-bats. With a .135 ISO, his power output is below-average for a third baseman. But hey, Jimenez, 25, is probably an offensive upgrade over Emilio Bonifacio.
Zach Kroenke | LHP | Arizona from New York (AL)
Kroenke is an interesting selection, as he was also picked in the '08 draft. However, the Florida Marlins chose not to keep Kroenke and he was offered back (and accepted) by the Yankees. If the southpaw fails to make the Arizona club this time around, he will become a free agent before the Yankees have a shot at taking him back. The 1.99 ERA at triple-A in '09 is nice, but his FIP was 3.64 and he was aided by a low BABIP at .251. His strikeout rate was nothing special at 6.84 K/9 but his ground-ball rate of 60.0% against left-handers suggests that he might have a future as a LOOGY. The Diamondbacks club could use some help in that department with just Clay Zavada currently on hand.
Mike Parisi | RHP | Chicago (NL) from St. Louis
Injuries prevented Parisi from making more than five starts during the regular season in '09. However, he pitched well in the Arizona Fall League and showed a heavy ball. Parisi made seven appearances (six starts), which was obviously enough to catch the eye of the Cubs. He'll open the 2010 season at the age of 27, so he has little upside. The club can use the depth in the bullpen.
Zech Zinicola | RHP | Toronto from Washington
Zinicola actually had a better season than many of his stats would suggest. The right-hander posted a 3.25 FIP in 20.2 innings at double-A and a 3.29 FIP in triple-A, so his defense definitely let him down at the higher level, which led to the 47 hits in 33.1 innings, and misleading ERA. The .417 BABIP and 52.5 LOB% are definitely not going to stick. Zinicola does have a nice heater (topping out around 93 mph), which led to a strikeout rate of 8.37 in triple-A, and he displayed at least average control in '09. You also have to love the 56.7% ground-ball rate, as well as the low 11.8% line-drive rate. On the worrisome side, Zinicola has struggled against right-handed batters in each of the past two seasons (.345 average in '09, .318 in '08), possibly due to inconsistent fastball command. The Jays club has a fair amount of depth in the bullpen, so Zinicola could have trouble finding a home.
Carlos Monasterios | RHP | Los Angeles (NL) via New York (NL) from Philadelphia
Monasterios, 23, was originally acquired by the Phillies from the Yankees in the Bobby Abreu deal of '06. The right-hander has average stuff, but he displays above-average control and posted a walk rate of 2.96 BB/9 in high-A ball in '09. He worked as a swing-man this past season, making seven starts and 28 relief appearances. Repeating high-A ball in '09, Monasterios improved his home-run vulnerability and dropped his HR/9 rate from 1.81 to 0.44. He opened some eyes recently while pitching in the Venezuelan Winter League and has allowed 45 hits in 51.1 innings. His ceiling is probably middle to long reliever in the Majors.
Ben Jukich | LHP | St. Louis from Cincinnati
Another low-ceiling pick, Jukich is 27 years old and he spent the entire year in triple-A with the Reds. In 123.0 innings split between the starting rotation and the bullpen, he allowed 125 hits and posted a walk rate of 2.93 BB/9. He had some trouble with the long-ball and posted a HR/9 rate of 1.17. His numbers against southpaws were nothing to write home about: .242 average (.164 BABIP), 5.71 K/9. Dennys Reyes has a potential partner now, though, in the bullpen.
Armando Zerpa | LHP | Los Angeles (NL) via Tampa Bay, from Boston
Along with Monasterios, the Dodgers actually added two Rule 5 picks, and the club is not likely to compete for the NL West title with both pitchers in its bullpen. Zerpa is definitely the odd man out at this point, even if he has the edge of being a lefty. The club actually already has pretty solid depth and Zerpa has pitched just 16 games above low-A ball. He allowed just 19 hits in 45.0 low-A ball innings in '09 but he was helped significantly by a .200 BABIP. Zerpa does generate a fair number of ground balls (53.3%) and he has good career splits against left-handed hitters (.166 career average).
Kenny (David) Herndon | RHP | Philadelphia from Los Angeles (AL)
A 2006 fifth-round pick of the Angels, Herndon never developed the secondary pitches needed to stick in the rotation. After dabbling in relief in '08, he went all-in in '09 and posted a 4.65 FIP in 65.1 innings. He gave up too many hits in double-A (70) but he didn't hurt himself by issuing walks (1.93 BB/9). His 4.82 K/9 rate leaves something to be desired, as does the 1.24 HR/9 rate. Herndon has never fared well against left-handed hitters, and they hit .313 against him (with a strikeout rate of just 2.54 K/9) in '09.
| Touching Bases | December 10, 2009 |
Crowding the Plate
Roger Dorn earned back some respect when he showed that he was willing to take one for the team. But really, that pitch was so far up and in, it would’ve been more impressive to have seen him in his old age avoid it.
Some players, though, do have the ability to dodge pitches. Orlando Cabrera has seen over 5,000 pitches in the last two years, and has been able to get out of the way of all but one of them. At the other end of the spectrum, Chase Utley has taken his base on 51 HBPs in the last couple years, 21 more than the next closest batter.
Batters are hit in just over 1% of plate appearances when facing same-handed pitchers, while opposite-handed matchups result in half as many HBPs. 10% of pitches are inside in same-handed plate appearances, while 7% are inside in opposite-handed plate appearances. This explains some of the difference in hit by pitch probability. Using 2008-2009 pitchf/x data, I found the expected probability of a batter getting hit by a pitch that is at least a foot from the center of the plate—more or less all pitches that would normally be called for a ball inside.
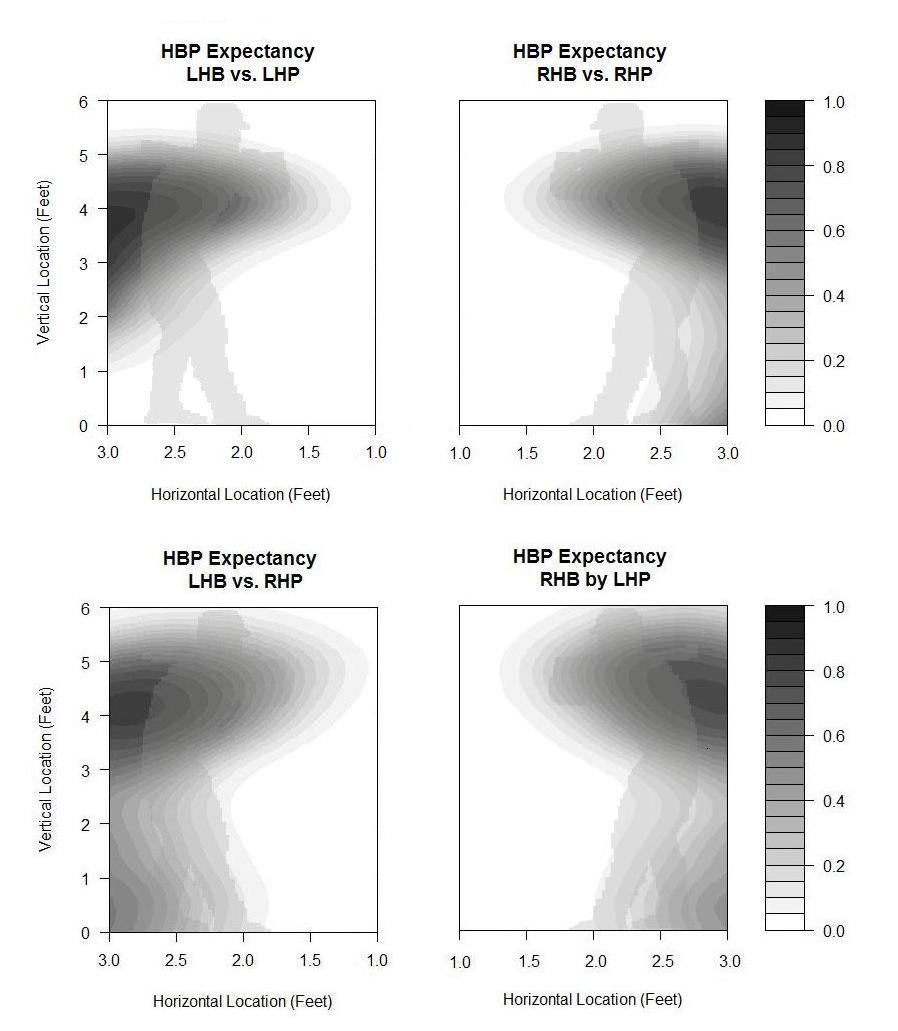
The figure of the batter (borrowed from Mike Fast) stands approximately a foot off the plate.
Here you see that if you’re a pitcher and have the intent of throwing a bean ball, you should throw at the batter’s back, where 80-90% of pitches will hit him.
The portion from the knees down—about one and a half feet off the ground and lower—protrudes more gray area from the opposite-handed graphs from than from the same-handed graphs. The head area is also more of a danger zone for same-handed batters. My guess is that batters of the same handedness as the pitcher pick up the ball later in the pitcher's delivery than they do facing opposite-handed pitchers, and therefore same-handed batters have less time to react to the pitch as they realize it’s going to hit them.
I also considered that velocity might be a factor in hit by pitch expectancy. Again, my sample is restricted to pitches inside.
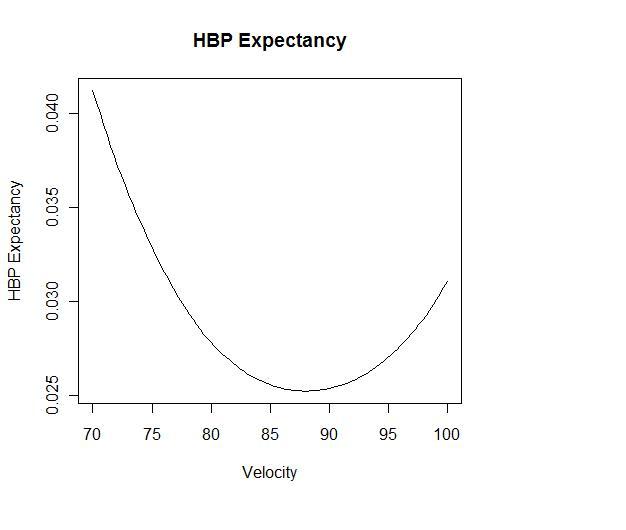
I’d imagine this trend has to do with the relationship between a pitcher’s velocity and his control. Breaking balls and 100 MPH heaters are not located as well as 90 MPH fastballs. But maybe batters are also more willing to get hit by the slowest pitches and not as able to get out of the way of the fastest pitches. I decided to include horizontal location, vertical location, and velocity as components in a regression to find the probability of HBPs.
| Player | Inside Pitches | Extra HBPs | HBP Probability |
|---|---|---|---|
| Chase Utley | 266 | 40 | 449% |
| Carlos Quentin | 288 | 26 | 442% |
| Jason Giambi | 255 | 22 | 502% |
| Kelly Shoppach | 231 | 21 | 414% |
| Aaron Rowand | 352 | 20 | 340% |
| Billy Butler | 526 | -13 | 13% |
| Vladimir Guerrero | 544 | -14 | 37% |
| Edgar Renteria | 501 | -16 | 6% |
| Michael Young | 510 | -16 | 15% |
| Adrian Gonzalez | 587 | -17 | 39% |
HBP probability is the rate at which a batter is hit by pitches over what would be expected from the average batter of that handedness.
I imagine this list is most indicative of how far batters stand from the plate. I also believe that pitchers are aware of the reputations of most batters' willingness to take his HBPs, so such batters are not pitched inside as often as they would be otherwise.
The charts of the best and worst at being hit by pitches, though I'm not sure you want to be the best in this category.
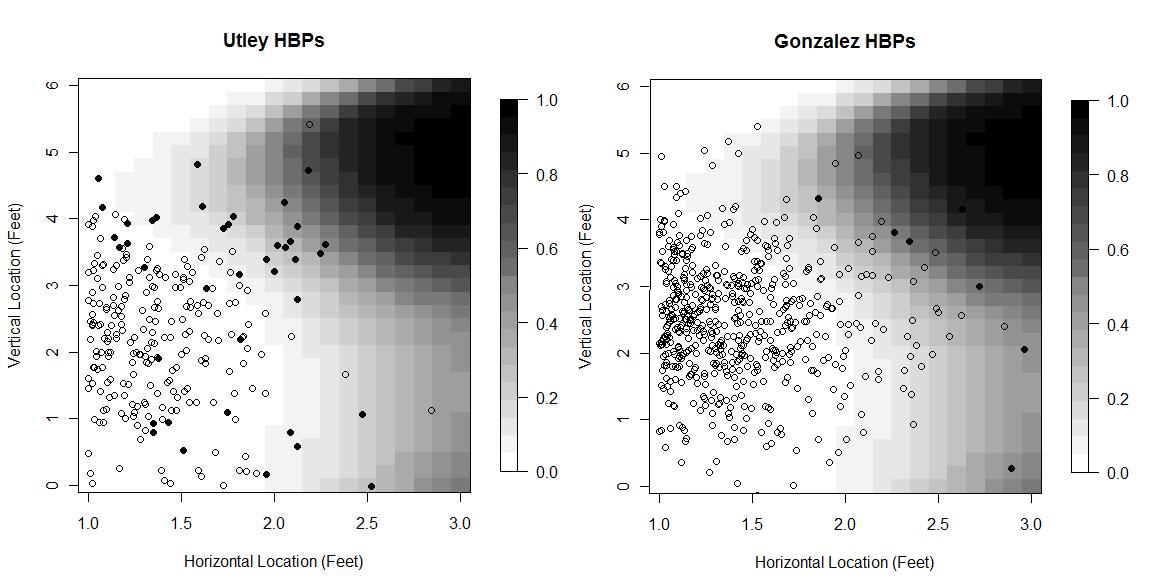
Solid points are HBPs, while hollow points are everything else. The background portrays the HBP probability for all LHBs.
Utley’s getting hit by anything at least a foot inside, where 16 of 21 pitches went for HBPs. He’s getting hit by anything at all inside and four feet up, about the location of his elbow, where eight of 11 pitches went for HBPs. In fact, Utley’s been hit on 10 pitches not charted, as they were less than a foot inside. All of those pitches were also at the letters or higher, so I’d imagine he leaned into at least a couple of them.
Meanwhile, Adrian Gonzalez has been hit by a few more pitches than anyone else on the list of laggards. He just gets pitched inside quite a bit and is more adept at dodging balls than Patches O’Houlihan.
Full results, including pitchers, can be found here.
| Crunching the Numbers | December 10, 2009 |
Why do the Dodgers hate Hoffman?
Jamie Hoffman isn't a great player by any means, and he is no longer a prospect, but the Dodgers have left him out to dry multiple times this year. If he was valuable enough for the Yankees to rise to the top of the Rule 5 Draft, why wasn't he protected?
Hoffman was the 18th best prospect in the Dodgers organization going into the year according to Scout.com, and 22nd according to Baseball America. He owns a AAA batting line of .285/.362/.449. He'll go into the 2010 season at age 25, and can play CF or RF. If he defense isn't quite good enough for CF, he projects to be a 4th outfielder, like a Gabe Kapler minus some muscle.
Hoffman was first designated for assignment on September 1st, passed through waivers, and then was resigned by the Dodgers. They did not protect him from the Rule 5 draft, however. The Dodgers made the choice to protect Trayvon Robinson instead of Hoffman, by adding him to the 40 man roster in November.
So why wasn't he on the 40-man roster, and why was he DFAed in September? The answer seems to be that he was redundant on the Dodgers. The 4th outfielder role is currently held down by Xavier Paul. Jason Repko also sits higher on the blue totem pole. I would have been surprised to see anyone grab Trayvon Robinson in the Rule 5 draft, but if the Dodgers perceived that as a threat, it could certainly be argued that he deserves protection more than Hoffman.
Perhaps it just says more about the Yankees than the Dodgers. The Yankees currently have 4 outfielders on the 40-man roster. The first two, Curtis Granderson and Nick Swisher, are clearly going to be penciled into most Yankees line-ups in 2010. The other two outfielders would be lucky to be penciled in at all. Melky Cabrera is a glorified backup centerfielder. He simply does not have the production to justify being played in a corner outfield position. With the Granderson acquisition, Melky will be reduced to being a 2nd choice centerfielder, and a last choice corner outfielder. The last outfielder, Brett Gardner is not even a good option for a 4th outfielder. How Gardner still has a job confuses me.
Hoffman would fit in well as a 4th outfielder. He can play any outfield position, and his production will likely justify his being played on a corner. He isn't a great base stealer, but he has speed on the bases, making him a good option as a pinch runner.
So this replacement-level outfielder, the 6th choice outfielder on the Dodgers, would be the starting left fielder on the current Yankees roster. This was clearly a good choice for the Yankees. It was also very bad planning on the part of the Dodgers if they had any interest in keeping Hoffman.
| Change-Up | December 09, 2009 |
OK in Arizona?
Like others I had no idea what Josh Byrnes might have been thinking when I first heard of yesterday's trade. Now, I'll admit it, I am no longer as appalled by the deal from the Diamondbacks' perspective as many of the writers and analysts I have seen. Arizona gave up Max Scherzer, a power pitcher with a longstanding history of arm troubles. As Keith Law noted in his write-up, it's likely that Scherzer will one day soon transition to the bullpen due to ongoing injury issues. He should be a good reliever, but not only could the D-Backs afford to give up a player who projects out as a quality 70-inning guy, but they absolutely should have. They gave up Dan Schlereth as well, a live-armed lefty whose limited performance record in pro baseball hasn't told us much about what he figures to become. We know he has a good arm, we know he struggled some in 2009 with Arizona.
In return, the Diamondbacks get two starters they hope to run out 30 times or so in 2010. Edwin Jackson is not as good as his 2009 performance might suggest, but he now transitions from the AL to the NL. Ask Brad Penny and John Smoltz how that worked out. While Scherzer might be more talented, Jackson should be able to offer more quality innings and quality starts over the next two seasons. In Ian Kennedy, Arizona receives a player who has dominated Minor League ball and struggled in spot Major League action. There's plenty still to like about Kennedy, and his return from a freak 2009 injury should not be much of an issue.
In the end this deal comes down to a relatively new and key performance projection factor, or what's often referred to as a player's "medicals" or "meds". Arizona might think they have a ticking time-bomb in Scherzer, while their diligence on Jackson and Kennedy (both with durability questions of their own) indicates they now have a couple of work-horses. If that's the case, with Brandon Webb back in the fold and Dan Haren taking the hill every 5th game, the Diamondbacks now have a nice little rotation. Whether the haul was maximized or not, at the very least, I don't think folks should be as dismissive of Arizona's decision to try and retrieve value elsewhere for Scherzer.
Oh, and yeah, the Yankees did great to acquire Curtis Granderson.
| Behind the Scoreboard | December 08, 2009 |
Was Marvin Miller Snubbed?
Marvin Miller was once again denied entry into the Hall of Fame this year by the Veterans Committee. The committee did induct two new members, with manager Whitey Herzog and umpire Doug Harvey gaining entrance, but the exclusion of Miller was widely seen as an injustice and an outrage.
A few weeks ago here at Baseball Analysts and over at Sports Illustrated, I talked about how the small sample size of voters for postseason awards could potentially select players for awards even if the larger consensus disagreed. With the Hall of Fame Veterans Committee this was an even larger issue. Of 12 former players, writers, and executives, people in consideration for the Hall needed just 9 votes.
Does Tom Seaver really deserve to have that much power to bestow people with baseball's highest honor? Why are there so many executives on the committee? Can they really be objective about a man who bested them time and time again? Is this in any way a fair process? Of course, it's not fair at all, but that's not what I'm focusing on here.
Despite Seaver's adamant support, Marvin Miller was barred access from the Hall. Should he have been? Miller changed the game to be sure. His contributions were instrumental in allowing the birth of free agency. In that sense few men have had the impact on the game that Miller did - he transformed the game from one in which the owners had most all of the power, to one in which players also had a say in where they went and how much they would be paid.
According to Bud Selig in 2007, "The criteria for non-playing personnel is the impact they made on the sport. Therefore Marvin Miller should be in the Hall of Fame on that basis. Maybe there are not a lot of my predecessors who would agree with that, but if you're looking for people who make an impact on the sport, yes, you would have to say that."
Certainly no one can argue with Selig's assertion that he had a huge impact on the sport, however, nowhere can I find that impact alone is the only basis for the Hall. One would assume that a positive impact is required, and on that Miller's induction is debatable.
There's no question that Miller made a positive contribution to players' wallets. Before free agency in 1975, the average major league salary was $45,000 - today the average player makes $3,260,000. Even with inflation, that 72-fold increase isn't too shabby. But baseball doesn't exist for the players - it exists for the fans.
And the advent of free agency has had questionable consequences for fans of the game. For one, Miller's hardball tactics allowed the MLB players to transform from "well-paid slaves" to being part of one of the nation's most powerful unions. While that's nice for them, it's had consquences. Before Miller came upon the scene, there had been zero work stoppages. After he was elected head of the MLBPA in 1966, we have seen strikes or lockouts in 1972, 1973, 1976, 1980, 1981, 1985, 1990, and 1994, five of which came under Miller's guidance which lasted until 1982.
Miller did his job well, and his transformation of the MLBPA and bamboozling of the fragmented owners and was masterful work. But along the way, the sport got changed as well. While players' wallets got a boost, their reputations took a hit. In the pre-Miller era, the greedy prima donna athlete stereotype so ubiquitous today did not exist. Nor did fans boo their former heroes for bolting town for the highest offer once they became free agents. Back in 1966, athletes of all stripes seemed to share more with the common man than the fat cats in the owners boxes. Today, fans are more inclined to view them as one in the same.
In an alternate, Miller-less world, A-Rod would perhaps be toasting his longtime teammates Ken Griffey and Randy Johnson in Seattle on another World Series title, with all three enjoying the same kind of local working-man's hero status that players like Ted Williams and Ernie Banks used to share. Perhaps also in this alternate world, the owners would have actually had the power to implement steroid testing with teeth before so many enhanced players made a mockery of the game. Perhaps Bud Selig as commissioner could have done something about the competitive balance problem which has plagued the game. In the post-Miller world of free agency and MLBPA power, these are all impossibilities. The game has changed, but is it better?
But perhaps this all gives Miller too much credit. It's a different world than it was in 1966, and the game was bound to follow suit with or without Marvin Miller. Still, it's likely that Miller ushered in an era of maximized profits and transformed baseball from primarily a game to primarily a business. Players were getting treated unfairly, and Miller gave them the power to negotiate for salaries equivalent to what they were truly worth. For that he should be celebrated. However, the fallout from his bold transformation was not all positive. While Miller was a godsend to the players and professional athletes everywhere, whether he had a positive impact on the game and on the fans is far from an open and shut case. It could be said that Miller was intrumental in forming the modern era of sport. Miller's case for the Hall of Fame probably depends on whether you like this modern era or not. As for me, I'm not so sure.
| Change-Up | December 08, 2009 |
Casey Kelly to Pitch, Steve Jobs to focus on Apple, Phil Micklelson to Forego Luge at 2010 Winter Olympics to Work on Golf
Any news is big news for Red Sox fans, and so yesterday when it was announced that prized farmhand Casey Kelly would pitch full-time and give up his career as a shortstop, reporters pounced. The Boston Globe and Boston Herald were quick to post stories. Twitter was abuzz.
Last night, I offered my two cents on my Twitter feed:
Big news for #redsox today: Casey Kelly chooses pitching. Elsewhere, Martin Brodeur remains goalie & NOT moving to forward.
I understand reporters have to cover these sorts of things - nothing at all against Amalie Benjamin or John Tomase. Benjamin's report, loaded with quotes from Red Sox Minor League infield instructor Gary DiSarcina, was terrific. The joke lies in the extent to which the writing was on the wall for Kelly. He could have continued at shortstop for part of the year if he wished. A bigtime recruit to play quarterback for the University of Tennessee, Kelly's ability to return to play college football offered him leverage even as the Sox urged him to focus on his pitching.
But just look at his numbers. He's a career .219/.282/.336 hitter in the Minors. Meanwhile, as a hurler, he has flashed command well beyond his years. It's no secret just how great the Red Sox brass thinks Kelly can be. At first glance, his 74 strikeouts in 95 professional innings pitched might underwhelm a bit. But when you consider he was 19 splitting the season between the Sally and Carolina leagues and sported a 4.63 K/BB, you can start to appreciate what the Red Sox see. For context, the list of Major League pitchers who were able to post a 4.63 K/BB in at least 95 innings in 2009 consisted of Zack Greinke, Javier Vazquez, Dan Haren and Roy Halladay.
We all have to make choices in our careers that shape how our professional lives play out. Yesterday Casey Kelly made a smart (and obvious) career move.
| Crunching the Numbers | December 07, 2009 |
Bayesian Umpires
I just wanted to post a short follow-up to a post from a few days back, Controlling the Zone in order to make what might appear to be a completely unreasonable assertion. Those are, after all, the best kind.
Umpires absolutely should be biased to give pitchers with good control a wider strike-zone. If an umpire does not give a pitcher with good control a wider strike zone, then he is being unfair.
The basic principle is this: if a pitcher has better control, then before you even see the pitch you should guess it will be a strike. If you see a borderline pitch that could go either way, you will be correct more often if you err on the side of calling strikes. That may not be too convincing, so let's do better.
Let's simplify this and look only at the lateral location of the pitch. Figure 1 shows a hypothetical distribution of pitches for a given pitcher. We'll assume that the distribution is normal along this dimension (this assumption is false for real pitchers, but that doesn't matter for our purposes here). In blue, we see the majority of pitches (60%) that fall between -10 and 10 inches from the center of the plate. These pitches are "true" strikes; they actually crossed the plate. The area in red represents the 40% of the pitches that fall outside the zone. These are "true" balls.

Figure 1. Histogram of "True" balls and strikes
Now let's assume that the umpire doesn't have direct access to the "true" location. Instead, he perceives the location of the pitch, but his perception has some uncertainty in it. Let's assume that the umpire will perceive the location of the pitch to equal the true location plus or minus a normally distributed error term. If we take the red distribution from figure 1 and convolve it with a Gaussian error term, we get the green distribution in figure 2. This green distribution represents where the umpire will perceive all of the "true" balls to cross the plane of the plate.
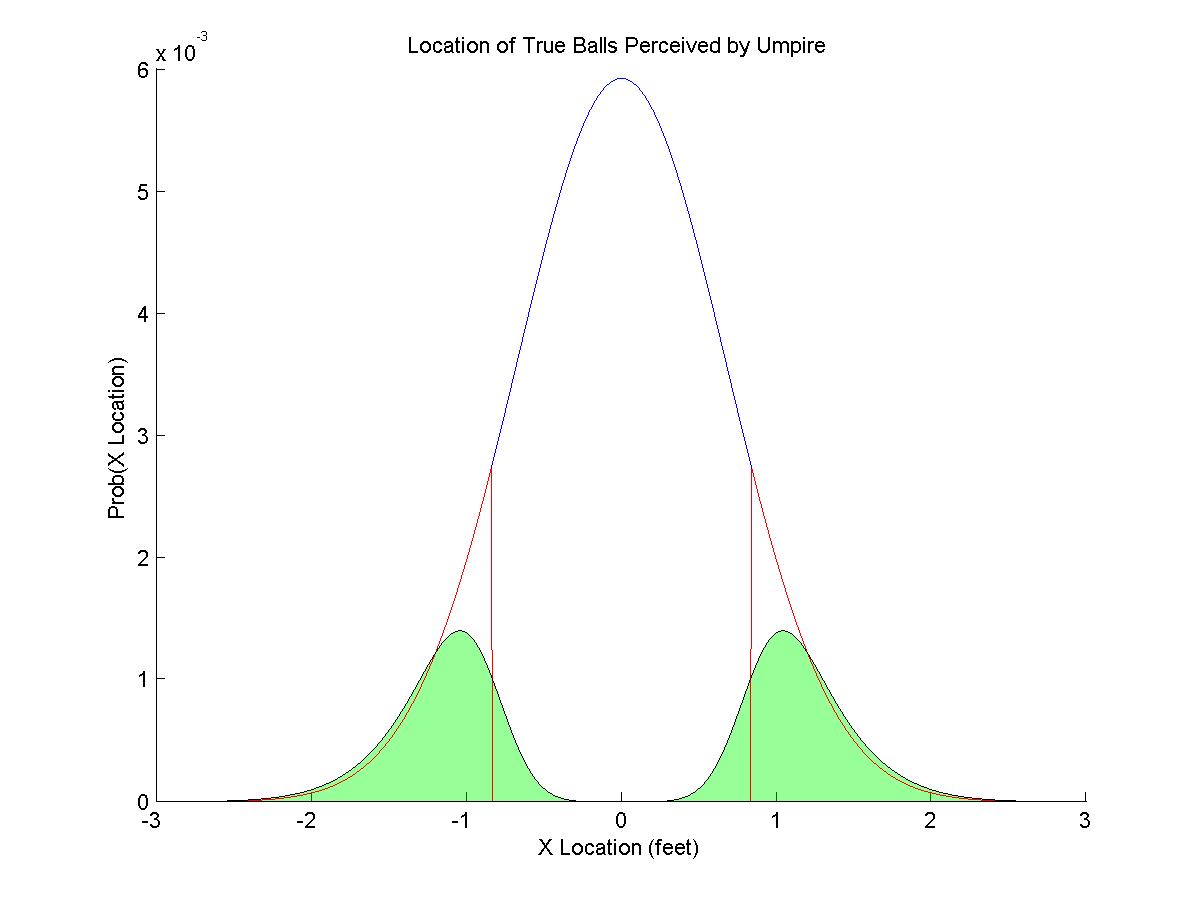
Figure 2. Histogram of the perceived location of "true" balls
Of these true balls, many appear to the umpire to cross the plate in the strike zone. That is, just the fact that the umpire is not perfect leads to some misclassifications. The green area in figure 3 reflects the true balls that are called strikes. In this figure, 16% of the actual balls are called strikes because of this error. But this isn't a bias; this error term will apply to all pitchers, regardless of their skill level.
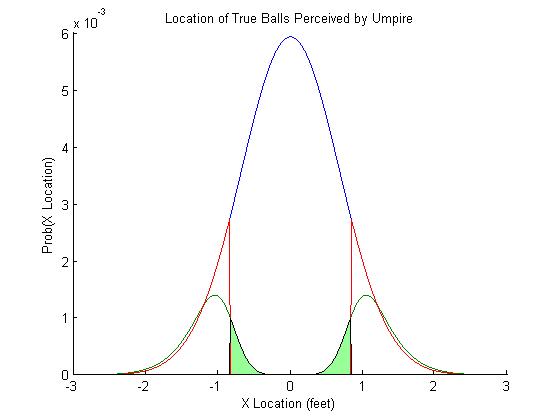
Figure 3. Pitches misclassified as strikes
The bias in the umpires perception comes in if he is trying to maximize his own performance, that is, make the fewest mistakes. The perceived distribution of pitches in figure 2 and 3 show how they would be classified if they were each considered in isolation. But we have a lot more information: we know the overall distribution of pitches. We know that a pitch closer to the center of the plate is more likely than a pitch outside. Therefore, our optimal guess, given the information and uncertainty that we have, is shown in figure 4. The green distribution in figure 4 shows the perceived location of the actual balls after the umpire takes his prior knowledge into account.
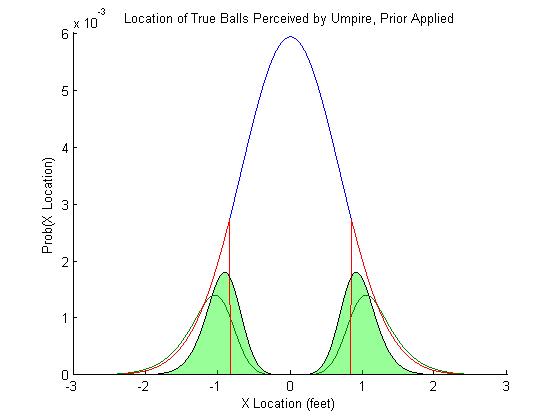
Figure 4. Pitches misclassified as strikes
Nearly 40% of the "true" pitches are now being classified as strikes (that's OK, some of the strikes are going to be misclassified as balls). Figure 5 shows the source of the misclassification. The area in red is the error caused by measurement error, the noise in the umpires perceptual system that causes him to be inherently uncertain. The area in green is caused by his priors, which will change depending on the context. If he faces a good pitcher with great control, the umpire's prior distribution should be very tight, with many strikes. If he faces Joel Zumaya, the umpire's prior distribution should be much more even (or even inverted, so that he is biased to call a ball).
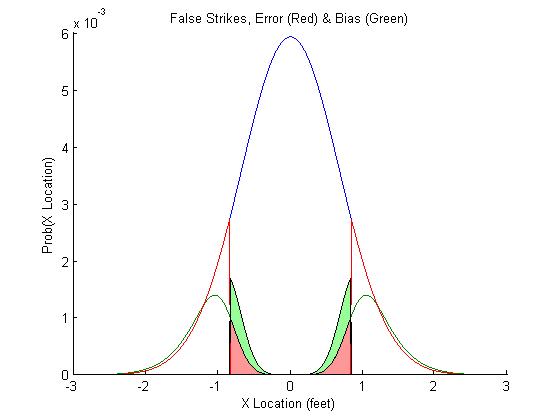
Figure 5. Pitches misclassified as strikes
Failing to take the context into account will result in impaired performance. The umpire would get more pitches wrong. If an umpire takes this "bias" into account, he is actually being as fair as he can be. If he did not use this bias, he would actually be unfairly biased against the pitchers with better control. What is fairness? Here, we would want the umpire to mistakenly call a true ball a strike as often as he calls a true strike a ball. If the umpire does not update and apply a prior based on the context, he is being unfair by this definition: when judging a good control pitcher, he will misclassify more true strikes as balls than vise versa.
Hence my initial claim: Umpires absolutely should be biased to give control pitchers a larger strike-zone.
This might be able to explain why the strikezone is a
All of that said, it's entirely unclear how an umpire should construct his prior, or what experiences should be used as a basis. Should it be based on a pitchers history? History with that umpire? The performance of that pitcher that day? The performance of all pitchers that day (not too unreasonable if the process is automatic)? The hypothesis becomes hard to test because the prior could be constructed in a number of very different ways.
| Change-Up | December 06, 2009 |
The Problematic Cubs Outfielder
 The Chicago Cubs have an outfielder who tends to miss games due to injury, flashes brilliance, makes a lot of money and struggles with his attitude from time to time. His name is Alfonso Soriano. He turns 34 in January. In the last two seasons, Soriano has managed to hit just .260/.323/.476 in 226 games played. His defense in left field is suspect. Few players in baseball enjoy more job security.
Milton Bradley had an off year in 2009. With a career .450 slugging percentage and coming off of a career high .563 number in 2008, you can understand why Cubs fans were frustrated with Bradley's lack of power. Still, Bradley managed a .378 on-base percentage and netted out as an asset to the club on the field. He wasn't worth his contract in 2009, but he helped the Cubs win baseball games more than he hurt them. The Cubs cannot say that same thing of Soriano's 2009 season. Yet, probably because he has a more favorable contract and dozens of other reasons beyond me, by all accounts, the Cubs seem determined to move Bradley and not Soriano.
When the Cubs acquired Bradley after his career season in 2008, they knew precisely what they were getting. They knew he had the ability to get on base and hit with a lot of pop if he could stay on the field. Anything approaching his 2008 campaign could have put them over the top. They also knew of his past. They knew he was emotional and complex. They also knew he was sincere. Here's Jim Hendry at the announcement of Bradley's signing:
"As we left the restaurant and stood on the curb waiting for the driver ... [Bradley] said, 'I know it's going to take some time and you have some work to do, but I want to be a Chicago Cub if you want me,'" Hendry said.
Hendry was moved by this. So much so, that he felt comfortable looking past Bradley's occasional meltdown and offering him a lucrative multi-year offer.
And here's Bradley:
"I don't feel like everybody is against me anymore," Bradley said. "I really felt like that in the past, and that I had to watch my back about everything, and I learned you have to trust somebody at some point. In Oakland, I had great teammates [and in] San Diego, Texas. Once I got around good guys who all they wanted to do was support and play with you and be a friend, I felt that love. Anybody, all they want is to be loved."My whole life all I tried to do was fit in places. I felt like I finally fit. Getting elected to the All-Star team last year by the players was a complete honor. A lot of that changed me. I just felt more comfortable being more open and letting people know who I am."
So there it is. He wants to be loved. When he hasn't felt "loved" in the past, he has reacted very poorly at the first signs of adversity. No question, Bradley bears responsibility for all of his past transgressions, but he also has shown that in an environment of acceptance and happiness, he can thrive. But at this point, at 31, Bradley is a known quantity.
When an employer looks to add to its workforce, it's hiring criteria rests on two components: ability and fit. Ability is straightforward. Does he/she interview well? How's the resume? Can they sell? Can they program? Are they innovative marketers? You get the point.
Fit is a bit more complicated. In a hands-off environment, can the individual thrive autonomously? In a more micro-managed organization, will the prospective employee be able to conform? The calculus runs deeper still. If the fit is there, maybe you make tweaks in your style. Maybe you have a candidate that could make such an impact, you decide it's appropriate to handle that employee differently than others. On the other hand, maybe the individual's working style and personality align so perfectly with your organizational culture that you can look past a mediocre resume or lackluster interview.
In this regard, in the Human Resources department, the Cubs failed miserably with either their acquisition of Milton Bradley or their subsequent handling. Either they knew that they would have to go to great lengths to make him comfortable once they brought him on board and just failed, or they signed him thinking he would be an excellent fit. It's impossible to know.
It's not too late. Imagine the impact a press conference from the Winter Meetings in Indianapolis would have if the Cubs, with Jim Hendry and Lou Piniella at the podium, said something to the following effect:
In January of this year, we acquired one of the very best players in baseball in 2008. He failed to meet our expectations on the field in 2009, he failed to meet his own expectations as well. We also think that we could have done a better job of fostering a productive environment for Milton. In 2010, that all changes. We cannot wait to welcome Bradley back to the Chicago Cubs. We urge our fans to do the same.
There is no way to know what kind of impact this would have on Bradley's play, but I know this approach would be better than eating salary and trying to pass him off for pennies on the dollar. Moreover, instead of handing Soriano a lineup spot for 2010, at least take other teams' temperature on him as well. I recognize his contract is far more burdensome than Bradley's - he's owed $18M annually through 2014 - but spilled milk is spilled milk. And Soriano is far more problematic for the Cubs than Bradley is.
Bradley is younger than Soriano, projections (at least CHONE) have him looking like a good bet to outperform Soriano, and the market for Bradley is thin thanks to teams appropriately questioning whether Bradley would make for a good fit. In this light, the Cubs would be smarter to try and move Soriano at all costs than they would be trying to move Bradley.
| F/X Visualizations | December 04, 2009 |
Pitchf/xing Passed Balls and Wild Pitches: Part Two
Two weeks ago I introduced the idea of evaluating catcher's ability to prevent wild pitches and passed balls using the pitchf/x data. In that post I presented the idea and some preliminary findings.
Here I will present that evaluation. I constructed a model which gives the probability a pitch gets passed the catcher based on the pitch type, its location and the handedness of the batter/pitcher.
Before presenting how the catchers ranked under this model I will address some questions posed by commenters. First MGL:
Obviously most WP are pitches thrown in the dirt (I assume), and almost no PB are pitches in the dirt. That is important. Also, a fastball in the dirt is extremely difficult to catch. A slider is somewhat difficult and a curve ball is not all that difficult
The pitchf/x system gives pz, the height of a pitch as it crossed the plate. Negative values are possible, those pitches have hit the ground before they got to the plate, and if they could keep going down they would have ended up somewhere below the plate. Other pitches that are very low, but positive, when they cross the plate will end up in the dirt. If one were not lazy, like me, he could go back and calculate, roughly, if a pitch will have a negative height before it reaches the catcher. I did not do this, but just looked at the reported height as it crosses the plate. Anyway here is how sliders, curves and fastballs vary for PB+WP% by height.
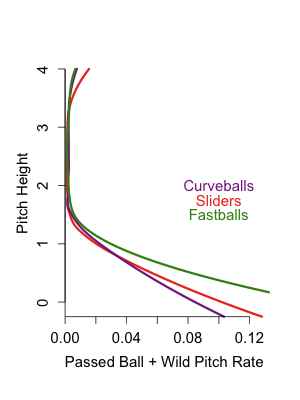
It looks like MGL is correct low fastballs are much more likley to get by the cacher than low sliders or curves.
Now Guy:
Dave: You mention that catchers have more trouble with inside pitches. While that could be the presence of the hitter, it might also be that catchers have more trouble with balls on the glove side of their body. What does this pattern look like for RHP vs. LHB? And with LHPs?
Another great question. In my post I showed just the RHB/RHP image and inferred that since inside pitches were harder because of the batter, but without looking at the other ones it could be for other reasons.
Here is the rate by horizontal location. RHBs are in black, LHBs in gray. RHPs are solid and LHPs dotted.
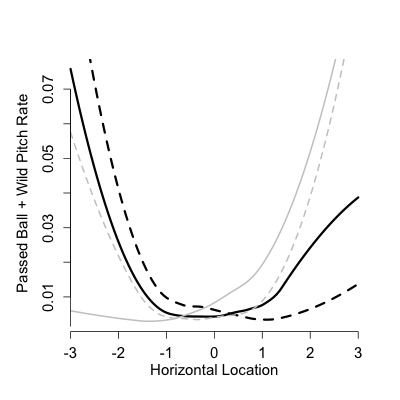
First off since the black lines both increase sharply to the left of the graph and gray lines to the right, we have that inside pitches do in fact have the highest passed ball rates regardless of handedness of the pitcher or batter. Outside pitches get by the catcher more often in same-handed at-bats than opposite for some reason. [On the left sided the dotted gray line (LHB/LHP) above the solid gray (LHB/RHP) and on the right side the solid black line (RHB/RHP) is above the dotted black (RHB/LHP) ].
Ok now for the catcher evaluations. I went through each pitch a catcher saw with men on base and based on its location and pitch type gave it a probability that the average catcher lets it by. First off there is considerable variation in expected number of passed balls/wild pitches a given catcher sees. Over the course of the pitchf/x era (part of 2007 and all of 2008 and 2009) Gregg Zaun saw the toughest pitches, with an expected 10.2 getting by him for every 1000 pitches with men on base. On the other hand Jason Varitek saw the easiest pitches. The average catcher would only let 7.1 by per 1000 pitches with men on. So it seems the model does project some variation.
It turns out that both these catchers do a good job. Here are the leaders and laggards in difference between expected and actual WP+PBs in the pitchf/x era. Each one is worth 0.28 runs, so over about two and a half years the best catcher is only about one win over average and the worst only one win below average.
+--------------------+-------+
| Catcher   WP+PB - expected |
+--------------------+-------+
| Zaun, Gregg        | -32.1 |
| Suzuki, Kurt       | -32.1 |
| Ruiz, Carlos       | -30.2 |
| Molina, Yadier     | -26.7 |
| McCann, Brian      | -24.5 |
| Varitek, Jason     | -23.7 |
| Coste, Chris       | -21.1 |
| Quintero, Humberto | -18.1 |
| Barajas, Rod       | -14.8 |
| Torrealba, Yorvit  | -14.7 |
+--------------------+-------+
| Iannetta, Chris    |  11.4 |
| Montero, Miguel    |  11.7 |
| Doumit, Ryan       |  14.4 |
| Snyder, Chris      |  14.7 |
| Burke, Jamie       |  15.4 |
| Navarro, Dioner    |  15.7 |
| Molina, Jose       |  16.5 |
| Shoppach, Kelly    |  16.7 |
| Olivo, Miguel      |  29.9 |
| Molina, Bengie     |  30.2 |
| Posada, Jorge      |  36.4 |
+--------------------+-------+
| Touching Bases | December 03, 2009 |
Controlling the Zone
"The STRIKE ZONE is that area over home plate the upper limit of which is a horizontal line at the midpoint between the top of the shoulders and the top of the uniform pants, and the lower level is a line at the hollow beneath the knee cap. The Strike Zone shall be determined from the batter's stance as the batter is prepared to swing at a pitched ball."
Eddie Gaedel knows not a called strike. The 3-foot-7 dwarf took four balls in his lone Major League plate appearance. (If you want to see a discussion on the practicality of short pinch-hitters taken well beyond its logical extreme, follow this link.
Gaedel physically shrunk the strike zone. I’m interested to see what batters can control the strike zone without any such advantage. Who manages to earn a ball on a pitch on the black or a strike on a pitch at the letters? That’s where pitchf/x comes into play.
John Walsh and Dave Allen have found the true dimensions of the strike zone using pitchf/x data. Jonathan Hale has studied individual umpire strike zones and found that Cy Young winners and control pitchers get better calls, and Hale dispelled the myth that rookies get big leagued by umps.
I assigned every pitch since 2008 an expected called strike probability based on the horizontal location of the pitch and a scaled vertical location*, while also accounting for batter handedness, pitch movement/velocity, and the umpire. After that, I added up the expected balls and called strikes of players, and the actual ball/strike numbers for all players. Here are the batters who have the largest disparity between their expected ball probability and the actual rate at which balls are called on them.
| Player | Balls:Called Strikes | Extra Balls | Ball Probability |
|---|---|---|---|
| Nelson Cruz | 2.9 | 49 | 115% |
| Chris Iannetta | 3.1 | 64 | 115% |
| Rick Ankiel | 3.6 | 47 | 115% |
| Michael Young | 2.5 | 98 | 114% |
| Ryan Raburn | 2.7 | 37 | 114% |
| John Buck | 2.9 | 38 | 113% |
| Josh Hamilton | 4.3 | 40 | 112% |
| Brad Wilkerson | 2.2 | 28 | 112% |
| Justin Morneau | 2.6 | 82 | 112% |
| Ken Griffey Jr. | 2.6 | 79 | 112% |
| Hunter Pence | 2.5 | -69 | 90% |
| Carlos Beltran | 2.5 | -75 | 89% |
| Alfonso Soriano | 2.8 | -56 | 88% |
| Travis Hafner | 2.2 | -52 | 88% |
| Brandon Phillips | 2.7 | -73 | 87% |
Michael Young and Carlos Beltran (who I suppose is synonymous with the called strike to Met fans) have the highest and lowest number of extra balls among all players, respectively. The average difference between a called strike and a ball is between a tenth and an eighth of a run. So Young has gotten nearly 20 runs of value out of controlling the strike zone better than Beltran has. To look deeper into this, I plotted their respective strike zones (Beltran's a switch hitter, so two for him) against the league average strike zones. Inside these contour lines, a pitch is more likely than not to be called a strike, while outside the contour lines, pitches are called for balls greater than 50% of the time.
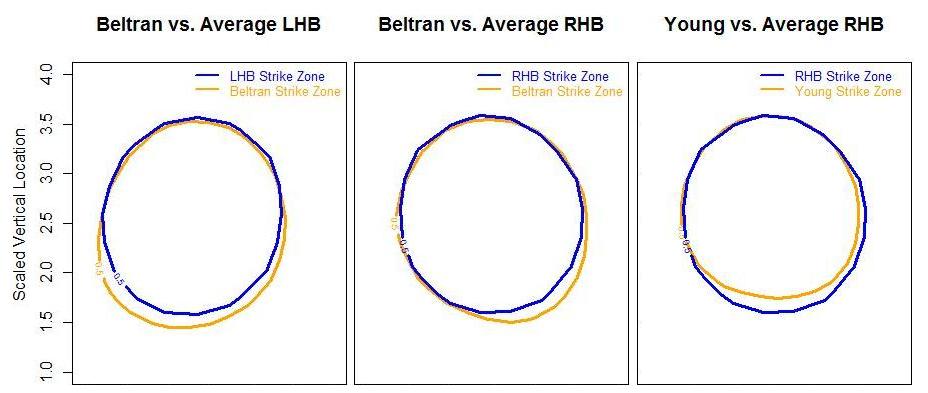
The difference between Beltran and Young can be seen at the knees. I should note the caveat that this entire effect could be caused by a few stringers listing Beltran’s bottom of the strikezone too high and Young's too low.
I don't want to make any rash conclusions on what type of players get the benefit of the doubt from umpires, but with three Rangers in the top ten, and another five Rangers in the next dozen on my list, I feel that I can say with confidence that Rudy Jaramillo is paying off umpires. Just throwing it out there. But I'm pretty sure it's true.
Seriously, though, one of the first things I noticed was that 10 of the top 30 players on the leaderboard were catchers. It turns out catchers are 2-3% more likely to have a pitch called a ball than average. It's fully possible that that's just noise, of course.
I was especially interested in batters' luck in full count situations. The leverage of a full count is double that of any other count, with the disparity in value between a walk and out coming in at around 0.6 runs. It turns out that Jack Cust, who has taken more full count pitches in the last two years than anyone but Adam Dunn, has had easily the best luck on full counts, with ten more balls called than expected. (Dunn's had one fewer than expected.)
Here I've plotted Cust's called strikes in green, balls in red, and the average LHB strike zone contour in blue.

I count two strikes easily outside the zone, and nine balls that were easily inside the zone. Most batters experience a smaller strike zone on full count than on average, but Cust has been particularly lucky. Serves him right for not swinging too often in a full count.
How about on the pitcher's side?
| Player | Balls:Called Strikes | Extra Strikes | Strike Probability |
|---|---|---|---|
| Tom Glavine | 2.1 | 88 | 178% |
| Peter Moylan | 2.3 | 45 | 130% |
| Derek Lowe | 1.9 | 288 | 129% |
| Gary Majewski | 1.9 | 28 | 126% |
| Francisco Cordero | 2.2 | 73 | 123% |
| Jorge Campillo | 1.8 | 87 | 122% |
| B.J. Ryan | 2.2 | 40 | 118% |
| Jamie Moyer | 2.0 | 171 | 118% |
| Matt Maloney | 1.9 | 18 | 117% |
| Tim Hudson | 2.2 | 61 | 117% |
| Dontrelle Willis | 2.7 | -30 | 86% |
| Luke French | 2.4 | -29 | 86% |
| T.J. Beam | 2.5 | -16 | 86% |
| Brandon League | 2.9 | -35 | 85% |
| Denny Bautista | 2.4 | -42 | 83% |
| Ryan Tucker | 3.6 | -22 | 78% |
It seems like control pitchers have better luck with umpires, which Hale has already shown. (The correlation between balls to called strikes ratio, which I'd consider a decent measure for control, is -.32.) Mariano Rivera, the best control pitcher in baseball, is 13% more likely to have his pitches called for strikes than you would expect. While watching Mo, you can sometimes actually see him intentionally try to expand the zone. When Hale did his study in 2007, he found that Derek Lowe had the highest rate of extra strikes per game. Demonstrating this ability for three straight years might be worth looking into further. Jamie Moyer and Lowe have also gotten five more strikeouts than expected on full counts, the most in the majors.
About the reliability of these ball and strike probabilities: For batters, the split-half correlation for "ball probability," (which I'm defining as the probability of a called pitch being called a ball above what is expected) reaches .5 when I limit my sample to batters with minimum of 125 called pitches. It takes batters with at least 600 called pitches to reach a .7 correlation. The league average pitches per plate appearances is 3.8, and an average of 2.1 of those pitches are called for a ball or strike by the umpire. So I’d say that it takes about 300 plate appearances for this metric to stabilize. You can compare that to more common metrics by reading the series by Pizza Cutter. or a sample of players with at least 50 plate appearances to know to regress halfway to the mean. For pitchers. r = .5 when pitchers the sample of pitchers has thrown at least 60 called pitches, and 300 called pitches to reach an r of .7.
*And Glove Slap to Tango on how to scale vertical location. I unfortunately decided to use the mean values of every batter's top and bottom strike zone values as inputted by MLBAM stringers. I probably should have scaled to the median, or better yet the median by month. Maybe next time.
| Change-Up | December 02, 2009 |
Stop Hawking Hawk
As a number of readers know, I am from Boston and a lifelong Red Sox fan. I also have married into a family of Cubs fans and so, in the spirit of concentrating on those things I feel I am most knowledgeable and passionate about, you will likely start to see the focus of the Wednesday Change-Up column narrow. Just as it did over this past weekend, more and more of my writing will center on the Red Sox and Cubbies. And to continue the theme, I thought I would look at the Hall candidacy of Andre Dawson, a Cub for six seasons and a Red Sox for two.
Joe Posnanski and more recently, Keith Law, presented arguments representing where I come down on the issue. This is not uncharted territory. Wrote Posnanski:
Dawson got on base less often than the average major leaguer of his time. That's just a very tough thing to overlook.
To counter that thinking, Ken Rosenthal has led a group of writers who contend that you can't blame Hawk for not getting on base more; that it was well within his skill set to get on base more often (the same argument was made for Jim Rice, by the way). I thought Law dealt with that line of reasoning nicely:
Yes, you will hear the argument that the value of OBP wasn't recognized during Dawson's career to the extent that it is today and that he shouldn't be penalized for it. But OBP measures how often a hitter doesn't make an out, and if you think that players, coaches and executives in the 1970s and 1980s didn't realize that making outs was bad, you are saying that people in the game in that era were, collectively, a giant box of rocks.
I would take Keith's point further. Whatever the conventional wisdom of the time, outs have always mattered the same. Each out brings you 1/27th of the way closer to the last chance for your team to score runs. That was the case in 1908, in 1946, in 2009 and certainly in 1985. Avoid outs, runners advance, runs score. It's that simple. Make outs and the club is that much closer to running out of chances to score.
Very few players managed to produce outs as prolifically as Dawson did during his career. On Baseball-Reference's Play Index, I ran a list of players who had at least 8,000 plate appearances during Hawk's playing days, 1976 to 1996. They are sorted by the number of outs made. Plenty of interesting tidbits leap off the screen but for our purposes here, let me compare Dawson to three Hall of Famers, as that seems to be the standard we should be concerned with.
During Dawson's playing career, Paul Molitor came up to the plate 235 more times than Dawson. Despite this, Dawson managed 391 more outs than Molitor. Put another way, Dawson managed this despite Molitor playing in what would amount to 50 full games more than Dawson, which would give Molitor a good 150-out head start on Hawk if you consider Molitor's career outs-per-PA numbers. Dawson managed to make up the 541-out difference. If you accept the commonly held calculation that an out is worth about -0.27 runs, then those outs Hawk gave back were worth about 146 runs, or 14-15 wins.
What about Robin Yount? He had 509 more plate appearances than Dawson between 1976 and 1996. That's about a season's worth of PA's for a platoon player or maybe a regular who does a 60-day DL stint (insert J.D. Drew jokes here). During that time, he made just 21 more outs than Dawson. How valuable would a guy that manages a .959 on-base percentage in 509 plate appearances be for a club? Let's not even give Yount credit for any hitting or power, and just assume those are all walks. With the run value of a walk at 0.30 and keeping with the -0.27 value of an out, Yount's mini-season (stretched out over 20 years of course), would be worth about 140 runs or, again, about 14 wins.
The crazy part about the Yount and Molitor cases is that, even though both were excellent players, neither was off the charts in terms of their ability to get on base. So what about someone like Rickey Henderson? Between '76 and '96, Henderson had 418 fewer plate appearances. So, in fairness, Dawson had 418 more chances to make outs than Rickey. But Dawson made 990 more outs. To put that into perspective, let's do this. Give Hawk back the 418 more chances to even up the plate appearances. We will forgive him that brutal 0-for-418 stretch that any player can go through. That still leaves him with 572 more outs. It would be as though in his 1985 season, when Dawson had 570 plate appearances, he made nothing but outs. Which, now that I look at it, he didn't come too far from doing given his paltry .295 on-base percentage that year.
You get the picture. Hawk's case amounts to counting up a bunch of numbers. He had 2,774 hits, 438 home runs, almost 1,600 RBI, 8 Gold Gloves, etc. That's fine. If you want to ignore a critical rate statistic like Dawson's .323 on-base and focus on the counting stats, then at least be thorough and consider ALL of the relevant counting statistics. Because those 7,479 outs sure stick out for me.