Rich Lederer • Baseball Beat
Patrick Sullivan • Change-Up
Jeremy Greenhouse • Touching Bases
Dave Allen • F/X Visualizations
Sky Andrecheck • Behind the Scoreboard
Marc Hulet • Around the Minors
Al Doyle • Past Times
Retired Uniforms:
Bryan Smith • WTNY
Joe Sheehan • Command Post
Jeff Albert • The Batter's Eye
RSS Feed
Home
*Examining the Past, Present, and Future*
Lineup Card
Recent Entries
» Putting Together a Reality Team
» Historical Hall of Fame Vote Comparisons: 2012
» An All-Christmas Team
» The New-Look Angels
» John Denny: The Forgotten Cy Young Award Winner
» Money Isn't Everything
» What Would It Take to Hit .400 in the 21st Century?
» Halos Heaven
» Brandon McCarthy's Breakout Season
» Link-o-Rama
» Historical Hall of Fame Vote Comparisons: 2012
» An All-Christmas Team
» The New-Look Angels
» John Denny: The Forgotten Cy Young Award Winner
» Money Isn't Everything
» What Would It Take to Hit .400 in the 21st Century?
» Halos Heaven
» Brandon McCarthy's Breakout Season
» Link-o-Rama
Best of Baseball Beat
Abstracts From the Abstracts
1977 Baseball Abstract
1978 Baseball Abstract
1979 Baseball Abstract
1980 Baseball Abstract
1981 Baseball Abstract
1982 Baseball Abstract
1983 Baseball Abstract
1984 Baseball Abstract
1985 Baseball Abstract
1986 Baseball Abstract
1987 Baseball Abstract
1988 Baseball Abstract
1978 Baseball Abstract
1979 Baseball Abstract
1980 Baseball Abstract
1981 Baseball Abstract
1982 Baseball Abstract
1983 Baseball Abstract
1984 Baseball Abstract
1985 Baseball Abstract
1986 Baseball Abstract
1987 Baseball Abstract
1988 Baseball Abstract
Bert Blyleven Series
Meeting Up and Hanging Out with Bert
The Results Are In And...
Aficionado Heavily Invested in Blyleven
Latest on Blyleven's Chances for the HOF
The Internet Zealot Responds
400 Down and 5 to Go...
Bert Be Home By Eleven?
Blyleven's Forgotten Season (1973)
HeyMan, Your Comments Don't Hold Water
The Waiting is the Hardest Part
Another Addition to the Blyleven Series
Search for the Truth
As Dominant as His HOF Contemporaries
Listen, Buster
A Larger Step for Blyleven
Answering the Naysayers (Part Two)
Another Small Step for Blyleven
Q&A: Blyleven on the Twins
The Majority Rules, Right?
It's All Dutch to Some
The Hall of Fame Case for Bert Blyleven
Q&A: Blyleven on Felix Hernandez
Clemens Rocketing Up Charts
Poz: An Interview With a KC Star
A HOF Chat with Tracy Ringolsby
Up Close and Personal
A Peek Into the Mind of a HOF Voter
Answering the Naysayers
It's That Time of the Year (Again)
"If Cooperstown is Calling..."
The Bert Alert
One Small Step for Blyleven...
Only the Lonely
Exclusive Interviews
Lee Sinins
Alex Belth
David Pinto
Will Carroll
Mike Carminati
Aaron Gleeman
Joe Sheehan
Jay Jaffe
Jeff Peek
Tracy Ringolsby
Joe Posnanski
Bill James Part I, II, III
Jon Lalonde
Chuck Tiffany
Dayn Perry
Fay Vincent
Nate Silver
Alex Belth
David Pinto
Will Carroll
Mike Carminati
Aaron Gleeman
Joe Sheehan
Jay Jaffe
Jeff Peek
Tracy Ringolsby
Joe Posnanski
Bill James Part I, II, III
Jon Lalonde
Chuck Tiffany
Dayn Perry
Fay Vincent
Nate Silver
Bullpen
Rich Lederer
The Odd Couple (with Alex Belth)
The MostUnder Over Underrated Player in Baseball (with Brian Gunn)
Three Wise Men (roundtable by Alex Belth)
Infrequently Asked Questions (interview with Matt Welch)
Interview (Orioles Think Tank)
Bernie and the Yanks (Bronx Banter)
Hope and Faith: How the LAA Win the World Series (Baseball Prospectus)
NL West (The Soul of Baseball)
Greatest Living Hitter? (Sports Illustrated)
Roundtable: 2008 HOF Ballot (Armchair GM)
The Most
Three Wise Men (roundtable by Alex Belth)
Infrequently Asked Questions (interview with Matt Welch)
Interview (Orioles Think Tank)
Bernie and the Yanks (Bronx Banter)
Hope and Faith: How the LAA Win the World Series (Baseball Prospectus)
NL West (The Soul of Baseball)
Greatest Living Hitter? (Sports Illustrated)
Roundtable: 2008 HOF Ballot (Armchair GM)
Patrick Sullivan
Designated Hitters
David Bromberg (Q&A: John Denny)
Mark Armour (H. Killebrew and Versatility)
Joe Lederer (Soundtrack of a Prospect)
David Bromberg (Clemente's Autograph)
David Bromberg (Woody Fryman)
D. Baumstein (WAR Against Age: Pitchers)
Doug Baumstein (The WAR Against Age)
Doug Baumstein (A Lifetime on the Road)
John Fraser (Pick Six)
Mark Armour (How to Score More Runs?)
Bill Parker (What Opening Day Tells Us)
Stan Opdyke (Pat Rispole)
Chris Jaffe (Evaluating Baseball's Mgrs)
Stan Opdyke (Baseball Radio in NYC, 1953)
A. Nathan (Performance of Baseball Bats)
Michael Weddell (Edgar Martinez/HOF)
Jon Weisman (100 Things Dodgers Fans...)
Stan Opdyke (Connie Mack and Vin Scully)
Eric Walker (Evaluating Run Production)
Brent Mayne (The Intangibles of Catching)
Chris Moore (Best Fastballs in Baseball)
Dave Baldwin (The Batter’s Brain)
Shawn Haviland (Ivy League to MLB)
Larry Granillo (Walking Off)
Rob Iracane (Solo HR Won't Break You)
Tommy Bennett (Charm of AM Radio)
Harry Pavlidis (Johan Santana's Fast Start)
John Walsh (WAR and Remembrance)
Eric Walker (Precisely Inaccurate)
Bob Timmermann (As They See 'Em)
Geoff Young (Unicycles and Delusions)
Baseball Analysis at Tufts (Groundballers)
Baseball Analysis at Tufts (GB Out Rates)
G. Rybarczyk ('09 Hit Tracker Projections)
Joe Lederer (Curt Schilling/HoF)
Conor Gallagher (Hall of Fallacies)
Chris Green (Jim Rice, HoF, the Numbers)
Shawn Hoffman (Baseball's Bear Mkt?)
Paul Anthony (Manny Syndrome)
Ross Roley (World Series Odds)
B. Timmermann (Catcher's Interference)
R.J. Anderson (Waiting the Hardest Part)
Maury Brown (Cubs, MLB, and Cuban...)
Myron Logan (Dee-Fense, Dee-Fense)
Craig Calcaterra (Frivolity, Part I, Part II)
Chad Finn (Ode to Baseball Cards)
David Cameron (Mariners Foibles)
Chris Dial (Chipper Jones)
Pat Lederer (Memory Lane)
David Appelman (Clutch Pitching)
Bob Rittner (DH)
Jonathan Mayo (Roger Clemens)
Lisa Winston (My Son-in-Law...)
Russ McQueen (The Yellow Hammer)
Bob Rittner (I'm OK, You're OK)
Mark Armour (In Defense of the HOF)
Pat Jordan (Friends)
Dan Levitt (Analysis of Terry Ryan)
Doug Baumstein (Trading Econ 101)
Ross Roley (Runner's Reluctance II)
Ross Roley (Runner's Reluctance I)
Mark Armour (No-Longer Lovable Sox)
Bruce Regal (Stealthy and Wise)
Brian Gunn (Roid Monster)
Current/McEvoy (Value of the SB)
John Rickert (Sinister Thefts)
Nate Silver (Sabermetrics)
David Vincent (Home Run Production)
Joe P. Sheehan (Enhanced Gameday II)
Mark Armour (An Ode to Sport)
David Gassko (All-Time Worm Burners)
Joe P. Sheehan (Enhanced Gameday)
John Walsh (When Titans Clash)
Fox/Williams (Quantifying Coaches II)
Fox/Williams (Quantifying Coaches I)
Jacob Luft (Bull Durham Rant)
Chad Finn (Strat-O-Matic)
Lisa Winston (Rotisserie Baseball)
Dave Studeman (Baseball Stats)
Steve Treder (Roger Craig)
Marc Normandin (Jeff Bagwell)
D. Appelman (Expanding Strike Zone)
Jeff Sackmann (Worst MiL Defenders)
Jeff Sackmann (Best MiL Defenders)
Maxwell Kates (Van Lingle Mungo)
David Appelman (Pitch Location)
Kent Bonham (Danny Ray Herrera)
Glenn Stout (Two Baseball Poems)
Bruce Regal (The Challenge Round)
Mark Lamster (Barry & Ty)
Geoff Young (NL West)
Tom Lederer (The Ryan Express)
Brian Erts (Great Leap Forward)
David Pinto (Parity and the N.L.)
Jacob Luft (Fathers and Daughters)
Jamey Newberg (Pete's Sake)
Jeff Albert (A. Jones Swing Analysis)
Jeff Albert (A-Rod Swing Analysis)
Keith Law (Death, Taxes, and Waivers)
Peter Abraham (Tales of Torre Tales)
Larry Borowsky (Let 'er Rip II)
Dan Levitt (Empirical Analysis of Bunting)
Jonah Keri (If I Met Warren Cromartie...)
Bob Klapisch (War Stories)
Bob Timmermann (John F. Kennedy HS)
Kent Bonham (Aluminum Adjustments)
Al Doyle (More Than Superstars)
Ross Roley (Instant Replay)
David Vincent (Barry Bonds Homers)
Chad Finn (Our Favorite Obscurities)
Bill Deane (1979 NL MVP)
Mark Armour (Rise/Fall of Artificial Turf)
Jeff Angus (Wally Moon Camp)
David Berri (Money and Baseball)
Larry Borowsky (Baseball w/o the #s)
Derek Zumsteg (The Irrational Market)
David Regan (Free Agent Contracts)
Peter Schmuck (Steroids and the HOF)
David Appelman (Pitchers, Pitch by Pitch)
Dan Fox (Swinging, Taking, Fouling, Etc)
Patrick Sullivan (Study of NYY CF/BOS LF)
Will Leitch (Baseball Journalism)
Jeff Sullivan (Pitcher Release Points)
Steve Treder ('69-'70 Giants)
Maury Brown (Charlie Finley)
John Brattain (Bob Johnson)
Bob Klapisch (The Case for Bert Blyleven)
Jeff Peek (Pride and Prejudice)
Dayn Perry (Bert and Warren)
Rob Neyer (If Don Sutton Was Great...)
Lisa Winston (Minor League Memories)
Alex Belth (Otis Redding Was Right)
David Cameron (Long Live the King)
Jeff Angus (Baserunning Study)
Bert Blyleven (Baseball Playoffs)
Boyd Nation (Not a Prospect List)
James Click (Batters-Baserunners Study)
Jeff Shaw (Why I Love Baseball)
David Gassko (BIP/BFP Fielding Study)
Jay Jaffe (Milwaukee Sausage Race)
Jamey Newberg (Remember When)
Bob Klapisch (Press Box to the Mound)
Dan Levitt (Predictive Value of BB)
David Vincent (Official Scorer)
Jon Weisman (Rick Monday)
Larry Borowsky (Let 'er Rip)
Will Carroll (Fictional Short Story)
Bob Timmermann (Japanese Baseball)
Cyril Morong (Best Pitching Seasons)
Sean Forman (Monte Carlo Win-Loss)
Brian Gunn (My Little Blue Book)
Joe Lederer (My Dad and Baseball)
Bill Deane (Bob Gibson, 1968)
Mark Armour (1977 Yankees)
Darren Viola (Retrosheet)
David Pinto (RFK)
Dayn Perry (Brave Heart)
Matt Welch (Dave Hansen)
Kevin Kernan (Jack McKeon)
Tom Lederer (Dodgers Road Trip)
Steve Lombardi (Slider)
Studes (Picturing Baseball)
Mike Carminati (Luck of the Drawl)
Eric Neel (Vin Scully)
J.C. Bradbury (Leo Mazzone)
John Sickels (Bill James)
Search Baseball Analysts
Archives
By Category:
Around the Majors Content Only
Around the Minors Content Only
Baseball Beat Content Only
Baseball Beat/Change-Up Content Only
Baseball Beat/WTNY Content Only
Behind the Scoreboard Content Only
Change-Up Content Only
Change-Up/Around the Majors Content Only
Command Post Content Only
Crunching the Numbers Content Only
Designated Hitter Content Only
F/X Visualizations Content Only
Past Times Content Only
Saber Talk Content Only
The Batter's Eye Content Only
Touching Bases Content Only
Weekend Blog Content Only
WTNY Content Only
By Month:
February 2012
January 2012
December 2011
October 2011
September 2011
August 2011
July 2011
June 2011
May 2011
April 2011
March 2011
February 2011
January 2011
December 2010
November 2010
October 2010
September 2010
August 2010
July 2010
June 2010
May 2010
April 2010
March 2010
February 2010
January 2010
December 2009
November 2009
October 2009
September 2009
August 2009
July 2009
June 2009
May 2009
April 2009
March 2009
February 2009
January 2009
December 2008
November 2008
October 2008
September 2008
August 2008
July 2008
June 2008
May 2008
April 2008
March 2008
February 2008
January 2008
December 2007
November 2007
October 2007
September 2007
August 2007
July 2007
June 2007
May 2007
April 2007
March 2007
February 2007
January 2007
December 2006
November 2006
October 2006
September 2006
August 2006
July 2006
June 2006
May 2006
April 2006
March 2006
February 2006
January 2006
December 2005
November 2005
October 2005
September 2005
August 2005
July 2005
June 2005
May 2005
April 2005
March 2005
February 2005
January 2005
December 2004
November 2004
October 2004
September 2004
August 2004
July 2004
June 2004
May 2004
April 2004
March 2004
February 2004
January 2004
December 2003
November 2003
October 2003
September 2003
August 2003
July 2003
June 2003
Reference
Organizational Stats
Arizona Diamondbacks Bat / Pitch
Atlanta Braves Bat / Pitch
Baltimore Orioles Bat / Pitch
Boston Red Sox Bat / Pitch
Chicago Cubs Bat / Pitch
Chicago White Sox Bat / Pitch
Cincinnati Reds Bat / Pitch
Cleveland Indians Bat / Pitch
Colorado Rockies Bat / Pitch
Detroit Tigers Bat / Pitch
Florida Marlins Bat / Pitch
Houston Astros Bat / Pitch
Kansas City Royals Bat / Pitch
Los Angeles Angels Bat / Pitch
Los Angeles Dodgers Bat / Pitch
Milwaukee Brewers Bat / Pitch
Minnesota Twins Bat / Pitch
New York Mets Bat / Pitch
New York Yankees Bat / Pitch
Oakland Athletics Bat / Pitch
Philadelphia Phillies Bat / Pitch
Pittsburgh Pirates Bat / Pitch
St. Louis Cardinals Bat / Pitch
San Diego Padres Bat / Pitch
San Francisco Giants Bat / Pitch
Seattle Mariners Bat / Pitch
Tampa Bay Devil Rays Bat / Pitch
Texas Rangers Bat / Pitch
Toronto Blue Jays Bat / Pitch
Washington Nationals Bat / Pitch
All-Star Links
Official Websites
News and Notes
Baseball News Blog
Baseball Newstand
ESPN Baseball
Fox Sports Baseball
Pro Sports Daily
Roto World
The Roto Times
USA Today Baseball
Baseball Newstand
ESPN Baseball
Fox Sports Baseball
Pro Sports Daily
Roto World
The Roto Times
USA Today Baseball
Reference and Analysis
Baseball Almanac
Baseball America
Baseball Archive
Baseball Contracts
Baseball Cube
Baseball Graphs
Baseball Library
Baseball Musings Player Database
Baseball Page
Baseball Primer
Baseball Prospectus
Baseball Reference
Baseball Statistics
Baseball Truth
Boxscore Central
Diamond Mind Baseball
Doug's Stats
FanGraphs
Fast Balls (pitchfx catalog)
Hardball Dollars
Hardball Times
Hit Tracker
Retrosheet
Rotobase/Rotoblog
Stat Corner
STATS
Tango on Baseball
Yahoo Sports MLB
Web Gems
Bill James Primer
Sabermetric Manifesto (Grabiner)
Pitching and Defense (McCracken)
Pitching and Defense (Tippett)
Transactions Primer (Neyer)
Baseball Stats (Batter's Box)
Prospect Report (Cameron)
Pitcher Workloads (Sheehan)
Goodbye to Old Baseball Ideas (Rickey)
Sabermetric Manifesto (Grabiner)
Pitching and Defense (McCracken)
Pitching and Defense (Tippett)
Transactions Primer (Neyer)
Baseball Stats (Batter's Box)
Prospect Report (Cameron)
Pitcher Workloads (Sheehan)
Goodbye to Old Baseball Ideas (Rickey)
Columnists
Baseball Blogs
Around the Majors
Athletics Nation
Baseball Crank
Baseball Musings
Baseball-Reference Blog
Batter's Box
Big League Stew
Bronx Banter
Catfish Stew
Cub Town
Dan Agonistes
Dodger Thoughts
DRays Bay
Ducksnorts
Futility Infielder
Halos Heaven
Inside the Rockies
It Might Be Dangerous
Knuckle Curve
LoHud Yankees Blog
Lookout Landing
Management by Baseball
Metaforian
Metsgeek
Mike's Baseball Rants
Only Baseball Matters
Redbird Nation
Red Reporter
Sabernomics (Braves)
Seth Speaks
ShysterBall
6-4-2 (Angels/Dodgers)
The Book
TheCubdom
The Cutting Edge
The House That Dewey Built
The View From The Bleachers
Tiger Blog
U.S.S. Mariner
Viva El Birdos
Where's Kernan
Minor Leagues
Arizona Fall League
BA Player Finder
Cal Leaguers
Jamey Newberg
JDM's Scoresheet Baseball
Minor League Baseball
Minor League Park Factors
Minor League Splits
No Pepper
Sickels' Minor League Ball
Warm October Nights
BA Player Finder
Cal Leaguers
Jamey Newberg
JDM's Scoresheet Baseball
Minor League Baseball
Minor League Park Factors
Minor League Splits
No Pepper
Sickels' Minor League Ball
Warm October Nights
Amateur
Boyd's World (College)
Cape Cod Baseball League
College Baseball Blog
College Baseball Insider
Collegiate Baseball Newspaper
College Splits
College Splits Blog
Dirtbags Baseball (Long Beach State)
NCAA Baseball
NCBWA
Team One Baseball (High School)
Texas A&M & Baseball
Cape Cod Baseball League
College Baseball Blog
College Baseball Insider
Collegiate Baseball Newspaper
College Splits
College Splits Blog
Dirtbags Baseball (Long Beach State)
NCAA Baseball
NCBWA
Team One Baseball (High School)
Texas A&M & Baseball
Historical
Cuban Baseball
House of David
Jim "Mudcat" Grant's Web Page
Negro League Baseball Players Assoc
Negro Leagues Baseball Museum
1919 Black Sox
Pacific Coast League
Philadelphia Athletics Historical Society
Shoeless Joe Jackson Society
SABR-L Archives
Walter O'Malley
House of David
Jim "Mudcat" Grant's Web Page
Negro League Baseball Players Assoc
Negro Leagues Baseball Museum
1919 Black Sox
Pacific Coast League
Philadelphia Athletics Historical Society
Shoeless Joe Jackson Society
SABR-L Archives
Walter O'Malley
Miscellaneous
Forums
Credits
Ticket Center
Tickets to Baseball -
Premium Red Sox Tickets - Tickets to Marlins Games - Cardinals Game Tickets - NY Yankee Tickets - Tickets Oakland Athletics - Dallas Cowboys Tickets - Arizona Cardinals Tickets - Tickets Seattle Seahawks - Buffalo Bills Tickets Online - Tickets to Dolphins Football
Buy Boston Red Sox tickets,
Philadelphia Phillies tix,
NY Yankees tickets,
NY Mets tickets, and
MLB All Star game tickets at ABC tickets
Not sure where to find the best online sportsbooks? Start your search with PlayersJet.
Get deals at SportsMemorabilia.com on baseball apparel, including Phillies jerseys and more for adults and children.
Shop the largest selection baseball equipment on sale at Sports Unlimited. Check out tons of baseball gloves, youth baseball gloves and catchers gear from Rawlings, Wilson, Nike & Under Armour.
2011 Draft Order
Courtesy of Baseball America
First-Round:
 1. Pirates (57-105)
 2. Mariners (61-101)
 3. Diamondbacks (65-97)
 4. Orioles (66-96)
 5. Royals (67-95)
 6. Nationals (69-93)
 7. Diamondbacks (for B. Loux)
 8. Indians (69-93)
 9. Cubs (75-87)
10. Padres (for Karsten Whitson)
11. Astros (76-86)
12. Brewers (77-85)
13. Mets (79-83)
14. Marlins (80-82)
15. Brewers (for Dylan Covey)
16. Dodgers (80-82)
17. Angels (80-82)
18. Athletics (81-81)
19. Red Sox (from DET for Martinez)
20. Rockies (83-79)
21. Blue Jays (85-77)
22. Cardinals (86-76)
23. Nationals (from CWS for Dunn)
24. Rays (from BOS for Crawford)
25. Padres (90-72)
26. Red Sox (from TEX for Beltre)
27. Reds (91-71)
28. Braves (91-71)
29. Giants (92-70)
30. Twins (94-68)
31. Rays (from NYY for Soriano)
32. Rays (96-66)
33. Rangers (from PHI for Lee)
Supplemental First Round:
34. Nationals (Dunn)
35. Blue Jays (Downs)
36. Red Sox (Martinez)
37. Rangers (Lee)
38. Rays (Crawford)
39. Phillies (Werth)
40. Red Sox (Beltre)
41. Rays (Soriano)
42. Rays (Balfour)
43. Diamondbacks (LaRoche)
44. Mets (Feliciano)
45. Rockies (Dotel)
46. Blue Jays (Buck)
47. White Sox (Putz)
48. Padres (Garland)
49. Giants (Uribe)
50. Twins (Hudson)
51. Yankees (Vazquez)
52. Rays (Benoit)
53. Blue Jays (Olivo)
54. Padres (Torrealba)
55. Twins (Crain)
56. Rays (Choate)
57. Blue Jays (Gregg)
58. Padres (Correia)
59. Rays (Hawpe)
| F/X Visualizations | March 31, 2011 |
Comparing 2011 Division Projections
Last year before the 2010 season started I looked at how a couple different projection systems saw the season playing out. With this season just one day old, I wanted to do the same for the 2011 projections. Here I take a graphical look at the number of wins six systems project for every team and plot those out for each division separately. This gives a good picture of the range of predictions and how much consensus there is across systems.
I used five projection systems for which I could get win totals and the Vegas regular season over/under win totals. I grabbed the Marcel, Bill James and Cairo projections complied by the folks at RLYW who ran the player-level projections for those systems through the Diamond Mind Simulator to get win totals. I also used THT's Oliver and BPro's Pecota projections (as of March 30th). The Vegas lines are from Pinnacle Sports, so they are not really Vegas's numbers but the offshore ones (also as of March 30th).
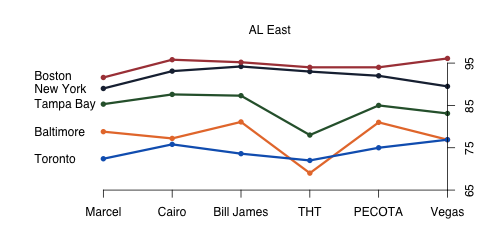
All of the projections systems see a pretty clear ordering of the five AL east teams, with a slight disagreement in the cellar dweller Toronto (Marcel, Cairo, Bill James, Pecota) or Baltimore (THT, Vegas). I was surprised to see Baltimore come out on top of Toronto in so many projections. Although not a difference in ordering, THT is not nearly as fond of Tampa Bay as the other systems are. And interestingly Vegas has a lower win total for the Yankees than any other system, I always assumed that there would be a pro-Yankees bias among bettors.
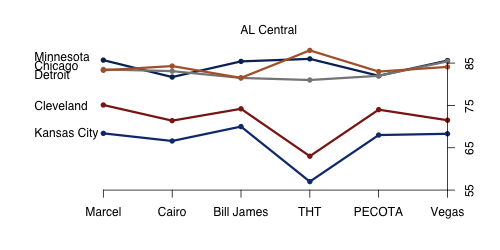
All six projections see the AL Central as pretty clearly two-tiered — with Minnesota, Chicago and Detroit competing for the division title and then Cleveland and KC a solid ten wins behind. Though everyone likes Cleveland more than Kansas City. As in the AL East THT has some outlier values, projecting more extreme values for Detroit, Cleveland and Kansas City
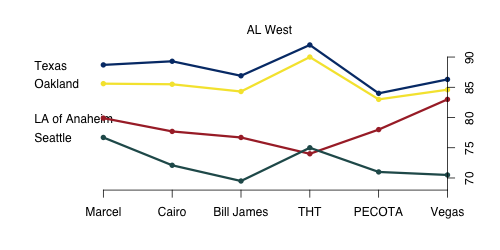
The AL West is similarly two-tiered — with Texas and Oakland at the top, and Los Angeles and Seattle bringing up the rear. There is only one disagreement in the ordering with THT thinking Seattle is above Los Angeles. THT also likes the top two teams much more than the other systems do. Vegas is pretty high on LA, seeing them just a slight step behind the Texas and Oakland. If you have faith in the projection systems over the bettors and bookmakers an under on the Angels is a clear play.
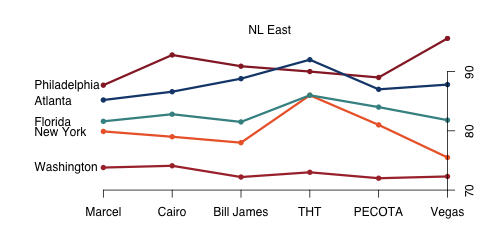
There is a farily well agreed upon ordering in the NL East,.THT is again something of an outlier projecting New York and Florida as fairly even while everyone else clearly prefers Florida, and is the only system that likes Atlanta over Philadelphia to win the division. If you trust the projections systems over Vegas this division offers two opportunities: the under on Philly and the over on New York.
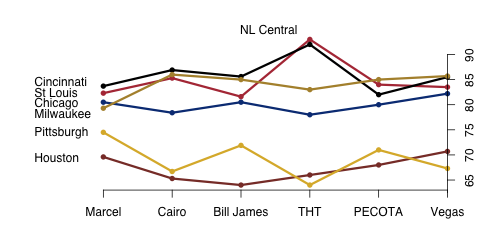
Sorry about the color choice here. Both St. Louis and Cincinnati deserve red, but their lines are very close so to keep things distinct. So I went with black for Cincinnati and red for St. Louis. This is another two-tiered division with four teams fairly close at the top (though Chicago is at the bottom of the top tier in most systems) and then two bottom dwellers. Like the AL Central this is projected to be a pretty competitive conference. Again THT is something of an outlier liking Cincinnati and St. Louis much more than the other systems.
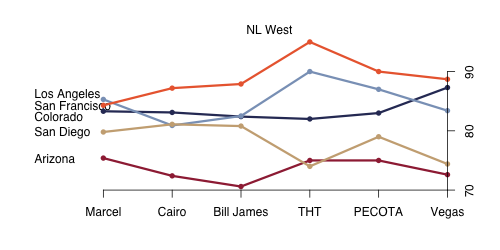
Five of the six systems like San Francisco to repeat at NL West champions, with Marcel the lone dissenter picking Los Angeles. THT is again the most bullish about the favorite's win total, as it is the only system projecting more than 90 wins for San Francisco. Vegas likes Colorado by a fairly big margin compared to the projection systems, so there is another play if you are so inclined.
| Baseball Beat | March 26, 2011 |
Looking for Breakout Players Based on Spring Training Stats
How many analysts, writers, and fans predicted Jose Bautista's breakout season last year? Well, I know of one. That's right, John Dewan, the owner of Baseball Info Solutions, cited Bautista as the No. 1 potential breakout player based on his 2010 spring training slugging percentage near .900, which was almost .500 higher than his career norm.
How did Bautista, who sported a career line of .238/.329/.400 with 59 HR in 2038 plate appearances prior to last season, hit in 2010? Try .260/.378/.617 while leading the majors in home runs with 54 and total bases with 351.
While Dewan admits that a player's spring stats, for the most part, are "not predictive of regular season success," a study he performed a few years ago found that "extremely good spring training numbers often indicated that a breakout season was on the way. In the study, about two-thirds of hitters who had spring slugging percentages at least .200 higher than their career total went on to best their career average that season."
Who could follow in Bautista's footsteps in 2011? My guess is that nobody will come close to matching what he did last year. Nonetheless, if you're looking for a relative unknown to break out this year, you might consider the following ten candidates based on their spring training slugging percentages.
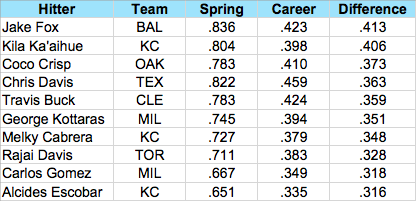
Note: Used with permission from John Dewan's Stat of the Week®, www.statoftheweek.com.
Jake Fox leads all players with nine homers this spring, including six in his last 28 at-bats. The 28-year-old has jacked 18 HR in a three-year career covering 467 plate appearances. His outstanding spring has likely earned him a spot on the Baltimore Orioles roster as the primary backup to catcher Matt Wieters and first baseman Derrek Lee.
Patrick Sullivan covered Kila Ka'aihue for Baseball Analysts last month. Ka'aihue, who turns 27 on Tuesday, has hit .429 and gone yard five times this spring. He hit .319/.463/.598 in Triple-A last year prior to being called up to the Kansas City Royals. He struggled in August but finished strongly by hitting .274/.361/.548 with six HR in 84 AB in September. He is slated to alternate with Billy Butler at first base and DH this season.
Center fielders Coco Crisp, Rajai Davis, and Carlos Gomez, and shortstop Alcides Escobar are more known for their speed and defense than their slugging. However, it should be pointed out that Crisp hit 15 HR in 2004 and 16 in 2005 when he was an up and coming star for the Cleveland Indians. After four disappointing seasons in which Crisp managed to hit just 24 HR, the switch hitter found his power stroke again last year when he produced eight four baggers in 75 games for the Oakland A's.
Chris Davis, Travis Buck, George Kottaras, and Melky Cabrera have all been highly regarded prospects at one time or another. Davis slugged a combined 38 homers in 736 plate appearances as a 22-year-old rookie and 23-year-old sophomore in 2008 and 2009. The lefthanded power hitter slumped badly for the Texas Rangers at the outset of the 2010 season and was sent to Oklahoma City (Triple-A) where he generated a line of .327/.383/.520 with 31 doubles and 14 home runs in fewer than 400 AB.
Buck was selected by the A's with the 36th overall pick in the 2005 draft and proceeded to hit .288/.377/.474 during his rookie season in 2007. However, the 27-year-old outfielder never came close to duplicating those results in 2008-2010 and was non-tendered last December. He signed a minor-league deal with the Indians with an invitation to spring training and has made the most of it by hitting .420/.453/.760 with five doubles and four home runs in 50 at-bats.
Kottaras has bounced around from the San Diego Padres organization (2003-2006) to the Boston Red Sox (2006-2009) to the Milwaukee Brewers (2010). He received more playing time than ever last year and cranked nine homers in 250 plate appearances. Kottaras and Wil Nieves are in a battle to serve as catcher Jonathan Lucroy's primary backup.
While it seems as if Cabrera has been around forever, he is only 26 years old despite amassing more than 2,600 plate appearances over the past five seasons. He reportedly dropped 15 pounds during the offseason and the six-footer is now down to 200. The slim and trim center fielder has raked to the tune of .490 with five doubles and two home runs in 51 at-bats this spring.
| Baseball Beat | March 25, 2011 |
News and Views: New York Yankees Starting Rotation
The New York Yankees reportedly signed Kevin Millwood to a minor league deal on Friday. The 36-year-old righthander will compete with the 37-year-old Bartolo Colon and the 34-year-old Freddy Garcia for the fifth spot in the team's starting rotation. And let's not forget Mark Prior who hasn't pitched in the major leagues since 2006!
These candidates would make for a nice staff if this were 2003 rather than 2011. I mean, this foursome might even give the Philadelphia Phillies' quartet a run for their money. You see, eight years ago, Colon, Garcia, Millwood, and Prior combined to post a 59-45 record with a 3.71 ERA and 733 SO/256 BB in 876.2 IP when all four starters were in their 20s.
Hey, if it's not 2003, then maybe it is the 1960s as we shouldn't forget that the club is also counting on a first-generation Nova.
| Baseball Beat | March 19, 2011 |
Scouting the G-Men (Gaviglio and Gagnon) and More
Living within walking distance of Blair Field, the home ballpark of the Long Beach State Dirtbags and the venue for many area high school teams, allows me the opportunity to witness a number of prospects every year. I have attended almost every Friday night home game that Long Beach State has played since Jered Weaver's sophomore year in 2003. Along the way, I have seen Weaver, Troy Tulowitzki, and Evan Longoria countless times plus several other notable first-round draft picks, including a matchup of Tim Lincecum vs. Ian Kennedy at USC in 2006, Bryce Harper at the Area Code Games in 2008, and Stephen Strasburg at the Major League Baseball Urban Youth Academy's Collegiate Baseball Tournament in Compton.
Last night, I was at Blair Field once again to see one of the best college pitching performances in the history of the park. While Oregon State's Sam Gaviglio is not a prospect in the class of Weaver, Lincecum, or Strasburg, the junior righthander nonetheless pitched one of the most impeccable games in the 50-plus years of this facility as the Beavers (14-3) defeated the Dirtbags (9-8), 4-0, in the opener of a three-game series between these two West Coast schools. Gaviglio (Guh-VEE-leo) threw seven perfect innings and allowed just one baserunner (a lead-off single in the eighth) in a complete-game shutout. He struck out the first four, nine of the first ten, and a career-high 14 overall while facing just 28 batters and throwing only 99 pitches.
 Gaviglio (4-0, 0.00 ERA) has now pitched 38 consecutive scoreless innings, just nine short of the single-season record of 47 by Todd Helton of Tennessee in 1994. Vermont's George Plender holds the NCAA record with 63 innings, accomplished over the 1954 and 1955 seasons. Gaviglio gave up two unearned runs in the first inning in a season-opening win over Gonzaga while outdueling the highly regarded Ryan Carpenter, threw a CG SHO against Connecticut (holding likely first rounder George Springer to an 0-for-3 with a SO) in his second start, held Hartford scoreless for six innings in his third outing, and whitewashed New Mexico State for eight prior to shutting out Long Beach State. He has allowed 14 hits and four walks while striking out 40 in 38 2/3 IP.
At 6-1 and 195 pounds, Gaviglio is the same listed height and weight as Kennedy when the latter was pitching for the Trojans from 2004-2006. The two RHP also share the fact that both rely on pitchability more than pure stuff. Gaviglio's fastball is a little light (mostly 86-88 with a high of 90) as compared to Kennedy's (89-91 when I scouted him during his college days), but his command and ability to throw strikes to both sides of the plate with all three pitches (FB-CB-CH) and at any time in the count rivals the pitcher who was recently named to start on opening day for the Arizona Diamondbacks. Gaviglio's breaking ball ranged from 78-82 and his changeup 77-81.
Gaviglio, who turns 21 in May, was a 40th-round selection in 2008 by Tampa Bay after being named the 5A Pitcher of the Year in Oregon while leading Ashland to the state championship. He chose the Beavers over the Rays and went 10-1 with a 2.73 ERA and 55 SO/9 BB in 62 2/3 IP during his freshman season. He regressed as a sophomore, going 3-4 with a 5.60 ERA and 45 SO/23 BB in an identical number of innings.
The dozen or so professional scouts (plus ESPN's Keith Law) sitting behind home plate a few rows in front of my brother and me were seemingly more interested in the opposing pitcher on Friday night. Andrew Gagnon, a 6-4/195 righthanded junior, had his first rough outing of the year, giving up six hits, four walks, and four runs in five innings. However, Gagnon (GAN-yawn) has faced much stiffer competition than Gaviglio thus far, with all five starts against ranked teams (Cal State Fullerton, Arizona, Oregon, Rice, and Oregon State). He retired Owls third baseman Anthony Rendon, a potential first pick in the 2011 draft, all three times (fly out to RF, groundout to 2B, and a line out to SS) when they hooked up a week ago Friday at AT&T Park in San Francisco.
 Gagnon, who gave up back-to-back home runs to OSU's Andrew Susac and Danny Hayes in the top of the first inning, saw his ERA rise from 1.30 to 1.91. He has allowed 25 hits and 13 walks while striking out 31 in 37 2/3 innings in 2011. Gagnon took over the role of the Friday night starter as a sophomore and moved up draft boards when he led the Cape Cod league with five wins while posting a 2.10 ERA and 43 K's in 38 2/3 IP. He was the Eastern Division starting pitcher for the Cape All-Star Game at Fenway Park and got the side out in order in his only inning of work. Gagnon throws an 89-92 mph fastball (with it comfortably sitting at 91), an 84-87 slider, and a low-80s change. His fastball is a bit straight and prone to getting turned around when left up in the zone. (Here is a video of Gagnon vs. Oregon on 3/4/11).
Susac (Suu-SACK) is a draft-eligible sophomore. At 6-1/205, the catcher has a pro body with a strong arm, quick pop times, and raw power at the plate. The home run he slugged cleared the wall in left-center field with lots of room to spare, a blast that was easily over 400 feet. He hit a hard groundball single between short and third in his next at-bat and drew a walk in the ninth. Susac (.453/.563/.811), riding a 13-game hitting streak, is 24-for-53 on the season with 7 2B, 4 HR, 14 BB, and 11 SO.
Baseball America ranked Susac, who turns 21 on Tuesday, as its No. 5 prospect in the Cape Cod League last summer when he hit .290 with five homers and the 23rd top college prospect for the 2011 draft. He was selected in the 16th round of the 2009 draft by the Philadelphia Phillies but did not sign. I wouldn't be surprised at all if a team took him in the first round in June.
Two weeks ago, I was on hand to see Oregon's Tyler Anderson also strike out 14 Dirtbags. The 21-year-old lefthander worked eight scoreless innings, throwing 77 strikes out of 112 pitches. After beating San Diego today, Anderson is now 3-0 with a 0.96 ERA and 52 SO/14 BB in 37 1/3 IP.
The 6-4, 215 pounder, who was drafted in the 50th round by the Minnesota Twins in 2008, was rated the 16th-best college prospect by Baseball America prior to the season. His fastball, which sat at 89-92 the night I saw him pitch against the Dirtbags, plays up due to a deceptive motion that includes a little quirk with the ball behind his back. The combination of a slightly across-the-body delivery and a slider with reasonable tilt wreaks havoc on LHB. Anderson can also handle RHB owing to a plus changeup with fade that ranks as his best pitch. Lastly, he displayed a strong move to first base, picking off two runners that evening. (Here is a video of Anderson vs. Long Beach State on 3/4/11.)
| Baseball Beat | March 15, 2011 |
Graphing the Pitchers: LOB% and BABIP
Thanks to the work of Voros McCracken and later Tom Tango, Defense Independent Pitching and Fielding Independent Pitching have become widely accepted in the baseball community as better measurements of pitching effectiveness (and predictability of future results) than earned run average (ERA). DIPS and FIP focus on strikeouts, walks, and home runs — the three primary outcomes that a pitcher controls. Except for perhaps catchers, fielders have no impact on these events.
While SO, BB, and HR play a large part in determining ERA, the latter is also a function of defensive and bullpen support, as well as performance with bases empty vs. runners in scoring position. As a result, the difference between ERA and FIP is almost entirely accounted by strand rate (LOB%*) and batting average on balls in play (BABIP). Each variable has a coefficient correlation of nearly 80 percent with the delta between ERA and FIP.
* Based on the formula, the strand rate is an estimator of LOB% rather than an actual tally.
When you put the two together (LOB% divided by BABIP), the coefficient correlation jumps to 90 percent. Accordingly, the coefficient of determination or R² is 81 percent. In other words, more than four-fifths of the difference between ERA and FIP is due to LOB% and BABIP. As such, in addition to SO, BB, and HR rates, it makes sense to study LOB% and BABIP to understand why a pitcher's ERA may be better or worse than his FIP.
The MLB averages for LOB% and BABIP have been running at almost exactly 72 percent and .300, respectively, for several years. These percentages held true once again in 2010.
Plotting LOB% on the y-axis and BABIP on the x-axis for all 147 pitchers who threw at least 100 innings in 2010, I created the following graph. As has become customary around these parts, I broke the graph into quadrants via the intersection of the LOB% and BABIP means. The pitchers in the northwest quadrant had high LOB% and low BABIP. Moving clockwise, the pitchers in the northeast quadrant had high LOB% and high BABIP, the hurlers in the southeast quadrant had low LOB% and high BABIP, and those in the southwest quadrant had low LOB% and low BABIP.
The numbers were lifted from FanGraphs in January. The BABIP data was subsequently recalculated, perhaps due to FanGraphs using an incorrect formula initially. While directionally correct, the BABIP used for this graph are generally about .005-.010 higher than those listed on the site now. The LOB% data matches exactly. You can download the spreadsheet with the applicable data here.
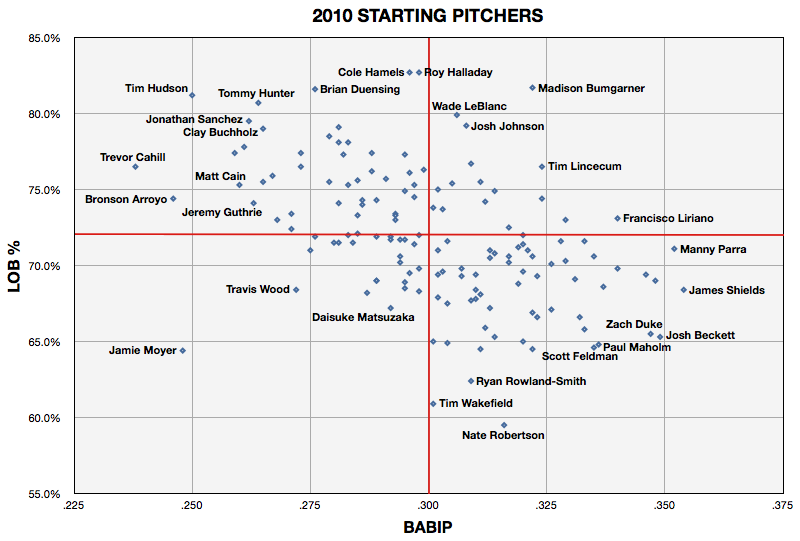
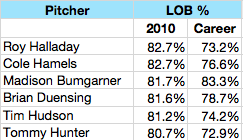
As usual, I have identified the outliers in all four quadrants in the graph above. In addition, as shown below, I have created lists of leaders and laggards for both LOB% and BABIP. For perspective, the ranges on LOB% and BABIP were 59.5-82.7 percent and .238-.354, respectively.
Starting with LOB%, I highlighted the six pitchers with strand rates over 80 percent and compared 2010 with their career marks. All but Madison Bumgarner (who pitched just 10 innings prior to last season) have career LOB% that are well below their results in 2010. That said, I found it interesting that the career rates were all above the MLB norm of 72 percent.
Roy Halladay, Cole Hamels, Brian Duensing, Tim Hudson, and Tommy Hunter all posted career high LOB%. Halladay had only exceeded 75 percent twice before last year.
In addition to sharing high LOB%, the common thread among these pitchers is that they fared better with RISP than with the bases empty.
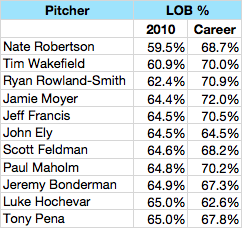
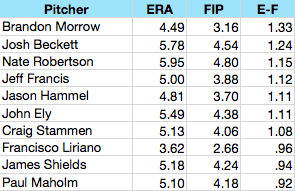
There were 11 pitchers with strand rates of 65 percent or lower. Excluding John Ely (who was a rookie), all but Luke Hochevar have career LOB% that are well above their results in 2010. Nonetheless, I found it as equally interesting as the observation from the leader board that the career rates were all at or below the MLB norm of 72 percent.
Nate Robertson, Tim Wakefield, Ryan Rowland-Smith, Jeff Francis, and Paul Maholm all posted career low LOB%. Scott Feldman, Jeremy Bonderman, and Tony Pena produced the second-lowest LOB% while Jamie Moyer had the third-lowest since he broke into the majors in 1986.
In addition to sharing low LOB%, the common thread among these pitchers is that they fared worse with RISP than with the bases empty.
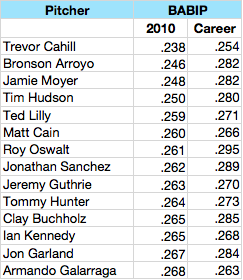
Turning to BABIP, I spotlighted the 14 pitchers with averages under .270 and, like LOB%, compared 2010 with their career marks. All of these starters (including Armando Galarraga who actually posted a .261 BABIP based on FanGraphs' revised calculations) have career BABIP that are above their results in 2010. Of note, the career rates were all below the MLB norm of .300.
Matt Cain has never had a league-average BABIP and, in fact, has not exceeded the .278 he allowed in 2007.
Hudson and Hunter appear on the most favorable LOB% and BABIP lists. Moyer, on the other hand, was the only pitcher to appear on a leader and laggard board.
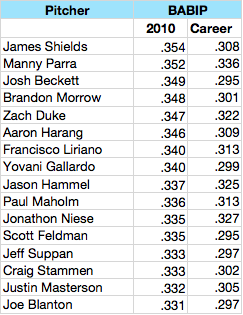
There were 16 pitchers with BABIP higher than .330. All of these pitchers have career BABIP that are below their results in 2010. In five cases, the career marks are slightly below the MLB norm of .300. The balance are all higher.
Maholm and Feldman appear on the least favorable LOB% and BABIP lists.
Here is the same graph presented with a best-fit trendline. As shown, it slopes from the northwest quadrant down and to the right through the intersection to the southeast quadrant. Generally speaking, the lower the BABIP, the higher the LOB%, and the higher BABIP, the lower the LOB%.
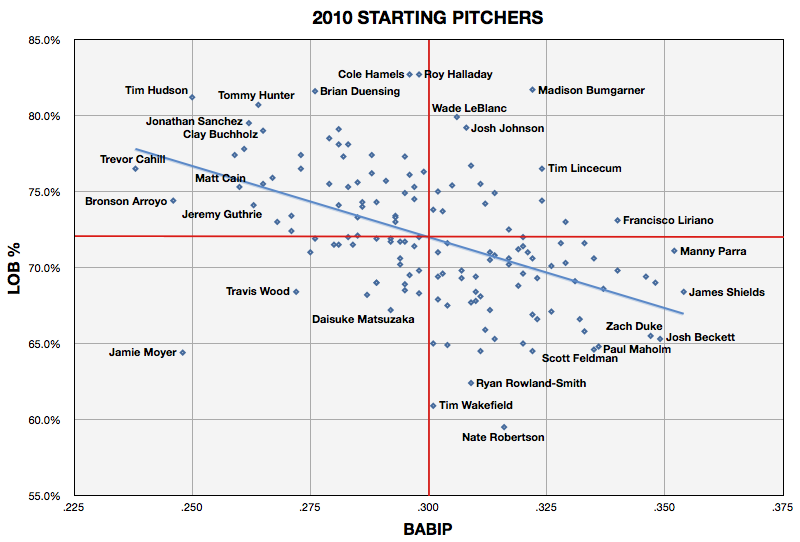
The outliers in the NWQ were the pitchers who benefited the most from high LOB% and low BABIP. Here are the pitchers with the highest ratios of LOB% divided by BABIP:
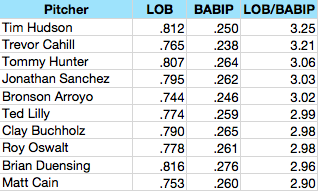
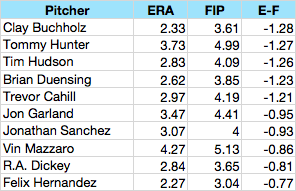
Six of the above pitchers ranked in the top seven in ascending order in ERA minus FIP (E-F), meaning they had better ERAs than FIPs. The other four placed 11th, 17th, 27th, and 28th (out of 147 pitchers who threw at least 100 innings in 2010).
Conversely, the outliers in the SEQ were victimized the most by low LOB% and high BABIP. Here are the pitchers with the lowest ratios:
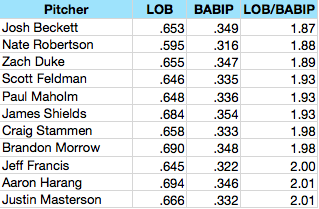
Seven of the above pitchers ranked in the top ten in descending order in E-F, meaning they had worse ERAs than FIPs. The other four placed 17th, 19th, 21st, and 22nd.
Interestingly, the outliers in the NEQ and SWQ neither benefited nor were victimized in the aggregate as the abnormal percentages in each category basically offset one another. As an example, Moyer, a SWQ outlier, had an ERA (4.84) minus FIP (4.98) of -0.14.
There are several takeaways embedded in this study, some of which are more obvious than others:
There are also a few questions: Is the discrepancy in performance between RISP and bases empty due to a pitcher's ability to work from the windup as opposed to the stretch? Do certain pitchers have an extra gear that they can employ when the going gets tough? Is there a self-fulfilling prophecy at play here, a Yogi-ism where pitchers perform well until they don't perform well? The answers to these questions could go a long way toward understanding how much skill or luck is involved in the year-to-year fluctuations in LOB%.
Courtesy of Dave Studeman of The Hardball Times, you can read more about LOB% here and here.
| March 07, 2011 |
Ervin Santana's Inside Pitch
A couple weeks ago Mike Fast posted two graphs showing the average plate location of each pitcher from 2007-2010 to LHBs and RHBs. I thought it was a very cool idea as it offers some insights into how pitchers attack the zone differently. It is particularly interesting to see the outlier pitchers: Derek Lowe has the lowest (ha) pitches, and Livan Hernandez pitches the farthest away to both left-handed and right-handed batters. And without being presented the data I would never have guessed that Ervin Santana throws the farthest inside to left-handed batters of any pitcher. With most pitchers throwing extremely away to lefties I wanted to see what was going on with Santana.
*As a quick side note, I think that these are the raw values straight from gameday and not Mike's corrected values (Mike can correct me if I am wrong). But recently both Mike and Max Marchi described park correction systems to the plate locations they developed. Though take slightly different approaches they seem to get similar results, which is reassuring. Also they both come to the conclusion that for most parks on most days the data are probably off by less than an inch or two, also reassuring. But still I think the correction process is an important one, and I hope to give it some thought soon.*
Turning back to Santana, although he occasionally throws a change up he is largely a two-pitch pitcher throwing his fastball 59% of the time and his slider 36% of the time (he stopped throwing a curve in 2007) . This is the case even to left-hand batters, to whom he still throws his change up under 10% of the time and throws his slider over 30% of the time. For a right-handed starter is this is a very high percentage, maybe one of the highest in the league, for slider use to left-handed batters.
I think this is a big part of the reason he throws so far inside to left-handed batters. Sliders have glove-side movement compared to fastballs, so from right-handed pitchers they move away to right-hand batters and in to left-handed batters. Thus from a right-handed pitcher they often end up inside to left-handed batters. Since Santana throws more sliders to left-handed batters than the almost any right-handed pitcher he will tend to throw more inside pitches. And his sliders are even more inside than the average right-handed pitcher's:
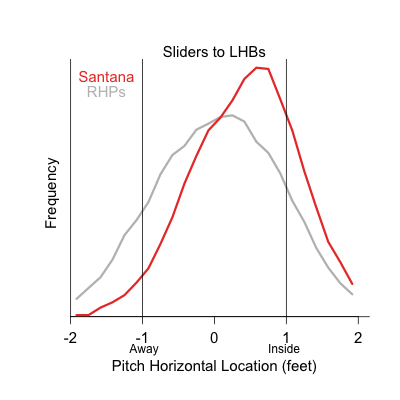
So Santana is throwing sliders to left-handed batters much more than other right-handed batters do and throwing them even farther inside than others do. Most right-handed pitchers throw fastballs and change ups to left-handed batters and when they do they throw them outside. Santana throws his share of fastballs to left-handed batters, but when he does he throws them slightly more inside than average:
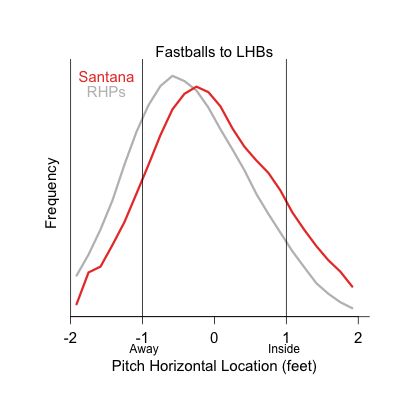
When you add up all these parts — fastball not as extremely outside as other RHPs, lots of inside sliders rather than outside change ups — you get Santana's extreme inside pitches to left-handed batters. But does it work? What are Santana's numbers against LHBs like?
Santana has averaged a 4.7 FIP against lefties versus a 3.94 FIP against righties — a pretty reasonable platoon split and generally an okay performance against lefties. Also his slider is better against lefties than his change is, getting more whiffs (17% versus 10%), more out-of-zone swings (35% versus 24%), fewer in-zone swings (53% versus 72%), and a lower slugging on balls in play (.583 versus .626). So given what he has to work with it looks like Santana is right to go with his inside slider against LHBs so much over his change. And as a result of this he is the only pitcher whose pitches on average end up on the inside half of the plate to left-handed batters.
| Baseball Beat | March 04, 2011 |
The Duke of Hazard
Edwin "Duke" Snider died last Sunday at the age of 84. We're talkin' baseball here. Willie, Mickey, and the Duke. Three Hall of Famers who patrolled center field in New York during the 1950s.
There have been countless tributes written about Snider during the past week, including one titled simply "The Duke" by the prolific Joe Posnanski. In addition, Duke's death has been a topic of conversation on the Society of American Baseball Research's SABR-L message board. The latter has focused on the time when Snider hurt his arm trying to throw a baseball out of the Los Angeles Coliseum in April 1958.
Posnanski mentioned that Snider "had a powerful arm when he was young but hurt it and was never quite the same after he turned 30" but doesn't provide any details. SABR members Bob Timmermann and Lloyd Davis provided excerpts from articles in the Los Angeles Times and Associated Press. I also found one from The Milwaukee Sentinel.
This story got me thinking about what my Dad, who covered the Los Angeles Dodgers from 1958-1968 for the Long Beach Independent, Press-Telegram, had to say about the matter. I pulled out his scrapbooks and found three separate stories on this subject.
The first was published in the morning newspaper (then known as the Independent) in a separate boxed insert on Thursday, April 24, 1958 as part of the Dodgers-Cubs game coverage from the previous night.
Clowns, Hurts ArmDuke Snider, who so far has failed to hit a ball out of the Coliseum, tried to throw one out Wednesday night with the adverse results.
Clowning around before batting practice, the Duke attempted to clear the concrete wall bordering the 79th row. He came close once, tossing one into the 77th row, but pulled a muscle in his arm on the final try.
Manager Walter Alston had to yank Snider from his announced lineup and he may miss today's game, too.
The second was the lead to a longer story with the headline spanning the entire newspaper of that evening's newspaper (known as the Press-Telegram).
Snider in Dodger DoghouseBy GEORGE LEDERER
There are some strained feelings among the Dodgers today, both physical and otherwise.
Physically, the strain is in Duke Snider's right elbow. Otherwise, it is between Snider and manager Walter Alston and the Dodger front office.
The Duke learned the hard way Wednesday night that he is paid roughly $40,000 per season to try and hit, not throw, the ball out of the park.
In a bit of pre-game horse play with utility infielder Don Zimmer, Snider strained a tendon in his right elbow as he tried to heave a ball out of the Coliseum, 79 rows high and some 120 feet deep.
Alston, who had already announced his lineup, was forced to make some quick changes. He not only yanked Snider, but suspended him without pay until he is ready to play again.
[snip]
Snider, who had succeeded in tossing a ball as far as the 77th row before straining his elbow, watched the action from the bench and was not informed of his suspension until after the game. His injury is believed to be not serious, but may keep him out another day or two.
Alston said he would not tolerate such antics. Snider, hitting only .217, was still showing the effects of last December's knee operation that sidelined him until late in the exhibition season.
The third article appeared in the newspaper the following day.
DAFFY DODGERS---AGAINClowning Costs Duke Day's Pay
Duke Snider was in a surprisingly good mood Thursday when he was reinstated in the Dodger lineup by Manager Walt Alston after some extra-curricular clowning cost him a day's pay.
The Duke was forced to sit out Wednesday night's 7-6 loss to the Cubs when he strained his right elbow in trying to throw a ball out of the 79-row Coliseum.
Snider was suspended for the night and docked a day's pay, which amounted to $275.
When asked how the arm felt, Snider said, "Peachy. I can't afford to lose another day's pay and neither can Uncle Sam. You know, I'm the guy who's firing all those missiles."
Alston was still somewhat sore about the incident. He also fined utility infielder Don Zimmer $25 for his part in the throwing contest. "Zimmer was just as much a part of it as Snider. The only difference is that he didn't get hurt. I would have liked to have Snider in there last night."
Dodger relief pitcher Ed Roebuck also commanded the spotlight briefly during Wednesday night's three-ring circus. Roebuck drew a $25 fine for trying to hit the scoreboard clock with fungoes in pre-game practice.
"He was supposed to hit fly balls to the outfielders," Alston said. "Instead, he was fooling around and knocking balls into the peristyle end. You won't see him hitting any today."
Snider showed no signs of being affected by the elbow injury. He threw well from left field and beat out an infield hit in his first time at bat. Rookie Don Demeter replaced Snider in the seventh inning.
There you have it ... the real story behind how the Duke of Hazard hurt his arm in 1958.
While I'm not a fan of leaders by the decade*, I found it interesting that Snider led MLB in home runs (326) and RBI (1,031) during the 1950s. You know, the decade that featured Ted Williams, Willie Mays, Mickey Mantle, Stan Musial, and Eddie Mathews. Williams missed virtually all of the 1952 and 1953 seasons to the Korean War. Mays and Mantle were rookies in 1951, and Mays missed a large portion of '52 and all of '53 to the military as well. Mathews slugged 299 HR despite debuting in 1952. Many other superstars like Hank Aaron, Ernie Banks, AL Kaline, and Frank Robinson didn't make it to the majors until the mid-1950s. By the way, Snider's teammate Gil Hodges was No. 2 in HR that decade with 310. Mathews was third, followed by Mantle (280), Musial (266), Yogi Berra (256), Mays (250), Ted Kluszewski (239), Gus Zernial (232), and Banks (228).
*Jack Morris led the majors in wins during the 1980s and Mark Grace led in hits during the 1990s.
| Designated Hitter | March 01, 2011 |
Roberto Clemente's Autograph
I am not now, nor have I ever been, a collector of autographs, baseballs, baseball cards, etc. As a kid in the '50s, I'd buy baseball cards to look at, memorize the stats on the back and to flip them (heads or tails, against the wall, anything we could think of). The following spring, I'd throw out last year's cards and start again. The most fun about getting autographs was you got to be next to the player to ask for it. That was thrill enough for me. It never crossed my mind that people in the future would make money from collectibles.
I was a Pirate fan living in New York City during the '60s. There weren't many of us. Roberto Clemente was my guy. In the same way that Mickey Mantle or Willie Mays or Sandy Koufax were your guys if you were a Yankee, Giant or Dodger fan. I loved him, wanted to play like him and tried to emulate him on the field. And I wanted his autograph. I can tell you literally dozens of great Clemente stories that I was around for during this era. Here's one of my favorites.
Getting Clemente's autograph was not the easiest thing in the world. He went through his baseball life with a chip on his shoulder. Not that he wasn't justified. With the exception of Jackie Robinson, I doubt any ballplayer was treated as badly by the press as Clemente was and he took every slight personally. He was black, Latino and spoke not one word of English when he came here in 1954 at the age of 19. Sportswriters, perhaps just not used to dealing with Latino players, would quote him phonetically, which made him look bad. "I theenk I have goood seeson." Learning to speak English was not easy for him.
You had to ask for his autograph when he was in a good frame of mind. Me and my buds would go down to the hotels where the teams were staying when they were in town to play the Yankees or Mets. Most teams stayed at the Hotel Roosevelt, the Pirates at the Hotel Commodore. We'd get there on Saturday mornings just before the bus would take them to the Bronx or to Shea and ask for their autographs in the lobby. Most would sign, some wouldn't.
I first got Clemente's autograph on August 18, 1964, which I knew was his 30th birthday. I was rowing boats six days a week all summer as a dock boy at Brooklyn Day Camp. I called in sick that day and went to Shea for an afternoon Pirate/Met game. Back then, I used to write to the Pirates for glossy photos of the players and they'd always oblige. So I had a few pages of Forbes Field stationery with me.
After the game, I waited outside the clubhouse for the Pirates to board their bus. Clemente comes out and a bunch of kids swarm around him. "Can I have your autograph, Roberto?" For whatever reason, he wasn't signing that day. Frank Oceak, the Pirates 3rd base coach, sees me holding my pen and paper and tells me, "Talk to him in Spanish and he'll sign for you." The proverbial light bulb goes on over my head! I took three years of torturous Spanish classes with Mr. Capitano in Junior High School!! "Roberto, Feliz Cumpleanos," I say. He puts down his suitcases, smiles and signs his name on my Forbes Field paper. I kept telling myself that Roberto Clemente likes me. A great moment.
Many decades later, the autograph on that paper is worth quite a bit. Supply and demand. Clemente didn't sign that many and died at age 38. Pete Rose has made his living by signing his name for the past 22 years. I took my Clemente autograph to a card show one time and showed it to a dealer, who immediately offered me $500 for it. Which told me it was worth much more than that. It is not for sale.
For the past 30 years, David Bromberg has lived in Northeast Pennsylvania, former home of the Scranton/Wilkes Barre Red Barons (Phils Triple A team) and current home of the S/WB Yankees Triple A team. He was dubbed "the most inveterate baseball fan in northeast Pa. by Ron Allen, who hosted the local nightly sports radio call-in show there.