Rich Lederer • Baseball Beat
Patrick Sullivan • Change-Up
Jeremy Greenhouse • Touching Bases
Dave Allen • F/X Visualizations
Sky Andrecheck • Behind the Scoreboard
Marc Hulet • Around the Minors
Al Doyle • Past Times
Retired Uniforms:
Bryan Smith • WTNY
Joe Sheehan • Command Post
Jeff Albert • The Batter's Eye
RSS Feed
Home
*Examining the Past, Present, and Future*
Lineup Card
Recent Entries
» Putting Together a Reality Team
» Historical Hall of Fame Vote Comparisons: 2012
» An All-Christmas Team
» The New-Look Angels
» John Denny: The Forgotten Cy Young Award Winner
» Money Isn't Everything
» What Would It Take to Hit .400 in the 21st Century?
» Halos Heaven
» Brandon McCarthy's Breakout Season
» Link-o-Rama
» Historical Hall of Fame Vote Comparisons: 2012
» An All-Christmas Team
» The New-Look Angels
» John Denny: The Forgotten Cy Young Award Winner
» Money Isn't Everything
» What Would It Take to Hit .400 in the 21st Century?
» Halos Heaven
» Brandon McCarthy's Breakout Season
» Link-o-Rama
Best of Baseball Beat
Abstracts From the Abstracts
1977 Baseball Abstract
1978 Baseball Abstract
1979 Baseball Abstract
1980 Baseball Abstract
1981 Baseball Abstract
1982 Baseball Abstract
1983 Baseball Abstract
1984 Baseball Abstract
1985 Baseball Abstract
1986 Baseball Abstract
1987 Baseball Abstract
1988 Baseball Abstract
1978 Baseball Abstract
1979 Baseball Abstract
1980 Baseball Abstract
1981 Baseball Abstract
1982 Baseball Abstract
1983 Baseball Abstract
1984 Baseball Abstract
1985 Baseball Abstract
1986 Baseball Abstract
1987 Baseball Abstract
1988 Baseball Abstract
Bert Blyleven Series
Meeting Up and Hanging Out with Bert
The Results Are In And...
Aficionado Heavily Invested in Blyleven
Latest on Blyleven's Chances for the HOF
The Internet Zealot Responds
400 Down and 5 to Go...
Bert Be Home By Eleven?
Blyleven's Forgotten Season (1973)
HeyMan, Your Comments Don't Hold Water
The Waiting is the Hardest Part
Another Addition to the Blyleven Series
Search for the Truth
As Dominant as His HOF Contemporaries
Listen, Buster
A Larger Step for Blyleven
Answering the Naysayers (Part Two)
Another Small Step for Blyleven
Q&A: Blyleven on the Twins
The Majority Rules, Right?
It's All Dutch to Some
The Hall of Fame Case for Bert Blyleven
Q&A: Blyleven on Felix Hernandez
Clemens Rocketing Up Charts
Poz: An Interview With a KC Star
A HOF Chat with Tracy Ringolsby
Up Close and Personal
A Peek Into the Mind of a HOF Voter
Answering the Naysayers
It's That Time of the Year (Again)
"If Cooperstown is Calling..."
The Bert Alert
One Small Step for Blyleven...
Only the Lonely
Exclusive Interviews
Lee Sinins
Alex Belth
David Pinto
Will Carroll
Mike Carminati
Aaron Gleeman
Joe Sheehan
Jay Jaffe
Jeff Peek
Tracy Ringolsby
Joe Posnanski
Bill James Part I, II, III
Jon Lalonde
Chuck Tiffany
Dayn Perry
Fay Vincent
Nate Silver
Alex Belth
David Pinto
Will Carroll
Mike Carminati
Aaron Gleeman
Joe Sheehan
Jay Jaffe
Jeff Peek
Tracy Ringolsby
Joe Posnanski
Bill James Part I, II, III
Jon Lalonde
Chuck Tiffany
Dayn Perry
Fay Vincent
Nate Silver
Bullpen
Rich Lederer
The Odd Couple (with Alex Belth)
The MostUnder Over Underrated Player in Baseball (with Brian Gunn)
Three Wise Men (roundtable by Alex Belth)
Infrequently Asked Questions (interview with Matt Welch)
Interview (Orioles Think Tank)
Bernie and the Yanks (Bronx Banter)
Hope and Faith: How the LAA Win the World Series (Baseball Prospectus)
NL West (The Soul of Baseball)
Greatest Living Hitter? (Sports Illustrated)
Roundtable: 2008 HOF Ballot (Armchair GM)
The Most
Three Wise Men (roundtable by Alex Belth)
Infrequently Asked Questions (interview with Matt Welch)
Interview (Orioles Think Tank)
Bernie and the Yanks (Bronx Banter)
Hope and Faith: How the LAA Win the World Series (Baseball Prospectus)
NL West (The Soul of Baseball)
Greatest Living Hitter? (Sports Illustrated)
Roundtable: 2008 HOF Ballot (Armchair GM)
Patrick Sullivan
Designated Hitters
David Bromberg (Q&A: John Denny)
Mark Armour (H. Killebrew and Versatility)
Joe Lederer (Soundtrack of a Prospect)
David Bromberg (Clemente's Autograph)
David Bromberg (Woody Fryman)
D. Baumstein (WAR Against Age: Pitchers)
Doug Baumstein (The WAR Against Age)
Doug Baumstein (A Lifetime on the Road)
John Fraser (Pick Six)
Mark Armour (How to Score More Runs?)
Bill Parker (What Opening Day Tells Us)
Stan Opdyke (Pat Rispole)
Chris Jaffe (Evaluating Baseball's Mgrs)
Stan Opdyke (Baseball Radio in NYC, 1953)
A. Nathan (Performance of Baseball Bats)
Michael Weddell (Edgar Martinez/HOF)
Jon Weisman (100 Things Dodgers Fans...)
Stan Opdyke (Connie Mack and Vin Scully)
Eric Walker (Evaluating Run Production)
Brent Mayne (The Intangibles of Catching)
Chris Moore (Best Fastballs in Baseball)
Dave Baldwin (The Batter’s Brain)
Shawn Haviland (Ivy League to MLB)
Larry Granillo (Walking Off)
Rob Iracane (Solo HR Won't Break You)
Tommy Bennett (Charm of AM Radio)
Harry Pavlidis (Johan Santana's Fast Start)
John Walsh (WAR and Remembrance)
Eric Walker (Precisely Inaccurate)
Bob Timmermann (As They See 'Em)
Geoff Young (Unicycles and Delusions)
Baseball Analysis at Tufts (Groundballers)
Baseball Analysis at Tufts (GB Out Rates)
G. Rybarczyk ('09 Hit Tracker Projections)
Joe Lederer (Curt Schilling/HoF)
Conor Gallagher (Hall of Fallacies)
Chris Green (Jim Rice, HoF, the Numbers)
Shawn Hoffman (Baseball's Bear Mkt?)
Paul Anthony (Manny Syndrome)
Ross Roley (World Series Odds)
B. Timmermann (Catcher's Interference)
R.J. Anderson (Waiting the Hardest Part)
Maury Brown (Cubs, MLB, and Cuban...)
Myron Logan (Dee-Fense, Dee-Fense)
Craig Calcaterra (Frivolity, Part I, Part II)
Chad Finn (Ode to Baseball Cards)
David Cameron (Mariners Foibles)
Chris Dial (Chipper Jones)
Pat Lederer (Memory Lane)
David Appelman (Clutch Pitching)
Bob Rittner (DH)
Jonathan Mayo (Roger Clemens)
Lisa Winston (My Son-in-Law...)
Russ McQueen (The Yellow Hammer)
Bob Rittner (I'm OK, You're OK)
Mark Armour (In Defense of the HOF)
Pat Jordan (Friends)
Dan Levitt (Analysis of Terry Ryan)
Doug Baumstein (Trading Econ 101)
Ross Roley (Runner's Reluctance II)
Ross Roley (Runner's Reluctance I)
Mark Armour (No-Longer Lovable Sox)
Bruce Regal (Stealthy and Wise)
Brian Gunn (Roid Monster)
Current/McEvoy (Value of the SB)
John Rickert (Sinister Thefts)
Nate Silver (Sabermetrics)
David Vincent (Home Run Production)
Joe P. Sheehan (Enhanced Gameday II)
Mark Armour (An Ode to Sport)
David Gassko (All-Time Worm Burners)
Joe P. Sheehan (Enhanced Gameday)
John Walsh (When Titans Clash)
Fox/Williams (Quantifying Coaches II)
Fox/Williams (Quantifying Coaches I)
Jacob Luft (Bull Durham Rant)
Chad Finn (Strat-O-Matic)
Lisa Winston (Rotisserie Baseball)
Dave Studeman (Baseball Stats)
Steve Treder (Roger Craig)
Marc Normandin (Jeff Bagwell)
D. Appelman (Expanding Strike Zone)
Jeff Sackmann (Worst MiL Defenders)
Jeff Sackmann (Best MiL Defenders)
Maxwell Kates (Van Lingle Mungo)
David Appelman (Pitch Location)
Kent Bonham (Danny Ray Herrera)
Glenn Stout (Two Baseball Poems)
Bruce Regal (The Challenge Round)
Mark Lamster (Barry & Ty)
Geoff Young (NL West)
Tom Lederer (The Ryan Express)
Brian Erts (Great Leap Forward)
David Pinto (Parity and the N.L.)
Jacob Luft (Fathers and Daughters)
Jamey Newberg (Pete's Sake)
Jeff Albert (A. Jones Swing Analysis)
Jeff Albert (A-Rod Swing Analysis)
Keith Law (Death, Taxes, and Waivers)
Peter Abraham (Tales of Torre Tales)
Larry Borowsky (Let 'er Rip II)
Dan Levitt (Empirical Analysis of Bunting)
Jonah Keri (If I Met Warren Cromartie...)
Bob Klapisch (War Stories)
Bob Timmermann (John F. Kennedy HS)
Kent Bonham (Aluminum Adjustments)
Al Doyle (More Than Superstars)
Ross Roley (Instant Replay)
David Vincent (Barry Bonds Homers)
Chad Finn (Our Favorite Obscurities)
Bill Deane (1979 NL MVP)
Mark Armour (Rise/Fall of Artificial Turf)
Jeff Angus (Wally Moon Camp)
David Berri (Money and Baseball)
Larry Borowsky (Baseball w/o the #s)
Derek Zumsteg (The Irrational Market)
David Regan (Free Agent Contracts)
Peter Schmuck (Steroids and the HOF)
David Appelman (Pitchers, Pitch by Pitch)
Dan Fox (Swinging, Taking, Fouling, Etc)
Patrick Sullivan (Study of NYY CF/BOS LF)
Will Leitch (Baseball Journalism)
Jeff Sullivan (Pitcher Release Points)
Steve Treder ('69-'70 Giants)
Maury Brown (Charlie Finley)
John Brattain (Bob Johnson)
Bob Klapisch (The Case for Bert Blyleven)
Jeff Peek (Pride and Prejudice)
Dayn Perry (Bert and Warren)
Rob Neyer (If Don Sutton Was Great...)
Lisa Winston (Minor League Memories)
Alex Belth (Otis Redding Was Right)
David Cameron (Long Live the King)
Jeff Angus (Baserunning Study)
Bert Blyleven (Baseball Playoffs)
Boyd Nation (Not a Prospect List)
James Click (Batters-Baserunners Study)
Jeff Shaw (Why I Love Baseball)
David Gassko (BIP/BFP Fielding Study)
Jay Jaffe (Milwaukee Sausage Race)
Jamey Newberg (Remember When)
Bob Klapisch (Press Box to the Mound)
Dan Levitt (Predictive Value of BB)
David Vincent (Official Scorer)
Jon Weisman (Rick Monday)
Larry Borowsky (Let 'er Rip)
Will Carroll (Fictional Short Story)
Bob Timmermann (Japanese Baseball)
Cyril Morong (Best Pitching Seasons)
Sean Forman (Monte Carlo Win-Loss)
Brian Gunn (My Little Blue Book)
Joe Lederer (My Dad and Baseball)
Bill Deane (Bob Gibson, 1968)
Mark Armour (1977 Yankees)
Darren Viola (Retrosheet)
David Pinto (RFK)
Dayn Perry (Brave Heart)
Matt Welch (Dave Hansen)
Kevin Kernan (Jack McKeon)
Tom Lederer (Dodgers Road Trip)
Steve Lombardi (Slider)
Studes (Picturing Baseball)
Mike Carminati (Luck of the Drawl)
Eric Neel (Vin Scully)
J.C. Bradbury (Leo Mazzone)
John Sickels (Bill James)
Search Baseball Analysts
Archives
By Category:
Around the Majors Content Only
Around the Minors Content Only
Baseball Beat Content Only
Baseball Beat/Change-Up Content Only
Baseball Beat/WTNY Content Only
Behind the Scoreboard Content Only
Change-Up Content Only
Change-Up/Around the Majors Content Only
Command Post Content Only
Crunching the Numbers Content Only
Designated Hitter Content Only
F/X Visualizations Content Only
Past Times Content Only
Saber Talk Content Only
The Batter's Eye Content Only
Touching Bases Content Only
Weekend Blog Content Only
WTNY Content Only
By Month:
February 2012
January 2012
December 2011
October 2011
September 2011
August 2011
July 2011
June 2011
May 2011
April 2011
March 2011
February 2011
January 2011
December 2010
November 2010
October 2010
September 2010
August 2010
July 2010
June 2010
May 2010
April 2010
March 2010
February 2010
January 2010
December 2009
November 2009
October 2009
September 2009
August 2009
July 2009
June 2009
May 2009
April 2009
March 2009
February 2009
January 2009
December 2008
November 2008
October 2008
September 2008
August 2008
July 2008
June 2008
May 2008
April 2008
March 2008
February 2008
January 2008
December 2007
November 2007
October 2007
September 2007
August 2007
July 2007
June 2007
May 2007
April 2007
March 2007
February 2007
January 2007
December 2006
November 2006
October 2006
September 2006
August 2006
July 2006
June 2006
May 2006
April 2006
March 2006
February 2006
January 2006
December 2005
November 2005
October 2005
September 2005
August 2005
July 2005
June 2005
May 2005
April 2005
March 2005
February 2005
January 2005
December 2004
November 2004
October 2004
September 2004
August 2004
July 2004
June 2004
May 2004
April 2004
March 2004
February 2004
January 2004
December 2003
November 2003
October 2003
September 2003
August 2003
July 2003
June 2003
Reference
Organizational Stats
Arizona Diamondbacks Bat / Pitch
Atlanta Braves Bat / Pitch
Baltimore Orioles Bat / Pitch
Boston Red Sox Bat / Pitch
Chicago Cubs Bat / Pitch
Chicago White Sox Bat / Pitch
Cincinnati Reds Bat / Pitch
Cleveland Indians Bat / Pitch
Colorado Rockies Bat / Pitch
Detroit Tigers Bat / Pitch
Florida Marlins Bat / Pitch
Houston Astros Bat / Pitch
Kansas City Royals Bat / Pitch
Los Angeles Angels Bat / Pitch
Los Angeles Dodgers Bat / Pitch
Milwaukee Brewers Bat / Pitch
Minnesota Twins Bat / Pitch
New York Mets Bat / Pitch
New York Yankees Bat / Pitch
Oakland Athletics Bat / Pitch
Philadelphia Phillies Bat / Pitch
Pittsburgh Pirates Bat / Pitch
St. Louis Cardinals Bat / Pitch
San Diego Padres Bat / Pitch
San Francisco Giants Bat / Pitch
Seattle Mariners Bat / Pitch
Tampa Bay Devil Rays Bat / Pitch
Texas Rangers Bat / Pitch
Toronto Blue Jays Bat / Pitch
Washington Nationals Bat / Pitch
All-Star Links
Official Websites
News and Notes
Baseball News Blog
Baseball Newstand
ESPN Baseball
Fox Sports Baseball
Pro Sports Daily
Roto World
The Roto Times
USA Today Baseball
Baseball Newstand
ESPN Baseball
Fox Sports Baseball
Pro Sports Daily
Roto World
The Roto Times
USA Today Baseball
Reference and Analysis
Baseball Almanac
Baseball America
Baseball Archive
Baseball Contracts
Baseball Cube
Baseball Graphs
Baseball Library
Baseball Musings Player Database
Baseball Page
Baseball Primer
Baseball Prospectus
Baseball Reference
Baseball Statistics
Baseball Truth
Boxscore Central
Diamond Mind Baseball
Doug's Stats
FanGraphs
Fast Balls (pitchfx catalog)
Hardball Dollars
Hardball Times
Hit Tracker
Retrosheet
Rotobase/Rotoblog
Stat Corner
STATS
Tango on Baseball
Yahoo Sports MLB
Web Gems
Bill James Primer
Sabermetric Manifesto (Grabiner)
Pitching and Defense (McCracken)
Pitching and Defense (Tippett)
Transactions Primer (Neyer)
Baseball Stats (Batter's Box)
Prospect Report (Cameron)
Pitcher Workloads (Sheehan)
Goodbye to Old Baseball Ideas (Rickey)
Sabermetric Manifesto (Grabiner)
Pitching and Defense (McCracken)
Pitching and Defense (Tippett)
Transactions Primer (Neyer)
Baseball Stats (Batter's Box)
Prospect Report (Cameron)
Pitcher Workloads (Sheehan)
Goodbye to Old Baseball Ideas (Rickey)
Columnists
Baseball Blogs
Around the Majors
Athletics Nation
Baseball Crank
Baseball Musings
Baseball-Reference Blog
Batter's Box
Big League Stew
Bronx Banter
Catfish Stew
Cub Town
Dan Agonistes
Dodger Thoughts
DRays Bay
Ducksnorts
Futility Infielder
Halos Heaven
Inside the Rockies
It Might Be Dangerous
Knuckle Curve
LoHud Yankees Blog
Lookout Landing
Management by Baseball
Metaforian
Metsgeek
Mike's Baseball Rants
Only Baseball Matters
Redbird Nation
Red Reporter
Sabernomics (Braves)
Seth Speaks
ShysterBall
6-4-2 (Angels/Dodgers)
The Book
TheCubdom
The Cutting Edge
The House That Dewey Built
The View From The Bleachers
Tiger Blog
U.S.S. Mariner
Viva El Birdos
Where's Kernan
Minor Leagues
Arizona Fall League
BA Player Finder
Cal Leaguers
Jamey Newberg
JDM's Scoresheet Baseball
Minor League Baseball
Minor League Park Factors
Minor League Splits
No Pepper
Sickels' Minor League Ball
Warm October Nights
BA Player Finder
Cal Leaguers
Jamey Newberg
JDM's Scoresheet Baseball
Minor League Baseball
Minor League Park Factors
Minor League Splits
No Pepper
Sickels' Minor League Ball
Warm October Nights
Amateur
Boyd's World (College)
Cape Cod Baseball League
College Baseball Blog
College Baseball Insider
Collegiate Baseball Newspaper
College Splits
College Splits Blog
Dirtbags Baseball (Long Beach State)
NCAA Baseball
NCBWA
Team One Baseball (High School)
Texas A&M & Baseball
Cape Cod Baseball League
College Baseball Blog
College Baseball Insider
Collegiate Baseball Newspaper
College Splits
College Splits Blog
Dirtbags Baseball (Long Beach State)
NCAA Baseball
NCBWA
Team One Baseball (High School)
Texas A&M & Baseball
Historical
Cuban Baseball
House of David
Jim "Mudcat" Grant's Web Page
Negro League Baseball Players Assoc
Negro Leagues Baseball Museum
1919 Black Sox
Pacific Coast League
Philadelphia Athletics Historical Society
Shoeless Joe Jackson Society
SABR-L Archives
Walter O'Malley
House of David
Jim "Mudcat" Grant's Web Page
Negro League Baseball Players Assoc
Negro Leagues Baseball Museum
1919 Black Sox
Pacific Coast League
Philadelphia Athletics Historical Society
Shoeless Joe Jackson Society
SABR-L Archives
Walter O'Malley
Miscellaneous
Forums
Credits
Ticket Center
Tickets to Baseball -
Premium Red Sox Tickets - Tickets to Marlins Games - Cardinals Game Tickets - NY Yankee Tickets - Tickets Oakland Athletics - Dallas Cowboys Tickets - Arizona Cardinals Tickets - Tickets Seattle Seahawks - Buffalo Bills Tickets Online - Tickets to Dolphins Football
Buy Boston Red Sox tickets,
Philadelphia Phillies tix,
NY Yankees tickets,
NY Mets tickets, and
MLB All Star game tickets at ABC tickets
Not sure where to find the best online sportsbooks? Start your search with PlayersJet.
Get deals at SportsMemorabilia.com on baseball apparel, including Phillies jerseys and more for adults and children.
Shop the largest selection baseball equipment on sale at Sports Unlimited. Check out tons of baseball gloves, youth baseball gloves and catchers gear from Rawlings, Wilson, Nike & Under Armour.
2011 Draft Order
Courtesy of Baseball America
First-Round:
 1. Pirates (57-105)
 2. Mariners (61-101)
 3. Diamondbacks (65-97)
 4. Orioles (66-96)
 5. Royals (67-95)
 6. Nationals (69-93)
 7. Diamondbacks (for B. Loux)
 8. Indians (69-93)
 9. Cubs (75-87)
10. Padres (for Karsten Whitson)
11. Astros (76-86)
12. Brewers (77-85)
13. Mets (79-83)
14. Marlins (80-82)
15. Brewers (for Dylan Covey)
16. Dodgers (80-82)
17. Angels (80-82)
18. Athletics (81-81)
19. Red Sox (from DET for Martinez)
20. Rockies (83-79)
21. Blue Jays (85-77)
22. Cardinals (86-76)
23. Nationals (from CWS for Dunn)
24. Rays (from BOS for Crawford)
25. Padres (90-72)
26. Red Sox (from TEX for Beltre)
27. Reds (91-71)
28. Braves (91-71)
29. Giants (92-70)
30. Twins (94-68)
31. Rays (from NYY for Soriano)
32. Rays (96-66)
33. Rangers (from PHI for Lee)
Supplemental First Round:
34. Nationals (Dunn)
35. Blue Jays (Downs)
36. Red Sox (Martinez)
37. Rangers (Lee)
38. Rays (Crawford)
39. Phillies (Werth)
40. Red Sox (Beltre)
41. Rays (Soriano)
42. Rays (Balfour)
43. Diamondbacks (LaRoche)
44. Mets (Feliciano)
45. Rockies (Dotel)
46. Blue Jays (Buck)
47. White Sox (Putz)
48. Padres (Garland)
49. Giants (Uribe)
50. Twins (Hudson)
51. Yankees (Vazquez)
52. Rays (Benoit)
53. Blue Jays (Olivo)
54. Padres (Torrealba)
55. Twins (Crain)
56. Rays (Choate)
57. Blue Jays (Gregg)
58. Padres (Correia)
59. Rays (Hawpe)
| Baseball Beat | June 30, 2010 |
Lefties in the News
No, today's article is not about President Obama or Elena Kagan. Instead, the title is meant to honor two southpaws who made news this week.
They just mentioned this on Baseball Tonight, which I thought would be of interest to you:Lee also allowed two runs in the ninth, but calmly worked out of trouble. He kept his cool earlier in the day, too, when his subway sped through the stop for Yankee Stadium. Lee handled it like a local. He got off and switched to a downtown D train going the other way. No big deal.
"I'm not afraid to take the subway," Lee said.
Lee has made a habit of bypassing the team bus in favor of alternative transportation to Yankee Stadium. Taking a taxi to Game One of the 2009 World Series at rush hour, Lee got stuck in traffic and asked the driver to take him to the nearest subway station. He took the local 6 train and changed to the express 4 train, exited at the 161st Ave./Yankee Stadium stop, and walked down the stairs and across the street to the ballpark, just as he did two years ago.
The lefthander is 43-19 with a 2.81 ERA (151 ERA+) and a 7.0 K/9, 1.3 BB/9, and 0.6 HR/9 since the beginning of his 2008 Cy Young Award campaign. A free agent at the end of this season, Lee is likely to be traded to a contender within the next month. The 31-year-old veteran could give the acquiring team a big boost down the stretch and into October as he was 4-0 with a 1.56 ERA covering five starts and 40.1 IP in the postseason last year.
Here are the career leaders:
1    Jamie Moyer                 506
2    Robin Roberts               505
3    Ferguson Jenkins            484
4    Phil Niekro                 482
5    Don Sutton                  472
6    Frank Tanana                448
7    Warren Spahn                434
8    Bert Blyleven               430
9    Steve Carlton               414
10   Randy Johnson               411
The top three all pitched for the Phillies, as did Steve Carlton, who ranks ninth. Six of the ten pitchers are in the Hall of Fame and Bert Blyleven should make it seven in 2011 and Randy Johnson eight when his name appears on the ballot five years from now, leaving Moyer and Frank Tanana as the only non-HOFers to comprise this list. Moyer and Tanana are distinguished for much more than their proclivity of giving up long balls. They have combined for 507 wins and 5,166 strikeouts over 8,243 innings with an ERA+ of 105 and 106, respectively. For more on Moyer, check out the tribute Patrick Sullivan wrote last month.
As Lee Sinins noted in his ATM Report on Monday, "Even though they are in the top 10 for most HR allowed, Spahn, Blyleven, Carlton and Johnson all allowed less than their league averages. Moyer is only tied for 36th in most HR above the league average."
HOMERUNS                        DIFF   PLAYER   LEAGUE
1    Ferguson Jenkins           -111      484      373
T2   Pedro Ramos                 -83      315      232
T2   Catfish Hunter              -83      374      291
4    Scott Sanderson             -77      297      220
5    Jose Lima                   -76      267      191
6    Denny McLain                -75      242      167
7    Brian Anderson              -74      264      190
8    Tom Browning                -73      236      163
9    Eric Milton                 -71      267      196
10   George Blaeholder           -62      173      111
...
T36  Jamie Moyer                 -43      506      463
T36  Jim Deshaies                -43      179      136
T36  Pedro Astacio               -43      291      248
Funny how some writers will use Blyleven's home runs against him when casting their Hall of Fame votes (despite the fact that he gave up fewer than the league average), yet Catfish Hunter and Fergie Jenkins were elected in 1987 and 1991, respectively, in their third year on the ballot.
In addition, Jay Jaffe has everything you would ever want to know about pitchers giving up home runs in a Baseball Prospectus article (subscription required) he titled Jacktastic!
| Touching Bases | June 29, 2010 |
Shifts Happen
Last week, I explored the difference between those players who hit with the shift and those who do not. It would be useful to show that the shift does, in fact, play a part in BABIP, and the observed effect was not only a product of different player pools. So I took the 16 players I believe to be semi-regularly shifted and found their groundball data with men on base vs. with no men on. This serves as a proxy that shows whether the defense is shifting them or not. Below is a plot of the 16 batters' groundball average based on trajectory angle and, below that, a plot showing the frequency at which these batters hit to each angle.
With men on, these pull hitters are able to pick up more hits on balls up the middle and in the 3-4 hole. The shift is most effective on balls in these locations, so this makes sense that these vacated holes result in hits. However, I think balls directly at the first baseman go for hits more often with men on base because the first baseman has to hold the runner on and not because the shift is off. The only place where there is an improved BABIP when the bases are empty is on balls down the third base line.
I've heard the argument that the shift takes away the outer part of the plate from the pitcher. Under this logic, the shift actually works to the hitter's advantage, as any ball that's on the outer half can be easily taken the other way for an automatic hit, and therefore the pitcher must pitch predictably inside. Using the same sample, I split the plate into halves and found the groundball distribution.
I think the takeaway here is that it's not natural for these guys to hit down the third base line. So unless they decide to change their approach dramatically, i.e. bunt, the defense can vacate third base, and the pitcher can pitch outside with no fear of a hit going right down the line.
The other unusual infield alignment, besides the shift, is the infield in. I searched for all grounders with a man on third in the seventh inning or later, which is when the infield might be drawn in. I just began the process of linking the Gameday database to Retrosheet, so unfortunately, I don't yet have data that indicates the number of outs or the score during each at bat. Instead, I broke the data into two groups based on whether the final score of the game was close (one or two runs) or not. In a blowout, teams never bring the infield in.
I don't have much confidence in the crude distinction between these two groups. This neither proves nor disproves that that batting average on groundballs goes up .100 points with the infield in. There might be evidence that bringing the infield in surrenders hits on balls in the holes, but not necessarily at the fielders.
Finally, I looked at bunts. I took all bunts that occurred with the bases empty, so I knew the batter was bunting for a hit, and split the data by handedness.
RHBs are most successful bunting down the first base line, where they bunt more often than LHBs. LHBs are most successful bunting toward third, where they bunt more often than RHBs.
I feel like there are wins to be had here. The difference between a third baseman playing in for a bunt or playing behind 2nd base in a shift isn't trivial in preventing runs. I don't know if it would be asking too much for the bench coach to study spray charts and plan defensive alignments for the opposition, but then again, I don't know what a bench coach does. What does a bench coach do?
| Around the Minors | June 28, 2010 |
The 2010 Amateur Draft: Bulk Investments
One of the quickest ways to turn a lower-ranked minor league system into a top-tiered powerhouse is to draft well. This approached is helped along significantly when a Major League organization has a plethora of top picks during a given draft.
The Arizona Diamondbacks organization is a perfect example of this, thanks to its 2009 draft, which saw it add the likes of Bobby Borchering, Matt Davidson, Mike Belfiore, Chris Owings, Eric Smith, Marc Krauss, A.J. Pollock and Ryan Wheeler, among others. Thirteen '09 draft picks were amongst the top 21 rated in Baseball America's Top 30 prospect list for the organization entering 2010. Obviously, a lot can change in two to three years... but it's still a great return.
However, having multiple picks in a draft does not guarantee a turn around to an organization's system. As we saw in 2007, four organizations had multiple picks in the first three rounds - San Diego (nine picks), Toronto (eight), San Francisco (six), and Texas (six) - but none of them received a full return on their investments. Here is a list of each organization's haul, and how the players rank in terms of current value.
1. Cory Luebke, LHP
2. Drew Cumberland, SS
3. Eric Sogard, 2B (now with Oakland)
4. Nick Schmidt, LHP
5. Brad Chalk, OF
6. Mitch Canham, OF
7. Danny Payne, OF
8. Kellen Kulbacki, OF
9. Tommy Toledo, RHP (did not sign)
The club appears set to receive a mid-rotation starter (Luebke) and an average to slightly-above-average middle infielder (Cumberland). Schmidt is the dark horse in all of this after undergoing Tommy John surgery, which delayed his development.
1. Brett Cecil, LHP
2. J.P. Arencibia, C
3. John Tolisano, 3B/OF
4. Justin Jackson, SS
5. Trystan Magnuson, RHP
6. Alan Farina, RHP
7. Eric Eiland, OF
8. Kevin Ahrens, 3B
Cecil has been a solid contributor to the rotation this season and also helped out in '09. Arencibia has been on fire in triple-A for the past month and looks like the catcher of the future beginning no later than April 2011. Magnuson and Farina look like they could develop into useful middle relievers. The club has had little to no luck with developing prep players from this draft and the minor-league coaching staff may have been unprepared to handle the initial wave.
1. Madison Bumgarner, LHP
2. Nick Noonan, 2B
3. Charlie Culberson, IF
4. Tim Alderson, RHP (now with Pittsburgh)
5. Wendell Fairley, OF
6. Jackson Williams, C
Bumgarner has just been called up to the Majors but his ceiling is significantly lower than what it was when he had better fastball velocity and crisper pitches. The same can be said for Alderson, which seems to point at a trend. Noonan and Culberson could develop into platoon or back-up players but neither is a sure bet to develop into an everyday player. Williams' defense is strong enough to play in the Majors right now (and probably was from the moment he was drafted) but he needs to show that he can hit above .200 at double-A.
1. Julio Borbon, OF
2. Tommy Hunter, RHP
3. Blake Beavan, RHP
4. Michael Main, RHP
5. Neil Ramirez, RHP
6. Matt West, 3B
Both Borbon and Hunter are already useful big-league players. Beavan (lost velo) and Main (injuries) have been a little slower to develop than expected and both have lower ceilings than what were originally projected. Still, they're both promising arms, as is Ramirez. West has yet to show much of anything with the bat.
Out of the four '07 drafts, I would argue that Toronto had the best return on those picks, as well as the best overall draft when you consider Marc Rzepczynski, Brad Mills, Brad Emaus, Michael McDade, and even Darin Mastroianni.
Clearly, having multiple picks is not a recipe for success; an organization must invest heavily in quality scouts and talent analysts, as well as be prepared to pay the price for quality prospects.
Now let's fast-forward to the 2010 draft and look at the seven clubs that have multiple picks (at least five) in the first three rounds. Players in bold have signed
The Toronto Blue Jays organization had nine picks in the first three rounds, including three supplemental first round picks and three second round selections. Entering the year, Baseball America ranked the Toronto minor league system as 28th overall out of 30 clubs, in terms of minor league talent/depth.
Picks
1. Deck McGuire, RHP, College
2. Aaron Sanchez, RHP, HS
3. Noah Syndergaard, RHP, HS
4. Asher Wojciechowski, RHP, College
5. Griffin Murphy, LHP, HS
6. Kellen Sweeney, 3B, HS
7. Justin Nicolino, LHP, HS
8. Chris Hawkins, 3B, HS
9. Marcus Knecht, OF, JC
It's clear that the Jays organization had a new draft approach under first-year GM Alex Anthopoulos and first-year director of amateur scouting Andrew Tinnish. The club took more prep players in one draft than former GM J.P. Ricciardi took during his entire eight-year tenure with the organization. The overall success of this draft will be dependent on inking the four unsigned picks above (Murphy and Nicolino allegedly have deals in place but are awaiting MLB approval). Anthopoulos went on record saying the club has $16 million set aside for the draft, which is a huge budget, and should allow the club to sign some other over-slot deals with the likes of Dickie Thon, Tyler Shreve, Eric Arce, Nick Vander Tuig, Logan Ehlers, and Kris Bryant. Because it's such a young draft, it will take longer than three years (like the 2007 draft) to have a really good idea of how the club did.
The Los Angeles Angels organization had eight picks in the first three rounds, including three first round selections and two supplemental first round picks. Entering the year, Baseball America ranked the Los Angeles minor league system as 25th overall out of 30 clubs.
Picks
1. Kaleb Cowart, 3B, HS
2. Cam Bedrosian, RHP, HS
3. Chevez Clarke, OF, HS
4. Taylor Lindsey, SS, HS
5. Ryan Bolden, OF, HS
6. Daniel Tillman, RHP, College
7. Wendell Soto, SS, HS
8. Donnie Roach, RHP, JC
I really like this draft, because the club nabbed Cowart, Bedrosian and Bolden. It's a very prep-heavy draft with only one collegiate selection and one junior college pick. The organization made a big splash is '09, too, with grabbing Mike Trout, who may be one of the biggest draft steals in the past five to 10 years. The club has done a nice job securing the services of five of the eight '10 picks already, but will likely be slowed down by Major League Baseball, which suppresses a lot of the agreements until right before the signing deadline, which hurts the players' development.
The Tampa Bay Rays organization had six picks in the first three rounds, including two first rounders and two second rounders. Entering the year, Baseball America ranked the Tampa Bay minor league system first overall out of 30 clubs.
Picks
1. Josh Sale, OF, HS
2. Justin O'Conner, C, HS
3. Drew Vettleson, OF, HS
4. Jake Thompson, RHP, College
5. Derek Dietrich, 3B, College
6. Ryan Brett, 2B, HS
I like this draft, too. Sale was one of my favorite picks, as was O'Conner - especially considering that the club got him with the 31st overall pick and he was projected to go in the Top 15. The organization has done well to sign 50% of these picks. The Rays club is looking to rebound from its '09 draft that saw it fail to sign its first two picks: LeVon Washington and Kenny Diekroeger. The club did make up for it later in the draft with a number of over-slot deals with the likes of Jeff Malm, Luke Bailey, and Kevin James.
The Texas Rangers organization had six picks in the first three rounds, including two first rounders, and two supplemental first round selections. Entering the year, Baseball America ranked the Texas minor league system as second overall out of 30 clubs.
Picks
1. Jake Skole, OF, HS
2. Kellin Deglan, C, HS
3. Luke Jackson, RHP, HS
4. Mike Olt, 3B, College
5. Cody Buckel, RHP, HS
6. Jordan Akins, OF, HS
I'm not overly thrilled with this draft. Both Skole and Deglan appear to be over-drafts. On the plus side, it allowed the club to get pre-draft deals done with both players, which allows them to get into pro ball right away. The best player taken in the Rangers' last two drafts is still Matt Purke, who has been pitching in the College World Series for Texas Christian University. The club was unable to come to terms with him after drafting him 14th overall in '09. He was absolutely dominating as a freshman pitcher and will be draft eligible after his sophomore year of college in 2011.
The Boston Red Sox organization had five picks in the first three rounds, including two supplemental first round picks. Entering the year, Baseball America ranked the Boston minor league system as sixth overall out of 30 clubs.
Picks
1. Kolbrin Vitek, 2B, College
2. Bryce Brentz, OF, College
3. Anthony Ranaudo, RHP, College
4. Brandon Workman, RHP, College
5. Sean Coyle, SS, HS
A college-heavy draft, this has a chance to work out really well for the club even if I'm not thrilled with the choices. If Ranaudo is healthy, he could be a huge steal - but that's also a huge "if." I'm not sold on either Vitek or Brentz being anything more than solid regulars; neither of them seems to have star potential. The Workman selection is probably my favorite pick from this draft and it was a surprise to see him last into the second round. The club will no doubt be busy right up until the August signing deadline as the organization has handed out 16 over-slot deals, outside the top three rounds, in the past three seasons.
The St. Louis Cardinals organization had five picks in the first three rounds, including two supplemental first round selections. Entering the year, Baseball America ranked the St. Louis minor league system as 29th overall out of 30 clubs.
Picks
1. Zack Cox, 3B, College
2. Seth Blair, RHP, College
3. Tyrell Jenkins, RHP, HS
4. Jordan Swagerty, RHP, College
5. Sam Tuivailala, SS, HS
Cox is a tough sign... and will be very expensive. He's a sophomore-eligible pick, so he has a lot of bargaining power. I am a big Blair fan, so I like this selection. The supplemental first round pick of Jenkins was another ballsy selection for the organization, as he's a multi-sport prep star with a commitment to Baylor University to play quarterback. This organization needs minor league depth quite badly so it will be a huge loss is the Cardinals cannot get deals done with all these picks. The club did pick up some intriguing pitchers in the '09 draft with the selections of prep star Shelby Miller and college sinker baller Joe Kelly.
The Houston Astros organization had five picks in the first three rounds, including two supplemental first round choices. Entering the year, Baseball America ranked the Houston minor league system as 30th overall - or the worst - out of all 30 clubs.
Picks
1. Delino DeShields, 2B, HS
2. Mike Foltynewicz, RHP, HS
3. Mike Kvasnicka, 3B, College
4. Vincent Velasquez, RHP, HS
5. Austin Wates, 2B, College
This is another organization that needs to get the deals done for all of its players. The club has done a much better job of identifying talent during the past two drafts. With that said, DeShields seems like a bit of an over-draft but there were a lot of clubs hot on his heels for the supplemental round. The club was lucky to have Kvasnicka available with the 33rd overall pick. He was another player that was coveted by a few other teams. Velasquez' injury history scared some teams but the Astros could have a real steal if he is A) healthy, and B) the former two-way player takes a big step forward in his development by focusing on one role. The club followed up a strong '08 draft (Jason Castro, Jordan Lyles) with a so-so '09 draft.
This article is pretty much a teaser for what is to come. As you probably know, it's going to be quite a while (at least four years) before we get a true feel for this draft... but it's still fun to speculate. We will definitely check back with the 2010 draft after the August signing deadline line and once we know exactly who has and hasn't come to terms.
| Change-Up | June 26, 2010 |
The Rest of the Way
For the first time in a while I feel like a fan of any other team in baseball. As a Red Sox fan, things have been great over the last 8 years or so. And they still are - don't get me wrong. But just like so many other teams face uncertainty, so too do the Red Sox now. In years past, you could pencil in a certain amount of production from the Red Sox players and chances were, in the aggregate, you'd end up pretty close to where you thought they'd be. This year though, who the hell knows?
From the start it's been a season of surprises. The team's core stunk for the first 15 games of the season or so, and the Rays and Yanks seemed to be running away. Then, thanks to outstanding work from some of the veterans in the lineup and surprising performances from journeymen cast into leading roles, the Red Sox have clawed their way back into the playoff race. Most satisfying of all, a team "experts" said wouldn't hit became baseball's best offense despite missing two starters for much of the season. Go and search "run prevention" and check out all the snark from the likes of Dan Shaughnessy, Nick Cafardo, Mike Silverman and others.
Questions still abound. Josh Beckett will not be back for a long time, which might even be a good thing if his pitching looks anything like it did before he went on the Disabled List. If you find someone who can shed light on Jacoby Ellsbury's health, let me know. The bullpen gets worse every game. John Lackey had something of an encouraging start in Denver the other night but his peripheral numbers still look awful. Relying on a AAAA guy like Darnell McDonald is beginning to take its toll. And now comes what is potentially the most devastating blow of all. Dustin Pedroia's health is in question after pounding a foul ball off the instep of his left foot last night in San Francisco. X-Rays were reported to be negative, but he's on crutches.
Back to being a Red Sox fan this season. Watching a team battle through imperfections and shortcomings when they had been all but written off has been an entirely new experience. It's been a blast. Watching a juggernaut fulfill its destiny is great, too. Don't get me wrong. But for one season, I am enjoying this. Nobody has any idea what to expect from the Red Sox the rest of the way because the answers lie in dynamics whose uncertainties extend well beyond even the difficult task of projecting forth human performance. We don't even know which humans to project! As a fan, the experience is heightened because it feels like this team needs us pulling for them more than ever. And that's what I find myself doing every night!
I am not confident that Josh Beckett will make a healthy and/or effective return. Same goes for Jacoby Ellsbury. It's hard to see signs of Mike Cameron turning a corner. He may surprise me, but I just want Lackey to eat innings at this point. Pedroia may be out for a while. And yet, thanks to guys like Jon Lester and Daniel Nava and Adrian Beltre and Daniel Bard and Kevin Youkilis, I can't help but love this team. I feel confident in the Red Sox as a whole even though when I think of the parts, I shudder.
This is the least analytical piece you may ever read on this site, so I apologize for betraying the spirit of the site's name. My brain's just been scattered as I think about this Red Sox team and I felt compelled to put some thoughts down. What I've come up with is this: uncertainty breeds a whole hell of a lot of excitement.
Have a great weekend, everyone.
| Touching Bases | June 24, 2010 |
Shift Morneau Shift?
Inspired by my possible doppelganger Ben Lindbergh, I decided to revisit the topic that brought me to this here very site: the shift. Ben wrote an in-depth piece at Baseball Prospectus about J.D. Drew and the shift on Monday, concluding that, "We don’t know precisely how Drew would respond to an escalation of the shift, and if the current state of affairs persists, we never will, but it’s probably worth it for teams to find out; it seems fairly certain that Drew is winning this battle of offense-against-defense game theory thus far." So my question is, who else might benefit from an altered defensive alignment?
Max Marchi and Ricky Zanker have explored aspects of graphing batted ball distributions. Building on their work, I came up with my own model. Using MLBAM-provided batted ball location data from 2008-present and Peter Jensen's gameday translations, I found the batted ball angle of all non-bunt grounders from left-handed hitters with no one on base, as well as whether or not the batter reached safely. I sorted the data into two groups, the first of which contained 2,500 grounders from 15 "shifted" batters, your Howards and Giambis. The rest of the 32,000 grounders formed the second group. I then fitted a binomial LOESS smoothing curve to the data. Here is the resulting model:
Allow me to explain. The top portion of the graph shows BABIP on grounders. There are three big differences between the red line (shift) are the blue line (no shift). First, at -15 degrees, shifted players have the benefit of a vacated shortstop position, and are therefore better than twice as likely to pick up a hit on a batted ball to that vector. Next, at 0 degrees, straight up the middle, shifted players have under a 50% chance at reaching base, while non-shifted players are up above 60%. And finally, balls directed toward the 3-4 hole are much more likely to go for hits when there is no shift. So, to sum up the obvious, implementing a shift allows hits on batted balls toward left field, but in exchange, balls up the middle and in the hole are converted into outs at a higher rate. On the bottom of the graph is a histogram. On average, shifted players hit a higher percentage of balls toward the second baseman, and many fewer balls toward the shortstop. The other notable difference is that shifted players have hit fewer balls up the middle than their counterparts, even though the defense is aligned to prevent hits on balls up the middle.
While it would be nice to have reliable measures pf batted ball speed and batter speed (the two other considerations that help determine groundball average), I had to make do without. So I predicted both of the above fits against my dataset to come up with expected averages for shift and no shift. Here's how the shifted players stack up:
"Angle" is the average batted ball angle. "BABIP" is the rate at which the batter reaches base safely. "No Shift" is the predicted BABIP using the no shift model, and "Shift" is the predicted BABIP using the shift model.
| Name | Angle | BABIP | No Shift | Shift |
|---|---|---|---|---|
| Ryan Howard | 19.7 | .167 | .238 | .199 |
| Carlos Pena | 23.7 | .212 | .213 | .174 |
| Adam Dunn | 19.6 | .203 | .232 | .193 |
| Jim Thome | 16.6 | .141 | .239 | .201 |
| Jason Giambi | 20.1 | .147 | .226 | .190 |
| Jack Cust | 18.5 | .205 | .223 | .189 |
| Chase Utley | 17.9 | .273 | .242 | .208 |
| David Ortiz | 19.2 | .168 | .221 | .189 |
| Travis Hafner | 10.9 | .203 | .257 | .227 |
| Ken Griffey | 17.4 | .180 | .225 | .196 |
| Mark Teixeira | 18.6 | .259 | .227 | .198 |
| Carlos Delgado | 18.1 | .128 | .234 | .207 |
| Prince Fielder | 11.0 | .271 | .261 | .235 |
| Mike Jacobs | 16.4 | .199 | .227 | .202 |
| League Average | 11.9 | .243 | .246 | .225 |
| Justin Morneau | 9.8 | .239 | .248 | .231 |
You might notice that the league-average BABIP on non-shifted players is 20 points higher than it is for shifted players. This doesn't mean that the shift uniformly lowers BABIP by 20 points. This means that the type of player who gets shifted is bad at reaching base via groundballs. So when comparing the two models, keep the averages in mind, and for players who are speedy, such as Jimmy Rollins, understand that the shift may not be a viable option.
I might be wrong about Justin Morneau, and maybe he isn't shifted regularly, but if he is, it's a mistake. So when it comes to Shift Morneau Shift,* I say "No Shift!"
*Credit to my friend Pat for starting the baseball T.V. shows Twitter topic and my buddy Steve for coming up with Deal Morneau Deal.
Carlos Pena has far and away the most skewed groundball angle toward his pull side. Most of these guys are obvious shift candidates. Fielder and Morneau maybe not so much. But these aren't the only players for whom the shift matters. So how about the non-shifted guys?
I found the difference between the "Shift" column and the "No Shift" column for those batters with at least 25 groundballs hit. Three rookies and J.D. Drew himself top the list. Brennan Boesch, Jason Heyward, and Ike Davis have all been hugely successful, exceeding even the most optimistic of expectations. But maybe their pace will slow once defenses learn how to play them. The exaggerated infield shift is certainly an option. It's also likely that their luck will soon run out, as their grounders have simply found holes. Luck has nothing to do with J.D. Drew's success on grounders. If people would just take a look at his spray chart data, they'd know to shift him, but unfortunately, too many are of the line of thought that it doesn't matter how you play him, since he's hit 30 homers in a season only once and is paid $70 million. J.D. Drew does something funny to people's minds.
Here are five players I would strongly consider shifting against, followed by the rest of my dataset.
| Name | Angle | BABIP | No Shift | Shift |
|---|---|---|---|---|
| J.D. Drew | 18.6 | .253 | .256 | .203 |
| Garrett Jones | 17.4 | .304 | .248 | .203 |
| Chase Headley | 20.0 | .236 | .241 | .196 |
| Adam LaRoche | 20.4 | .178 | .225 | .187 |
| Alex Gordon | 19.4 | .309 | .234 | .197 |
| Baseball Beat | June 23, 2010 |
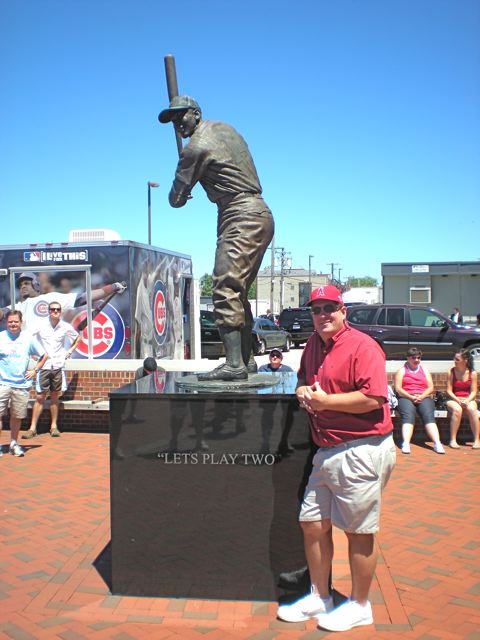
My Trip to Chicago and Wrigley Field in Words, Links, and Photos
I traveled to Chicago on Wednesday for business and attended the Angels-Cubs games on Friday and Saturday at Wrigley Field. It was my first trip to the Windy City in five years. I returned home on Sunday and watched the final round of the U.S. Open before celebrating Father's Day dinner with my family.
Here were the highlights of my trip:
Wednesday
 Thursday
Friday
The Angels beat the Cubs, 7-6, in a game that wasn't really as close as the final score suggests. After George Wendt sang "Take Me Out to the Ballgame," the clouds and umbrellas opened up, and the majority of Chicago fans had left, the Cubs rallied for four runs in the bottom of the ninth on a pair of home runs by Tyler Colvin and Derrek Lee, but it was too little, too late. Although the temperatures hovered in the high-80s early on, a thunderstorm struck immediately after the game and the grounds crew rolled out the tarp before the Angels could get off the field. Steven drove us to his home afterwards and his wife Patti outdid herself in preparing a delicious dinner for all of us. Never underestimate the value of friendships that persist for decades despite geographical obstacles.
Saturday
Howie Kendrick jump started the Halos' offense with a lead-off home run and Jered Weaver combined with Scot Shields to shut out the Cubs, 12-0. Weaver, who leads the American League in strikeouts (107), K/9 (10.17), and K/BB ratio (4.65), is making a strong case for earning the starting nod for the All-Star game in Anaheim next month. That said, there is always room for improvement. Jered tops the league in pitches per plate appearance (P/PA), which has contributed to the fact that he has only worked into the eighth inning twice this season, and has allowed the seventh-highest number of stolen bases (14 SB and only 3 CS) in the junior circuit.
Weaver has confounded skeptics by dominating LHB to the tune of .210/.249/.280 (with 2 HR, 10 BB, and 51 SO in 197 PA) this season. His opponent OPS vs. LHB ranks fourth in the majors among RHP. His big turn and length, outstanding command, and curve ball/slider combo "makes his fastball play up a bit" according to Mike Scioscia. Weaver's improved two-seamer now gives him five quality pitches and his ability to induce popups year-in and year-out adds to his effectiveness.
Sunday
| Touching Bases | June 22, 2010 |
Expected Platoon Splits
A couple of weeks ago, MGL formulated a regression equation that estimated platoon splits based on different pitch types. Max Marchi has found the average run values for different pitch types by batter handedness as well. I ran my own regression equation using pitch velocity and movement to find an expected value of pitches against batters of different handedness.
Pitchers are often placed in the bullpen if they prove incapable of getting opposite-handed batters out. In relief, the ability to get same-handed batters out can be leveraged. In fact, the majority of players with large expected platoon splits are relievers.
Mike Macdougal, a sinker/slider pitcher with a tailing sinker and a sweeping slider has the largest expected platoon split in my sample. As for left-handed pitchers, I was very surprised to learn that Daniel Ray Herrera has a strong platoon split. The changeup is the great neutralizer when it comes to the platoon advantage, and I've always thought of the screwball as a mutant changeup in that it also moves toward same-handed batters. But Herrera is useless against righties. That Herrera has a high LOOGY score is just another mark in his favor for sabermetric fans. I hope by now we all know about the joy of his screwball. But even when he was in college, one stat-savvy fan wrote a ballad for Herrera, and Herrera has since become the mascot for collegesplits.com* Similarly, Hideki Okajima, whose over-the-top delivery I would think allows same-handed hitters to see the ball out of his hand, actually has much greater success against lefties than righties.
*I like to think of Yankee farmhand Pat Venditte as the current Herrera. Seen as trick-pitchers by scouts (Herrera because of his screwball, Venditte because he's a switch-pitcher), both Herrera and Venditte have encountered nothing but success. Venditte has been putting up better numbers in the Minors than he did as a walk-on-turned-All-American at Creighton. At 25 years old, Venditte has thrown 36 innings in High-A this year, striking out 48, walking 9, and allowing one homer. People say that his gimmick won't work when he has to face Major League hitters, but I say the game's the same, just gets more fierce. I fear that the only reason the Yankees have yet to promote him is that they don't want to disrupt the structure of every baseball database in the world, as pitcher-handedness has never been tracked by at-bat. Anyway, if I had to guess, I'd think Venditte would perform better as a southpaw, given that he has subpar stuff from both sides, yet he still tries to get it done conventionally as a righty. His sidearm approach as a lefty could at least give Major Leaguers a different look.
Sinkerballer Fausto Carmona has the largest expected platoon split for a starter. He's struck out as many lefties as he's walked in his career, but for some reason he's found more success as a starter than he did in the bullpen, where he had one of the most disastrous runs as a closer of all-time. Carmona's former battery-mate CC Sabathia is also Carmona's counterpart when it comes to left-handed starters expected platoon splits. However, Sabathia is fine against righties, and otherworldly against lefties, which is why he's never been considered as a reliever.
I think J.A. Happ would have the most to gain of any starter by being placed in the bullpen, in spite of his quality changeup. Dontrelle Willis, too. Why hasn't he been tried in the bullpen? Junkballer Matthew Mahoney has one of the few expected reverse platoon splits, although that hasn't come to fruition in his time in the Majors. Chris Tillman, too, has an expected reverse platoon split, so I think it's wise that the Orioles break him in as a starter and keep him in the rotation if only at AAA. And Jennry Mejia's cutter, like Mariano Rivera's, should be either \as good or better against lefties as it is to righties, so that's another reason he should be given every attempt to start. It's Oliver Perez who might be better suited for the bullpen, as he would have utility as a LOOGY.
Joe Maddon and the Rays have surrendered the platoon advantage against changeup specialists a couple times this year. Maddon has stacked the lineup with same-handed batters against such pitchers, and even ordered switch-hitters to bat from their unnatural side. The switch-hitter thing is just crazy, but maybe there's something to a reverse platoon splits with changeup guys. The Rays' front office is known for going the extra 2%, which includes PITCHf/x analysis. But if the decision is coming from any higher up than Maddon, I don't know what data they're looking at. (If Maddon is making the decision, it's off of splits from this year and whatever biases come from being no-hit twice by chaneup artists.) RHP Shaun Marcum and LHP John Danks have been better against opposite-handed batters than same-handed batters, but I don't see anything in their PITCHf/x profile that would suggest their projected platoon splits should be so far from the mean. It's much easier to say which pitchers' reverse platoon splits are fake (I'd say a couple of Giants in Jeremy Affeldt and Sergio Romo) than whose are real.
In doing this analysis, the pitcher in whom I was most interested was Justin Masterson. Ever since he broke into the Bigs, the word was that his sidearm delivery was more suited for relief than starting. His performance has been acceptable as a starter, but his enormous platoon split has reinforced the notion in some minds that he should start. I didn't include him in my sample, since he's a sidearmer, but I predicted his out-of-sample performance anyway. His slider is a fine pitch to both RHBs and LHBs. To righties, both of his fastballs are truly unique pitches, and have been hugely successful. The problem is that his sinker is his best pitch, and he chooses not to throw it to lefties. And his four-seam fastball is rendered ineffective against LHBs, so he's handcuffed himself to only his breaking ball. Without another offering, I don't think he'll ever be able to get lefties out.
| Touching Bases | June 17, 2010 |
Stuff on Stuff
So I ran my StuffRV numbers yesterday, and you know what that means? Gallimaufry!
Chad Cordero is back and pitching in the Major Leagues. I predict that, like this, won't end well.
| Change-Up | June 16, 2010 |
Are Things Looking Up for the Red Sox?
The Boston Red Sox weathered the slow start, guys we knew could play better started to do just that, the balls started to bounce their way, they now hit well with runners on base...so it's smooth sailing now, right? They've ironed out their problems and Boston just needs to keep after it and chip away at the 4-game deficit New York and Tampa Bay currently enjoy over them. Perhaps the hole they dug themselves may prove to be too big, but they're out of their rut.
But are they? I'm not so sure, and here's a handful of reasons why.
1) John Lackey continues to look awful.
Yes, he's 3-1 in his last 4 starts. Yes, the ERA is coming down. But it's June 16th and Lackey currently has a 4.87 K/9. Of the 61 starters in the American League who have tossed at least 60 innings, only 9 have posted a lower K/9. Only 2 pitchers have a less impressive K/BB.
But he's pitching better of late, no? It's hard for me to see that he is. Amazingly, that 4.87 K/9 is actually DOWN to 3.42 over this 4-start "good" stretch for Lackey. His ERA sits at 4.54 while his xFIP is 5.21. He's been bailed out by a superb Red Sox defense and some good balls-in-play fortune.
John Lackey's far from out of the woods, and it's hard to see how the Red Sox fulfill their goals for this season without an effective Lackey.
2) Injuries
The Daniel Nava story has been a blast. Darnell McDonald has filled in admirably. Bill Hall has really come around of late and his ability to play more or less every position, albeit badly, has been invaluable. Felix Doubront has been great in the Minors this year and it will be fun to watch him take the hill Friday night. Tim Wakefield's ability to fill in and make a start whenever needed is huge.
But let's be honest with ourselves. Scott Atchison started a game last Saturday. Nava led off while Hall played shortstop last night. The depth, the scrambling, the fill-ins, it's all great fun but it will also catch up in due time. The Red Sox need strong aggregate contributions from the likes of Josh Beckett, Daisuke Matsuzaka, Jacoby Ellsbury and Mike Cameron if they are going to be the team they can be in 2010.
3) Adrian Beltre will not keep this up.
I love the guy. He's been the best 3rd baseman not named Evan Longoria in the American League. He's raking, and like he always does, he's playing defense. The Red Sox and Scott Boras could not have scripted this any better. It's June and Boston has already got its money's worth out of Beltre while Boras licks his chops as Beltre once again will hit the free agent market after the 2010 season.
It's not going to last, though. Beltre is hitting .333 on the strength of a .367 BABIP, a figure he almost definitely will not be able to maintain. Beltre's ZIPS projection on his Fangraphs page for the rest of 2010 has him at .293/.337/.473 while he currently sits at .333/.366/.524. The drop-off might not feel precipitous, but the Red Sox will begin to get less and less out of Beltre.
4) Clay Buchholz is having a 2008 Daisuke type season.
In 2008, Dice-K was 18-3 with a 2.90 ERA. As Larry David might say, prett-AY prett-AY good. But beneath his win-loss record and earned run average, Matsuzaka had a pedestrian K/BB ratio and a downright awful 5 walks per 9 innings. Somehow he maintained a .260 BABIP-against for a full season and a ridiculous strand rate.
Fast forward to 2010 and Clay Buccholz is 9-4 with a 2.67 ERA. Ostensibly, Buchholz looks like a Cy Young candidate. But like Matsuzaka in 2008, his peripherals don't seem to line up with those of a great pitcher. He's posted just a 1.71 K/BB, and his good fortune shows itself in his .281 BABIP-against and his incredible, unsustainable 3.9 HR/FB%. Some of those fly balls Clay is giving up will begin to land on the other side of the fence, and some of those grounders will find more holes.
5) The Bullpen
In February, while many touted the Boston bullpen as a real strength, I expressed concerns. Hideki Okajima, Ramon Ramirez and Jonathan Papelbon all slipped in the 2nd half of 2009. Manny Delcarmen was more or less awful all season long. Daniel Bard seemed to be the only real sure bet in the pen.
Sure enough, it's more or less how 2010 has played out. Bard's been excellent, Papelbon somehow ekes by with seemingly weaker stuff, and the other three have been awful. Nobody has more appearances in the American League than Bard, so Boston will need others to step up before long, or else they will need to acquire another arm. It's likely that they will need both to happen, but it's hard to see a quick fix on the horizon.
==========
The storyline for the Red Sox this season has been that they have been able to battle through a slow start, some crippling under-performance and terrible injury luck to crawl back into playoff contention. All of these things are true. What I wanted to highlight in this post was that there are two sides to that coin. The Red Sox have also been the beneficiaries of unlikely performances, while there may not be a quick fix to some of the problems that continue to plague the team.
All in all, I would say the problems above are easily offset by the potential a healthy quartet of Beckett, Matsuzaka, Ellsbury and Cameron offer. But if those four cannot provide a boost down the stretch, look for items discussed herein to sink Boston's hopes.
| Touching Bases | June 15, 2010 |
Bimodal Distributions
Dave Allen has written at length about Mariano Rivera's pitch locations. PITCHf/x has recorded over 2,500 Mo-thrown pitches, and from the following graph, you can see that Rivera spots his fastball on either side of the plate, but is able to avoid the middle.
Dave described this horizontal scattering as a bimodal distribution, which Rob Neyer in turn called his "new favorite baseball term." Chris Moore, too, was intrigued, and he found that Rivera is indeed the best at hitting the corners. "On average, Rivera places his pitches 4.4 inches away from the very edge of the plate."
I'm interested in who can throw to both sides of the plate, but avoid the middle. So I broke the plate into thirds and counted the number of each pitcher's separate pitch types in each zone. Overall, I came up with a list of about 60 pitchers who threw fewer pitches in the middle zone than they did in either of the outer thirds. Andy Pettitte, Carl Pavano, Jake Peavy, and Livan Hernandez command multiple pitches on both sides of the plate. Rivera, of course, stood out, as he throws only 20% of pitches over the plate in the middle third, while other pitchers are 25% and up. But using the invaluable Texas Leaguers' PITCHf/x tool, which provided the above graph for Rivera, I'd like to take a look at some other pitchers who manage visible bimodal distributions.
Here's Shaun Marcum, who throws the third-softest fastball in the American League, but commands it better than nearly anyone.
Livan Hernandez's fastball shows a bimodal distribution, but unlike Rivera and Marcum, he doesn't keep the batters guessing. He only throws his fastball outside.
Livan vs. RHB:
Livan vs. LHB:
Since Livan demonstrates the ability to throw his fastball to both sides of the plate, shouldn't he keep hitters honest by coming in on them once in a while?
Hiroki Kuroda follows a similar approach to Livan, but more impressively, he avoids the heart of the plate with his slider.
Kuroda vs. RHB:
Kuroda vs. LHB:
But I prefer pitchers who can throw the same pitch to both sides of the plate against the same batter, like Jamie Moyer's cutter to righties.
| Baseball Beat | June 14, 2010 |
A Smorgasbord Monday
News, notes, and stats from around the major leagues while doing my best to avoid the buzzing sound of the vuvuzelas at the World Cup games over the weekend.
Let's take a look at Kemp's stats BC (before Colletti) and AC (after Colletti):
      AVG    OBP    SLG     OPS
BC   .316   .379   .645   1.024
AC   .243   .304   .395    .700
Coincidence? Small sample sizes? Hurt feelings? Or a combination? You pick your poison.
While Kemp didn't deserve the Gold Glove he "won" last year, the center fielder wasn't nearly as bad as he has been this campaign. According to Ultimate Zone Rating (UZR), Kemp ranks last among all CF with -15.7, which works out to -42.3 per 150 games (or about four losses more than an average fielder at that position). His baserunning has also been dismal with 9 SB, 9 CS, 2 PO (pick-offs), and 3 other outs on the bases.
Kemp will almost assuredly be moved to a corner outfield position after Manny Ramirez exits Los Angeles, but it is also possible that he could be traded during the offseason.
For his part, the 36-year-old Blake is hitting .258/.333/.442 while making $6 million (compared to the pro rated minimum that Santana will earn this year and not much more than the $500,000 he will be paid over each of the next three seasons — unless, of course, he agrees to a longer-term deal that buys out a year to two of free agency at a discounted price).
The most remarkable stat of all might be that the injury-plagued Glaus leads the league in games played with 64. With each passing day, he looks more and more like one of the best free-agent signings last offseason. He inked a contract for $1.75 million with bonuses that equal an additional $2.25 million for a maximum payout of $4M. Although Glaus ranks as the worst-fielding first baseman in the majors according to UZR, he has been worth over $5 million thus far using Fangraphs' Wins Above Replacement (WAR) converted to a dollar scale based on what a player would make in free agency.
Gregerson, who combines a 91-mph fastball with one of the best sliders in baseball (an MLB-best 10.4 runs above average among RP), may be the best-kept secret in the game and one of the main reasons why the Padres sit atop the NL West with a 37-26 record.
While Rodriguez's major league stats are in stark contrast to his minor league results (5.03 ERA, 1.55 WHIP, 6.1 K/9, and 4.4 BB/9 in 499 IP), he has pitched much better since being converted to a full-time reliever in 2008. Nonetheless, his performance in the majors has defied all reasonable expectations. Small sample size for sure but take a look at his stuff for yourself if and when you get the chance. He throws a heavy 94-95 mph fastball, an 89-mph cutter, and an occasional curveball that has generated a lot of swinging strikes (18.9%) and 11 groundballs out of the 15 batted balls in play.
| Touching Bases | June 10, 2010 |
Spitballing on Command
At best, quantifying command is really difficult. At worst it's a foolish endeavor. The reason is that, while we may know the precise location of a pitch thanks to PITCHf/x data, we have no idea of the pitcher's intention. Perhaps pitchers could fill out a survey after every inning, or perhaps someone could track the target of the catcher's glove. Maybe these data are being collected somewhere, but they certainly aren't publicly available. But we beat on.
Mike Fast in the 2009 Hardball Times Annual took a shot at measuring Cliff Lee's command, and Dave Allen tried with Mariano Rivera. Borrowing ideas from both of them, I attempted to rank a group of pitchers by command.
My sample consists of pitches that I have classified as four-seam fastballs in RHB vs. RHP matchups on 0-0 counts. 100 pitchers have thrown at least 200 such pitches, giving me over 60,000 data points.
First, I came up with a heat map. It shows what you'd expect. Fastballs up-and-in or down-and-away are most successful. Then I predicted each pitch's expected run value based on such location. Here are the top six:
Greg Maddux
Trevor Hoffman
Yusmeiro Petit
Phil Hughes
Paul Byrd
Maddux's command is legendary, so it speaks wellthat he ranks so highly. I'm pretty sure all of these guys have good reputations for command. And the bottom 5:
Seth McClung
Fausto Carmona
Rich Harden
Dennis Sarfate
Matt Albers
Looking at a pitcher's walk rate usually suffices in grading command. Since 2007, all of these guys have surrendered their fair share of walks, and all those balls show up in the numbers.
So I think that method has legs. I controlled for a fair amount of things (batter/pitcher handedness, count, pitch type), but one could go even further and regress the league-wide locational run values to each batter's own heat map. The sample sizes get small, so for left-handed fastballs to left-handed batters, I'd probably combine 0-2 counts with 1-2 counts, and use both two-seam and four-seam fastballs. Regression to the mean and stuff.
I also tried clustering analysis. In a situation as specific as RHB vs. RHP, 0-0 count, pitchers generally have more types of pitch offerings to choose from than pitch locations. With fastballs, you either go high heat or throw at the knees. With sliders, there's back foot or back door. Curves are intended to be thrown either anywhere in the dirt or anywhere in the zone. Anyway, those are the assumptions you need to make if you believe clustering makes sense. Furthermore, if you're limited to k-means clustering, you might as well assume that all pitchers have two intended locations for their fastballs. That's what I did, anyway. So I gave each pitcher his own two separate cluster centers, and found each pitch's standard deviation from those centers, grouping by pitcher. Here were the leaders:
Greg Maddux
Brett Myers
Joakim Soria
Ricky Nolasco
John Lackey
Maddux is no Rivera, but he's head-and-shoulders above the other 99 pitchers in my sample when it comes to command, so it lends validation to the power of PITCHf/x that two rudimentary analyses can pull out Maddux's needles from the haystack. The bottom five:
Matt Garza
Brandon Morrow
Seth McClung
Rich Harden
David Aardsma
I believe that Aardsma's four-seam fastball is an outlier in several ways. Though I'm not disregarding this piece of data, I don't think it means what it's supposed to mean. But all of these guys are prone to the walk. It would be weird be if somebody had excellent command outside the strike zone, so that his expected run values based on location graded out poorly, but he had really tight clusters of pitches. This would indicate good command but poor approach. I always get that feeling watching Dice-K.
So Maddux, Nolasco, Hughes, and Petit are in the top ten of both lists. I know Maddux and Nolasco have great reputations for control; I'm unsure about the other two. Garza, Sarfate, Harden, and McClung show up in the bottom ten of both lists, Sarfate and McClung definitely have no aptitude for command.
The ultimate goal here is to evaluate pitchers. I feel confident that with a sample of 50 pitches, I could assess a guy's stuff. I think a pitcher would need to have thrown over 1,000 pitches, assuming he's not walking the ballpark, to provide an ample PITCHf/x sample for evaluating command, given the need to drill down the data by pitch types, batter types, and counts. And it takes precisely 4,242 pitches to get a good read on a pitcher's intangibles.
| Touching Bases | June 08, 2010 |
Dollars per WAR
When it comes to free agent signings, baseball fans love making snap decisions and playing GM. Some contracts, like Evan Longoria's or Ryan Howard's, are rather easy to judge. To objectively evaluate others, you need a whole lot of context. I'd like to provide a bit of that context using the informative and interactive Google Motion Charts. (If you want to view the charts, you need Flash, and if you're using Chrome, you need to open them in a new tab or incognito. For some reason, Google doesn't want its browser to have access to its apps.)
The baseball databank has salary data going back to 1985, and Sean Smith's WAR database well covers that time frame. As the Collective Bargaining Agreement stands, players in their first few years of MLB service time have their salary set by the team (league minimum $400,000). After that, players face several years where they are eligible for arbitration, and finally, with over six years of service time, they can become free agents. Here is how each group of players has been valued over time.
The less experienced players have seen their salaries rise steadily since 1985. But I'd like to focus more on the more interesting group of players who have over seven-plus years experience. Many mark 1998 as the year that baseball recovered from 1994. Indeed, from 1998 to 2003, the market rate for "free agent" WAR rose $500,000 per year, which signifies financial health. Consequently, over half of all MLB salaries went to these "free agent" players during the time period. However, these players produced approximately 75-80% of the league's WAR, whether they accounted for 40% or 65% of the league's salary. Free agents are no longer in vogue, as teams realize the value of the more inexperienced players, and are less willing to pay for for production from more experienced players. From the chart, you can see that over the last couple years, free agent prices might be on the decline, while cheap talent has become less cheap.
I'm also interested in dollars per WAR at the team level. I broke down the data into five increments of five years apiece stretching from 1985-2009, and found the average yearly WAR, salary, and dollars per WAR for all 30 teams. You might be familiar with a graph of this nature, plotting a team's payroll against a team's success.
This demonstrates the positive, non-linear relationship between pay and performance. The size of each point represents whether a point falls above or below an imagined regression line. I've highlighted both teams from Florida, and both teams from New York. The Marlins and Rays, occupied by the smallest dots, appear to get the most out of limited resources since 2005. But have they identified market inefficiencies, or are they just cheap? The Yankees and Mets portray the most bloated dots, and perhaps dole out the most bloated contracts. So are their payrolls' driven by reckless spending, or is the free agent market more practical to them?
In Baseball Between the Numbers, Nate Silver penned a seminal piece in which he stated that the marginal value of a win is most valuable for teams closest to the playoffs. Many point out that the more a team spends, the more it wins Few point out that the more a team wins, the more it should spend. Breaking the data down further, I ran the salary and WAR numbers by team for only players with over six years experience. This way, we can see if the Rays and Marlins have shrewdly spent in the free agent market, or if they simply stayed away from signing veterans altogether, thereby controlling costs. If the Yankees and Mets have been winning games by outbidding other teams in free agent auctions, they would be afflicted by the winner's curse. They would pay above-market rates for free agents. However, they do not, as evidenced by the color of their dots. The shading of each point represents the Dollars per WAR paid for a team's most experienced players. Due to their position in the standings, the Mets and Yankees find more value in the free agent market than others do, so New York teams allocate more resources in it. But they spend about as efficiently as others.
While the Marlins may spend their money efficiently, this is only because they more or less avoid free agents, not because they make wise free agent signings. In fact, the teams that have spent least on free agents over the last five years have been less successful when dipping their toes in the free agent waters. The average Dollars per WAR for seven-plus year players has been around $4.5 million, which shows up as greenish-yellowish in the chart. The yellow/red points indicate teams that have spent inefficiently on free agents. Turns out, Seattle, San Francisco, Baltimore, San Diego, Washington, Kansas City, Pittsburgh, and Florida have had the worst fortune in the free agent market. None of these teams have dabbled too heavily, but they've all paid well above market rate, and the Padres are the only one of them to have made the playoffs. Meanwhile, the Yanks and Mets pay right around market rate. The Blue Jays have somehow managed to acquire good, experienced players on the cheap.
| Baseball Beat | June 07, 2010 |
The 2010 MLB First-Year Player Draft Has Arrived
This has been and continues to be a big week for sports fans. The French Open. The Memorial Tournament. The Stanley Cup Finals. The NBA Championship. The NCAA Baseball Regionals. The MLB First-Year Player Draft. And the Major League debuts for Stephen Strasburg and Mike Stanton.
The main focus today is on the draft, which starts at 7 p.m. ET. It will be televised live by MLB Network and MLB.com.
Bryce Harper, the 17-year-old catcher who we highlighted two years ago, is expected to be taken by the Washington Nationals with the No. 1 pick. He hit .442/.524/.986 with 29 HR in 254 plate appearances with a wood bat for the College of Southern Nevada this year. Look for the Nats to move Harper's power bat and strong arm to right field where he can advance through the minor league system more rapidly than at catcher. Harper, who was ejected in his final junior college game last week, is lacking in maturity but not talent.
Once Washington pops for Harper, the next question will be the amount of the signing bonus. Harper is advised by Scott Boras, who will try to persuade the Nats ownership into a Strasburg-type bonus. Look for the Nats to shell out at least $10 million but not $15 million despite threats along the way of Harper playing another year at CSN and re-entering the draft in 2011.
The Los Angeles Angels, who have three first-round selections (18th, 29th and 30th overall), possess five of the first 40 picks overall. The Houston Astros (8th and 19th), the Texas Rangers (15th and 22nd), and the Tampa Bay Rays (17th and 31st) also hold multiple first-round choices.
Here are the projections of Baseball America (Jim Callis), ESPN (Keith Law), and Baseball Prospectus (Kevin Goldstein). Callis' predictions were updated within the past couple hours while Law's and Goldstein's were made a couple days ago and are subject to last-minute revisions.
| Num | Baseball America | ESPN | Baseball Prospectus | |
|---|---|---|---|---|
| 1 | Nationals | Bryce Harper | Bryce Harper | Bryce Harper |
| 2 | Pirates | James Taillon | Jameson Taillon | Manny Machado |
| 3 | Orioles | Manny Machado | Manny Machado | Jameson Taillon |
| 4 | Royals | Chris Sale | Chris Sale | Chris Sale |
| 5 | Indians | Drew Pomeranz | Drew Pomeranz | Drew Pomeranz |
| 6 | D-backs | Barret Loux | Matt Harvey | Matt Harvey |
| 7 | Mets | Zack Cox | Zack Cox | Zack Cox |
| 8 | Astros | Josh Sale | Josh Sale | Michael Choice |
| 9 | Padres | Karsten Whitson | Karsten Whitson | Nick Castellanos |
| 10 | Athletics | Michael Choice | Michael Choice | Christian Colon |
| 11 | Blue Jays | Christian Colon | Christian Colon | Josh Sale |
| 12 | Reds | Brandon Workman | Yasmani Grandal | Kolbrin Vitek |
| 13 | White Sox | Asher Wojciechowski | Asher Wojciechowski | Deck McGuire |
| 14 | Brewers | Matt Harvey | Deck McGuire | Anthony Ranaudo |
| 15 | Rangers | Jake Skole | Delino DeShields | Asher Wojciechoswki |
| 16 | Cubs | Justin O’Conner | Justin O’Conner | Alex Wimmers |
| 17 | Rays | Reggie Golden | Bryce Brentz | Austin Wilson |
| 18 | Angels | Peter Tago | Dylan Covey | Stetson Allie |
| 19 | Astros | Delino DeShields | Kolbrin Vitek | Karson Whitson |
| 20 | Red Sox | Kolbrin Vitek | Anthony Ranaudo | Yasmani Grandal |
| 21 | Twins | Alex Wimmers | Alex Wimmers | Mike Kvasnicka |
| 22 | Rangers | Bryce Brentz | Brandon Workman | Justin O’Conner |
| 23 | Marlins | Luke Jackson | Barret Loux | A.J. Cole |
| 24 | Giants | Yorky Cabrera | Nick Castellanos | Bryce Brentz |
| 25 | Cardinals | Yasmani Grandal | Stetson Allie | Brett Eibner |
| 26 | Rockies | Kyle Parker | Kevin Gausman | Dylan Covey |
| 27 | Phillies | Jesse Biddle | Christian Yelich | Kaleb Cowart |
| 28 | Dodgers | Drew Vettleson | Drew Vettleson | Brandon Workman |
| 29 | Angels | Stetson Allie | Peter Tago | Ryne Stanek |
| 30 | Angels | Dylan Covey | Tony Wolters | Sammy Solis |
| 31 | Rays | Tony Wolters | Derek Dietrich | Kelllin Deglan |
| 32 | Yankees | Christian Yelich | Gary Brown | Gary Brown |
We will have more analysis of the draft in the days to come. In the meantime, enjoy the festivities at MLB Network and MLB.com this evening. The draft will continue on Tuesday and conclude Wednesday.
***
Updates
1. Harper was indeed announced as an outfielder. ETA: June 2013 as a 20-year RF along the lines of Jason Heyward and Mike Stanton.
2. Kansas City pulls the first surprise and nabs Christian Colon, a shortstop out of Cal State Fullerton, with the fourth overall pick. Colon (.352/.439/.621 with 16 HR and 32 BB/17 SO) can handle the bat but lacks the range to play shortstop at the highest level. In a game against Long Beach State last month (in which he went 3-for-6 with a HR at Blair Field), I clocked him to first base at 4.64. While it may not have been an all-out sprint to first, I would be surprised if he can get down the line under 4.50. Look for Colon, who broke his leg last summer, to play SS in the minors but his ticket to the big leagues may be as an offensive-oriented second baseman.
3. While I've never seen Delino DeShields Jr. play in person, I'm skeptical that he merits the eighth overall selection of the draft. But nothing Houston does surprises me. Taken as a center fielder, his speed may rank as a legitimate 80 on the 20-80 scouting scale. However, with a below-average arm, DeShields may be better suited for left field or second base. At 5-foot-9 and 188 pounds, it will be interesting to see if he can hit for more power than his father (80 HR in 6652 plate appearances), who was leaner but stood four inches taller.
4. The only way to explain the Hayden Simpson pick is that the Cubs either have insight that nobody else had or are looking to save money with their first-round selection. Simpson (6-0, 175) is a smallish righthander from Southern Arkansas University (Division II). He posted a 13-1 record with a 1.81 ERA while striking out 131 and walking 35 in 99.1 innings. The school's website reported that "Simpson was listed by various sources as expected to be taken anywhere from the second through eighth rounds. None may have been more surprised than Simpson."
“I’m just blown away,” Simpson stated. “I had no idea I’d be picked then. A bunch of friends came over just to watch the draft. I was waiting for tomorrow’s rounds.”
5. The Angels drafted three high school players from Georgia with their first round picks. It will take a lot of money to sign this trio. Kaleb Cowart (3B/RHP, Cook County HS) has signed a letter of intent to play baseball at Florida State. Cam Bedrosian (RHP, East Coweta HS), the son of the 1987 NL Cy Young Award winner, has committed to LSU. Chevez "Chevy" Clarke (CF, Marietta HS) has signed to play at Georgia Tech.
| Baseball Beat | June 05, 2010 |
John Wooden, 1910-2010
John Wooden died Friday night of natural causes at Ronald Reagan UCLA Medical Center in Los Angeles. He would have turned 100 on October 14.
While Wooden is generally recognized as the greatest basketball coach ever, he was much more than a coach. He transcended the sporting world and was nearly as legendary for serving as a role model and teaching his midwestern values as the 10 national championships his UCLA teams won in 12 years (including seven straight from 1967 to 1973). Wooden amassed a record of 885-203 (.813) as a college coach, winning 88 consecutive games and 38 NCAA tournament games in a row.
Wooden is one of only three members elected to the Basketball Hall of Fame as a coach and as a player. (The other two are Bill Sharman and Lenny Wilkens.) He went to Purdue, winning All-America honors three times and leading the Boilermakers to the 1932 national championship. Wooden coached at the high school level and at Indiana State before being hired by UCLA in 1948, where he remained until retiring after winning his last championship in 1975.
 Although I went to USC, Wooden's influence was so far reaching that I grew up rooting for UCLA during the 1960s and early 1970s. My first college basketball memories were watching Walt Hazzard, Gail Goodrich, and Keith Erickson lead the Bruins to an undefeated season and the school's first NCAA basketball title in 1964. I was hooked and followed Wooden's teams, which included All-Americans Lew Alcindor, Mike Warren, Lucius Allen, Sidney Wicks, Bill Walton, Henry Bibby, Keith Wilkes, and Dave Meyers, closely thereafter.
UCLA only lost 19 games spanning a dozen years from Wooden's first championship in 1964 to his last championship in 1975. These losses were so infrequent that many of them (such as the loss to Houston in the first nationally televised college basketball game in 1968, USC's dramatic upset using a slow-down offense in 1969 at Pauley Pavilion, Notre Dame ending UCLA's 88-game winning streak in 1974, and North Carolina State defeating the Bruins in the semi-finals in 1974) stand out in my mind four decades later. But I'll never forget the big wins, including many net-cutting ceremonies that are indelibly etched in my memory.
Wooden was active in retirement, writing books, giving speeches, and attending as many UCLA home games as possible. Nell, his wife of 53 years, died in 1985. He was a devoted father, grandfather, and husband, writing love letters to his deceased wife right up until the very end. A religious man who read the Bible daily, Wooden didn't smoke, drink, or curse (although he was known to berate referees using words like "dadburn it" or "goodness gracious sakes alive"). He admired his father Joshua, regularly quoting his "two sets of three: (1) never lie, never cheat, never steal and (2) don't whine, don't complain, don't make excuses."
Upon graduation from grammar school, his dad gave him the following Seven-Point Creed:
- Be true to yourself.
- Make each day your masterpiece.
- Help others.
- Drink deeply from good books, especially the Bible.
- Make friendship a fine art.
- Build a shelter against a rainy day.
- Pray for guidance and give thanks for your blessings every day.
Wooden later developed his "Pyramid of Success," consisting of philosophical building blocks for winning at basketball and in life. I had the privilege of attending a breakfast featuring Wooden as the keynote speaker at the Pyramid on the campus of Long Beach State University about 15 years ago. Coast Federal Bank, the sponsor of the event, handed out "John Wooden's Pyramid of Success" (shown above), which he generously autographed afterwards. In his mid-80s, Wooden spoke for nearly an hour without the benefit of a TelePrompter or any notes or cards. He explained his Pyramid, shared his wisdom, and recited many poems off the top of his head. The morning was educational, inspirational, and unforgettable.
Coach taught his players fundamentals, teamwork, and sportsmanship. He was more pleased by his players’ success in life than on the basketball court. Almost all of his players graduated, with dozens becoming lawyers, teachers, doctors, or ministers.
Wooden impressed upon the rest many lessons of life, including some of my favorite Wooden maxims (from Wooden: A Lifetime of Observations and Reflections On and Off the Court):
- The best way to improve the team is to improve ourself.
- Big things are accomplished only through the perfection of minor details.
- Discipline yourself and others won't need to.
- I will get ready and then, perhaps, my chance will come.
- If you don not have the time to do it right, when will you find the time to do it over?
- The smallest good deed is better than the best intention.
- The man who is afraid to risk failure seldom has to face success.
- Time spent getting even would be better spent trying to get ahead.
- It is what you learn after you know it all that counts.
- Goals achieved with little effort are seldom worthwhile or lasting.
- Tell the truth. That way you don't have to remember a story.
- Don't let making a living prevent you from making a life.
- Although there is no progress without change, not all change is progress.
- Do not permit what you cannot do to interfere with what you can do.
- Be more concerned with your character than your reputation. Character is what you really are; reputation is what you are perceived to be.
- Much can be accomplished by teamwork when no one is concerned about who gets credit.
- Don't permit fear of failure to prevent effort. We are all imperfect and will fail on occasions, but fear of failure is the greatest failure of all.
- The time to make friends is before you need them.
- Nothing can give you greater joy than doing something for another.
- Do not mistake activity for achievement.
- You can do more good by being good than any other way.
- Treat all people with dignity and respect.
- Acquire peace of mind by making the effort to become the best of which you are capable.
Oh... and Wooden's favorite sport? Baseball. He coached baseball in college and was offered the job to manage the Pittsburgh Pirates in the 1960s.
Farewell, Mr. Wooden. You will be missed but never forgotten.
[There are videos and links to numerous articles at ESPN Los Angeles.]
| F/X Visualizations | June 04, 2010 |
Three Perfect* Games
Even before Wednesday we had witnessed a remarkable thing: two perfect games in the course of a single season -- that last happened in 1880. But then Armando Galarraga seemingly had the third of the season. You know the story by now and much has been written about the game, the call, and how the parties have responded (I can add my voice to the chorus of voices praising how they have). In addition there has discussion about whether Selig should overturn Joyce's call and give Galarraga the perfect game, which he will not, with reasonable and considered opinions on both sides (studes and Dave Cameron for calling it a perfect game, MGL and Craig Calcaterra seeing that as setting a dangerous precedent). I will leave that discussion to them and at least consider it a perfect game for the sake of this pitchf/x tribute to the three games.
In each case I show the location of the pitches thrown in the game, separated by handedness of batter, color coded by pitch type, called strikes have a white '+', swinging strikes a black '+' and those put in play are encircled.
Dallas Braden
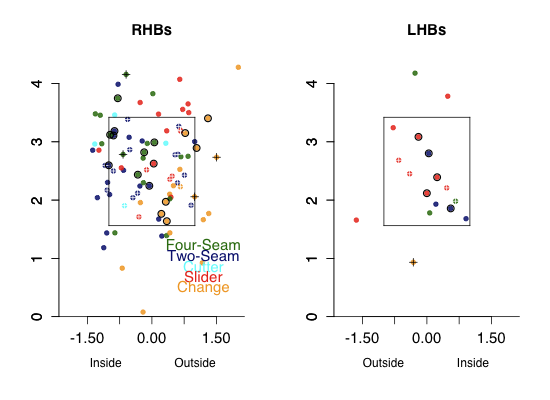
Braden throws five pitches and his best is a very slow (72mph) changeup. Although he works relatively high in the zone he did a great job of keeping his change down-and-away to RHBs where it got a couple of swinging strikes, but also some contact. Contact on that nasty change so far away is going to be pretty weak, probably leading to easily field-able balls in play. To both LHBs and RHBs Braden was around the zone with all his pitches, resulting in no walks.
Roy Halladay
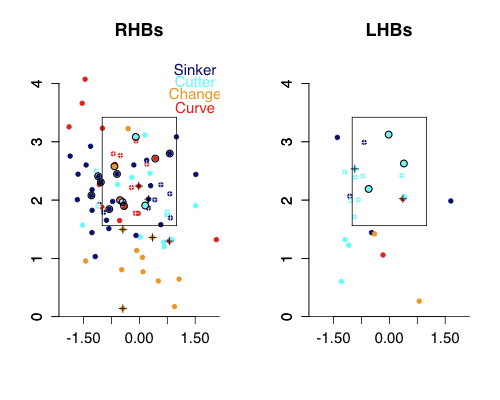
You can see how much lower in the zone Halladay works compared to Braden, one of the reasons he gets so many more ground balls. Halladay's change rather than being down-and-away is just down. Look at all those changes below the zone, four of them resulted in swingings strikes. Halladay pounded his sinker (two-seam fastball) down-and-in against RHBs. Against LHBs Halladay threw lots of cutters.
Armando Galarraga
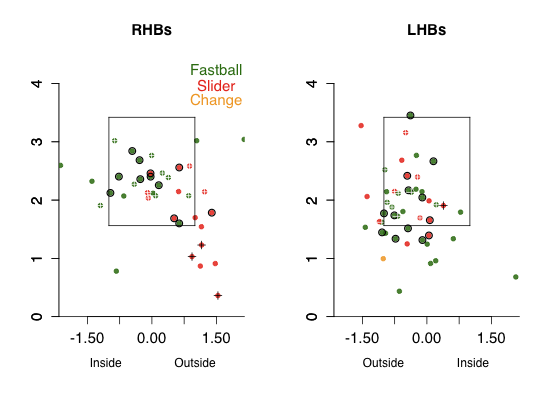
Galarraga, mostly a fastball/slider pitcher, did a great job of keeping his pitches down to RHBs, with his fastball inside and his slider down-and-away. That slider got a good number of swinging strikes on pitches way out of the zone. Against LHBs Galarraga keeps his pitches almost perfectly on the outer half of the plate, where LHBs are less dangerous. He only got one swinging strike against LHBs, but by keeping his pitches away all of the contact was harmless
| Touching Bases | June 03, 2010 |
WAR Aging Curves
WAR, short for Wins Above Replacement, is an all-encompassing metric of a player's value. It incorporates hitting, defense, baserunning, durability, and spits out one number. Using Sean Smith's invaluable WAR database, I studied positional player aging.
We know that speed and defense peak early and that power and walks peak late. With WAR, we can throw everything together. Overall player value was originally posited to peak between ages 28-32, but the subject has been revisited and peak age revised to somewhere around 26-30. Here's my basic aging curve.
To develop this curve, I found all examples of players playing in two consecutive seasons, excluding the first and last year's of a player's career, since those tend to be somewhat fluky. I then computed the average difference in WAR between such seasons.
While players between 30 and 35 years old are often the best in the Majors, they are likely in decline. In general, I find that players improve at a decreasing rate until they're 27 or so and then decline at an increasing rate. I'm not trying to toss my hat into the J.C. Bradbury vs. MGL debate, but I'm using that as my benchmark for further aging curves.
My intention is to find how players, given a certain set of characteristics, age as compared to others. Height and weight are fairly consistent attributes, but unfortunately, height and weight data are unreliable for baseball players. Nevertheless, it would make sense that players with different body types would age their own separate ways, so I used body mass index to differentiate between big and small players.
Bigger is better, although the aging curves move along more or less parallel lines. You might say that bigger players age less gracefully than smaller players, but that could be just because they are better and therefore have more room to collapse. Regression to the mean works more heavily on players farther from the mean.
Next, I separated players by career defensive ability, as defined by the sum of the positional and total zone components of WAR.
Bad defenders are good hitters, otherwise they wouldn't play. I would imagine that during a bad defender's peak, he is a passable fielder. But as he ages and his defense deteriorates at a pace that outstrips the offensive decline of good defenders, the good defenders become better all-around players than the bad ones.
Separating by career hitting value,
Bad hitters peak two years earlier than good hitters. My guess is that good hitters use their power, which peaks late, while bad hitters get by with their speed, which peaks early.
Bill James once submitted that "young players with old player's skills...tend to peak early and fade away earlier than other players." Old player skills consist of striking out, walking, hitting for power, and being slow. Separating players by career baserunning value yielded no trend. I also looked at strikeout and walk rates. To do so, I had to limit my sample to years after 1954.
This evidence indicates that high-strikeout players do indeed peak a year earlier than low-strikeout players, but they also have a smoother aging curve than their counterparts. If they fade away faster, it's only because they weren't as good in the first place
By walk rate,
High-walk players actually peak a year later than low-walk players, but fade faster.
There are some lessons on regression to the mean in here. Better players appear to decline quickly because there's more room for them to collapse in case of an injury. I'm not making any conclusions about aging curves for types of players with old player skills or any such subset, since the more specifically I drill down a type of player, the smaller the sample becomes. Even so, big or small, old player skills or no, the Ryan Howard contract was a mistake.
| Baseball Beat | June 02, 2010 |
They Don't Make 'Em Like This Anymore
Happy 80th Birthday to Bob Lillis. My favorite player growing up was signed by Brooklyn in 1951 and played for the Los Angeles Dodgers, St. Louis Cardinals, and Houston Colt .45s/Astros. He was the expansion team's MVP in its inaugural season in 1962.
Born in Altadena, California, during the first year of the Great Depression, Robert Perry Lillis attended Pasadena High School, Pasadena City College, and the University of Southern California. He was on PCC's national championship team in 1949 and was nominated for the College World Series Legends Team based on his performance for USC in the 1951 tournament. Lillis made his MLB debut with his hometown Dodgers in August 1958 during the club's first year in Los Angeles. He wore jersey No. 30 a year before Maury Wills was called up to the big leagues. Both shortstops were previously buried in the team's minor league system behind future Hall of Famer Pee Wee Reese.
Lillis was traded to the Redbirds in 1961 and was drafted by the Colt .45s as the fifth pick in the 1961 expansion draft. He played ten years in the majors and was a scout, coach, or manager of the Astros from 1967-1985 and a bench coach with the San Francisco Giants from 1986-1996.
Even though Lillis hit only .236/.270/.277 with just three home runs in nearly 2,500 plate appearances, a young kid could not have had a better favorite player. He was the friendliest athlete I met, sending me autographed photos with hand-written inscriptions three times.
The first photo that Lillis sent to me was almost 49 years ago to the day when he thanked me for sending him a card on his 31st birthday. I was a month short of my 6th birthday. On the verso, he wrote "Dear Richard, That was a very nice picture you sent me. Thank you for the thoughtful birthday card. Sincerely, Bob Lillis."
Over the years, I lost contact with the player I called "Bobby" but he's always occupied a special place in my heart and the photos have been a treasured part of my collection now for nearly 50 years.
Happy Birthday, Bobby. If you happen to read this, please feel free to contact me via email. I would enjoy hearing from you. Thank you.
| Change-Up | June 02, 2010 |
Fading Stars?
A little over a month ago in a piece about Geovany Soto's hot start, I noted the following about the Cubs offense:
When your biggest problems are Derrek Lee and Aramis Ramirez, there's hope.
Now, on June 2nd, the question has become "when your two biggest problems are Derrek Lee and Aramis Ramirez for the first third of the season, and you're 6.5 games out of a playoff spot as a result, is there still hope?". Lee is hitting a career-worst .232/.339/.366, while Ramirez, at .162/.227/.269, might be the very worst regular in baseball so far in 2010. Lee is not living up to his potential, Ramirez isn't living up to MY potential. Since I wrote the sentence above on April 29th, Lee has hit .252/.341/.365, Ramirez .169/.239/.241.
So, is there hope? For Chicago, given the strong play from those around Ramirez and Lee, the prospect of the two performing at anywhere near their career norms is tantalizing. Here is how Cubs regulars have performed thus far in 2010:
           AVG   OBP   SLG  wOBA
Soto      .260  .409  .415  .376
Fontenot  .324  .373  .481  .372
Castro    .310  .355  .414  .334
Soriano   .301  .368  .589  .414
Byrd      .299  .340  .490  .366
Fukudome  .294  .392  .490  .382
Lee is a career .283/.368/.500 hitter, while Ramirez put up a .292/.369/.539 line from 2006 to 2009. Add those two hitting the way they can and suddenly the Cubs have one of the best lineups in the National League. Will Ramirez and Lee turn it around? Let's take a look at some numbers that might offer a glimpse (the line drive numbers are from 2002 on).
                  BABIP   LD%     K%    BB%
Lee '10           .275    23.0   23.8   13.7
Lee Career        .322    21.3   23.1   11.3
Ramirez '10       .187    15.0   25.7    8.1
Ramirez Career    .288    19.8   15.5    7.3
In Lee's case, I think we can safely expect significant improvement. He's hitting the ball hard, and his strikeouts and walks are in line with his career totals. If anything, Lee's peripherals presented above look better than his career numbers.
As for Ramirez, everything looks pretty ominous. He is striking out way more than he ever did, while only walking slightly more often, and not hitting the ball as hard as he has in the past. His .187 BABIP is ridiculously low so he's likely to improve - really, he cannot get any worse - but there's a chance Ramirez may not return to form in 2010. Given what we've seen from the third baseman thus far, I don't think it's premature for the Cubs to contingency-plan for 3rd base while looking out for signs of improvement from Ramirez over the next 30-50 games or so. Maybe the best available way to glean how Lee and Ramirez figure to play the rest of the year is by looking at their Rest of Season Zips projections on Fangraphs.
          AVG   OBP   SLG  wOBA
Lee      .277  .363  .466  .366
Ramirez  .265  .337  .460  .349
That Ramirez projection looks optimistic to me, but one can hope.
Even if Lee and Ramirez return to form, the rest of the lineup that has performed so ably to date for the Cubs might regress. There are no guarantees. The lesson of this Cubs season so far is that teams need their stars to perform in order to fulfill expectations. The Cubs remain within striking distance, but a 2-4 stretch with just 11 total runs scored over their last 6 games has made it painfully obvious that this Cubs offense needs a productive Lee and Ramirez to mount a playoff charge.
| Designated Hitter | June 01, 2010 |
A Lifetime on the Road
One of the great insights of the sabermetric revolution is the recognition that when evaluating a player, context counts. Ballparks, scoring environments, teammates, leagues and a host of other factors often give the illusion of success (or failure) to a ballplayer’s career. In this article, I take a look at some players through the prism of their road statistics to try to tease out differences in performance and ability that may cause you to think differently about certain stars of the last 50 years.
Intuitively, we recognize that hitters who play in great environments like Coors are benefitted and that players in cavernous stadiums are generally hurt. I am not sure, however, that we ever truly appreciate that some players, as a result of hitting style, luck or other reasons, are inordinately benefitted or hindered by their home ballpark.
By looking at just a player’s career road statistics, I try to separate out the effect of a player’s home ballpark and come to some interesting observations when certain hitters are compared “all else being equal.” The theory is simple, by examining a player’s away statistics, we get to view a player’s production playing at what is close to a league-average neutral park because all the park’s except the player’s home stadium are counted. The methodology is also equally simple, for purposes of this article, I will lay out a player’s slash statistics (avg./obp./slg.) and double his home runs, hits, RBIs and runs accumulated on the road so that the totals replicate traditional career numbers. Obviously, players play very similar amounts of games on the road and at home, so doubling does not reflect differences in opportunity and, by focusing on career statistics, sample size problems are easily avoided. Also, the players I compare here (usually with a player A and player B format) were contemporaries, so they may be playing in the same ballparks at the same time (although league differences may skew the results a bit). Nevertheless, the “road career” I have created here often differs markedly from the numbers we associate with a lot of the great players discussed.
From looking at a lot of home and road splits, I made a number of observations I will pass on. For a host of reasons, some of which we can guess about, over the course of their career, players generally perform better at home than on the road. Additionally, players probably deserve some credit for learning to take advantage of their home ballparks (or were recognized by talent evaluators for having skills that would translate well to a particular ballpark), so taking away their home stats probably over-penalizes a player a bit. Finally, it is clear that two venerable ballparks, Fenway and Wrigley, result in giant advantages for certain hitters. So I suspect that a number of Red Sox and Cubs fans will have particular views about this article. All the players discussed below had complete careers after the retro sheet era, so there are not gaps in their numbers. Without further ado, here are some comparisons for discussion:
Example 1 – The Hall Of Very Good
For my first example, I am comparing two players whose careers largely overlapped in the National League. Both were multiple gold glove fielders playing the same position in the middle of the defensive spectrum. Both played in lower run scoring environments than today. Both are in the Hall of Merit, but only one is a cause celebre as an unjust Hall of Fame snub.
Player A won 5 gold gloves, was an eleven time all star and won one MVP. He performed better at home and his slash line away is .277/.340/.443. If he spent his career on the road, he would have accumulated 2066 hits, 268 homers, 996 RBIs and 1056 runs.
Player B also won 5 gold gloves (starting right after the run of Player A) and was a nine time all star. His highest MVP performance was fourth. He too performed better at home, and his slash line away is .257/.342./406. His “career on the road” yields 2092 hits, 256 homers, 1176 RBIs and 958 runs.
Both players are pretty even, but seeing the above, I would take Player A. If you haven’t guessed, Player A is Ken Boyer, Player B is Ron Santo. Santo mashed at Wrigley over his career (.296/.383/.522), but was just ordinary on the road. Take away the Wrigley advantage, and these guys were about as even as they come in playing ability. (The comparison above is not entirely fair, because, even though their careers overlapped, Santo peaked in the ultra-low scoring environment of the late 60’s, by which team Boyer’s career was basically over.) Nevertheless, the numbers cause me to question whether Santo really is as deserving for the Hall of Fame as many now believe (and frankly, I did before looking at his splits).
Example 2: The Best Right Handed Hitter of the Steroids Era?
The next four players were all born within a few months of each other in 1968 (two share a birthday, which already will alert some trivia buffs). These right handed sluggers debuted between 1988 and 1992. Who was the best?
Player A has a .297/.414/.511 slash line on the road. His career on the road yields 2444 hits, 418 dingers, 1630 RBIs and 1368 runs. He is a 5 time all star and two time MVP. With the glove, he is best remembered as a hitter.
Player B has a .288/.384./.501 slash line on the road, and would have had 2704 hits, 1594 runs, 494 homers, and 1670 RBIs had his entire career been played on the road. He was a nine time all star and his best showing for MVP was second. Although not a good fielder, he was versatile, having played all over the diamond during his career. He is also generally regarded as one of the surlier stars of the past twenty years.
Player C has a .291/.398/.521 away slash line, with 2306 hits, 1422 runs, 430 home runs, and an even 1500 RBIs. He was a four time all star, one time MVP and garnered one gold glove (and was generally regarded as a good fielder).
Player D has a .320/.388/.572 slash line. This road warrior’s away career would have garnered 2328 hits, 1094 runs, 464 homers and 1414 RBIs. He was a twelve time all star and his best showing for MVP was a couple of second places. Oh, did I mention he was a catcher?
If you haven’t guessed, the above are, in order, Frank Thomas, Gary Sheffield, Jeff Bagwell and Mike Piazza. Piazza’s power and overall hitting on the road is astounding, as he gets an additional 20 to 30 points in average over the other greats here and sports a slugging percentage fully 50, 60 and 70 points better than Bagwell, Thomas and Sheffield, respectively. Piazza had the unlucky circumstance of having played most of his career in Chavez Ravine and Shea, two parks that are tough on right handed power hitters. Even his short stopovers in Oakland, San Diego, and a week of games for the Marlins were all played in pitchers’ parks. He is one of the small percentage of players whose road numbers are better than his home numbers (.294/.364/.515). He averaged 38 homers per 162 games on the road. A good argument can be made that Piazza was the best right-handed hitter of this bunch. I don’t know that many would have argued that before seeing the numbers. Rather, I imagine most people would think Frank Thomas was the best hitter of this group. Thomas, for his part, had 100 more home runs at home than on the road, showing he may have benefitted inordinately from favorable home parks well suited for his hitting. His career home numbers, primarily at Comiskey, are a phenomenal .305/.424/.599.
As a side note, Manny Ramirez, who is four years younger than this group, has even more impressive away numbers (as well as a much closer association with the “steroids era” than Thomas, Bagwell and Piazza). At the time of this writing, his road slash numbers are .313/.408/.582, even better than Piazza’s, and he has produced comparable line, .313/.414/.596, at home.
Example 3: a Trio of 3000-Hit Slap Hitters
When I think of great career hitters for average, three names that jump to mind are Tony Gwynn, Wade Boggs and Rod Carew. Among the three, they all finished with between 3010 and 3143 hits, all hit between .328 and .338, with on base percentages between .388 and .415 while slugging between .429 and .459. Below are three slash lines, and the number of hits they would have if they played all their games on the road.
Player A: 3088 hits, .323/.385/.425
Player B: 3172 hits, .334/.384/.451
Player C: 2774 hits, .302/.387/.395
In order, that is Carew, Gwynn, and Boggs. Carew and Gwynn, on the road, hit like Rod Carew and Tony Gwynn. Wade Boggs hits like Al Oliver (career 2743 hits, .303/.344/.451).
Boggs is not the only 3000 hit-club member who received a big boost from Fenway. One of the most notable “road careers” is that of Carl Yastrzemski, who put up a career .264/.357/.422 on the road, with what would have been 3194 hits, 430 homers, 1644 runs and 1562 RBIs. Not a lot of .264 hitters get to 3000 hits, so it is hard to believe that Yaz could have gotten there without the benefit of a home park that suited him well and helped keep him in the lineup for 23 years. His career line at home is an impressive .306/.402/.503.
Example 4: Let Wrigley Double Your Pleasure
Now let’s take a look at three Cub icons, Ryne Sandberg, Billy Williams and Mr. Cub himself, Ernie Banks. I have compared the first two to long-time Tigers Lou Whitaker and Al Kaline (the number one and three most comparable players to each, respectively, according to Baseball Reference) and Banks to his top comparable, Eddie Mathews. Only one of the long-time Cubs’ road numbers hold up, can you guess who?
So here are the second sackers:
Player A: With a .269/.326/.412 line, this second baseman’s road career yields 2256 hits, 1184 runs, 908 RBI and 236 homers.
Player B: With a .274/.357/.406 line, this second baseman would have tallied 2394 hits, 1310 runs, 1070 RBIs and 196 homers with a career entirely on the road.
And the outfielders:
Player A: With a .278/.349/.459 line, this outfielder’s life on the road would garner 362 homers, 2596 hits, 1363 RBIs and 1298 runs.
Player B: With a .292/.369/.458 line, this outfielder would clout 346 homers, with 1510 RBIs, 1568 runs, and 2998 hits if his career took place solely on the road. I am pretty sure he would not have found a way to get a couple more hits.
And the slugging infielders:
Player A: His .259/.311/.462 on the road would result in 444 homers, 2424 hits, 1454 RBIs, 1168 runs and an inordinate number of outs.
Player B: His .277/.382/.529 line would result in 548 homers, 2468 hits, 1574 RBIs, 1624 runs and likely consideration as a member of the inner circle of Hall of Famers.
In all the examples above, the Cub is always Player A. Take Ryne Sandberg out of Wrigley, and he doesn’t look like a Hall of Famer, even for a second baseman. Of course, his .300/.361/.491 career line at Wrigley counts toward his bottom line, so he skated in to Cooperstown. In this exercise, however, Whitaker’s career looks more impressive than Sandberg’s when you factor in the longer effectiveness as well as the additional 30 points in on base percentage. That Whitaker couldn’t even manage to stay on the Hall of Fame ballot is a travesty.
Williams holds up remarkably well (and better than I would have thought), considering he wasn’t quite the hitter Kaline was when factoring in home numbers. Williams’ home slash stats of .302/.374/.525 are still much better than his road numbers, however.
The Mathews/Banks comparison is especially revealing, as Banks and Mathews played in the same league at the same time. Mathews simply laps Banks. Mathews was better on the road than at home (.264/370/.488) over the course of his career. Hank Aaron, Mathews’ right-handed power-hitting teammate, produced virtually identical numbers home and away, so it is not self-evident that the Braves’ ballparks were a burden on right-handed power hitters. (Willie Mays, like Aaron, also produced virtually identical numbers at home and on the road, refuting the oft-repeated, and oft-debunked, myth that his power numbers were sapped by unfortunate home venues.) Banks was a different, and better, hitter at home, where he had a career line of .290/.348/.537, a more than .110 point difference in OPS. Considering he played fewer than half his games at shortstop, had Banks spent his “career on the road,” so to speak, it is not clear he would have been a Hall of Famer, and certainly would not have been thought of as an elite member of the Hall, as he generally is now.
Conclusion
I suspect a lot of people will argue that this methodology is unnecessary because OPS plus factors in home ball parks or that a player should receive full credit for taking advantage of his environment. I think, however, that looking at only road statistics serves as a great equalizer in assessing such questions as, “who was better?” When we ask that question, we generally don’t mean to look merely at accumulated statistics without context, but to examine the question in light of a platonic ideal of a great hitter. A great hitter is a great hitter at home, on the road or in the middle of a cornfield. Hits, and especially home runs, are often the result of hitting a ball well in a stadium that rewards it, and not all players end up in parks that reward their skills. Simply, ballparks do not behave equally or match a hitter’s strengths equally. By looking at the amalgamated statistics of a player on the road, I believe we gain better insight into a player’s performance by eliminating the home field advantages or disadvantages that a player faces in half his at bats.
Finally, for some parting thoughts, here are some other observations I made. For example, I always considered Kirby Puckett and Don Mattingly interesting comparables in terms of Hall of Fame debates. Puckett hit just .291/.330/.431 on the road compared to .302/.353/.450 for Mattingly. In my mind, neither cuts it as a Hall of Famer based on their short careers. If I ever thought there was an offensive difference between Dave Winfield (.289/.356/.485) and Eddie Murray (.286/.356/.482) I certainly can’t believe there is one now. I find it hard to make a strong case for Jim Rice as a Hall of Famer based on his weak road stats (.277/.330/.459), especially when Edgar Martinez (.312/.412/.514) is such a long shot. I have a heightened appreciation of Jeff Kent (.290/.353/.504) who toiled for several teams, mostly in pitchers’ parks. The magnitude of difference between Larry Walker on the road (.278/.370/.495) and at home (.348/.431/.637), while predictable, is nevertheless astounding.
Often, a review of splits confirms our perception of a player, but in some cases, it challenges it. While not the ending point of all debates, looking at road statistics provides new and often unexpected insights.
Doug Baumstein is an attorney in New York and Mets fan.