Rich Lederer • Baseball Beat
Patrick Sullivan • Change-Up
Jeremy Greenhouse • Touching Bases
Dave Allen • F/X Visualizations
Sky Andrecheck • Behind the Scoreboard
Marc Hulet • Around the Minors
Al Doyle • Past Times
Retired Uniforms:
Bryan Smith • WTNY
Joe Sheehan • Command Post
Jeff Albert • The Batter's Eye
RSS Feed
Home
*Examining the Past, Present, and Future*
Lineup Card
Recent Entries
» Putting Together a Reality Team
» Historical Hall of Fame Vote Comparisons: 2012
» An All-Christmas Team
» The New-Look Angels
» John Denny: The Forgotten Cy Young Award Winner
» Money Isn't Everything
» What Would It Take to Hit .400 in the 21st Century?
» Halos Heaven
» Brandon McCarthy's Breakout Season
» Link-o-Rama
» Historical Hall of Fame Vote Comparisons: 2012
» An All-Christmas Team
» The New-Look Angels
» John Denny: The Forgotten Cy Young Award Winner
» Money Isn't Everything
» What Would It Take to Hit .400 in the 21st Century?
» Halos Heaven
» Brandon McCarthy's Breakout Season
» Link-o-Rama
Best of Baseball Beat
Abstracts From the Abstracts
1977 Baseball Abstract
1978 Baseball Abstract
1979 Baseball Abstract
1980 Baseball Abstract
1981 Baseball Abstract
1982 Baseball Abstract
1983 Baseball Abstract
1984 Baseball Abstract
1985 Baseball Abstract
1986 Baseball Abstract
1987 Baseball Abstract
1988 Baseball Abstract
1978 Baseball Abstract
1979 Baseball Abstract
1980 Baseball Abstract
1981 Baseball Abstract
1982 Baseball Abstract
1983 Baseball Abstract
1984 Baseball Abstract
1985 Baseball Abstract
1986 Baseball Abstract
1987 Baseball Abstract
1988 Baseball Abstract
Bert Blyleven Series
Meeting Up and Hanging Out with Bert
The Results Are In And...
Aficionado Heavily Invested in Blyleven
Latest on Blyleven's Chances for the HOF
The Internet Zealot Responds
400 Down and 5 to Go...
Bert Be Home By Eleven?
Blyleven's Forgotten Season (1973)
HeyMan, Your Comments Don't Hold Water
The Waiting is the Hardest Part
Another Addition to the Blyleven Series
Search for the Truth
As Dominant as His HOF Contemporaries
Listen, Buster
A Larger Step for Blyleven
Answering the Naysayers (Part Two)
Another Small Step for Blyleven
Q&A: Blyleven on the Twins
The Majority Rules, Right?
It's All Dutch to Some
The Hall of Fame Case for Bert Blyleven
Q&A: Blyleven on Felix Hernandez
Clemens Rocketing Up Charts
Poz: An Interview With a KC Star
A HOF Chat with Tracy Ringolsby
Up Close and Personal
A Peek Into the Mind of a HOF Voter
Answering the Naysayers
It's That Time of the Year (Again)
"If Cooperstown is Calling..."
The Bert Alert
One Small Step for Blyleven...
Only the Lonely
Exclusive Interviews
Lee Sinins
Alex Belth
David Pinto
Will Carroll
Mike Carminati
Aaron Gleeman
Joe Sheehan
Jay Jaffe
Jeff Peek
Tracy Ringolsby
Joe Posnanski
Bill James Part I, II, III
Jon Lalonde
Chuck Tiffany
Dayn Perry
Fay Vincent
Nate Silver
Alex Belth
David Pinto
Will Carroll
Mike Carminati
Aaron Gleeman
Joe Sheehan
Jay Jaffe
Jeff Peek
Tracy Ringolsby
Joe Posnanski
Bill James Part I, II, III
Jon Lalonde
Chuck Tiffany
Dayn Perry
Fay Vincent
Nate Silver
Bullpen
Rich Lederer
The Odd Couple (with Alex Belth)
The MostUnder Over Underrated Player in Baseball (with Brian Gunn)
Three Wise Men (roundtable by Alex Belth)
Infrequently Asked Questions (interview with Matt Welch)
Interview (Orioles Think Tank)
Bernie and the Yanks (Bronx Banter)
Hope and Faith: How the LAA Win the World Series (Baseball Prospectus)
NL West (The Soul of Baseball)
Greatest Living Hitter? (Sports Illustrated)
Roundtable: 2008 HOF Ballot (Armchair GM)
The Most
Three Wise Men (roundtable by Alex Belth)
Infrequently Asked Questions (interview with Matt Welch)
Interview (Orioles Think Tank)
Bernie and the Yanks (Bronx Banter)
Hope and Faith: How the LAA Win the World Series (Baseball Prospectus)
NL West (The Soul of Baseball)
Greatest Living Hitter? (Sports Illustrated)
Roundtable: 2008 HOF Ballot (Armchair GM)
Patrick Sullivan
Designated Hitters
David Bromberg (Q&A: John Denny)
Mark Armour (H. Killebrew and Versatility)
Joe Lederer (Soundtrack of a Prospect)
David Bromberg (Clemente's Autograph)
David Bromberg (Woody Fryman)
D. Baumstein (WAR Against Age: Pitchers)
Doug Baumstein (The WAR Against Age)
Doug Baumstein (A Lifetime on the Road)
John Fraser (Pick Six)
Mark Armour (How to Score More Runs?)
Bill Parker (What Opening Day Tells Us)
Stan Opdyke (Pat Rispole)
Chris Jaffe (Evaluating Baseball's Mgrs)
Stan Opdyke (Baseball Radio in NYC, 1953)
A. Nathan (Performance of Baseball Bats)
Michael Weddell (Edgar Martinez/HOF)
Jon Weisman (100 Things Dodgers Fans...)
Stan Opdyke (Connie Mack and Vin Scully)
Eric Walker (Evaluating Run Production)
Brent Mayne (The Intangibles of Catching)
Chris Moore (Best Fastballs in Baseball)
Dave Baldwin (The Batter’s Brain)
Shawn Haviland (Ivy League to MLB)
Larry Granillo (Walking Off)
Rob Iracane (Solo HR Won't Break You)
Tommy Bennett (Charm of AM Radio)
Harry Pavlidis (Johan Santana's Fast Start)
John Walsh (WAR and Remembrance)
Eric Walker (Precisely Inaccurate)
Bob Timmermann (As They See 'Em)
Geoff Young (Unicycles and Delusions)
Baseball Analysis at Tufts (Groundballers)
Baseball Analysis at Tufts (GB Out Rates)
G. Rybarczyk ('09 Hit Tracker Projections)
Joe Lederer (Curt Schilling/HoF)
Conor Gallagher (Hall of Fallacies)
Chris Green (Jim Rice, HoF, the Numbers)
Shawn Hoffman (Baseball's Bear Mkt?)
Paul Anthony (Manny Syndrome)
Ross Roley (World Series Odds)
B. Timmermann (Catcher's Interference)
R.J. Anderson (Waiting the Hardest Part)
Maury Brown (Cubs, MLB, and Cuban...)
Myron Logan (Dee-Fense, Dee-Fense)
Craig Calcaterra (Frivolity, Part I, Part II)
Chad Finn (Ode to Baseball Cards)
David Cameron (Mariners Foibles)
Chris Dial (Chipper Jones)
Pat Lederer (Memory Lane)
David Appelman (Clutch Pitching)
Bob Rittner (DH)
Jonathan Mayo (Roger Clemens)
Lisa Winston (My Son-in-Law...)
Russ McQueen (The Yellow Hammer)
Bob Rittner (I'm OK, You're OK)
Mark Armour (In Defense of the HOF)
Pat Jordan (Friends)
Dan Levitt (Analysis of Terry Ryan)
Doug Baumstein (Trading Econ 101)
Ross Roley (Runner's Reluctance II)
Ross Roley (Runner's Reluctance I)
Mark Armour (No-Longer Lovable Sox)
Bruce Regal (Stealthy and Wise)
Brian Gunn (Roid Monster)
Current/McEvoy (Value of the SB)
John Rickert (Sinister Thefts)
Nate Silver (Sabermetrics)
David Vincent (Home Run Production)
Joe P. Sheehan (Enhanced Gameday II)
Mark Armour (An Ode to Sport)
David Gassko (All-Time Worm Burners)
Joe P. Sheehan (Enhanced Gameday)
John Walsh (When Titans Clash)
Fox/Williams (Quantifying Coaches II)
Fox/Williams (Quantifying Coaches I)
Jacob Luft (Bull Durham Rant)
Chad Finn (Strat-O-Matic)
Lisa Winston (Rotisserie Baseball)
Dave Studeman (Baseball Stats)
Steve Treder (Roger Craig)
Marc Normandin (Jeff Bagwell)
D. Appelman (Expanding Strike Zone)
Jeff Sackmann (Worst MiL Defenders)
Jeff Sackmann (Best MiL Defenders)
Maxwell Kates (Van Lingle Mungo)
David Appelman (Pitch Location)
Kent Bonham (Danny Ray Herrera)
Glenn Stout (Two Baseball Poems)
Bruce Regal (The Challenge Round)
Mark Lamster (Barry & Ty)
Geoff Young (NL West)
Tom Lederer (The Ryan Express)
Brian Erts (Great Leap Forward)
David Pinto (Parity and the N.L.)
Jacob Luft (Fathers and Daughters)
Jamey Newberg (Pete's Sake)
Jeff Albert (A. Jones Swing Analysis)
Jeff Albert (A-Rod Swing Analysis)
Keith Law (Death, Taxes, and Waivers)
Peter Abraham (Tales of Torre Tales)
Larry Borowsky (Let 'er Rip II)
Dan Levitt (Empirical Analysis of Bunting)
Jonah Keri (If I Met Warren Cromartie...)
Bob Klapisch (War Stories)
Bob Timmermann (John F. Kennedy HS)
Kent Bonham (Aluminum Adjustments)
Al Doyle (More Than Superstars)
Ross Roley (Instant Replay)
David Vincent (Barry Bonds Homers)
Chad Finn (Our Favorite Obscurities)
Bill Deane (1979 NL MVP)
Mark Armour (Rise/Fall of Artificial Turf)
Jeff Angus (Wally Moon Camp)
David Berri (Money and Baseball)
Larry Borowsky (Baseball w/o the #s)
Derek Zumsteg (The Irrational Market)
David Regan (Free Agent Contracts)
Peter Schmuck (Steroids and the HOF)
David Appelman (Pitchers, Pitch by Pitch)
Dan Fox (Swinging, Taking, Fouling, Etc)
Patrick Sullivan (Study of NYY CF/BOS LF)
Will Leitch (Baseball Journalism)
Jeff Sullivan (Pitcher Release Points)
Steve Treder ('69-'70 Giants)
Maury Brown (Charlie Finley)
John Brattain (Bob Johnson)
Bob Klapisch (The Case for Bert Blyleven)
Jeff Peek (Pride and Prejudice)
Dayn Perry (Bert and Warren)
Rob Neyer (If Don Sutton Was Great...)
Lisa Winston (Minor League Memories)
Alex Belth (Otis Redding Was Right)
David Cameron (Long Live the King)
Jeff Angus (Baserunning Study)
Bert Blyleven (Baseball Playoffs)
Boyd Nation (Not a Prospect List)
James Click (Batters-Baserunners Study)
Jeff Shaw (Why I Love Baseball)
David Gassko (BIP/BFP Fielding Study)
Jay Jaffe (Milwaukee Sausage Race)
Jamey Newberg (Remember When)
Bob Klapisch (Press Box to the Mound)
Dan Levitt (Predictive Value of BB)
David Vincent (Official Scorer)
Jon Weisman (Rick Monday)
Larry Borowsky (Let 'er Rip)
Will Carroll (Fictional Short Story)
Bob Timmermann (Japanese Baseball)
Cyril Morong (Best Pitching Seasons)
Sean Forman (Monte Carlo Win-Loss)
Brian Gunn (My Little Blue Book)
Joe Lederer (My Dad and Baseball)
Bill Deane (Bob Gibson, 1968)
Mark Armour (1977 Yankees)
Darren Viola (Retrosheet)
David Pinto (RFK)
Dayn Perry (Brave Heart)
Matt Welch (Dave Hansen)
Kevin Kernan (Jack McKeon)
Tom Lederer (Dodgers Road Trip)
Steve Lombardi (Slider)
Studes (Picturing Baseball)
Mike Carminati (Luck of the Drawl)
Eric Neel (Vin Scully)
J.C. Bradbury (Leo Mazzone)
John Sickels (Bill James)
Search Baseball Analysts
Archives
By Category:
Around the Majors Content Only
Around the Minors Content Only
Baseball Beat Content Only
Baseball Beat/Change-Up Content Only
Baseball Beat/WTNY Content Only
Behind the Scoreboard Content Only
Change-Up Content Only
Change-Up/Around the Majors Content Only
Command Post Content Only
Crunching the Numbers Content Only
Designated Hitter Content Only
F/X Visualizations Content Only
Past Times Content Only
Saber Talk Content Only
The Batter's Eye Content Only
Touching Bases Content Only
Weekend Blog Content Only
WTNY Content Only
By Month:
February 2012
January 2012
December 2011
October 2011
September 2011
August 2011
July 2011
June 2011
May 2011
April 2011
March 2011
February 2011
January 2011
December 2010
November 2010
October 2010
September 2010
August 2010
July 2010
June 2010
May 2010
April 2010
March 2010
February 2010
January 2010
December 2009
November 2009
October 2009
September 2009
August 2009
July 2009
June 2009
May 2009
April 2009
March 2009
February 2009
January 2009
December 2008
November 2008
October 2008
September 2008
August 2008
July 2008
June 2008
May 2008
April 2008
March 2008
February 2008
January 2008
December 2007
November 2007
October 2007
September 2007
August 2007
July 2007
June 2007
May 2007
April 2007
March 2007
February 2007
January 2007
December 2006
November 2006
October 2006
September 2006
August 2006
July 2006
June 2006
May 2006
April 2006
March 2006
February 2006
January 2006
December 2005
November 2005
October 2005
September 2005
August 2005
July 2005
June 2005
May 2005
April 2005
March 2005
February 2005
January 2005
December 2004
November 2004
October 2004
September 2004
August 2004
July 2004
June 2004
May 2004
April 2004
March 2004
February 2004
January 2004
December 2003
November 2003
October 2003
September 2003
August 2003
July 2003
June 2003
Reference
Organizational Stats
Arizona Diamondbacks Bat / Pitch
Atlanta Braves Bat / Pitch
Baltimore Orioles Bat / Pitch
Boston Red Sox Bat / Pitch
Chicago Cubs Bat / Pitch
Chicago White Sox Bat / Pitch
Cincinnati Reds Bat / Pitch
Cleveland Indians Bat / Pitch
Colorado Rockies Bat / Pitch
Detroit Tigers Bat / Pitch
Florida Marlins Bat / Pitch
Houston Astros Bat / Pitch
Kansas City Royals Bat / Pitch
Los Angeles Angels Bat / Pitch
Los Angeles Dodgers Bat / Pitch
Milwaukee Brewers Bat / Pitch
Minnesota Twins Bat / Pitch
New York Mets Bat / Pitch
New York Yankees Bat / Pitch
Oakland Athletics Bat / Pitch
Philadelphia Phillies Bat / Pitch
Pittsburgh Pirates Bat / Pitch
St. Louis Cardinals Bat / Pitch
San Diego Padres Bat / Pitch
San Francisco Giants Bat / Pitch
Seattle Mariners Bat / Pitch
Tampa Bay Devil Rays Bat / Pitch
Texas Rangers Bat / Pitch
Toronto Blue Jays Bat / Pitch
Washington Nationals Bat / Pitch
All-Star Links
Official Websites
News and Notes
Baseball News Blog
Baseball Newstand
ESPN Baseball
Fox Sports Baseball
Pro Sports Daily
Roto World
The Roto Times
USA Today Baseball
Baseball Newstand
ESPN Baseball
Fox Sports Baseball
Pro Sports Daily
Roto World
The Roto Times
USA Today Baseball
Reference and Analysis
Baseball Almanac
Baseball America
Baseball Archive
Baseball Contracts
Baseball Cube
Baseball Graphs
Baseball Library
Baseball Musings Player Database
Baseball Page
Baseball Primer
Baseball Prospectus
Baseball Reference
Baseball Statistics
Baseball Truth
Boxscore Central
Diamond Mind Baseball
Doug's Stats
FanGraphs
Fast Balls (pitchfx catalog)
Hardball Dollars
Hardball Times
Hit Tracker
Retrosheet
Rotobase/Rotoblog
Stat Corner
STATS
Tango on Baseball
Yahoo Sports MLB
Web Gems
Bill James Primer
Sabermetric Manifesto (Grabiner)
Pitching and Defense (McCracken)
Pitching and Defense (Tippett)
Transactions Primer (Neyer)
Baseball Stats (Batter's Box)
Prospect Report (Cameron)
Pitcher Workloads (Sheehan)
Goodbye to Old Baseball Ideas (Rickey)
Sabermetric Manifesto (Grabiner)
Pitching and Defense (McCracken)
Pitching and Defense (Tippett)
Transactions Primer (Neyer)
Baseball Stats (Batter's Box)
Prospect Report (Cameron)
Pitcher Workloads (Sheehan)
Goodbye to Old Baseball Ideas (Rickey)
Columnists
Baseball Blogs
Around the Majors
Athletics Nation
Baseball Crank
Baseball Musings
Baseball-Reference Blog
Batter's Box
Big League Stew
Bronx Banter
Catfish Stew
Cub Town
Dan Agonistes
Dodger Thoughts
DRays Bay
Ducksnorts
Futility Infielder
Halos Heaven
Inside the Rockies
It Might Be Dangerous
Knuckle Curve
LoHud Yankees Blog
Lookout Landing
Management by Baseball
Metaforian
Metsgeek
Mike's Baseball Rants
Only Baseball Matters
Redbird Nation
Red Reporter
Sabernomics (Braves)
Seth Speaks
ShysterBall
6-4-2 (Angels/Dodgers)
The Book
TheCubdom
The Cutting Edge
The House That Dewey Built
The View From The Bleachers
Tiger Blog
U.S.S. Mariner
Viva El Birdos
Where's Kernan
Minor Leagues
Arizona Fall League
BA Player Finder
Cal Leaguers
Jamey Newberg
JDM's Scoresheet Baseball
Minor League Baseball
Minor League Park Factors
Minor League Splits
No Pepper
Sickels' Minor League Ball
Warm October Nights
BA Player Finder
Cal Leaguers
Jamey Newberg
JDM's Scoresheet Baseball
Minor League Baseball
Minor League Park Factors
Minor League Splits
No Pepper
Sickels' Minor League Ball
Warm October Nights
Amateur
Boyd's World (College)
Cape Cod Baseball League
College Baseball Blog
College Baseball Insider
Collegiate Baseball Newspaper
College Splits
College Splits Blog
Dirtbags Baseball (Long Beach State)
NCAA Baseball
NCBWA
Team One Baseball (High School)
Texas A&M & Baseball
Cape Cod Baseball League
College Baseball Blog
College Baseball Insider
Collegiate Baseball Newspaper
College Splits
College Splits Blog
Dirtbags Baseball (Long Beach State)
NCAA Baseball
NCBWA
Team One Baseball (High School)
Texas A&M & Baseball
Historical
Cuban Baseball
House of David
Jim "Mudcat" Grant's Web Page
Negro League Baseball Players Assoc
Negro Leagues Baseball Museum
1919 Black Sox
Pacific Coast League
Philadelphia Athletics Historical Society
Shoeless Joe Jackson Society
SABR-L Archives
Walter O'Malley
House of David
Jim "Mudcat" Grant's Web Page
Negro League Baseball Players Assoc
Negro Leagues Baseball Museum
1919 Black Sox
Pacific Coast League
Philadelphia Athletics Historical Society
Shoeless Joe Jackson Society
SABR-L Archives
Walter O'Malley
Miscellaneous
Forums
Credits
Ticket Center
Tickets to Baseball -
Premium Red Sox Tickets - Tickets to Marlins Games - Cardinals Game Tickets - NY Yankee Tickets - Tickets Oakland Athletics - Dallas Cowboys Tickets - Arizona Cardinals Tickets - Tickets Seattle Seahawks - Buffalo Bills Tickets Online - Tickets to Dolphins Football
Buy Boston Red Sox tickets,
Philadelphia Phillies tix,
NY Yankees tickets,
NY Mets tickets, and
MLB All Star game tickets at ABC tickets
Not sure where to find the best online sportsbooks? Start your search with PlayersJet.
Get deals at SportsMemorabilia.com on baseball apparel, including Phillies jerseys and more for adults and children.
Shop the largest selection baseball equipment on sale at Sports Unlimited. Check out tons of baseball gloves, youth baseball gloves and catchers gear from Rawlings, Wilson, Nike & Under Armour.
2011 Draft Order
Courtesy of Baseball America
First-Round:
 1. Pirates (57-105)
 2. Mariners (61-101)
 3. Diamondbacks (65-97)
 4. Orioles (66-96)
 5. Royals (67-95)
 6. Nationals (69-93)
 7. Diamondbacks (for B. Loux)
 8. Indians (69-93)
 9. Cubs (75-87)
10. Padres (for Karsten Whitson)
11. Astros (76-86)
12. Brewers (77-85)
13. Mets (79-83)
14. Marlins (80-82)
15. Brewers (for Dylan Covey)
16. Dodgers (80-82)
17. Angels (80-82)
18. Athletics (81-81)
19. Red Sox (from DET for Martinez)
20. Rockies (83-79)
21. Blue Jays (85-77)
22. Cardinals (86-76)
23. Nationals (from CWS for Dunn)
24. Rays (from BOS for Crawford)
25. Padres (90-72)
26. Red Sox (from TEX for Beltre)
27. Reds (91-71)
28. Braves (91-71)
29. Giants (92-70)
30. Twins (94-68)
31. Rays (from NYY for Soriano)
32. Rays (96-66)
33. Rangers (from PHI for Lee)
Supplemental First Round:
34. Nationals (Dunn)
35. Blue Jays (Downs)
36. Red Sox (Martinez)
37. Rangers (Lee)
38. Rays (Crawford)
39. Phillies (Werth)
40. Red Sox (Beltre)
41. Rays (Soriano)
42. Rays (Balfour)
43. Diamondbacks (LaRoche)
44. Mets (Feliciano)
45. Rockies (Dotel)
46. Blue Jays (Buck)
47. White Sox (Putz)
48. Padres (Garland)
49. Giants (Uribe)
50. Twins (Hudson)
51. Yankees (Vazquez)
52. Rays (Benoit)
53. Blue Jays (Olivo)
54. Padres (Torrealba)
55. Twins (Crain)
56. Rays (Choate)
57. Blue Jays (Gregg)
58. Padres (Correia)
59. Rays (Hawpe)
| Designated Hitter | January 31, 2008 |
The Yellow Hammer
[Editor's note: Russ McQueen and my brother Tom were All-CIF pitchers on the Lakewood High School team that won the California Interscholastic Federation championship at Anaheim Stadium in 1970. Russ played on four consecutive NCAA championship teams at USC. He was named the College World Series MVP in 1972 when he pitched 14 shutout innings in relief while chalking up three of USC's five wins and saving a fourth. A 1970s CWS All-Decade selection, McQueen tossed a no-hitter vs. Cal to mark the opening of Dedeaux Field on 3/30/74. Russ was drafted by the California Angels in June 1974 and pitched three years in the club's minor league system.]
As I recently read some of Rich's articles, I was taken back to the Lakewood High baseball field one dreary, overcast, fall Saturday morning.
Seated in the third base dugout, I tried to stay as close to manager, scout and former Dodger pitcher Ed Roebuck as possible, to catch whatever he might say to help me comprehend the game of baseball. He might even ask me to get loose and pitch an inning or two; that is, if he ran out of pitchers or happened to remember I had thrown batting practice the last several Saturdays.
There was nothing unusual about seeing new faces, arms and bats at "The Lake" on a Saturday morning. After all, it was a scout league where minor leaguers and some college guys would show up for some work. A few of us high school guys came out in case... well, just in case.
A new fellow came by that morning with a big equipment bag and exchanged quick hellos and howaryas up and down the line. He meant nothing to me, and I figured him for another lower minor leaguer looking for some work. Mr. Roebuck caught his eye and offered, "Get loose and work a couple innings if you want to."
"If you want to?"
I thought no more about it, other than to spend an inning or so quietly lamenting the fact that I'd now have to wait at least two more innings to have any hope of hearing those words myself.
Then something happened.
The new guy took the mound and things changed. An air of expectancy took hold, and the place got quiet. Sounds were reduced only to those necessary. It felt like a premonition of something terrible, or terribly great, like right before a big fish takes your lure and you know in your gut he's about to hit.
The first batter took his stance. Fast ball, strike one called. Not bad, right down at the knees and on the inside corner. With considerable zip. Not the one he wanted to hit, I thought. But then the new guy threw something I had never seen before. It was gorgeous, and it was terrible, and I wasn't sure I had seen it correctly. Fast like a heater, but in front of the plate it made a wicked dive, down and a little bit away from the batter, who buckled at the knees. Strike two called. Hearts beat faster – I know mine did.
"Throw it again," I prayed.
He did, only this time the batter mustered up a feeble excuse for a swing and made his retreat back to the bench, where he joined other mortals to watch the continuing carnage.
Five more up, five more down. One guy grounded out, but everyone else fell to that monstrous, terrifying curve ball.
I've seen the Grand Canyon and the Grand Tetons. I've walked into Yankee Stadium and Fenway Park and Wrigley Field on a Sunday afternoon. I've been to dozens of countries all over the world and seen it all. But I have never seen anything more riveting than that curve ball on that one cool, gray Saturday morning.
I have always remembered that awesome pitch as a big hammer the new guy swung and pounded batters with. It certainly went way beyond any fair deal I ever witnessed. To say "he threw a curve" was to understate the terror of the act. However ordinary the new guy looked to begin with, to me he had become substantially taller, heavier, and more dangerous.
For a moment there was no one sitting between me and Mr. Roebuck. "That's some kind of a curve ball," I managed, trying to make it sound as casual as I could so Mr. Roebuck wouldn't think I was overly impressed.
"Son, that's a pure yellow hammer," replied Roebuck. "And that is Bert Blyleven."
Russ McQueen, a CPA with PricewaterhouseCoopers LLP, is married to his wife Betty (thirty-two years) and has three sons, including Matt, first baseman for the Biola University Eagles.
| Change-Up | January 30, 2008 |
"Out" With The Old: A Better Way to Look at OBP
During their recent back-and-forth, in one of Buster Olney's responses to Rich Lederer, he boiled their differences on Jim Rice down thusly:
Many analysts don't think Rice walked enough and believe RBI is a junk stat and that Rice had no other skills other than amassing hits. Rice supporters like myself place a higher value in hits and RBI, especially given the context of the time. So be it.
Leave aside the tone of the statement, and even leave aside the oversimplification. Olney's willingness simply to count up hits and RBI with an apparent disregard for defense, baserunning or most importantly, out-making is what stands out. It's this final item, out-making, that this piece will endeavor to bring into more clarity.
Articulating the value of an out would be redundant. It's been written or said artfully already by many in and around baseball. Below are some excerpts that help lay it out as plain as day.
The currency of baseball is the out. There are a finite number of outs that a team can make in one game, and it is almost always 27 (or 3 outs/inning * 9 innings/game). A player consumes these outs to create runs, and at the simplest level, runs and outs are the only truly meaningful stats in baseball.
He always said, ‘you only get 27 outs in a game, so don't waste them...'
The higher a player’s OBP, the less often he’s costing his team an out at the plate. Viewed another way, 1-OBP = out %. In other words, OBP subtracted from the number 1 will yield the percentage of how often a hitter comes up to bat and uses up one of his team’s 27 outs for that game. A player can play all season, rack up impressive counting stats and still be using up far too many outs.
Maybe a tweak to how we think about outs and on-base percentage is in order. Dayn may be onto something here with this 1-OBP. I am going to take it a step further here and make it Outs/PA with "outs" defined as AB-H+CS+GDP. Baseball fans understand that outs are the only scarce resource in baseball. They understand that you only get 27 of them, and that each one you use puts you that much closer to running out of chances to score. So instead of tallying on-base percentage, which really only seems to resonate with folks who already buy in to advanced performance metrics, how about focusing on outs?
Discrediting Jimmy Rollins's 2007 MVP case by clamoring "but his on-base was only .344!!!" is obviously not sufficient. How about "did you know that Jimmy Rollins led all of Major League Baseball in outs in 2007?" Now that might help clarify things. To be sure, outs, on-base, outs per PA, etc. ignores what Bill James would call "advancement percentage" (which is really just slugging). It also fails to fully account for baserunning and clutch hitting. Still, tallying up outs per plate appearance is an instructive way to take a look at a major component of one's offensive makeup.
Here's a look at the top 10 and bottom 10 players in 2007 (minimum of 502 plate appearances) in Out %.
Bottom 10
                Outs    PA      Out %
Rodriguez, I.   379     515     .736
Feliz           433     590     .734
Lopez, Jos      411     561     .733
Pena, T.        392     536     .731
Pierzynski      370     509     .727
Durham          383     528     .725
Uribe           408     563     .725
Molina          373     517     .721
Johjima         370     513     .721
Punto           386     536     .720
Top 10
                Outs    PA      Out %
Ortiz, D.       384     667     .576
Helton          395     682     .579
Pena, C.        359     612     .587
Ordonez, M.     400     678     .590
Utley           362     613     .591
Rodriguez, A.   419     708     .592
Cust            302     507     .596
Posada          353     589     .599
Wright          427     711     .601
Jones, C.       362     600     .603
So let's break this down to one game to shed some meaning here. Dividing 27 by Out % tells us how many hypothetical plate appearances, or incremental run-scoring opportunities, a team full of one player would amass.
          Out%       27/Out%
Ortiz     .576        46.9
Pudge     .736        36.7
To put these numbers into further perspective, let's look at some more 2007 figures. Here are the top-3 and bottom-3 scoring teams in the American League.
          PA       R       R/PA
NYY      6,527    968      .148
DET      6,363    887      .139
BOS      6,426    867      .135
          PA       R       R/PA
CHW      6,101    693      .114
KCR      6,139    706      .115
MIN      6,161    718      .117
Taking an average of these six R/PA figures, we get a figure of .128. Let's use this figure and once again compare Ortiz and Pudge. And remember, this is assuming that all else is equal between the two players (slugging, baserunning, etc).
          Out%    27/Out%    R/G
Ortiz     .576     46.9      6.0
Pudge     .736     36.7      4.7
Perhaps if the performance analysts focused their efforts on outs as both a counting and rate stat instead of tallying on-base, inroads could be made a bit more easily with mainstream figures. You and I know what a .400 on-base percentage means, but maybe that figure does not mean much to many others. On the other hand, if you know that a season full of plate appearances consists of 650-750 times at bat, and you know that David Ortiz only made an out just 384 times, that might start to mean something.
Likewise, by knowing that Rollins led the league in outs or that Pudge makes an out nearly three-quarters of the time he steps in the box, this too may help many fans start to evaluate offensive performance more appropriately.
Kicking and screaming about how too many do not understand what it takes to score runs does very little good. Rich's exchange with Buster Olney has led me to believe that trying to narrow the gap between the performance analysts and the mainstream is time better spent. Hopefully thinking about outs in this way furthers this cause.
| Baseball Beat | January 29, 2008 |
2007 Payroll Efficiency
On the heels of the commissioner's office disclosing the final 2007 payrolls for the 30 major league clubs, I thought it might be instructive to analyze payroll efficiency by comparing team salaries to wins.
The payrolls shown below are for 40-man rosters and include salaries and prorated shares of signing bonuses, earned incentive bonuses, non-cash compensation, buyouts of unexercised options and cash transactions. In some cases, parts of salaries that are deferred are discounted to reflect present-day values.
The following table, ranked by club payroll (in millions of dollars), also includes team wins.
Team	Wins	$ Pay
NYY	 94	218.3
BOS	 96	155.4
LAD	 82	125.6
NYM	 88	120.9
CHC	 85	115.9
SEA	 88	114.4
LAA	 94	111.0
PHI	 89	101.8
SF	 71	101.5
CWS	 72	100.2
STL	 78	 99.3
DET	 88	 98.5
HOU	 73	 97.2
BAL	 69	 95.3
TOR	 83	 95.1
ATL	 84	 92.6
TEX	 75	 78.9
OAK	 76	 78.5
CIN	 72	 73.1
MIL	 83	 72.8
MIN	 79	 71.9
CLE	 96	 71.9
ARI	 90	 70.4
SD	 89	 67.5
KC	 69	 62.3
COL	 90	 61.3
PIT	 68	 51.4
WAS	 73	 43.4
FLA	 71	 33.1
TB	 66	 31.8
The 2007 total payroll was $2,711,274,581 or approximately $90.4 million per team. The median was slightly higher than the mean. While the New York Yankees' record payroll of $218.3M added about $4.5M to the average, the teams below the median exerted an even greater impact on the mean than those above the mid-point. To put the payroll dollars in perspective, please note that MLB reported $6.075 billion in total revenues last season, or just north of $200M per team.
The information presented in the above table can be displayed in a graphic format, as shown below.
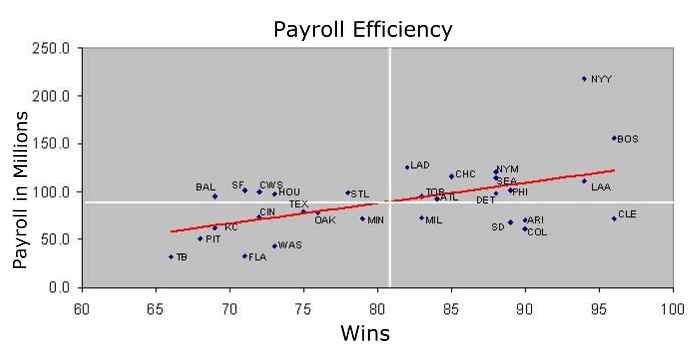
Based on this graph, we can categorize teams by the four quadrants as well as by the trendline. Starting in the upper-right end of the graph and moving clockwise, the northeast quadrant includes teams that won more games than average with a higher-than-average payroll. The southeast quadrant depicts clubs that won more games than average with a lower-than-average payroll. The southwest quadrant includes teams that won fewer games than average with a below-average payroll. The northwest quadrant lists teams that won fewer games than average with a higher-than-average payroll.
The red trendline indicates the positive correlation of team payroll and wins. The correlation coefficient works out to 0.5328. Teams above the line were less efficient and teams below the line were more efficient in terms of getting the most bang for their buck (as measured by payroll and wins).
Due to the fact that it's the goal of all teams to win the World Series, I'm going to excuse Boston from any list of inefficient clubs. Yes, the Red Sox paid up for their success, but it's hard to argue with the fact that they won it all. While Boston may not have been the most efficient in terms of regular-season wins vs. payroll, John Henry, Theo Epstein & Co. were clearly the most efficient in terms of winning World Championships – especially in view of the competition within the division.
Aside from the Red Sox, which teams were the most and least efficient last year?
There were five clubs that won more than 81 games with payrolls under the average of $90.4M. The best of the best was Cleveland, followed by Colorado, Arizona, San Diego, and Milwaukee. To their credit, the Indians, Rockies, and Diamondbacks all made the playoffs with COL advancing to the World Series. Congratulations to Mark Shapiro, Dan O'Dowd, and Josh Byrnes for doing the most with the least. Honorable mention goes to Kevin Towers and Doug Melvin.
The Los Angeles Angels, Philadelphia Phillies, Detroit Tigers, and Atlanta Braves also deserve praise for their payroll efficiency. The Angels and Phillies won division titles before falling in the first round of the playoffs. In the meantime, the Minnesota Twins, Washington Nationals, Florida Marlins, Pittsburgh Pirates, and Tampa Bay Rays should share the award for "doing the best while pinching pennies."
The clubs in the northeast quadrant and above the trendline had mixed results. All of these teams won more than their share of games, but they did so at a cost. In the case of the Yankees, George Steinbrenner, Brian Cashman & Co. did it at a huge cost. Two-hundred-and-eighteen-million dollars huge. New York's payroll was roughly $63 million higher than the No. 2 team (Boston), $128 million above the mean, and more than $186 million or nearly seven times above the lowest payroll (Tampa Bay). The Yankees made the playoffs so it wasn't a total loss. The Chicago Cubs won the NL Central and were the only other team in this group that at least got something in return for their large commitment to player payroll.
Moving to the least efficient teams, Baltimore, San Francisco, Chicago White Sox, and Houston failed miserably in their quest to buy a division title, much less a league or world championship. Mike Flanagan and Jim Duquette (Orioles), Brian Sabean (Giants), Kenny Williams (White Sox), and Tim Purpura (Astros) get the booby-prize award for (mis)managing payroll efficiency. Purpura was fired after the season and was replaced by current GM Ed Wade.
For more information on this subject, be sure to visit the Business of Baseball to check out Maury Brown's article By the Numbers: 2007 Player Payroll for the 30 MLB Clubs. Brown breaks down the data in even more detail, listing teams with the largest increases and decreases in player payroll from Opening Day while ranking playoff teams by cost per marginal win, a concept developed by the late Doug Pappas. In addition, Brown has recently published Unusual MLB Contract Clauses and Salary Arbitration.
| Baseball Beat | January 28, 2008 |
A Public Letter to Buster Olney
Dear Buster,
Thank you for taking the time to engage me in a lively debate about Jim Rice and his Hall of Fame qualifications. I don't know about you, but I believe this discussion is actually about much more than whether Rice should or shouldn't be elected to Cooperstown. I maintain that what we are really at odds over isn't Rice as much as the way we go about evaluating players when it comes time to vote for MVPs, Cy Young Awards, and the Hall of Fame. Rice just happens to serve as an excellent example of the differences in the thought processes that go (or should go) into these decisions.
I would be remiss if I didn't point out that you mischaracterized my comments on Rice and Bert Blyleven in the opening paragraph of your latest response. Rather than incorrectly interpreting what I wrote, perhaps you should have quoted me or linked to my articles so your readers could see for themselves what it is I said or didn't say.
In any event, in the spirit of Bob Rittner's guest column last week, I want to acknowledge our common ground as it relates to Rice. There is no question that Jim was a very good hitter for the vast majority of his career with the Boston Red Sox in the 1970s and 1980s. I would even go so far as to say that he was an outstanding hitter from 1977-1979 and in 1983 as well. Rice led the American League in total bases in all four of those seasons. That is a terrific accomplishment.
As you have pointed out on at least one occasion, Rice also topped the majors in RBI and hits from 1975-1986 and placed third in HR and fourth in OPS during that 12-year period. All of these rankings speak well of Rice's hitting prowess.
However, in order to fully understand and appreciate Rice's value and place in baseball history, I believe it is important to put his stats into their proper perspective. I would like to do that by focusing on context, consistency (in the application of the stats), and comparability (to other players). Allow me to refer to them as the three Cs.
Context
All players need to be viewed within the context of their era, league, team, place in the lineup, ballpark, and position. In the case of Rice, he played during a period that neither favored pitchers nor hitters. The second half of the 1970s and the decade of the 1980s were a fairly neutral time with respect to scoring runs. However, Rice benfited to a significant degree by playing his entire career in Boston. The team's home games were played at Fenway Park, which ranked as the AL's #1 or #2 most friendly ballpark to hitters in 13 of Rice's 14 full seasons (including nine years in which it was #1). As such, it follows that Rice's raw stats need to be adjusted.
Based on your skepticism of Adjusted OPS (or OPS+) as a measurement tool, I believe it is instructive to look at Rice's home (.320/.374/.546) and road (.277/.330/.459) splits to see how he performed in a more neutral environment. To the extent that Rice tailored his swing or game for Fenway Park, he should definitely get credit for his home performance above and beyond the park factor. This nuance is actually accounted for in Rice's career OPS+ mark because it only dings him about 3.5% or one-half of the average park factor of 107 and not for his total outperformance at home.
Sure, Carl Yastrzemski and Wade Boggs took advantage of Fenway, too. But Yaz and Boggs both had higher peaks and better career totals than Rice. Yastrzemski was a better left fielder and Boggs played a more vital defensive position to boot.
Context is also an important consideration with respect to counting stats such as runs batted in and hits. Opportunities play a big role in both. I covered these matters in detail two weeks ago and believe many of Rice's counting stats were largely a function of his opportunities. His career totals were definitely solid but not overly special. Combining counting stats with rate stats allows us to judge quantity and quality. A player's longevity, efficiency, and peak value are all part of the puzzle.
A player's position is another contextual item. The fact that Rice played LF for about 75% of his career and DH for the other 25% – and was generally viewed as a slightly below-average fielder – means he was basically a hitter and little else. I'm not arguing that he didn't hit; instead, I'm just trying to put his offensive contributions in their proper light. All else being equal, players on the left side of the Defensive Spectrum (DH | 1B | LF | RF | 3B | CF | 2B | SS) are less valuable than those on the right side.
Consistency
In order to have meaning, statistics and statistical profiles need to be applied consistently from one player to the next. If using a 12-year period to measure Rice's worth is fair as you suggest, should we not apply this same window to all time frames and players?
Joe Carter, for example, led the majors in RBI for four consecutive 12-year periods (1984-1995, 1985-1996, 1986-1997, and 1987-1998). He also led the majors in HR for those first two 12-year periods. Carter was a better baserunner than Rice, played on two World Series championship teams, and slugged one of the most famous home runs in the history of the game. The point of this exercise isn't to suggest that Carter is a HOFer; rather, it is to downplay the significance of Rice's rankings during his best dozen years.
You have also made a big deal out of Rice's standing in so-called MVP Shares. Along the lines of your disdain for OPS+, "if this [is] your be-all, end-all statistic, keep in mind that" . . . Dave Parker had more MVP Shares than Jim Rice, Juan Gonzalez had more MVP Shares than Rickey Henderson, and George Bell had more MVP Shares than Robin Yount even though the latter won two MVPs and was a first-ballot HOF selection.
Comparability
Is Rice the best player not in the Hall of Fame? Is he even the best outfielder not in the Hall of Fame? Seriously, is Rice really better than Andre Dawson, Dwight Evans, Dale Murphy, and Dave Parker? I don't see it myself. I will concede that a proponent of Rice could make a case that he is as good as these four outfielders (none of whom are in the HOF), but I can't for the life of me understand how somebody could claim that he was sufficiently better and deserved enshrinement over the others. By my way of thinking, if Rice is a Hall of Famer, then so are Dawson, Evans, Murphy, and Parker.
          POS      PA     TOB     TB     AVG   OBP   SLG   OPS+  WS   WARP3
Dawson   CF-RF   10769   3474    4787   .279  .323  .482   119   340   105
Evans      RF    10569   3890    4230   .272  .370  .470   127   347   120
Murphy   CF-RF    9040   3125    3733   .265  .346  .469   121   294    86
Parker   RF-DH   10184   3451    4405   .290  .339  .471   121   327    85
Rice     LF-DH    9058   3186    4129   .298  .352  .502   128   282    83
If Win Shares (WS) and Wins Above Replacement Player (WARP3) are too esoteric, that's fine. But please note that both measures account for defense as well. Three Win Shares equal one win. As such, both Win Shares and WARP paint a similar picture. Notably, scores of 300 WS and 100 WARP generally equate to Hall of Fame-caliber careers. There are exceptions on both sides of these magic numbers, particularly in the case of players that had short careers but extraordinary peaks (like Sandy Koufax).
I will grant that Rice may have been the best hitter of the fivesome (by the narrowest of margins), but he played the least important position and was the least competent defensively. Dawson, Murphy, and Parker were certainly better baserunners at their peaks, giving each of them a modest plus in this department as well.
Mix in the MVPs and Gold Gloves if you will, shake it all up, and how can one justify Rice's Hall of Fame worthiness over his fellow outfielders? A rational analysis would suggest it is virtually impossible. If you're a big Hall guy, then go ahead and continue to vote for Rice. But you should be voting and pushing for Dawson, Evans, Murphy, and Parker, too.
Although I don't expect to sway your vote as it relates to Rice, I'm hopeful that our debate will give you (and others) pause when filling out your ballot in the future. All of us love stats in one form or fashion, but they are most relevant when viewed in their proper context and applied consistently so that player comparability can be truly evaluated.
Respectfully submitted,
Rich Lederer
| Command Post | January 25, 2008 |
First Things First
The first pitch is thought to be very important in an at-bat. Young pitchers are taught to get ahead in the count and that the balance of an at-bat hinges on whether this pitch is a strike or ball. Throwing first pitch strikes is a mark of a good pitcher, and one of the most infuriating things to watch is a pitcher who can't throw first pitch strikes. Today I want to look at the value of the first pitch and what happens to those pitches after they leave the pitcher's hand.
Of the twelve counts, there are six (anything without three balls or two strikes) where the at-bat is guaranteed to continue if the batter does not swing at the pitch. Assuming no swing, here are the chances of seeing a fastball in a subsequent count, based on whether the pitch is a ball or a strike. The chart is based on what will happen in the future based on what happens in the current count. So starting in an 0&0 count, if pitch is a ball, there is a 59% chance the next pitch (in the 1&0 count) will be a fastball, but if the first pitch is a strike, there is a 48% chance of a fastball being thrown in an 0&1 count. The swing of 11% measures how valuable a strike is in each count, in terms of potentially seeing fastballs.
Count   FB%     If Ball   If Strike    Difference
0&0     0.59    0.59      0.48         0.11
0&1     0.48    0.49      0.47         0.02
1&0     0.59    0.70      0.49         0.21
1&1     0.49    0.59      0.44         0.15
2&0     0.70    0.78      0.59         0.19
2&1     0.59    0.76      0.47         0.29
The first pitch of an at-bat sets the tone of the at-bat due to the conditions it creates for ensuing pitches. In terms of seeing a fastball, there is relatively little difference between an 0&1 count and a 1&0 count, but if the first pitch is a strike the pitcher has put himself in a good position as the count progresses. An 0&1 count is a clear pitcher's count and even if he throws a ball in that count, a 1&1 count is still a pitcher's count and the pitcher arrived there through pitcher's counts. However, if the first pitch is a ball, the pitcher is now at a slight disadvantage because while 1&0 is a neutral count, it has the potential to turn into an extreme hitter's count. If the pitcher does throw a strike and evens the count at 1&1, he would have presumably been under more pressure to throw a strike after the first pitch. Sal Baxamusa explores this type of pitch sequencing in more detail here and actually finds that when batters put a 1&1 pitch into play, they do better when the order was strike-ball, despite apparently having an advantage in the other sequence.
Anyway, that tangent was just to establish the importance of the first pitch of an at-bat. Now that we have a rough idea of its importance, lets look at what actually happens on the first pitch. The table below shows all first pitches, broken up by pitch type, along with certain measurements about each pitch type. Freq. is how often the pitch was thrown, S% is strike frequency, or strikes balls in play/all pitches, Called% is called strikes/total pitches, Swing% is how often the batter swung at a pitch, Sw% is how often batters swung and missed when they swung, Fo% is how often batters fouled balls off when they swung, and SLGBIP is slugging percentage on balls in ball, including home runs.
Pitch   NP      Freq.    S%     Called%  Swing%  Sw/Swing  Fo/Swings   SLGBIP
CH      6271    0.11     0.55   0.23     0.33    0.33      0.28        0.557
CB      6437    0.11     0.55   0.37     0.18    0.29      0.31        0.552
FB      35131   0.60     0.60   0.32     0.29    0.13      0.44        0.551
SL      10728   0.18     0.60   0.30     0.31    0.26      0.35        0.506
============================================================================
Tot     58567   1.00     0.59   0.31     0.28    0.19      0.40        0.543
Fastballs are thrown slightly more often as first pitches than overall (60% on first pitches vs. 56% overall) which makes sense with pitchers trying to throw a strike and get ahead in the count, but generally, the rates are pretty similar for how often each pitch is thrown as a first pitch and overall. The most interesting thing to me on this chart is how often batters swing at a first pitch curveball. As a batter, a curveball isn't necessarily a pitch you would expect to see at the start of an at-bat, which probably explains the low number of swings because batters would only swing if it were a very hittable curve. This seems like a great example of how not being predictable helps a pitcher tremendously though. By occasionally throwing a curve as the first pitch, the pitcher is sometimes able to get a free strike because the batter swings so rarely.
A first pitch slider would also come as somewhat of a surprise from most pitchers, yet batters swing at that pitch relatively frequently. A slider looks more like a fastball immediately out of a pitcher's hand, so perhaps batters are fooled into swinging because of this. This would explain the low SLGBIP, because unlike curveballs where a batter is swinging preferentially at pitches he likes, with sliders, batters are swinging at a pitch they think is a fastball, but are forced to adjust their swing once the slider breaks. Overall, curveballs that are put in play lead to a SLGBIP of .484, but on the first pitch their SLGBIP jumps to .552, similar to SLGBIP for fastballs on first pitches, which supports the idea that batters are good at selecting which curves to swing at on the first pitch. One other interesting thing in the table is what happens when batters swing at certain pitches. Batters rarely swing and miss at first pitch fastballs, but they foul off those pitches so frequently that fastballs are only slightly less likely to be put in play than the other three pitch types. I'm unsure why batters foul off so many fastballs, but it might be because batters are be willing to swing at a wider range of locations and speeds if they recognize the pitch as a fastball.
In the past, I've looked at how batters of different quality are approached by pitchers. Using that method again, I wanted to see if there are differences in how these batters were pitched to on the first pitch as well. In the table below, columns labeled with -1 are the frequencies for first pitches while the columns labeled with -R are the frequencies for all other pitches.
SLG        FB-1   FB-R   SL-1   SL-R    CB-1    CB-R    CH-1    CH-R
>=.500     0.58   0.52   0.20   0.21    0.12    0.11    0.11    0.15
.499-.400  0.58   0.54   0.19   0.20    0.12    0.11    0.11    0.15
<=.399     0.68   0.58   0.16   0.19    0.08    0.10    0.08    0.13
I grouped hitters based on their Marcel projected SLG for the 2007 season and while the windows I used to group hitters are wider than in my previous examination, the overall idea is almost identical. Narrower windows would just show a more gradual increase in off-speed pitches as batters improved, but one other thing thats interesting is that it almost is as if there is a plateau for batters with a .400 SLG. A .400 SLG seems to be the level of hitter that prompts a pitcher to alter his first pitch repertoire.
Recently, I've been looking at different groups of pitchers and seeing if there are differences in the way they pitch based on their age and the quality of their fastball. I created two group, those pitchers 34 and older and those 24 and younger, and then split those two groups into pitchers with an average fastball speed of more than 91 MPH and an average speed less than 91 MPH. The table below shows just the first pitch fastball frequency for each type of pitcher throwing to each type of hitter, along with the average of all first pitches for each pitcher type.
SLG         Young/Slow  Old/Slow  Young/Fast  Old/Fast
>=.500      0.54        0.59      0.61        0.48
.499-.400   0.54        0.56      0.63        0.49
<=.399      0.66        0.62      0.69        0.63
==================================================
Avg.        0.56        0.57      0.63        0.51
The same pattern is evident here as well, with the bad hitters seeing a lot more fastballs than the other two groups of hitters. This trend holds regardless of the age of a pitcher or the quality of his fastball and the big difference between groups of pitchers is how many extra fastballs they throw to bad hitters. Even though there isn't a tremendous amount of difference between a 1&0 count and an 0&1 count, the first pitch is a crucial pitch in setting the tone of an at-bat and the importance placed on it is probably justified because of this.
| Designated Hitter | January 24, 2008 |
I'm OK, You're OK
I think the most productive discussion is the one where, after spirited debate, each person argues in favor of his opponent's case. And the least productive is when each person comes away convinced he is right and has demolished his opponent's arguments.
I would like to spin off from the Mark Armour In Defense of the Hall of Fame thread to consider the differences between traditional baseball writers and the contemporary analytical community. The distinction is not always stark; I always considered Leonard Koppett an analyst, and I enjoyed reading Arthur Daley, Roger Angell and others who brought the game to life for me and often provided a sense of intimacy with the players. Often, they brought to the issues facing the game an intellectual perspective that stimulated thinking on subjects like expansion or the DH rule or the Curt Flood case.
And often they were fine writers whose humor and ability to delineate the character of particular people expressed the mood of the game and enhanced the joy of watching and thinking about it. I still alternately laugh and tear up reading Larry Ritter's "The Glory of Their Times" even while cringing at some of the cliches from Lefty O'Doul and others. Periodically I listen to excerpts on tape from some of Ritter's interviews, and hearing Sam Crawford describe Rube Waddell or barnstorming in the mid-west, or Hans Lobert discussing Honus Wagner's kindness to the rookie or Fred Snodgrass defending himself and Fred Merkle from the criticism both have endured makes the game real and vibrant. I really think it is required reading (or listening) for any baseball fan.
But in my mind, with rare exceptions, these were not really analysts. They were writing about the game as literary figures, creating plots and climaxes and denouements and using all the approved techniques of novelists. What mattered was the story. Baseball was the arena in which to exhibit character and moral principles. And stories were built around those issues. Players rose to the occasion or choked, were heroes or goats, overcame all sorts of obstacles and odds or failed to deliver for their teammates and fans.
The stories were exciting and sometimes even had whispers of truth in them, but they had nothing to do with what was really happening because most of what really happens is mundane and not terribly exciting. The job of these writers was to extract the drama from the details and to make the story as interesting as possible.
After a time, certain themes (often reflecting virtues like sacrificing for the team or out-thinking the opposition) became fixed orthodoxy, elevating strategies like sacrifice bunts and moving runners over and the psychology of winning to the status of gospel or leitmotifs in most story lines. I have sometimes speculated that in the first decades of the 20th century when the sport was considered disreputable by many and the province of hooligans, in an effort to make baseball more respectable, books and articles by Christy Mathewson (or his ghostwriter) and others focused on the "inside game," the intellectual components of baseball, and praised the cleverness and psychological maneuverings of manager John McGraw. The effect was not simply to make baseball a more intellectually and morally respectable game, but it simultaneously established the basic principles that hardened into "the Book."
I was satisfied with this sort of baseball writing and raised my son with my recollections of baseball in the 1950s and discussions of columns in the mainstream newspapers and books of the 1970s. When he was a teenager, he returned the favor by introducing me to Bill James. And in my mid-40s, I became dissatisfied. Of course, James was interested in the stories and anecdotes. (In fact, I was sometimes irritated when I expected a hard analysis of some player's ranking in his Abstract only to be treated instead to some tangent about Dick Williams socializing with Sal Bando.) But alongside were questions and a serious attempt to find some way to answer them. I did not always follow the math, but I did understand the logic, and it was exciting. I still read the columns but they were not enough. The columns were about human interest and could have been on any subject. James and company were about baseball specifically.
In a way, the sabermetricians have created a problem for the traditional columnists. The early journalists always used stats, but they were rarely the key to any argument, and they generally were rather simple and commonly understood. They were the details that lent depth to a story, like descriptions of scenery and characters' physical traits in a novel. The journalists' audience, training and medium are not conducive to detailed statistical analysis. When Murray Chass mocks VORP and the like, I think he is actually making a valid point (I am really biting my tongue now) in the context of what would be acceptable in a mass circulation newspaper.
Of course elements of sabermetrics can and should be incorporated into the columns, and the movement has earned the right to be respected by columnists. Some have and do, and even those who ignore or resist progressive statistical analysis are clearly influenced by it, at least on the margins. OBP has almost gained the status of BA, albeit not quite, even among traditionalists. But to ask them to accept its approach as authoritative or to defer to its judgments is futile. They can include OBP, even ERA+ or OPS+ in their assessments, but their style precludes the charts and graphs and more detailed statistics. You don't ask Tolstoy to include a chart of the nationalities of prisoners in "War and Peace."
And the reason is not that they are wrong. It is that the two groups are engaged in different purposes. And while it is easy for sabermetricians to apply the approach of traditionalists to liven up their writings, it is not so easy for traditionalists to incorporate statistical models and arguments in theirs. So there is frustration on both sides.
When a traditional columnist writes an article defending a position, sabermetricians attack using all the tools at their disposal, and sometimes with sarcasm and nastiness. If the columnist dismisses their arguments, they pile on. But it is even worse if he tries to meet them on their own grounds. Without the expertise, his statistical arguments appear juvenile and then the attacks often turn vicious and personal. A successful career journalist, out of his depth in this kind of debate, finds himself the object of mockery, and with the internet, there is now a public forum for the ridicule. The problem is there is no common ground. The traditional journalist is not wrong; he simply has a different purpose, and to critique him is like arguing with Shakespeare that Hamlet should have compromised with Claudius or brought him before a board of inquiry.
When an issue like the Hall of Fame elections arises, the problem is magnified because for statistically minded analysts there are objective criteria from which to begin the discussion. But to many traditionalists, the key word in the discussion is "Fame" as in who do people know, who had an impact on the story.
Jack Morris exemplified qualities that suggest he is a Hall of Fame character; Bert Blyleven did not. Jim Rice dominated because that is the story line, and for anyone who lived in his era, it makes perfect sense. It does not matter to those who are now voting if the statistics belie the claim.* When I watched a Yankee game and Rice came to the plate, I was scared. I was not as worried when Dwight Evans was at bat. I may have been wrong, but Rice felt like a star and Evans a supporting player. To say the journalists are wrong does nothing to advance the discussion because these players are first and foremost literary figures to them. You and I may know that Watson and Crick were far greater men than Alexander the Great and Napoleon, but in the pantheon of human heroes, you can bet Alexander will get in first, and nobody is going to identify Crick as Crick the Great.
I do think there can and ought to be dialogue between the "schools of thought," but I think it requires mutual respect for and recognition of the divergent approaches. The dichotomy is probably not as dramatic as I have suggested, but I do think it would help if in debating points each side tries first to ascertain where there is common ground so they can talk to each other rather than at each other.
*I am reminded of reading that the Medieval books about the Lives of the Saints were almost entirely fictitious as narratives of events. Their truth was in the morals of the stories, the standards of behavior and faith the saints represented. So a particular saint may not even have existed, but the virtue of courage or charity he exemplified did exist and was true.
Robert Rittner is a retired high school history teacher from Westchester county, NY, now living in Clearwater, Florida. He has been a baseball fan since 1951, moving to Florida in part because of the opportunity to watch baseball regularly. He is also starting to hit a little better in his softball league.
[Additional reader comments and retorts at Baseball Primer Newsblog.]
| Baseball Beat | January 23, 2008 |
The Search for the Truth Continues
Rob Neyer's wish ("here's hoping it lasts the rest of the winter") is coming true. Buster Olney responded to my article yesterday.
Rich Lederer has another post in our ongoing Jim Rice debate. Rich writes, "Despite protestations to the contrary, those of us who oppose Rice's candidacy are not viewing him through a "time-machine prism" or "offensive formulas tailored for the way the game was played in the '90s."The quoted words are mine. Rich goes on to cite an example of skeptical words written about Rice in 1985: "Virtually all sportswriters, I suppose, believe that Rice is an outstanding player. ... If someone can actually demonstrate that Jim Rice is a great ballplayer, I'd be most interested to see the evidence."
Those words belonged to Bill James, whom Rich and I both view (I assume) as an extraordinary visionary.
With this, Rich absolutely demonstrates one of my primary points about Rice. Bill James was someone who was years (decades?) ahead of his time in evaluating the value of walks and on-base percentage. But he wasn't only ahead of sportswriters, but ahead of managers, coaches, general managers and scouts, who placed value judgments on what they viewed as the proper approach to the game. Jim Rice, as a middle-of-the-order slugger, was expected to drive in runs. That's how he was evaluated, that's what he was expected to do, that's what he did well, that's why he was among the game's highest-paid players.
Guys who hit in the middle of the lineup and drew a lot of walks were viewed by the old guard, in some respects, as selfish players who refused to put their batting average at risk for the betterment of the team. I spoke about this last week with Jayson Stark, in regards to Mike Schmidt, a slugger who drew a lot of walks, and Stark specifically remembered Schmidt -- a '70s star who really played a 21st style of baseball, with lots of home runs, walks and strikeouts -- drawing criticism from peers for his approach. Sure, a Schmidt or Rice base on balls leading off an inning was a good thing, but if there were runners on base, the feeling was that they needed to swing the bat; they needed to drive in runs. Ted Williams, another slugger who drew a lot of walks, was subject to the same sort of scrutiny, as Peter Gammons recalled in a phone conversation the other day. Rice, on the other hand, knew he was expected to drive in runs, as Peter recalled.
Just two players drove in 85 or more runs in 11 seasons in the 12-year period of 1975-1986, and Rice almost certainly would've been 12-for-12 if not for the 1981 strike. In the eyes of the people he played for, he did exactly what a middle-of-the-order hitter should do. Honing his command of the strike zone and drawing walks, alongside all of those hits he generated, was not what his employers wanted him to do.
James ran the numbers and recognized the flaws in this manner of thinking. He was ahead of his time, and now almost everybody in the game has embraced his view. The thinking of hitters and evaluators has completely shifted: A middle-of-the-order hitter who refuses to take walks and trust the hitters behind him to drive in runs is now viewed, within the game, as being selfish.
But James cannot both be a visionary and an example of evaluation at that time, as Rich has used him above. It's one or the other. By the standards of the time -- and RBI unquestionably was the primary standard for the sluggers who played and for those who managed and evaluated -- Rice was exceptional, and he honed his game to that end. He swung the damn bat. The managers he played for and against respected him for it, the executives he played for paid him handsomely for it, and given the standards of his time, the sportswriters rewarded him with a staggering portion of MVP votes. In the James quote above, he takes issue with sportswriters, but he easily could've inserted "managers" or "general managers" or "players" into that sentence.
The RBI way of thinking seems, these days, as outdated as drawing blood with leeches. But Rice did his work within those parameters, and within that context, he was among the best in the game. We cannot go back now and say, Hey, Jim, remember all those times when you swung at pitches just off the plate as you tried to put the ball in play and drive in those runners, because you thought it was your job, because Derrell Johnson and Zimmy and John McNamara and their bosses thought it was your job? Well, we're here to tell you now, in the 21st century, that was a bad idea. You should've taken the walk. So forget it, you played the game the wrong way. We know this because your Adjusted OPS+ -- a statistic no ballplayer or manager or GM ever heard of until after you retired -- is poor. Oh, sure, you drove in a lot of runs, but we're here to tell you, 20 years later, that RBI is a junk stat.
I majored in Civil War history, so please excuse this completely inappropriate analogy between war and baseball: This is like suggesting now that Ulysses.S. Grant was a lousy general because he lost staggering numbers of men attacking entrenched positions. Rather, we should attempt to view his decisions through the evolving technology and tactics of war. Through that horrible vantage point, he was necessarily a tough and brilliant general.
No one can dispute that Rice was either the best or among the best RBI men in the AL for more than a decade, and for power hitters, this was the stat that defined them. That was the accepted vantage point of the time. To retroactively dismiss RBI seems utterly insane. Nicolaus Copernicus thought the sun was the center of the universe, wrongly, but that doesn't mean he wasn't exceptional for his time.
(And in case anyone hasn't noticed, I have not used the word "fear" one time in this conversation with Rich. At least I think I haven't.)
Olney is zeroing in on RBIs (or "RBI" as my Dad taught me). Although it is far from my stat of choice, let's take a look at the American League leaders in RBI since 1950:
1950--Walt Dropo          144
      Vern Stephens       144
1951--Gus Zernial         129
1952--Al Rosen            105
1953--Al Rosen            145
1954--Larry Doby          126
1955--Ray Boone           116
      Jackie Jensen       116
1956--Mickey Mantle       130
1957--Roy Sievers         114
1958--Jackie Jensen       122
1959--Jackie Jensen       112
1960--Roger Maris         112
1961--Roger Maris         142
1962--Harmon Killebrew    126
1963--Dick Stuart         118
1964--Brooks Robinson     118
1965--Rocky Colavito      108
1966--Frank Robinson      122
1967--Carl Yastrzemski    121
1968--Ken Harrelson       109
1969--Harmon Killebrew    140
1970--Frank Howard        126
1971--Harmon Killebrew    119
1972--Dick Allen          113
1973--Reggie Jackson      117
1974--Jeff Burroughs      118
1975--George Scott        109
1976--Lee May             109
1977--Larry Hisle         119
1978--Jim Rice            139
1979--Don Baylor          139
1980--Cecil Cooper        122
1981--Eddie Murray         78
1982--Hal McRae           133
1983--Cecil Cooper        126
      Jim Rice            126
1984--Tony Armas          123
1985--Don Mattingly       145
1986--Joe Carter          121
1987--George Bell         134
1988--Jose Canseco        124
1989--Ruben Sierra        119
1990--Cecil Fielder       132
1991--Cecil Fielder       133
1992--Cecil Fielder       124
1993--Albert Belle        129
1994--Kirby Puckett       112
1995--Albert Belle        126
      Mo Vaughn           126
1996--Albert Belle        148
1997--Ken Griffey Jr.     147
1998--Juan Gonzalez       157
1999--Manny Ramirez       165
2000--Edgar Martinez      145
2001--Bret Boone          141
2002--Alex Rodriguez      142
2003--Carlos Delgado      145
2004--Miguel Tejada       150
2005--David Ortiz         148
2006--David Ortiz         137
2007--Alex Rodriguez      156
If RBI is an indicator of greatness, why is it that only nine leaders (covering 11 seasons) from 1950 to 1994 (chosen to accommodate eligible candidates) have been inducted into the Hall of Fame? Sure, Jim Rice led the AL in RBI twice. But so did Al Rosen, Jackie Jensen, Roger Maris, and Cecil Cooper (as well as Vern Stephens if we also include 1949). Moreover, Cecil Fielder and Albert Belle each led the league three times. None of these players are in the Hall of Fame. In fact, other than Maris, not a single one of these players ever received even 10% of the vote. Cooper failed to get any votes at all, while Fielder was named on just one ballot.
The most damning evidence against Rice in the case of RBI is the fact that Eddie Murray is the only player who ever led the league during Rice's 14 full seasons and was later elected to the Hall of Fame. George Scott, Lee May, Larry Hisle, Don Baylor, Hal McRae, Tony Armas, Don Mattingly, Joe Carter, George Bell, Jose Canseco, and Cooper all led the league in RBI and only Donnie Baseball ever picked up 5% or more of the vote.
As far as Olney's hypothetical comments to Rice (see the italicized statements above), nobody said or is saying that he "should've taken a walk" or that he "played the game the wrong way." We're only evaluating what it is Rice did and what it is he didn't do. That's all. Roberto Clemente, Rod Carew, George Brett (save 1985-1988), Paul Molitor, and Tony Gwynn didn't walk much either, yet I don't think you will find many people who believe these players are undeserving of the Hall of Fame.
The fact that "no ballplayer or manager or GM ever heard of" Adjusted OPS "until after (Rice) retired" suggests that he would have fared better in this stat had he only known about it. That not only seems silly to me but contrary to any and all evidence, such as the fact that Rice walked at the same rate with nobody on base and with runners in scoring position (7.0% of plate appearances in both cases) [hat tip to tangotiger]. Look, OPS+ is a measurement tool. And it's not overly complicated either. You see, when you get right down to it, the factors that go into Adjusted OPS – singles, doubles, triples, home runs, walks, hit-by-pitches, and outs – have been tracked since the turn of the previous century. OPS+ simply takes these stats and adjusts them for context (i.e., era, league, and ballpark). Is it a perfect stat? No. But it is a telling stat and one that shouldn't be dismissed, whether Rice and others knew of it or not.
| Baseball Beat | January 22, 2008 |
Search for the Truth
In Rob Neyer's Friday Filberts, he made a keen observation that perhaps has been lost in the debate over Jim Rice's Hall of Fame worthiness.
• Rich Lederer and our own Buster Olney have devoted space this week in their respective venues to an entertaining back-and-forth that's ostensibly about Jim Rice but is really about something much deeper than one man's Hall of Fame candidacy. Highly recommended for the quality of the writing alone, and here's hoping it lasts the rest of the winter.
I totally agree with Rob's take on this matter. I'm not nearly as interested in whether Rice gets elected to the HOF as I am in shaping the thought process. If Rice gets in, he gets in. I'm not going to lose any sleep over the matter. I just don't want to be standing in the way of the cattle call when Andre Dawson, Dale Murphy, Dave Parker, Dwight Evans, and even George Foster storm the front door to Cooperstown.
Although Olney and I disagree on the bottom line (i.e., Rice's inclusion or exclusion), in some ways, it's neither here nor there. What is here and there is the way we go about evaluating players. Despite protestations to the contrary, those of us who oppose Rice's candidacy are not viewing him through a "time-machine prism" or "offensive formulas tailored for the way the game was played in the '90s."
For proof on this very subject, let's take a look at what Bill James had to say about Rice in the 1985 Baseball Abstract:
Virtually all sportswriters, I suppose, believe that Jim Rice is an outstanding player. If you ask them how they know this, they'll tell you that they just know; I've seen him play. That's the difference in a nutshell between knowledge and bullshit; knowledge is something that can be objectively demonstrated to be true, and bullshit is something that you just "know." If someone can actually demonstrate that Jim Rice is a great ballplayer, I'd be most interested to see the evidence.
How great is that? I mean, Bill's not saying that now. Instead, he made that statement 23 years ago while Rice was still playing!
And, again, it's not about Rice per se. It's about the search for the truth.
James opened up our eyes – and our minds – by challenging the conventional wisdom and proving it wrong in so many cases. More than anything, he taught us to ask questions. Thanks to Bill, we have learned the importance of dealing with questions rather than answers.
With the foregoing in mind, here are eight questions for Rice's supporters and undecided voters to ponder when filling out their ballots next year:
- To what extent were Rice's career totals positively affected by playing home games his entire career at Fenway Park, known as a hitter friendly ballpark?
- If Rice gets credit for leading the majors in RBI from 1975-1986, then shouldn't he be debited for topping all players by an even wider margin in GIDP during that same period?
- Was Rice as great as his RBI totals would indicate or were they heavily influenced by the fact that he ranked in the top seven in runners on base in nine of those 12 years?
- Can we ignore that Rice produced the second-most outs during these same dozen years?
- Did Rice play a difficult defensive position?
- Was Rice a Gold Glove-caliber fielder?
- Was Rice a "plus" baserunner?
- In other words, was Rice really as good as advertised?
The greatest change since Rice's playing days hasn't been the acceptance of OBP as a noteworthy stat as it has been in recognizing that many long-held beliefs based on traditional stats are as much a function of the era, league, team, lineup, and ballpark as anything else. Stats don't tell the entire story but the *right* stats tell us most of what we need to know.
Take, for instance, Bert Blyleven and Jim Palmer. One of the knocks against Blyleven is that he wasn't one of the most dominant pitchers of his era. The conventional wisdom says that Palmer was dominant and Blyleven wasn't. To that, I say, "Really?"
Can we accept a stat that measures the number of runs that a pitcher saved versus what an average pitcher would have allowed (adjusted for park differences) as a reasonable proxy to judge effectiveness?
Well, if we can, what would you say if I told you that Blyleven led all pitchers in Runs Saved Against Average from 1973-1977? Yes, all pitchers. Not just Palmer. But Tom Seaver, Phil Niekro, Gaylord Perry, Steve Carlton, Nolan Ryan, and Don Sutton, too?
Furthermore, what would you say if I told you that Palmer won three Cy Young Awards during those five years and that Blyleven received one third-place vote during that same time? I mean, would you scratch your head and wonder if the Cy Young voting process was flawed? If nothing else, wouldn't you want to consider facts outside the simple tasks of counting CYA and All-Star games?
Moreover, what would you say if I told you that Blyleven led the majors in RSAA in not just one five-year period but in four consecutive five-year periods? Yes, it is a fact. Blyleven saved more runs than any pitcher from 1971-1975, 1972-1976, 1973-1977, and 1974-1978. It seems to me that he was probably the best pitcher during that time period, no? If Bert wasn't the greatest, he was certainly one of the most dominant, don't you think?
In the spirit of asking questions, is it possible that Palmer benefited by working his home games in a ballpark that was more friendly to pitchers than Blyleven? The answer is "yes." Palmer pitched in Memorial Stadium while Blyleven toiled in Metropolitan and Arlington Stadiums. The difference in park factors averaged a tad over 7% per year.
Is it also possible that Palmer benefited by having a superior defense playing behind him? During his Cy Young seasons, Palmer had Mark Belanger at shortstop, Bobby Grich at second base, and Paul Blair in center field. He also had Brooks Robinson at third base in two of those three years. Belanger, Grich, Blair, and Robinson are among the best defensive players at their position in the history of the game. Blyleven, on the other hand, had Danny Thompson and Rod Carew as his middle infielders.
You see, there are answers in these questions. Better yet, knowledge.
As for my *debate* with Olney, I'm proud that we behaved in a mature and civil manner while arguing the message and not the messenger. Writing opposing views in a public discourse like this is healthy and can go a long way in our search for the truth, which is what these exercises should be all about.
| Baseball Beat | January 21, 2008 |
Hot Dog Links
My pal Alex Belth wrote a terrific literary piece on Ray Negron, entitled "Inside Man: A Bronx Tale." Although he published it as a Bronx Banter exclusive, the four-part series could have easily appeared in the New York Times Magazine or the New Yorker. It is that good.
Negron has been with the Yankees off and on for more than 30 years. He started as a batboy in the early 1970s and worked his way up to special advisor to George Steinbrenner. As Belth wrote, "Negron has done everything from shine the players' shoes and collect their dirty jockstraps, to bring them food from their favorite restaurants and park their cars. He has been an agent, an actor, an advisor, and a liaison; a confidant, a sounding board and a whipping boy to some of the biggest egos in the game. He is whatever he needs to be."
Here is an excerpt from the story, which was written last summer:
Ray is philosophical about his future with the Yankees. "Let's face facts, I'm not going to be with the Yankees forever, so I'm trying to find a niche for myself. Look, the Boss has told me that as long as he's here, I'd always be a Yankee, and that's all I can go by. George is here, I'm a Yankee, and that's the bottom line. Someday, he might not be here—or I may not be here—then the new people, the new regime might say, 'Okay, that's enough, get him outta here.' And I've come to grips with that."
Due to the unedited quotes, the timely article, which comes complete with photos and illustrations, is recommended for mature audiences. Hurry over to Bronx Banter and read about Negron, Steinbrenner, Reggie Jackson (who Ray nudged out of the dugout for a curtain call after the slugger hit his third consecutive home run in the deciding game of the 1977 World Series), Dwight Gooden, Darryl Strawberry, and much more.
Tulowitzki (.291/.359/.479) slugged 24 HR while driving in 99 runs and scoring 104 times. He placed second (behind Ryan Braun) in the National League Rookie of the Year balloting and should have won a Gold Glove for his outstanding fielding. He topped all shortstops in fielding percentage (.987) and ranked first at his position in Jon Dewan's Plus/Minus fielding ratings.
My former partner Bryan Smith recently brought to my attention a scouting report I gave in a One on One: Amateur Hour conversation between us in May 2005.
Tulowitzki is the real deal. I wouldn't hesitate taking him number one in the draft. He is that good. Everybody knows the comparisons to Bobby Crosby. He's got the size, a powerful arm, a good glove, 4.2 speed, and plus power. What might not be so well known is that Troy also has the energy, enthusiasm, and leadership skills reminiscent of Miguel Tejada. This is a guy who could make it to the majors by September 2006 and has as good a shot at being named Rookie of the Year in 2007 as anybody.
Despite the protestations of mainstream writers to the contrary, they have trouble wrapping their heads around the idea that a hitter can be valuable without flashing a light-tower stroke. These scribes will whine that fans and the league have made a fetish out of the home run, but then cast more ballots for the inferior Jim Rice than they do for Raines. All too often, we’re subjected to generational spats over whether the Moneyball approach to offense (i.e., waiting for your pitch and hitting it out of the park when you see it) is better than the traditionalist’s beloved “small ball” game (bunts, hit-and-run, stealing bases, being aggressive at the plate). We know that the former leads to more runs, but it’s odd that the shrillest advocates of the latter would abandon Raines, who played the small-ball way better than almost anyone else. Somehow, though, they’ve turned their backs on him.So, apparently, power matters to the writers except when they’re grouchy over the fact that bloggers/Web-based writers/stat geeks/kids on their lawns happen to like power.
Got it? It all raises the possibility that they don’t believe their own words. The truth is that Raines is a Hall-of-Fame caliber player regardless of how you think the game should be played. That he’s been so inexcusably dismissed by the writers speaks to the flawed nature of the process. Fans, however, are free to recognize Raines as one of the greats regardless of whether or not he ever gets the Cooperstown imprimatur.
As for the writers, we’ll leave them with their rank inconsistencies and their extra-large helpings of cognitive dissonance.
Update: Jeff Albert, who was a guest columnist and contributing writer to this site in 2006 and 2007, recently was hired by the St. Louis Cardinals as the organization's batting coach at Batavia (A) of the New York-Penn League. Here is an excerpt from the "Cardinals announce Minor League field staffs" press release:
Jeff Albert has been hired as hitting coach at Batavia. Albert played collegiate baseball at the Division 3 and Division 1 levels, with a couple of stops among independent professional teams. He began working on instruction and strength and conditioning with high school, college and professional players shortly thereafter and is owner and operator of swingtraining.net, which is a site dedicated to baseball training and analysis.
Best wishes to Jeff, who is weeks away from graduating with a Master's in Exercise Science at Louisiana Tech. He will report to the team's minor league spring training facility in Jupiter, Florida on March 1. Congratulations!
Late Add: Peter Gammons, who makes "no bones about (his) strong feelings about the human element," wrote a thoughtful piece about the exploration of cyberspace as it relates to politics and sports.
Pure numbers cannot do justice to character and drive and energy. They cannot measure the impact Robin Yount had on teamates when he ran down the first-base line at the same breakneck speed (one scout had nearly 90 Yount games in a six- or seven-year period and claimed he never got Yount faster than 3.9 seconds, or slower than 4.0). Mariano Rivera, Josh Beckett and David Wright are what they are because of who they are.Stat lines cannot quantify work habits, the ability to learn, emotional stability, etc., but they are important guidelines by which to remind us that, in the end, performance counts.
Gammons identifies Jack Morris, George Brett, David Ortiz, and Derek Jeter as examples of players who "transcended the human elements that so alter the sport." He adds, "But those are parts of a greater landscape of arguments." Peter admits that "we all know more about baseball because of the proliferation of creative thought" and lists The Baseball Analysts among approximately a dozen general baseball sites he enjoys, as well as another 15 team-specific sites "club officials read."
| Baseball Beat | January 17, 2008 |
Another Helping of Rice
How do you like your Rice? I'll take mine fried, thank you. Buster Olney, on the other hand, has a completely different recipe for his Rice.
With the above in mind, Olney responded today to my two-part retort to his posts about Jim Rice's Hall of Fame worthiness last Friday and Saturday.
• Rich Lederer strongly disagrees with what was written here in the Jim Rice HOF debate last week, in a couple of pieces you can locate through this link. It's interesting that he says he played APBA and counted the "on base numbers" on the card, an acknowledgement which, as a baseball board game nerd, I fully appreciate. In playing thousands of games of Strat-O-Matic Baseball, and drafting dozens of teams, the system I have always used to evaluate players before any draft (until this moment a closely guarded secret from my Strat-O rivals) was to add up the number of points based on the possible rolls of the dice. In other words, in the '80s, if Wade Boggs had hits against right-handers in Column 1 in slots 5 through 10 (I'm sorry, but anybody who hasn't played Strat-O is going to get lost in this part of the conversation), a walk or hit in Column 2-6, and hits or walks on Column 3-5 through 3-10, he scored 59 on that side of his playing card -- six points for every roll on a No. 7, five points for any roll of Nos. 6 or 8, four points for any roll of Nos. 5 or 9, three points for any roll of Nos. 4 or 10, two points for any roll of Nos. 3 or 11, and a point for a roll of Nos. 2 or 12.I'd go through all the cards and calculate these ratings of all pitchers and hitters versus right-handers and left-handers. This, of course, was a Strat-O-Matic version of calculating on-base percentage. I loaded up on guys who scored the highest in this system, including platoon monsters like Jeff Leonard and Al Newman (who killed lefties) and Dwayne Murphy (who drew tons of walks against right-handers on his '87 card), and I'd trade to get Boggs and Tim Raines; my teams always fared very well. In the early '80s, I drafted Gene Tenace as a backup catcher to pinch hit, because he drew walks, and I would effectively pair him with Ron LeFlore, who I'd keep as a fourth outfielder and as a pinch-runner because of LeFlore's high Triple-A stolen-base percentage. In a close game in the late innings, Tenace could come off the bench to draw a walk and LeFlore would swipe second, and I'd be in business.
But regardless of how Rich or I preferred to play our board games, the reality is that in the '70s and early '80s, many of the executives who ran teams and the managers who managed and the players who played did not value walks the way walks are valued these days. This is partly a function of how the game was played -- the strike zone was larger, there were fewer pitches per plate appearance, and there was more pressure on the hitter to swing the bat. The conventional wisdom was that a middle-of-the-order hitter who took a lot of walks was actually hurting his club (especially if he was a cleanup hitter on a team in a lineup without a lot of depth). Now, was that philosophy flawed, in part? Sure. Folks in baseball should've absorbed Bill James' Baseball Abstracts from the outset (I got my first as a high school graduation present in the spring of '82). But the bottom line is this: Rice's approach to hitting was engrained in the game; guys in the middle of the lineup focused on generating RBIs.
During Eddie Murray's batting practice sessions, he would take a round in which he focused on practiced emergency swings -- awkward hacks at pitches off the plate, or pitches on which he was fooled -- in order to put the ball in play. Why? Because he considered himself an RBI guy, and if there was a runner at third, his focus was to do everything he could to drive the run in. Despite breaking into the big leagues under a progressive manager like Earl Weaver, Murray wasn't thinking about on-base percentage; he defined himself by RBIs. He didn't say at the end of the year, Hey, I had an OBP of .380 and I feel damn good about that.
His first responsibility to the team, he felt (and according to colleague Peter Gammons, Rice had an approach similar to that of Murray), was being in the lineup every day as a reliable teammate, and in this role, he measured himself by RBIs -- more than 80 in 17 of the first 19 seasons of Murray's career. As Peter remembers, Rice felt enormous pressure to drive in runs, and this was not merely self-inflicted. With runners on first and second base and one out and the Red Sox down a run and the count 2-1, he was going to swing at a fastball on the outside corner with the intent of driving in the run.
Rich might not like it, and it might not make a lot of sense in today's OBP world, but that is the way sluggers were taught and expected to think. Ted Williams was one of the sluggers who took walks, refusing to swing at pitches out of the strike zone. Look at the year-to-year leaders and you can see that the elite players tend to walk and strike out more than they used to.
Football has some parallels. Johnny Unitas is regarded, in football history, as one of the greatest quarterbacks in history. And if you look at his completion percentages and quarterback ratings and interception rates, you could, at first glance, ask: What's the big deal? There were four quarterbacks who had higher ratings this year than Unitas did in his best season. His completion percentage would be pedestrian in the modern game, a skill that you might think would translate in a conversation about eras, in the same way that you might think that Rice should've drawn more walks.
But if you talk to anyone affiliated with the NFL in Unitas' era and what they will tell you, without hesitation, is that Unitas was The Man. The game was just different.
There was one thing that Rich wrote that really caught my eye, about past MVP Award results: "At the risk of speaking on behalf of serious fans and students of the game, I believe we would all like for the MVP voting to be a 'barometer' of Rice's [and everyone's] play. We're not 'ignoring the MVP voting entirely.' Instead, we're just discounting it."
I'm sorry, but I guess I'll never be such a serious fan or student of the game that I would discount the information generated in hundreds of MVP votes cast in 14 AL cities during Rice's time as a player. I'll never be such a serious student of the game that I would presume that the past voters like Peter Gammons, Ross Newhan, Tim Kurkjian, Tracy Ringolsby, Ken Rosenthal, Richard Justice, Gerry Fraley, Moss Klein, Bob Nightengale, Bob Elliott and others who spent 10-12 hours a day in ballparks eight months a year didn't know what they were watching. I'd never presume they were simply ignorant in giving Rice all those MVP votes he collected through the years.
And I've always assumed there is plenty of room for opinion and interpretation in the game. Rich's point of view is not wrong; it's his opinion. And I have my own.
Olney and I clearly disagree on Rice's value and place in baseball history. Even though we both own the 1982 Bill James Baseball Abstract, we also don't agree on how an offense functions.
As it relates to APBA and Strat-O-Matic, I never drafted or traded for Jim Rice in my ten-year stint in the Greater Los Angeles APBA Association. I just was never attracted to the fact that he was a below-average ("OF-1") or average ("OF-2") fielder, a below-average ("S") or average baserunner (neither "S" or "F"), rarely walked (averaged 2 "14"s on his card), didn't steal bases (never had an "11" and rarely had a "10"), and grounded into lots of double plays ("24"s). His strengths were limited to the fact that he had three or four "power numbers" ("0-6") on his card and normally had a couple of "7"s (which generally resulted in singles against most pitchers).
Just like in "real" baseball, Rice was a low on-base, high-slugging type hitter. Yes, he could drive in runs but wasn't adept at creating as many runs as the best players. I was much more attracted to players who could hit for power and get on base. Walks were valuable back then. It didn't matter if one was managing an APBA or major league team.
In Rice's rookie year, the Cincinnati Reds led the major leagues in walks and won the World Series (ironically beating the Red Sox in seven games). The Reds also led the majors in BB the following year while winning the World Series once again. Throughout baseball history, teams that have ranked at or near the top in drawing or preventing walks have won much more often than they have lost. For offenses, getting on base is of paramount importance – it always has been and always will. For defenses, keeping runners off base is basically what it has been, is, and will always be about. It's just a simple truism.
As it relates to my APBA playing days, I traded for two of Rice's fellow outfielders – Dwight Evans and Fred Lynn – yet never even thought about acquiring him. Like in "real" baseball, he was a good hitter but was limited in all other phases of the game. Evans and Lynn also hit well but got on-base more often via walks and were significantly better defensive players. In my mind, Rice was basically the equal of George Foster – and I never traded for him either. However, I owned Dave Parker during his peak years because he was a better hitter, better baserunner, and a better fielder than Rice.
Following the 1981 season, I made sure to trade for the number one draft pick and took Tim Raines even though many other league members were partial toward Fernando Valenzuela. Raines was one of the very best players in the game. He got on base frequently, stole bases often and at a record clip, and was as valuable at scoring runs as the Rices and Fosters were in driving them in. I knew what was important back then, and I know what is important today.
With respect to the Johnny Unitas example offered by Olney, I think he is missing the point. Johnny U. was outstanding in his day and remains one of the top QBs in the history of football despite the fact that present-day passers have surpassed his records. Relative to his era, Unitas was fantastic. Nothing will ever change that. The fact that his "completion percentage would be pedestrian in the modern game" has zero impact on his status as one of the all-time greats of the game.
I respect many of the writers Olney mentioned, and I value their opinions. It's not a matter of whose viewpoints carry more weight as much as it is about understanding and appreciating what wins and loses games. Just as no one stat is says it all, no one person or groups of persons knows it all. Beat writers, baseball columnists, statisticians, analysts, scouts, players, managers, coaches, umpires, general managers, owners, fans . . . all of us have a perspective that is neither better nor worse than the others based on our employment alone.
My Dad was a sportswriter who covered the Los Angeles Dodgers from 1958-1968. He never missed a game in 11 years. As such, he probably saw more games than any other beat writer during those years. A member of the Baseball Writers Association of America, he voted for MVP and Cy Young Awards in his day. He also voted for the Hall of Fame up until his death in 1978. Dad was also the statistician for the Dodgers, maintaining game logs, home and road, left- and right-handed splits, etc. well before doing so became popular.
A little bit of my Dad rubbed off on me. I grew up going to games at the Coliseum and Dodger Stadium, and playing Little League, Pony League, Colt League, Connie Mack, American Legion, and high school baseball. I played fast-pitch softball for 10 years. I played APBA during the 1960s, 1970s, and 1980s. I have been a participant in one of the longest-running fantasy leagues for more than 25 years. I coached my son's Little League team. I have attended dozens of games every year of my adulthood and have subscribed to MLB Extra Innings since 2001. Heck, I've even dabbled as a writer and analyst for the past five years.
I own all 12 of the Bill James Baseball Abstracts, and have read every book from cover to cover. I'm not an expert, but I pride myself on having an open mind when it comes to learning more about this great game. I can only hope that those who have been given the privilege of voting for MVPs, Cy Youngs, and Hall of Famers will be equally open minded when it comes time to fill out their ballots.
[Additional reader comments at Baseball Primer Newsblog.]
| Change-Up | January 16, 2008 |
On the Margin - Positional Quality
In each baseball game, both teams field players at the same positions. Other sports feature more interchangeability between the various players on the playing surface. Magic Johnson won the NBA Finals MVP as a rookie when he subbed for Kareem Abdul-Jabbar at center to clinch the title. Magic's big enough and tall enough to do that. While there will always be valuable guys like Chone Figgins playing baseball, needless to say, Jason Varitek could not have replaced a slumping Julio Lugo in the World Series.
This phenomenon engenders a situation in which, for the purposes of team construction theory, baseball contests end up amounting to a series of indirect, one on one match-ups. Let's stick with the Red Sox. Varitek was just ok by his standards in 2007 (.255/.367/.421) but he was good enough that on a given night, chances were the Red Sox had the better catcher than the other team. The same could be said of Kevin Youkilis, Dustin Pedroia, Mike Lowell and Manny Ramirez. None of these players is the best at their given position but more likely than not, better than the guy in the other dugout penciled into the lineup at the same position. Have the upper hand at enough positions, mix in solid pitching and you are in business.
Like anything else, quality at a given position in Major League Baseball will fluctuate. From 1996 through 2005, an annual average of 4.3 National League right fielders posted an OPS+ of 130 or better. You can see the full list here. Between 2006 and 2007, not one right fielder managed to post such a number.
Perhaps I am late to the game here but I think that positional quality at a given snapshot in time should factor into teams' talent assemblage. To break this down, let's have a look at the top-5 National League right fielders in 2007, according to Baseball Prospectus's VORP.
C. Hart     39.2
B. Hawpe    37.4
K. Griffey  31.1
J. Hermida  27.3
R. Winn     26.4
So let's play GM now, National League GM to be exact. Such a weak top of the right field class screams opportunity to me. Sure, on the one hand you could throw a second-rate rookie out there and not take on too much risk because because even if he flops, other teams are not beating you too badly in right. On the other hand, a single bold move or exercising some creativity could net an enterprising team a decided advantage.
Take the Philadelphia Philles, for instance. They will be using a right field platoon of Geoff Jenkins and Jayson Werth. On the surface, there is not a whole lot to get excited about here. But let's look closer. Below are their respective three-year splits against both right-handed and left-handed pitchers:
Vs. RHP
           AVG   OBP   SLG
Jenkins   .292  .365  .504
Werth     .243  .350  .389
Vs. LHP
           AVG   OBP   SLG
Jenkins   .209  .312  .372
Werth     .316  .413  .471
It looks to me like the Phillies might have managed to put together the NL's best right field for 2008. With an excellent southpaw-hitting right-fielder in the fold already and Jenkins out there and available, the Phillies acted. Jenkins is the sort of player who is often panned by some as exactly the sort of mid-market overpriced talent you should steer clear of. You pay up for premium talent, develop and play the scrap-heap for the rest of your team. The Phillies spotted the opportunity, however, and figure to be rewarded.
Another option in a situation such as this is to really go for the kill. What would it have taken to pry Magglio Ordonez away from the Tigers? With two years left on his albeit pricey contract, would it have been worth it for a team that's close but not there yet to part with some prospects for the opportunity to blow away the right field pool in the National League? Would the Angels ever part with Vladimir Guererro?
You don't make such a deal without careful consideration but to the extent that you would ever be willing to deal prospects for a name brand superstar player, isn't this precisely the sort of time to do it? Widespread mediocrity at a given position should trigger the aggressive, smart GM to get either creative, bold or both in order to net his team a quick positional advantage.
| Baseball Beat | January 15, 2008 |
"Listen, Buster" Redux (Part Two)
Moving on to Olney's second article (after reviewing his first piece yesterday), Buster begins by mentioning that he received a lot of email over his Friday piece and then jumps into a discussion on Adjusted OPS (aka OPS+).
Adjusted OPS+ is a useful number. And if this your be-all, end-all statistic, keep in mind that:Mark McGwire and Frank Thomas rank higher than Willie Mays, Hank Aaron and Joe DiMaggio.
Jim Thome ranks higher than A-Rod and Gary Sheffield.
Lance Berkman ranks higher than Ken Griffey Jr.
Brian Giles ranks higher than George Brett, Al Kaline, Orlando Cepeda, Tony Gwynn, Rod Carew and Roberto Clemente.
Adam Dunn ranks higher than Eddie Murray.
I'm not sure where to start here. But let me say that OPS+ should not be anyone's "be-all, end-all statistic." On this front, Olney and I agree. No single stat, in fact, should be viewed in such a manner.
More than anything, Olney's comparisons demonstrate a lack of understanding and appreciation for walks and OBP. Every player that he questions is well known for his ability to get on base by taking a walk. Maybe it's just me, but I don't find it so outrageous that Frank Thomas (157) has a higher OPS+ than Willie Mays (156), Hank Aaron (155), or Joe DiMaggio (155). That said, I believe Olney's splitting hairs here. These four players all have virtually identical OPS+ totals.
OPS+ measures hitting, not fielding or baserunning. Thomas was a great hitter – one of the best ever. However, the Big Hurt's offensive prowess doesn't mean he was a better player than the Say Hey Kid, Hammerin' Hank, or the Yankee Clipper. Mays and DiMaggio were two of the best defensive center fielders of all time, Aaron was a quality right fielder, and all three ran the bases extremely well. Thomas was a poor fielding first baseman or a DH and was a slow runner for the vast majority of his career. Shake it all up, and I'm quite certain that every reputable baseball historian and analyst would take Mays, Aaron, and DiMaggio for their all-round play over Thomas. But that doesn't detract from Thomas' hitting or from OPS+ as a measurement of offensive production (ex-baserunning).
Jim Thome (.281/.409/.565) over Gary Sheffield (.296/.397/.522)? Sounds plausible to me. Thome has out-homered and out-walked Sheffield in 1726 fewer plate appearances.
Adam Dunn over Eddie Murray? Oh my gosh, who thought of this stat anyway? Comparing a career rate stat for a player through his 27-year-old season to another who played up to the age of 41 tells us more about Olney than it does either Dunn or Murray. But, if the truth be known, Murray had a higher OPS+ (143) than Dunn (130) at a comparable point in their careers.
And if you think that Adjusted OPS+ is a set of numbers that generally creates a level statistical playing field for all of the eras of baseball, then you'd have to ignore the following. Of the top 63 players all time in OPS+, there are: Nineteen players who performed the bulk of their careers in the years leading up to 1920.Eight players who performed the bulk of their careers in the years from 1920-1939.
Seventeen players who have performed the bulk of their careers from 1990-2007.
And a total of 17 players from the 50-year period of 1940-89.
That all may be true. However, I'm not sure why Olney chose to measure the "top 63", but nine of the top 24 (if you include Hank Greenberg) are from 1940-1989. That works out to 37.5% of the sample size, which just happens to match the sample period (50 years divided by 132 years). Interestingly, only four of the top 24 career leaders (16.7%) are from 1990-2007 (13.6% of the overall time frame).
Getting back to Olney's point, I don't believe OPS+ is necessarily weakened by the fact that the distribution of superior results may not be equal throughout baseball history. I'm not aware of any statistic that "creates a level statistical playing field for all of the eras of baseball." Take league leaders. There is only one per category each year, yet the number of teams and players has increased over time (as Olney acknowledges in the next section), making it increasingly more difficult to lead the league – or rank among the league leaders – in any stat.
Part of the reason, of course, is there are more teams now. But part of the reason is that in years in which there is less offense, generally, it is more difficult to create a plus/minus disparity in this statistic.
I tend to agree with the latter assertion.
If you don't think that Adjusted OPS+ is a statistic that skews toward the elite players of the Steroid Era, well, then that's your story and you're sticking to it.
OPS+ might be skewed by the higher run-scoring environment and even steroids, but that does not take away from the fact that Jim Rice hit .320/.374/.546 in a highly favorable park environment at home and .277/.330/.459 on the road. His raw counting stats and unadjusted rate stats should not be compared to those from the so-called "Steroid Era," just as they shouldn't be compared to those from the Dead Ball or Live Ball eras.
But Rice's OPS+ should absolutely be compared to players of his own era. I don't think one can quibble with that unless, of course, they don't like what they see. Using Olney's hand-picked years (1975-1986), Rice ranked 11th in OPS+ among players with 4000 or more plate appearances. Jack Clark, Ken Singleton, and Fred Lynn posted higher totals. Greg Luzinski had the same OPS+ as Rice. Keith Hernandez, George Foster, Dave Parker, and Dale Murphy rank directly behind Rice.
I would submit that Foster is a pretty good comp. Same era, same position, same type of hitter/slugger. Both players won an MVP award. Rice led the AL in HR 3x and RBI 2x. Foster led the NL in HR 2x and RBI 3x. Maybe Rice was better. But, if so, the difference between the two was minor (and mostly a function of playing time), yet Foster never received more than 29 votes for the HOF (or 6.9% of the total).
If you place a lot of weight on playing time and counting stats, then perhaps Parker should be viewed more favorably than Rice. Again, both players were from the same era. The Cobra was a Gold Glove-caliber right fielder and a much better baserunner during his peak. Like Rice, he won an MVP. He also led the NL in AVG and SLG 2x, and TB 3x. As it relates to HOF consideration, Parker's vote total peaked at 116 (24.5%) in 1998 and his candidacy has been trending downward ever since.
Joe Morgan, Gary Carter, and Johnny Bench are the only three players with a lower OPS+ during Rice's best years who have been inducted into Cooperstown. None of them played left field indifferently. In fact, all three were outstanding defensively at much more difficult and important positions. And, to be fair to Morgan and Bench, the chosen period didn't capture all of their best seasons.
If we're going to get behind a player from this era, let's focus our time and attention on Bobby Grich. Note that the slick-fielding second baseman ranks 20th in OPS+ during that same period. There are only three non-OF/1B above him on that list. The three? Mike Schmidt, George Brett, and Morgan. Three of the greatest players in the history of the game. But I digress. I'll give Grich, who garnered almost zero support from the voters, his due in a separate article at a later time.
It's not a perfect statistic. There aren't any perfect statistics.
Agree. No single metric is flawless, whether they're counting or rate, unadjusted or adjusted. They all have flaws. None of them are perfect, especially as standalone measures. It's important to put all stats into their proper context.
While I'd generally agree that to focus on building a Hall of Famer's credentials around a single year of MVP voting might be dubious, the numbers cited in Friday's column accounts for hundreds of votes from every AL city over more than a decade. A lot of writers who watched Rice play daily, at the time he was on the field -- rather than through the time-machine prism of Adjusted OPS+ -- thought he was pretty damn good.
I don't doubt or dispute that. But I think it is only fair to point out that writers have always been biased toward RBI (check out the MVP award winners over time for proof) and rarely, if ever, adjusted for park effects – particularly in Rice's day. As a result, I believe it follows that Rice was overrated by writers back then and is benefiting today from the misperception that he was better than he actually was. Importantly, by making this statement, I'm not revising history. The fact that writers "thought he was pretty damn good" doesn't necessarily mean he was pretty damn good.
If you want to quibble with the fact that he won the award in 1978, or with his placement in some particular year, OK, I get that. But to ignore the MVP voting entirely, as if it isn't at least some kind of barometer of his play over the course of his career, is embarrassing. This is like saying, "Hey, forget the Oscar voting of the 1950s. Marlon Brando was clearly overrated."
At the risk of speaking on behalf of serious fans and students of the game, I believe we would all like for the MVP voting to be a "barometer" of Rice's (and everyone's) play. We're not "ignoring the MVP voting entirely." Instead, we're just discounting it. Doing so shouldn't be "embarrassing" to anybody. After all, Roger Maris and Dale Murphy won back-to-back MVPs and never even sniffed the Hall of Fame.
Look, I've never met Jim Rice, didn't grow up a Red Sox fan, don't think he is one of the very elite players of all time. I understand why someone wouldn't vote for him (but don't agree). But to portray his career as entirely unworthy of Hall of Fame consideration is silly.
I've never met Jim Rice either, didn't grow up a Red Sox fan or hater, and certainly don't think he is one of the very elite players of all time. I understand why someone would vote for him (HR and RBI titles plus an MVP). That said, I disagree. When put in the proper context, Rice was not as good as he appears to be on the surface.
| Baseball Beat | January 14, 2008 |
"Listen, Buster" Redux
Buster Olney provides an invaluable service by linking to numerous baseball articles on almost a daily basis. I enjoy skimming Olney's blog (ESPN Insider subscription required) for his notes and links to stay abreast of what others are writing and saying.
Unlike the Baseball Primer Newsblog, which tries to highlight the best (or most interesting) stories irrespective of their origin, Olney's links are nearly always to stories in the mainstream media. However, Buster linked to Baseball Analysts a year ago [editor's note: link is no longer available] when I challenged his rationale for excluding Bert Blyleven from his Hall of Fame ballot.
Olney and I differ not only on Blyleven but on Jim Rice as well. With respect to Rice, Buster wrote two entries in support of him on Friday and Saturday, and I believe there are several fundamental flaws that need to be addressed – especially in light of the fact that the candidate in question finished second in the balloting with 72.2% of the vote and is on the verge of being elected next year in his 15th and final opportunity.
I'm going to excerpt Olney's comments and respond to them on the small chance that Hall of Fame voters will take the time to read this and further evaluate their position on Rice. I'm hopeful that this exercise will also shed some light on a number of basic truths and falsehoods when it comes to analyzing stats so as to improve the process (and the quality of the inductees) in the future.
During Jim Rice's incredible 1978 season, a total of two American League players had on-base percentages over .400: Rod Carew, with .411, and Ken Singleton, at .409. In 2007, eight AL players achieved an OBP of .400 or higher.In fact, in the seven seasons played since the start of 2001, there already have been 42 AL players who have posted OBPs of .400 or better; in the entire decade, of 1970-79, there were only 36 AL players who achieved OBPs of .400 or better. It was a time of less offense and fewer runs, a time when teams didn't value walks the way they do now, a time when the strike zone was larger, a time when hitting 20 homers and driving in 80 runs was an excellent year.
Rice's OBP in 1978 wasn't anywhere close to .400. It was .370. He ranked 12th in that category. Rice, in fact, never finished higher than ninth in OBP in any single season. As such, mentioning Rice and on-base percentage in the same sentence does more harm than good when it comes to discussing his Hall of Fame qualifications.
I don't believe anyone is disputing the fact that runs were more difficult to come by during the 1970s than in the current decade. By the same token, I don't know anyone who is comparing Rice's raw totals to today's sluggers. The case "for" or "against" Rice should be based on how he performed versus the competition over the course of his career. More on that later.
As far as teams not valuing walks the way they do now, I believe there is some truth to that. However, more than anything, I contend writers and voters (both HOF and MVP) have never given walks their proper due. I played APBA during a large portion of Rice's career and used to count how many "on base numbers" players had on their cards. Walks have always been important. If anything, walks were more valuable in Rice's day because bases and runs were scarcer than they are today.
So it's almost laughable to hear and read about how Rice was nothing more than a very good player in his time. Look, if you stick his statistics into offensive formulas tailored for the way the game was played in the '90s, he's not going to look as good. Giving him demerits because he failed to draw walks is like diminishing what Pedro Martinez has accomplished because he has only two 20-win seasons.
Speaking of "laughable," comparing Rice's failure to draw walks to Martinez's lack of 20-win seasons is mixing apples and oranges. Of course, Rice deserves "demerits" for not walking more often. It's not like Rice's lack of walks wasn't his own doing. He has nobody to blame but himself for not earning more bases on balls. As such, Rice's low walk rate detracted from his value as a hitter every time he went to the plate. It was one of the weaknesses in his game. The fact that Martinez only won 20 games twice over the course of his career had little, if anything, to do with his value as a pitcher every time he took the mound.
But, if you want to go down this alley, let's at least be fair about it. To Martinez's credit, he had a pair of 20-win seasons. Rice, on the other hand, never had even one season in which he walked 100 times. (Rice's career high was 62 in 1986.) For context, there have been 54 20-win seasons during Pedro's career. By the same token, there were 72 100-walk campaigns during Rice's career. In other words, winning 20 games has been an even bigger rarity in Martinez's time than walking 100 times in Rice's era.
Olney then spends time pointing out how highly Rice ranked in HR (3rd), RBI (1st), and OPS (4th) from 1975-1986. I generally find such arguments unconvincing because the time frames chosen almost always favor the player in question. To wit, Rice gets the benefit of all 12 years whereas his competition in many cases loses the early or latter portions of their careers in such studies. Nonetheless, I believe it is instructive to see where Rice ranks in outs during this period.
                                OUTS
1    Steve Garvey               5402
2    Jim Rice                   5298
3    Robin Yount                5099
4    Dave Winfield              5069
5    Buddy Bell                 5040
6    Dave Concepcion            5025
7    Don Baylor                 5006
8    Mike Schmidt               4890
9    Bill Buckner               4887
10   Cecil Cooper               4846
That's right, Rice made more outs than anyone other than Steve Garvey over the course of his 12 best seasons. I make this point not to put Rice down but to show that his counting totals and rankings were highly influenced by the fact that he had more plate appearances (7754) than any player in baseball during this period.
As for RBI, it's important to recognize that Rice benefited from hitting with runners on base much more frequently than most players. In fact, it is one of the reasons why he ranks first by a wide margin in grounding into double plays (GIDP) over this stretch.
                                GIDP
1    Jim Rice                    269
2    Steve Garvey                215
3    Buddy Bell                  195
4    Dave Concepcion             194
5    Dave Winfield               186
6    Ted Simmons                 185
T7   Bill Buckner                174
T7   Ken Singleton               174
9    Larry Parrish               168
10   Doug DeCinces               167
Put another way, Rice's GIDP and RBI totals are inflated for no other reason than he had so many opportunities to accumulate both. Hitting with runners on base will do that. Rice's backers will build their case around his RBI and ignore GIDP. Those who oppose Rice will mock how many times he hit into a double play and disregard RBI. You can't really view one without the other.
Thanks to Baseball Prospectus, we can check where Rice ranked in RBI Opportunities in each of those dozen years.
       RBI  Rank | ROB  Rank | OBI   OBI%  Rank
1975   102    5    458    3     80   17.5    9
1976    85   15    391   27     60   15.3   21
1977   114    3    426   17     75   17.6   15
1978   139    1    461    7     93   20.2    4
1979   130    2    474    4     91   19.2    8
1980    86   16    370   33     62   16.8   17
1981    62   10    367    1     45   12.3   53
1982    97   14    466    7     73   15.7   31
1983   126    1    504    2     87   17.3   14
1984   122    2    545    1     94   17.2   10
1985   103    9    496    2     76   15.3   33
1986   110    4    514    3     90   17.5   10
ROB = Runners On Base: the number of runners on base during a batter's plate appearances.OBI = Others Batted In: runs batted in, except for the batter driving himself in via a home run. Equals RBI-HR.
OBI% = Others Batted In Percentage: the fraction of runners on base who were driven in during a batter's plate appearances.
Although Rice led the AL in RBI in 1978 and 1983 and ranked in the top ten nine times, he was among the top three in terms of coming to bat with runners on base in six of those 12 seasons. More telling is the fact that Rice never ranked in the top three in OBI%.
In 1981, Rice had 47 more ROB than any other batter in the AL, yet ranked 10th in RBI because he was 53rd (out of 73 qualifiers) in OBI%. In 1984, Rice had 57 more ROB than anyone else so it should not be surprising that he finished second in RBI that season. Rice had the second most ROB (behind teammate Bill Buckner) in 1985 and the third most ROB in 1986 (behind teammates Buckner and Don Baylor). Hmmm. I wonder if Wade Boggs had anything to do with that?
Rice was a significantly better hitter at home than on the road, hitting .320, with a slugging percentage of .546 and 208 career homers in Fenway, compared with an average of .277 and 174 homers on the road.
Let me display Rice's home/road splits a bit more visually. I'm mean, there's no reason to gloss over something that is so fundamental to Rice's "for" or "against" case than his home and road performance.
        AVG   OBP   SLG   OPS
Home   .320  .374  .546  .920
Road   .277  .330  .459  .789
Rice hit like a Hall of Famer at home and closer to Ben Oglivie (.273/.336/.450) or George Hendrick (.278/.329/.446) on the road.
Let's drill down deeper and see just how Rice fared away from Fenway Park year-by-year. His MLB and AL rankings are nothing more than where his road OPS would have placed among all qualifiers (both at home and on the road).
       Road OPS  MLB Rank  AL Rank
1975     .807       41       18
1976     .746       55       30
1977     .886       19       11
1978     .837       24       15
1979     .809       49       27
1980     .810       40       27
1981     .703       92       50
1982     .859       22       15
1983     .903        7        4
1984     .741       71       42
1985     .743       73       47
1986     .835       28       19
Rice's performance on the road would have ranked him in the top ten in the AL in OPS one time in his entire career. ONCE. Now I recognize that this exercise unfairly penalizes Rice in the theoretical rankings because his Boston teammates get the full benefit and visiting players the partial benefit of playing games at Fenway Park. Bump Rice's rankings up a bit if you would like to compensate for the simplicity in my methodology.
But again, consider the era, and how much less offense there was. If you were a team, you would like to have the guy considered to be most dominant home-field hitter in the game? Of course you would.
Look, Rice wasn't the "most dominant home-field hitter in the game." Olney makes that statement as if Rice would have hit well at any home park. There is no evidence to suggest that at all. Simply put, Rice hit well at home because he played his home games at Fenway Park. From 1975-1986, Fenway's park factor averaged 107.5, meaning it favored hitters by 7.5% over the league average. In 1977, Boston's home park played like Coors Field in 2002.
Rice was taking advantage of the conditions in the games he played, much as Sandy Koufax did. From 1962-1966, Koufax had a home ERA of 1.37, in the pitcher-friendly Dodger Stadium, and a road ERA of 2.57. Does anyone say that this diminishes what Koufax accomplished, the way it is said about Rice?
I don't know anybody who would dispute the fact that Koufax benefited by pitching his home games at Dodger Stadium during the last five years of his career. But to try and compare Jim Rice to Sandy Koufax? Oh my! Koufax's 1.37 ERA at home is much, much more impressive than Rice's .920 OPS at home. But, more to the point, Sandy's 2.57 ERA outside of Dodger Stadium is also much, much more impressive than Rice's .789 OPS away from Fenway.
Like Rice's OPS rankings in the illustration above, Koufax's MLB and NL rankings are nothing more than where his road ERA would have placed among all qualifiers (both at home and on the road). As in the case of Rice, feel free to adjust Sandy's rankings upward due to the simplicity in methodology as well.
       Road ERA  MLB Rank  NL Rank
1962     3.53       26       14
1963     2.31        2        2
1964     2.93       19       10
1965     2.72       16        6
1966     1.96        1        1
Koufax was also much better than generally believed in 1960 and 1961 when his season totals were negatively affected by pitching home games at the Coliseum. His 3.00 ERA on the road in 1960 would have ranked fourth in the National League and sixth in MLB. His 2.77 ERA on the road in 1961 would have topped the senior circuit and placed third overall. It's all a distant memory now but Koufax's 269 strikeouts in '61 broke Christy Mathewson's NL record that had stood for 58 years.
In any event, Sandy's road ERA was good enough to theoretically lead the league two times and finish in the top ten six times in a span of seven seasons! Koufax was not only one of the greatest pitchers ever inside the confines of Dodger Stadium, but he was a terrific pitcher on the road as well. Too bad the same can't be said about Rice's hitting.
I will cover Olney's second article tomorrow, which focuses on Adjusted OPS (or OPS+) and how the adoption of this statistic has unfairly hurt Rice.
| Command Post | January 10, 2008 |
Grouping Madness
Last week, I wrote about different age groups and differences in the way they pitch. I received a couple of comments about certain ways to further create groups and try to isolate the differences I saw, and in doing that, I came up with some interesting new material for this week's article.
In last week's article, I had two groups: old and young pitchers. This week, I split my age groups into two groups based on the speed of their fastball. The "young-slow" group was young pitchers who had an average fastball speed of 90.5 MPH or lower, and the "young-fast" group was comprised of the rest of the pitchers originally in the young group. I did the same thing with my group of old pitchers, and ended up with 4 different groups, which are summarized in the table below, along with the groups from last week for perspective.
Group        N    FB Spd  FB%    CH%    CB%    CT%    SL%
Young-slow   22   88.1    0.53   0.13   0.12   0.04   0.17
Young-fast   59   93.1    0.59   0.13   0.10   0.04   0.14
Old-slow     45   87.8    0.53   0.19   0.09   0.05   0.14
Old-fast     26   92.8    0.48   0.14   0.07   0.09   0.23
===========================================================
Old-all      71   89.9    0.50   0.17   0.08   0.07   0.18
Young-all    81   92.1    0.58   0.13   0.10   0.04   0.15
There are a couple of really interesting bits in the table, the first being the FB% of the old-fast group being lower than the FB% of the old-slow group. One reason for this apparent inconsistency is that the fast group is made up of players who have retained a very effective breaking ball even as they aged (mostly sliders and cutters), which they rely heavily on.
Here's a chart that highlights some important features about the sliders in each group. The old-fast group actually has the fastest slider, but the important parts of this table are the last two columns. One quick way for judging the "nastiness" or effectiveness of a pitch is to see how often a pitcher is able to get a swing and miss from it. The final two columns show the swing and miss percentage for sliders and fastballs in each group. These break down pretty nicely along speed lines, with the faster groups getting more swings and misses than the slower ones. What is a little bit surprising, especially in light of the frequency table, is how similar the speed groups are to each other for sliders and fastballs. The pitches move slightly differently for the two fast groups (and slow ones), but there isn't a whole lot of difference in how often batters swing and miss it. The similarity is surprising because of how often the two fast groups throw their fastball with the hard-throwing old pitchers throwing the fewest amount of fastballs with their younger counterparts throwing the most. Some of that difference is explained by difficulty controlling the slider vs. fastball, but it seems like hard-throwing young pitchers are being over-reliant on fastballs as a group. The flip side to this is that hard-throwing old pitchers could be throwing fastballs at closer to the optimal rate and preferentially throwing them when needed.
Group        SL Spd   pfx_x    pfx_z    SL-SandM%   FB-SandM%   FB-SLGBIP
Young-slow   82.3     4.74     3.44     0.11        0.05        0.552
Young-fast   85.1     2.98     3.43     0.14        0.07        0.592
Old-slow     81.1     2.66     4.02     0.10        0.05        0.580
Old-fast     86.2     3.00     4.13     0.15        0.07        0.509
This possibility of old hard-throwers leveraging their fastballs better than younger ones also shows up in the results as well. The young-fast group had the highest SLGBIP on their fastballs while the old-fast group had the lowest and while this isn't the strongest evidence for the old pitchers picking their spots with their fastballs, but it's a start. Looking at fastball selection either by count or hitter quality is the next step here.
I mentioned last week how the younger population was made up of both players who would eventually join the old group and players who wouldn't. This is a "duh" statement, but I think the pitchers who will survive and eventually make it into the old group would tend to come out of the young-fast group. That group can afford to lose some velocity on their pitches and still be effective, but the young-slow group is already on the edge of being very hittable and has nowhere to go if they suffer a drop in velocity. Obviously the attrition doesn't just come from the slow group, but everything else being equal, I would rather bet on a hard thrower having a longer career than a slow thrower. Looking at the list of names in each group reinforces this idea too. The slow group has only 22 names on it, but most of them wouldn't be considered top-prospects. The highlights include Dallas Braden, Kyle Kendrick, Zach Duke, and Carlos Villanueva. The fast list is full of either prospects or young guys who have already established themselves, including Justin Verlander, Matt Cain, Tim Lincecum, Felix Hernandez, and Scott Kazmir.
| Designated Hitter | January 10, 2008 |
In Defense of the Hall of Fame
[Editor's Note: As always, the views expressed in this article are those of the author and do not necessarily reflect the official policy or position of Baseball Analysts and/or its writers.]
Over the holidays, I spent a lot of time poring over issues of The Sporting News from the 1960s. Typically distracted by stories that have nothing to do with my task, I came across many discussions about who should be in the Hall of Fame. This was 45 years ago, so the articles were about guys like Sam Rice, George Kelly, Elmer Flick, or Jim Bottomley, written by Shirley Povich, Fred Lieb, Lee Allen, or Taylor Spink, with testimony from Branch Rickey, Joe McCarthy, or Casey Stengel, old men who knew a thing or two about talent. There were stories like this every off-season, largely anecdotal, well-written, and fascinating. My reading has been like a refresher course in early 20th century baseball.
What was missing from these newspapers were all of the “No” votes. Back in the day, a writer would pull out his typewriter to support some old ballplayer, but there were no stories about why someone was overrated or unqualified. Had baseball blogs existed in 1962, some modern expert could have lectured Povich about Sam Rice’s WARP score, or blasted Rickey for his silly misevaluation of George Kelly. But we missed out on all of that good fun, and eventually all these guys, and others like them, got in.
The argument for George Kelly, as I recall it, went something like this: starred on offense and defense for the only National League team ever to win four consecutive pennants (still true), won multiple HR and RBI titles, credited by John McGraw with getting more important hits than any man who ever played for him, and had a cool nickname (“Highpockets”). Using the standards of the time, that’s a decent argument. Not perfect, insufficient even, but not a bad resume. Kelly was a fine player.
There are very few people around anymore who think George Kelly should be in the Hall of Fame (Bill James has suggested he is the worst player in the Hall), though there are also few people around who know anything about him—what teams he played for, his impact on those teams, what his great manager thought of him, how he played the game. All we know about him, or think we know about him, is how good his statistics were. Not good enough, apparently.
I am not suggesting that George Kelly “deserves” his plaque—whatever that means. Rather, I am saying that the man and his accomplishments and his stories have been buried by the avalanche of his Hall of Fame case. The memories and opinions of Fred Lieb and Branch Rickey have been replaced with … what exactly? Is there anyone out there that has anything to say about any of these players besides their statistics? Forget George Kelly, does anyone have any colorful stories about Bert Blyleven or Andre Dawson to help me get through the winter? Even Joe Posnanski, one of our best bloggers, has felt a need to serve up endless “How Good Was He?” columns this winter. Say it ain’t so, Joe.
Having read dozens of Hall of Fame arguments on the web in the past few weeks, by good people, some of them my friends, I find several problems with them in the main. Walking timidly into the lion’s den, let me summarize.
Recently there has been some debate on various internet sites, including this one, about who deserves to vote in Hall of Fame elections. Let me tell you what I think. If I were in charge of the process, I would require that all voters understand what the Hall of Fame actually is before gaining the privilege. I would make every voter take a history test. There are 200 members of the Hall of Fame who were chosen based on their play in the major leagues, and I would expect each of the voters to understand (at the very least) the careers and qualifications of all of those men—the highlights, great moments, opinions of contemporaries.
Does this mean that the correct 200 players are in the Hall of Fame? No, of course not. Does this mean that 200 is the right size? No. However, I suggest that whatever standards you come up should be “reasonably” consistent with the current membership list. If you want to say that the voters overvalue the players of the 1930s, or that 3B is underrepresented, or there are not enough Yankees, you must do so while not dynamiting a 70-year-old institution. You want to ignore the bottom 10% of the Hall, we can live with that.
Jay Jaffe, a fine writer and analyst over at Baseball Prospectus, invented a measure called JAWS (which uses WARP as its basis) and compares new candidates to the JAWS score of the average HOF player at his position. Actually, if I have this right, he first removes the worst inductee at each position (and four pitchers) and then uses the average of the rest. This process might suggest that Jay believes that half of the Hall of Fame is unqualified, or at least suspect. My bright friend Rob Neyer uses Win Shares, but has a similarly strict standard, recently writing, "I believe that if a player is among the best dozen or so at his position, he belongs in the Hall of Fame; or, alternatively, that if he's better than half the players at his position already in the Hall, he belongs in the Hall of Fame." When considering that there are about 18 HOFers per position now, and that there are several non-inductees that Rob supports, he is implying that about 40% of the current members are unqualified.
I mention Jay and Rob because they are two of the more talented and visible writers on this subject, and I suspect most people reading this agree with them on this issue. With all due respect, and writing as a product of the same general community of thought, I have a different view.
Look, I am down with the idea that the Hall of Fame contains several questionable players. (Not bad players—there are no players even remotely “bad” in the Hall of Fame.) But, I am sorry, if you want to impose standards that 40% or 50% of the current Hall does not reach, then, in my opinion, you should not get to vote. You are ignoring what the Hall of Fame actually is. You can’t wave away 40% of the Hall and claim to be interested in helping. And there are no “tiers” in the Hall of Fame either—every member is honored equally.
Parenthetically, if every voter was like Rob and Jay, and only voted on, for example, the best 12 players at each position, the actual HOF bar would be even higher than that. All voters are not going to agree on who these 12 guys are, and you need 75% of the vote. The effective standard becomes that 75% of the voters have to put you in the top 12. Which I suspect would leave you with something like 8 guys per position. We will reach the point where we only elect superstars and relief pitchers. Oh look, here we are.
Another problem with the analytical arguments is that they are so … strident. The current message from the stat community to the Hall of Fame and its voters goes something like this: “Your institution is riddled with poor selections, and most of the current voting writers are morons. P.S. Please find enclosed my application to join your fine group.” It’s a bit like saying, “I don’t like your wife, but if you have me over for dinner I can give her a few tips on her attitude.”
Every time some poor writer released their Hall of Fame ballot last month, unless it had the “right” guys on it, the voter was deemed not smart enough, unthinking. I don’t really want to quote examples because I am in enough trouble already, but, trust me, if you voted for Jack Morris you were mocked. (Sure, Morris had more Win Shares and the same WARP as Rich Gossage, and no GM in their right mind would prefer Gossage to Morris, even before considering Morris’s epic post-season performances. Apparently “relief pitcher” is a separate position now. Coming soon: the top 12 “seventh-place hitters”. But I digress…)
Jim Rice received 72% of the vote on Tuesday, an overwhelming consensus of support, 12% more than Franklin Roosevelt’s 1936 landslide over Alf Landon. Are these 72% all just not smart enough? Four hundred journalists, many of whom saw Rice play hundreds of time, just need to think this through properly? How did we all get so confident? I submit, sheepishly, that perhaps it is we who need to open our minds.
Me? Sure, I have argued for all the “smart” guys—Ron Santo and Bert Blyleven and Tim Raines—at cocktail parties. Even Tony Oliva, which is a big hit, believe me. But I suggest we all could use a little humility. The idea that we can confidently separate Dale Murphy and Andre Dawson statistically is nuts—who you prefer is basically a matter of taste. Defense, adjusting for eras, quality of competition, integration, position, post-season play, intangibles? If you are approached by someone who claims to have unraveled these issues statistically—I strongly urge you to run.
My final problem with all of the analytical Hall of Fame arguments: there are too many of them, and they all say the same thing. Once you have decided to use Win Shares, or WARP, or JAWS, there is really no need for a lengthy explanation. If you want to explain the internals of Win Shares and make the case for why you are using it as opposed to something else, go right ahead. But once you have defined the parameters of the debate on your terms, there is nowhere to go unless you typed some of the numbers incorrectly. The reason people come up with a different answer is that you confidently co-opted the question.
The only way one can add to the conversation is to supply some sort of color or nuance—a description of performances in big games, quotes from opponents or managers, a great World Series catch, your own personal memories. Does this matter? I suggest it matters in one sense at least: without it, you don’t really have an article that hasn’t been written before. Are you all really going to write the same Jim Rice stories again next year?
When I was about 12 years old, I received a little book for Christmas about the Hall of Fame, written by Ken Smith (who was the librarian at the Hall for many years), containing biographies of all of the current members. It was not great literature by any means, but I must have read that paperback three or four times, and it played its small part in my baseball education. Reading about Hugh Duffy and Tommy McCarthy got me curious about the great Boston Beaneater teams of the 1890s, just as Frankie Frisch and Dizzy Dean brought me to the Gas House Gang, and Eddie Collins and Frank Baker to the powerhouse Athletics teams of the early 1910s. Although the book focused on the players, it was the great teams that made the stories interesting. The teams, it seemed to me, were what baseball history was really all about.
I think we all agree that if George Kelly had played for the Phillies in the 1920s instead of the Giants, he would not be in the Hall of Fame. (He would actually be more respected than he is, since instead of being a “joke Hall of Famer” he would be an “unappreciated star”.) However, he *did* play for the Giants, and this seems wholly relevant to the conversation. John McGraw somehow won ten pennants with Christy Mathewson (who was only around for five of them) and a bunch of players like George Kelly—great defenders who could hit a little. The only NL team ever to win four straight flags, the 1921-24 Giants, had four Hall of Famers: Frankie Frisch, George Kelly, Ross Youngs, and the shortstop (Dave Bancroft, giving way to Travis Jackson), all but Frisch considered “mistakes” by today’s experts. How many Hall of Famers should be on this great team? It is consistent with the purpose of the Hall of Fame, in my view, to honor baseball’s champions.
If you begin with the premise that the 200 guys in the Hall of Fame should be the 200 statistically-best careers in history, a premise all analysts have rallied around, then George Kelly does not have a case. If you modify this premise, if you believe that being on this great Giants team gets him extra points, that the word of John McGraw carries additional weight, that first base defense was more important at that time and place than it is today, that career length is less important to you, we start inching along and suddenly his case seems less ridiculous. This is not a case I would make, but this is the case that the people who lived and watched those teams made about George Kelly. If the guy who John McGraw thought was the best player on a four-time champion—if this is the worst guy in the place, how bad can it really be?
Don’t worry, I am not asking for your support for George Kelly, although I do suggest you pause at his plaque the next time you are in that great museum in Cooperstown. He’s got a nice story. Jack Morris and Jim Rice have nice stories too, and the smart people advocating their candidacies are worth a listen.
Mark Armour writes baseball from his home in Corvallis, Oregon. He was the co-author, with Dan Levitt, of the award-winning book Paths to Glory, the editor of Rain Check: Baseball in the Pacific Northwest, and the director of SABR's Baseball Biography Project. His next large project is the life of Joe Cronin. He can be reached at markarmour@comcast.net.
| Change-Up | January 09, 2008 |
The Votes Are In
The votes have been tallied and a most deserving Goose Gossage will be enshrined in the Baseball Hall of Fame next summer. Nobody else will be going in with him. Here is how the votes broke down, with players who received less than 5% of votes not listed (don't worry, there are two BBWAA writers out there who saw fit to throw their support behind Travis Fryman).
              PCT
Gossage       85.8
Rice          72.2
Dawson        65.9
Blyleven      61.9
Smith, L.     43.3
Morris        42.9
John          29.1
Raines        24.3
McGwire       23.6
Trammell      18.2
Concepcion    16.2
Mattingly     15.8
Parker        15.1
Murphy        13.8
Baines        5.2
Immediately leaping off the page to me is the outfield vote. Consider these five players, and tell me how 72.2% of voters can give the nod to one of them and just 13.8% to another.
         PA     AVG   OBP   SLG   OPS+  RC/G
Rice    9,058  .298  .352  .502   128   6.0
Dawson  10,769 .279  .323  .482   119   5.4
Raines  10,359 .294  .385  .425   123   6.6
Parker  10,184 .290  .339  .471   121   5.5
Murphy  9,040  .265  .346  .469   121   5.7
To my eye, these guys look pretty comparable. Tim Raines was by far the greatest offensive force of the bunch and as Rich Lederer and others have pointed out, should have been a slam-dunk first ballot selection.
While Jim Rice has the next best offensive resume, it seems that the defensive contributions of Andre Dawson, Dale Murphy and Dave Parker - all Gold Glove level outfielders - have been far too heavily discounted by the electorate. I am not sure that Parker's case is as strong as Rice's, but Murphy's and Dawson's are. It's just too bad people don't fear solid hitting center fielders who can shag fly balls and don't play with a wall in left field that's just a knock-down sandwedge away (remember, Rice hit .277/.330/.459 away from Fenway). I will spare readers further snark and just point to Joe Posnanski to help address Rice's candidacy once and for all. Here he addresses the "dominantest hitter ever for 12-years" Rice crowd:
For instance, what (if) I told you there was a player who, over a 12-year period, led all of baseball in home runs and RBIs? I’m talking all of baseball. Even Rice did not do that. And what if I further told you this guy played center field for much of his career, he stole more than 200 bases (31 in his best season) and hit one of the three most famous home runs in baseball history. That guy would be a SURE Hall of Famer, wouldn’t he?Joe Carter (1984-1995 — that’s 12 years for you)
Homers (327), 1st in baseball
RBIs (1172), 1st in baseball
Carter was so highly thought of by voters that he couldn't even muster 4% of the vote in his one and only year on the ballot. Meanwhile, Rice looks like he is going to get in, which is fine I guess. But boy are there a lot of other players who should be in there before him.
==========
Bert Blyleven is up to 61.9% and on the right track. Hat tip to Rich, there.
==========
Poor Alan Trammell.
- A career 110 OPS+, good for 11th all time amongst shortstops with 6,000 PA's through 2002.
- A career .333/.404/.588 hitter in the post-season and the 1984 World Series MVP.
- Four gold gloves
- Should have run away with the 1987 MVP award, when he hit .343/.402/.551. Showing there is something of a longstanding tradition of BBWAA, um, confusion, George Bell won the award that season (RBI's are the best!).
==========
The following link is definitely parody, but have a look and decide for yourself if the divergences in logic between this spoof piece and the general electorate are all that vast.
Check out Art Garfamudis's ballot.
==========
Update: Here's exhibit A for what's wrong with the current voting system: Dan Shaughnessy, in one of his more odious pieces of blatant deceit in quite some time, chimes in on what a travesty it is that Rice was not elected. A snippet for you:
He hasn't cried about racism or favoritism (he'd probably already be in Cooperstown if he'd had the disposition of Kirby Puckett or Gary Carter), but he knows he was a better hitter than former teammates Perez and Wade Boggs and he suffers in silence while inching excruciatingly close to election.
| Baseball Beat | January 08, 2008 |
Station Break
One of the rules of thumb that we try to live by at Baseball Analysts is to only write about subjects where we can add value to the discussion. Our goal is to inform, entertain, and engage our readers on all things baseball. But only when we have some insight. Otherwise, we're just filling space and wasting your time.
With the foregoing in mind, we have generally refrained from writing about steroids on this site. In more than four-and-a-half-years and nearly 1300 entries, the word "steroids" has appeared in only 20 articles. Five of them were written by guest columnists and three involved interviews. In all but two cases (including one of the most thought-provoking articles I've ever encountered), the mention of steroids was either tangental to the topic at hand or in jest. Even Sunday's widely read piece by Pat Jordan mentioned the "s" word twice.
I'm going to break with tradition and discuss steroids today. The purpose isn't to point fingers, name names, play the blame game, or act as an apologist for anyone. It is simply designed to try to add a perspective that I believe is missing from many discussions on this emotionally charged subject. You can stop right here and click to another favorite site if you'd like. Or you can read on.
First of all, I am not an expert when it comes to performance-enhancing drugs. Far from it. In fact, I would describe myself as a novice. Most people are. Heck, even the medical profession doesn't have a uniform opinion on PEDs. Dr. George Griffing, Professor of Medicine at St. Louis University, claims in a recent webcast and editorial (registration required) that "the athletic benefits of HGH is a myth." I'm sure there are doctors who believe otherwise. My point is that the benefits, if any, are not a given. Rob Neyer admits that Dr. Griffing might be wrong, "but his analysis seems to be based on the best science available at the moment." One can still frown upon its use "as it may be unhealthy and is often, as obtained by professional athletes, illegal. But it now seems quite possible that not a single home run or strikeout has been gained from the ill-gotten, illusory benefits of human growth hormone."
I'm torn on the subject myself. My head says one thing. My heart says something else. And my gut goes back and forth. Put me in the camp that has more questions than answers.
But I feel strongly about one thing: a record, by definition, is not to be tampered with. It records what has transpired. Nothing more, nothing less. Accordingly, I would not expunge any player records, stats, awards, or honors. That seems foolish and like an overreaction to me. Where do you start and where do you stop? What about players in the '60s and '70s grabbing "greenies" out of jars openly available in locker rooms? Were they legal? Did they not stimulate players and enhance performance?
Part of the fun of discussing records is that we can always speculate about context. No era is comparable to any other. Dead ball/live ball, segregation/integration, lights/no lights, day games/night games, travel by train/travel by plane, 154 games/162 games in a season, 16 teams/30 teams, symmetrical/asymmetrical ballparks, four man/five man rotations, designated hitters/no designated hitters, grass/artificial turf, and outdoor stadiums/indoor domes. I could go on and on. The strike zone, height of the mound, and equipment have changed over the years. Player usage and strategy have changed as well. In the "old" days, starting pitchers were expected to complete their games. Today, if a starting pitcher gives his team a quality start, the manager can turn to his bullpen and employ three relievers to shut down the opposition.
As with society in general, today's players benefit more from nutritional, medical, and technological advances than those from previous generations. Tommy John surgeries have prolonged the careers of countless pitchers. Less invasive surgeries allow players to return to the playing field faster than ever. Laser eye surgeries have reduced the need for glasses and contact lens.
Sure, for the sake of the record books, the purist in all of us wishes everything could be the same. But the reality is that things change over time. Sometimes for better. Sometimes for worse. But they do change.
I, for one, am not troubled by the fact that Babe Ruth's single-season home run record was eclipsed by Roger Maris. Ford Frick, the commissioner at the time, was bothered by it and vowed to put an asterisk by Maris' name in the record book. It was the prevailing hysteria of the day. I'm also not disturbed in the least by the fact that Maris' record was broken by Mark McGwire. Or that McGwire's record was short-lived and beaten by Barry Bonds.
Similarly, I was totally fine with Hank Aaron breaking Ruth's career home run mark. And I have no problem with Bonds setting the new standard as he did last season. Going forward, I won't be surprised if Alex Rodriguez breaks Bonds' record. Should A-Rod become the new HR king, I'm quite sure that someone will come along and overtake him.
Does any of this make me think less of Ruth? No. If anything, his legend has increased over the years. His memorabilia is worth more today than ever before. No player or record can take away what Ruth and Honus Wagner, Ty Cobb, Rogers Hornsby, Lou Gehrig, Joe DiMaggio, Ted Williams, Stan Musial, Jackie Robinson, Mickey Mantle, Willie Mays, Pete Rose, Mike Schmidt, Cal Ripken, and Rickey Henderson accomplished. Or what Cy Young, Christy Mathewson, Walter Johnson, Grover Cleveland Alexander, Lefty Grove, Bob Feller, Warren Spahn, Sandy Koufax, Bob Gibson, Tom Seaver, Nolan Ryan, Roger Clemens, Greg Maddux, Randy Johnson, and Pedro Martinez achieved. All of these players are great. Besides, there was never a single measure that allowed us to say that this player was better than that player anyway.
The irony is that baseball is more popular today than ever. As a result, I don't think the public is as bothered by the revelations of steroids as certain members of the media and Congress. It is what it is. It's silly to try and turn back the clock. If you want to rid the game of performance-enhancing drugs, then put a firm policy in place, test, and enforce the damn rules with stiff penalties, including fines, suspensions, and expulsions. Other than getting the MLBPA to agree, it's really not anymore difficult than that.
. . . and now back to our regularly scheduled programming.
| Designated Hitter | January 06, 2008 |
Friends
It's nice to have friends, especially friends one makes during the course of business. It's even nicer if those new friends are celebrities. Take Mike Wallace, for example. At 89, Mr. Wallace has made a lot of celebrity friends during the 40 years he has been a reporter for CBS's "60 Minutes." Not friends like Yassir Arafat, maybe, but friends like George Steinbrenner, the owner of the New York Yankees, of whom Mr. Wallace says, "I like Steinbrenner, he likes me, we became good friends." It was through his friendship with Steinbrenner that Mr. Wallace made friends with one of Steinbrenner's celebrity hirelings, Roger Clemens, of whom Mr. Wallace says, "He became my friend. He trusts me." Which is no doubt why, when Mr. Clemens' name appeared prominently in the Mitchell Report, he turned to Mr. Wallace to help clear his name from accusations by his former trainer, Brian McNamee, that Clemens took steroids and Human Growth Hormone in his late 30s and 40s to enhance his pitching career.
Tonight on "60 Minutes," Mr. Clemens will sit for an interview with Mr. Wallace, because, Mr. Wallace says, "He trusts me." Hopefully, Mr. Wallace can be, as he says, "objective." Tomorrow, according to Rusty Hardin, Mr. Clemens' lawyer, Clemens will submit to questions from a host of reporters, the first time he will speak off-the-cuff so to speak, to a roomful of reporters, some of whom may not be his friends. Previously, Mr. Clemens has denied Mr. McNamee's allegations that he injected Mr. Clemens with steroids and HGH through press releases emitted by his lawyer and his agent, and through a staged video in which Mr. Clemens denies McNamee's allegations directly to a camera.
I had a chance to become friends with Mr. Clemens in 2001, when I interviewed him for a profile in the New York Times Sunday magazine. But, alas, our friendship did not take. Despite the fact that I, like Mr. Wallace, felt I too had been objective in my profile, Mr. Clemens did not concur. In fact, he called me up after the story appeared and berated me over the telephone. When I asked him what he didn't like about the story, he said, "I didn't read it." I responded, "Then how do you know you don't like it?" He said he was told by his "friend," and the co-author of one of Mr. Clemens' books, Peter Gammons, the ESPN-TV analyst, that he should hate it. In fact, Mr. Clemens hated my profile so fervently that he had me banned from the Yankees' clubhouse during the years he remained with the team.
I would later learn that one of the many things Mr. Clemens hated about my profile of him was my description of his fawning relationship at the time with his friend Mr. McNamee, who lived in the pool house of Mr. Clemens' Houston estate. On the first day I interviewed Mr. Clemens in Houston I had dinner with him and Mr. McNamee at the most exclusive steak house in Houston. The bill was for over $400, which I paid. Mr. Clemens said, "I’ll get you tomorrow." The next day he bought me a taco at a Mexican Restaurant. But the point of my profile of Mr. Clemens was less about his parsimoniousness than it was his strange relationship with Mr. McNamee. During the dinner at the steakhouse Mr. Clemens asked Mr. McNamee for his permission to have a steak (McNamee nodded) and a baked potato (McNamee nodded again, but added a caveat, "Only dry."). The same scenario played itself out at the Mexican Restaurant. Clemens pointed to an item on the menu and Mr. McNamee either nodded, or shook his head, no.
During the three days I followed Mr. Clemens around Houston, he seemed like a child beholden to the whims of the sour, suspicious, and taciturn McNamee. It seemed as if Mr. Clemens would not do anything to his body, or ingest anything into it that Mr. McNamee hadn't approved. I found it strange that, at 38, Mr. Clemens still had to have someone dictate his diet and workout regimen down to the minutest detail at this late stage of his illustrious career. In fact, Mr. Clemens' devotion to Mr. McNamee's diet and workout routine seemed almost like a spiritual quest that must not be impeded. When Mr. Clemens and Mr. McNamee went on a long run one day and they came across another runner, lying on the ground, in the throes of a heart attack, they called for help. When Mr. Clemens related that story to me, he ended it by saying, "We were having a good run, too."
I also found it strange that, at 38, Clemens had the energy of a teenager. Clemens' workouts lasted 10 hours a day with only breaks for lunch and dinner. They began at 9 a.m. under McNamee's watchful eyes, with light weight-lifting for an hour, then an hour run, then a trip into Clemens' own personal gym, where he did a few hours of calisthenics, wind sprints, and throwing before going to lunch. After lunch, Clemens and McNamee went to an exclusive Houston men's gym (Clemens told me that President Bush worked out there), where Clemens pedaled a stationary bike for an hour and then performed a heavy weight-lifting routine for another hour. Then after dinner at home, Clemens worked out again until 9 or 10 in the evening.
Just watching Clemens work out over a day exhausted me. I wondered where he found the energy to sustain such a maniacal pace when I, at a similar age 20 years before, had been unable to work out for more than a few hours a day without being drained. At the time I interviewed Clemens, I was training for an amateur body building contest and, like Clemens, I adhered to a strict diet and a strenuous weight-lifting and calisthenics routine. But nothing I did at 41 compared to the 10 hours-a-day routine McNamee put Clemens through.
This brings me by a circuitous route to Tom Seaver, the Hall of Fame pitcher from the 1960s to the 1980s. Now Seaver and I were friends. Not the best of friends. Not intimate friends. Just friends. In the early 70s we lived only a few miles from each other in Connecticut. On the weekends we played one-on-one basketball games against each other at the Greenwich YMCA. They were rough, no-holds-barred games marked by a lot of uncalled fouls, bruises, and bloody noses. I always let Seaver win those games; after all, he was Tom Seaver, but he denies this.
Whenever Seaver pitched badly I'd call him every so often to give him advice.
"Tom, you're throwing too many breaking balls."
"You really think so?"
"Absolutely."
"What the hell do you know?"
Seaver and I had a lot in common. We were both big men in our playing days. Six-one, 200 pounds. We were both pitchers. Bonus babies. Tom signed with the Mets for a $50,000 bonus and I signed with the then Milwaukee Braves in 1959 for a $50,000 bonus. We both threw hard. I threw harder than Seaver, of course, but he will never admit that. He had better control than I did (at least I will admit that). And a longer career. His lasted 20 years. In the major leagues. Mine lasted three years, in the minor leagues. And then out. Back home, at 21, lugging bricks and mortar up a rickety scaffold for a Lithuanian mason.
Over the 40 years of our friendship, I still call Seaver every now and then, mostly to remind him that I threw harder than him. His response is always the same, "In your dreams." My response is always the same. "But I did, Tom, I did!" Then he will say, "Yeah, and between us we won 311 major league games." I say, "Precisely!"
Like Clemens today, Seaver in his day was considered the most dominating pitcher of modern times. He did win 311 games over a 20-year career, and would have won another 50 or so if he had pitched into his mid-40s like Clemens has. But he didn't. He lost his fastball at 38, pitched without it for several more seasons with varying results, and retired. During his career, Seaver, too, was famous for his strict diet and strenuous workout routine. In fact, he was one of the first baseball players to begin lifting weights to enhance his performance. It had been considered taboo, particularly for pitchers, likely to make them feel too muscle-bound and inflexible.
I visited Seaver once at his home in Greenwich, Conn., in the dead of a cold winter. Seaver lives in Calistoga, Calif., today. Seaver took me down into his basement where he had set up a net to catch baseballs. There, with a bucket of balls beside him, and his breath billowing in front of him, Seaver grunted and sweated for 30 minutes as he pitched baseballs into that net.
I was so impressed with his diligence that I asked him why he bothered to throw on such a cold, January day. He gave me a little sideways look as if I'd asked the stupidest question, and said, "Because it's my day to throw."
After the Mitchell Report on the use of performance-enhancing drugs was published, I checked the records of Seaver and Clemens. In his first 12 seasons with the Boston Red Sox, Clemens posted a 192-111 record. In his first 12 years with the Mets, and the Cincinnati Reds, Seaver posted a 219-117 record. Over Seaver's last eight years with the Reds, Red Sox, and Chicago White Sox, he posted a 92-78 record. Over Clemens' last 11 years with the Toronto Blue Jays, Yankees and Houston Astros and then the Yankees again, he posted a 162-73 record, a winning percentage appreciably better than in his younger years.
While Seaver struggled with that declining fastball in the latter stage of his career, Clemens kept throwing hard. Seaver's decline in those final seasons was the normal drop-off for a pitcher who had relied on an exceptional fastball for a good part of his success. Clemens' improved record in his later years was an anomaly for a fastball pitcher. (Knuckleball pitchers like Phil Niekro, and junk ball pitchers like Jamie Moyer have pitched successfully into their 40s because they rely on finesse, not strength.)
A fastball pitcher still throwing in the mid-90s after the age of 40, as Clemens did, is a true rarity, except if his name is Nolan Ryan, who was blessed by God. It goes against the laws of nature, although I suspect that a case can be made that Clemens' incredible late career success could be attributed to the strict diet and fabled workout routine of his former trainer and friend, now his adversary, Brian McNamee. Which I also suspect is the case Clemens will make to his friend, Mr. Wallace, when Mr. Wallace interviews him tonight on "60 Minutes."
Pat Jordan, author of "A False Spring," and "A Nice Tuesday," is a freelance writer. His latest book, "The Best Sports Writing of Pat Jordan" (Persea Books), which features profiles of both Roger Clemens ("Roger Clemens Refuses to Grow Up") and Tom Seaver ("The Best of Friends"), will be released next month.
| Command Post | January 04, 2008 |
Old Man River
Tom Glavine has a reputation for consistently posting a better ERA than his peripheral statistics would otherwise suggest. Glavine's ability to change his approach based on the situation has been covered, and the basic idea is that he nibbles even more than normal in hitter's counts and is willing to allow some walks instead of giving in to hitters by throwing a meatball. Glavine's ability to leverage his walks is noticeable among all pitchers, but some other older pitchers have shown this "ability" as well. Is this nibbling an old-pitcher trait and are there other pitching patterns that old pitchers have compared to younger ones? How does the movement and speed on specific pitches compare across age groups? Where do different generations of pitchers locate their pitches? One year of data isn't going to give a great indication of how pitchers and their pitches age, but this is one step towards answering those questions. I created two groups of pitchers, old (34 years old and older), young (24 years old and younger), and looked at how each group pitched.
Glavine's willingness to sacrifice walks for a decrease in power provided the spark behind this article, so the first thing I wanted to see was if there was any difference in the location of pitches between the age-groups. Overall, there was very little difference between where the two groups located their pitches, but looking at specific situations some differences could be seen. Hitter's counts are times when nibbling would be especially advantageous, and when you compare the two groups of pitchers in hitter's counts, the differences become clearer. The images below are for extreme hitter's counts (3&0, 3&1 and 2&0) and only include fastballs. I included only fastballs because I wanted to see where pitches were located even when the pitcher "gave in" to the hitter's count and threw a fastball.
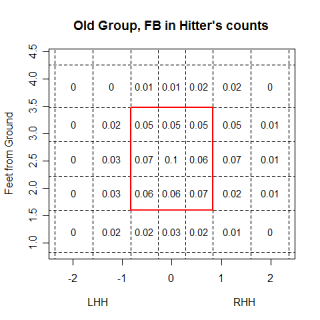 nbsp;
nbsp;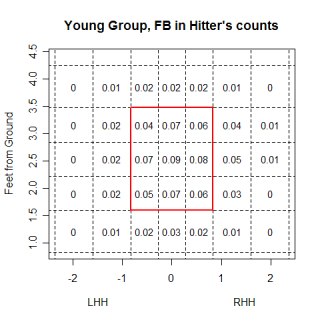
The older pitchers have a higher percentage of fastballs in almost all of the border regions at the edges of the strike-zone. The differences aren't huge in any one area, which is probably more of a result of the fairly large regions used, but the older group appears to be throwing more at the margins. Not surprisingly, older pitchers fared a little worse when balls were put into play, which is one reason they are nibbling more than younger pitchers. Despite the older pitchers throwing fewer pitches in the strike-zone, batters swung at almost the same percentage of pitches from older pitchers as they did for younger pitchers and older pitchers didn't get any more called strikes than younger pitchers.
All FB-Hitter's Counts
Group   BABIP   SLGBIP  Swing%  Called%
Young   0.352   0.664   0.39    0.31
Old     0.372   0.682   0.38    0.31
Looking at all pitches in hitter's counts, it's unclear how much nibbling is going on or how effective it actually is. However, if you just look at pitches thrown within a 4 inch window, centered on the black of both sides of the plate, the picture changes. In these windows, which I think is where the nibbling largely takes place, old pitchers dominate their younger counterparts. Not only do they get a higher percentage of called strikes, but the slugging average on balls in play is almost .200 points lower.
FB within 4 inches of either corner-Hitter's counts
Group   BABIP   SLGBIP  Swing%  Called%
Old     0.263   0.421   0.35    0.37
Young   0.383   0.617   0.35    0.32
If you expand the chart above to cover all pitches in all counts, but still only look at that limited region, the old pitcher advantage almost completely disappears. Older pitchers still get more called strikes, which could be the older pitchers throwing more to the strike-zone as it is called, but the SLGBIP and BABIP values get much closer, with younger pitchers doing a little better overall.
All pitches within 4 inches of either corner-All counts
Group   BABIP   SLGBIP  Swing%  Called%
Old     0.313   0.445   0.47    0.24
Young   0.308   0.439   0.46    0.21
Without a larger sample, I don't think you can make any huge conclusions about the power of nibbling, but there are fundamental differences between the two groups of pitchers. Getting back to the extreme hitter's counts again, the pitchers in the young group threw 79% fastballs in those counts, which is a totally different approach than the pitchers in the older group, who only threw 63% fastballs in those counts. To put those values into some type of perspective, I previously found that in hitter's counts, the amount of fastballs thrown was very dependent on the quality of the hitter, with better hitters seeing fewer fastballs than bad hitters. Hitters with a SLG above .550 saw roughly 61% fastballs, while those with a SLG below .350 saw 74% fastballs. My older group was pitching to every hitter like they were facing Albert Pujols while the younger group was pitching to everyone like they were facing Willie Bloomquist. In pitcher's counts, both groups of pitchers threw roughly the same amount of fastballs, which is also what happened with different calibers of hitters as well. Both Pujols and Bloomquist saw the same amount of fastballs when they were in a pitcher's count.
The differences in how the groups pitched is at least partially due to differences in the repertoire of the groups. The table below shows the frequency that they threw each pitch, with the big difference being the amount of time they threw fastballs. This is in all counts, not just hitter's counts, but the older pitchers still are more cautious throwing their fastballs than the younger ones are.
Group   FB%    CH%    CB%    CT%    SL%
Old     0.50   0.17   0.08   0.07   0.18
Young   0.58   0.13   0.10   0.04   0.15
One reason for this could be the quality of the pitch. The table below shows the average values for fastballs for each group, (the pfx values are the average of the absolute values to put LHP and RHP on the same scale), and the average fastball for the older pitchers is slower, probably making it a little easier to hit. Another interesting tidbit from this table is that the older group has less vertical drop on their curveball.
Group   FB-spd  FB-pfx  FB-pfz | CB-spd  CB-pfx  CB-pfz | CH-spd CH-pfx  CH-pfz
Old     89.9    6.43    9.02   | 75.3    5.13   -3.84   | 81.5   6.67    5.89
Young   92.1    5.57    9.43   | 77.0    5.63   -4.60   | 82.6   6.38    6.32
It would be interesting to see if there was a steady decrease in velocity or movement as a pitcher gets older, but the biggest problem with having just one year worth of data is that there is no good way to compare a player to himself at a younger age. Dividing them by age is a good start, but I'm really comparing two groups of pitchers, one group made up of players who have survived 10+ years in the major leagues (and possess certain traits that let them survive) and another group that is made up of some players with those traits (who will eventually make it into the old group) and some without those traits. When comparing the groups, I can't say that younger pitchers have certain traits, but rather that the younger group in my sample have certain traits.
This selection bias is going to be present in any study that looks at aging (only the players who do well will survive to be included in subsequent samples), but I think that the pitch f/x data is well suited to minimize the problem. If a certain number of pitches (say 100) is enough to establish how a pitch moves, the prior success needed for a pitcher to throw that many pitches in the future is much lower than the prior success needed to throw enough innings to show a realistic portrayal of skill as a pitcher ages. This won't eliminate the problem but in certain cases it could help minimize it.
| Change-Up | January 03, 2008 |
The Outsiders
For this column I had considered comparing the best of those on the outside looking into Cooperstown to the bottom players enshrined in the Baseball Hall of Fame. I soon realized that would be a useless exercise, however, as most everyone agrees that "better than the worst" should not be the standard. If everyone better than Rick Ferrell is to be enshrined, Cooperstown may have to invade Bowerstown, Toddsville, Hartwick and Middlefield just to make room.
Instead I decided I would just assemble a lineup of the best not in the Hall and let readers determine for themselves if any of these eight are Hall-worthy. Either this weekend or next week, maybe I will turn my attention to the pitchers but for now it's the position players. Readers of this site already have a pretty good sense of who the most glaring omissions are amongst the hurlers.
So without further ado, here is my All-Overlooked starting eight.
==========
Catcher
Ted Simmons - .285/.348/.437 - 117 OPS+ | 95.3 WARP3
Simmons played 19 seasons, was rarely injured and as his B-Ref page sponsor notes, he "had more RBIs than Bench, more runs than Carter, more hits than Berra or Fisk."
Hard to say it much better than that.
First Base
Will Clark - .303/.384/.497 - 137OPS+ | 105.2 WARP3
Clark's peak was tremendous, and there is little doubt that toiling for the better part of his career in Candlestick Park hampered the general public's appreciation for him. A terrific gloveman, Bill James famously ranked Clark among the best first baseman in baseball history in The New Bill James Historical Baseball Abstract. A Hall with Orlando Cepeda, Jim Bottomley and Tony Perez ought to be able to make some room for Clark.
Second Base
Bobby Grich - .266/.371/.424 - 125 OPS+ | 121.1 WARP3
Grich won four gold gloves, finished in the top-10 for bases on balls in a season six times (he was hit by a ton of pitches too) but failed to live up to the electorate's standards in the team-dependent numbers like runs or RBI. I would love to know why, say, Bobby Doerr has a better case than Grich.
He edged Lou Whitaker for this slot, whom Rich has convinced me should also be enshrined.
Third Base
Dick Allen - .292/.378/.534 - 156 OPS+ | 92.8 WARP3
Allen's shoddy defensive work over the course of his career harmed his candidacy but it is tough to imagine a hitter of Allen's greatness on the Cooperstown outs. His career OPS+ number is greater than Hank Aaron's.
Shortstop
Alan Trammell - .285/.352/.415 - 110 OPS+ | 129.4 WARP3
Trammell should be such a lock, yet he probably will not get in again. There is a tier of middle infielder that the electorate seems to overlook, whose offense does not stack up to the HOF position players further to the right of the defensive spectrum and whose defense does not stack up (at least in reputation) to their peers at their own positions. Think Trammell and Luis Aparicio, and Grich versus Bill Mazeroski.
This should be addressed.
Left Field
Tim Raines - .294/.385/.425 - 123 OPS+ | 123.9 WARP3
I would say Rich tackled this one pretty thoroughly last week.
Center Field
Andre Dawson - .279/.323/.482 - 119 OPS+ | 105.3 WARP3
I have come around on Dawson. His superior defensive work as a center fielder early in his career combined with his exceptional power numbers overcome his crummy on-base. Without injuries, I have a feeling his case would be a real slam dunk.
Right Field
Dwight Evans - .272/.370/.472 - 127 OPS+ | 120.2 WARP3
He was every bit the offensive force Jim Rice was, he played longer and won eight gold gloves. I addressed Evans's case in my first Change-Up column here at Baseball Analysts.
==========
So have at it. Tell me why those eight do not belong in the Hall, and which position players you think are more glaring omissions.
Edit: For Will Clark/Bill James ranking accuracy
==========
Update (01/04/08): Rob Neyer disagrees with me on Clark (he would put Keith Hernandez ahead of him), thinks Santo belongs ahead of Allen and Murphy ahead of Dawson.
As far as first base goes, a vote for Hernandez ahead of Clark places a whole lot of faith in the superiority of the mustached man's glove. Clark has him comfortably on the OPS+ front, and notched just a few less plate appearances over the course of his career. Maybe Keith really was that good a fielder but to my eye Clark looks like the superior option.
The Santo over Allen argument is all about fielding and longevity. Allen was a way better hitter (156 OPS+ vs. 125) but Santo has five gold gloves and about three full seasons worth of plate appearances over Santo. Still, I am comfy with my choice.
Murphy over Dawson is fair, but here is why I favor The Hawk. He and Murphy had similarly awesome peaks, but Dawson's was ended by a stroke of utter misfortune - his horrible knee injury on that Montreal turf. Murphy just kinda faded.
| Change-Up | January 02, 2008 |
Houston Signs a "Professional Baseball Player"
There's a new sheriff in town in Houston and he plans on winning. Now.
Ed Wade has traded for Miguel Tejada, and acquired Kazuo Matsui. He has supplemented his new 32 year-old middle infield with another veteran, 34 year-old center fielder, Darin Erstad. He has made other moves as well, but I want to focus on the Erstad signing. From the Houston Astros press release:
Erstad, 33, hit .248 (77-for-310) with four home runs and 32 RBI in 87 games for the Chicago White Sox in 2007. Including 11 seasons with the Los Angeles Angels of Anaheim from 1996-2006, he has hit .284 (1582-for-5568) with 118 home runs, 657 runs batted in, and 292 doubles in 1,407 Major League games.
Can you imagine a more insipid, uninspiring way to rally the fans than to reel off meaningless counting stats amassed over the time frame referenced? Let's even forget about Erstad for a moment. Could a passage do a better job of highlighting the insignificance of counting statistics without context? I am not even talking about park effects or replacement level for a given year. How about just some indication of how he stacked up against his competition? Oh, he has hit 118 home runs in 11 seasons? Why didn't you tell me? 657 RBI? .284? Sheesh, sign him up!
Of course a presser put out by the acquiring team wants to paint the signing in the most favorable light. When a transaction lacking justification grounded in any sort of reason whatsoever occurs, you will often read and hear quotes about intangibles and counting stats. You cannot refute either and as such, the very items designed to evidence the rationale for the acquisition in actuality tell you very little about the incoming player. From the same piece:
"Darin is one of the prototypical professional baseball players," said Wade. "He's made a career out of playing the game the right way. Darin is a veteran who brings a lot to our club and will really help us."
In case you did not know by now, Ed Wade and I diverge on how we think of the "prototypical professional baseball players." In my view, a professional baseball prototype should have the ability to play professional baseball. Someone who plays the game the "right way" ought to have some baseline level of competence.
For seven seasons now, we have seen little evidence that Darin Erstad can play Major League Baseball as a regular without severely hampering his teams' ability to win games. His defensive contributions notwithstanding, and they have been significant over the years, Erstad has had no business in a Big League starting lineup since the 2000 campaign. To wit, here are the worst five outfielders in terms of OPS+ since the start of the 2001 season (3,000 minimum plate appearances):
                AVG   OBP   SLG  OPS+
D. Erstad      .270  .323  .369   83
C. Patterson   .260  .299  .415   84
J. Pierre      .301  .348  .376   86
J. Payton      .279  .324  .430   95
J. Encarnacion .267  .317  .436   97
Over the same period, and with the same minimum amount of appearances applied once again, here are the bottom five run creating outfielders since 2001:
               RC    PA
D. Erstad      375   3,314
J. Gibbons     384   3,035
C. Patterson   394   3,289
P. Wilson      409   3,159
J. Guillen     436   3,095
Picking on such low-hanging fruit is not especially gratifying but criminally egregious transactions of this nature that are justified by the team with the nonsense Houston has floated out there deserve to be highlighted. The incentive-filled $1 million guaranteed contract that Houston has furnished Erstad is one of the very worst signings in recent memory. In a desperate, flailing attempt at competing now, Houston continues to dig its own grave.