Rich Lederer • Baseball Beat
Patrick Sullivan • Change-Up
Jeremy Greenhouse • Touching Bases
Dave Allen • F/X Visualizations
Sky Andrecheck • Behind the Scoreboard
Marc Hulet • Around the Minors
Al Doyle • Past Times
Retired Uniforms:
Bryan Smith • WTNY
Joe Sheehan • Command Post
Jeff Albert • The Batter's Eye
RSS Feed
Home
*Examining the Past, Present, and Future*
Lineup Card
Recent Entries
» Putting Together a Reality Team
» Historical Hall of Fame Vote Comparisons: 2012
» An All-Christmas Team
» The New-Look Angels
» John Denny: The Forgotten Cy Young Award Winner
» Money Isn't Everything
» What Would It Take to Hit .400 in the 21st Century?
» Halos Heaven
» Brandon McCarthy's Breakout Season
» Link-o-Rama
» Historical Hall of Fame Vote Comparisons: 2012
» An All-Christmas Team
» The New-Look Angels
» John Denny: The Forgotten Cy Young Award Winner
» Money Isn't Everything
» What Would It Take to Hit .400 in the 21st Century?
» Halos Heaven
» Brandon McCarthy's Breakout Season
» Link-o-Rama
Best of Baseball Beat
Abstracts From the Abstracts
1977 Baseball Abstract
1978 Baseball Abstract
1979 Baseball Abstract
1980 Baseball Abstract
1981 Baseball Abstract
1982 Baseball Abstract
1983 Baseball Abstract
1984 Baseball Abstract
1985 Baseball Abstract
1986 Baseball Abstract
1987 Baseball Abstract
1988 Baseball Abstract
1978 Baseball Abstract
1979 Baseball Abstract
1980 Baseball Abstract
1981 Baseball Abstract
1982 Baseball Abstract
1983 Baseball Abstract
1984 Baseball Abstract
1985 Baseball Abstract
1986 Baseball Abstract
1987 Baseball Abstract
1988 Baseball Abstract
Bert Blyleven Series
Meeting Up and Hanging Out with Bert
The Results Are In And...
Aficionado Heavily Invested in Blyleven
Latest on Blyleven's Chances for the HOF
The Internet Zealot Responds
400 Down and 5 to Go...
Bert Be Home By Eleven?
Blyleven's Forgotten Season (1973)
HeyMan, Your Comments Don't Hold Water
The Waiting is the Hardest Part
Another Addition to the Blyleven Series
Search for the Truth
As Dominant as His HOF Contemporaries
Listen, Buster
A Larger Step for Blyleven
Answering the Naysayers (Part Two)
Another Small Step for Blyleven
Q&A: Blyleven on the Twins
The Majority Rules, Right?
It's All Dutch to Some
The Hall of Fame Case for Bert Blyleven
Q&A: Blyleven on Felix Hernandez
Clemens Rocketing Up Charts
Poz: An Interview With a KC Star
A HOF Chat with Tracy Ringolsby
Up Close and Personal
A Peek Into the Mind of a HOF Voter
Answering the Naysayers
It's That Time of the Year (Again)
"If Cooperstown is Calling..."
The Bert Alert
One Small Step for Blyleven...
Only the Lonely
Exclusive Interviews
Lee Sinins
Alex Belth
David Pinto
Will Carroll
Mike Carminati
Aaron Gleeman
Joe Sheehan
Jay Jaffe
Jeff Peek
Tracy Ringolsby
Joe Posnanski
Bill James Part I, II, III
Jon Lalonde
Chuck Tiffany
Dayn Perry
Fay Vincent
Nate Silver
Alex Belth
David Pinto
Will Carroll
Mike Carminati
Aaron Gleeman
Joe Sheehan
Jay Jaffe
Jeff Peek
Tracy Ringolsby
Joe Posnanski
Bill James Part I, II, III
Jon Lalonde
Chuck Tiffany
Dayn Perry
Fay Vincent
Nate Silver
Bullpen
Rich Lederer
The Odd Couple (with Alex Belth)
The MostUnder Over Underrated Player in Baseball (with Brian Gunn)
Three Wise Men (roundtable by Alex Belth)
Infrequently Asked Questions (interview with Matt Welch)
Interview (Orioles Think Tank)
Bernie and the Yanks (Bronx Banter)
Hope and Faith: How the LAA Win the World Series (Baseball Prospectus)
NL West (The Soul of Baseball)
Greatest Living Hitter? (Sports Illustrated)
Roundtable: 2008 HOF Ballot (Armchair GM)
The Most
Three Wise Men (roundtable by Alex Belth)
Infrequently Asked Questions (interview with Matt Welch)
Interview (Orioles Think Tank)
Bernie and the Yanks (Bronx Banter)
Hope and Faith: How the LAA Win the World Series (Baseball Prospectus)
NL West (The Soul of Baseball)
Greatest Living Hitter? (Sports Illustrated)
Roundtable: 2008 HOF Ballot (Armchair GM)
Patrick Sullivan
Designated Hitters
David Bromberg (Q&A: John Denny)
Mark Armour (H. Killebrew and Versatility)
Joe Lederer (Soundtrack of a Prospect)
David Bromberg (Clemente's Autograph)
David Bromberg (Woody Fryman)
D. Baumstein (WAR Against Age: Pitchers)
Doug Baumstein (The WAR Against Age)
Doug Baumstein (A Lifetime on the Road)
John Fraser (Pick Six)
Mark Armour (How to Score More Runs?)
Bill Parker (What Opening Day Tells Us)
Stan Opdyke (Pat Rispole)
Chris Jaffe (Evaluating Baseball's Mgrs)
Stan Opdyke (Baseball Radio in NYC, 1953)
A. Nathan (Performance of Baseball Bats)
Michael Weddell (Edgar Martinez/HOF)
Jon Weisman (100 Things Dodgers Fans...)
Stan Opdyke (Connie Mack and Vin Scully)
Eric Walker (Evaluating Run Production)
Brent Mayne (The Intangibles of Catching)
Chris Moore (Best Fastballs in Baseball)
Dave Baldwin (The Batter’s Brain)
Shawn Haviland (Ivy League to MLB)
Larry Granillo (Walking Off)
Rob Iracane (Solo HR Won't Break You)
Tommy Bennett (Charm of AM Radio)
Harry Pavlidis (Johan Santana's Fast Start)
John Walsh (WAR and Remembrance)
Eric Walker (Precisely Inaccurate)
Bob Timmermann (As They See 'Em)
Geoff Young (Unicycles and Delusions)
Baseball Analysis at Tufts (Groundballers)
Baseball Analysis at Tufts (GB Out Rates)
G. Rybarczyk ('09 Hit Tracker Projections)
Joe Lederer (Curt Schilling/HoF)
Conor Gallagher (Hall of Fallacies)
Chris Green (Jim Rice, HoF, the Numbers)
Shawn Hoffman (Baseball's Bear Mkt?)
Paul Anthony (Manny Syndrome)
Ross Roley (World Series Odds)
B. Timmermann (Catcher's Interference)
R.J. Anderson (Waiting the Hardest Part)
Maury Brown (Cubs, MLB, and Cuban...)
Myron Logan (Dee-Fense, Dee-Fense)
Craig Calcaterra (Frivolity, Part I, Part II)
Chad Finn (Ode to Baseball Cards)
David Cameron (Mariners Foibles)
Chris Dial (Chipper Jones)
Pat Lederer (Memory Lane)
David Appelman (Clutch Pitching)
Bob Rittner (DH)
Jonathan Mayo (Roger Clemens)
Lisa Winston (My Son-in-Law...)
Russ McQueen (The Yellow Hammer)
Bob Rittner (I'm OK, You're OK)
Mark Armour (In Defense of the HOF)
Pat Jordan (Friends)
Dan Levitt (Analysis of Terry Ryan)
Doug Baumstein (Trading Econ 101)
Ross Roley (Runner's Reluctance II)
Ross Roley (Runner's Reluctance I)
Mark Armour (No-Longer Lovable Sox)
Bruce Regal (Stealthy and Wise)
Brian Gunn (Roid Monster)
Current/McEvoy (Value of the SB)
John Rickert (Sinister Thefts)
Nate Silver (Sabermetrics)
David Vincent (Home Run Production)
Joe P. Sheehan (Enhanced Gameday II)
Mark Armour (An Ode to Sport)
David Gassko (All-Time Worm Burners)
Joe P. Sheehan (Enhanced Gameday)
John Walsh (When Titans Clash)
Fox/Williams (Quantifying Coaches II)
Fox/Williams (Quantifying Coaches I)
Jacob Luft (Bull Durham Rant)
Chad Finn (Strat-O-Matic)
Lisa Winston (Rotisserie Baseball)
Dave Studeman (Baseball Stats)
Steve Treder (Roger Craig)
Marc Normandin (Jeff Bagwell)
D. Appelman (Expanding Strike Zone)
Jeff Sackmann (Worst MiL Defenders)
Jeff Sackmann (Best MiL Defenders)
Maxwell Kates (Van Lingle Mungo)
David Appelman (Pitch Location)
Kent Bonham (Danny Ray Herrera)
Glenn Stout (Two Baseball Poems)
Bruce Regal (The Challenge Round)
Mark Lamster (Barry & Ty)
Geoff Young (NL West)
Tom Lederer (The Ryan Express)
Brian Erts (Great Leap Forward)
David Pinto (Parity and the N.L.)
Jacob Luft (Fathers and Daughters)
Jamey Newberg (Pete's Sake)
Jeff Albert (A. Jones Swing Analysis)
Jeff Albert (A-Rod Swing Analysis)
Keith Law (Death, Taxes, and Waivers)
Peter Abraham (Tales of Torre Tales)
Larry Borowsky (Let 'er Rip II)
Dan Levitt (Empirical Analysis of Bunting)
Jonah Keri (If I Met Warren Cromartie...)
Bob Klapisch (War Stories)
Bob Timmermann (John F. Kennedy HS)
Kent Bonham (Aluminum Adjustments)
Al Doyle (More Than Superstars)
Ross Roley (Instant Replay)
David Vincent (Barry Bonds Homers)
Chad Finn (Our Favorite Obscurities)
Bill Deane (1979 NL MVP)
Mark Armour (Rise/Fall of Artificial Turf)
Jeff Angus (Wally Moon Camp)
David Berri (Money and Baseball)
Larry Borowsky (Baseball w/o the #s)
Derek Zumsteg (The Irrational Market)
David Regan (Free Agent Contracts)
Peter Schmuck (Steroids and the HOF)
David Appelman (Pitchers, Pitch by Pitch)
Dan Fox (Swinging, Taking, Fouling, Etc)
Patrick Sullivan (Study of NYY CF/BOS LF)
Will Leitch (Baseball Journalism)
Jeff Sullivan (Pitcher Release Points)
Steve Treder ('69-'70 Giants)
Maury Brown (Charlie Finley)
John Brattain (Bob Johnson)
Bob Klapisch (The Case for Bert Blyleven)
Jeff Peek (Pride and Prejudice)
Dayn Perry (Bert and Warren)
Rob Neyer (If Don Sutton Was Great...)
Lisa Winston (Minor League Memories)
Alex Belth (Otis Redding Was Right)
David Cameron (Long Live the King)
Jeff Angus (Baserunning Study)
Bert Blyleven (Baseball Playoffs)
Boyd Nation (Not a Prospect List)
James Click (Batters-Baserunners Study)
Jeff Shaw (Why I Love Baseball)
David Gassko (BIP/BFP Fielding Study)
Jay Jaffe (Milwaukee Sausage Race)
Jamey Newberg (Remember When)
Bob Klapisch (Press Box to the Mound)
Dan Levitt (Predictive Value of BB)
David Vincent (Official Scorer)
Jon Weisman (Rick Monday)
Larry Borowsky (Let 'er Rip)
Will Carroll (Fictional Short Story)
Bob Timmermann (Japanese Baseball)
Cyril Morong (Best Pitching Seasons)
Sean Forman (Monte Carlo Win-Loss)
Brian Gunn (My Little Blue Book)
Joe Lederer (My Dad and Baseball)
Bill Deane (Bob Gibson, 1968)
Mark Armour (1977 Yankees)
Darren Viola (Retrosheet)
David Pinto (RFK)
Dayn Perry (Brave Heart)
Matt Welch (Dave Hansen)
Kevin Kernan (Jack McKeon)
Tom Lederer (Dodgers Road Trip)
Steve Lombardi (Slider)
Studes (Picturing Baseball)
Mike Carminati (Luck of the Drawl)
Eric Neel (Vin Scully)
J.C. Bradbury (Leo Mazzone)
John Sickels (Bill James)
Search Baseball Analysts
Archives
By Category:
Around the Majors Content Only
Around the Minors Content Only
Baseball Beat Content Only
Baseball Beat/Change-Up Content Only
Baseball Beat/WTNY Content Only
Behind the Scoreboard Content Only
Change-Up Content Only
Change-Up/Around the Majors Content Only
Command Post Content Only
Crunching the Numbers Content Only
Designated Hitter Content Only
F/X Visualizations Content Only
Past Times Content Only
Saber Talk Content Only
The Batter's Eye Content Only
Touching Bases Content Only
Weekend Blog Content Only
WTNY Content Only
By Month:
February 2012
January 2012
December 2011
October 2011
September 2011
August 2011
July 2011
June 2011
May 2011
April 2011
March 2011
February 2011
January 2011
December 2010
November 2010
October 2010
September 2010
August 2010
July 2010
June 2010
May 2010
April 2010
March 2010
February 2010
January 2010
December 2009
November 2009
October 2009
September 2009
August 2009
July 2009
June 2009
May 2009
April 2009
March 2009
February 2009
January 2009
December 2008
November 2008
October 2008
September 2008
August 2008
July 2008
June 2008
May 2008
April 2008
March 2008
February 2008
January 2008
December 2007
November 2007
October 2007
September 2007
August 2007
July 2007
June 2007
May 2007
April 2007
March 2007
February 2007
January 2007
December 2006
November 2006
October 2006
September 2006
August 2006
July 2006
June 2006
May 2006
April 2006
March 2006
February 2006
January 2006
December 2005
November 2005
October 2005
September 2005
August 2005
July 2005
June 2005
May 2005
April 2005
March 2005
February 2005
January 2005
December 2004
November 2004
October 2004
September 2004
August 2004
July 2004
June 2004
May 2004
April 2004
March 2004
February 2004
January 2004
December 2003
November 2003
October 2003
September 2003
August 2003
July 2003
June 2003
Reference
Organizational Stats
Arizona Diamondbacks Bat / Pitch
Atlanta Braves Bat / Pitch
Baltimore Orioles Bat / Pitch
Boston Red Sox Bat / Pitch
Chicago Cubs Bat / Pitch
Chicago White Sox Bat / Pitch
Cincinnati Reds Bat / Pitch
Cleveland Indians Bat / Pitch
Colorado Rockies Bat / Pitch
Detroit Tigers Bat / Pitch
Florida Marlins Bat / Pitch
Houston Astros Bat / Pitch
Kansas City Royals Bat / Pitch
Los Angeles Angels Bat / Pitch
Los Angeles Dodgers Bat / Pitch
Milwaukee Brewers Bat / Pitch
Minnesota Twins Bat / Pitch
New York Mets Bat / Pitch
New York Yankees Bat / Pitch
Oakland Athletics Bat / Pitch
Philadelphia Phillies Bat / Pitch
Pittsburgh Pirates Bat / Pitch
St. Louis Cardinals Bat / Pitch
San Diego Padres Bat / Pitch
San Francisco Giants Bat / Pitch
Seattle Mariners Bat / Pitch
Tampa Bay Devil Rays Bat / Pitch
Texas Rangers Bat / Pitch
Toronto Blue Jays Bat / Pitch
Washington Nationals Bat / Pitch
All-Star Links
Official Websites
News and Notes
Baseball News Blog
Baseball Newstand
ESPN Baseball
Fox Sports Baseball
Pro Sports Daily
Roto World
The Roto Times
USA Today Baseball
Baseball Newstand
ESPN Baseball
Fox Sports Baseball
Pro Sports Daily
Roto World
The Roto Times
USA Today Baseball
Reference and Analysis
Baseball Almanac
Baseball America
Baseball Archive
Baseball Contracts
Baseball Cube
Baseball Graphs
Baseball Library
Baseball Musings Player Database
Baseball Page
Baseball Primer
Baseball Prospectus
Baseball Reference
Baseball Statistics
Baseball Truth
Boxscore Central
Diamond Mind Baseball
Doug's Stats
FanGraphs
Fast Balls (pitchfx catalog)
Hardball Dollars
Hardball Times
Hit Tracker
Retrosheet
Rotobase/Rotoblog
Stat Corner
STATS
Tango on Baseball
Yahoo Sports MLB
Web Gems
Bill James Primer
Sabermetric Manifesto (Grabiner)
Pitching and Defense (McCracken)
Pitching and Defense (Tippett)
Transactions Primer (Neyer)
Baseball Stats (Batter's Box)
Prospect Report (Cameron)
Pitcher Workloads (Sheehan)
Goodbye to Old Baseball Ideas (Rickey)
Sabermetric Manifesto (Grabiner)
Pitching and Defense (McCracken)
Pitching and Defense (Tippett)
Transactions Primer (Neyer)
Baseball Stats (Batter's Box)
Prospect Report (Cameron)
Pitcher Workloads (Sheehan)
Goodbye to Old Baseball Ideas (Rickey)
Columnists
Baseball Blogs
Around the Majors
Athletics Nation
Baseball Crank
Baseball Musings
Baseball-Reference Blog
Batter's Box
Big League Stew
Bronx Banter
Catfish Stew
Cub Town
Dan Agonistes
Dodger Thoughts
DRays Bay
Ducksnorts
Futility Infielder
Halos Heaven
Inside the Rockies
It Might Be Dangerous
Knuckle Curve
LoHud Yankees Blog
Lookout Landing
Management by Baseball
Metaforian
Metsgeek
Mike's Baseball Rants
Only Baseball Matters
Redbird Nation
Red Reporter
Sabernomics (Braves)
Seth Speaks
ShysterBall
6-4-2 (Angels/Dodgers)
The Book
TheCubdom
The Cutting Edge
The House That Dewey Built
The View From The Bleachers
Tiger Blog
U.S.S. Mariner
Viva El Birdos
Where's Kernan
Minor Leagues
Arizona Fall League
BA Player Finder
Cal Leaguers
Jamey Newberg
JDM's Scoresheet Baseball
Minor League Baseball
Minor League Park Factors
Minor League Splits
No Pepper
Sickels' Minor League Ball
Warm October Nights
BA Player Finder
Cal Leaguers
Jamey Newberg
JDM's Scoresheet Baseball
Minor League Baseball
Minor League Park Factors
Minor League Splits
No Pepper
Sickels' Minor League Ball
Warm October Nights
Amateur
Boyd's World (College)
Cape Cod Baseball League
College Baseball Blog
College Baseball Insider
Collegiate Baseball Newspaper
College Splits
College Splits Blog
Dirtbags Baseball (Long Beach State)
NCAA Baseball
NCBWA
Team One Baseball (High School)
Texas A&M & Baseball
Cape Cod Baseball League
College Baseball Blog
College Baseball Insider
Collegiate Baseball Newspaper
College Splits
College Splits Blog
Dirtbags Baseball (Long Beach State)
NCAA Baseball
NCBWA
Team One Baseball (High School)
Texas A&M & Baseball
Historical
Cuban Baseball
House of David
Jim "Mudcat" Grant's Web Page
Negro League Baseball Players Assoc
Negro Leagues Baseball Museum
1919 Black Sox
Pacific Coast League
Philadelphia Athletics Historical Society
Shoeless Joe Jackson Society
SABR-L Archives
Walter O'Malley
House of David
Jim "Mudcat" Grant's Web Page
Negro League Baseball Players Assoc
Negro Leagues Baseball Museum
1919 Black Sox
Pacific Coast League
Philadelphia Athletics Historical Society
Shoeless Joe Jackson Society
SABR-L Archives
Walter O'Malley
Miscellaneous
Forums
Credits
Ticket Center
Tickets to Baseball -
Premium Red Sox Tickets - Tickets to Marlins Games - Cardinals Game Tickets - NY Yankee Tickets - Tickets Oakland Athletics - Dallas Cowboys Tickets - Arizona Cardinals Tickets - Tickets Seattle Seahawks - Buffalo Bills Tickets Online - Tickets to Dolphins Football
Buy Boston Red Sox tickets,
Philadelphia Phillies tix,
NY Yankees tickets,
NY Mets tickets, and
MLB All Star game tickets at ABC tickets
Not sure where to find the best online sportsbooks? Start your search with PlayersJet.
Get deals at SportsMemorabilia.com on baseball apparel, including Phillies jerseys and more for adults and children.
Shop the largest selection baseball equipment on sale at Sports Unlimited. Check out tons of baseball gloves, youth baseball gloves and catchers gear from Rawlings, Wilson, Nike & Under Armour.
2011 Draft Order
Courtesy of Baseball America
First-Round:
 1. Pirates (57-105)
 2. Mariners (61-101)
 3. Diamondbacks (65-97)
 4. Orioles (66-96)
 5. Royals (67-95)
 6. Nationals (69-93)
 7. Diamondbacks (for B. Loux)
 8. Indians (69-93)
 9. Cubs (75-87)
10. Padres (for Karsten Whitson)
11. Astros (76-86)
12. Brewers (77-85)
13. Mets (79-83)
14. Marlins (80-82)
15. Brewers (for Dylan Covey)
16. Dodgers (80-82)
17. Angels (80-82)
18. Athletics (81-81)
19. Red Sox (from DET for Martinez)
20. Rockies (83-79)
21. Blue Jays (85-77)
22. Cardinals (86-76)
23. Nationals (from CWS for Dunn)
24. Rays (from BOS for Crawford)
25. Padres (90-72)
26. Red Sox (from TEX for Beltre)
27. Reds (91-71)
28. Braves (91-71)
29. Giants (92-70)
30. Twins (94-68)
31. Rays (from NYY for Soriano)
32. Rays (96-66)
33. Rangers (from PHI for Lee)
Supplemental First Round:
34. Nationals (Dunn)
35. Blue Jays (Downs)
36. Red Sox (Martinez)
37. Rangers (Lee)
38. Rays (Crawford)
39. Phillies (Werth)
40. Red Sox (Beltre)
41. Rays (Soriano)
42. Rays (Balfour)
43. Diamondbacks (LaRoche)
44. Mets (Feliciano)
45. Rockies (Dotel)
46. Blue Jays (Buck)
47. White Sox (Putz)
48. Padres (Garland)
49. Giants (Uribe)
50. Twins (Hudson)
51. Yankees (Vazquez)
52. Rays (Benoit)
53. Blue Jays (Olivo)
54. Padres (Torrealba)
55. Twins (Crain)
56. Rays (Choate)
57. Blue Jays (Gregg)
58. Padres (Correia)
59. Rays (Hawpe)
| F/X Visualizations | April 29, 2009 |
Looking Back at Burrell's Defense
I mentioned a couple of weeks ago how this offseason teams placed a greater emphasis on defense, and particularly outfield defense. Some teams went out of their way to create power-house outfield defenses, and on the other hand poor-fielding outfielders got much smaller contracts than expected. I have already checked in with an example of the former, now I want to look back at an example of the latter.
From 2005 to 2008 Pat Burrell cost the Phillies about 48 runs with his defense in left field--costing them almost 5 wins. I wanted to see if we could visualize this defensive ineptitude. I employed the run value by field location technique I first introduced here. This time I took all balls in play at Citizens Bank Park split up by when the Phillies were in the field and when the visitors were in the field. That way you can compare the defense of the Phillies's left fielders from 2005 to 2008 (mostly Pat Burrell) to all visiting left fielders in that time.
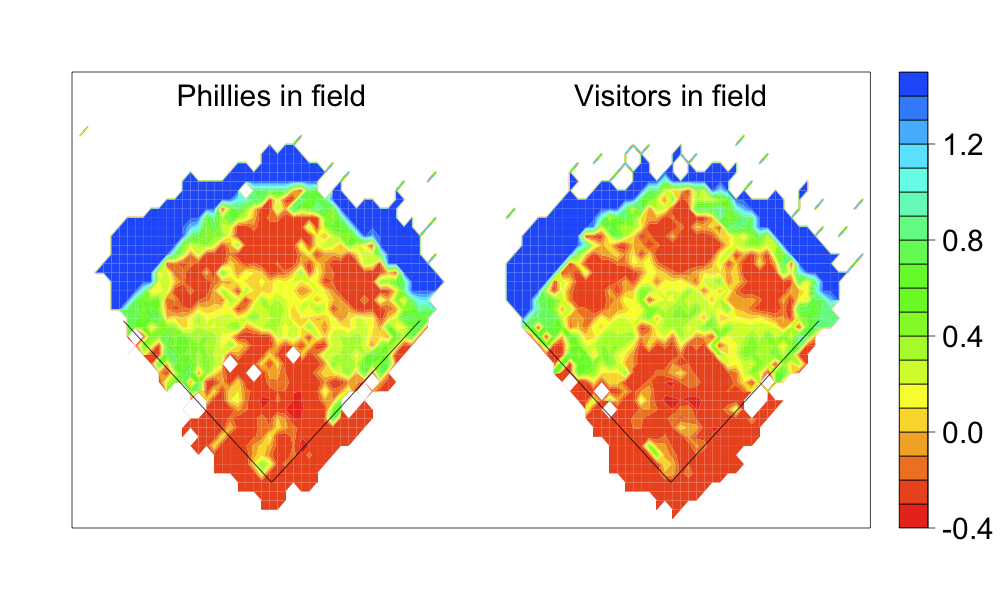
I had hoped that the results would be more dramatic, but you can definitely see that the red blob for the Phillies is smaller than the blob for the visitors. In addition there is much more deep green in left field for the Phillies than for the visitors. Good thing Burrell is now predominately a DH, too bad the Phillies replaced him with Raul Ibanez.
EDIT: In the comments LarryinLA suggested graphing the difference between the two images as a better way of displaying the information. In the image below positive areas (blue) are where the Phillies' defensive did better than the visitor's defense, and negative (red) where the Phillies' did worse.
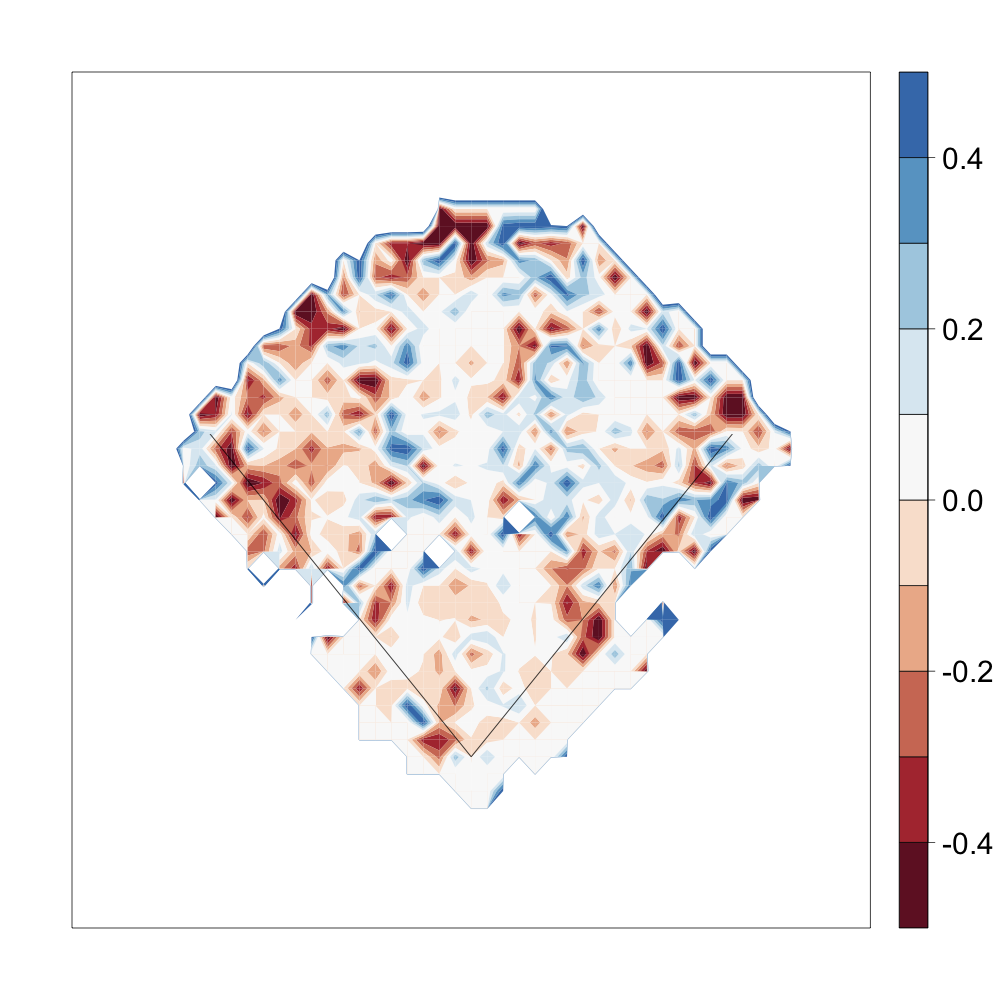
I think this shows the difference even better. It looks like Burrell was particularly bad on balls hit down the foul line.
| F/X Visualizations | April 27, 2009 |
Best Pitches of the Year So Far
After the 2007 season John Walsh looked at the best pitches of each type for 2007. For example, that year Heath Bell had the best fastball. For every 100 fastballs he threw the opposing team scored 2.7 runs less than expected. For this quick post I wanted to check in on pitchers so far this year and see who had the best of each pitch type. Like John I am going to measure a pitch by its run value (in the link John has a great description of the run value of pitch).
+-----------------------+--------+-------------------+
| Four-Seam Fastball    | Number | Run Value per 100 |
+-----------------------+--------+-------------------+
| David Aardsma	        |    101 |              -4.6 |
| Jonathan Broxton      |     89 |              -4.3 |
| Brian Stokes          |     75 |              -4.2 |
| Frank Francisco       |     76 |              -4.1 |
| Dan Haren             |    201 |              -4.1 |
+-----------------------+--------+-------------------+
It is incredible that over twice as many pitches and as a starter Dan Haren's four-seam fastball is right up there with those of four hard throwing relievers. Heath Bell's fastball is still very good checking in at 9th on this list.
+-----------------------+--------+-------------------+
| Two-Seam/Sinker       | Number | Run Value per 100 |
+-----------------------+--------+-------------------+
| Derek Lowe	        |     44 |              -7.8 |
| Josh Beckett          |     32 |              -7.8 |
| Jamie Shields         |     37 |              -6.3 |
| Rick Porcello         |     64 |              -6.3 |
| Ramon Ramirez         |     32 |              -5.3 |
+-----------------------+--------+-------------------+
It is my understanding that the new pitchf/x pitch classification system calls two-seam fastballs sinkers for some pitchers, so I grouped both of them here. Tiger's fans must be thrilled to see Porcello's name on any list that includes Lowe, Beckett and Shields.
+-----------------------+--------+-------------------+
| Changeups             | Number | Run Value per 100 |
+-----------------------+--------+-------------------+
| Dallas Braden	        |     79 |              -6.5 |
| Shairon Martis        |     45 |              -6.1 |
| Anthony Reyes         |    100 |              -5.2 |
| Jered Weaver          |     44 |              -4.8 |
| Johan Santana         |     74 |              -4.4 |
+-----------------------+--------+-------------------+
Shairon who? Luckily Harry Pavlidis broke down his stuff for us about a month ago.
+-----------------------+--------+-------------------+
| Curves                | Number | Run Value per 100 |
+-----------------------+--------+-------------------+
| Javier Vazquez        |     62 |              -6.5 |
| Wandy Rodriguez       |    133 |              -5.1 |
| Jeff Niemann          |     44 |              -4.9 |
| Jose Veras            |     42 |              -4.6 |
| Paul Maholm           |     48 |              -3.9 |
+-----------------------+--------+-------------------+
Wandy had the top curveball in 2007. Erik Bedard just missed the top 5 with -3.6 runs per 100 on his 127 curves, so on a total run value basis he is second only to Rodriguez.
+-----------------------+--------+-------------------+
| Sliders               | Number | Run Value per 100 |
+-----------------------+--------+-------------------+
| John Danks            |     55 |              -6.0 |
| Kyle Davis            |     32 |              -5.1 |
| Santiago Casilla      |     34 |              -4.8 |
| Yovani Gallardo       |     29 |              -4.8 |
| Mark Lowe             |     30 |              -4.6 |
+-----------------------+--------+-------------------+
This is an interesting list with mostly younger pitchers.
One HUGE caveat here is that I did not adjust for the strength of the batters faced. So if a pitcher has only faced poor batters his numbers could be artificially inflated. Also if a pitcher tends to throw a particular pitch only against very good or very bad batters that could throw things off. When I make these lists again at the all-star break or at the end of the year I will properly adjust for the batters faced.
| Behind the Scoreboard | April 27, 2009 |
Ellsbury's Steal of Home
Last night, Jacoby Ellsbury pulled off the rare play of a straight steal of home. The feat electrified the Fenway crowd, but was it a good play? It was the bottom of the 5th with the Red Sox leading 2-1. The Yankees' southpaw Andy Pettitte had just intentionally walked Kevin Youkillis to get to JD Drew to load the bases with two outs. Pettite threw a fastball for a swinging strike one, then a breaking ball outside for a ball. Then Ellsbury took off....
Let's look at the factors which affect the chances that a player is able to steal home or not and whether Ellsbury had them in his favor.
1) Speed of the runner. Obviously, this is vital and Ellsbury has great speed.
2) Pitcher's stance. It's far easier to steal home if the pitcher is working from a windup - Pettitte was.
3) Pitcher's handedness. A lefty turns his back to third during his windup, meaning he can't see the runner take off. Pettitte's a lefty.
4) Batter's handedness. It's easier to steal home with a righty at the plate, since he blocks the catcher's view to third base. With a lefty, he can see the runner coming. Drew was a lefty, which was a drawback for Ellsbury.
5) Pitch selection. Obviously a curve or a change-up are the best pitches to run on since they take longer to get to the plate. Previously, Pettitte got a fastball for a swinging strike one and threw a breaking ball for a ball. Ellsbury guessed right on the third pitch as Pettite threw a big slow curve ball.
6) Attention. In order to steal home, the defense has to be oblivious to it. The third baseman was playing well off the bag, and Pettitte paid no attention to Ellsbury. He was able to get an enormous jump down the third base line.
Overall, Ellsbury had 5 of 6 factors in his favor, meaning he had a decent chance to pull off what's become an increasingly rare feat. However, did the game situation call for a steal of home? Let's look at the factors relating to this.
1) Score/Inning. The best time to run is late in the game when the game is tied or you are down by one. The Red Sox were up by one in the 5th, which wasn't ideal.
2) Outs. The play must be done with two outs, since with less than two outs there are plenty of easier ways to get a man home from third. There were indeed two outs in the inning.
3) Other runners. Ideally, nobody else is on base - that way you don't take yourself out of a potential big inning if you get thrown out. The Red Sox had the bases loaded, which means Ellsbury was really gambling by running.
4) The batter. A weak hitter at the plate is ideal since it makes it harder for the runner to score by means other than a steal of home. JD Drew is a good (but not outstanding) hitter, so Ellsbury was also gambling by potentially taking the bat out of his hands.
5) The count. A pitcher's count is best since it limits the chances that the runner can score by other means. The runner can't go on two strikes since the batter must swing, so an 0-1 count is ideal. Ellsbury ran on 1-1, which isn't great, but better than a 2-1 or 3-1 count.
Ellsbury only had 1 out of 5 of these factors really in his favor, meaning while he might be capable of stealing home, it would be a risky play. From a WPA perspective (not taking into account batter or count), the Red Sox had a 72.1% chance of winning before the steal. Afterwards it increased to 79.8%. Had he been thown out, the chances would have dropped to 65.8%. The break-even point for the steal was 45%, meaning that if Ellsbury were safe 45% of the time, it would be a good play.
Stealing home is so difficult, that ideally all 11 factors that I outlined would have to be in a runner's favor before attempting a straight steal of home. Ellsbury had only about half working for him in this case, meaning that while exciting, it might not have been the smartest baseball play ever. But Ellsbury beat the throw (and beat it fairly easily), so it's hard to argue with results - perhaps he knew something we didn't. In any case, cheers to him making the most exciting play in baseball thus far in 2009.
| Touching Bases | April 27, 2009 |
Derek Holland Analysis
I wrote this post last Wednesday night, and Derek L. Holland has since made another appearance, tossing three innings of one-run ball. His velocity was a bit down, but his pitch usage and movements were similar. He gave up two walks and threw a lot more balls as well. Here's what I wrote Wednesday in what seemed to me auspicious introduction to a promising career.
Rookie Derek L. Holland made his Major League debut on Wednesday night against the Blue Jays, pitching two and a third scoreless innings.
Holland, 22, was drafted out of junior college in the 25th round of the 2006 Rule 4 draft. From there, Holland’s stock as a prospect rocketed upwards coinciding with the increase in his velocity. In his stint in A-ball in 2007, Holland threw 67 innings with a 3.22 ERA and 3.95 K/BB ratio. In 2008, across three leagues—the highest being AA Frisco—Holland made even more strides, lowering his walk and home run rates in 150.2 innings, which culminated in a 2.27 ERA and 157 strikeouts—third in the Minor Leagues. The performance garnered him Rangers Minor Leaguer of the year.
“What worked so well for me was being able to communicate with my catchers and staying ahead of the hitters,” Holland told mlb.com. “It was huge, and that was what helped me to keep having the hitters guessing. I feel as the year went along, I got stronger and my pitches became a little better.”
Coming into the year, Holland was a prospect on everyone’s radar, as he was ranked 40th by Kevin Goldstein, 31st by Baseball America, and 21st by Keith Law.
Here’s what Goldstein had to say about the flame-throwing left hander:
“The Good: Holland's velocity only got better during the year, as he began the year in the low 90s but was sitting at 94-96 mph while touching 99 by season's end. His arm speed rivals that of any southpaw in the minors, and the pitch also features excellent late life. His top secondary pitch is a plus changeup with depth, fade, and good arm-side deception.
The Bad: Holland is still struggling to come up with a consistent breaking ball. He throws a slider which either flashes plus or is below average depending on the day, and he can flatten the pitch out by overthrowing it. The leap he made last year was so unexpected that he still has some skeptics.”
And Law:
“He was 88-91 mph the following spring, then was 90-93 in the summer of '07 in Spokane. By the middle of 2008, he was already in Double-A, sitting 93-95 and touching 98, with natural bore and cut to the pitch and uncanny command. His changeup is already an above-average pitch, and he held right-handed hitters to a .215/.268/.305 line across three levels this year. His slider is still a work in progress, but it's improving, and he has enough command and deception to get left-handed hitters out in the minors. He doesn't have the raw upside of (Neftali) Feliz, but he's not far behind him in potential and is ahead of him in command and feel for pitching, and is the most likely of Texas' horde (pun intended) of pitching prospects to contribute to the big club in 2009.”
With that in mind, I broke down Holland’s first appearance in the show.
Holland entered in the 6th inning of a 6-3 game with the bases loaded and two outs. He had the platoon advantage against Adam Lind and promptly challenged Lind with two consecutive 96-MPH heaters. Ahead 1-2, Holland threw Lind a slider that broke off the plate outside that Lind just barely spoiled. Holland worked outside with another 95 MPH fastball and Lind fought it off for an infield hit. Holland again worked ahead of the count on Scott Rolen with fastballs before throwing a 1-2 slider that Rolen popped up.
Holland breezed through the seventh. He retired Kevin Millar on the first pitch of the inning, and then got into a ten-pitch duel with Rod Barajas. Holland fell behind with two high-and-wide fastballs. Yet he continued to work up in the zone, and Barajas was unable to catch up any of his next four fastballs, fouling three off and swinging through another. When the count worked full, there was no doubt Holland would stay with the hard stuff, and after a couple more foul balls, Holland eventually induced a fly out on a letter high fastball.
Holland picked up two strikeouts in the eighth. His best pitch of the night might have been a 1-2 ankle-high slider to Aaron Hill which was swung over for strike three. But he tried a 1-2 slider on the very next batter, and this time Alex Rios stayed on it for a single. Holland worked inside to Vernon Wells, and Wells was caught looking at a 92 MPH fastball right over the heart of the plate, a pitch Holland got away with.
He had lost his velocity by the 9th inning. In the seventh, Holland’s fastball averaged 96-97, but it fell to 93-94 in the ninth. He also missed his target on each of the first three pitches against his final batter. On 2-0, the catcher set up outside and the pitch sailed over the inside part of the plate, hammered for a single by Adam Lind. Lind was the only lefty Holland faced, and he got base hits on both encounters.
Holland certainly was able to work ahead of hitters, as he indicated was one of the keys to his success. He got into only one three-ball count and six two-strike counts.
Courtesy of Brooks baseball, here’s what his location chart looked like.
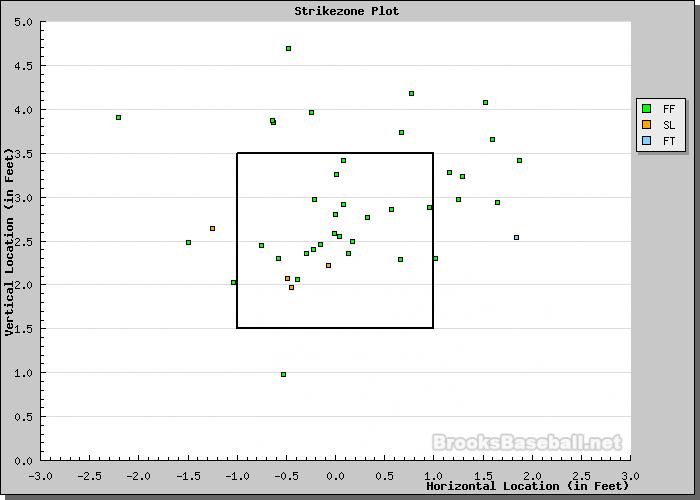
Holland worked up. His shoulder might have been flying open a bit, because something caused him to consistently miss high and wide to his arm side.
Holland showed that plus velocity Goldstein referred to. In addition to his 94 MPH fastball, he generated solid movement on the pitch. However, he didn’t throw any pitch listed as a changeup, which Goldstein and Law called his best offspeed pitch. I could see why Goldstein referred to his slider as inconsistent. He was able to keep it down in the strikezone, which is always a positive, and coming in at 84-85 MPH, his slider has a nice speed differential with his hard stuff, but the break on the pitch was suspect. Though harder than most sliders, Holland’s had below average vertical and horizontal movement. Law noted Holland’s possible reverse platoon split, and the fact that Holland’s slider doesn’t break away from lefties certainly contributes to this.
Holland’s going to want to work on getting some more tilt on his slider. He also might want to start working down in the zone with his fastball, though his nerves might have made him overthrow a bit Wednesday night. His biggest asset is simply being a southpaw who can dial up 97 and throw strikes. He can survive with just that pitch if he comes out of the bullpen. I think Holland, and Neftali Feliz, will be tremendous assets to the Rangers decrepit pitching situation in the future. But considering how wide open that A.L. West division is, we could see the fruits of the Ranger’s superlative farm system pay dividends this year.
| Touching Bases | April 27, 2009 |
Parks and Conversation
These notes don't fit into the post that I will hopefully have up tomorrow, but I thought I'd include this graphic of average ballpark dimensions from 2006-2008 here. I converted the dimensions found on Hit Tracker from pixels into feet, and here are the results by quartiles.
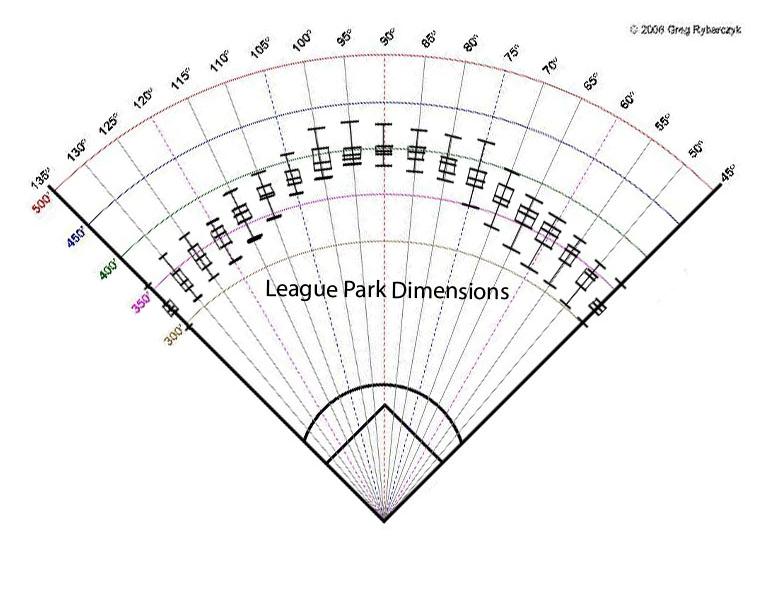
Also, last week I linked to a couple excellent studies on park factors by Greg Rybarczyk and David Gassko, but I forgot to to link to Jeff's excellent post on park factors, which I will be referencing as well in the future. Fortunately, his study used the same years of data as I did. It contains several useful pieces of information that I have not seen used in many other places, such as foul area, and average wall height, which is a key part of information missing from the above visual, but which can also be found at ballparks.com
Lastly, I'm interested in hearing thoughts on whether it would be more informative to list numbers other than just averages for home run characteristics. For example, the bottom 10% of home runs in a certain park might tell us how easy it is to hit short home runs, while showing perhaps the top 25% could tell us how well the ball carries in a park. Or for certain players, the top quartile will give an indication of a player's raw power, while the bottom half may tell us more about how he used his park to his advantage.
| Behind the Scoreboard | April 25, 2009 |
Updating Preseason Predictions
We're coming up on three weeks into the 2009 season and as usual there have been plenty of surprises. Here at Baseball Analysts, Patrick Sullivan has been breaking down those teams which have underperformed and over-performed their expectations. I'll be tackling the same subject from a simply numeric standpoint.
When a surprising start occurs, such as the Florida Marlins' remarkable first two weeks of the season, we have two strongly conflicting pieces of information. On one hand, the Marlins were predicted to be a very bad team (PECOTA's prediction had them winning 72 games) and such teams rarely turn out to be any good. On the other hand, the Marlins started the season 11-1, and teams that start 11-1 are rarely poor clubs. So how can we marry these two pieces of information to determine a ballclub's true skill level?
To do this, first we need some information about the accuracy of such preseason predictions. Baseball Prospectus' PECOTA predictions have been shown to be the most accurate out there, so let's take a look at their accuracy. From 2003 to 2008, the predictions had a root mean squared error of .053 points of WPCT, which means that the predictions were on target give or take about 9 games - not bad at all for preseason prognostication.
Next, we'll have to make sure the predictions aren't biased. PECOTA had major systematic problems in 2003 and 2004, causing the good teams to be overrated and bad teams to be underrated. If Nate Silver had been setting the Vegas lines you could have cleaned up ('03 Yanks at 109 wins? I'll take the under please). Eight out of the top 10 predicted teams won less than predicted, while 8 of the bottom 10 predicted teams won more than predicted. It seems they forgot to regress their predictions to the mean, which would be a major factor in our work here. Luckily since 2004, they've corrected the problem and the over-under on their predictions for good and bad teams have been dead on.
So, for 2009 we can be fairly confident that the PECOTA predictions will be unbiased and our best estimate for the error is about .053 points of WPCT (re-calculating the RMSE based on regressed 2003 and 2004 data reduces the RMSE slightly, but it's still about .053). However, a lot of this potential error in PECOTA's predictions is not PECOTA's fault. Teams play only 162 games in a year, and contrary to the old adage, it doesn't all even out of the course of a season. Even if we know the exact true WPCT of a team, there will still be substantial variation in a team's record. Using the binomial distribution, we can calculate that the standard error of a team's WPCT over a 162 game season is .039 points of WPCT (or about 6.3 games). So, even a perfect prognosticator who could tell you the true WPCT of every team in the league would be off by at least that much (this is over the long run - in the short run of course, anything can happen).
So how much of the error is PECOTA's fault, and how much is random chance that can't be accounted for? If we subtract the variances, we can see that (.053)^2 - (.039)^2 = (.035)^2, meaning that PECOTA's estimate for the true winning percentage of each team has a standard error of .035.
Armed with this information we now have what we need to get started. When the Marlins' started the season 11-1, this was indeed a very unlikely result - but now we can look at each potential true winning percentage to see the likelihood of the Marlins having that true WPCT. The following graph of WPCT distributions shows the results.
The green line indicates the distribution of the Marlins likely true winning percentages based solely on their 11-1 record. Obviously, based on this information alone we would think the Marlins had an extremely high true WPCT - far higher than any major league team could possibly sustain. However, because relatively few games have been played, the distribution is wide, allowing for a wide range of true WPCTs. The red line indicates the likelihood that the Marlins have a particular true WPCT based on PECOTA's preseason prediction. PECOTA predicted the Marlins to have a WPCT of .444, so you can see that the distribution peaks at .444. This distribution is far narrower, reflecting the fact that we know that the true WPCT of an MLB team is almost always somewhere between .350 and .650.
The purple line takes account of both factors. By multiplying the probability of having a certain WPCT under the prediction distribution with the probability of having a certain WPCT under the game distribution, we can derive the probability of having a certain WPCT given both the prediction and game distributions. As we can see, this final distribution is still normal shaped, but is shifted over, reflecting the fact that the Marlins' 11-1 start means that they are likely significantly better than we thought before the season began. The peak of this distribution is now at .471 - much better than .444, but still not over .500. Using this .471 mark to predict a win total in their remaining 150 games and adding it to their win total thus far, we would upgrade their predicted record from 72-90 to 82-80, based on their 11-1 start.
Using this methodology, PECOTA's 2009 predictions, and the current standings, we can make updated predictions for the rest of the 2009 season.
As you can see, two and a half weeks into the season, the preseason predictions still hold a lot of weight. The biggest changes in estimated true WPCT have been Toronto (+.021), Washington (-.019), Florida (+.018), and St. Louis (+.015). This changes the expected final standings as well, with now incredibly, the Seattle Mariners being the favorite to win the AL West. In the AL East, we can see that Tampa has dug itself a major hole behind the Yankees and Red Sox and no longer appears to be their peer.
In the NL, we can see the toll that Florida's four-game losing streak has taken on their predicted true WPCT - when they were 11-1 their estimate was .471, but now they've been downgraded to .462. Elsewhere in the NL, the Dodgers have overtaken the Cubs as the best team in the NL, while the Pirates, despite their 9-7 start, remain baseball's worst (though Houston is now predicted to have the lowest number of wins).
So what happens as the season goes on? Obviously, the more games that have been played, the more weight they will have in the resulting distribution, and the less reliant we are on the pre-season prediction. However, as we showed earlier, the standard error for the pre-season prediction is .035, while the standard error due to random chance after 162 games is .039. What this means is that even after the season is over, the PECOTA prediction is still a more accurate predictor of a team's true talent than the actual record of the team over the course of 162 games!! Based on the standard errors, PECOTA's predictions actually have the accuracy of about 204 major league games!
The following example shows the Chicago White Sox of last year. In this case PECOTA predicted a 77 win season while they actually won 89 - so what's the best estimate of their true WPCT? The following graph shows the result.
As you would expect, the best estimate of the true WPCT is somewhere in the middle (.507). Not only will you notice that the final distribution is in between the other two, but you'll notice that it's also a more narrow distribution with a higher peak and shorter tails. This is because with both pieces of information, we now have more confidence in our estimate of the White Sox' true WPCT. The standard error of the White Sox' final true WPCT estimate is .026, which is better than either the standard error of the PECOTA estimate or the standard error from luck of playing 162 games (actually 163 games for the 2008 White Sox!).
All in all, this is a simple yet powerful way to calculate a team's true skill level based on preseason predictions and the actual games played thus far. This would make it ideal for creating the "power rankings" that every sports related publication seems to release. Of course, it doesn't take into account things like a team's Pythagorean WPCT, trades, or injuries (though these are built into the variance), but this gives a great quick estimate of a team's true skill level based on just two simple pieces of information.
This result also shows just how powerful good preseason predictions are. However, the weight of the preseason prediction is not limited to just PECTOA - even a casual fan's prediction will likely have a weight of over 100 MLB games, which is why fans and commentators "don't believe" in a team even after they've won a lot of games over a 162 game season. Likewise, it's why people can still consider a team dangerous even after a finish around .500. They know that their "gut" perception of a team is actually about as indicative of a team's true talent as the team's record.
As the season goes on and even after it's over, we can keep updating these estimates to keep track of how our perceptions and reality converge to get an estimate of a team's true talent level.
| F/X Visualizations | April 24, 2009 |
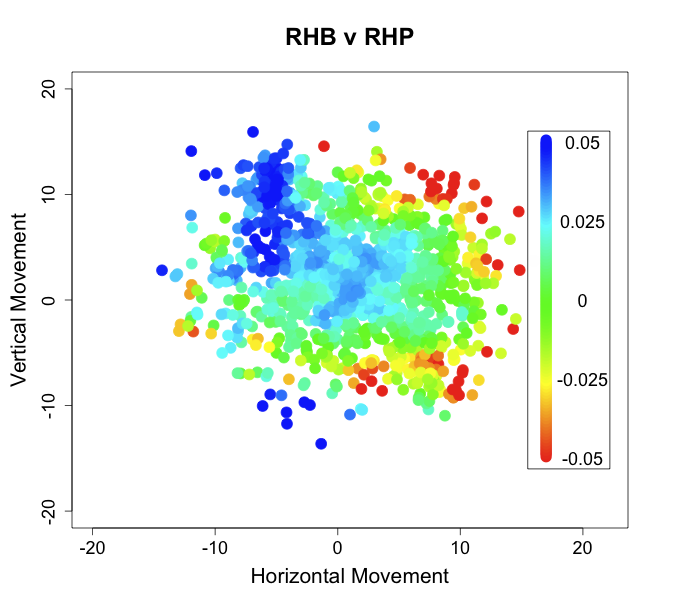
The Breaking and the Knuckling: Run Value by Pitch Movement
Over at Beyond the Box Score Sky Kalkman posted an introduction to understanding pitchf/x graphics. It is a great post for people who are having a hard time understanding these graphics. I also liked the comments section where there is some discussion of the state of pitchf/x analysis. In particular some commenters noted areas of the current analysis they found lacking.
Trey Hilman's Chin commented:
I do have one question to go along with all this. For any particular pitch, is there a range of movement that is generally recognized as “good” for that pitch classification? I am terrible at judging “stuff” simply by watching a pitch, but it would be nice to look at some of these charts and intuitively see that a particular pitch had a “nasty slider” tonight, etc.
Similarly, azruavatar wrote:
5 inches of break is absolutely meaningless to me in the context of a slider. I also question whether all 5 inches are created the same. Rivera’s cutter is notorious for late movement. If a pitch moves 5 inches over 20 feet compared to 5 inches over 60 feet that’s an incredible difference.
It seems that people are having the hardest time intuitively understanding pitch movement and putting an individual pitch's movement in perspective. Another commenter suggested Josh Kalk's two-part Anatomy of a League Average Pitcher series. The first broke down the league average fastball, sinker and cutter by presenting the frequency distribution of speed and movement for these pitches, and the second did so for off-speed and breaking pitches. These allow one to see if, say, a pitcher's curveball breaks more than the average curveball. But we are still left wondering if that additional movement makes the pitch any more successful. I will begin to address this question here for the breaking (and knuckling) pitches, and look at fastballs and changeups in a future post.
The pitchf/x system measures pitch movement in a number of ways but the two easiest to understand are the horizontal movement (pfx_x) and the vertical movement (pfx_z) of a pitch. Alan Nathan has a helpful description of the meaning behind these two values:
pfx_x,pfx_z: The deviation (in inches) of the pitch trajectory from a straight-line in the x (horizontal) and z (vertical) directions...[T]he effect of gravity has been removed from pfx_z, so that both parameters are the "break" of the pitch due to the Magnus force on a spinning baseball...[A positive value of pfx_x corresponds to] a deviation to the catcher's right and a negative value to the catcher's left. Similarly, a positive value of pfx_z is a pitch the drops less than it would from gravity alone (most pitches fall in this category), whereas a negative value is a pitch that drops more than from gravity alone (e.g., a "12-6" curveball).
So the movement of a pitch is the difference between where you would expect the pitch to end up as it crosses the plate based solely on its velocity, trajectory and gravity and where it actually ends up as it crosses the plate. This difference is broken up into its horizontal and vertical components. Then you can plot the horizontal and vertical movements of a number of pitches together in a scatter plot to see the movement of a particular pitch type or from a particular pitcher.
Curveballs
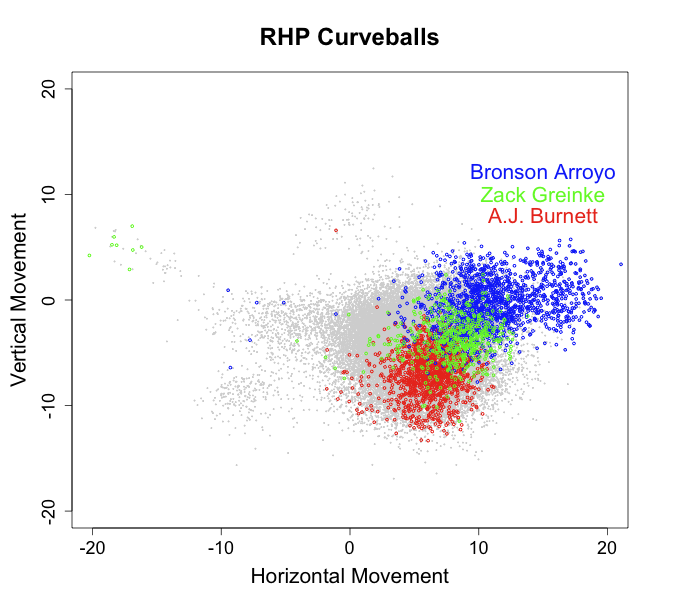
In gray, are all curveballs thrown by RHPs. You can see that most tail to the catcher's right by about 5 inches (meaning they tail away from RHBs) and break down by about 5 inches. On top I plotted the curveballs of three pitchers with distinctive and successful curves. Bronson Arroyo's curve has almost no vertical movement, but far and away the most horizontal movement of any curveball in the game. A.J. Burnett's curve, on the other hand, has some of the most downward movement of any pitcher's curve, but average horizontal movement. (Arroyo's curve's dependence on its heavy horizontal movement compared to Burnett's on its heavy vertical movement may partially explain Arroyo's more extreme platoon split compared to Brunett's). Zack Greinke combines intermediate levels of horizontal and vertical movement in his very successful curveball.
I am using the pitchf/x given pitch classifications and you can see three strange 'blobs' off of the central cluster of pitches. These are not curveballs. I think they are misclassified changeups. One cluster comes from sidearm pitchers and another from pitchers who throw sinking fastballs and changeups.
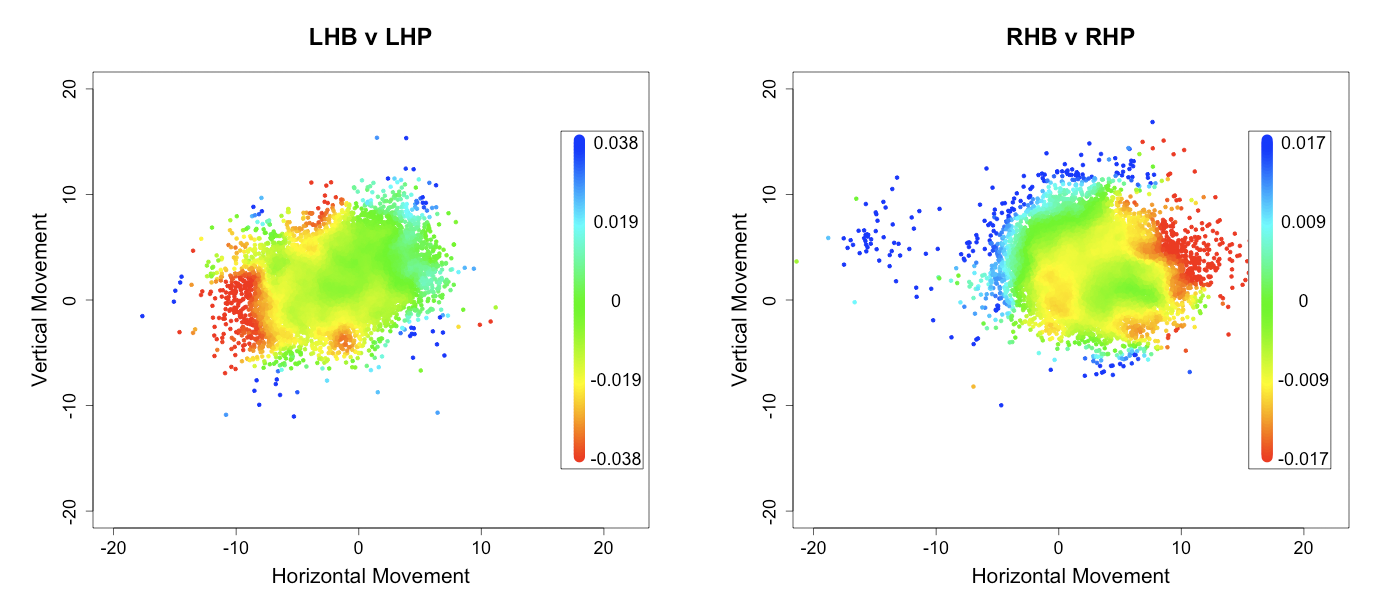
Now that we have seen the range of movement for all and a select group of individual pitchers's curves we can look at how curveball success varies by movement. In the images below I show the run value of a curve based on its movement. I decided to take a slightly different approach from my run value by location heat maps. I wanted to show not only the run value by movement, but also roughly the number of pitches with that movement. So I plotted the heat map colors on top of the scatter plot of pitches. Note that I change the color scale in each image, while this makes it harder to compare across images, it makes it easier to highlight differences within a particular image.
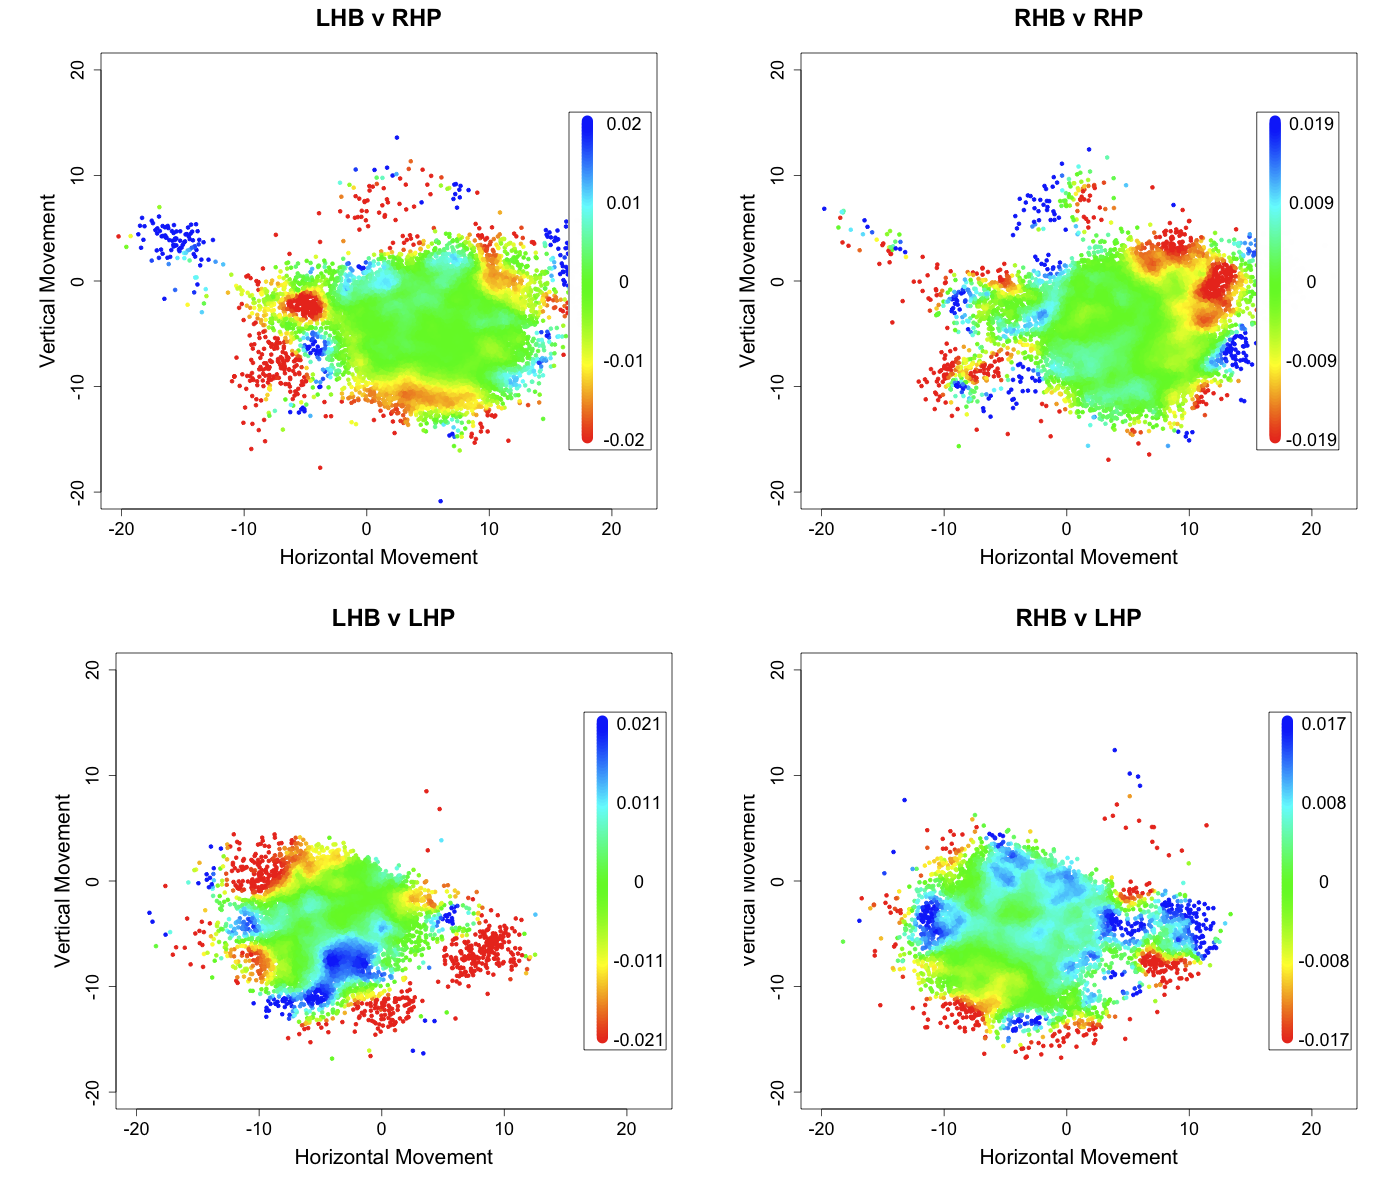
These are pretty messy complicated images. Studes suggests that at times these heat maps are too messy to be very informative. I think that is the case here (although I cannot agree too much or I lose my raison d'être). So I took a more traditional route below and plotted run value versus first the vertical movement (averaging over the horizontal) and then against the horizontal movement (averaging over the vertical).
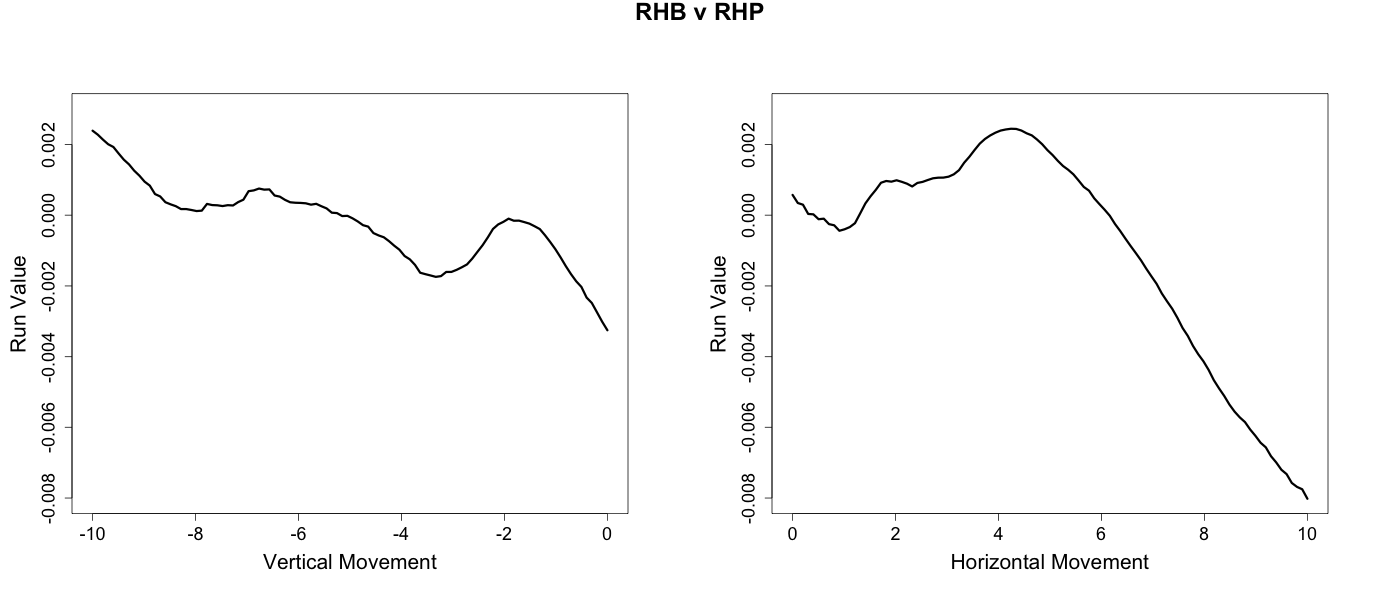
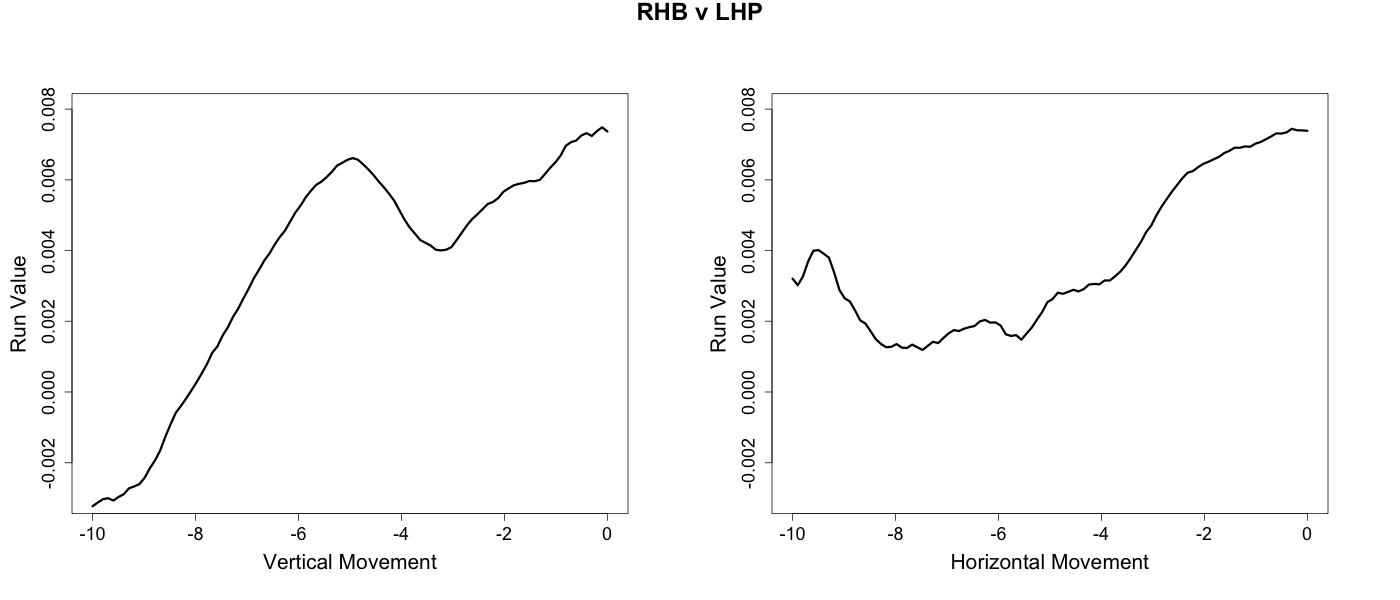
These figures reveal an interesting dichotomy between same handed versus opposite handed at-bats. In opposite handed at-bats the success of the curveball is mostly determined by its vertical break. The greater the downward break the more successful the curve. Conversely, in same handed at-bats the horizontal movement of the pitch largely drives the pattern. The more a curveball tails away from a batter the more successful it is.
Sliders

RHP's sliders, on average, have slight tailing away movement from RHBs and slight rising movement, although there is considerable variation. Greg Maddux's slider, for example, tailed in to RHBs. Justin Duchscherer's slider has little horizontal movement but above average rising movement. Carlos Marmol's slider is in the top five among sliders for both horizontal and downward movement, which makes it the slider with the most overall movement in the game.
I use the same technique described above for curveballs to produce the run value by movement images for sliders below. Since sliders are thrown overwhelmingly in same handed at-bats I only present those.
Here, I think, the heat maps show a relatively clear gradient, with sliders that tail away from the hitter the most being the most successful.
Knuckleballs
There are fewer knuckleballs thrown than sliders or curves, but I really wanted to include them. John Walsh wrote the seminal pitchf/x article on the knuckleball. He found that, unlike other pitches, knuckleballs do not have a consistent pattern of movement, but a random horizontal and vertical movement each anywhere from -15 to 15 inches (for Wakefield, at least). The success of an individual knuckleball varies directly with its, seemingly random, amount of movement; batters make less and poorer contact the more movement a knuckleball has. Using the method described above I am able to make one slight addition to Walsh's conclusion.
Outside of the north-west quadrant we get a confirmation of Walsh's results; there is a lower run value as the break increases. But knuckeballs with positive vertical movement and negative horizontal movement have even higher run values than those with no movement. Thus knuckleballs that break up and in to batters, even if they have a lot of movement, are very unsuccessful. This makes knuckleballs even more random; even if a pitcher can get lots of movement on his knuckleball if it happens to break up and in he could be in trouble.
In a future post I will look at fastball and changeup movement.
| Designated Hitter | April 23, 2009 |
WAR and Remembrance
Baseball fans love to argue. Did Dustin Pedroia really deserve the MVP award last year? (After all, he was only 18th in the AL in OPS.) Sure, Manny can hit (can he ever!), but he gives it all back with the glove, right? On the flip side, is Adam Everett, with his fabulous defense, a valuable player? We older folks like to argue about the players of our youth: For example, who had the better career, George Brett or Wade Boggs? In the end, it usually comes down to putting a value on a player, a total value that includes hitting, defense, baserunning and everything else.
Well, Sean Smith -- you know, the guy who does the CHONE player projections -- is putting an end to some of these arguments. What Sean has done, bless his soul, is evaluate players on just about every aspect in which a player contributes to winning. And he's done this for all players going all the way back to the middle of the last century. Bravo, Sean!
So, what are these different aspects of baseball, the important contributions a player can make towards winning? Here's the list:
o batting
o baserunning
o avoidance of grounding into double plays
o defensive range
o catcher defense
o defensive arm for outfielders
o double-play proficiency for infielders
Sean has analyzed over 50 seasons of play-by-play data available at Retrosheet and determined each player's value in the above categories, expressed in runs above or below that of an average player. For the defensive categories, players are compared to the average for that position. I won't go into the methodology for all these categories, you can refer to Sean's explanations here. I do want to mention Sean's Total Zone system, which he uses to measure defensive range. After hitting, defensive range (and catcher defense) is the biggest contribution to a player's value. Total Zone uses Retrosheet play-by-play data to evaluate defensive range for all players of the last 55 years or so. It's a clever system that squeezes just about every bit of information from the play-by-play data, data that is not as complete as modern play-by-play data from professional statistics providers like Baseball Info Solutions or STATS, Inc. See here for more details on Total Zone.
Of, course there's a lot more here than just defense, as you can see in the list above. Now, we've known how to measure baserunning and outfield arm proficiency for a while and the other categories, given the Retrosheet data are treated in a similarl way. The important thing that Sean has done is to 1) put in the dirty work to make all these different evaluations and 2) put them altogether to allow us to get a total picture of player value. Oh, and 3) he's posted it all on the web for all to use (at no charge).
Do you realize how great this all is? I recently wrote an article for the Hardball Times that did an in-depth comparison of Carl Yastrzemski and Manny Ramirez. I got the hitting from baseball-reference.com, defensive range from Sean's own Total Zone system and the outfield arm ratings came from my own work at THT. I couldn't locate comprehensive baserunning information, so I had to work that out (a less complete analysis) on my own. Now, to write that article, I would could do all my "shopping" at Baseball Projection.
Sean then goes a couple of steps further with the data he has compiled. He translates "runs above average" to "runs above replacement", since a player's true value is best measured against a replacement level player. Along the way he gives each player a "position adjustment". Remember when I wrote that range is measured against the average defender at the same position? Well, the position adjustment accounts for the fact that the value of an average fielder is not the same for each position.
The last step is translating runs into wins and, since we are now relative to replacement, these are Wins Above Replacement, or WAR. I've been very brief in describing the system, if you want more info about determining overall player value, I heartily recommend a series of posts at FanGraphs, which goes through the process step-by-step, starting here.
Speaking of FanGraphs, those good folks have been doing similar work. They also produce WAR values for all players, using a different fielding system (known as UZR) and play-by-play data purchased from Baseball Info Solutions. Their data set goes back only a few years, though, so you need to use Sean's WAR database, if you want to look at, I dunno, who really should have won the MVP awards in 1974...
-------------------------------------------------------------
Jeff Burroughs is the guy who, when reciting the names of MVP winners, you always leave off the list. Well, him and Zoilo Versalles, I guess.* It's not that he was underserving of the award, although, he was, as we shall see shortly. It's just that looking back, he doesn't seem like much of a star. He actually was a very good hitter for a few seasons and I'm sure he's not the MVP-winner with the worst career.
*What? You mean, you don't find yourself reciting the names of AL MVP winners? That's strange, I do it all the time. Pennant winners and World Series champs, too. Just don't ask me who the 13th President of the United States was.
Jeff Burroughs in 1974 was probably the best hitter in the American League. The 23-year-old Texas Ranger hit .301/.397/.504, which is even better than it looks, since offensive levels were quite a bit lower 35 years ago. Burroughs finished third in on-base average and slugging percentage and finished among the top ten in just about every important offensive category. He only led the league in one category, but it was the right one for garnering MVP votes: RBI.
We can get an overall measure of Burroughs' hitting by considering the Batting Runs part of the WAR database. Here are the AL leaders for 1974:
 ------------------ ------ ---------
| Name             | Team | BatRuns |
 ------------------ ------ ---------
| Jackson_Reggie   | OAK  |      49 |
| Burroughs_Jeff   | TEX  |      48 |
| Carew_Rod        | MIN  |      35 |
| Allen_Dick       | CHA  |      34 |
| Rudi_Joe         | OAK  |      34 |
| Yastrzemski_Carl | BOS  |      33 |
| Bando_Sal        | OAK  |      27 |
| Tenace_Gene      | OAK  |      27 |
| Gamble_Oscar     | CLE  |      27 |
| Grich_Bobby      | BAL  |      27 |
 ------------------ ------ ---------
Burroughs is right there with Reggie Jackson at the top of the list. Jackson finished fourth in the MVP balloting, which may be explained by Burroughs' advantage in RBI, 118 to 93. In any case, from a hitting standpoint, Burroughs was certainly not a bad choice for MVP.
But, baseball is more than hitting, of course — how did Burroughs do in the non-hitting categories? Burroughs was not a fast player, at all, so we don't expect him to excel at baserunning, defensive range and avoiding the GDP. But did he at least hold his own? Did the 1974 American League MVP at least approach the average players in the "extra" categories? I'm sorry to report that he did not.
Here's how Burroughs fared in the non-hitting categories:
o Defensive range - Burroughs was 17 runs worse than an average right-fielder. That's the worst range mark of any AL player in 1974.
o Outfield arm - sometimes slow guys have good arms. Not in this case. Burroughs cost his team an additional five runs with an ineffectual throwing arm.
o Baserunning - Two stolen bases and three caught stealings give you an idea of Burroughs' speed. He was also below average in advancing on the basepaths, giving him a net baserunning value of -3 runs.
o GDP - Burroughs grounded into 17 double plays in 1974, a few more than the average batter would have, given the same opportunities. Good for -2 runs.
o Position - it's not his fault, of course, but Burroughs played right field in his MVP year, which is an offense-first position. The adjustment for right fielders is -8 runs.
The 1974 AL MVP was below average in every single non-hitting category for a grand total of -35 runs. Yikes, that negates a good chunk of his batting runs (which was +48, you'll recall). In fact, without considering hitting, Burroughs was the very worst player in all of baseball in 1974 and he was one of only four players who was below average in each of the non-hitting categories. This dude was seriously one-dimensional.
So, who should have won that 1974 AL MVP? Well, if you don't require your MVP to play on a playoff team (Burroughs's Rangers did not make the playoffs), then you could rank MVP candidates according to their overall win value, or WAR:
 ----------------- ------ --------- ------- ----- ------ ------ ---------- ------
| Name            | Team | Batting | Range | Arm | BsRn | GIDP | Position | WAR  |
 ----------------- ------ --------- ------- ----- ------ ------ ---------- ------
| Grich_Bobby     | BAL  |      27 |     5 |   3 |    5 |   -2 |        4 |  6.9 |
| Jackson_Reggie  | OAK  |      49 |     0 |  -2 |    0 |    2 |       -8 |  6.7 |
| Carew_Rod       | MIN  |      35 |    -9 |   2 |    5 |    2 |        4 |  6.6 |
| Rudi_Joe        | OAK  |      34 |     0 |   3 |    1 |    1 |       -8 |  5.6 |
| Campaneris_Bert | OAK  |      13 |     6 |   1 |    4 |    1 |        8 |  5.4 |
| Money_Don       | MIL  |      19 |     0 |   2 |    3 |    0 |        4 |  5.4 |
| Maddox_Elliott  | NYA  |      19 |     4 |   6 |    4 |   -1 |       -2 |  5.1 |
| Bando_Sal       | OAK  |      27 |    -4 |   0 |    1 |    0 |        3 |  5.0 |
| Tenace_Gene     | OAK  |      27 |     4 |   0 |   -5 |   -1 |       -2 |  4.6 |
| Robinson_Brooks | BAL  |       5 |    14 |   1 |    0 |   -1 |        4 |  4.4 |
 ----------------- ------ --------- ------- ----- ------ ------ ---------- ------
BsRn - baserunning runs
Range - includes catcher defense
Arm  - includes infield DP rating
For me, it comes down to Bobby Grich, Jackson and Rod Carew. Pay no attention to the 0.3 wins separating these three — no system is accurate enough to distinguish players this close. Grich played a prime defensive position and played it exceptionally well. He won a Gold Glove at second base in '74, and was excellent with the bat and on the basepaths. Reggie, we already saw, was one of the top two hitters in the league, and he hangs on to those batting runs by coming out average in the other categories (except for position adjustment). Carew was top notch in everything except defensive range (he was still playing second base at this point).
In the actual vote, Grich finished ninth and Carew seventh. You might notice the absence of somebody from the above list: Jeff Burroughs, who totaled 4.0 wins over replacement for the season.
-------------------------------------------------------------------
Over in the National League, the voters did not fare much better: they elected Dodger first basement Steve Garvey over several more valuable players. The problem in this case was not neglecting the other categories (although I suspect many writers did so), but rather not doing a good job of evaluating offensive value.
Sean Smith's WAR database rates Garvey as the NL's ninth most productive hitter in 1974:
 --------------------- ------ ---------
| Name                | Team | Batting |
 --------------------- ------ ---------
| Schmidt_Mike        | PHI  |      49 |
| Wynn_Jimmy          | LAN  |      47 |
| Morgan_Joe          | CIN  |      46 |
| Stargell_Willie     | PIT  |      46 |
| Smith_Reggie        | SLN  |      40 |
| Zisk_Richie         | PIT  |      33 |
| Bench_Johnny        | CIN  |      32 |
| Garr_Ralph          | ATL  |      31 |
| Garvey_Steve        | LAN  |      29 |
| McCovey_Willie      | SDN  |      28 |
 --------------------- ------ ---------
Why did the voters elect Garvey over these other superior hitters? Well, some of these guys were on non-contending teams, including Mike Schmidt, but that doesn't explain why Garvey's teammate Jimmy Wynn finished fifth in the voting (not to mention the Pirates, Reds and Cardinals in the above list).
Garvey batted .312/.342/.469 on the year, with 21 homers and 111 runs driven home. He did not lead the league in any category, though he was Top 10 in several. Here's my take on how he won the MVP: he batted over .300, knocked out 200 hits and had the highest RBI total of players on an NL playoff team (the other being the Pirates). That and the great hair, of course.
Did Garvey do anything in the non-hitting categories to boost his case and vault him over the better hitters in 1974? No, not really. Here are the numbers:
 --------------------- ------ --------- ------- ----- ------ ------ ---------- ------
| Name                | Team | Batting | Range | Arm | BsRn | GIDP | Position | WAR  |
 --------------------- ------ --------- ------- ----- ------ ------ ---------- ------
| Garvey_Steve        | LAN  |      29 |     0 |   0 |    3 |    2 |      -10 |  4.8 |
 --------------------- ------ --------- ------- ----- ------ ------ ---------- ------
I don't think of Garvey as a speedster, but he was above average in the speed categories of baserunning and avoiding double plays. He was average in defensive range and arm (although he was famous for having a very weak arm), but he takes a -10 run hit for playing first base. An overall WAR value of 5 is nothing to be ashamed of, but Garvey was not among the ten most valuable National League players in 1974:
 --------------------- ------ --------- ------- ----- ------ ------ ---------- ------
| Name                | Team | Batting | Range | Arm | BsRn | GIDP | Position | WAR  |
 --------------------- ------ --------- ------- ----- ------ ------ ---------- ------
| Schmidt_Mike        | PHI  |      49 |    17 |   1 |    1 |    2 |        4 | 10.0 |
| Morgan_Joe          | CIN  |      46 |     3 |   1 |    8 |    1 |        4 |  8.8 |
| Wynn_Jimmy          | LAN  |      47 |    12 |   2 |   -1 |    2 |       -2 |  8.4 |
| Bench_Johnny        | CIN  |      32 |    11 |  -1 |   -1 |    0 |        9 |  7.5 |
| Evans_Darrell       | ATL  |      18 |    18 |   2 |    2 |    1 |        4 |  6.8 |
| Stargell_Willie     | PIT  |      46 |     1 |   1 |   -2 |    0 |       -7 |  6.2 |
| Rose_Pete           | CIN  |      18 |    15 |   5 |    4 |    1 |       -9 |  6.0 |
| Smith_Reggie        | SLN  |      40 |     8 |   0 |   -2 |   -3 |       -7 |  5.7 |
| Cedeno_Cesar        | HOU  |      20 |     4 |   4 |    7 |    1 |       -2 |  5.7 |
| Oliver_Al           | PIT  |      28 |     6 |  -4 |    6 |   -3 |       -4 |  5.2 |
 --------------------- ------ --------- ------- ----- ------ ------ ---------- ------
Wow, look at the fabulous season that Mike Schmidt had. Best hitter in the league, one of the best defensive players and above average in all the other categories. Achieving a WAR of 10 is no small feat: it has only been done 36 times since 1955.
The fantastic thing about having this WAR database (did I thank Sean for this yet?) is it makes clear just how some very good players end up getting underrated, because a lot of their value comes in the non-hitting categories. Jimmy Wynn, Darrell Evans and arguably Cesar Cedeno fall into this group. Wow, just noticed that Pete Rose had a great year with the glove in 1974.
In case you were wondering, Steve Garvey ranked 14th in WAR in the NL in 1974.
-------------------------------------------------------------------
So, I hope I have given you a flavor for just how useful Sean's WAR database really is. You could use it to answer many, many questions, of course. Which players are underrated because much of their value is in the non-hitting categories? Which players were the most well-rounded or one-dimensional? Who had value because of speed and who despite of a lack of it? Or let's talk about teams: The 1985 Cardinals stole 314 bases — how much impact did their baserunning have on their offense? Were they the best baserunning team of the last half-century? Who were the best defensive teams and the worst?
Oh, the mind reels at the possibilities. All the numbers are there, waiting to be looked at. Thank you, Sean.
John Walsh is a regular contributor to the Hardball Times. He welcomes comments via email.
| Change-Up | April 22, 2009 |
A Look at the Front-Runners - AL Edition
It's early, but it seems that fans and media alike of many teams are making post-season plans or pressing the panic button far too early. Baseball being a game that needs to play out over the long haul, it's best to peel back the onion just a little bit to identify why a team is winning or losing. Are the good teams lucky on balls in play? Getting ridiculous performances from players ready to plummet back to earth? Are the bad teams failing because they are stranding too many runners or just plain slumping? Maybe they're showing their true colors?
Last week I broke down the last place teams to try and identify who might be ready to turn things around.
These games count, so I do not want to downplay the impact of a tough start. Without a doubt, each of these teams has dug themselves a hole. But looking at the numbers alone, I think Boston and Cleveland fans should hold off on panicking just yet. Meanwhile, the Rangers have to be happy with the way they have hit the ball so far and it appears that given their strand rate, the run prevention figures to improve.In the National League, all three last place teams will see their pitching improve, while Houston is going to get a big jump offensively when they start hitting in the clutch and Lance Berkman and Carlos Lee come around.
Combined, Boston, Cleveland, Texas and Houston are 17-7 since I posted that piece. This week I will take a little different format but look at the first place teams to identify whose play is sustainable and whose is not. Dayn Perry has done a similar piece looking at teams and individuals alike over at Fox Sports.
AL East
The Toronto Blue Jays are off to a 10-4 start thanks to a well-rounded club whose OPS+ and ERA+ of 118 and 124 respectively are both 3rd in the American League. They are also sporting the league's most impressive Defensive Efficiency Rating.
Five players with an OPS north of .900 are pacing Toronto's offensive attack. While it would be easy to say that they will all fall back to earth, I am not so sure. I am not going to contend that Lyle Overbay finishes the year hitting .330 or that Aaron Hill slugs better than .600. And Marco Scutaro is hitting .281/.417/.561. Will he finish the year there? I wouldn't bet on it.
But there are some mitigating factors that should give Jays fans hope. For instance, is it so inconceivable that Overbay would have a big bounce-back year? He's getting up there but still just 32, and he did hit .312/.372/.508 in his first season with Toronto in 2006. He was injured in 2007 and struggled to regain his form last season. Maybe he's all the way back in 2009. Speaking of injuries, Hill is just 27 years old and missed much of last season. He could simply be building off of his strong 2007. Scutaro has never been much of a hitter but look at that disparity between his batting average and on-base. That suggests to me that he is up at the plate with a better approach and may be in for a career year.
The other two members of the Blue Jays tearing it up early are Travis Snider and Adam Lind. 21 and 25 respectively and both loaded with talent, I am not ready to dismiss either of their early performances. This group will fall back some - maybe a lot - but I still believe it constitutes a solid offensive core. Moreover, Scott Rolen appears resurgent while Alex Rios and Vernon Wells have not hit yet.
On the pitching side, Roy Halladay is not slowing down. David Purcey and Jesse Litsch have gotten off to slow starts but Ricky Romero looks terrific. Where their run prevention will settle in I am not sure but there seems to be enough guys under-performing not to write this unit off.
Toronto is in the best division in baseball - indeed one of the very best in recent memory. There is no telling at this point where they will finish up. What appears evident at this point, however, was that I was just terribly wrong in my AL East preview. I thought they would be awful and many Jays fans called me out - in comments and over email. It looks like they're right.
AL Central
It seems a little silly to dig in too much on the AL Central, with three teams atop the division at 7-6, Minnesota at 7-7 (without Joe Mauer) and Cleveland, the consensus favorite at 5-9 but 4-2 in their last six. This is truly anybody's division. Let's look at the three teams tied atop the division.
For Kansas City, Zack Greinke is off to an unbelievable start while Gil Meche and Kyle Davies have been excellent as well. They will have to figure out the back end of the rotation to stay in it for the long haul but they are definitely solid at the front end. In the bullpen, the sooner Trey Hillman abandons Kyle Farnsworth in high-leverage situations, the better for the Royals. Offensively, they're performing slightly below average, just as you might have expected them to.
The White Sox are riding three guys offensively. Carlos Quentin is following up a breakout 2008 with another stellar year thus far. Mainstays Paul Konerko and Jermaine Dye are both off to excellent starts. Whatever fallback you might expect from these players should be softened by increased production from Alexei Ramirez (.159/.213/.182) and Jim Thome (.304 on-base). On the pitching side, I am not sure I buy Bartolo Colon's start (3.86 ERA) but John Danks once again looks terrific. Jose Contreras looks done to me.
Detroit's offense looks to me like it is performing just a smidge below expectations. Yes, Miguel Cabrera is off to a ridiculous start and there is absolutely no way Brandon Inge does not come back to earth. But look at all of the other good players falling short of expectations in that lineup. That outfield will start to hit before long. It's Detroit's pitching that is all of a sudden awfully intriguing. With three youngsters simultaneously stepping in and stepping up, when they get Jeremy Bonderman back, this could be one of the best starting fives in the American League. Armando Galarraga and Edwin Jackson have been terrific, and boy does Rick Porcello have some talent. Justin Verlander is just fine and Bonderman is rumored to be coming along.
AL West
The Seattle Mariners are currently 9-5 with a +12 run differential; this despite a .296 wOBA and a 76 ERA+. They haven't hit at all, and I am not sure they ever will this year. But one thing we know, and we knew all along, is that they would be able to catch the ball. What I wasn't sure we knew was just how much of a measurable impact defense would have. This is what I wrote in our AL West preview:
The Mariners will be a real case study in how much we know about defense metrics. Consensus seems to be that Jarrod Washburn and Carlos Silva in particular stand to improve. Let's see how it plays out.
A resurgent Washburn, a healthy Erik Bedard and a lights-out defense that sports the best UZR in the game right now all signify to me that these M's might have some staying power. Their 2.94 team ERA may be unsustainable, but their offense will tick up. Besides, that's a division for the taking they're competing in.
--------
I will be back this weekend with a look at the National League division leaders.
Thanks to Fangraphs for many of the more in-depth statistics.
| Touching Bases | April 21, 2009 |
Personal Park Effects (Part 1)
There's been a lot of talk on this site about park effects, as Eric Walker and Sky Andrecheck just this week delved into home-field advantage, precision, and accuracy.
My idea is that not all park effects are uniform. For example, I believe that Mike Lowell and Dustin Pedroia are largely aided by the Green Monster, to a greater extent than most hitters and Johnny Damon's home run production has been largely influenced by the short porch in Yankee Stadium's right field. So what I've set out to do is use Hit Tracker data to compare players' home runs at home and away from home, and perhaps come to conclusions about certain ballparks effects on certain players.
I will not attempt to come up with my own home run factors. One reason for this is because if I look at only home runs here, I will face terrible selective sampling issues which would make my results neither precise nor accurate. The other is that I'm not that smart. I'll just present the data, and try to infer results from it. For actual park effects, Walker linked to a paper by my friends at the Harvard Sports Analysis Collective, and in the future I will be referring to a couple of articles at The Hardball Times by David Gassko and Greg Rybarczyk.
Here are the averages for all regular season home runs from 2006-2008 for which Hit Tracker has information. Here is the glossary for the terms. I've broken the fields into left, center, and right. I'd love to get more granular if I had more data. The second column refers to how many home runs were hit over the timespan, and the percentage hit to each field. The rest are Hit Tracker terms.
| Field | 497.6 | True | Speed | Elevation | Apex | Wind | Temperature | Altitude | Standard | Parks |
| Left | 51% | 394.7 | 104.2 | 29.9 | 91.0 | 1.9 | 1.0 | 2.1 | 389.6 | 24.2 |
| Center | 12% | 421.7 | 106.6 | 28.9 | 94.7 | 2.6 | 1.3 | 2.3 | 415.6 | 20.5 |
| Right | 37% | 393.8 | 103.9 | 29.9 | 90.7 | 1.9 | 1.1 | 2.1 | 388.6 | 23.9 |
I defined the dimensions so that 12% of balls went out to center, so as to be consistent with the work I did last week. However, Hit Tracker also gives horizontal launch angles, with which you can define your own dimensions rather accurately. As there are more right-handed batters than left-handed batters, there are more left-field home runs than right-field home runs. Other than that, the differences between left and right are negligible. Homers to center are hit harder and farther, but also need more help from atmospheric effects. On to specific ballparks. Click on the ballpark names to view their dimensions.
Homers in Arlington certainly travel. They have by far the greatest impact from temperature of any ballpark. There have actually been more home runs to right field than left, which would likely mean that it is easier to hit home runs in that direction. Indeed, home runs to right have to travel a lesser distance than those to left. This is likely compounded by the home team, the Texas Rangers, trying to exploit this advantage by stocking up on lefties or switch-hitters. This effect is most prominent with the Yankees and Yankee Stadium, who have been well-known to go after left-handed batters as their production will be enhanced by the short right-field fences.
| Field | 545 | True | Speed | Elevation | Apex | Wind | Temperature | Altitude | Standard | Parks |
| Left | 38% | 403.1 | 105.2 | 29.7 | 92.3 | 0.9 | 4.6 | 2 | 395.2 | 27.7 |
| Center | 14% | 423.1 | 106.5 | 29.3 | 97.3 | 0.5 | 4.9 | 2 | 415.3 | 20.2 |
| Right | 47% | 396.2 | 103.8 | 29.6 | 90.4 | 2.2 | 4.5 | 2 | 387.3 | 22.6 |
Angels Stadium seems to play true to most of the league averages. It might be a bit easier than normal to hit home runs out to center.
| Field | 417 | True | Speed | Elevation | Apex | Wind | Temperature | Altitude | Standard | Parks |
| Left | 48% | 401.3 | 104.7 | 29.8 | 91.4 | 5.5 | 1.3 | 1 | 394.0 | 25.2 |
| Center | 18% | 413.8 | 105.2 | 28.5 | 89.8 | 4.9 | 1.0 | 1 | 407.5 | 15.1 |
| Right | 35% | 394.8 | 103.6 | 30.1 | 90.9 | 3.2 | 1.3 | 1 | 389.7 | 24.1 |
I'm surprised that AT&T Park has one of the strongest negative temperature effects. I guess being by the bay really cools the weather. This, and an endemic offense from the home team, contribute to the very small amount of homers to have been hit in AT&T. However, the wind will ratchet up at times. It's clearly a pitcher's park. I imagine it would have been helpful to break up this park into right-center and right field.
| Field | 363 | True | Speed | Elevation | Apex | Wind | Temperature | Altitude | Standard | Parks |
| Left | 64% | 395.5 | 104.1 | 29.3 | 86.9 | 9.1 | -2.6 | 0 | 388.8 | 22.9 |
| Center | 11% | 423.1 | 106.7 | 28.0 | 89.4 | 9.4 | -2.2 | 0 | 415.6 | 19.0 |
| Right | 25% | 386.5 | 103.2 | 29.9 | 86.9 | 7.6 | -2.5 | 0 | 381.3 | 24.4 |
It can get windy in Busch, which will inflate the actual distances of home runs. Overall, the park is fair.
| Field | 463 | True | Speed | Elevation | Apex | Wind | Temperature | Altitude | Standard | Parks |
| Left | 54% | 399.7 | 104.5 | 30.1 | 91.8 | 5.0 | 2.6 | 2 | 390.4 | 26.0 |
| Center | 9% | 424.5 | 106.0 | 29.4 | 95.9 | 7.2 | 2.9 | 2 | 412.9 | 19.3 |
| Right | 37% | 399.5 | 104.2 | 30.3 | 92.8 | 4.0 | 2.3 | 2 | 391.5 | 25.5 |
Chase Field is clearly a home run park, but it is quite deep to center. There aren't many cheap home runs hit at Chase.
| Field | 522 | True | Speed | Elevation | Apex | Wind | Temperature | Altitude | Standard | Parks |
| Left | 54% | 406.0 | 105.5 | 29.6 | 92.1 | 0.7 | 3.6 | 5 | 397.2 | 26.6 |
| Center | 7% | 439.8 | 109.0 | 29.3 | 101.6 | 0.1 | 3.7 | 5 | 431.2 | 28.0 |
| Right | 39% | 397.7 | 104.3 | 30.2 | 93.1 | 0.1 | 3.3 | 5 | 389.9 | 24.6 |
Citizens Bank Park's dimensions are right around league average, but the walls don't just out toward right-center and left-center making home runs attainable in those directions.
| Field | 654 | True | Speed | Elevation | Apex | Wind | Temperature | Altitude | Standard | Parks | |
| Left | 53% | 387.5 | 103.4 | 29.8 | 89.0 | 2.3 | 1.3 | 0 | 383.8 | 21.3 | |
| Center | 11% | 423.5 | 106.9 | 29.5 | 98.4 | 4.2 | 1.7 | 0 | 417.5 | 22.2 | |
| Right | 36% | 391.0 | 103.9 | 29.8 | 90.2 | 3.4 | 1.1 | 0 | 386.5 | 22.8 | |
Comerica is built for triples with its insanely deep walls in center field. Anyone who can hit homers out there is a man. For such a difficult home run park, its impressive how many homers have been hit there.
| Field | 538 | True | Speed | Elevation | Apex | Wind | Temperature | Altitude | Standard | Parks |
| Left | 64% | 394.7 | 105.1 | 29.3 | 89.2 | 0.9 | 0.2 | 2 | 391.2 | 26.0 |
| Center | 4% | 440.2 | 109.8 | 28.6 | 99.1 | 3.5 | -0.3 | 2 | 434.1 | 28.9 |
| Right | 32% | 388.2 | 103.9 | 29.3 | 87.3 | -0.5 | 0.3 | 2 | 386.0 | 25.1 |
Mile-high air is worth 21 feet in home run distance. Aside from that, there's not much notable about the park. The deep fences do a decent job of canceling out the extreme altitude effects.
| Field | 522 | True | Speed | Elevation | Apex | Wind | Temperature | Altitude | Standard | Parks |
| Left | 48% | 415.5 | 104.7 | 30.0 | 91.5 | 2.1 | 1.1 | 21 | 391.1 | 24.5 |
| Center | 13% | 441.1 | 106.8 | 29.4 | 96.1 | 3.6 | 0.6 | 21 | 416.0 | 19.3 |
| Right | 39% | 414.3 | 104.4 | 29.4 | 88.8 | 1.9 | 0.2 | 21 | 391.6 | 23.1 |
Dodger Stadium's center field doesn't reach 400 feet, so a rather high percentage of homers travel that way.
| Field | 423 | True | Speed | Elevation | Apex | Wind | Temperature | Altitude | Standard | Parks |
| Left | 42% | 402.6 | 105.1 | 29.6 | 91.5 | 2.8 | 0.9 | 2 | 396.8 | 24.5 |
| Center | 18% | 416.6 | 105.8 | 28.6 | 91.8 | 1.7 | 1.3 | 2 | 411.7 | 18.3 |
| Right | 39% | 399.0 | 104.2 | 29.8 | 91.1 | 2.9 | 0.7 | 2 | 393.5 | 23.5 |
Dolphins Stadium is conducive to righties, so long as they can get some loft on their fly balls. Right field is the opposite, as home runs travel farther but not as high. Straightaway center is 400 feet, which is normal, but the walls jut out from there, making home runs into the power alleys difficult. Fly balls are aided by the temperature, though I'm not sure the temperature data accounts for whatever effect humidity might cause.
| Field | 503 | True | Speed | Elevation | Apex | Wind | Temperature | Altitude | Standard | Parks |
| Left | 61% | 390.4 | 103.8 | 29.7 | 90.2 | -0.2 | 4.2 | 0 | 386.3 | 22.8 |
| Center | 7% | 426.5 | 107.9 | 27.3 | 90.5 | 0.9 | 4.4 | 0 | 421.1 | 24.4 |
| Right | 32% | 396.6 | 104.9 | 28.8 | 87.9 | 0.3 | 4.4 | 0 | 391.6 | 26.2 |
You can see how high home runs have to go to clear the Green Monster. Though the relationship is far from strict, ten feet in distance correlates with an extra foot and a half in apex height. But in Fenway, homers to center are 40 feet longer but only half a foot higher on average than those to left.
| Field | 442 | True | Speed | Elevation | Apex | Wind | Temperature | Altitude | Standard | Parks |
| Left | 54% | 385.2 | 102.4 | 31.4 | 93.6 | 5.0 | -0.7 | 0 | 377.7 | 21.7 |
| Center | 9% | 423.3 | 106.7 | 28.8 | 94.1 | 7.3 | -1.6 | 0 | 417.6 | 20.6 |
| Right | 37% | 397.7 | 105.2 | 29.1 | 88.1 | 5.0 | 0.5 | 0 | 393.3 | 25.8 |
Great American seems to be a bit harder on righties than it is to lefties, but it overall plays as a home run hitter's park.
| Field | 675 | True | Speed | Elevation | Apex | Wind | Temperature | Altitude | Standard | Parks |
| Left | 44% | 399.5 | 104.9 | 29.9 | 92.5 | 1.6 | 1.6 | 2 | 394.1 | 24.4 |
| Center | 14% | 418.5 | 105.9 | 29.0 | 93.8 | 2.4 | 2.4 | 2 | 411.6 | 18.1 |
| Right | 42% | 393.7 | 103.8 | 29.9 | 90.5 | 2.3 | 2.1 | 2 | 387.3 | 22.2 |
I would think that it shouldn't be too hard to hit balls out of the Jake to center, but there haven't been too many hit in that direction for some reason.
| Field | 481 | True | Speed | Elevation | Apex | Wind | Temperature | Altitude | Standard | Parks |
| Left | 44% | 392.3 | 103.6 | 30.2 | 91.9 | 0.1 | -0.1 | 3 | 389.7 | 24.4 |
| Center | 11% | 412.2 | 104.8 | 29.0 | 91.6 | 3.3 | 1.2 | 3 | 405.4 | 15.0 |
| Right | 45% | 385.7 | 102.4 | 30.2 | 89.6 | 2.2 | -0.2 | 3 | 381.2 | 20.9 |
Looking at the atmospheric effects, I'm surprised it's so difficult to hit home runs at Kauffman, though the fences are kind of deep to right-center and left-center field.
| Field | 413 | True | Speed | Elevation | Apex | Wind | Temperature | Altitude | Standard | Parks |
| Left | 49% | 404.8 | 105.7 | 30.0 | 94.3 | 0.7 | 2.6 | 4 | 397.9 | 28.0 |
| Center | 15% | 429.0 | 107.8 | 28.6 | 95.4 | 0.3 | 3.5 | 4 | 421.8 | 23.9 |
| Right | 37% | 403.5 | 104.9 | 30.5 | 96.0 | 1.0 | 2.4 | 4 | 396.5 | 26.8 |
I always thought McAfee was a more difficult home run park, but the dimensions aren't bad at all. It does have the worst wind and temperature effects of any park, though.
| Field | 407 | True | Speed | Elevation | Apex | Wind | Temperature | Altitude | Standard | Parks |
| Left | 53% | 389.6 | 104.6 | 29.4 | 89.1 | -1.9 | -1.6 | 0 | 393.0 | 26.2 |
| Center | 12% | 409.5 | 106.5 | 28.9 | 93.5 | -4.7 | -1.7 | 0 | 416.0 | 22.6 |
| Right | 36% | 390.3 | 105.3 | 30.1 | 92.8 | -3.6 | -2.1 | 0 | 396.0 | 26.2 |
It takes some elevation to hit home runs over the baggy in right, but there are a lot of cheap home runs hit in that direction too. A 32.9 degree elevation angle is the highest figure for any field I came up with and 370 feet in standard distance is the lowest to a field either direction of center.
| Field | 413 | True | Speed | Elevation | Apex | Wind | Temperature | Altitude | Standard | Parks |
| Left | 50% | 392.4 | 104.2 | 29.7 | 89.9 | 0.3 | 0.0 | 3 | 388.9 | 25.2 |
| Center | 16% | 426.2 | 108.5 | 27.3 | 89.6 | 0.0 | -0.1 | 3 | 423.1 | 24.4 |
| Right | 34% | 373.6 | 100.2 | 32.9 | 97.4 | 0.0 | 0.1 | 3 | 370.3 | 18.0 |
Down the line to right is nice and short. The apex of home runs to center is unusual.
| Field | 556 | True | Speed | Elevation | Apex | Wind | Temperature | Altitude | Standard | Parks |
| Left | 51% | 397.2 | 104.5 | 29.5 | 90.9 | 0.2 | 0.0 | 2 | 394.8 | 21.7 |
| Center | 15% | 419.4 | 106.7 | 29.9 | 100.0 | 0.2 | 0.5 | 2 | 416.3 | 22.9 |
| Right | 34% | 393.2 | 104.0 | 29.9 | 91.3 | 0.9 | 0.1 | 2 | 389.9 | 20.7 |
That hill out in center sure makes things difficult for power hitters. It's unusual that the wind had an adverse effect on center-field home runs, since normally balls need a little help from the wind to carry that far.
| Field | 531 | True | Speed | Elevation | Apex | Wind | Temperature | Altitude | Standard | Parks |
| Left | 59% | 376.6 | 101.9 | 31.5 | 93.5 | 0.2 | 1.7 | 0 | 374.6 | 19.2 |
| Center | 4% | 429.0 | 108.9 | 28.2 | 95.7 | -0.2 | 0.8 | 0 | 427.9 | 26.7 |
| Right | 37% | 393.7 | 104.9 | 29.1 | 88.3 | 0.3 | 1.8 | 0 | 391.5 | 24.2 |
There's not much of a sample for Nationals Park, but it seems to play around league average, unlike RFK which was cavernous.
| Field | 145 | True | Speed | Elevation | Apex | Wind | Temperature | Altitude | Standard | Parks |
| Left | 50% | 397.2 | 105.1 | 29.0 | 88.1 | 1.6 | 1.2 | 0 | 394.5 | 25.6 |
| Center | 19% | 412.2 | 105.5 | 28.4 | 90.2 | 1.8 | 2.2 | 0 | 408.1 | 16.7 |
| Right | 32% | 389.1 | 102.5 | 30.8 | 92.6 | 1.5 | 2.5 | 0 | 384.9 | 21.7 |
Oriole Park is definitely a home run haven thanks to friendly atmospherics and a short fence in left.
| Field | 570 | True | Speed | Elevation | Apex | Wind | Temperature | Altitude | Standard | Parks |
| Left | 50% | 388.1 | 102.9 | 29.7 | 87.7 | 2.3 | 2.6 | 0 | 383.1 | 21.3 |
| Center | 12% | 415.6 | 105.9 | 28.7 | 92.8 | 1.4 | 2.1 | 0 | 412.1 | 18.9 |
| Right | 37% | 393.4 | 103.5 | 30.3 | 91.7 | 2.7 | 2.8 | 0 | 387.8 | 23.9 |
Petco is death to righties. Wind might blow from left to right in Petco more often than not. Straightaway center isn't so deep, but the fences in the alleys extend out to 400 feet.
| Field | 414 | True | Speed | Elevation | Apex | Wind | Temperature | Altitude | Standard | Parks |
| Left | 54% | 390.1 | 104.3 | 29.7 | 90.4 | 0.5 | -0.6 | 0 | 390.0 | 26.1 |
| Center | 18% | 417.5 | 106.5 | 28.8 | 93.7 | 4.1 | -0.9 | 0 | 414.3 | 18.5 |
| Right | 29% | 396.5 | 104.3 | 29.7 | 89.5 | 5.9 | -0.3 | 0 | 390.7 | 26.7 |
PNC plays similarly to Petco, except it is even harder on righties and even easier out to center. Jason Bay must be happy getting out of that ballpark and into Fenway where he can pepper the left-field wall.
| Field | 418 | True | Speed | Elevation | Apex | Wind | Temperature | Altitude | Standard | Parks |
| Left | 46% | 401.5 | 105.3 | 29.2 | 89.5 | 2.1 | 1.3 | 3 | 395.1 | 27.6 |
| Center | 15% | 415.2 | 104.8 | 29.8 | 95.9 | 2.6 | 1.8 | 3 | 407.7 | 16.2 |
| Right | 39% | 394.1 | 103.8 | 31.0 | 95.3 | 1.1 | 0.9 | 3 | 388.9 | 24.7 |
I almost feel bad for Nationals hitters who had to play in this behemoth of a stadium.
| Field | 285 | True | Speed | Elevation | Apex | Wind | Temperature | Altitude | Standard | Parks |
| Left | 54% | 395.6 | 104.5 | 30.3 | 93.5 | 0.9 | 2.5 | 0 | 392.1 | 27.3 |
| Center | 11% | 426.8 | 108.4 | 27.7 | 93.0 | -0.2 | 0.9 | 0 | 425.8 | 26.3 |
| Right | 35% | 397.5 | 104.5 | 30.9 | 96.9 | 1.8 | 2.1 | 0 | 393.4 | 27.8 |
It's impressive that there was an above average amount of home runs in the Rogers Centre and also above average distances.
| Field | 505 | True | Speed | Elevation | Apex | Wind | Temperature | Altitude | Standard | Parks |
| Left | 54% | 398.3 | 105.8 | 29.6 | 92.1 | 0.9 | 0.0 | 1 | 396.1 | 26.3 |
| Center | 12% | 425.9 | 108.5 | 28.1 | 94.7 | -0.5 | 0.1 | 1 | 425.1 | 25.3 |
| Right | 34% | 397.6 | 105.6 | 29.4 | 90.9 | -0.3 | -0.2 | 1 | 396.9 | 27.1 |
Safeco is awful for right-handed power hitters. It was an odd decision for the Mariners to go after Adrian Beltre and Richie Sexson.
| Field | 448 | True | Speed | Elevation | Apex | Wind | Temperature | Altitude | Standard | Parks |
| Left | 48% | 386.2 | 103.8 | 30.2 | 91.2 | 1.2 | -1.7 | 0 | 386.7 | 27.2 |
| Center | 9% | 413.9 | 106.7 | 28.7 | 94.0 | 0.4 | -2.0 | 0 | 415.6 | 23.2 |
| Right | 43% | 385.8 | 103.1 | 29.9 | 88.9 | 2.5 | -2.3 | 0 | 385.5 | 23.7 |
If you thought Shea Stadium was a pitcher's park, wait until you see how Citi Field plays.
| Field | 499 | True | Speed | Elevation | Apex | Wind | Temperature | Altitude | Standard | Parks |
| Left | 48% | 391.6 | 103.2 | 30.8 | 93.8 | 4.5 | 0.5 | 0 | 386.6 | 23.7 |
| Center | 6% | 420.6 | 106.2 | 30.2 | 100.4 | 3.6 | 0.9 | 0 | 416.2 | 21.0 |
| Right | 46% | 397.0 | 105.1 | 29.4 | 90.2 | 1.9 | 0.7 | 0 | 394.4 | 24.8 |
The Trop conforms to league averages except to center where the walls are very deep.
| Field | 528 | True | Speed | Elevation | Apex | Wind | Temperature | Altitude | Standard | Parks |
| Left | 52% | 388.9 | 103.7 | 30.0 | 90.6 | 0.2 | 0.9 | 0 | 388.0 | 24.2 |
| Center | 10% | 422.6 | 107.5 | 28.6 | 95.3 | 0.0 | 0.9 | 0 | 421.9 | 26.4 |
| Right | 39% | 392.2 | 104.5 | 29.0 | 87.4 | 0.0 | 0.8 | 0 | 389.7 | 24.7 |
Turner Field is deep down the lines, but hitters get a lot of help from altitude, wind, and temperature.
| Field | 502 | True | Speed | Elevation | Apex | Wind | Temperature | Altitude | Standard | Parks |
| Left | 49% | 404.3 | 105.7 | 29.4 | 91.6 | 0.5 | 2.9 | 4 | 397.1 | 26.2 |
| Center | 17% | 423.6 | 106.0 | 29.7 | 98.0 | 2.6 | 3.3 | 4 | 414.1 | 19.5 |
| Right | 34% | 400.9 | 104.3 | 30.3 | 93.4 | 2.3 | 2.8 | 4 | 392.0 | 25.9 |
I had always thought that there was a jet stream of wind that forced balls out of U.S. Cellular, but it appears that the park is friendly to home runs only because of the crazy-short fences. The deepest part of the park might not even reach 390 feet.
| Field | 662 | True | Speed | Elevation | Apex | Wind | Temperature | Altitude | Standard | Parks |
| Left | 59% | 387.6 | 103.4 | 30.5 | 92.3 | 1.3 | -0.4 | 2 | 384.3 | 21.5 |
| Center | 12% | 417.5 | 105.6 | 28.9 | 92.7 | 2.9 | 1.0 | 2 | 411.4 | 18.3 |
| Right | 29% | 391.0 | 103.8 | 29.2 | 87.3 | 1.5 | -0.4 | 2 | 387.6 | 22.4 |
Wrigley Field is windy, who would've guessed? I don't think that the park has much to do with the Cubs' decision to stock up on right-handed bats.
| Field | 552 | True | Speed | Elevation | Apex | Wind | Temperature | Altitude | Standard | Parks |
| Left | 62% | 393.5 | 103.2 | 29.6 | 87.9 | 4.6 | 0.9 | 2 | 386.0 | 19.0 |
| Center | 15% | 421.2 | 105.2 | 30.5 | 98.6 | 9.6 | 1.1 | 2 | 408.5 | 15.9 |
| Right | 23% | 401.0 | 104.4 | 30.2 | 92.5 | 5.9 | 0.9 | 2 | 392.0 | 23.9 |
There's been a lot of talk about the new Yankee Stadium playing like a bandbox, but the old stadium wasn't so bad itself. The short right-field porch allowed the Yankees to stack up on lefties, so there has been a higher percentage of homers hit to right in Yankee Stadium than any other park.
| Field | 533 | True | Speed | Elevation | Apex | Wind | Temperature | Altitude | Standard | Parks |
| Left | 37% | 397.1 | 105.4 | 30.0 | 92.9 | 2.9 | 0.4 | 0 | 391.7 | 26.8 |
| Center | 10% | 425.0 | 107.5 | 28.1 | 91.7 | 5.2 | 0.8 | 0 | 418.8 | 21.7 |
| Right | 54% | 379.1 | 101.8 | 30.6 | 89.3 | 2.8 | 0.6 | 0 | 375.5 | 21.4 |
Next time, I will look at a team's home runs at home compared to a team's home runs away from home. The ultimate goal is to find how certain park's effects on certain players.
| Baseball Beat | April 20, 2009 |
How I Ruined My Ted Williams and Mickey Mantle Autographed Baseball
Let me set the stage. The date was June 13, 1971. I was three weeks short of my 16th birthday. My sophomore year at Lakewood High School was winding down. Finals were over, summer was about to begin, and my mind was on baseball.
Given my age, I wasn't paying close attention to the news outside of the baseball world. Little did I know (or care) that the New York Times published the Pentagon Papers, a top-secret Department of Defense study of America's involvement in the Vietnam War, in the Sunday newspaper that very day.
Closer to home (literally), I had no idea that Frank Sinatra was honored with a gala farewell that evening at the Music Center in Los Angeles. Ol’ Blue Eyes returned in November 1973 in "Sinatra - The Main Event" at Madison Square Garden.
Now, thirty-eight years later, I'm much more attuned to political news and Sinatra's music has its own playlist on my iPod. But, on the morning of June 13, 1971, I was thinking about one thing and one thing only: Ted Williams and the Washington Senators were in town to play the California Angels.
Courtesy of my Dad, who was Director of Public Relations and Promotions for the Angels, I had a pair of tickets that afternoon. I invited my longtime friend and high school basketball teammate Matt Cooper to the game. Matt had turned 16 several months before and he not only had a driver's license but his own car, a 1968 Pontiac Bonneville. Having a friend with wheels is important to any teenager. We went to a lot of games that summer.
On this particular day, Matt picked me up at my house between 9:30 and 10 a.m. Although the Angels-Senators game wasn't scheduled to begin until 2 p.m., we had one pit stop to make before heading to Anaheim Stadium. The Sheraton, a castle-themed hotel right off the Santa Ana Freeway, was the home of the Senators when the club was in Anaheim.
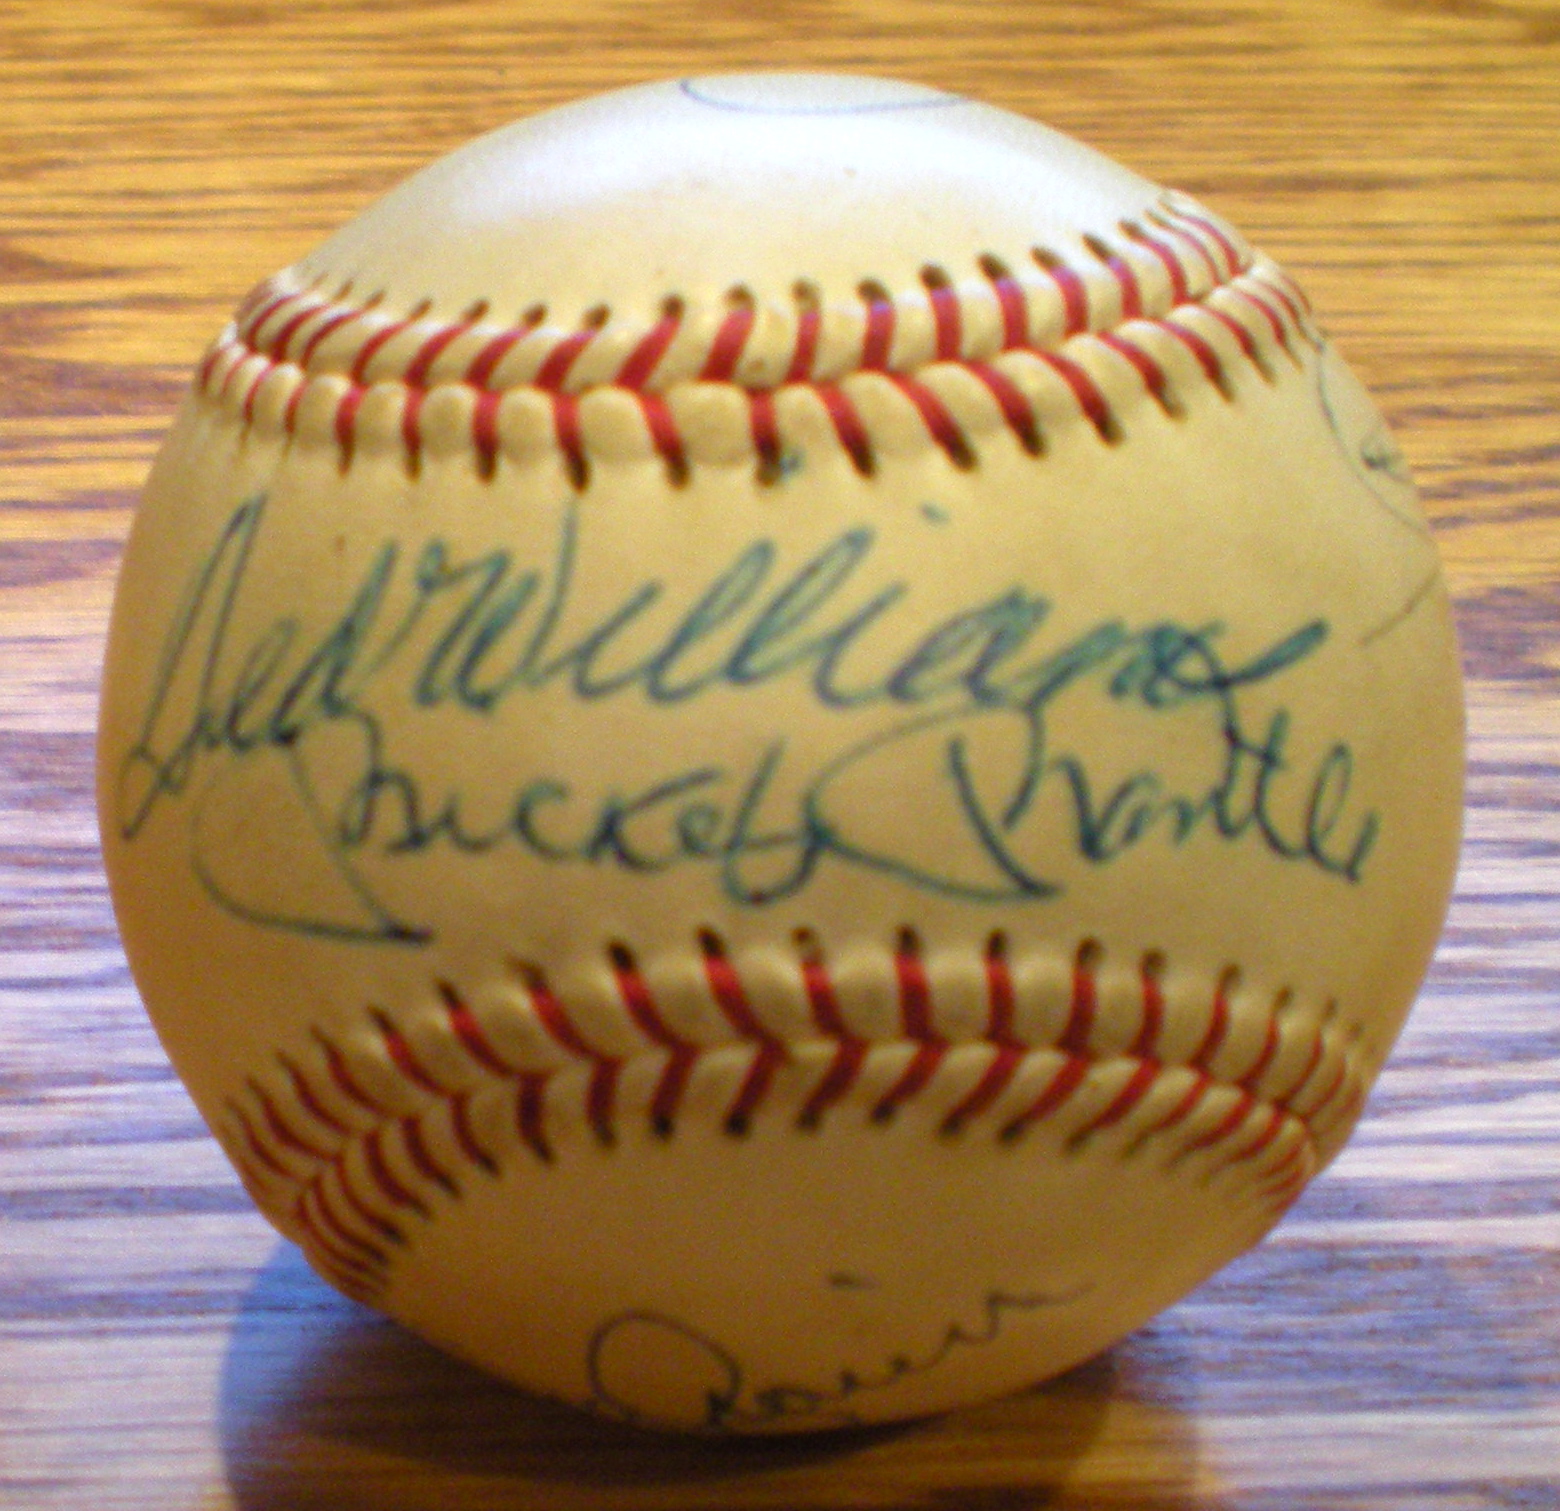 I was determined to add Ted Williams' signature to a ball that had been autographed by Mickey Mantle. Williams and Mantle. Now THAT would be an autographed baseball to pass down to my children. I had the ball, a blue ballpoint pen, and my game face on. I knew exactly what I wanted. I wasn't interested in getting Paul Casanova or Tim Cullen or Del Unser or Larry Biittner (double "i" and double "t"...I spelled it right!) to sign an autographed book or even their baseball cards. On this day, I was going to get their manager's signature. And nothing else.
Matt parked his car within steps of the team bus. We positioned ourselves between the hotel exit and the bus, waiting for "Mister" Williams, as I would call him, to emerge from the lobby. Ever the gentleman — at least with kids — Williams stopped in his tracks and paid special attention to the ball that I handed him.
As Williams was affixing his beautiful signature on the sweet spot above Mantle's gorgeous autograph, he said to me, "This is a special ball. You've got two Hall of Famers on there. Make sure you take good care of it."
Hall of Famers, ehh? Hmm. I was actually thinking much bigger than Williams. I thought I had the signatures of two of the greatest players in the history of the game on that ball. But he got me thinking, "I could turn this ball into one devoted to Hall of Famers." And Hall of Famers to be. See, Mantle had not been inducted into the HOF yet. While the Mick was retired, he was still three years away from his day in Cooperstown.
Just about the time my mind was focused on securing the autographs of Hall of Famers, out walks Denny McLain. You know, the 27-year-old pitcher with back-to-back Cy Young Awards in 1968 and 1969 and a Most Valuable Player Award, too. McLain, in fact, was the first pitcher in the history of the American League to win the Cy Young and MVP in the same season. He had three 20-win campaigns under his belt, including 31 victories in 1968, the first to win 30 games in a single season since Dizzy Dean in 1934. I mean, this guy was 117-62 with a 3.13 ERA. Little did I know that his ERA+ was only 110 at that point. I knew I should have been paying more attention to sabermetrics back then. Damn. Damn. Damn.
 With "now this is my chance to add a third Hall of Famer to my ball" ringing throughout my head, I hand McLain my prized possession and ask him politely for his autograph. He grabs it and signs his name diagonally right smack in the middle of a separate panel on the ball.
I remember being more upset about the location of McLain's autograph than the signature itself. I don't know if Denny scrawled his name on my ball not knowing that Mantle and Williams had already signed it or if he did so purposely given his dislike for the Washington manager. Either way, the latest autograph didn't compare in stature or beauty to the other two. But, hey, a Hall of Famer is a Hall of Famer, right?
If anything, I was so psyched by the prospect of adding to my themed baseball that I checked the Angels schedule and learned that the Boston Red Sox were going to be in town on Monday, Tuesday, and Wednesday. Matt and I headed back to the visiting team's hotel on one of those late afternoons or early evenings before what was then an 8 p.m. start time.
This time I set out to get Carl Yastrzemski's autograph. Yaz was only 31 at the time, but he had an MVP, a Triple Crown, three batting titles, and five Gold Gloves to his credit. Heck, he even had an OPS+ of 142 going into that season. As was the case with McLain, forget the fact that Yastrzemski was in the middle of his worst season ever. I know a Hall of Famer when I see one and these two guys were Hall of Famers, let me tell you.
Like McLain, Yaz positioned his less than bold signature on another panel that would make it difficult for anyone else to add their name next to his. I also added one more autograph either that evening or on the same day when I got Williams and McLain to sign my ball. The signature is none other than that of Joe Cronin, who was the president of the American League at that time. A major league player (1926-1945), manager (1933-1947), general manager (1948-1958), and/or president (1959-1973) for 48 consecutive years, he was inducted into the Hall of Fame in 1956.
I did well with Williams, Mantle, Yastrzemski, and Cronin, but "not so much" with McLain. While four out of five ain't bad when it comes to most baseball endeavors, 80 percent doesn't get the job done with respect to putting together a Hall of Fame autographed ball. As it turns out, I would have been better off getting McLain's father-in-law to sign the ball — at least Lou Boudreau was a Hall of Famer.
You might say that I learned one of my first — and hardest — lessons about pitchers... if not that day in June, then certainly two years later when the 29-year-old McLain was released by the Atlanta Braves, never to appear in a major-league game again. He "retired" with 131 wins and one disgruntled fan in Long Beach.
Denny McLain may be Dennis Dale McLain to his mom and dad. But he's Denny Effing McLain to me.
* * *
Do you have a similar story to share?
| Behind the Scoreboard | April 18, 2009 |
Does a Quirky Home Field Cause a Road Disadvantage?
Last week I wrote an article on home field advantage and what types of parks are conducive to particularly large or small home field advantages for a team. Its conclusion was that unusual and idiosyncratic parks give teams the biggest home field advantage. This week's column expands on the topic, tweaking the model a bit and studying additional effects of home and road performance of teams in various ballparks.
Last week I suggested that since unusual parks give the largest difference between home and road WPCT, that unusual parks were the most advantageous to teams overall. The assumption was that all teams play to their true skill level on the road, with the home park effect taking hold only when the teams were at home.
Several people challenged this assumption and hypothesized that perhaps an especially high difference between home and road performance may be due to an unusual home park giving teams a road disadvantage. This is a very difficult distinction to make, but here I'll try to do so statistically.
One way to look at this is to test for a correlation between overall winning percentage and the difference between home and road records. A positive correlation would indicate an overall positive effect for having a high home/road difference, while a negative correlation would indicate the road disadvantage that others have hypothesized about. However, the correlation (which we would expect to be very weak in any case) between home/road difference and overall winning percentage was not significant either way. The p-value of the correlation was .61 when using year-by-year data, and was .96 when using aggregated winning percentages for each park. So this is an inconclusive test - we don't see evidence of a high home/road difference really helping teams, but we don't see it hurting either.
Another approach is to take a look at players who moved from a regular park to an idiosyncratic park, or vice-versa. If the road disadvantage hypothesis is correct, then we would expect the raw road performance of players to decrease when playing for the team with the unusual park.
For this, I did a case study of two parks with extremely high home/road splits where this road disadvantage might be evident: Coors Field and the Astrodome. One of course, is an extreme hitters park, whereas the other is an extreme pitchers park. Both conferred a very large home field advantage to their teams.
Overall I found 131 cases of players moving either in or out of these two parks in adjacent years with significant playing time (250 PA's for hitters, 100 IP for pitchers). For both hitters and pitchers I looked at the difference in Road OPS when playing for either the Rockies or Astros and when they were playing for another team in an adjacent year.
Unfortunately, this method is fraught with variance. Players' statistics can change dramatically from year to year for many other reasons besides what park they are playing in, and this clouds the study. Additionally, bias could be introduced due to the effects of coaching staffs and other factors. Due to this and a relatively few number of cases, it is difficult to detect if such a road disadvantage is occurring. The results of the study can be seen below.
Both Rockies hitters and pitchers tended to have better road statistics in years when they were not playing for Colorado. Astros pitchers also had this same result, but Astros hitters performed better on the road when they were playing for Houston than for another team. When taking all 131 players together, we see an overall decrease in road performance when playing for the team with an unusual park of 7 OPS points. However, the standard error of this estimate is 10 points of OPS, meaning that we are far from being able to make any conclusions on whether an odd home park really causes players to perform more poorly on the road.
In lieu of concrete statistical results, a discussion might be useful. The original findings were that teams with unusual home parks tend to have larger home/road splits. A good reason for this may be that visitors, not familiar with the park, may not be able to deal with the park's quirks as well as the home players can, since they have had more practice.
Certainly it would seem that learning one park's difficult oddities wouldn't cause a player to forget how to play in normal parks. A sailor who learns on rough seas can sail in calm seas as well. It seems doubtful that an outfielder who learns the Wrigley wind and ivy should suffer any disadvantage when playing elsewhere - after all, the conditions are easier and he still gets plenty of practice playing 81 games per year on the road. Similarly, will a player who plays in a dome forget what it's like to play outside even though he does so for nearly half the season on the road? To me it seems as though if unfamiliarity is the main reason for high home/road splits, then a player's road performance would be consistent, since all players are familiar with playing on the road (in a variety of parks) half the year.
However, it does seem as though a player playing in an extremely unusual ballpark could develop bad habits that would carry over to his road games, giving him a road disadvantage. For instance, playing one's home games in the LA Coliseum could cause players to get into the habit of popping up balls down the line for cheap homers - a habit that would cause him great harm in most normal parks. How much players can control their habits depending on their surroundings is unknown, but this could be a reason why an odd home park could cause a road disadvantage. Whether the road disadvantage would outweigh the home advantage in this case is a matter of debate.
After reviewing all of the evidence and arguments here, I'm still inclined to say that teams with quirky home parks are helped overall by their park and I would highly doubt that teams are actually hurt overall by having a quirky park. I will say this with one caveat however, and that is that teams with an odd park could have trouble attracting top talent (such as pitchers to Coors Field or hitters to the Astrodome) and in the era of free agency, this could be a very big disadvantage indeed. However, that is a conversation for another day.
Update to Last Week's Study
Last week, a thoughtful commenter made a great point that perhaps Coors Field carried too much weight in my study, considering the fact that the magnitude of its home field advantage is an outlier and its altitude makes it a unique park, not replicable elsewhere. Looking at a few regression diagnostics, indeed Coors Field had a large impact on the findings in the model - and while its inclusion is defensible, it's probably preferable to have its influence lessened by reducing its weight considerably. After doing so, the basic results are the same - unusual parks are of the most advantage - however, I'd like to share a few additional findings that this change produced.
The findings were, in order of importance:
1) Parks which were subjectively considered "quirky" had a greater home field advantage. This was still the most important predictor of home field advantage. P-value <.001
2) Parks which produced a lot of doubles still produced a high home field advantage. P-value=.002
3) Domed stadiums produced a higher home field advantage. This new finding was partially due to a reconfiguring of the "dome" variable, as well as the reduction of influence of Coors. P-value=.016.
4) Pitchers parks provide a greater home field advantage, though being a hitters park is not a disadvantage. In fact, playing in a hitters park is better than playing in a neutral park. The following graph shows the relationship between park factor and home park advantage. This is a change from last week's findings, which showed that hitters and pitchers parks were both equally superior to neutral parks - however, without the over-influence of Coors, we find that pitchers parks clearly provide a higher advantage.
5) Strikeouts and triples, which were marginally significant before, are now not at all significant.
Additionally, I wanted to give a complete list of ballparks and their predicted home field advantages for readers to use as a reference. It's also particularly interesting for relatively new parks, where the predicted value may be more accurate than the actual empirical home field advantage since this is highly variable over only a few seasons.
Of parks built in the last 10 years, Minute Maid Park and AT&T Park should continue their excellent home field advantage, while Petco Park, so far not giving the Padres much advantage, should improve to be a very advantageous parks. On the other side, Citizens Bank Park, which has so far provided a very poor advantage, should continue to do so (though not quite as bad as its been), and New Busch and Nationals Stadium should see their home field advantage decline from what it has been during each stadium's first few years. When we check back in 20 years or so, we'll see if these assessments have been correct.
| F/X Visualizations | April 17, 2009 |
What Did We Know This Time Last Year?
This early in the season the leader and laggard boards often have some interesting names, and it is fun to theorize which of these are legitimate breakouts (or breakdowns) and which are small sample size flukes. The pitchf/x data adds a powerful tool in helping with this classification. It allows us to look deeper into why a pitcher may have struggled or succeeded in a start. We have already seen some great analysis along these lines. RJ Anderson has a series of posts looking at Lincecum's, Sabathia's and Wheeler's performances thus far based on pitch speed and movement and release point. River Avenue Blues broke down Wang's first two games to see what might be up.
These are good examples of using all the data pitchf/x offers to assess recent performance. Of course what often happens is people just look at fastball speed and ignore movement, location, and release point data. For example after Cole Hamels first poor start everyone focused on his 86 mph fasball, but, as Hamels said himself, he started off with a fastball in the mid-80s early last year too. The image below shows Hamels's average fastball speed by start. The x-axis is not scaled by date, but by start (so no matter how far apart in time two consecutive starts are they are always the same distance apart along the x-axis). The division between seasons in marked with a red line.
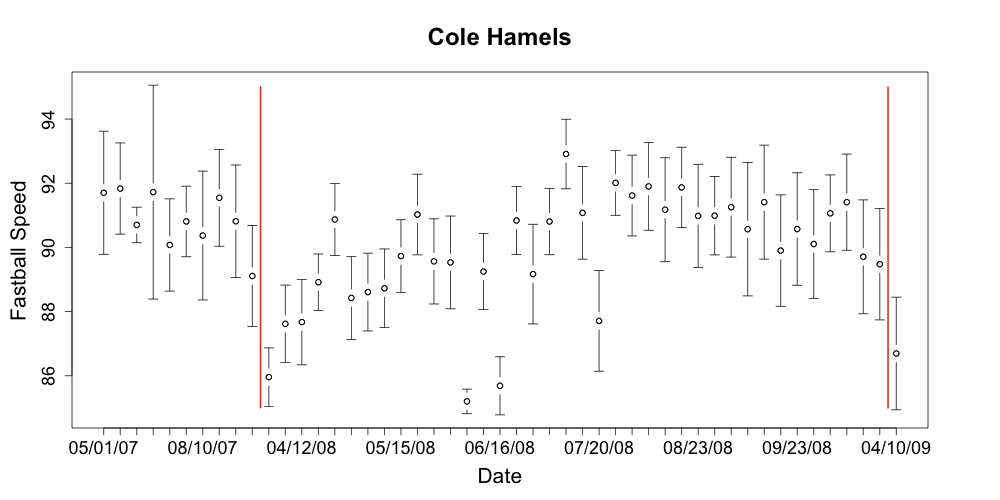
Hamels's fastball speed is right where it was last year (not to say that we should be worry free about Hamels; last year he pitched 261 innings after just 189 in 2007). This provides a useful way to see if a pitcher's speed is within his normal variation. Consider Wang:
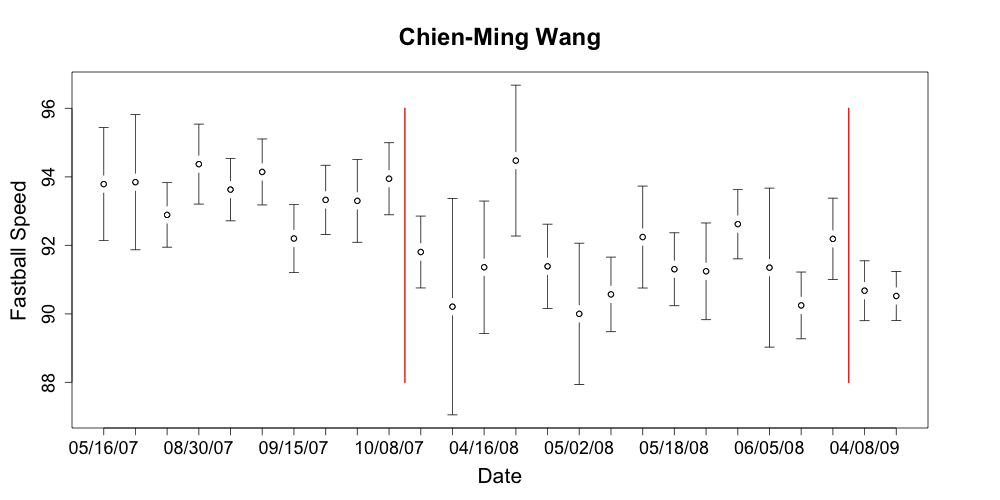
His fastball in his injury shortened 2008 was 2 mph slower than his fastball in 2007. For his first two starts of 2009 it is in the low range of his already low 2008 numbers. That could mean trouble.
As I noted earlier the best pitchf/x analysis will take into account all the data, but most people will be lazy. Like I just did, they will look at just fastball speed. So I wanted to know how much we could learn only looking at that. More specifically what can we say about performance for the rest of the season looking just at fastball speed thus far into the season. I looked back at last year to find out. Most starters have started two games with about 100 pitches per start, about half of them fastballs. So what can we know with 100 fastballs worth of data?
I started off with the average speed of every pitcher's first 100 fastballs in 2008 and then compared that with his average fastball speed for all of 2007. I wanted to see how well that pitcher performed from that point forward, so I found their FIP from the game after they reached their 100th fastball on in the 2008 season. (FIP stands for fielding independent pitching. Developed by Tangotiger, it roughly gives the expected ERA of a pitcher if he pitched in front of an average defense). From that I subtracted that player's preseason CHONE projected FIP (CHONE is one of the best projection systems. It was created by Sean Smith). The result is how the pitcher performed over the rest of the season relative to his projection. Here are the players with the biggest increase and decrease in fastball speed.
The second column is how much faster (or slower) the player's first 100 2008 fastballs were compared to his 2007 fastballs. A positive number is a faster fastball in 2008. The third is FIP minus projected FIP. Like ERA a low FIP is good, so a negative difference is outperforming the projection.
+---------------------+--------------+----------------+
| Name                | FB speed dif | FIP - proj FIP |
+---------------------+--------------+----------------+
| Ervin Santana	      |         2.28 |          -1.16 |
| Tim Lincecum        |         1.65 |          -0.83 |
| Josh Beckett        |         1.36 |          -0.45 |
| John Maine          |         1.07 |           0.10 |
| Santiago Casilla    |         1.06 |           0.92 |
| Wandy Roriguez      |         0.96 |          -0.84 |
| Manny Delcarmen     |         0.89 |          -0.86 |
| Wilfredo Ledezma    |         0.82 |          -0.05 |
| Shaun Marcum        |         0.79 |          -0.26 |
| Leo Nunez           |         0.77 |           0.05 |
+---------------------+--------------+----------------+
| Francisco Rodriguez |        -2.34 |           0.05 |
| Mike Mussina        |        -2.34 |          -1.37 |
| Daniel Cabrera      |        -2.49 |           0.82 |
| Brad Lidge          |        -2.51 |          -1.10 |
| Jeff Suppan         |        -2.61 |           0.80 |
| Oliver Perez        |        -2.81 |           0.21 |
| Chris Young         |        -3.42 |           0.41 |
| Bob Howry           |        -3.89 |           0.84 |
| Cole Hamels         |        -3.90 |           0.15 |
| Heath Bell          |        -4.01 |           0.30 |
+---------------------+--------------+----------------+
Although there is considerable variation seven of the ten pitchers with the largest increases in fastball speed outperformed their projection and eight of the ten with the largest decrease underperformed their projection. In addition the top two were two of the biggest breakout pitching performances of last year and you could have seen it just 100 fastballs into the season. Of course the trend is not perfect, 100 fastballs into the season Brad Lidge, Mike Mussina, Hamels and Francisco Rodriguez were way below their 2007 averages and they all had great seasons (although Hamels's and Rodriguez's performances were slightly worse than projected). Here are the results for all players.
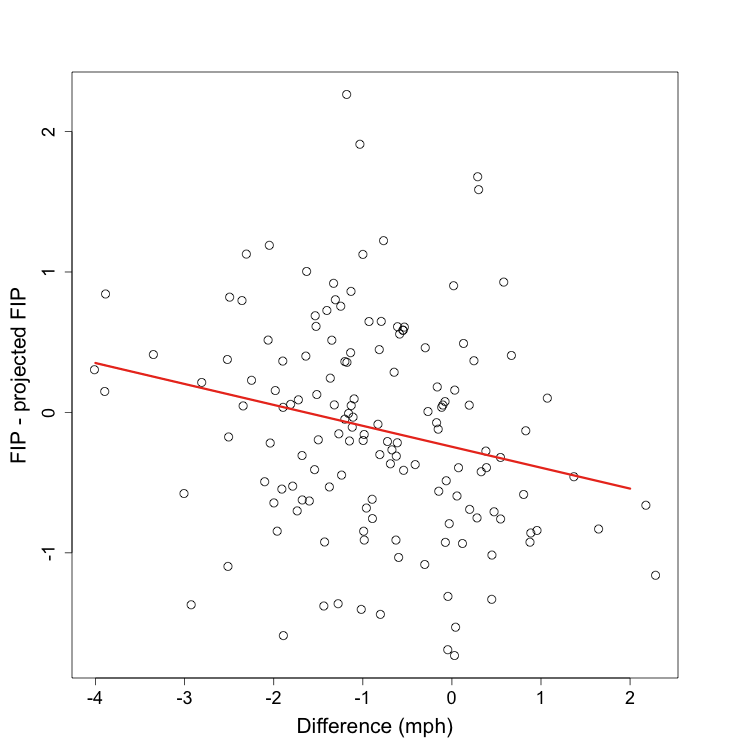
The relationship is very significant ( p < .01), but explains little of the variation (r2= 0.05). The equation for the best fit line is y = -0.24 - 0.15x. Where x is the difference in fastballs speeds (first 100 '08 fastballs minus '07 fastballs) and y is remaining 08 FIP minus projected FIP. So an increase of one mph is worth a 0.15 decrease in FIP (or each decrease of a mph is worth an increase of 0.15 FIP). Also if a pitcher is throwing just as fast in his first 100 fastballs of the season as he was all of last season (x = 0) you expect him to outperform his projection by almost 0.25 runs. If you thought going into the season he was a 4.00 FIP (or ERA) pitcher and his first 100 fastballs are just as fast as his fastballs the year before you would expect him to be a 3.75 FIP (or ERA) pitcher. But there is so much unexplained variation (95% in fact) this pitcher could end up performing very well or very poorly.
So, although the trend is significant, there is so much unexplained variation I would say with just the speed of the first 100 fastballs we don't know that much more than before. But that will not stop me from posting this season's leaders and laggards in fastball speed difference. Some of the pitchers have not reached the 100 fastball cutoff used in the above analysis. Remember someone at the top of the list could end up with very poor performance relative to projection, like Santiago Casilla last year. A pitcher at the bottom could end up like Mussina.
 Greatest difference between 09 fastball speed thus far and 08 fastball speed

+-------------------+--------+--------+
| Name              | Number |    Dif |
+-------------------+--------+--------+
| Todd Coffey       |     61 |   1.93 |
| Justin Verlander  |    119 |   1.81 |
| Kevin Correia     |    109 |   1.23 |
| Jonathan Sanchez  |     74 |   1.14 |
| Josh Johnson      |    163 |   1.14 |
| Matt Albers       |     55 |   1.13 |
| Chirs Volstad     |    117 |   1.09 |
| Adam Eaton        |     55 |   1.09 |
| Armando Galarraga |     97 |   0.98 |
| Jason Marquis     |    105 |   0.94 |
+-------------------+--------+--------+
| Geoff Geary       |     63 |  -2.04 |
| Matt Harrison     |     59 |  -2.05 |
| Daniel Cabrera    |    131 |  -2.25 |
| Manny Delcarman   |     68 |  -2.26 |
| Oliver Perez      |    126 |  -2.39 |
| Joe Saunders      |    128 |  -2.44 |
| Daisuke Matsuzaka |     62 |  -2.44 |
| Hideki Okajima    |     55 |  -2.66 |
| Dana Eveland      |     91 |  -2.88 |
| Dennis Sarfate    |     67 |  -3.12 |
+-------------------+--------+--------+
With all the caveats I will still venture that the pitchers at the top of the list, as a whole, out-perform their projections and the pitchers at the bottom under-perform. It will be interesting to see if any of the names on the top of this list turn out to be this season's Tim Lincecum or Ervin Santana.
Sorry this post was a little light on visualizations. I promise my next post will make up for it.
| Designated Hitter | April 16, 2009 |
Precisely Inaccurate
Perhaps the widest and deepest pitfall lying in wait for any who deal in numerical analyses is forgetting the distinction between precision and accuracy. If I state that Team X's opening-day first pitch was delivered at 1:07:32 pm, I am being quite precise; but if in fact it was a night game, then the statement that the pitch was made sometime between 7:35 and 7:40 pm, though far less precise, is far more accurate.
It is all too easy to be hypnotized by the ability to calculate some metric to a large number of decimal places into believing that such precision equates to accuracy. As a case in point, let us look over the concept of "park factors". It is undoubtable that ballparks influence the results that players achieve playing in them, and in many cases--"many" both as to particular parks and as to particular statistics--those influences are substantial. Park factors are intended as correctives, numbers that ideally allow inflating or deflating actual player or team results in a way that neutralizes park effects and give us a more nearly unbiased look at those players' and teams' abilities and achievements. So much virtually everyone knows.
The idea behind the construction of park factors, stated broadly, is to compare performance in a given park with performance elsewhere. As an example, a widely used method for educing park factors for a simple but basic metric, run scoring, is the one used by (but not original to) ESPN. The elements that go into it are team runs scored (R) and opponents' runs scored (OR) at home and away, and total games played at home and away.
           (Rh + ORh) ÷ Gh
  factor = ───────────────
           (Ra + ORa) ÷ Ga
That comes down to average combined (team plus opponents) runs scored per game at home divided by the corresponding figure for away games. Let us see what some of the things wrong with that basic approach are, and if we can improve on it.
A "park factor" is supposed to tell us how the park affects some datum--here, run scoring. Perhaps the most obvious failing of the ESPN method is made manifest by the simple question compared to what? In the calculation above, run scoring at Park X is being compared to run scoring at all parks except X. Thus, each park for which we calculate such a factor is being compared to some different basis: the pool of "away" parks for Park X is obviously different from the pool of "away" parks for Park Y (in that X's pool includes Y but excludes X itself, while Y's includes X but excludes Y itself). Now that rather basic folly can be fairly easily corrected for; let's call the average combined runs per game at home and away RPGh and RPGa, respectively. Then, if there are T teams in the league,
                        RPGh
  factor = ───────────────────────────────
           {[RPGa x (T - 1)]   [RPGh]} ÷ T
But there remain considerable problems, the most obvious being that the pools are still not identical, in that schedules are not perfectly balanced: Teams X and Y can, and probably do, play significantly different numbers of games in each of the other parks. Even if we throw out inter-league data, which is especially corrupt owing to the variable use of the DH Rule, we still have differing pools for differing teams, at least by division (and possibly even within divisions, owing to rainouts never made up). Well, one thinks, we can see how to deal with that: we would normalize away data park by park, then combine the results, so the "away" pool would, finally, represent the imaginary "league-average park" against which we would ideally like to compare any particular park's effects.
Let us remain aware, however, before we move on, that there are yet other difficulties. We have been using the simple--or rather, simplistic--idea of "games" as the basis for comparing parks' effects on run scoring. But even at that level, there are inequalities needing adjustment, in that the numbers of innings are not going to be equally apportioned among home batters, away batters, home pitchers, and away pitchers, in that a winning team at home does not bat in the bottom of the last inning. There is also the further question of whether innings are the proper basis for comparison. For most stats, the wanted basis for comparison is batter-pitcher confrontations, whether styled PA or BFP. But there are complexities there, too. A batter's ability to get walked, or a pitcher's tendency to give up walks, might seem best based on PAs or BFPs; but higher numbers of walks mean a higher on-base percentage, which means that more batters will get a chance to come to the plate (it is that "compound-interest effect" of OBA that is often not properly factored into metrics of run-generation, individual or team: not only is the chance of a batter becoming a run raised, but the chance of getting that chance is also raised). That will increase run scoring in a manner that a metric measured against PAs will not fully capture. And there are yet other questions, such as whether strikeouts should be normalized to plate appearances or to at-bats.
But for our purposes here--getting a grand overview of the plausibility of "park factors"--such niceties, while of interest, can be set aside. Let's look at the larger picture. Let's say we want to get a Runs park factor for Park X. We have seen that we need to use normalized runs per game on a park-by-park basis if we are to avoid gross distortions from schedule imbalances and related factors. How might that look for a real-world example? Let's take, arbitrarily, San Francisco in 2008. Here are the raw data:
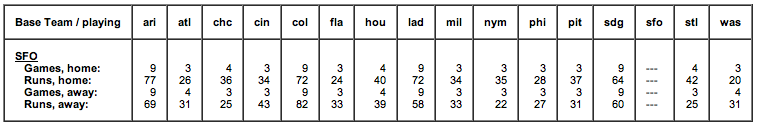
And here are the consequent paired raw factors:
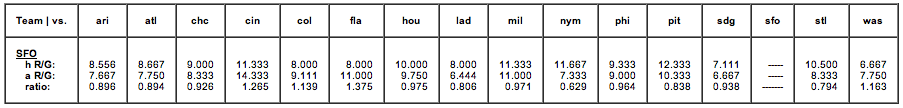
But, because we have used a particular park for these figurings, all those numbers are relative to that park. What we want are numbers relative to that imaginary "league-average" park. For example, if we had chosen the stingiest park in the league, all the factors would be greater than 1; had we chosen the most generous, all the factors would be under 1. But all we have to do is average the various factors--in which process we assign the park itself, here San Francisco (I refuse to use the corporate-name-of-the-day for that or any park), a value of 1, since it is necessarily identical to itself--and then normalize the factors relative to that average. When we do that, we get what ought to be the runs "park factor" for each National-League park relative to an imaginary all-NL average park:

The average is not exactly 1.000 owing to rounding errors, but it's close enough for government work. If we sort that assemblage, it looks like this:
But before we jump to any conclusions whatever about those results, let's ponder this: they were derived from data for one park, one team. Yet, if the methodology is sound, we ought to get at least roughly the same results no matter which park we initially use. Imagine a Twilight-Zone universe in which the 2008 season was played out in some timeless place where each team played ten thousand games with each other team, yet still at their natural and normal performance levels as they were in 2008. Surely it is clear that we then could indeed use any one park as a basis for deriving "park factors" since, in the end, we normalize away that park to reach an all-league basis. In that Twilight Zone world, any variations from using this or that particular park can only be relatively minor random statistical noise. San Francisco is to Los Angeles thus, and San Francisco is to San Diego so, hence Los Angeles is to San Diego thus-and-so (in a manner of speaking). So what do we see if we try real calculations with real one-season data? Let's continue with the National League in 2008. Shown are the "park runs factors" for each park as calculated from each of the other parks as a basis. If the concept is sound, the numbers in each row across ought to be roughly the same. Ha.
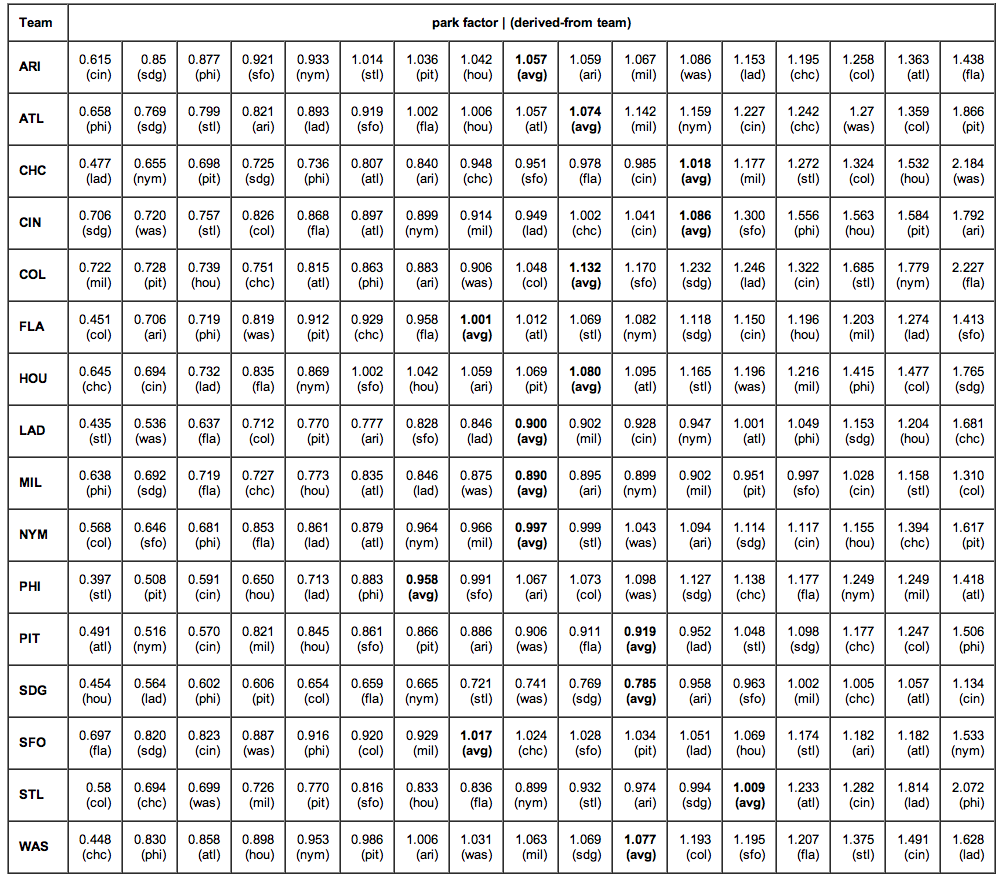
Well, now we know something, don't we? This just doesn't work. But it's not the methodology. Nor is it the various minor factors we saw earlier: those don't produce 3:1 and greater spreads in estimation. No, what we are dealing here, plain and simple, is the traditional statistical bugaboo--an inadequate sample size. Here is a possibly instructive presentation: the averaged run-factor values from that table above compared to what the simplistic ESPN formula yields:
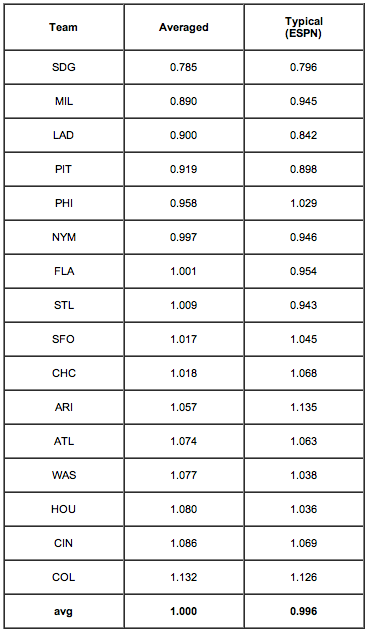
Instructive, indeed. The agreement is not perfect, as we would not expect it to be. The "average" column is a little better than the ESPN column because it allows better for the differing numbers of games on the schedule, but by using the average for each park of the values derived from all the other parks we are approximating the ESPN method.
The entire point of this lengthy demonstration has been to lift the lid off those nice, clean-looking, precise park-effect numbers to show the seething boil in the pot. The end results are not totally meaningless: we can say with fair credibility that San Diego's is a considerably more pitcher-friendly park than Colorado's, and that the Mets and the Marlins were playing in parks without gross distorting effects. But to try to numerically correct any team's results--much less any particular player's results--by means of "park factors" is very, very wrong.
But wait, there's more! (As they say on TV.) If the problem is a shortage of data, why not simply expand the sample size? Use multi-year data? That would be nice, and useful, were no park changed structurally over a period of some years. But consider: not even counting structural changes, in the last ten seasons (counting 2009), a full dozen totally new ballparks have come on line. When one considers that pace, plus the changes (some even to a few of those new parks), it becomes painfully obvious that trying multi-year data is as bad or worse. Even for a particular park that might itself not have been at all changed for many years, there remains the issue that the standard of comparison--that imaginary league-average park--will have changed, probably quite a lot, over that time, owing to changes in the other real parks. So we can't use multi-season values, and single-season values are comically insufficient for anything beyond broad-brush estimations, estimations more qualitative than quantitative.
I should point out that none of this is today's news. In 2007, Greg Rybarczyk at The Hardball Times noted that the home-run "factor" for the park in Arizona was 48 in one season and 116 in the next. Back in 2001, Rich Rifkin at Baseball Prospectus remarked that "Unfortunately, it is problematic to average out a park factor over more than a few years because the conditions of one or more of the ballparks in a league change. New stadiums are built, existing stadiums change their dimensions, and abnormal weather patterns have an impact." (Regrettably, the next sentence was "Nonetheless, a 10-year sample is likely to be more accurate than a one-year accounting.") Probably the defining essay on the subject is the 2007 paper titled "Improving Major League Baseball Park Factor Estimates", by Acharya, Ahmed, D'Amour, Lu, Morris, Oglevee, Peterson, and Swift, published in the Harvard Sports Analysis Collective. But, justifiably proud as they are of their improved methodology, even they concluded that "Unfortunately, the lack of longer-term data in Major League Baseball . . . makes it extraordinarily difficult to assess the true contribution of a ballpark to a team's offense or defensive strength."
Precisely accurate.
Eric Walker has been a professional baseball analyst for over a quarter-century. His paper "Winning Baseball", commissioned by the Oakland A's for the purpose, first instructed Billy Beane in the concepts later called "Moneyball"; Walker has also authored a book of essays, The Sinister First Baseman and Other Observations. Walker is now retired, but maintains the HBH Baseball-Analysis Web Site.
| Change-Up | April 15, 2009 |
Get Off the Ledge: Why Your Team Might Not Stink
We are over a week into the season and there are some promising teams off to crummy starts, as well as some bad teams who have started off the way many expected they would. Today we will have a look at the six last place teams and assess whether there is legitimate cause for long term concern or some bright spots to which fans might cling. We will seek to identify the ominous signs and highlight any glimmers of hope for these six clubs.
For starters, let's compare win-loss records to Pythagorean records to try and identify major disparities. It's conceivable that teams are hitting, pitching and fielding well but not yet closing out wins.
                 W-L         Pythag W-L
Boston           2-6            3-5
Cleveland        1-7            2-6
Texas            3-5            4-4
Washington       0-7            2-5
Houston          1-6            1-6
San Francisco    2-5            2-5
Nope, it does not appear that any team has been particularly unlucky. According to runs scored and runs allowed, they are all pretty much in line with their records. The Rangers have been the best of this bunch, allowing just four more runs than they have scored. So let's run some more in-depth diagnostics to see if we can identify anything that might stand out.
                RS  Rank   OPS  Rank
Boston          29   26   .708   22
Cleveland       38   13   .768   13
Texas           52    2   .857    3
Washington      34   21   .742   20
Houston         16   30   .662   29
San Francisco   27   29   .670   27
               RA  Rank  OPSa  Rank  UZR Rank
Boston         43   19   .838   23      11
Cleveland      64   30   .962   29      29
Texas          56   29   .864   25       9
Washington     54   28   .969   30      25
Houston        43   19   .900   27      22
San Francisco  41   16   .866   26      10
Ok, now we start to get into it. Last season, the San Diego Padres plated the fewest runs in Major League Baseball with 637. Currently Houston is on pace for 370 runs, while San Francisco and Boston are on pace for 625 and 588, respectively. Boston scored 845 last season. You get the point. There are some teams on this list who are absolutely going to improve offensively.
On the pitching side, did you know that Cleveland Indians starters are currently sporting a 10.91 ERA? Anthony Reyes leads their starters with a 6.00 mark. The very highest OPS allowed last season was .817 by the Texas Rangers. However awful you think Washington's run prevention is, they will improve off of their .969 OPS allowed mark. The same goes for every other team on that list.
Now let's look at some balls-in-play data.
Batting
               BABIP  Rank  LD%   Rank
Boston         .261    26   19.4   11
Cleveland      .306    13   21.3    5
Texas          .291    19   18.8   15
Washington     .349     1   22.9    3
Houston        .257    29   17.3   21
San Francisco  .318     9   19.5   10
Pitching
                BABIP  Rank  LD%   Rank
Boston          .322     7   17.8   20
Cleveland       .353     1   20.6    5
Texas           .329     6   22.8    1(t)
Washington      .350     2   22.1    4
Houston         .343     3   20.0   11
San Francisco   .331     5   18.3   17
A couple things stand out to me here. First, on both the hitting and pitching side for the Red Sox, there is considerable dislocation between their balls in play average and their line drive percentage. If a team ranks 11th in line drive percentage, that same team should be reaching base at a pretty good clip when making contact. And yet, the Red Sox find themselves 26th in the league at this point on batting average on balls in play. Similarly, their pitchers are doing a good job preventing opposing hitters from making square contact but they don't have results to show for it. Their .322 balls in play average allowed is the seventh highest in baseball. As time goes on, this should work itself out. Boston fans should take heart in this. Applying the same principles, Cleveland's hitting and San Francisco's pitching also figure to improve.
The next thing that stands out to me is that Washington is hitting the cover off the ball without a win to show for it. Now, they also rank second in Major League Baseball in strikeouts but still. You would think the way they are hitting the ball might translate into more runs.
Finally, let's look at some situational numbers. The first number is OPS with runners in scoring position while the second shows what percentage of runners each team strands to end an inning. It's the "left on base" percentage. You can also see where each team ranks in MLB for the respective figures. I am posting these numbers because they can influence results but not necessarily reflect a team's true quality.
               RISP OPS  Rank   LOB%  Rank
Boston           .626     27    72.8   13
Cleveland        .642     25    56.3   30
Texas            .949      5    64.3   25
Washington       .801     15    59.2   29
Houston          .490     30    69.7   20
San Francisco    .707     20    67.9   23
Take heart, Tribe fans. Your team will start to hit better in the clutch and a runner reaching first base will cease to equate to an automatic run. "How does a team score just 16 runs in a seven game stretch?" you ask. Well how about a .490 OPS with men in scoring position. Houston may not be a world class offensive club, but they'll come around.
These games count, so I do not want to downplay the impact of a tough start. Without a doubt, each of these teams has dug themselves a hole. But looking at the numbers alone, I think Boston and Cleveland fans should hold off on panicking just yet. Meanwhile, the Rangers have to be happy with the way they have hit the ball so far and it appears that given their strand rate, the run prevention figures to improve.
In the National League, all three last place teams will see their pitching improve, while Houston is going to get a big jump offensively when they start hitting in the clutch and Lance Berkman and Carlos Lee come around. For Nationals fans looking for hope, it may be a biased perspective but I would nonetheless point you to this piece by Manny Acta.
Next week I will take a look at the teams with the best records to see who has staying power and who might be in for a drop-off.
Thanks to Fangraphs for many of the more in-depth statistics.
| Touching Bases | April 14, 2009 |
All-Time Home Run Location Leaderboards
I’ve hypothesized, along with others, that Ryan Howard might be the best opposite-field power hitter of all time. Thanks to the wonders of Retrosheet (and Colin Wyers), we can get closer to answering that question.
I queried for all home runs in the retrosheet era, and came up with about 185,000 homers. I then tried to eliminate all home runs that didn’t have a field location or were inside-the-parkers. That cut around 20,000 homers. And not all the homers cut were from the 50s. I think the worst year for data on home run location in the retrosheet era (1953-2008) was 1984. The most accurate years are probably during the ‘90s. Anyway, Here’s the diagram retrosheet uses. I coded all three zones left/right of center as pull/opposite field respectively, and the straightaway zone as center field. Onward.
+----------+---------+-----------+-----------+
|   Bats   |  Pull%  |  Center%  | Opposite% |
+----------+---------+-----------+-----------+
|  Left    |  76.3   |    11.8   |    11.9   |
|  Right   |  76.6   |    12.1   |    11.3   |
+----------+---------+-----------+-----------+
Somewhat odd that lefties hit more opposite field homers than center field homers. This won't really shed light on the matter, but I felt like looking at splits against pitchers.
+----------+-----------+---------+-----------+-----------+
|   Bats   |  Pitches  |  Pull%  |  Center%  | Opposite% |
+----------+-----------+---------+-----------+-----------+
|  Left    |   Left    |  77.6   |    11.6   |   10.9    |
|  Left    |   Right   |  76.0   |    11.8   |   12.1    |
|  Right   |   Left    |  77.0   |    11.7   |   11.3    |
|  Right   |   Right   |  76.4   |    12.3   |   11.2    |
+----------+-----------+---------+-----------+-----------+
So it appears that lefty pitchers have their homers pulled more often than righty pitchers—likely a result of southpaws being softer throwers. I wonder why lefties appear to hit homers to the opposite field against righties at an abnormal rate.
Alright, let’s look at the top home run hitters of all time.
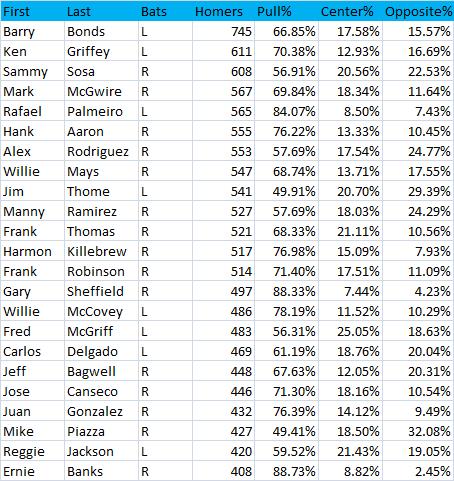
This was a convenient place to stop, as the next three in line hitters were switch hitters in Chipper Jones, Mickey Mantle, and Eddie Murray. Unfortunately, I messed up coding home run locations for them.
I had a feeling Jim Thome hit a very high percentage of homers to the opposite field. He and Ryan Howard are linked in more ways than one. I have to give credit to Rich Lederer for guessing that Mike Piazza would be among the tops in percentage of homers to the opposite field. But just wait until we get to my man Howard. Sheffield, not surprisingly, pulled twenty times as many homers as he hit the other way. I can’t say that I knew Ernie Banks was that extreme a pull hitter.
With a minimum of 100 home runs in my sample set, here are those with the highest pull percentage.
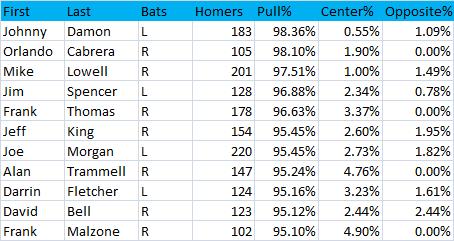
No, not that Frank Thomas. You can see his splits above on the all-time leader list.
These are guys who don’t have the power to hit it out any other way. I’m impressed that so many batters have hit 100 homers without using an entire third of the field. The only other member of this group is Don Baylor, who hit 277 homers without an opposite field blast. I wanted to check on Ichiro Suzuki, since he fits in this school of hitters, but didn’t reach the 100 home run threshold. He’s hit a single opposite-field home run in his career. I hope it was memorable.
Center Field Percentage
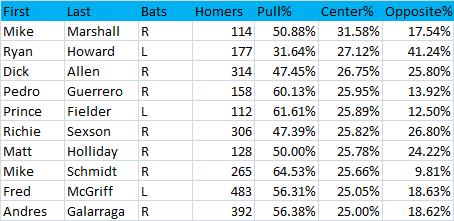
Mike Marshalls have played a large part in my life over the last year. I recently learned that one Mike Marshall was as an outcast Cy Young award-winning former teammate of Jim Bouton, who later became a doctor who developed radical pitching mechanics. Now I know that the year he retired another Mike Marshall, of whom I had never heard, debuted as an impressive home run hitter to center field. They both had their best years with the Dodgers.
These guys all seem to have tons of raw power, as that’s what it takes to hit balls out to center. Chipper Jones belongs on this leaderboard, but was excluded due to my glitch with switch hitters.
Opposite Field Percentage
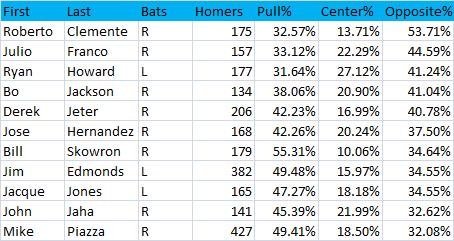
It’s always a pleasure to see Roberto Clemente top any list. The fact that he was such an extreme opposite field power hitter might be a tidbit not many knew about, so I’m glad I can contribute one of the more trivial pieces of information to his legend. I’m surprised to see Julio Franco here. I saw a game or two of his in my day (who didn’t), and I always thought his unique batting stance would be conducive to pulling balls, kind of like Gary Sheffield’s bat wiggle. I guess holding the bat parallel to the ground delays his swing so he makes contact with the ball as it travels further in the zone. Chuck Knoblauch, who was the opposite of Franco in that he held his bat practically parallel to the ground behind him instead of over his head, pulled 75% of his homers. Also irrelevant: Franco's hit multiple homers against both Oil Can Boyd and Russ Ortiz. I doubt many others can say that.
So Ryan Howard is clearly up there. When I made my claim about Howard, it was after seeing that he was the only player in the last four years to have recorded greater than 15 homers in a season to his weak side. I was looking at Baseball Info Solutions data then, which has Howard’s 177 career homers distributed as 37.29% to left, 32.20% to center, and 30.51% to right. So the center field zone I’m using is a bit smaller than that of BIS. I think we can say pretty definitively that he’s a great opposite-field home run hitter, but Clemente seems to be in a class by himself when it comes to opposite%. I assume that Clemente’s and Skowron’s opposite field numbers are somewhat inflated, since their center field numbers are depressed as a result of the much deeper fences back in the day. Additionally, the right-field line at Forbes Field was 300 feet, which may have padded Clemente's totals.
Was Bo Jackson the beginning of the hype machine? Or was it Brian Bosworth? I believe that Bo Jackson hit a home run to the opposite field so far that it went into orbit, only to be knocked down by a homer Matt Wieters hit last week, which I’m sure will in turn be bumped by Stephen Strasburg and then Bryce Harper.
Derek Jeter’s opposite-field prowess is well known, and I believe he’s the only batter in this group to have added to his tally this year. (I wrote that, and then on Monday, Howard hit a three-run shot to left-center field. We’ll have to see where they score that one.)
On to the single season leaderboards.
Single Season Pulled

Roger Maris is the home run king!
Single Season Center Field
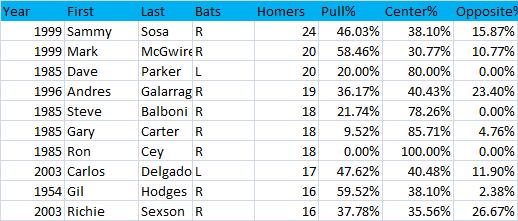
Chipper had 17 in 1999 as well, but he is not included. '99 was an interesting year. 1985 was also an interesting year. Clearly, home run location data from that year are not reliable.
Finally, here's the leaderboard that started this whole ordeal.
Single Season Opposite Field
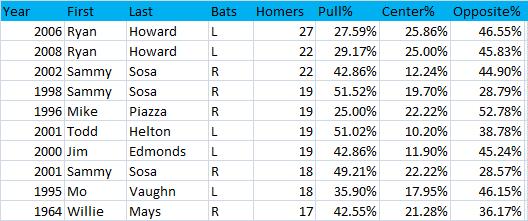
There you have it. Howard is demonstrating opposite field power the likes of which we have never seen before.
Actually, one more note. Since I regret messing up the coding for switch hitters, I decided to go back and check on the five most notable I could think of in Mickey Mantle, Eddie Murray, Chipper Jones, Lance Berkman, and Mark Teixeira. Here are their career splits.
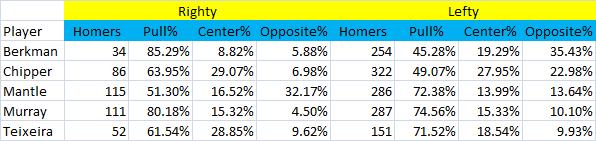
Looks like Murray and Teixeira were similar from both sides of the plate while Berkman has a split personality.
If you've made it this far, here's something that might interest you. In a google docs spreadsheet, I’ve included all batters with 50 career home runs in my dataset and on another sheet all batters with seasons of at least ten recorded home runs. If you want to search for a specific player, I’d suggest that you check out baseball reference's home run logs. Sean Forman does good stuff over there.
| Baseball Beat | April 13, 2009 |
Fantasy Baseball
My buddies and I held our fantasy baseball draft a week ago Sunday. Our league is one of the longest, continuous fantasy pools in the country. The Lakewood Players League, as it is known, has been in existence, in one form or fashion, for over 30 years.
The current format has been in place since 1987. My older brother Tom, who has served as our commissioner since the beginning, tabulated the statistics by hand in the early going. We then contracted with a service called FASTats from 1988-1998. In 1999, we used an internet service (commissioner.com) for the first time. We moved to sportsline.com in 2001 and have stuck with this scoring service ever since.
There are 16 teams in our league this year. Other than in 1995 — the year after the strike that cancelled the World Series — when we had just 11 franchises (and I had to be talked into participating at the last minute), our league has had 13 to 16 teams every year. We draft new rosters annually. While "keeper" leagues can be fun, it is our belief that they can get a bit uneven after a few years, discouraging the weaker owners from participating year in and year out and making it difficult to find replacements to take over the worst teams.
Our league is unusual in that we don't allow trades or waiver wire pickups. To make up for the lack of these transactions, we expanded our rosters from 26 to 28 players two years ago and added a third mid-season replacement draft (at each of the quarter poles) where we allow teams, in the reverse order of the standings, to throw back and pick up two players (for a total of six over the course of the season).
Stolen bases have minimal value in our league. Unlike most fantasy/rotisserie pools, stolen bases are not one of four or five offensive categories. Heck, they're not even a separate category in our league. Instead, we take net stolen bases (defined as SB - 2*CS), multiply that by .5 and add it to walks plus hit by pitches. In other words, we treat (net) stolen bases as "extra" bases, if you will. As such, the Juan Pierres and Scott Podsedniks of the world hold about as much value in our fantasy league as they do in real baseball. Close to zero. Just the way I like it.
We have also reduced the value of closers by making saves worth half as much as the other pitching categories (IP, ERA, WHIP, and K minus BB). However, our league is far from pure as we have a few team-dependent stats such as wins, win percentage, runs scored, and runs batted among our mix of counting and rate stats (with the former two also treated as half categories).
What I most like about fantasy baseball vs. other fantasy sports are the number of teams, players, positions, stats, and games — all of which combine to reduce the randomness and dependency on one or two players a la football. Fantasy baseball, in my mind, is a true test. Sure, injuries play a factor (just like in real baseball), but the owner who wins it all basically has the best collection of players in our league.
I've won the LPL fantasy baseball pool six times since 1987, including back-to-back titles in 1989 and 1990 and a three-peat from 1995-1997. My last championship was in 2006. I have finished third or better every year since 2001 sans one. I am coming off two second place finishes in a row and am hopeful that I can get back into the winner's circle again this year.
I drew No. 1 out of a hat for the first time since 1999. I had the option of either going first or sliding down to any spot of my choosing. With a serpent draft format in a 16-team league, picking first means you have the No. 1, 32, 33, 64, 65, etc. choices. What's a guy to do? I kept No. 1 and picked Albert Pujols. I've never had Prince Albert on my team before. In fact, I haven't even had a shot at him since 2003 when I selected Manny Ramirez with the 11th pick and Pujols went two spots later at 13. He was taken first or second from 2004 through 2007, then dropped to seventh last year due to concerns going into the season about his elbow.
Here is how I drafted round-by-round:
1. Albert Pujols: For me (and probably most others in my shoes), it was between Pujols and Hanley Ramirez. Some people take Ramirez because of the value of stolen bases in most fantasy pools. Others take him because of positional scarcity. I love Hanley but chose Pujols. Only time will tell if I made the right choice.
2. Nick Markakis: I had him ranked as my fifth-best outfielder. The top four (Grady Sizemore, Josh Hamilton, Ryan Braun, and Manny Ramirez) were all taken in the first 24 picks. Carlos Beltran was chosen 25th. The top three 2B, 3B, and SS were off the board as well. I thought Markakis was the next-best bat available among players not named Chipper Jones. I'm expecting a .300 season with 20+ HR, 40+ 2B, and close to or more than 100 BB, R, and RBI (or a virtual repeat of 2008 with a few more ribbies thrown in). Those across-the-board stats work for me in that spot.
3. Ricky Nolasco: I stepped up on Nolasco. Johan Santana, Tim Lincecum, CC Sabathia, Roy Halladay, Brandon Webb, Dan Haren, Jake Peavy, Josh Beckett, Cole Hamels, Jon Lester, and Roy Oswalt were off the board. Although this pick isn't looking too swift after two starts, Nolasco may have been the best pitcher in the majors from June 10 through the end of last season.
4. Matt Holliday: I was surprised that Holliday was still available as my fellow owners apparently shied away due to the trade that sent him from Colorado to Oakland. Even if Holliday falls a tad short of Greg Rybarczyk's projection, I will be happy with him at No. 64.
5. Alexei Ramirez: This was the first time I thought long and hard about my choice. His hack-tastic approach at the plate bothers me, but Alexei is a second baseman *and* shortstop out of the shoot in our league and the two-position flexibility was enough to sway me to take him over Troy Tulowitzki, who was the next-highest SS on my board. Like Nolasco, Ramirez is off to a less than thunderous start, but he hit .304/.331/.502 with 21 HR in 118 games once he was inserted into the starting lineup on May 16.
6. Josh Johnson: This pick is looking better with each start this season. I probably had him ranked higher than any other competitor in my pool. Johnson was a plus/plus/plus K/BB/GB pitcher last year and seems poised to improve upon his half season in 2008 now that he is two years removed from Tommy John surgery. The 25-year-old righthander throws a mid-90s fastball that touched 97 on the radar gun for GameDay and 98 for TV in the ninth inning of his complete-game victory over the Mets yesterday, as well as a nasty slider.
7. Kevin Slowey: Greg Maddux light. We double count walks via WHIP and K-BB, making Slowey at least as valuable in our league as in real baseball. He posted an ERA under 4.00 with a WHIP of 1.15 and a K/BB ratio over 5:1 last year. Check out his minor league stats when you get the chance.
8. Chris Iannetta: With eight catchers already gone at this point in the draft, I was quite pleased to get Iannetta. He hit .264/.390/.505 with 18 HR and 56 BB in 104 games last year. Iannetta, who turned 26 earlier this month, is off to a slow start but should be fine as long as manager Clint Hurdle doesn't panic and go with Yorvit Torrealba as his regular catcher.
9. David Price: I expect Price will be recalled no later than May 15. Although it's unlikely that the young lefthander will overpower major league hitters for six innings as a starter the way he did for an inning as a reliever in the postseason last October, there's little reason to think the No. 1 pitching prospect in baseball won't have a successful rookie season.
10. Nelson Cruz: Fantastic minor league, (partial season) major league, WBC, and spring training stats coupled with a great ballpark and lineup were enough to convince me that Cruz could put up some BIG numbers this year. Going into the draft, I had an inkling that I liked Cruz more than anyone else. Who knows, I may have been able to float him for another 32 picks, but I didn't want to take that chance.
11. Scott Baker: I think he fell a couple of rounds due to a sore arm that cost him a start last week. However, he is scheduled to make his first start on Wednesday at home against the Blue Jays. If Baker is healthy, he will be a steal at No. 161 in the draft.
12. Rickie Weeks: Long on potential, short on results to this point in his career. Call me a sucker, but I think he is going to hit around .260 with 15-20 HR and score 100 runs.
13. Rick Ankiel: I just had to remind myself that Ankiel hit .270/.343/.537 with 20 HR and 50 RBI in the first half before suffering an injury and limping home with a .245/.319/.415 (5 HR, 21 RBI) second half. I'm betting that he will be produce better numbers over a full season in 2009 than 2008.
14. Alex Gordon: The NCAA Player of the Year, the Minor League Player of the Year, and the No. 2 overall pick in the 2005 draft should be about ready to break out this year, no? I was jazzed when he went yard in his first AB of the season but am fully aware that he has gone 1-for-14 since and sat out yesterday with a stiff right hip. He produced counting stats last year that were equal to or better than his rookie campaign in 2007 while increasing his walk rate nearly 70% and decreasing his strikeout rate ever so slightly.
15. Frank Francisco: One of my two "sleeper" relievers. Francisco throws gas and didn't allow an earned run from August 18-on last season while posting a 21/4 K/BB ratio and five saves.
16. Tommy Hanson: Great minor league, Arizona Fall League, and spring stats. Hanson was the first pitcher to win the MVP award in the AFL when he struck out 49 batters in 28.2 innings with a miniscule ERA of 0.63 in a hitter-friendly environment. He whiffed 10 batters in 4.1 scoreless innings in his Triple-A debut last Thursday. With Tom Glavine unable to answer the opening bell, Hanson could be in Atlanta's rotation as early as this week.
17. Brandon Morrow: Like Francisco, Morrow is not on the best team for a closer but he is in a weak division and a favorable ballpark. I saw the fireballing righthander implode in his opening game but manager Don Wakamatsu stuck with Morrow and allowed him to save two games over the course of three days.
18. Paul Maholm: Having drafted two minor league starters up to this point, I needed a solid fifth and chose Maholm to go along with Nolasco, Johnson, Slowey, and Baker. The lefty throws strikes, generates more than his share of groundballs, and eats innings. Exactly what the doctor ordered at that spot.
19. Kelly Shoppach: Did you know that Shoppach was third in HR among all MLB catchers with 21 last season, just two behind the co-leaders (Brian McCann and Geovany Soto)? He won't hit much more than .250 or .260 but could crank 20 HR again with sufficient playing time.
20. Brett Anderson: With five starting pitchers in hand plus two high-ceiling minor leaguers, I wanted someone who was not only expected to take a regular turn in the rotation but had a little bit more upside than the fourth and fifth type starters that were still available. Anderson gives me both. Was pleasantly surprised to see him throwing as hard as 94-95 on the radar gun in his MLB debut last week.
21. Chone Figgins: Not as valuable in our league as most other fantasy formats but still above-average in a few categories.
22. Adam Jones: Only 23, Jones is probably a year away from being a fantasy star. His spring and first-week stats, along with the fact that he is batting second between Brian Roberts and Nick Markakis, give me hope that he can be serviceable this year if called upon.
23. Stephen Strasburg: Partly for fun but also as a potential difference maker down the stretch. There isn't a starting rotation in the majors that he wouldn't make better right now.
24. Grant Balfour: Third-highest weighted Z-score among all relievers last year. Fastball sits at 94-95 and can reach the upper 90s on occasion.
25. Lyle Overbay: What can I say? Except for Overbay, every starting first baseman in baseball may have been taken at this point. Look, if Pujols gets hurt, my team's not going to win it anyway.
26. Brandon Wood: Only a phone call away. Wood will be up in no time if Erik Aybar or Chone Figgins get hurt or if the Angels use him as trade bait for a starting pitcher. Either way, I think he is (finally) ready to play every day in the majors and could hit in the .260s with 20 HR if given the opportunity.
27. Chan Ho Park: Nothing special here. With two minor leaguers and an amateur among my starting pitchers at this juncture, I opted for Park, who performed well as a starter last year and this spring.
28. Aaron Miles: Assuming Wood gets some PT, Miles is my third-string SS and 2B. He is a leading candidate to get tossed back at our first replacement draft in mid- to late-May.
Oh, after the first week, I'm in third place. It's early. But it's sure fun.
| Behind the Scoreboard | April 11, 2009 |
A Study in Home Field Advantage - Will the New Stadiums Be Friendly to NY Teams?
On Monday, Major League Baseball will christen two new stadiums, New Yankee Stadium and Citi Field. The previous New York stadiums were known as intimidating places to play in, and fans are probably wondering whether the new ballparks will confer as great of a home field advantage as the old buildings - particularly in the case of Yankee Stadium, where the ghosts of Babe Ruth, Lou Gehrig, and others were said to give Yankee Stadium a certain aura of invincibility. This article attempts to explore the relationship of a stadium to home field advantage, and how it might affect the two New York ballparks.
Of course everybody knows that playing at home is indeed an advantage. Over the course of modern baseball history, the difference between playing at home vs. on the road has been about 80 points of team WPCT - a road team will win about 46% of its games, and a home team will win about 54% of its games, all else being equal. But do some parks confer more of an advantage than others? Or is the "Yankee mystique" no more potent than the Padres mystique?
Gathering data from all major league home parks during the modern era (thanks to Retrosheet), I found the average home field advantage (as defined by home WPCT minus road WPCT) of each park during each year. A quick chi-squared statistical test shows that indeed the home park is highly significant, and not all home parks are identical. To the average baseball fan, this comes as no surprise - we expect that some parks are more advantageous than others, and indeed we see this born out in real data: Fenway Park has a lifetime average advantage of .109 while Seattle's Kingdome had a lifetime home field advantage of .070. So what is it about a park that gives one place a bigger advantage than others?
Home Field Advantage Over Time
One factor to consider is the year - throughout history, home field advantage has fluctuated and it's been suggested that there has been a strong decrease in home field advantage over time. A cursory look at the data implies that surely this is the case - from 1901-1910 teams had a home field advantage of .104, but by the 1980's, the advantage was down to .080. Cyril Morong finds a statistically significant decrease in home field advantage over time, and people have suggested that it's due to shorter travel times, increased luxuries and amenities for the players, more comfortable hotels, etc.
It's a nice theory, but I find it not to be true. Modeling home field advantage using year alone does indeed suggest a powerful effect. However, this theory leaves out an important confounding variable - the fact that ballparks have also changed over time. If the decrease in home field advantage was due to things like air travel and player amenities, we would see decreasing home field advantages even when looking within the same ballpark over time. However, when we run a model with both year and ballpark included, we see that the effect of year on home field advantage is no longer significant, with a p-value of .50 (in fact, the direction of the year effect actually switches to being positive!) Nearly all of the variability over time is due to the parks themselves, not the year. I also ran the model with a pre/post-1960 variable (around the time that travel became easier and cushier for visiting players) instead of using the continuous year variable, and again there was no effect. From this, we see that the reason for the decrease in home field advantage over time actually is due to different ballparks being built, not due to things like air travel and amenities as commonly believed.
With this knowledge, we can move forward more confidently. If individual ballparks do have a major effect on home field advantage, then what are the features that make up this advantage?
What Features Are Advantageous?
For this I looked at several statistical variables for each park, as well as several qualitative variables for each. From the retrosheet data, I was able to calculate park indices for several different statistics: runs, hits, doubles, triples, home runs, walks, and strikeouts. A number greater than 1 indicates the park was more likely to have those events occur, while a number less than 1 indicates the park was less likely. I also created additional variables for each of the above statistics by taking the absolute value of the difference from 1 (so the value for homers would be high if the park either allowed a lot of homers or allowed very few). I also created several subjective variables: whether or not the park's features were "quirky" (odd dimensions, wild wind, strange ground rules, etc.), whether the park strongly favored one handed batter over another, whether the park was in a hot outdoor climate, whether the park was grass or turf, whether the park was a dome, whether the park had "rabid" fans (confined to old baseball cities mostly on the east coast, NY, BOS, PHI, etc.), and what era the park was built in (wooden era, classic era, modern era, nostalgic era).
Running this all in a model (weighted for the number of seasons the park was used), we find that most of the variables are not significant at all. Of the qualitative variables there was no advantage to being in a city with rabid fans, no advantage to a dome, no advantage if the park strongly favored one hand over the other, no advantage to being in a hot climate, and no advantage based on what era the park was built. Of the statistical variables, most had no effect as well. The most interesting result was that the amount of homers allowed by the park had no effect on the home field advantage (all that time agonizing over whether to build a homer happy park, homer deprived park, or simply a homer neutral park was time wasted).
After taking out the insignificant terms, we are left with this final model:
As you can see, the 5 factors of home field advantage are, in order of significance:
1) Having either a good hitters park or a good pitchers park - not a neutral park.
2) Having a "quirky" park (weird field dimensions, difficult fences, weird wind patterns, etc)
3) Having a park conducive to doubles
4) Having a park conducive to triples
5) Having a park conducive to strikeouts
From the above list, all of the variables seem to favor more unusual parks. Parks which deviate from the normal amount of runs scored seem to be advantageous. Parks that allow a high proportion of doubles and triples also tend to be more unusual, with odd angles and odd dimensions. This makes intuitive sense as well. The more unusual a park is, the more difficult it would be to play in it for the first time - giving the home team, who is already familiar with the park, a significant advantage. Likewise, cookie cutter parks, requiring little adjustment on the part of visiting players, have the lowest advantage. It also could be the case that teams bring in specific players who are particularly suited for an unusual home park, also increasing home field advantage. However, if this were the main reason, I would think we would see a spike in home field advantage after the free agent era, when it became much easier to bring in specific players - since we don't see this, it's likely not the driving force.
The quirky variable is an attempt at a subjective definition of unusual and the model sees it as highly significant - even when considering the statistical variables above. Obviously, the "quirky" variable is highly subjective and is simply a binary variable that doesn't take into account just how quirky a park is, but the inclusion gives some information that statistics alone cannot. It also varies a lot depending on the era of the park - in the wooden/classic era 18 of 23 were considered quirky, in the modern era just 3 out of 27 were considered quirky, and in the nostalgic era 5 out of 17 were considered quirky.
The strikeout variable was perhaps the most interesting of the bunch (though it's only marginally significant) - parks which increase strikeouts tend to increase home field advantage. My guess is that this is related to the hitting background - with more difficult or unusual hitting backgrounds being advantageous to the home team since they have more practice hitting under those tough conditions.
Below is a table of the top and bottom 5 parks in each of the statistical categories (with 10 years or more as an MLB park).
Additionally you can see a chart of the top and bottom 5 parks according to predicted home field advantage according the model. As you can see, the model predicts Coors Field to be by far the #1 biggest home field advantage in the history of baseball. It's followed by Baker Bowl, that wacky Philadelphia ballpark, and classic Fenway Park. The other parks rounding out the current top 5 most advantageous parks according to the model are Minnesota's Metrodome, Minute Maid Park in Houston, and AT&T Park in San Francisco. The bottom 5 parks are dominated by the more modern ballparks, with New Comiskey Park being the lowest and the other current low advantage parks being Angels Stadium, Jacobs Field, Turner Field, and Camden Yards.
With an R-squared of .38, the model is far from a perfect fit, explaining only 38% of the variability in home field advantage between parks. The model misses considerably on several parks (in fact, New Comiskey has enjoyed a decent home field advantage over its 18 years). Of the misses that the model makes, its most egregious (accounting for the number of seasons) are overestimates of Camden Yards and Riverfront Stadium and underestimates of Crosley Field and the Astrodome. A graph of the predicted and actual home field advantage of each park can be seen here. As you can see, there are still other unknown factors at play, but the model does a fair job of predicting how much home field advantage a park will bring.
What Does This Mean?
So, some parks have a greater home field advantage than others, and we now have some idea of why, but is it significant in a baseball sense? Over the course of the year, if we assume a team plays .460 ball on the road, a team with a healthy home field advantage may play .560 ball at home, while a team with a small home field advantage may play only .520 ball at home. The team with the big advantage will win over 3 games more than the team with the small advantage. This is not insignificant at all and could easily be the difference between winning and losing the pennant. Additionally, a good home field advantage is the gift that keeps on giving, with the team reaping the advantage year after year. In the extreme case, Coors field, the ballpark makes a .500 team into an 86 win team - so far a lifetime gain of 70 wins for the park, making it likely the most valuable member of the Rockies franchise.
So what does this mean for new parks being built? If I were building a new park for maximum home field advantage, I would choose one which had a difficult hitting background, increasing strikeouts and making it a low scoring park, with short but high fences down the lines to maximize doubles, and spacious alleys to maximize triples and further minimize scoring. Astroturf also would also help (while astroturf is not significant in itself, it is positively correlated with doubles and triples). Throw in gale force winds, hard brick walls, and a hill in right field, and you'd have yourself a ballpark. It may be baseball's most hideous park, but it'd probably net a fairly decent home field advantage.
Thankfully, neither the Yankees nor Mets decided to go this route and it remains to be seen how their new parks will play. Shea Stadium actually gave the Mets poor home field advantage (.063 actual, .074 predicted), so Citi Field should be a boon to the team. It's not particularly quirky, but is being billed as a hitters park. After a year or two, we'll see how it plays.
Yankee Stadium, in contrast, did give the Yankees a healthy home field advantage (.091 actual, .086 predicted). However, the advantage predictably decreased after the 1970's renovation, when the outfield walls were brought in. Before the renovation, Yankee Stadium had a home field advantage of .094, but in the 20 years since the walls have been brought in to their current dimensions, the advantage has dropped to .070. This can be attributed in part to the triples park factor decreasing from 1.40 to .73. Since the New Yankee Stadium will have the exact same dimensions as the old park, we can expect the park to confer about the same advantage - which is to say, not nearly the advantage that Ruth, DiMaggio, and Mantle enjoyed. Of course, that doesn't consider the ghosts.
An update to this study can be found here.
| F/X Visualizations | April 10, 2009 |
Checking in on Seattle's New Outfield
With about half a week's worth of games played I wanted to check in on a major story from the offseason: the increasing importance teams put on defense when acquiring players. We saw some all-hit no-glove guys get much smaller contracts than expected and we saw the Seattle Mariners trade for Franklin Gutierrez and Endy Chavez, two defensive standouts not know for their offense, and promptly make them two thirds of their starting outfield. The outfield hasn't reached its full defensive glory yet because Ichiro is the DL for a couple more days. But the first couple days the Ms still started a pretty good outfield with Gutierrez and Chavez every game and the third spot given to one of Ken Griffey Jr., Wladimir Balentien and Ronny Cedeno.
Their play has already received rave reveiws from Ms fans, so I wanted to see just how good it has been. Small sample size be damned, I thought I would check it out.
Again I am using Peter Jensen's Gameday defense metric as my guide (and his invaluable translation factors as my tool). In this case I took all balls in play at the Metrodome (from 2005 to 2008) and looked at the out percentage (1-BABIP) by location, those are the colors in the image. Over that I plotted all the non-homerun fly balls and line drives that Seattle's outfield saw in their first series, the filled circles are hits and the open outs. Now you can compare how Seattle's outfield did versus the average outfield at the Metrodome. A filled circle in the middle of blue is a hit in a location that most outfields turn into an out, and an open circle in yellow/red is an out which most outfields would let drop in for a hit.
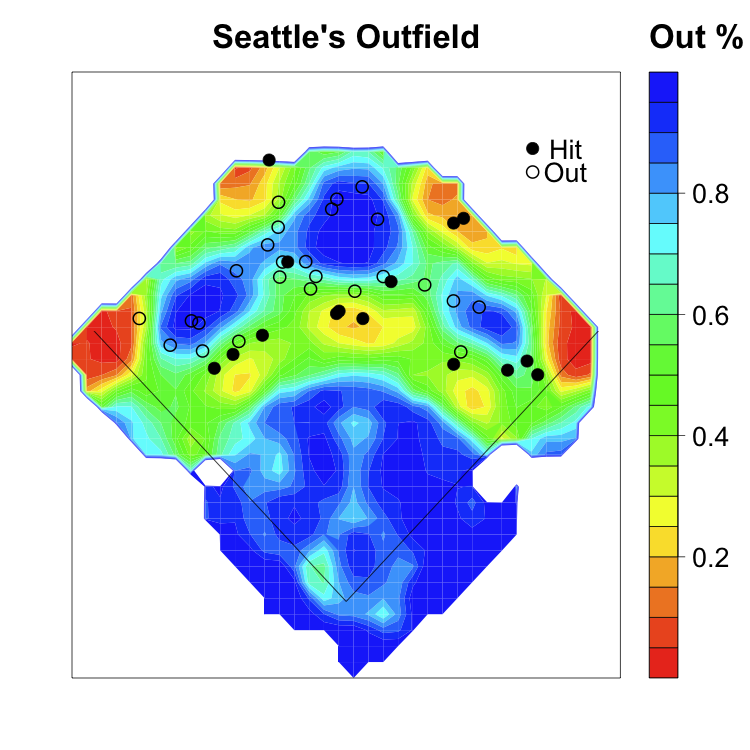
The Mariner's outfield looks pretty good. A couple hits in the blue/green region (one of those in right is Griffey's fault) but a ton of outs in the yellow/green region. As a quick check I added up the expected number of outs and compared that to the number the Mariners actually made. There have been 40 balls in play to Seattle's outfield so far and the average outfield makes 21.75 outs. The Mariners made 25 outs. They are 3.25 outs above average just four games into the season (how many over Raul?).
Huge caveats apply here. 1) Jensen's translation factors that let you go from Gameday's pixel to feet sometimes change year to year and I am using the 2008 numbers for the 2009 hits. So the location of the hits could be off by a couple of feet. 2) Gameday records where the ball is fielded not where it lands, which would be more important. 3) This should be in no way viewed as a substitute for or peer of the real fielding metrics. Once they come out you can ignore these results.
| Around the Minors | April 10, 2009 |
Around the Minors: Opening Day
The young stars of tomorrow are back. A few days after the Major League Baseball season got underway, the Minor League Baseball season was back in full swing as each team's top prospects took to the field. Let's have a look at how some of the top prospects began their seasons.
Arizona Diamondbacks
Daniel Schlereth: 1.0 IP, walk, strikeout, save
Atlanta Braves
Tommy Hanson: 4.1 IP, three hits, zero runs, two walks, 10 strikeouts
Jason Heyward: 1 for 4, strikeout
Baltimore Orioles
Matt Wieters: 0 for 3
Boston Red Sox
Lars Anderson: 1 for 4
Chicago Cubs
Josh Vitters: 0 for 3, run
Chicago White Sox
Gordon Beckham: 4 for 6, double, three runs, RBI
Dayan Viciedo: 1 for 5, RBI, three strikeouts
Cincinnati Reds
Yonder Alonso: 1 for 3, homer, three runs, two walks, strikeout
Cleveland Indians
Carlos Santana: 0 for 3, walk, two strikeouts
Matt LaPorta: 3 for 5, two doubles, homer, two RBI, three runs
Florida Marlins
Michael Stanton: 0 for 4, two strikeouts
Logan Morrison: 2 for 4, triple, homer, two runs, three RBI, walk, strikeout
Houston Astros
Jason Castro: 1 for 5, double, strikeout
Kansas City Royals
Eric Hosmer: 1 for 4, RBI, strikeout, caught stealing
Mike Moustakas: 0 for 4, walk, strikeout
Los Angeles Dodgers
Andrew Lambo: 2 for 6, strikeout
Milwaukee Brewers
Mat Gamel: 2 for 4, double, homer, two RBI, walk, strikeout
Brett Lawrie: 0 for 4, run
Minnesota Twins
Ben Revere: 0 for 4, strikeout
New York Mets
Wilmer Flores: 0 for 3, RBI, two strikeouts
New York Yankees
Jesus Montero: 0 for 4, walk, strikeout
Oakland Athletics
Adrian Cardenas: 0 for 4, three strikeouts
Pittsburgh Pirates
Pedro Alvarez: 3 for 4, double, home run, 4 RBI
St. Louis Cardinals
Brett Wallace 4 for 5, four runs, two homers, six RBI
San Diego Padres
Kyle Blanks 0 for 5, strikeout
San Francisco Giants
Buster Posey 0 for 5, RBI, strikeout
Seattle Mariners
Greg Halman 0 for 4, two strikeouts
Tampa Bay Rays
Tim Beckham 2 for 5, homer, three RBI
Texas Rangers
Justin Smoak 2 for 5
Toronto Blue Jays
J.P. Arencibia 2 for 5, double, two RBI
Washington Nationals
Jordan Zimmermann 5.1 IP, 4 hits, three runs, walk, four strikeouts
What prospects are you most excited about this season?
| Touching Bases | April 10, 2009 |
Thursday Thoughts
No scheduled column today, so I'll be throwing a Barry Zito changeup. Luckily for us, Dave might also post later, so he'll bring the vintage Pedro change of pace. Here's what I got from yesterday's slate of games.
Kyle Davies threw seven scoreless innings yesterday. He got some buzz in the preseason as a potential breakout pitcher, as Joe Posnanski and scouts alike noted his September surge and excellent spring training. Last year, he posted a 4.06 ERA in spite of a mediocre 1.65 strikeout-to-walk ratio. However, in September, he improved those marks to a 2.27 ERA and 3.43 K/BB. Last afternoon, he was lights out as he struck out eight in seven innings.
Davies is a standard four-pitch righty. He’s been making steady improvement since a disastrous second year in the Majors. Per fangraphs, his fastball velocity since 2006 has risen from 90.6 to 91.3 to 91.5, and yesterday it was clocked at 91.7. Meanwhile, He’s improved his rate of drawing swinging strikes from 17.5% to 18% to 18.3%. Yesterday, he managed to induce 14 swing and misses on 52 swings.
Davies throws a rising fastball which made him vulnerable to homers two years ago. Last year, his HR/FB dipped to 7%, which will probably regress to the mean this year. Even so, his peripherals are improving, so while he might continue to improve his GB/FB rate, he'll almost certainly allow more homers. Davies snaps off a curve with above average velocity, vertical, and horizontal movement, which I would say makes it a plus pitch. However, he shows a noticeably higher release point for his curve than other pitches, which can only serve to tip pitches. Nevertheless, his curve was awesome yesterday. He threw only three of his 13 curves for balls, as he was able to draw a groundout, three swinging strikes, a foul ball, and five called strikes from the yakker. Davies’ changeup had some serious tail yesterday, and he threw it for strikes three quarters of the time yesterday which is excellent. He began using the changeup more often in September of last year in favor of his fastball, as he threw the change 16% of the time as compared to 10% earlier in the season. His changeup and curve are both strong pitches, which makes him formidable against both right-handed and left-handed batters.
Davies' slider and fastball have minimal differential in terms of velocity, but sometimes with sliders, not mixing speeds helps to conceal the pitch. Sinkerballers will often complement their two-seemer with a strong sweeping slider, so they stay on the same plane and have similar velocity, and therefore are unrecognizable until about 30 feet from the plate. Davies, on the other hand, works up and down, complementing his rising fastball with a slider that has little horizontal movement but dives down. I would think his slider is his worst pitch, but he might just use it as a show-me pitch against righties. I could see Davies showing a reverse platoon split, since his slider seems to be substantially worse than his curve and change. I could buy him as a league average pitcher this year too.
Other thoughts: We saw a rather telling difference in managing philosophies in the Mariners’ and Cardinals’ games. Young flamethrowers Brandon Morrow and Jason Motte both got their first save opportunities of the year earlier this week, and they imploded, forfeiting ninth inning two-run leads. Up 2-0 yesterday , Don Wakamatsu decided to give Brandon Morrow another chance, and Morrow promptly came in and walked the first batter on four fastballs out of the zone. But Wakamatsu’s confidence in the youngster paid off, and so did Morrow’s confidence in his heater, as Morrow threw nothing but fastballs all inning, resulting in two strikeouts and a can of corn to center to end the game. Tony LaRussa, however, was in the precarious position of trying to preserve a one-hitter. Did this game have any added significance as it was Chris Carpenter's first healthy start in three years? I don’t know, but LaRussa must have somehow considered it a must-win, as he abandoned his bullpen strategy, leaving Jason Motte on the bench and trotting out Dennys Reyes. Reyes got the job done, but I still prefer Wakamatsu’s approach to bullpen usage thus far. Don't panic after one game.
My favorite moment of the day was in the Dodgers Padres game. Vin Scully was calling the game, so you know it’s good. Heath Bell came on to pitch the ninth, and he had the luck of facing the heart of the Dodgers’ imposing lineup. Things looked bleak for the new Padres’ new closer when Orlando Hudson led off with a triple, sending one Manny B. Ramirez to the plate with the tying run on third and no outs. But with the infield in, Bell got Manny to ground out to short, halting Hudson at third. Following an Andre Ethier walk, Russell Martin bounced into a double play, and thus the Padres were tied for third place with the Dodgers. We might have our first divisional race of the year on our hands.
| Baseball Beat | April 09, 2009 |
Breaking News: Nick Adenhart Killed in Car Accident
Hours after pitching six shutout innings on Wednesday night, Los Angeles Angels starting pitcher Nick Adenhart, 22, was killed in a felony hit-and-run car accident in Fullerton, California early this morning. The story is still developing. You can read a brief news story here.
The Angels have had a history of bad luck when it comes to player deaths. But the more important concern for now is Adenhart's family, friends, and teammates.
Like the rest of the baseball world, all of us at Baseball Analysts are shocked and reach out with our deepest sympathies and most heartfelt condolences to the families of all the victims at a time when the game itself seems so meaningless.
I had the privilege of interviewing Nick three years ago after he made his debut in the California League. In honor of him, we are going to re-run that interview today.
Nick Adenhart: A Rising Star (Once Again)
I watched Bryan Smith's 23rd-ranked prospect make his California League debut two weeks ago yesterday and had a chance to interview him after the game.
Nicholas J. Adenhart (A-den-hart) is a 6-foot-3, 185-pound right-hander out of Williamsport, Maryland. He is a very accomplished pitcher for someone who has yet to celebrate his 20th birthday. Adenhart was Baseball America's Youth Player of the Year in 2003 and its top-ranked high school prospect prior to his senior season in 2004. He tossed a perfect game in his first outing that spring, striking out 15 of the 21 batters faced.
A cinch first-round draft pick heading into his senior year, Adenhart blew out his elbow in May and had Tommy John surgery one week after the Los Angeles Angels selected him in the 14th round (413rd overall). Area scout Dan Radcliff and director of scouting Eddie Bane convinced Adenhart to forego a scholarship offer from the University of North Carolina and signed him to a $710,000 bonus on July 26, 2004.
Adenhart spent the next year rehabbing his elbow in Tempe, Arizona before making his professional debut on June 25, 2005. He pitched 50 innings in the Arizona and Pioneer Rookie Leagues that summer, fashioning a 3-3 record with a 3.24 ERA. Not surprisingly, his command was a bit off, walking 24 batters or 4.32 per 9 IP. However, he offset his wildness with 59 strikeouts, good for 10.62 K/9.
At the age of 19, Adenhart earned a non-roster invitation to the Angels' big league camp this spring. He threw three innings without allowing a run. Nick faced the Chicago White Sox, the defending World Series champions, in one outing. "I threw strikes and got a couple of punchouts," he told me matter of factly in the locker room in the aftermath of winning his Cal League debut for the Rancho Cucamonga Quakes.
Adenhart was assigned to the Cedar Rapids Kernels (Low-A) out of spring training. He dominated Midwest League hitters, leading the circuit in wins (10) and placing third in ERA (1.95) and strikeouts (99 in 106 IP). His performance earned him a starting assignment in the All-Star Game on June 20 and a promotion to the organization's High-A affiliate nine days later.
 Sporting a Fu Manchu-style mustache, the dark-haired prized prospect got the start on July 2 and pitched six innings, allowing four runs on eight hits and three walks while striking out four in front of Bane and several scouts. Thanks to Ben Johnson's 3-for-3 night (including a pair of home runs and two walks), Adenhart earned his first victory for the Quakes and his 11th of the season in a performance that was less than overwhelming but hinted at his star potential. Six of the eight hits were to the opposite field and the only extra-base hit was a slicing double to left in the fifth that failed to produce a run.
"My pitch selection was good, but I left a couple of the pitches over the plate with two strikes," was Nick's response when I asked him about his outing. "I wasn't at my best in terms of command."
Trying to establish his fastball the first time through the lineup, Adenhart ran into trouble in the second, allowing four hits (including three in a row to open the inning) and a trio of runs. "My touch and feel was off, and I was trying to do too much."
Adenhart "calmed down" and gave up just three hits and one run over his final four frames. "I located my fastball better down and in the zone."
The second-year pro throws a two-seam and a four-seam fastball. "I throw my two-seamer about 80-90% of the time. There is no difference in velocity between the two fastballs. I use my four-seamer when trying to elevate on 0-2 and 1-2 counts or into left-handed batters and away from right-handed batters."
Adenhart's fastball was clocked in the high-80s-to-low-90s, topping out at 94 on a few occasions. He is an extreme groundball pitcher and has only given up two home runs in 170 innings in his professional career. "Both home runs were on changeups that I left up."
"I get good sink on my two-seamer," while attributing his favorable groundball-to-flyball ratio to the pronation in his delivery. Nick recorded 11 of his 14 non-strikeouts on the ground the evening I saw him pitch.
Adenhart, who was invited to but did not pitch in the Futures Game, also throws an 11-to-5 curveball in the mid-70s and a circle change in the low-80s. "My changeup tends to be a strikeout pitch. I get lots of swings and misses, especially down-and-away to left-handed batters."
I asked Nick how his elbow felt two years after undergoing surgery performed by Dr. James Andrews. "My elbow is great. It feels different than before I had the surgery. But there is no pain or discomfort."
Adenhart made his next start five days later but was limited to just two innings (2-1-0-0-0-3 with three groundouts) a couple of days prior to the Futures Game. His next outing was last Wednesday, an impressive six-inning, four-hit, one-run victory with six strikeouts. He has pitched 120 innings thus far, going 12-2 with a 2.10 ERA. (Complete stats from MiLB.com.)
Although Adenhart won't turn 20 until August 24, I wouldn't be surprised if he made it to the big leagues at some point during the 2008 season. Once he arrives, the kid with the three "plus" pitches is apt to become part of a starting rotation that could include Kelvim Escobar, John Lackey, Ervin Santana, and fellow 2004 draftee Jered Weaver. The future of the Halos looks bright indeed.
Photo credit: Rob McMillin, 6-4-2.
| Change-Up | April 08, 2009 |
In Appreciation of Derek Lowe
On the golf course Sunday for our first round of the year outside my hometown of Boston, one of my pals, an avid Sox fan but one who does not follow the rest of the league closely, was incredulous that Atlanta - once the Mecca of MLB starting pitching - would be sending Derek Lowe to the hill to start their season.
"He's a very legitimate MLB ace," I replied. For once I looked pretty smart just a few hours later, as Lowe went out and shut down the defending World Series champs. He pitched eight shutout innings, allowing just two hits and no walks along the way.
My friend's view on Lowe represents the view of many in the Boston area. He has been marginalized over the years for a number of reasons. For one, popular ESPN columnist Bill Simmons made famous "the Derek Lowe face" because he had the nerve to blow a few saves throughout the course of the 2001 season. Here is Simmons on Lowe from back in '01:
In Lowe's case, you spend the ninth inning rooting for things to go smoothly for him ... and then something happens (a single or a walk), and you start searching for signs that he's OK, and he is OK, but maybe something else happens (a stolen base, a walk) and then ... BOOM!He makes the face.
My buddy J-Bug calls it The Derek Lowe Face...
The Derek Lowe Face is a little different. It's a frozen expression like The Aikman Face, only it's more anguished and tortured (imagine someone taking a dump and suddenly realizing that there's no toilet paper in the bathroom). And as soon as Lowe starts making that face, the umpires should halt the game and award it to whomever the Red Sox are playing. I have to admit, I'm haunted by The Derek Lowe Face.
I spend every one of his appearances saying to the TV, "Don't make it, don't make the face, stay cool, come on, stay with us, hang tough, kiddo." It never ends.
(Note to the Red Sox: I'd like to order the Ugueth Urbina please? And hold the mayo.)
Moreover, Lowe is known for his off-field partying and womanizing, which serves to hamper his image as a professional. His crotch-chop after striking out Terrence Long with the bases loaded and two outs in the final frame of Game 5 of the 2003 ALDS in Oakland did not help on this front, either. He's tall, he's gangling and his uniform does not seem to fit him very well. He does not strike many batters out. In his final year in Boston, he had the worst year of his career.
Add it all up you have a player whose terrific record of achievement manages to go overlooked. Even after winning all three post-season clinching games for the Red Sox in 2004, Boston was happy to see Lowe head west to Los Angeles after the season. Generally critical of their team's moves, Red Sox fans, although appreciative of Lowe's work over the years, did not question their team's decision to let Lowe walk. When he signed with the Atlanta Braves this past off-season, Deadspin, a site I happen to enjoy and one that I would consider to be a decent gauge for how sports fans think about various players, teams and issues, ran the following headline:
How Does A 14-11 Record Get You $60 Million? Here's How
Well, as readers of this site probably already know, Lowe has had a magnificent Major League Baseball career and does not appear to be slowing down. How did that four-year deal with the Dodgers work out - a deal the Red Sox were happy not to consider so that they could go out and get Matt Clement?
               IP   K/BB   WHIP  ERA+
2005-2008     850   2.63   1.23  122
Over the course of Lowe's Dodgers deal, 2005 through 2008, 20 other players notched 800 innings. Among them, Lowe ranks tenth in ERA+.
               IP     ERA+
Santana       918.2   152
Halladay      833     144
Webb          927     143
Oswalt        883     137
Sabathia      883.1   136
Lackey        814     130
Peavy         802.1   128
Zambrano      842.1   125
Haren         878.2   123
Lowe          850     122
I wonder how many would consider Lowe to be in the company of the other names on that list. I would say the Dodgers received great return on their investment in Lowe.
Before arriving in Los Angeles, Lowe was already an accomplished player. In 278 career relief appearances, Lowe has a 2.95 ERA. In 1999 he pitched 109 innings in relief, notching a 2.63 ERA and a 1.00 WHIP. The following season he tied for the AL lead with 42 saves. 2001 saw the birth of "the Derek Lowe face" - he struggled a bit - but bounced back in a big way in 2002, forming one of the best 1-2 combo's in recent memory with Pedro Martinez.
2002
           IP   K/BB  WHIP  ERA+
Lowe     219.2  2.65  0.98  177
Pedro    199.1  5.98  0.92  202
Barry Zito won the Cy Young Award that year in a classic awards vote that ignored park effects while over-emphasizing wins (Zito was 23-5). Pedro and Lowe finished second and third, respectively. In 2003 and 2004, Lowe slipped but was still a fairly dependable option every fifth day. As much as he struggled by his standards in 2004, Lowe still made 33 starts for a team that won the World Series. He was fantastic in the post-season.
=======
Since Lowe became a full-time starter in 2002, of all pitchers with at least 1,100 innings pitched, he ranks 9th in innings and 13th in ERA+. Over the last 25 seasons, of all pitchers to have notched at least 1,700 innings, Lowe ranks 14th in ERA+. Barring an unrealistically spectacular close to his career, Lowe's numbers will never rise to a level that garners him Hall of Fame consideration. He will end up more Jimmy Key, Kevin Appier or Bret Saberhagen than Curt Schilling, Kevin Brown or Mike Mussina. But nonetheless he has comfortably reached that next level down - the Hall of Very Good some call it - and as his record comes more into focus and some of his ancillary traits less so, time figures to treat Lowe's legacy well.
| F/X Visualizations | April 07, 2009 |
Saying Goodbye
I know this post is supposed to be about opening day, but there was one more thing I wanted to do before turning my attention to the current season. Peter Jensen's amazing series on using the Gameday data to build a fielding metric prompted me to get that data and play around with it. The first thing I wanted to do was make a run value by hit location map. It seems only right to present such images for the two closed New York parks as a way of saying goodbye before really getting into the new season.
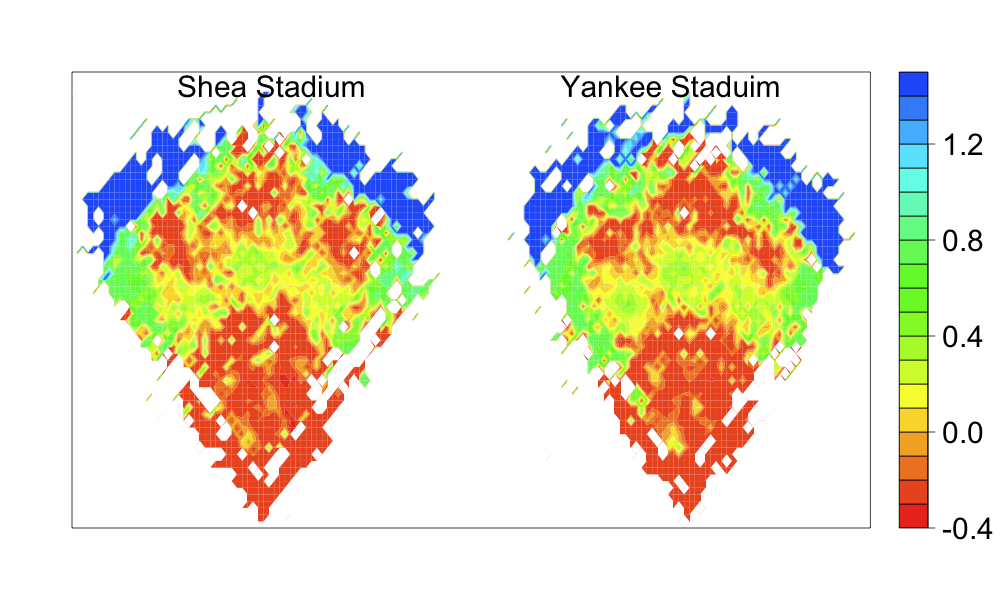
I used Jensen's hit factors to translate gameday's pixel into feet, so the two images should be to scale. The run value should include all hits, outs, foul outs and HRs since 2005.
| Around the Majors | April 07, 2009 |
Opening Day 3
I had the opportunity to catch most of the first game of the 2009 Major League Baseball season when the Atlanta Braves defeated the reigning champion Philadelphia Phillies by the score of 4-1. Phillies starter Brett Myers did not look comfortable on the mound and he allowed four runs on eight hits and a walk over six innings. The biggest issue with Myers appeared to be a lack of confidence in his fastball. The right-hander began to rely on his secondary pitches too much during the game. The fastballs came mostly early on in the at-bats. Myers favored his change-up as his out-pitch in the beginning, but switched to the curveball after giving up a home run to Atlanta catcher Brian McCann on the off-speed pitch.
It was only one game, but Jeff Francoeur looked much more comfortable at the plate. It also appeared like a huge weight was lifted off his shoulders after he hit that home run; He can now hopefully put the demons to rest after a horrendous 2008 season. His home run, though, came on the first pitch he saw in 2009 so maybe he hasn't learned from his mistakes... or has he? Franceour then saw seven pitches in his second at-bat. That is actually more impressive than the home run.
I also have a couple quick thoughts from the Texas-Cleveland game, which ended in favor of the Rangers by the score of 9-1.
| Around the Majors | April 07, 2009 |
Opening Day 2
The Toronto Blue Jays, considered perhaps the weakest team in the American League East this season, stomped on the Detroit Tigers on Opening Night 2009, by the score of 12-5. While it might be exciting to have such a powerful start to the year, it really doesn't change anything; it's still going to be a rough year for the Jays. The club was just lucky to match up with another struggling team during the first series of the year.
Ace - and perhaps the most consistent starter in the American League - Roy Halladay was on the mound for the Jays last night and he was dominant. He did not allow a hit until Detroit center-fielder Curtis Granderson led off the fourth inning with a solo home run. Halladay did not allow another run until the wheels fell off in the seventh inning and the Toronto right-handed hurler allowed another four runs. The most frustrating part was that I asked myself at the beginning of the half inning why Toronto was sending Halladay out for the seventh inning with the club already ahead 9-1.
It was the first game of the year, but for whatever reason Toronto managers (and they've all been guilty) leave Halladay in games when things are well-in-hand. Now, he was at just about 75 pitches at the beginning of the inning, but why not keep him fresh early in the year - on the outside chance that you might need him to throw a lot of key innings in the second half of the season? As it was, he ended up throwing 99 pitches, he allowed five earned runs, and he lost his quality start, when in fact he dominated for six innings. The club also still ended up using four relievers (Jesse Carlson, Brandon League, Scott Downs and Brian Tallet) over the final two innings.
Other Thoughts on the Blue Jays:
Thoughts on the Tigers:
The move to the bullpen might just be what Nate Robertson needed. The displaced starter, who finished the 2008 season with a 6.35 ERA in 32 games (28 starts) was not happy about the move to the pen, but he made two left-handed hitters look foolish. Robertson, a southpaw, struck out both lefties that he faced and sent Overbay (who swung feebly at three pitches) back to the dugout shaking his head.
| Around the Majors | April 07, 2009 |
Opening Day 1
The good news, as a Jays fan, is that the club defeated the Detroit Tigers on Opening Night by the score of 12-5. The bad news was that it was the first time in my 32 years that I was ashamed to be a baseball fan. Last night's game in Toronto was delayed about 20 minutes when Detroit manager Jim Leyland pulled his players off the field when fans began throwing balls, paper and other items onto the field, which Leyland rightfully felt was putting his players in danger.
If the fans had not gotten themselves under control, a forfeit of the game could have occurred and the Jays - leading 12-5 at the time - would have been credited with the loss, according to the announcers Jamie Campbell and former MLB player Pat Tabler (KC, Cleveland, Toronto).
Maybe it's just wishful thinking, but I am not sure it was the Blue Jays fans that were throwing the items at the Detroit players. No. 1, a large number of Detroit fans had driven down to watch the game given the close proximity of the two cities and more than 48,000 tickets were sold. No. 2, why would fans of the winning team be throwing things when their club was leading by seven runs and also had runners on and were in the middle of threatening to score even more? That sounds more like a situation where the losing team's fans would be in an uproar. No. 3, Toronto fans have been lambasted in the media on more than one occasion by players on local teams who say Canadian fans are too quiet, too polite and need to be more vocal.
It really doesn't matter who it was; it may have been fans from both cities. It was inexcusable and embarrassing. What makes it even worse is that it happened during the first game of the 2009 season. I hope it was not a sign of things to come in Major League Baseball and professional sports, in general.
| Touching Bases | April 07, 2009 |
GameDay, MLB.TV, and Instant Replay
The new MLB gameday and mlb.tv are unreal. MLBAM unveiled GameDay Premium, which will cost $20 for the season , but I’ll be sure to make the investment for the comprehensive pitch f/x data presentations including hot/cold zones velocity charts, pitch type charts movement charts, and release point charts. Now that Josh Kalk took his player cards down, the only two sources left for real-time pitch f/x graphs and data are brooksbaseball and mlb gameday.
MLB.tv offered every game’s home, away, and radio broadcasts, and the DVR as well as “jump to inning” functions will be useful later on when I’m not watching games live. The option of displaying four games at once is awesome. Unfortunately, MLB’s archaic zoning laws prevents friend of mine who lives in Pennsylvania from watching Mets, Yankees, Pirates, and Phillies games due to blackout restrictions.
As for actual baseball, It looks like the closer’s job in St. Louis may still be up for grabs. Jason Motte entered the ninth inning with a two run lead and immediately brought the heat. His first pitch was a fastball in, and a hitter as experienced as Freddy Sanchez knew what to do, raking it for a double. Motte got the next two batters out before he unraveled. Motte was too predictable, as Adam LaRoche, Eric Hinske, and Jack Wilson all sat dead red. He challenged LaRoche with three fastballs, and LaRoche picked up his second hit of the game. Hinske pounded the first-pitch fastball for a double. Finally, Motte loaded the bases with two outs up one when he challenged Jack Wilson. Wilson was overmatched, swinging through the first-pitch fastball he knew was coming. He was able to foul off the second, but then went to the well once too often as Wilson caught up with a letter-high fastball for a game-winning three-run double. In all, Motte threw 22 fastballs in the 95-98 MPH range, but he might want to use his slider more often when he’s ahead in the count.
I already saw a couple contested home run calls for which replay wasn’t used. I think it was Yunel Escobar who hit a shot to center in the Sunday night that might or might not have cleared the wall. The hit ruled a double in spite of a fan’s protest that the ball had hit him in the chest. The next day Cesar Izturis lifted a ball to deep left which Johnny Damon had a beat on, but as he jumped at the wall a fan reached over and interfered with his arm, allowing the ball to travel into the stands. Is replay only going to be used during the playoffs or are we going to take this tool seriously?
| Behind the Scoreboard | April 07, 2009 |
Opening Day
Well, Opening Day is in the books. What can you take away after one game? Not a whole lot, but I'll do my best here to look at who's smiling and who's worrying after Day 1.
Worrying - NY Yankees: The Yanks went and spent big money on CC Sabathia and he did not reward them on Opening Day, getting pounded for six runs, eight hits, five walks, and zero strikeouts. We now get to see whether the heavy workload the Brewers put on him will take its toll in 2009. A few more starts like this and fans will be giving him the Bronx cheer all year long. In other news, Mark Teixeira went 0-4 with 5 left on base. Perhaps it's good that the Yanks started on the road this year.
Worrying - Cleveland Indians: Cliff Lee had a Cinderella story in 2008. He entered the season with a lifetime ERA of 4.64, but dominated the league going 22-3 with a 2.54 ERA. After Monday's performance (5 IP, 7 ER, 10 H), should the Tribe be worried he'll turn back into a pumpkin in 2009? He clearly turned a corner last year, but he hasn't exactly been the model of consistency throughout his career. Opening Day didn't exactly instill confidence that he can keep it going in 2009.
Worrying - Kosuke Fukudome: He set the world on fire in his first two months in 2008, but then the league caught up to him and his second half consisted of looking lost at the plate. Monday's performance was more of the same - ground out to second, strikeout looking, ground out to second for a double play, fly out to left. Fukudome is an outstanding right fielder, but that advantage is negated when they put him in center as they did last night. Only Piniella knows how long they'll stick with him - as a Cubs fan, I hope it's not long.
Worrying - St. Louis Cardinals: Any time you go with a closer who has 12 innings of major league experience, you are playing with fire. On Monday, Tony LaRussa got burned with Jason Motte (1 IP, 4 ER, 4H). Motte dominated the minor leagues the past few seasons, but the Cards will have to determine quickly if he can close at the major league level. If not, they'll need to find an answer at the back end of their pen soon if they are to contend.
Smiling - Atlanta Braves: Derek Lowe, Atlanta's big free agent acquisition, pitched a gem (8 IP, 2 H, 0 BB). He's been a consistent performer over the past several years, but he will be 36 this year - if the Braves are to contend they'll need him in top form. Additionally, hot prospect Jordan Schafer homered in his first at-bat - can't beat that. Defeating the World Champs and division rival Philadelphia was a nice bonus too.
Smiling - NY Mets: J.J. Putz and K-Rod did what they were paid the big bucks to do (1 inning apiece, 0 runs, 0 hits). If they pitch like they are supposed to, the combo of Santana, Putz, and K-Rod will be awfully tough to beat in the post-season this year. Now that the Mets have fixed their leaky bullpen, it's a lot more likely they'll actually get there this season.
Smiling - LA Angels: Yes, it's only Game #1, but their game against the Oakland A's had probably the biggest pennant race implications of the day. For teams that most picked to go 1-2 in the AL West, every game between them will be big. The Angels now have a 1 game head start.
Now that opening day is over, there are 161 more games to find the other storylines in what should be another exciting season of baseball.
| Change-Up | April 07, 2009 |
Nice Start for the Fish
Over dinner in Fort Myers back in early March, a number of us were kicking around who the surprise teams were. Minnesota was mine; I liked their 1-through-5 starting pitching depth and thought that any offense anchored by Joe Mauer and Justin Morneau would be good enough. This was before Mauer was hurt, of course.
One Red Sox front office member's team was the Florida Marlins. Hanley Ramirez may be the best player in baseball, after all, and the roster is filled with young, hungry players all seemingly ready to come into their own around the same time. They're loaded with live arms, speedsters and power hitters, features that were all on display yesterday.
The Fish pounded the Washington Nationals 12-6 in most impressive fashion. Ricky Nolasco went six innings and the Marlins bullpen finished the final three frames. They combined for nine strikeouts, six hits and most importantly for a Florida staff that can get a little wild, no walks. Ramirez hit his first career grand slam. Jeremy Hermida and Jorge Cantu added home runs of their own.
Also homering was Emilio Bonifacio. His was of the inside-the-park variety. In his first game with the Marlins after coming over from their Opening Day opponent - the poor Nationals - Bonifacio had a debut for the ages. He hit a thrilling inside-the-park home run, added three singles, three stolen bases and four runs scored.
One never wants to put too much stock in just one day but in looking for how to describe this Florida club after one game, I thought Cody Ross did a pretty nice job describing their appeal. He said:
''If I'm a fan and this was one of the few games I've ever seen, I'd definitely want to come back and watch the Marlins play again.''
Agreed, Cody.
| Baseball Beat | April 07, 2009 |
Opening Impressions
All of us at Baseball Analysts are throwing a Johan Santana changeup at you today and posting short takes on what we found interesting on Opening Day.
Angels 3, Athletics 0
I sat in the front row behind the Angels dugout (that's me on the far left) and witnessed Joe Saunders carve up the A's, allowing only three hits and two walks over 6 2/3 scoreless innings. In opposition to the consensus perception, Saunders is not a soft-tossing lefthander. According to FanGraphs, his fastball averaged 91.0 mph last year and it ranged from 88-92 on Monday night. His 93rd and last pitch of the evening hit 91 and resulted in a weak comebacker off the bat of Oakland catcher Kurt Suzuki, who was retired 1-3.
Manager Mike Scioscia handed the ball to Jose Arredondo to close out the seventh. He was throwing 93-94 (in line with his 93.7 average last season). Scioscia then went to Scot Shields in the eighth. He retired the side in order with a heater that was 91-92 (vs. 92 last year). Newly signed free agent Brian Fuentes closed out the ninth 1-2-3 and earned his first save as a Halo. The slinging southpaw was working at 89-90 (down a tad from a year ago when it was sitting at 91-92).
While the Angels bullpen lacks a Jonathan Papelbon and Boston's depth (which is strong enough to exclude Daniel Bard and the easiest-throwing 100-mph fastball you've ever seen), it ranks among the best in the league. Look for Arredondo, Shields, and Fuentes to finish the final three innings of numerous games this season.
A couple of other quick takes:
- Chone Figgins made two spectacular plays at third base in the first and third innings, one where he ranged to his right, backhanded it, and made a strong throw to nip former teammate Orlando Cabrera and a second in which he dove to his left and forced out a baserunner at second with a throw from his knees. Figgy may not win any Gold Gloves for his work at the hot corner but is better defensively than generally believed.
- Howie Kendrick had two run-scoring hits, including a home run that left the park just to the right of straightaway center field. It's easy to forget that Kendrick is only 25 years old and averaged .360/.401/.571 during his minor league career (with 50 HR in 1669 plate appearances). Howie could inflict a lot of damage from the two hole this season.
...and a couple of departing questions:
- Why is it that respected analysts such as those at Baseball Prospectus, Keith Law, Rob Neyer, and our own Patrick Sullivan and Jeremy Greenhouse pick the A's over the Angels to win the AL West?
- What am I missing?
If one is worried about the Angels' starters, then one has to be equally concerned about the A's. Sure, LA is doing without Kelvim Escobar, John Lackey, and Ervin Santana in April (and perhaps part of May for one or more of the trio). But the Angels managed to go 18-11 last April without any help from Escobar or Lackey (or Mark Teixeira, for that matter). By contrast, OAK opened the season with Dallas Braden and the rotation includes Dana Eveland, a guy named Josh Outman (nice name for a pitcher but c'mon), and two highly touted but untested rookies who have thrown a combined total of 68 innings above High-A and have yet to appear in anything above Double-A. Meanwhile, the bullpen is in shambles and in no way compares to what the Angels can deliver in the late innings.
While I picked the A's to finish second behind the Angels in our AL West preview last week, I believe (as I opined on Friday) that Oakland "could find themselves in the cellar come October if the young pitchers aren't up to the challenge and Beane trades Holliday in July."
It's only one game. I know there are still 161 games to play. But I see no reason to change my assessment of the Angels and A's after last night.
| F/X Visualizations | April 06, 2009 |
Does the Umpire Know the Count?
In my previous posts I have averaged over all counts, but intuitively and empirically we know that pitchers and batters behave differently in different counts: Joe Sheehan showed that pitch location and batter's swing rates, John Walsh that pitch type frequency and Jonathan Hale that the size of the called strike zone all vary by pitch count. In this post I build on, combine, and present in a visual manner some of these previous results.
Below I reproduce the first panel from my deconstructing the run value map posts, but here separated by count and averaged over pitch types. The heat map is the batter swing rate, the percentage of pitches in a given location the batter swings at. Over that are the 25%, 50% and 75% strike contours for taken pitches. This means taken pitches inside the smallest contour are called strikes over 75% of the time, pitches between the smallest and middle contours are called strikes between 75% and 50% of the time and so on. The strike zone is called differently to RHBs and LHBs, so I restricted this analysis to just RHBs.
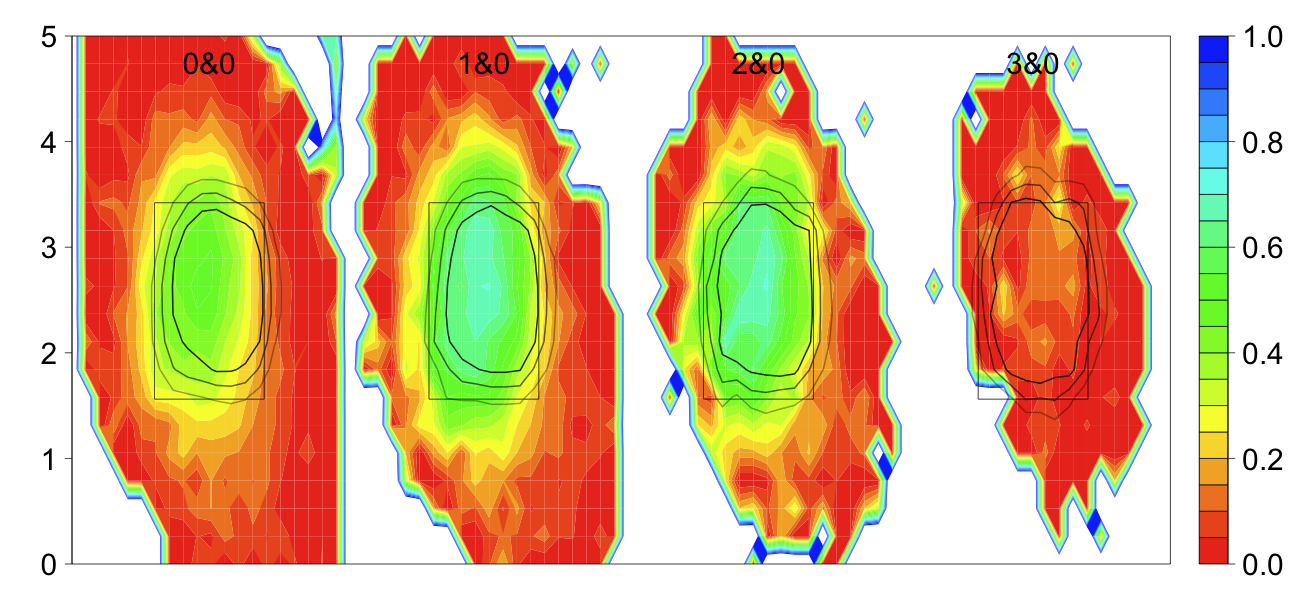
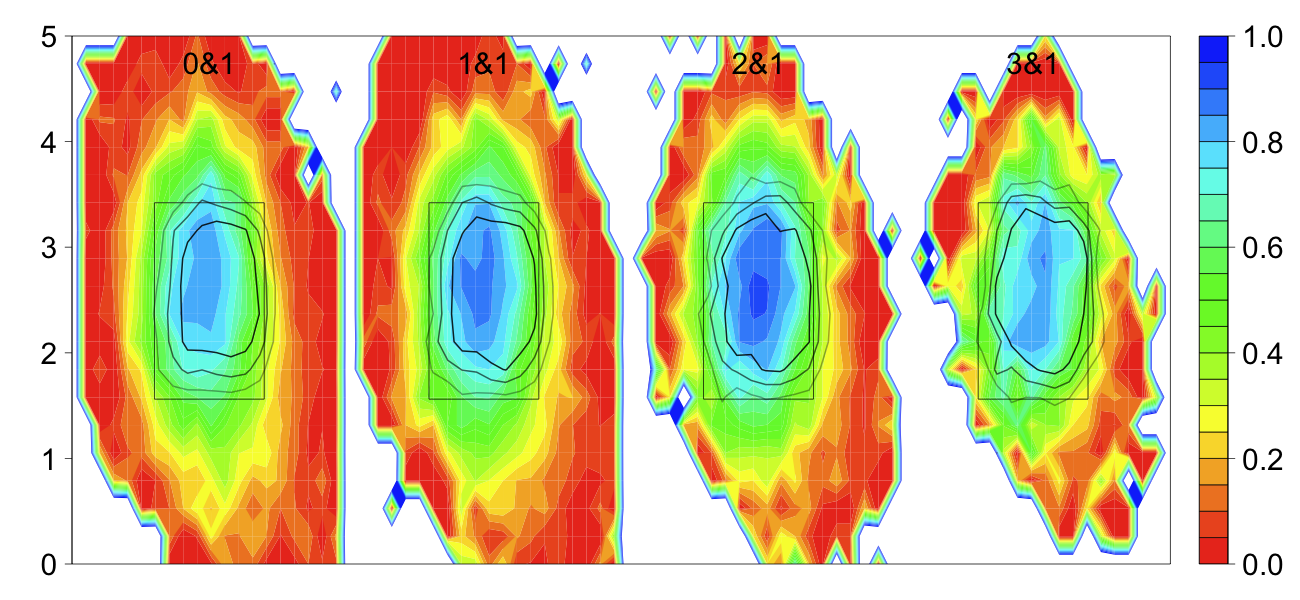
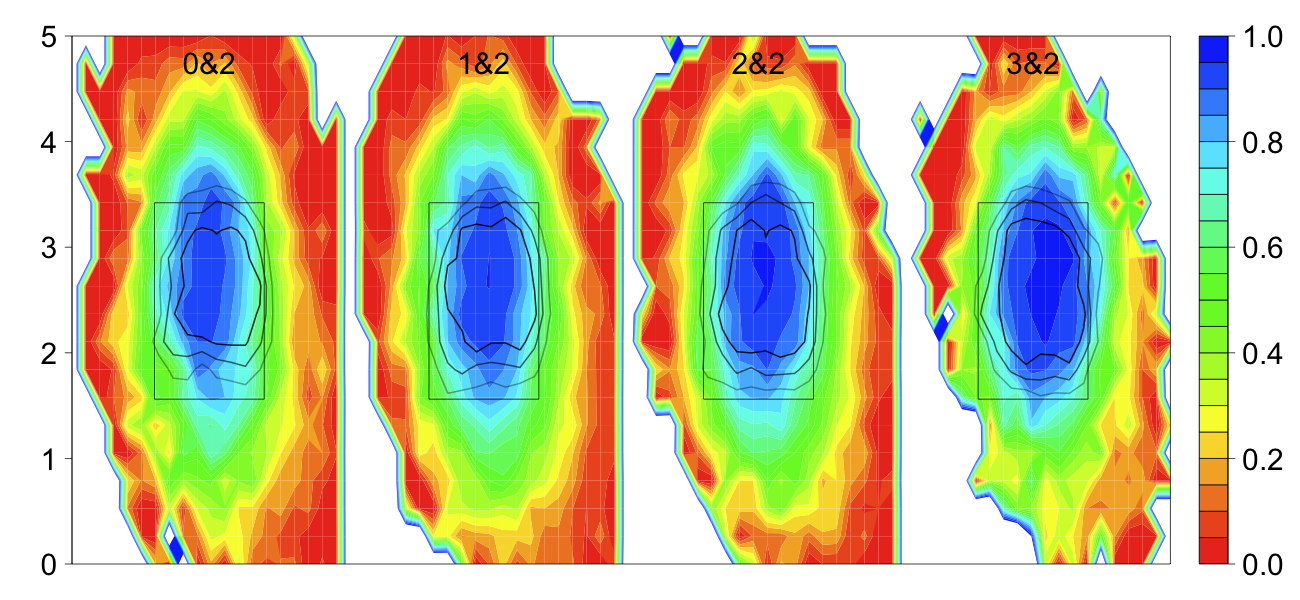
Swing Rate
Batters swing more when there are most strikes (going down a column). In favorable counts batters swing slightly more inside, but that tendecy is lost in pitcher's counts. In order to see the trends in swing rate better I averaged over all locations in and out of the strike zone (using the 50% strike contour not the rule book zone).
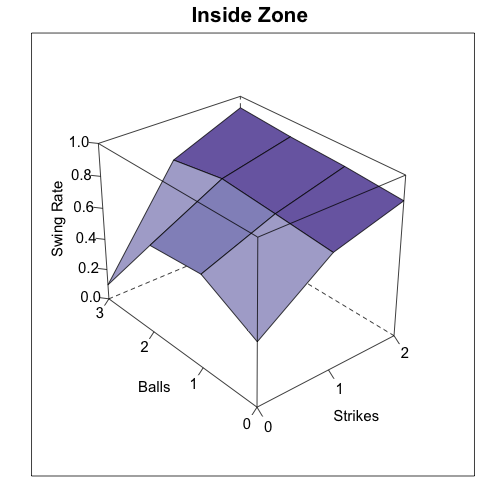
 Swing rate inside the zone
+-----------+---------+---------+---------+---------+
|           | 0 Balls |  1 Ball | 2 Balls | 3 Balls |
+-----------+---------+---------+---------+---------+
| 0 Strikes |   0.405 |   0.587 |  0 .559 |   0.096 |
| 1 Strike  |   0.727 |   0.762 |   0.795 |   0.742 |
| 2 Strikes |   0.850 |   0.880 |   0.898 |   0.927 |
+-----------+---------+---------+---------+---------+

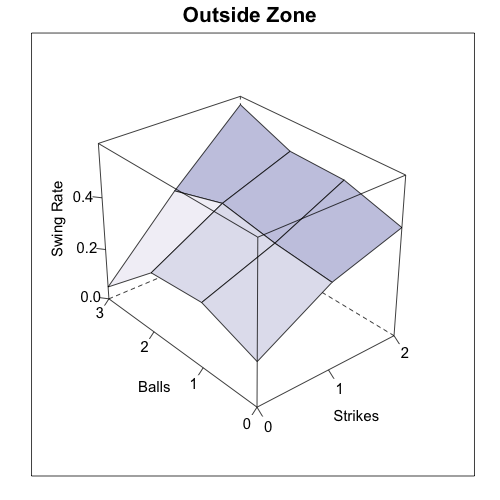
 Swing rate outside the zone
+-----------+---------+---------+---------+---------+
|           | 0 Balls |  1 Ball | 2 Balls | 3 Balls |
+-----------+---------+---------+---------+---------+
| 0 Strikes |   0.171 |   0.249 |   0.232 |   0.049 |
| 1 Strike  |   0.330 |   0.350 |   0.385 |   0.325 |
| 2 Strikes |   0.414 |   0.478 |   0.484 |   0.568 |
+-----------+---------+---------+---------+---------+
There is no uniformly increasing or decreasing swing rate trend with number of balls like there is with number of strikes. Batters swing at roughly the same rate with one and two balls, and less than that when they have zero or three balls. But the size of this effect is quite variable depending on the number of strikes. It is very pronounced with no strikes and quite small with one or two. Interestingly batters swing more in 3&2 counts than in 2&2 counts (or any other count for that matter), which runs counter to the above trend. Intuitively this seems like a mistake on the part of batters and it would be interesting to see if this is case, perhaps taking a game theoretic approach like iamawesomer recently did.
Strike Zone
The size the of strike zone changes dramatically in the way that Hale previously demonstrated. As the number of strikes increases the strike zone shrinks and as the number of balls increases the strike zone expands. One thing we can do here, beyond Hale's original analysis, is see where this expansion and contraction take place. As the number of balls increase the top of the strike zone gets higher and the bottom lower, but the outside and inside edge do not change very much. As the number of strikes increase there is some small movement of the inside edge in, but most of the change is the top moving down and the bottom moving up. So most of the change is a vertical, not horizontal, expansion or contraction of the zone.
In addition this analysis allows us to measure just how big the strike zone is in each count. The measurements below are in square feet. (In the image the strikes count in the opposite direction from the swing rate images.)
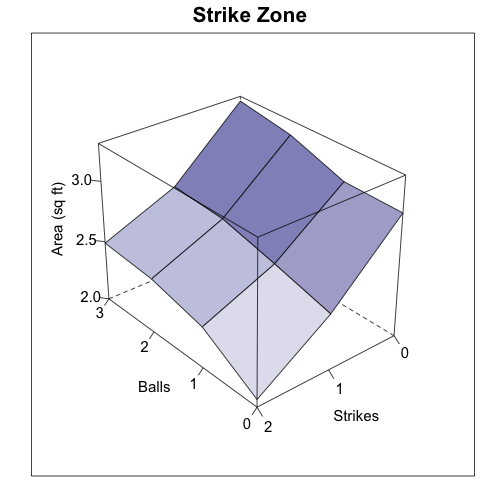
 Area of the strike zone (sq ft)
+-----------+---------+---------+---------+---------+
|           | 0 Balls |  1 Ball | 2 Balls | 3 Balls |
+-----------+---------+---------+---------+---------+
| 0 Strikes |    3.01 |    3.02 |    3.18 |    3.26 |
| 1 Strike  |    2.46 |    2.59 |    2.71 |    2.74 |
| 2 Strikes |    2.06 |    2.34 |    2.45 |    2.49 |
+-----------+---------+---------+---------+---------+
There is a substantial change; at its largest the strike zone is over 1.5 times the size of the zone at its smallest. But are these changes statistically significant? I noted in a past post that it seemed different pitch types were called differently, and we know that the frequency of pitch types thrown in different counts is different. So maybe the changes we see are an interaction of these two facts. For example 3-0 pitches are overwhelmingly fastballs, maybe umpires call a larger strike zone for fastballs than other pitches and the differences we see are not driven by count, but by pitch type.
To address this, and the overall significance of the zone size changes, I ran a binomial logistic regression. This is a regression in which the dependant variable only takes two values, in this case 1 if a taken pitch is called a strike and 0 if it is called a ball. The dependant variable is regressed against any number of ordinal and/or categorical variables. I regressed strike/ball against horizontal distance from middle of zone (in inches), vertical distance from middle of zone, the interaction of these two distances, length of pitch break (in inches), the number of strikes, the number of balls and the pitch type (the analysis uses fastballs as the baseline and compares the other pitches to them). I used x distance, y distance and x by y interaction rather than just distance so the strike zone isn't forced to be a circle.
 Binomial Logistic Regression
+-----------------+----------+------------+---------+------------+
|                 | Estimate | Std. Error | z Value |    P(>|z|) |
+-----------------+----------+------------+---------+------------+
| (Intercept)     |    7.887 |      0.050 |  157.72 |  < 2e-16 * |
| x dist.         |   -0.570 |      0.003 | -163.49 |  < 2e-16 * |
| y dist.         |   -0.693 |      0.004 | -173.08 |  < 2e-16 * |
| x*y Interaction |    0.029 |      0.000 |  111.84 |  < 2e-16 * |
| Break           |    0.027 |      0.005 |    5.51 |  3.6e-08 * |
| Num. Strikes    |   -0.575 |      0.013 |  -44.91 |  < 2e-16 * |
| Num. Balls      |    0.213 |      0.010 |   21.76 |  < 2e-16 * |
| Changeups       |    0.012 |      0.039 |    0.31 |     0.76   |
| Curves          |    0.037 |      0.049 |    0.77 |     0.44   |
| Sliders         |   -0.038 |      0.026 |   -1.43 |     0.15   |
+-----------------+----------+------------+---------+------------+
So the effect of count is indeed significant. In fact, all else equal, each strike in the count decreases the likelihood of a pitch being called a strike the same amount as a pitch being one inch further away from the center of the zone (roughly equal estimates). The number of balls is also significant but the effect is less than half of that of the number of strikes (you can see in the image of strike zone area above, area decreases more as you increase strikes than it increases as you increase balls). The length of break is also significant, pitches with lots of break are slightly more likely to be called a strike. Once we control for break and count there is no significant difference in how the strike zone is called to different pitch types.
MLB is still interested in monitoring umpire performance and this year will replace QuesTec with a new Zone Evaluation system (which it seems is just the pitchf/x system). So I am sure MLB is aware, or will be aware soon, of the variable zone size based on count. I wonder if it is something they will try to change or if it is appreciated as being part of the fabric of the game.
| Change-Up | April 05, 2009 |
2009 Over Unders
For two seasons running now, I have decided to run a piece in this space putting myself out there with picks on Over/Under MLB team win totals. The 2009 over/unders are out and the season gets underway tonight, so let's give it another go. Here is how I introduced 2007's predictions.
Many would argue that the crux of Sabermetrics is that you can predict a team's win total by analyzing a team's ability to score and prevent runs. Virtually all other research aimed at determining what contributes to a baseball club's winning efforts, on both an individual and team-wide level, is derived from this finding. Sabermetric projection mechanisms with these principles at their core offer a neat opportunity for the enterprising individual to take advantage of Vegas over/under win totals.Now, projections are never fool-proof and are often downright inaccurate. Just ask Tigers fans from last season [2006]. But I happen to believe that the astute fan has the opportunity to stick one to Vegas on these (hey, it makes up for football season). So without further ado, let me try my hand at each MLB team. I will offer up my prediction (over or under) and then briefly account for why I believe the arbitrage opportunity exists. And yeah, I will be on the record here so just as I stated back on Valentine's Day, feel free to check back and ridicule me if it turns out I am just dead wrong on a lot of these.
Last season I had a rough year (slightly below .500) but I went 21-9 in 2007. Onto my picks...
===========================
National League
Arizona - Over 86 (-115) Under 86 (-115)
Prediction: Under
What is Vegas missing here?
Barring 200 innings from Max Scherzer and bigtime jump seasons from two of Stephen Drew, Chris Young, Conor Jackson and Justin Upton, the back end of the rotation and lineup are just not good enough to allow Arizona to contend.
==============
Atlanta - Over 84.5 (-115) Under 84.5 (-115)
Prediction: Over
What is Vegas missing here?
Not much but I will take the over. By adding Derek Lowe, Javier Vazquez and Kenshin Kawakami, the Braves have dramatically bolstered their starting pitching. Kelly Johnson and Jeff Francoeur figure to improve and whatever you think of the man, Garret Anderson figures to imorove upon Gregor Blanco.
==============
Chicago Cubs - Over 92.5 (-115) Under 92.5 (-115)
Prediction: Over
What is Vegas missing here?
I like the over here because they won 97 last year and with all due respect to Kerry Wood, the Cubbies managed more-or-less a "pure addition" off-season. They should get an additional 100 innings from Rich Harden in 2009 and they managed to add Milton Bradley, the American League's finest hitter from 2008.
==============
Cincinnati - Over 78.5 (-115) Under 78.5 (-115)
Prediction: Under
What is Vegas missing here?
The bull case for this offense rests on Brandon Phillips bounce-back, big steps forward from Jay Bruce and Joey Votto and a return to form for starters Aaron Harang and Bronson Arroyo. Any two or three of these things seem probable to me but for the Reds to be a .500-type team, they need to fire on all cylinders. I don't see it happening.
==============
Colorado - Over 76.5 (-115) Under 76.5 (-115)
Prediction: Under
What is Vegas missing here?
They won 74 games last year and have lost Matt Holliday and Jeff Francis off of last year's team. Sure, there will be some guys bouncing back from injuries and I am as excited as anyone to see Chris Iannetta get some regular hacks but no. Not with this group.
==============
Florida - Over 75.5 (-115) Under 69 (-115)
Prediction: Over
What is Vegas missing here?
Not much at all - this looks like a good line to me. But I would be excited to get behind a pitching staff's like Florida's. With all of the high-K guys, there's tons of potential there and while the walks will in all likelihood preclude them from pushing 80 wins, you never know. Sometimes pitchers with talent like Josh Johnson and Anibal Sanchez and Chris Volstad and Ricky Nolasco can put it together.
==============
Houston - Over 72.5 (-115) Under 72.5 (-115)
Prediction: Under
What is Vegas missing here?
That looks right to me. They're not good, but they have enough individual stars sprinkled throughout the roster to stay out of truly awful territory.
==============
Los Angeles Dodgers - Over 85 (-130) Under 85 (even)
Prediction: Under
What is Vegas missing here?
Since the o/u number looks about in line with how I would call it, just give me the even money.
==============
Milwaukee - Over 81.5 (-115) Under 81.5 (-115)
Prediction: Over
Here is last year's remark on Milwaukee.
I am buying the "Rickie Weeks is poised to go crazy" story.
OK, seriously, I am buying it this year. Perhaps more importantly, C.C. or no C.C., they won 90 ballgames last season. Sub-.500 would be a long way to fall.
==============
New York Mets - Over 90.5 (-120) Under 90.5 (-105)
Prediction: Over
What is Vegas missing here?
89 wins last season coming back with a wholly dependable bullpen. I will take the "they will choke again" discount I think we are getting with this line, too.
==============
Philadelphia - Over 88 (-125) Under 88 (-105)
Prediction: Under
What is Vegas missing here?
How does Chase Utley bounce back? Is Cole Hamels really a 225-inning horse? Jamie Moyer? Still? Raul Ibanez will not replicate what Pat the Bat did. Joe Blanton gets pounded this season at Citizens Bank Park. Should I go on?
==============
Pittsburgh - Over 69 (-115) Under 69 (-115)
Prediction: Over
What is Vegas missing here?
The coming Andy LaRoche developmental leap...that the bullpen is pretty solid...that Nate McLouth and Ryan Doumit are both very much legit ballplayers.
==============
San Diego - Over 71 (-115) Under 71 (-115)
Prediction: Over
What is Vegas missing here?
That Tadahito Iguchi and Khalil Greene will be replaced by warm bodies, and that Chris Young and Jake Peavy will todd anywhere between 100 and 150 more innings than they did in 2008. I don't think the Padres are contenders by any stretch, but I do think this might be the easiest money on the board.
==============
San Francisco - Over 79 (-115) Under 79 (-115)
Prediction: Under
What is Vegas missing here?
Not a whole lot but give me the under by just a smidge. The lineup remains a wreck and I don't see the pitching taking any meaningful steps forward this season. Maybe Barry Zito bounces back a bit and Matt Cain takes a step in the right direction, but then Tim Lincecum probably comes off of his Cy Young numbers from 2008.
==============
St. Louis - Over 83.5 (-115) Under 83.5 (-115)
Prediction: Under
What is Vegas missing here?
Not much at all. I will concede that this starting rotation might have the widest range of outcomes in terms of how it performs in 2009 - they may well turn out to be quite good. But I can't get too comfortable with Chris Carpenter coming off injury and Joel Pineiro doing the Joel Pineiro thing. Is Kyle Lohse dependable? Is Adam Wainwright a number one? I don't know.
This is the call in which I am least confident.
==============
Washington - Over 72.5 (-115) Under 72.5 (-115)
Prediction: Over
What is Vegas missing here?
That catcher Jesus Flores is the only guy that does not hit in this lineup. Check it out - pretty much all of the Nats offensive regulars have it in them to really rake.
============================
American League
Baltimore - Over 72.5 (-115) Under 72.5 (-115)
Prediction: Under
What is Vegas missing here?
Matt Wieters, probably a few wins better than Gregg Zaun, starts in the Minors so that the O's can optimally manage his service time. I think their upside is a pesky 75-win team that wears down pitching staffs but with Wieters out and that pitching staff running out there, I will take the under on these guys.
==============
Boston - Over 94.5 (-115) / Under 94.5 (-115)
Prediction: Over
What is Vegas missing here?
The pitching is more or less guaranteed to be among the best in the American League. On offense, nobody except the catcher is a below average performer for their respective positions. Excellent, deep pitching and a solid, consistent offensive attack is a repeatable formula for teams interested in posting bigtime win totals.
==============
Chicago White Sox - Over 77.5 (-125) Under 77.5 (-105)
Prediction: Under
What is Vegas missing here?
Aging bats anchor a mediocre offense. Fluky 2008 performers set to return to earth headline a pitching attack that strikes fear in nobody now that Vazquez has headed south.
==============
Cleveland - Over 85.5 (-115) Under 85.5 (-115)
Prediction: Under
What is Vegas missing here?
That Cliff Lee regresses and all of CC's innings are gone. So that 85-win Pythag team set to get contributions from Victor Martinez and Travis Hafner once again unfortunately finds itself turning to Carl Pavano to contribute to its championship hopes. I understand the Cleveland bull case, the optimism, all of it. I am just not buying it.
==============
Detroit - Over 81.5 (-115) Under 81.5 (-115)
Prediction: Under
What is Vegas missing here?
Injury and age-related questions everywhere. I will admit that Rick Porcello is a damn interesting wild-card, however. If I am wrong, I'll be cool with it if I get to see that guy pitch lights-out this early on in his career.
==============
Kansas City - Over 77 (-115) Under 77 (-115)
Prediction: Over
What is Vegas missing here?
Why the hell not? They have some good starting and relief pitching, and a few interesting bats that could carry the lineup.
==============
Los Angeles Angels - Over 87.5 (-115) Under 87.5 (-115)
Prediction: Under
What is Vegas missing here?
Just too many injuries in that starting rotation. Also, check out Mark Teixeira's output as an Angel sometime.
==============
Minnesota - Over 83 (-115) Under 83 (-115)
Prediction: Over
What is Vegas missing here?
Scott Baker and Joe Mauer starting the year on the DL makes me skiddish about this call but I like the Twins a lot this year. I think their pitching will be deep and consistent, and expect them to edge Cleveland for the division title.
==============
New York Yankees - Over 94.5 (-115) Under 94.5 (-115)
Prediction: Under
What is Vegas missing here?
Not much - the Yanks are excellent. I just think the A-Rod injury could pose problems all season long.
=============
Oakland Athletics - Over 82 (-115) / Under 82 (-115)
Prediction: Over
What is Vegas missing here?
Jason Giambi, Orlando Cabrera and most of all, Matt Holliday represent significant upgrades over the guys they will be replacing from the 2008 squad. Travis Buck bounces back, and some of that young talent that Billy Beane hopes is ready steps forward.
==============
Seattle - Over 73 (-115) Under 73 (-115)
Prediction: Under
What is Vegas missing here?
Not much at all. They were a 67-win Pythag team last year, figure to get Erik Bedard back and they have drastically improved their defense, which figures to help save some runs. I worry about the offense but I think Russell Branyan could offer a nice little unexpected boost over and above Richie Sexson's, um, output in 2008. I guess I just think six wins is a little much.
==============
Tampa Bay - Over 89 (-115) Under 89 (-115)
Prediction: Over
What is Vegas missing here?
Nothing, really. B.J. Upton emeges as a consistent regular but the bullpen regresses. They get a little boost from more Scott Kazmir innings, and that one month without A-Rod may mean an extra win or two for them. I like them closer to 92 wins.
=============
Texas - Over 74.5 (-115) Under 74.5 (-115)
Prediction: Under
What is Vegas missing here?
No more Milton Bradley, but plenty of other sticks. There are also holes in this lineup but then, the defense improves with Elvis Andrus and the starting pitching should take a step forward. Shake it all together, and I guess I just think there are too many problems with this roster.
==============
Toronto - Over 77.5 (-115) Under 77.5 (-115)
Prediction: Under
What is Vegas missing here?
That this is the year Toronto falls right off the cliff. Talent defections, financial problems, injuries...it's going to add up in an ugly way north of the border this season.
=============
OK folks, have at it. Who do you like? Where did I mess up? What's the one over/under pick you take with your life on the line?
Oh, and Happy Baseball. Should be one hell of a season.
| Behind the Scoreboard | April 04, 2009 |
Championship WPA: What Portion of a Title Did A Player Contribute?
Last week I introduced Championship Leverage Index, an index for measuring the impact of a game on a team's World Series title chances. This week I expand on the idea, and introduce Champ LI's sister stat, Championship Win Probability Added.
To review, Champ LI, similar to Tango's Leverage Index, measures the importance of a game relative to an average, neutral game. Last week I showed off the potential of Champ LI by showing graphs of each NL team's Champ LI as the season progressed. Last week's graphs, while informative, lacked one key component - they did not take into account the opponent of the game. It was nice to see the smooth graphs, taking into account only the standings without any odd spikes due to opposition, but to really measure a game's impact, the team's opponent must be considered.
Contrary to what some players and managers may say, all games don't count the same. A Red Sox-Yankees game isn't "just another game", as much as players may try to frame it that way. When a team plays a division rival also contending for the crown, the game takes on added impact - the team not only gets a needed win, but deals a loss to a competitor. So just how much additional impact does playing a division foe bring?
Let's look at a couple of graphs of last season's races to find out. Below is a graph of the Arizona Diamondbacks' Leverage Index over the course of the season. The red bars indicate games against Los Angeles, the D'Backs main rival for the 2008 season.
As you can see, games against LA have an enormous impact compared with games against other teams around the league. However, it varies greatly depending on the time of year. Early season games against LA were not particularly important - only as important as games against other division rivals, which were in turn, only slightly more important than games against non-division rivals. In April, it wasn't yet clear who Arizona would have to compete with for a playoff spot, so the LA games had relatively little additional impact on Arizona's Champ LI. However, by the next time LA rolled into town, it was after the All-Star break and Arizona was up by 1 game on LA and up 7 on the next closest rival. They were also 6 games out of the wild card, so it was becoming clear that LA was the team to beat. Accordingly, their Champ LI skyrocketed from 1.5 to 2.5 for the first game of the Dodgers series. This was cemented even further by the time of their late August and September series, when the Champ LI was nearly doubled for the Dodger games.
Another example, Philadelphia, can be seen below. Games against the Mets and the Brewers are highlighted in red and green respectively.
Again, early in the season, games against New York had little additional impact and games against Milwaukee had no additional impact. However, when it looked like a two team race between Philly and New York in late August, the Phillies' Champ LI dramatically spiked during the New York series. The same happened when Philadelphia dramatically swept Milwaukee in four games in September to get back in the race.
The moral of the story is that, yes, games against rivals contending for the crown really are big games - counting for as much as double the importance of games against non-contending teams. In fact, as it becomes increasingly clear that it is strictly a two-team race, the Champ LI gets closer and closer to doubling when playing the other team in the race.
As a point of curiosity, I'll present this chart of each team's "biggest" games of the year. Most of the games are indeed against a division rival, and were usually the game where everything started to go downhill (for the non-playoff teams) or where the team really took off (in the case of playoff teams). For some, that game came very early in the season (opening day for the Giants), and for others it came late (astute readers will notice slight differences in Champ LI from last week's post. Last week the baseline of the index was an opening day game against a team not contending for the playoffs - however when the possibility of playing a pennant race opponent was factored in, this average used as a baseline increased slightly, making the Champ LI numbers you see here slightly smaller than last week.) Of course, it comes as no surprise that the most important regular season game of the year was the 1-game playoff between the White Sox and Twins.
Now that we finally have the effect of playing division rivals well-understood, I'll explain Championship Win Probability Added. As you've probably already guessed, Champ WPA is analogous to regular WPA, except that instead of measuring how many games a particular play or player won (or lost), it measures how many championships a particular play or player contributed.
The formula for this is very simple. Having already calculated the impact of a win on a team's chance to win the championship, we can simply multiply this number by a particular player's individual WPA to get Champ WPA. Taking account of the impact of both the game and the play within the game, we get the number of championships won. Intuitively, a player who had an individual game WPA of 1.0 (or 100%) during the 7th game of the World Series, would have contributed exactly one world championship to his team.
Let's look at an example in the case of C.C. Sabathia - a player who many consider to have practically carried Milwaukee on his back on the way to the playoffs. Below is a chart of his game by game results with the Brewers and we can see just how much of a World Series championship he earned.
As everyone knows, Sabathia was dominant in his stint with the Brewers - he was 11-2 with a 1.65 ERA. What's interesting is to see that he won about 6% of a World Series title due to his work during the regular season - the biggest game of course being his masterpiece against the Cubs on the final day of the season. However, in his one playoff appearance, he choked away much of his value when he was pounded for 5 runs in 3 2/3 innings - on that single day alone, he gave back 3.5% of a championship, leaving him with a net value of 2.33% of a World Series title with the Brewers. This may not sound like a lot for a player who played so well down the stretch in big games, but the way MLB is set up, the playoffs are what really matter, and it's difficult to make huge impacts without your team going deep into the postseason.
Let's take a look at another guy who was lauded for his big game performance after coming to a new team: Manny Ramirez. I won't print the whole chart here, but Ramirez earned 4.4% of a World Series title during the regular season with the Dodgers, with his most valuable performance coming in a September 7th game against Arizona (Champ WPA of 0.7%), the team's most important game of the year. It took Manny two months of MVP-caliber play in a pennant race to earn 4.4% of a championship, but in the postseason Ramirez bettered it in only 8 games (his most valuable game coming in Game 3 of the NLCS), racking up 7.3% of a World Series title for a total championship contribution of 11.7% with Los Angeles.
It's important to note that I'm not billing Champ WPA as the end all or be all of MVP-stats. Champ WPA does in fact give you the percentage of a championship won by a player, but of course, that is not necessarily the criteria that I would recommend using for the MVP. Champ WPA of course, is also not predictive, and thus is not very useful in player evaluation, but it does measure the actual impact that a player did have in terms of championships. I think that's a fairly noteworthy thing to keep track of, if just from a historical perspective. Francisco Cabrera, in one swing, contributed greater share of a championship (37%) than thousands of better players did in their entire careers. It doesn't mean he was better, it just means he really did contribute more - even if only by luck.
With that disclaimer, I'll wrap up with some fun stuff. Last week I left you hanging in the most important at-bat of the year - the 8th inning of the 7th game of the ALCS - when JD Drew struck out against David Price. How much of a championship did Drew lose with that at-bat? With a WPA of -13% and the game itself worth half of a championship, he lost 6.5% of a World Series title!
However, while that was the at-bat with the largest leverage, that wasn't the biggest championship changing event of 2008. What was? In Game 3 of the World Series, Grant Balfour came on in the bottom of the 9th with no outs and a man on first in a tie game. One pitch later, a wild pitch and a throwing error by Dioner Navarro put the winning run on third. Net result: 8.25% of a World Series title lost.
In the regular season, the biggest play of the year belonged to Ryan Braun's 2-out 8th inning home run giving the Brewers the lead against the Cubs on the last day of the season. The game was meaningless to the Cubs, but to Braun and the Brewers the play earned 2.4% of a World Series title.
Like WPA, Championship Win Probability Added doesn't tell you everything, but it does paint an informed picture of how plays and players impacted a team's chances for a championship over the course of a game, a season, and a career. While you may not want to choose your MVP by it, it's a fun an informative stat in its own right.
| Change-Up | April 03, 2009 |
AL West Preview
Today, Rich, Jeremy and I conclude the division series previews with the AL West. You can find past previews below:
AL Central
NL Central
AL East
NL East
NL West
The numbers presented are the averages of each of the projection systems featured on the Fangraphs player pages.
CATCHER
                 AVG   OBP   SLG
Napoli, M.      .246  .352  .480
Salty, J.       .259  .336  .421
Suzuki, K.      .265  .339  .382
Johjima, K.     .259  .307  .392
Rich: Mike Napoli cranked 20 home runs in 78 games while slugging .586, a higher rate than Joe Mauer, Brian McCann, Geovany Soto, and every other catcher in 2008.
Jeremy: The Rangers have a rare glut in catching depth, and Jarrod Saltalamacchia is the best hitter of the group. He put up a 27% line drive rate, which is really solid, but also a 37% strikeout rate, which is ridiculously high for someone who hit only three homers. The two factors resulted in a BABIP of .388 with a batting average of .253. Perhaps he should adjust to make more contact if it means sacrificing whatever power he may have, though of course it’s easier said than done.
Sully: I attended Game 3 of the ALDS last season, when Napoli hit a couple of moonshots at Fenway. I would love to see what he can do playing 125 games or so.
FIRST BASE
                 AVG   OBP   SLG
Morales, K.     .278  .321  .438
Davis, C.       .279  .329  .531
Giambi, J.      .239  .372  .463
Branyan, R.     .235  .330  .465
Rich: None of these four first basemen held down the job a year ago. Kendry Morales has had a huge spring (.395/.427/.671 with 14 XBH in 82 PA). He won't replace Mark Teixeira's numbers but will surpass those provided by Casey Kotchman, who served as the Angels first baseman for four months last season.
Jeremy: Chris Davis hits home runs. It’s kind of his thing. This is a great group for Three True Outcomes, and we haven’t even gotten to Jack Cust.
Sully: Kudos to the Mariners for giving Russell Branyan the job. I've long wondered how he might be able to perform with everyday playing time. The M's are going to find out.
SECOND BASE
                 AVG   OBP   SLG
Kendrick, H.    .309  .340  .448
Kinsler, I.     .287  .357  .472
Ellis, M.       .256  .329  .398
Lopez, J.       .281  .314  .418
Rich: Everybody except the AL West competitors would like to see what Howie Kendrick can do over a full season — if indeed he can stay healthy, which is something he has yet to accomplish. Kendrick, in fact, has never even played 100 games in a single season. His career walk rate (3.1%) and lack of home run power (12 HR in nearly 1000 career PA) suggest his ceiling may be much lower than his biggest supporters would like to believe.
Jeremy: Mark Ellis could foresee the collapse in the Free Agent market, but can he stop popping up a quarter of his fly balls?
Sully: Ian Kinsler hit .319/.375/.517 last season before going down. Given Kinsler's age - he's just 27, I will take the over on the projection listed above.
THIRD BASE
                 AVG   OBP   SLG
Figgins, C.     .281  .337  .370
Young, M.       .293  .347  .418
Chavez, E.      .251  .331  .435
Beltre, A.      .267  .322  .459
Rich: Although Eric Chavez is only 31, I suspect he is at or near the end of the road. If not for his contract (which pays him $11M in 2009 and $12M in 2010 with a $3M buyout in 2011), I'm afraid Chavez may have been jettisoned by now. His OPS+ has declined from 134 in 2004 to 108 to 105 to 102 to 87 in 2008. The trend is not Eric's friend.
Jeremy: Adrian Beltre. Contract year. Not that he needs incentives. Contrary to popular belief, he’s lived up to his contract, as Fangraphs win values say he’s added $6 million in surplus value over the life of his contract. He’s always had a nice glove, and Safeco is probably the hardest park for right handed power hitters in baseball, so I’d expect some smart team to trade for him (The A's, Rich?) and reap the benefits.
Sully: Rich Lederer, 6/25/2007:
While Michael Young may be the face of the franchise, did it really make sense to give the 30-year-old shortstop an extension for his age 32-36 seasons at a cost of $16M per? Young wasn't eligible to test the free agent waters until after the 2008 campaign. Make no mistake about it, Young is a productive player but the majority of his value rests in his batting average and defensive position. Young will earn his new contract if he continues to hit .310-.330 while playing a decent shortstop, but how valuable will he be if his average slips to .275-.295 as his power declines, especially if he winds up at a less desirable position on the Defensive Spectrum?
SHORTSTOP
                 AVG   OBP   SLG
Aybar, E.       .269  .310  .372
Andrus, E.      .251  .302  .327
Cabrera, O.     .276  .309  .379
Betancourt, Y.  .282  .307  .404
Rich: Can anybody hit here? These shortstops look like they are right out of the 1960s or 1970s. And Yuniesky Betancourt's advanced defensive metrics were horrible last year. But, hey, he saw a MLB-low 3.15 pitches per plate appearance in 2008!
Jeremy: Yeah, can I pass? I’ll say Orlando Cabrera is the only one here still holding his job in August.
Sully: There's nothing really to add about this group. Elvis Andrus will have to be Ozzie Smith reincarnate to make up for his bat.
LEFT FIELD
                 AVG   OBP   SLG
Abreu, B.       .282  .377  .441
Murphy, D.      .271  .327  .438
Holliday, M.    .297  .370  .500
Chavez, E.      .273  .319  .364
Rich: This is a big year for Matt Holliday. The five-year veteran will be a free agent at the end of the season and needs to prove that he can hit outside Coors Field. His career home (.357/.423/.645) and road (.280/.348/.455) splits are about as pronounced as anybody's. That said, Hit Tracker's Greg Rybarczyk, in a guest column on our site, projects Holliday to post a .418 OBP and .563 SLG for an OPS (.981) that is much closer to his home than road performance.
Jeremy: I’m right there with you, Rich. Why do people use Holliday’s road stats as a proxy for his true talent level? Every hitter is better at home. Why not just use park-adjusted stats. A 140 OPS+ and .410 park-adjusted wOBA are awesome, and it would make sense to expect something similar this year.
Sully: Abreu hit .327/.408/.522 in the second half of 2008. If that's the hitter the Angels are getting out of the gates this season, it could go a long way in holding them over while some of their starters heal up.
CENTER FIELD
                 AVG   OBP   SLG
Hunter, T.      .273  .331  .464
Hamilton, J.    .296  .365  .523
Sweeney, R.     .276  .340  .390
Gutierrez, F.   .260  .319  .411
Rich: While Franklin Gutierrez's offensive projections pale in comparison to Josh Hamilton's, he anchors a Seattle outfield that may be second to none defensively.
Jeremy: I’ve got to say, Josh Hamilton is highly overrated. So he tallied a bunch of RBI and put on a show during the home run derby. He was one of the worst defensive center fielders in baseball last year and was the third best hitter on his team behind Milton Bradley and Kinsler.
Sully: Now's the time for Ryan Sweeney. He took a big step forward last season, posting an above average offensive season in over 400 plate appearances. Now 24, he's the unquestioned starter on a team with high aspirations.
RIGHT FIELD
                 AVG   OBP   SLG
Guerrero, V.    .307  .372  .520
Cruz, N.        .273  .343  .501
Buck, T.        .266  .344  .429
Suzuki, I.      .311  .358  .399
Rich: Just about the time I thought Big Daddy Vladdy was starting to lose it, the 33-year-old ... err, 34-year-old ... right fielder hits .330/.391/.580 during the second half last season. The Angels exercised their team option for 2009 but Guerrero is unsigned for 2010 and beyond.
Jeremy: Vlad and Ichiro are the two *most unique* players I’ve seen in my life. Bobby Abreu and Guerrerro in the corners are the antithesis of Endy Chavez and Ichiro in every way. I expect big things from Cruz, who not only had that well publicized sizzling end to the season with the bat, but also steals bases and is a solid outfielder. This might be his last chance.
Sully: In his Minor League career, Travis Buck hit .326. Last year, he hit .226. I think he is a solid bounce-back candidate in 2009.
DESIGNATED HITTER
                 AVG   OBP   SLG
Rivera, J.      .274  .321  .457
Blalock, H.     .275  .336  .459
Cust, J.        .243  .382  .466
Griffey, K.     .248  .339  .426
Rich: Cust struck out, walked, or homered in 57 percent of his plate appearances last season. His 197 whiffs set an AL record and were the fourth-highest in the history of baseball. Did you know that the top four single-season totals took place in 2007 or 2008?
Jeremy: Interesting. I wonder how much of that is due to the fact that managers have a strong aversion to playing guys who struck out so often. I mean, there’s been a distinct change in styles of play, but managers have historically held a bias against batters who strike out, so as to avoid embarrassment. I’d imagine Juan Rivera plays a corner and Vlad or Abreu DHs. I’d also imagine neither Griffey nor Blalock plays more than 80 games.
Sully: It's amazing but Cust at DH might represent the single biggest positional advantage in the division. Maybe Napoli at catcher edges him.
STARTING PITCHING
                 K/9    BB/9    WHIP    ERA
Saunders, J.    5.61    2.70	1.34	4.09
Weaver, J.	7.45	2.58	1.26	3.78
Moseley, D.	5.77	3.21	1.53	5.27
Adenhart, N.	5.71	4.52	1.61	5.10
Loux, S.	4.50	2.86	1.45	4.77
                 K/9    BB/9    WHIP    ERA
Millwood, K.	6.29	2.77	1.44	4.61
Padilla, V.	6.24	3.37	1.44	4.88
Harrison, M.	4.98	3.40	1.52	5.17
McCarthy, B.	6.33	3.45	1.40	4.57
Jennings, J.	5.78	3.93	1.54	5.10
                 K/9    BB/9    WHIP    ERA
Braden, D.	6.34	2.97	1.40	4.48
Cahill, T.	5.75	5.16	1.57	4.68
Eveland, D.	6.69	3.94	1.45	4.25
Anderson, B.	5.64	3.26	1.44	4.81
Outman, J.	5.75	4.13	1.52	5.35
                 K/9    BB/9    WHIP    ERA
Hernandez, F.	7.93	3.11	1.32	3.78
Bedard, E.	9.24	3.44	1.26	3.51
Washburn, J.	5.19	2.89	1.39	4.44
Silva, C.	4.13	1.85	1.44	5.05
Rowland-Smith	7.18	3.80	1.40	4.09
Rich: If healthy, the Angels would have the best starting pitching in the division, perhaps by leaps and bounds. However, with John Lackey, Ervin Santana, and Kelvim Escobar shelved for April, the Halos will have to rely on prized prospect Nick Adenhart, journeyman Dustin Moseley, and never-has-been Shane Loux to comprise 60 percent of the rotation for at least the first month. I look for Adenhart to come through but am skeptical of Moseley and downright negative on Loux.
Jeremy: The Mariners have a pretty solid run prevention club. Felix Hernandez and Bedard make for an excellent front two, and the improved outfield defense will do wonders for the rest of the staff who have what you might call a strikeout problem. First step is admitting it, second is adding Endy Chavez and Franklin Gutierrez.
Sully: The Mariners will be a real case study in how much we know about defense metrics. Consensus seems to be that Jarrod Washburn and Carlos Silva in particular stand to improve. Let's see how it plays out.
BULLPEN
                 K/9    BB/9    WHIP    ERA
Fuentes, B.	9.69	3.41	1.22	3.30
Arredondo, J.	7.68	3.55	1.32	3.66
Shields, S.	8.62	3.61	1.30	3.61
                 K/9    BB/9    WHIP    ERA
Francisco, F.	9.82	4.10	1.31	3.59
Wilson, C.	8.07	4.30	1.43	4.37
Guardado, E.	6.32	3.27	1.43	4.61
                 K/9    BB/9    WHIP    ERA
Ziegler, B.	5.48	2.92	1.30	3.44
Springer, R.	7.69	3.06	1.19	3.19
Casilla, S.	8.19	3.78	1.37	3.94
                 K/9    BB/9    WHIP    ERA
Morrow, B.	9.42	4.88	1.37	3.76
Batista, M.	5.53	4.52	1.61	5.07
Aardsma, D.	8.83	5.02	1.50	4.46
Rich: There are a lot of question marks here. Joey Devine, whose 0.59 ERA in 2008 was the lowest ever for any pitcher with 40 or more innings pitched, will visit Dr. James Andrews next week and is likely to miss at least a few weeks of action, if not the entire season. His injury leaves the closer role in the hands of submariner Brad Ziegler, who set a record with 39 consecutive scoreless innings to start a major league career last summer. Meanwhile, the Angels will have to muddle through without Francisco Rodriguez, the Rangers will hand the ball to the unproven Frank Francisco in the ninth inning, and Brandon Morrow has decided he would rather close than start for the Mariners.
Jeremy: Parting to the bullpen is such a poor decision for Morrow. Why are the Mariners letting him choose his path? And the Angels’ pen won’t miss a beat without K-Rod.
Sully: In 12 appearances last September, hitters pounded Ziegler to the tune of a .362/.423/.617 line.
Bench
Rich: The Angels have an outstanding bench, led by Maicer Izturis and Gary Matthews and with Brandon Wood only a telephone call away.
Jeremy: Brandon Wood has to be better than Aybar, right? And Ramon Vazquez has to be better than Andrus, right? And a loaf of bread has to be better than Bettancourt, right? What’s going on at short?
Sully: Rich has a beat on this one. The Halos bench is the class of the AL West.
Do you foresee any surprises this season in the AL West?
Rich: If two or more of the Angels disabled starters fail to take the hill 20 times this season, then this division is up for grabs and the winner may be the first team to nab 81 victories.
Jeremy: The division is wide open, so any team could potentially surprise. But I feel like some teams will start to follow in the Rays’ footsteps, and not try to contend until ready. I think the Padres, Mariners, and Rangers, who all have progressive front offices best I can tell, will tank until they’re ready to compete. I don’t mean actually try to lose, but I mean they won’t actively try to make a run and make midseason trades so they can have a chance at third place (like the Astros did trading for Randy Wolf).
Sully: I'll take the Mariners to win more than 75 games, which would be a 14-game improvement off of their 2008 total.
Who are the awards candidates in the division?
Rich: MVP: Ken Griffey Jr. Oh wait, this is the 2009 Mariner version, not 1999.
CYA: Felix Hernandez is the best bet here. OK, the only bet.
ROY: Elvis Andrus is the only position player with any chance while Nick Adenhart, Brett Anderson, and Trevor Cahill are long shots as pitchers.
Jeremy:
MVP: Holliday
CYA: Hernandez
ROY: Anderson
Projected standings?
Rich:
1. Los Angeles Angels: The Halos certainly won't win 100 games again but could fall short of last year's 89 Pythag season and still win this weak, four-team division.
2. Oakland A's: If the young pitchers aren't up to the challenge and Beane trades Holliday in July, the A's could find themselves in the cellar come October.
3. Texas Rangers: At a projected win total of 72, I'm more inclined to bet the overs than the unders.
4. Seattle Mariners: The M's could finish in second place if everything goes right.
Jeremy:
Athletics: 87-75
Angels: 82-80
Rangers: 75-87
Mariners: 70-92
Sully:
1. Oakland Athletics - too many health questions in the Angels rotation. The default choice.
2. Los Angeles Angels - See above.
3. Seattle Mariners - outfield defense, healthier Bedard, better luck, more wins
4. Texas Rangers - The starting pitching is just awful.
| Around the Minors | April 02, 2009 |
The Rule 5 Draft: Day of Reckoning
Twenty-one players were chosen this past off-season as part of the annual Rule 5 draft. Of those selected, 16 were pitchers which obviously speaks to need for pitching depth at the Major League level. Unlike past years when "big" name players were chosen, like Dan Uggla and Josh Hamilton, no name stood out in the 2008 draft. That shows in the fact that only a few players are going to stick with the teams that chose to draft them this past December.
1. Terrell Young RHP | Washington from Cincinnati
No official decision has been announced with Young, but he's struggled with his command this spring with nine walks in as many innings. He has also allowed nine hits and six earned runs. The 23-year-old hurler is a former 10th-round selection out of high school by the Reds organization. He could stick with Washington because, well, look at the other options...
2. Reegie Corona INF | Seattle from New York (AL)
It's hard to know what Seattle is thinking sometimes. But with Ronny Cedeno and Chris Burke around, there probably isn't room for Corona. The young infielder started the spring off slowly, but has picked things up and is now hitting a respectable .281/.311/.386 in 57 at-bats.
3. Everth Cabrera SS | San Diego from Colorado
What a difference an organization makes. Cabrera, with a line of .262/.297/.344 with seven stolen bases in 61 at-bats will make the Padres' 25-man roster as the back-up infielder. The saddest thing is that starting shortstop Luis Rodriguez really isn't much better.
4. Donald Veal LHP | Pittsburgh from Chicago (NL)
Perhaps the biggest name in the draft, Veal is still under consideration to make the Pirates, although no decision has been made officially. The big left-hander has crazy numbers this spring after allowing just four hits in 13 innings... but he's also walked 13 batters. Sadly, those kind of numbers put him about fourth on the bullpen depth chart. It's going to be another long season in Pittsburgh.
5. Lou Palmisano C | Baltimore (to Houston) from Milwaukee
Palmisano was a bit of a strange pick given that he missed most of the 2008 season with injuries, and he did not have a very good spring. His fate was sealed when the Astros nabbed free agent Ivan Rodriguez at the last minute. Offered back to Milwaukee, his originally organization declined and he will remain in the Houston organization - but in the minors.
6. Luis Perdomo RHP | San Francisco from St. Louis
Perdomo threw up a stinker of a performance recently, but he still appears to have won a spot in the Giants' bullpen after impressing the manager with his 94 mph fastball and slider combination. His ERA recently jumped from the 4s to the 6s.
7. David Patton RHP | Cincinnati (to Chicago NL) from Colorado
The Cubs club is going to field a veteran-heavy team this year but Patton has an opportunity to head north with the club after a solid spring. He has allowed 10 hits and two walks in 12.1 innings. He has also struck out 15 batters without allowing a homer.
8. Kyle Bloom LHP | Detroit from Pittsburgh
Detroit barely has any prospects... or pitching for that matter... but Bloom still wasn't good enough to make the club. He had an 8.44 ERA in five games.
9. Jose Lugo LHP | Kansas City (to Seattle) from Minnesota
Lugo gave it a shot by posting a 2.45 ERA in 11 games, but the ERA was misleading. He allowed just three hits in 7.1 innings but struck out just one batter and did not overpower anyone. The Mariners don't have many quality left-handed bullpen options, so his return to the Twins speaks volumes.
10. Benjamin Copeland CF | Oakland from San Francisco
Copeland was drafted by the wrong organization. Oakland has a ton of outfield depth, although the outfielder has yet to be sent back to San Francisco. He injured his shoulder earlier this month so the A's could always stash him on the DL for awhile and see how things play out. He's hit just .182 in 22 spring at-bats.
11. James Skelton C | Arizona from Detroit
As mentioned earlier, the Tigers organization is hurting for prospects so it was surprising when the club left this young catcher unprotected for the draft. Arizona is not in desperate need for catching with Chris Snyder and Miguel Montero, but Skelton is athletic enough to play other positions on the field, which could help him make the club in April. He's hit just .150 in 40 at-bats after spending 2008 in High-A and Double-A.
Update: Skelton did not make the team, but the Diamondbacks worked out a deal today to keep the catcher's rights. Arizona sent pitcher Brooks Brown, a 2006 supplemental first round draft pick, to the Tigers.
12. Zachary Kroenke LHP | Florida from New York (AL)
Another pick out of the Yankees organization, Kroenke was sent back to his original club last week after barely registering a blip in camp with the Marlins. He's a former fifth-round pick out of the University of Nebraska.
13. Gilbert De La Vara LHP | Houston from Kansas City
De La Vara was recently returned to the Royals after allowing 14 hits and three walks in 9.2 innings for the Astros. The 24 year old has appeared in just 21 games above A-ball.
14. Jason Jones RHP | Minnesota from New York (AL)
The third pick out of the Yankees system, Jones failed to make the Twins but his rights were retained after the club sent pitching prospect Charles Nolte to New York. Jones had a 2.70 ERA but allowed 11 hits and three walks in 10 innings, so he was hardly dominant. If the Twins have one thing, it's pitching depth... so Jones may have been better off heading back to the Yankees.
15. Darren O'Day RHP | New York (NL) from Los Angeles (AL)
O'Day appears to have made the Mets. The right-hander has struck out just five batters in 13 innings, to go along with 12 hits allowed and three walks. He's lucky that the Mets' pen is not overly deep.
16. Eduardo Morlan RHP | Milwaukee from Tampa Bay
Morlan has always shown good stuff, but he has also always stumbled when trying to take that next step. He failed to close the deal as a member of the Brewers organization and was sent back to the Rays. Morlan was originally signed by the Twins and sent to Tampa Bay in the Delmon Young/Matt Garza deal.
17. Robert Mosebach RHP | Philadelphia from Los Angeles (AL)
Mosebach failed to make the reigning World Champions after allowing 15 hits and two walks in 7.2 innings of work.
18. Miguel Gonzalez RHP | Boston from Los Angeles (AL)
Gonzalez has battled elbow problems this spring so the Red Sox could stash him on the DL, if the organization wants to waste a roster spot on the 24-year-old reliever.
19. Derek Rodriguez RHP | Tampa Bay from Chicago (AL)
A 7.71 ERA with 12 hits and three walks allowed in 7.0 innings is not going to endear you to a new organization. Not surprisingly, Rodriguez was sent back to his old club.
20. Ivan Nova RHP | San Diego from New York (AL)
Nova never wowed anyone with his stuff, but he always managed to get results... until spring training 2009, that is. The right-hander posted an 8.31 ERA and allowed 13 hits and four walks in 8.2 innings of work. He struck out three batters and allowed as many home runs. He was sent back to New York.
21. Rocky Cherry RHP | New York (NL) from Baltimore
O'Day was able to make the Mets, but Cherry was not as lucky and he actually got released because he would have become a free agent anyway. He signed a minor league deal with the Red Sox. Cherry was the most experienced pitcher in the draft at the age of 29 and with 40 MLB games under his belt.
So there you have it. A lackluster Rule 5 draft ends up with about seven or eight players (33-38%) beginning the 2009 season with the club that acquired them in the Rule 5 draft.
| Change-Up | April 01, 2009 |
NL West Preview
Today, Rich, Jeremy and I preview the NL West. You can find past previews below:
AL Central
NL Central
AL East
NL East
The numbers presented are the averages of each of the projection systems featured on the Fangraphs player pages.
Let's get to it.
CATCHER
                AVG   OBP   SLG
Martin, R.     .284  .376  .430
Snyder, C.     .244  .340  .424
Iannetta, C.   .263  .370  .461
Molina, B.     .277  .310  .427
Hundley, N.    .235  .291  .398
Rich: Russell Martin's walk rate (14.0%) increased to a career high while his isolated power (.116) plunged to a new low. With manager Joe Torre promising to limit Martin, who faded once again down the stretch, to 140 games behind the plate, the 26-year-old catcher's counting stats are likely to flatten out but his rate stats may approach or exceed their best levels.
Jeremy: Strong group here overall. Martin has a unique set of skills for a catcher with his speed, but it still doesn't make sense to me why the Dodgers shift him to third on off days.
Sully: Chris Iannetta has a shot to be one of the better players in the National League. Although he had a great 2006 season with the bat splitting time at Double-A and Triple-A, he came through the Minors with a strong defensive reputation. Now it is his bat that is turning heads. I say he ends the year as the best catcher in the league not named Mauer or McCann.
FIRST BASE
                AVG   OBP   SLG
Loney, J.      .293  .348  .449
Tracy, C.      .274  .333  .436
Helton, T.     .291  .402  .458
Ishikawa, T.   .257  .325  .446
Gonzalez, A.   .281  .353  .497
Rich: Put Todd Helton in Petco Park and Adrian Gonzalez in Coors Field and their projections would look totally different. Make of it what you will but Travis Ishikawa has slugged six home runs in 76 plate appearances this spring.
Jeremy: James Loney took a big step back last year following a really promising 2007 .331/.381/.538 campaign. His power evaporated and he swung and missed much more often, but he’s certainly young enough to turn things around. And yes Rich, Gonzalez is a beast playing in unfriendly confines.
Sully: Chad Tracy is not a very good fielding first baseman and he has a career 102 OPS+. I know this roster-assembly thing is not easy but if you're a club with high aspirations, sheesh, can't you find someone in professional baseball who can offer you more than Tracy as a first base option?
SECOND BASE
                AVG   OBP   SLG
Hudson, O.     .279  .351  .414
Lopez, F.      .271  .342  .397
Barmes, C.     .265  .307  .406
Frandsen, J.   .275  .331  .397
Eckstein, D.   .273  .340  .350
Rich: Which Felipe Lopez did Arizona sign? The bum who "hit" .234/.305/.314 in 100 games with Washington or the hero who hit .385/.426/.538 in 43 games with St. Louis? While his 2009 rate stats will undoubtedly fall somewhere between these peaks and valleys, look for the eight-year veteran to benefit by hitting at the top of the lineup in Chase Field.
Jeremy: I’m realizing the Dodgers have quite a lineup. If a second baseman who projects to hit better than league average is your worst hitter, you’ve done well for yourself.
Sully: Good point on Orlando Hudson, Jeremy. He's the type of acquisition that might tip the balance of power in the NL West.
THIRD BASE
                AVG   OBP   SLG
Blake, C.      .264  .335  .441
Reynolds, M.   .258  .334  .478
Atkins, G.     .293  .355  .470
Sandoval, P.   .297  .329  .461
Kouzmanoff, K. .274  .324  .463
Rich: Did the Dodgers really sign Casey Blake, who turns 36 in August, to a three-year, $17.5M contract three months ago? Aside from the Raul Ibanez and Edgar Renteria signings, this one has to be one of the silliest of the off-season. But all is not lost, Dodger fans. Ned Colletti included a team option at $6M for 2012. You know, just in case.
Jeremy: Lot of free-swingers in this group. Pablo Sandoval swung at the highest percentage of pitches outside the strike zone of any player, by far. I wonder if he and Bengie Molina will push each other to see who can have the shortest at bats. Kevin Kouzmanoff has some pop that is sapped by PETCO, but you can’t blame his league worst strikeout to walk ratio on the ballpark. And we can’t forget that Mark Reynolds broke the single season strikeout record last year.
Sully: I think Garrett Atkins is one of the likelier bounce-back candidates in the division. He struggled in 2008, but he was very good in 2006 and 2007. Just 29, look for Atkins to return to form this season.
SHORTSTOP
                AVG   OBP   SLG
Furcal, R.     .284  .353  .411
Drew, S.       .274  .330  .453
Tulowitzki, T. .278  .348  .445
Renteria, E.   .284  .343  .406
Rodriquez, L.  .263  .324  .350
Rich: Fun stat comparison... In the second half last season, All-World shortstop Hanley Ramirez hit .282/.414/.495 while the brother of J.D. Drew hit .326/.372/.556.
Jeremy: I’m looking forward to watching Troy Tulowitzki play a full season. I think that he’s easily the Rockies’ best player.
Sully: Good one on Stephen Drew, Rich. That's something the projection systems can't capture. While it would be silly to ignore all of the past data, it's entirely possible that something clicked for Drew during the second half of 2008.
LEFT FIELD
                AVG   OBP   SLG
Ramirez, M.    .300  .397  .540
Jackson, C.    .291  .373  .452
Smith, S.      .283  .351  .452
Lewis, F.      .270  .346  .414
Headley, C.    .271  .347  .443
Rich: Seth Smith went 0-fer against lefthanders last season. Granted, the sample size was only 11 at-bats. But there is little in Smith's past to suggest that he can hit southpaws. To wit, the former second round draft pick has gone yard only four times in more than 500 plate appearances vs. lefties over the past four minor league seasons. Based on Smith's inability to hit LHB, I was surprised to learn that the Rockies sent Matt Murton (.311/.382/.484 career vs. LHP) to Triple-A on Monday.
Jeremy: Fred Lewis is one of my favorite players since he does so many things well—fielding, hitting, running. He could probably replicate Barry Bonds’ production if only Scott Boras were his agent.
Sully: If Chase Headley puts up those numbers this season while playing home games at Petco, that will make him a nice little corner outfielder - especially for the price. Not that anyone will notice, of course.
CENTER FIELD
                AVG   OBP   SLG
Kemp, M.       .299  .347  .478
Young, C.      .252  .321  .469
Spilborghs, R. .294  .369  .450
Rowand, A.     .275  .339  .430
Gerut, J.      .280  .344  .458
Rich: Aaron Rowand is the highest paid center fielder in the NL West by far and possibly the least productive offensively. So his value must be due to his defense, right? Well, his advanced defensive metrics (-7.3 UZR/150 games in 2008 and a fifth-worst -24 Plus/Minus over the 2006-2008 period) belie his reputation as a Gold Glove-caliber fielder. But do not despair Brian Sabean supporters. Rowand is "only" owed $12M per season for the next four years.
Jeremy: Matt Kemp and Chris Young are breakout candidates who could both join the 30-30 club if thing go their way. Meanwhile, Jody Gerut might be the best player of the group but certainly won’t be recognized as such.
Sully: It's not Ryan Spilborghs' bat that concerns me. It's that he is going to be asked to man full-time center field duties. He's wholly unqualified for half of his job.
RIGHT FIELD
                AVG   OBP   SLG
Ethier, A.     .294  .363  .475
Upton, J.      .260  .346  .456
Hawpe, B.      .278  .370  .490
Winn, R.       .284  .342  .415
Giles, B.      .280  .378  .429
Rich: While Manny was being the Dodger Manny and hitting .396/.489/.743, teammate Andre Ethier was putting up a .368/.448/.649 line over the same period. Just sayin'.
Jeremy: Similar to the situation in center field, Ethier and Justin Upton will steal the headlines while the perpetually underrated Randy Winn and Brian Giles sneak under the radar. Each one of these teams has a really solid outfield, but the Dodgers have something special.
Sully: You summed up this group well, Jeremy. They're all pretty nice players.
STARTING PITCHING
                 K/9    BB/9    WHIP    ERA
Kuroda, H.      5.84    2.39    1.29    3.93
Billingsley, C. 8.69    3.66    1.32    3.57
Kershaw, C.     7.76    4.05    1.41    4.17
Wolf, R.        7.53    3.51    1.41    4.47
McDonald, J.    6.97    3.58    1.39    4.67
                 K/9    BB/9    WHIP    ERA
Webb, B.        7.23    2.66    1.24    3.37
Haren, D.       8.08    2.00    1.19    3.59
Davis, D.       6.77    4.11    1.54    4.67
Garland, J.     4.58    2.64    1.45    4.73
Scherzer, M.    9.10    3.78    1.32    3.74
                 K/9    BB/9    WHIP    ERA
Cook, A.        4.01    2.40    1.42    4.40
Jimenez, U.     7.69    4.71    1.48    4.31
Marquis, J.     4.82    3.68    1.51    4.93
De La Rosa, J.  7.78    4.24    1.52    4.96
Morales, F.     6.04    5.36    1.62    5.12
                 K/9    BB/9    WHIP    ERA
Lincecum, T.   10.00    3.53    1.22    3.13
Cain, M.        7.85    3.67    1.31    3.66
Johnson, R.     8.58    2.47    1.25    3.98
Zito, B.        6.39    4.31    1.46    4.38
Sanchez, J.     8.87    4.30    1.42    4.21
                 K/9    BB/9    WHIP    ERA
Peavy, J.       9.05    2.89    1.18    3.25
Young, C.       8.06    3.80    1.27    3.71
Baek, C.        6.06    2.76    1.36    4.43
Correia, K.     6.80    3.62    1.42    4.27
Hill, S.        5.50    2.69    1.41    4.34
Rich: There are a number of good, young arms in this division. While San Francisco may not quite match up at the top with Arizona's Brandon Webb and Danny Haren, the starting rotation is every bit as good as its offense is bad. It goes five deep. And there's no mistaken who the No. 5 guy is. Just ask him.
Jeremy: The Giants have the best rotation in the division. It seems like a really odd decision for the Diamondbacks to have opted for Jon Garland over Randy Johnson. Ubaldo Jimenez has huge upside, flashing similar stuff to Felix Hernandez. They both use the standard four pitch repertoire and are the two hardest throwing starters in the Majors, as their fastballs average 95 miles per hour. But I don’t know if anything messes up a young pitcher worse than Coors field. Maybe Dusty Baker. Maybe.
Sully: If Arizona wants to compete for this division, they would be well served to stretch out Max Scherzer as soon as possible. Doug Davis, Garland and then four or five innings of Scherzer will not cut it for a championship caliber back-end of a rotation; even one that features Haren and Webb at the front.
BULLPEN
                 K/9    BB/9    WHIP    ERA
Broxton, J.    10.84    3.31    1.18    3.02
Mota, G.        7.67    3.73    1.40    4.36
Kuo, H.        10.40    3.29    1.22    3.24
                 K/9    BB/9    WHIP    ERA
Qualls, C       7.51    2.76    1.27    3.66
Rauch, J.       7.75    2.69    1.26    3.90
Pena, T.        6.63    2.63    1.27    3.77
                 K/9    BB/9    WHIP    ERA
Corpas, M.      6.55    2.57    1.31    3.80
Street, H.      9.16    2.81    1.19    3.45
Buchholz, T.    7.03    2.63    1.27    3.81
                 K/9    BB/9    WHIP    ERA
Wilson, B.      8.38    4.33    1.40    3.87
Howry, B.       7.20    2.26    1.28    3.98
Affeldt, J.     7.52    3.65    1.37    3.85
                 K/9    BB/9    WHIP    ERA
Bell, H.        8.86    3.10    1.23    3.25
Meredith, C.    6.54    2.53    1.31    3.72
Britton, C.     6.96    3.15    1.33    3.92
Rich: Who will close in Colorado? Manny Corpas or Houston Street? The odd man out may find himself on the trading block come July, especially if the Rockies appear to have little or no chance to make the playoffs.
Jeremy: Outstanding bullpens all around. Bob Howry had a 4.5 strikeout-to-walk ratio and managed a 5.35 ERA last year. How is that possible? Guillermo Mota and Chris Britton are the only names I see here that I don’t like.
Sully: Given the pitcher he has become, can you blame Heath Bell for expressing frustration with Mets pitching coach Rick Peterson?
BENCH
Rich: Ian Stewart, Jeff Baker, and whomever is replaced by Dexter Fowler in the outfield give Colorado a potent bench. Did I mention Juan Pierre? The Dodgers are on the hook for $28.5M over the next three years. But, get this, ol' Juanderful isn't even the highest-paid backup left fielder in the division. That distinction goes to Eric Byrnes, who will be paid $11M in each of the next two seasons. Wonderful.
Jeremy: Byrnes does make for a very good (if expensive) fourth outfielder. The Rockies now have a surplus of outfielders after taking on Matt Murton and Carlos Gonzalez from the As, not to mention Fowler waiting in reserve.
Sully: I agree with Rich, here. Colorado's bench is the strongest in the NL West.
Who are the awards candidates from the NL West?
Rich: MVP: Manny. No, not Corpas. Nice try.
Cy Young: The West has produced the last three NL Cy Young award winners: Webb in 2006, Peavy in 2007, and Lincecum in 2008. Let's make it four different pitchers in four years and give it to Haren in 2009.
Rookie of the Year: If it's not Fowler, the Rookie of the Year will not be coming from this division.
Jeremy: MVP: If Manny Ramirez does anything, the BBWAA will try to award him the MVP twice.
CYA: Lincecum
ROY: Fowler
Sully: Manny has almost no competition at all for the best player in the NL West. It's a stretch but not inconceivable to me that Iannetta breaks out and becomes a top-10 MVP type player.
You could pull any NL West starting pitcher's name out of a hat and have a decent chance of picking the winner. Between the past winners and the budding stars, what a great division for those who appreciate the art of pitching.
Unfortunately for the kid, I think Spilborghs will hit too well to make room for Fowler.
Any surprises this year?
Rich: San Diego Padres manager Bud Black doesn't lose his sanity.
Jeremy: The Giants could make a run at the division if they were to acquire another bat. They have prospects to spare. And someone in that Diamondbacks outfield will hit 30 homers.
Sully: Call me crazy, but I don't hate the Padres as much as some do. With Peavy and Chris Young healthy, I think they improve off of last season's win total by at least seven games.
Predictions?
Rich:
1. Arizona Diamondbacks: Youth, talent, and balance.
2. Los Angeles Dodgers: Will battle the Snakes for first place all season long.
3. San Francisco Giants: Won't finish first or fifth.
4. Colorado Rockies: Hey, I didn't trade Matt Holliday.
5. San Diego Padres: I've got the unders on Baseball Prospectus' 74-win projection.
Jeremy:
Los Angeles Dodgers: 87-75
Arizona Diamondbacks: 84-78
San Fransisco Giants: 81-81
Colorado Rockies: 78-84
San Diego Padres: 66-96
Sully:
Los Angeles by five games or so.
San Francisco
Arizona
San Diego
Colorado
==========
We will be concluding this series with the AL West on Friday.