Rich Lederer • Baseball Beat
Patrick Sullivan • Change-Up
Jeremy Greenhouse • Touching Bases
Dave Allen • F/X Visualizations
Sky Andrecheck • Behind the Scoreboard
Marc Hulet • Around the Minors
Al Doyle • Past Times
Retired Uniforms:
Bryan Smith • WTNY
Joe Sheehan • Command Post
Jeff Albert • The Batter's Eye
RSS Feed
Home
*Examining the Past, Present, and Future*
Lineup Card
Recent Entries
» Putting Together a Reality Team
» Historical Hall of Fame Vote Comparisons: 2012
» An All-Christmas Team
» The New-Look Angels
» John Denny: The Forgotten Cy Young Award Winner
» Money Isn't Everything
» What Would It Take to Hit .400 in the 21st Century?
» Halos Heaven
» Brandon McCarthy's Breakout Season
» Link-o-Rama
» Historical Hall of Fame Vote Comparisons: 2012
» An All-Christmas Team
» The New-Look Angels
» John Denny: The Forgotten Cy Young Award Winner
» Money Isn't Everything
» What Would It Take to Hit .400 in the 21st Century?
» Halos Heaven
» Brandon McCarthy's Breakout Season
» Link-o-Rama
Best of Baseball Beat
Abstracts From the Abstracts
1977 Baseball Abstract
1978 Baseball Abstract
1979 Baseball Abstract
1980 Baseball Abstract
1981 Baseball Abstract
1982 Baseball Abstract
1983 Baseball Abstract
1984 Baseball Abstract
1985 Baseball Abstract
1986 Baseball Abstract
1987 Baseball Abstract
1988 Baseball Abstract
1978 Baseball Abstract
1979 Baseball Abstract
1980 Baseball Abstract
1981 Baseball Abstract
1982 Baseball Abstract
1983 Baseball Abstract
1984 Baseball Abstract
1985 Baseball Abstract
1986 Baseball Abstract
1987 Baseball Abstract
1988 Baseball Abstract
Bert Blyleven Series
Meeting Up and Hanging Out with Bert
The Results Are In And...
Aficionado Heavily Invested in Blyleven
Latest on Blyleven's Chances for the HOF
The Internet Zealot Responds
400 Down and 5 to Go...
Bert Be Home By Eleven?
Blyleven's Forgotten Season (1973)
HeyMan, Your Comments Don't Hold Water
The Waiting is the Hardest Part
Another Addition to the Blyleven Series
Search for the Truth
As Dominant as His HOF Contemporaries
Listen, Buster
A Larger Step for Blyleven
Answering the Naysayers (Part Two)
Another Small Step for Blyleven
Q&A: Blyleven on the Twins
The Majority Rules, Right?
It's All Dutch to Some
The Hall of Fame Case for Bert Blyleven
Q&A: Blyleven on Felix Hernandez
Clemens Rocketing Up Charts
Poz: An Interview With a KC Star
A HOF Chat with Tracy Ringolsby
Up Close and Personal
A Peek Into the Mind of a HOF Voter
Answering the Naysayers
It's That Time of the Year (Again)
"If Cooperstown is Calling..."
The Bert Alert
One Small Step for Blyleven...
Only the Lonely
Exclusive Interviews
Lee Sinins
Alex Belth
David Pinto
Will Carroll
Mike Carminati
Aaron Gleeman
Joe Sheehan
Jay Jaffe
Jeff Peek
Tracy Ringolsby
Joe Posnanski
Bill James Part I, II, III
Jon Lalonde
Chuck Tiffany
Dayn Perry
Fay Vincent
Nate Silver
Alex Belth
David Pinto
Will Carroll
Mike Carminati
Aaron Gleeman
Joe Sheehan
Jay Jaffe
Jeff Peek
Tracy Ringolsby
Joe Posnanski
Bill James Part I, II, III
Jon Lalonde
Chuck Tiffany
Dayn Perry
Fay Vincent
Nate Silver
Bullpen
Rich Lederer
The Odd Couple (with Alex Belth)
The MostUnder Over Underrated Player in Baseball (with Brian Gunn)
Three Wise Men (roundtable by Alex Belth)
Infrequently Asked Questions (interview with Matt Welch)
Interview (Orioles Think Tank)
Bernie and the Yanks (Bronx Banter)
Hope and Faith: How the LAA Win the World Series (Baseball Prospectus)
NL West (The Soul of Baseball)
Greatest Living Hitter? (Sports Illustrated)
Roundtable: 2008 HOF Ballot (Armchair GM)
The Most
Three Wise Men (roundtable by Alex Belth)
Infrequently Asked Questions (interview with Matt Welch)
Interview (Orioles Think Tank)
Bernie and the Yanks (Bronx Banter)
Hope and Faith: How the LAA Win the World Series (Baseball Prospectus)
NL West (The Soul of Baseball)
Greatest Living Hitter? (Sports Illustrated)
Roundtable: 2008 HOF Ballot (Armchair GM)
Patrick Sullivan
Designated Hitters
David Bromberg (Q&A: John Denny)
Mark Armour (H. Killebrew and Versatility)
Joe Lederer (Soundtrack of a Prospect)
David Bromberg (Clemente's Autograph)
David Bromberg (Woody Fryman)
D. Baumstein (WAR Against Age: Pitchers)
Doug Baumstein (The WAR Against Age)
Doug Baumstein (A Lifetime on the Road)
John Fraser (Pick Six)
Mark Armour (How to Score More Runs?)
Bill Parker (What Opening Day Tells Us)
Stan Opdyke (Pat Rispole)
Chris Jaffe (Evaluating Baseball's Mgrs)
Stan Opdyke (Baseball Radio in NYC, 1953)
A. Nathan (Performance of Baseball Bats)
Michael Weddell (Edgar Martinez/HOF)
Jon Weisman (100 Things Dodgers Fans...)
Stan Opdyke (Connie Mack and Vin Scully)
Eric Walker (Evaluating Run Production)
Brent Mayne (The Intangibles of Catching)
Chris Moore (Best Fastballs in Baseball)
Dave Baldwin (The Batter’s Brain)
Shawn Haviland (Ivy League to MLB)
Larry Granillo (Walking Off)
Rob Iracane (Solo HR Won't Break You)
Tommy Bennett (Charm of AM Radio)
Harry Pavlidis (Johan Santana's Fast Start)
John Walsh (WAR and Remembrance)
Eric Walker (Precisely Inaccurate)
Bob Timmermann (As They See 'Em)
Geoff Young (Unicycles and Delusions)
Baseball Analysis at Tufts (Groundballers)
Baseball Analysis at Tufts (GB Out Rates)
G. Rybarczyk ('09 Hit Tracker Projections)
Joe Lederer (Curt Schilling/HoF)
Conor Gallagher (Hall of Fallacies)
Chris Green (Jim Rice, HoF, the Numbers)
Shawn Hoffman (Baseball's Bear Mkt?)
Paul Anthony (Manny Syndrome)
Ross Roley (World Series Odds)
B. Timmermann (Catcher's Interference)
R.J. Anderson (Waiting the Hardest Part)
Maury Brown (Cubs, MLB, and Cuban...)
Myron Logan (Dee-Fense, Dee-Fense)
Craig Calcaterra (Frivolity, Part I, Part II)
Chad Finn (Ode to Baseball Cards)
David Cameron (Mariners Foibles)
Chris Dial (Chipper Jones)
Pat Lederer (Memory Lane)
David Appelman (Clutch Pitching)
Bob Rittner (DH)
Jonathan Mayo (Roger Clemens)
Lisa Winston (My Son-in-Law...)
Russ McQueen (The Yellow Hammer)
Bob Rittner (I'm OK, You're OK)
Mark Armour (In Defense of the HOF)
Pat Jordan (Friends)
Dan Levitt (Analysis of Terry Ryan)
Doug Baumstein (Trading Econ 101)
Ross Roley (Runner's Reluctance II)
Ross Roley (Runner's Reluctance I)
Mark Armour (No-Longer Lovable Sox)
Bruce Regal (Stealthy and Wise)
Brian Gunn (Roid Monster)
Current/McEvoy (Value of the SB)
John Rickert (Sinister Thefts)
Nate Silver (Sabermetrics)
David Vincent (Home Run Production)
Joe P. Sheehan (Enhanced Gameday II)
Mark Armour (An Ode to Sport)
David Gassko (All-Time Worm Burners)
Joe P. Sheehan (Enhanced Gameday)
John Walsh (When Titans Clash)
Fox/Williams (Quantifying Coaches II)
Fox/Williams (Quantifying Coaches I)
Jacob Luft (Bull Durham Rant)
Chad Finn (Strat-O-Matic)
Lisa Winston (Rotisserie Baseball)
Dave Studeman (Baseball Stats)
Steve Treder (Roger Craig)
Marc Normandin (Jeff Bagwell)
D. Appelman (Expanding Strike Zone)
Jeff Sackmann (Worst MiL Defenders)
Jeff Sackmann (Best MiL Defenders)
Maxwell Kates (Van Lingle Mungo)
David Appelman (Pitch Location)
Kent Bonham (Danny Ray Herrera)
Glenn Stout (Two Baseball Poems)
Bruce Regal (The Challenge Round)
Mark Lamster (Barry & Ty)
Geoff Young (NL West)
Tom Lederer (The Ryan Express)
Brian Erts (Great Leap Forward)
David Pinto (Parity and the N.L.)
Jacob Luft (Fathers and Daughters)
Jamey Newberg (Pete's Sake)
Jeff Albert (A. Jones Swing Analysis)
Jeff Albert (A-Rod Swing Analysis)
Keith Law (Death, Taxes, and Waivers)
Peter Abraham (Tales of Torre Tales)
Larry Borowsky (Let 'er Rip II)
Dan Levitt (Empirical Analysis of Bunting)
Jonah Keri (If I Met Warren Cromartie...)
Bob Klapisch (War Stories)
Bob Timmermann (John F. Kennedy HS)
Kent Bonham (Aluminum Adjustments)
Al Doyle (More Than Superstars)
Ross Roley (Instant Replay)
David Vincent (Barry Bonds Homers)
Chad Finn (Our Favorite Obscurities)
Bill Deane (1979 NL MVP)
Mark Armour (Rise/Fall of Artificial Turf)
Jeff Angus (Wally Moon Camp)
David Berri (Money and Baseball)
Larry Borowsky (Baseball w/o the #s)
Derek Zumsteg (The Irrational Market)
David Regan (Free Agent Contracts)
Peter Schmuck (Steroids and the HOF)
David Appelman (Pitchers, Pitch by Pitch)
Dan Fox (Swinging, Taking, Fouling, Etc)
Patrick Sullivan (Study of NYY CF/BOS LF)
Will Leitch (Baseball Journalism)
Jeff Sullivan (Pitcher Release Points)
Steve Treder ('69-'70 Giants)
Maury Brown (Charlie Finley)
John Brattain (Bob Johnson)
Bob Klapisch (The Case for Bert Blyleven)
Jeff Peek (Pride and Prejudice)
Dayn Perry (Bert and Warren)
Rob Neyer (If Don Sutton Was Great...)
Lisa Winston (Minor League Memories)
Alex Belth (Otis Redding Was Right)
David Cameron (Long Live the King)
Jeff Angus (Baserunning Study)
Bert Blyleven (Baseball Playoffs)
Boyd Nation (Not a Prospect List)
James Click (Batters-Baserunners Study)
Jeff Shaw (Why I Love Baseball)
David Gassko (BIP/BFP Fielding Study)
Jay Jaffe (Milwaukee Sausage Race)
Jamey Newberg (Remember When)
Bob Klapisch (Press Box to the Mound)
Dan Levitt (Predictive Value of BB)
David Vincent (Official Scorer)
Jon Weisman (Rick Monday)
Larry Borowsky (Let 'er Rip)
Will Carroll (Fictional Short Story)
Bob Timmermann (Japanese Baseball)
Cyril Morong (Best Pitching Seasons)
Sean Forman (Monte Carlo Win-Loss)
Brian Gunn (My Little Blue Book)
Joe Lederer (My Dad and Baseball)
Bill Deane (Bob Gibson, 1968)
Mark Armour (1977 Yankees)
Darren Viola (Retrosheet)
David Pinto (RFK)
Dayn Perry (Brave Heart)
Matt Welch (Dave Hansen)
Kevin Kernan (Jack McKeon)
Tom Lederer (Dodgers Road Trip)
Steve Lombardi (Slider)
Studes (Picturing Baseball)
Mike Carminati (Luck of the Drawl)
Eric Neel (Vin Scully)
J.C. Bradbury (Leo Mazzone)
John Sickels (Bill James)
Search Baseball Analysts
Archives
By Category:
Around the Majors Content Only
Around the Minors Content Only
Baseball Beat Content Only
Baseball Beat/Change-Up Content Only
Baseball Beat/WTNY Content Only
Behind the Scoreboard Content Only
Change-Up Content Only
Change-Up/Around the Majors Content Only
Command Post Content Only
Crunching the Numbers Content Only
Designated Hitter Content Only
F/X Visualizations Content Only
Past Times Content Only
Saber Talk Content Only
The Batter's Eye Content Only
Touching Bases Content Only
Weekend Blog Content Only
WTNY Content Only
By Month:
February 2012
January 2012
December 2011
October 2011
September 2011
August 2011
July 2011
June 2011
May 2011
April 2011
March 2011
February 2011
January 2011
December 2010
November 2010
October 2010
September 2010
August 2010
July 2010
June 2010
May 2010
April 2010
March 2010
February 2010
January 2010
December 2009
November 2009
October 2009
September 2009
August 2009
July 2009
June 2009
May 2009
April 2009
March 2009
February 2009
January 2009
December 2008
November 2008
October 2008
September 2008
August 2008
July 2008
June 2008
May 2008
April 2008
March 2008
February 2008
January 2008
December 2007
November 2007
October 2007
September 2007
August 2007
July 2007
June 2007
May 2007
April 2007
March 2007
February 2007
January 2007
December 2006
November 2006
October 2006
September 2006
August 2006
July 2006
June 2006
May 2006
April 2006
March 2006
February 2006
January 2006
December 2005
November 2005
October 2005
September 2005
August 2005
July 2005
June 2005
May 2005
April 2005
March 2005
February 2005
January 2005
December 2004
November 2004
October 2004
September 2004
August 2004
July 2004
June 2004
May 2004
April 2004
March 2004
February 2004
January 2004
December 2003
November 2003
October 2003
September 2003
August 2003
July 2003
June 2003
Reference
Organizational Stats
Arizona Diamondbacks Bat / Pitch
Atlanta Braves Bat / Pitch
Baltimore Orioles Bat / Pitch
Boston Red Sox Bat / Pitch
Chicago Cubs Bat / Pitch
Chicago White Sox Bat / Pitch
Cincinnati Reds Bat / Pitch
Cleveland Indians Bat / Pitch
Colorado Rockies Bat / Pitch
Detroit Tigers Bat / Pitch
Florida Marlins Bat / Pitch
Houston Astros Bat / Pitch
Kansas City Royals Bat / Pitch
Los Angeles Angels Bat / Pitch
Los Angeles Dodgers Bat / Pitch
Milwaukee Brewers Bat / Pitch
Minnesota Twins Bat / Pitch
New York Mets Bat / Pitch
New York Yankees Bat / Pitch
Oakland Athletics Bat / Pitch
Philadelphia Phillies Bat / Pitch
Pittsburgh Pirates Bat / Pitch
St. Louis Cardinals Bat / Pitch
San Diego Padres Bat / Pitch
San Francisco Giants Bat / Pitch
Seattle Mariners Bat / Pitch
Tampa Bay Devil Rays Bat / Pitch
Texas Rangers Bat / Pitch
Toronto Blue Jays Bat / Pitch
Washington Nationals Bat / Pitch
All-Star Links
Official Websites
News and Notes
Baseball News Blog
Baseball Newstand
ESPN Baseball
Fox Sports Baseball
Pro Sports Daily
Roto World
The Roto Times
USA Today Baseball
Baseball Newstand
ESPN Baseball
Fox Sports Baseball
Pro Sports Daily
Roto World
The Roto Times
USA Today Baseball
Reference and Analysis
Baseball Almanac
Baseball America
Baseball Archive
Baseball Contracts
Baseball Cube
Baseball Graphs
Baseball Library
Baseball Musings Player Database
Baseball Page
Baseball Primer
Baseball Prospectus
Baseball Reference
Baseball Statistics
Baseball Truth
Boxscore Central
Diamond Mind Baseball
Doug's Stats
FanGraphs
Fast Balls (pitchfx catalog)
Hardball Dollars
Hardball Times
Hit Tracker
Retrosheet
Rotobase/Rotoblog
Stat Corner
STATS
Tango on Baseball
Yahoo Sports MLB
Web Gems
Bill James Primer
Sabermetric Manifesto (Grabiner)
Pitching and Defense (McCracken)
Pitching and Defense (Tippett)
Transactions Primer (Neyer)
Baseball Stats (Batter's Box)
Prospect Report (Cameron)
Pitcher Workloads (Sheehan)
Goodbye to Old Baseball Ideas (Rickey)
Sabermetric Manifesto (Grabiner)
Pitching and Defense (McCracken)
Pitching and Defense (Tippett)
Transactions Primer (Neyer)
Baseball Stats (Batter's Box)
Prospect Report (Cameron)
Pitcher Workloads (Sheehan)
Goodbye to Old Baseball Ideas (Rickey)
Columnists
Baseball Blogs
Around the Majors
Athletics Nation
Baseball Crank
Baseball Musings
Baseball-Reference Blog
Batter's Box
Big League Stew
Bronx Banter
Catfish Stew
Cub Town
Dan Agonistes
Dodger Thoughts
DRays Bay
Ducksnorts
Futility Infielder
Halos Heaven
Inside the Rockies
It Might Be Dangerous
Knuckle Curve
LoHud Yankees Blog
Lookout Landing
Management by Baseball
Metaforian
Metsgeek
Mike's Baseball Rants
Only Baseball Matters
Redbird Nation
Red Reporter
Sabernomics (Braves)
Seth Speaks
ShysterBall
6-4-2 (Angels/Dodgers)
The Book
TheCubdom
The Cutting Edge
The House That Dewey Built
The View From The Bleachers
Tiger Blog
U.S.S. Mariner
Viva El Birdos
Where's Kernan
Minor Leagues
Arizona Fall League
BA Player Finder
Cal Leaguers
Jamey Newberg
JDM's Scoresheet Baseball
Minor League Baseball
Minor League Park Factors
Minor League Splits
No Pepper
Sickels' Minor League Ball
Warm October Nights
BA Player Finder
Cal Leaguers
Jamey Newberg
JDM's Scoresheet Baseball
Minor League Baseball
Minor League Park Factors
Minor League Splits
No Pepper
Sickels' Minor League Ball
Warm October Nights
Amateur
Boyd's World (College)
Cape Cod Baseball League
College Baseball Blog
College Baseball Insider
Collegiate Baseball Newspaper
College Splits
College Splits Blog
Dirtbags Baseball (Long Beach State)
NCAA Baseball
NCBWA
Team One Baseball (High School)
Texas A&M & Baseball
Cape Cod Baseball League
College Baseball Blog
College Baseball Insider
Collegiate Baseball Newspaper
College Splits
College Splits Blog
Dirtbags Baseball (Long Beach State)
NCAA Baseball
NCBWA
Team One Baseball (High School)
Texas A&M & Baseball
Historical
Cuban Baseball
House of David
Jim "Mudcat" Grant's Web Page
Negro League Baseball Players Assoc
Negro Leagues Baseball Museum
1919 Black Sox
Pacific Coast League
Philadelphia Athletics Historical Society
Shoeless Joe Jackson Society
SABR-L Archives
Walter O'Malley
House of David
Jim "Mudcat" Grant's Web Page
Negro League Baseball Players Assoc
Negro Leagues Baseball Museum
1919 Black Sox
Pacific Coast League
Philadelphia Athletics Historical Society
Shoeless Joe Jackson Society
SABR-L Archives
Walter O'Malley
Miscellaneous
Forums
Credits
Ticket Center
Tickets to Baseball -
Premium Red Sox Tickets - Tickets to Marlins Games - Cardinals Game Tickets - NY Yankee Tickets - Tickets Oakland Athletics - Dallas Cowboys Tickets - Arizona Cardinals Tickets - Tickets Seattle Seahawks - Buffalo Bills Tickets Online - Tickets to Dolphins Football
Buy Boston Red Sox tickets,
Philadelphia Phillies tix,
NY Yankees tickets,
NY Mets tickets, and
MLB All Star game tickets at ABC tickets
Not sure where to find the best online sportsbooks? Start your search with PlayersJet.
Get deals at SportsMemorabilia.com on baseball apparel, including Phillies jerseys and more for adults and children.
Shop the largest selection baseball equipment on sale at Sports Unlimited. Check out tons of baseball gloves, youth baseball gloves and catchers gear from Rawlings, Wilson, Nike & Under Armour.
2011 Draft Order
Courtesy of Baseball America
First-Round:
 1. Pirates (57-105)
 2. Mariners (61-101)
 3. Diamondbacks (65-97)
 4. Orioles (66-96)
 5. Royals (67-95)
 6. Nationals (69-93)
 7. Diamondbacks (for B. Loux)
 8. Indians (69-93)
 9. Cubs (75-87)
10. Padres (for Karsten Whitson)
11. Astros (76-86)
12. Brewers (77-85)
13. Mets (79-83)
14. Marlins (80-82)
15. Brewers (for Dylan Covey)
16. Dodgers (80-82)
17. Angels (80-82)
18. Athletics (81-81)
19. Red Sox (from DET for Martinez)
20. Rockies (83-79)
21. Blue Jays (85-77)
22. Cardinals (86-76)
23. Nationals (from CWS for Dunn)
24. Rays (from BOS for Crawford)
25. Padres (90-72)
26. Red Sox (from TEX for Beltre)
27. Reds (91-71)
28. Braves (91-71)
29. Giants (92-70)
30. Twins (94-68)
31. Rays (from NYY for Soriano)
32. Rays (96-66)
33. Rangers (from PHI for Lee)
Supplemental First Round:
34. Nationals (Dunn)
35. Blue Jays (Downs)
36. Red Sox (Martinez)
37. Rangers (Lee)
38. Rays (Crawford)
39. Phillies (Werth)
40. Red Sox (Beltre)
41. Rays (Soriano)
42. Rays (Balfour)
43. Diamondbacks (LaRoche)
44. Mets (Feliciano)
45. Rockies (Dotel)
46. Blue Jays (Buck)
47. White Sox (Putz)
48. Padres (Garland)
49. Giants (Uribe)
50. Twins (Hudson)
51. Yankees (Vazquez)
52. Rays (Benoit)
53. Blue Jays (Olivo)
54. Padres (Torrealba)
55. Twins (Crain)
56. Rays (Choate)
57. Blue Jays (Gregg)
58. Padres (Correia)
59. Rays (Hawpe)
| Touching Bases | January 28, 2010 |
On the Out Pitch
Tim Lincecum retired 89% of batters he got to 0-2 or 1-2 counts. They had no chance. Here's how Lincecum's pitch selection breaks down on 0-2 and 1-2 counts, and the results of each pitch type.
| FB | CH | SL | CB | |
|---|---|---|---|---|
| Usage | 43% | 31% | 20% | 6% |
| Ball | 36% | 36% | 39% | 31% |
| Out | 32% | 43% | 46% | 51% |
| Hit | 7% | 4% | 4% | 1% |
| RV100 | 0.3 | -4.6 | -5.4 | -7.8 |
I'm grouping his four-seam and two-seam fastball. When I split the two, I find his two-seamer is much more effective than his four-seamer, but still not even as valuable as his off-speed offerings. I mean his changeup and slider are true out pitches. In fact, his change might be the best out pitch in baseball. You probably already know that. Yet his fastball on these counts is merely average. Would he be better off sacrificing some of the effectiveness from his changeup in exchange for some added effectivenss on his fastball? Theoretically, yes, this would be the right move, and theoretically, he could do this by throwing his changeup so often that batters come to expect it, and at the same time throwing his fastball so rarely that it acts like an out pitch, in that batters are fooled by it.
Yet for some reason, whenever I look at a pitcher's different pitch type run values, I notice disparities. Check out the A's duo of Brett Anderson and Mike Wuertz, who possibly possess the two best sliders in the game. Apparently, their fastballs suffer in spite of their extraordinary sliders. My guess is that they use their sliders as out pitches, so I wanted to see if there's a trend among pitchers to have a disparity in value between their out pitch and their fastballs. This type of analysis could, and probably should, be done for all counts, but I've been intrigued by the theory of the out pitch, so I'm limiting my sample to only pitches on 0-2 and 1-2 counts.
For the sake of simplicity, I'm grouping all fastballs together (four-seam, two-seam, cutter), and all off-speed pitches together (curve, slider, change, splitter, knuckler). So, in the following plot each pitcher represents a data point (minimum 200 pitches, Mo excluded), and the color of each dot represents how often a pitcher throws his fastball.
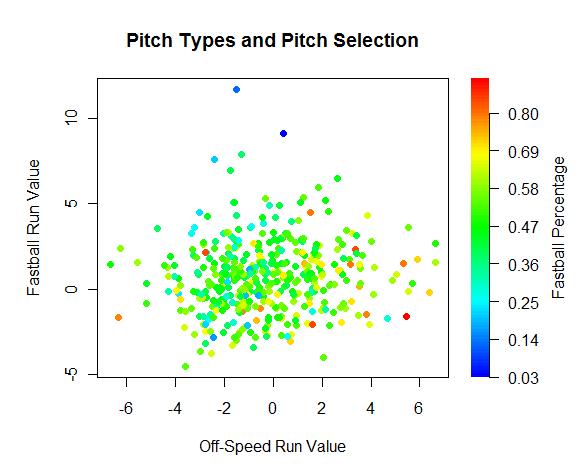
There appears to be a slightly positive trend line heading in the direction we would expect. Pitchers who extract value from one pitch type tend to get some value out of their other pitch types. Also, I see more yellow and red points on the right side and more blue points on the left side, meaning pitchers who throw more off-speed pitches have had better success with them than pitchers who throw fewer off-speed pitches.
Given that the average run value is defined as zero, 59% of pitchers perform at an above average rate with their off-speed offerings, while only 38% are above average with their fastballs. There are two and a half times more pitchers who have above average off-speed pitches and below average fastballs than pitchers who have below average off-speed pitches and above average fastballs.
As for correlation coefficients, which are on a scale of -1 to 1 with 1 representing a strong positive relationship, -1 representing a strong negative relationship, and 0 representing little or no correlation, I found that there is a weak correlation of .09 between fastball and off-speed run values. In addition, there is a correlation of -.25 between pitch type run value and pitch type frequency. Again, all of these data suggest that pitchers are not throwing their best pitches often enough in out pitch situations.
Returning to the above graph, one interesting note I made is that the two bluest points also show up as the two highest points on the graph. This means that the two pitchers who have the lowest fastball percentage have also had the poorest fastball results. Want to take a guess at the names behind the data points?
Well, it turns out knuckleballers should stick to the knuckleball. R.A. Dickey and Tim Wakefield aren't fooling anybody by trying to sneak a fastball in there. Wake's thrown 34 fastballs in 0-2/1-2 counts, and he's generated nine outs compared to six hits. That's abysmal. Dickey is just as bad, with 14 outs against nine hits. They're doing batters a favor by throwing fastballs.
There seems to be a stigma to pitching backwards, but if your out pitch is your best pitch, and you can throw it for strikes and it doesn't add stress on your arm, then you should consider turning your fastball into a secondary pitch, making it a potential out pitch as well
Pitch type run values don't tell the whole story. It's important to look at what happens in the entire at-bat, not just the one pitch. For example, it's possible that pitchers are throwing fastballs outside the strike zone to set up breaking balls as their out pitch. So they're intentionally lowering the value of their fastballs, and therefore are getting better overall results when they throw the fastball even though the fastball doesn't get the glory in the run value column. However, the conclusions I found when looking at the linear weights value of the entire at bat remain the same as when I analyzed single pitch run values.
I'm including a scatter plot of the categories I've used--fastball/off-speed percentage, fastball/off-speed run value, and fastball/off-speed linear weights-the overall linear weights value of the at-bat following the 0-2/1-2 fastball/off-speed pitch). Use the scroll bar on the bottom right to locate your pitcher of interest.
| Change-Up | January 27, 2010 |
On Xavier Nady & An Off-Season Lost
To the extent that you want more solid MLB-caliber players than not on the roster, the addition of Xavier Nady is a nice get for the 2010 Cubs. Short money, decent enough right-handed bat, positional flexibility, in some ways the move was a no-brainer. Almost any team in baseball would improve, some more than others, as a result of having Nady on their roster.
The problem for the Cubs, and any other team for that matter, is that resources and roster spots are finite. Coming off of 83 wins playing in one of baseball's weakest divisions, a few focused, tactical moves could have resulted in enough wins added to spring the North Siders into contention. As it stands at the end of the Hot Stove season, their starting rotation looks thin and injury prone while their offense looks to be improved. On the whole, it looks like this Cubs team should be just a bit better than last year's club. With luck, they'll contend. With Xavier Nady in the fold, they'll still need luck.
It's hard not to think back to the Milton Bradley episode and how much it distracted Chicago when looking at their moves this off-season. Losing Bradley and picking up Carlos Silva and Marlon Byrd, wherever you come down on the argument that they just had to part ways with Bradley, amounts to wheel-spinning. Byrd is no better than Bradley, Silva is just awful. Nady might hit southpaws better than Kosuke Fukudome, but how much of that differential offensively does Nady give back when he takes the field in right? As I see it, the most enticing part of this addition is that it protects against further Soriano deterioration. That's no small thing, but in an off-season where just a few shrewd moves could have made all that difference, Bradley, Byrd, Silva, Nady - the Cubs just haven't seem focused.
With the ownership commotion surrounding the club and Soriano's bi-weekly direct deposit hamstringing baseball operations, I can empathize. But at the same time, this was an off-season that called for even greater focus. There wasn't going to be a lot of money to spend, but the Cubs had a roster on the cusp. And it still is on the cusp, so it's not like they've mismanaged their way out of any hope for 2010. They just could have done more, and the announcement of the Nady signing tells me that they're not thinking strategically enough. Nady just won't make much of an impact, when there was impact at a great price still to be had on the free agent market.
You want to go short money and improve the club? Well what about Orlando Hudson or Felipe Lopez for a team whose second basemen hit .254/.310/.357 in 2009? If the Cubs opted to bolster their starting pitching instead, to avoid relying on some combination of Tom Gorzelanny and Randy Wells and Sean Marshall for 400 innings, then Jon Garland and his 200 league average innings could have helped. Garland would have led the 2009 Cubs in innings pitched. And heavens, Johnny Damon is still sitting out there. Maybe you don't want to hurt Alfonso Soriano's feelings or you otherwise sense a logjam in the outfield, but Damon is still an excellent player whose value seems to have plummeted without good reason.
Again, I want to stress that I can't get too worked up about any of the Cubs moves this off-season. I understand the chemistry stuff and the case for why Bradley had to go. Center field was a hole that Marlon Byrd should be able to fill. Xavier Nady adds some depth and a nice platoon partner if deployed appropriately. But if the Cubs looked at their roster and determined they only had a few moves to make this off-season, I wish they would have been executed with more focus and precision. Because a couple wins could mean all the difference in the National League Central.
| Behind the Scoreboard | January 26, 2010 |
Stolen Base Strategies Through History
This week's subject is a little lighter fare, focusing on how the stolen base has changed through time, and whether there is any rhyme or reason to why that has occurred. The amount of stolen bases has fluctuated throughout history. The early days of baseball saw a lot steals until the live-ball era began. As teams started scoring more and hitting more home runs, the speed game went on the decline, picking up again as scoring decreased throughout the 1980's.
A major explanation for the difference in stolen base strategies is that teams were rationally reacting to run environments. As scoring became harder, teams played "small ball" in order to scratch out runs. The goal here is to find out if teams actually did this and whether it was a rational strategy.
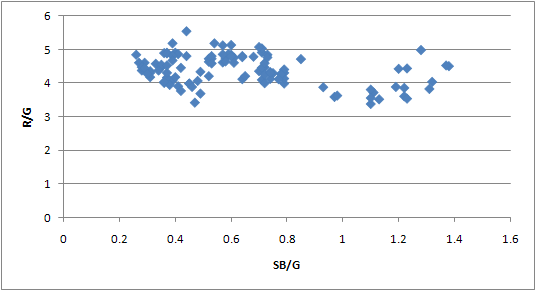
First, the relationship between runs and stolen bases. One would think that stolen bases would increase as run scoring decreased. Is this the case? According the above scatter plot, we see a very tenuous relationship. The points out to the right are deadball era years, where stolen bases are high. However, contrary to popular perception run scoring wasn't all that low during the deadball years. The relationship isn't any stronger after 1920 either - the rest of the scatter points are basically in a big clump. That pretty much puts to rest the myth that stolen base trends are a reaction to run scoring.
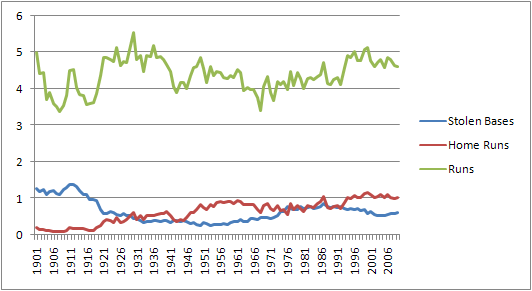
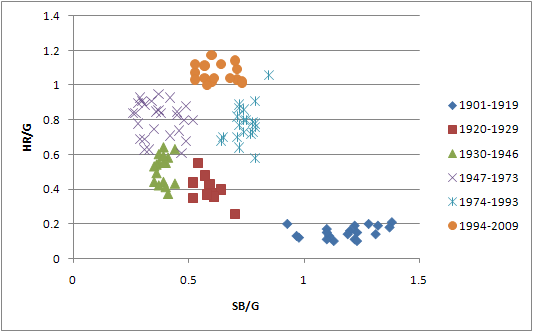
But is there another relationship between offense and stolen bases? Indeed, the graph above shows the relationship between steals and home runs over time. As you can see, steals and homers seem to be inversely related. Meanwhile, it doesn't have much of a relationship with scoring. A scatter plot doesn't tell quite as strong of a picture, although it's very easy to identify various eras based on these two statistics, which is something that I found pretty cool, even though it wasn't the point of the study.
It would make sense that teams would limit their steals when run scoring was high, but it might make even more sense when those runs are coming via the longball. Obviously, there's no point in taking an extra base if you're likely to be knocked in with a homerun anyway.
The real test of looking at the value of the stolen base is the break-even point. How often must a stolen base attempt be successful, before it is a good play? And how did this breakeven point change over time? Using Tom Tango's Run Expectancy Generator (which didn't do a perfect job across eras mainly because of differing error rates, but it's close enough) I calculated the break-even points on a no-out steal of second base. Obviously there are other situations in which a steal takes place, but being a common one, it's reasonable to use this as a baseline for how advantageous the stolen base is across eras. Picking the most typical point in each of the eras above, and tossing in anomalies 1968, 1930, and today, we can see that while the breakeven point has changed some, there's not a huge difference.
1905: 74.0%
1923: 80.3%
1930: 81.8%
1937: 80.5%
1959: 79.3%
1968: 75.2%
1985: 79.3%
2001: 81.1%
2009: 81.0%
Obviously looking at the break-even rates, we would expect that the number of steals would be highest in the dead-ball era and in 1968. While steals were higher in the dead-ball era, the number of stolen bases in the 1960's was eclipsed by the 1980's and even the current era, which has much higher scoring. While stealing was a better proposition in the 60's, it was used as much as it is today.
Of course, there is a final factor that comes into play: the likelihood that a stolen base attempt is successful. I can't think of much good reason for why the stolen base success rate would change over time, but the fact is that it has changed dramatically. Modern base stealers are vastly more successful than they have been in the past. Why this is, I'm not sure. Perhaps players are faster now, without a corresponding increase in catcher arm strength and accuracy. Perhaps teams are better at reading and timing pitchers' moves to the plate. Or perhaps teams are just better about stealing bases they know they can make. In any case, the chart below combines the data.
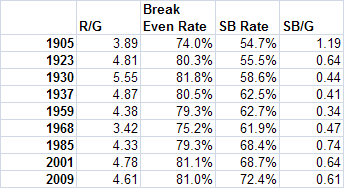
As you can see, the stolen base success rate varied tremendously over time. The variation here is far more than the variation in the break-even rate. Hence it would make sense that teams would steal more bases today than in the past. Certainly there is more stealing in the modern 1974-2009 era, than there was between 1930-1973. However, the odd scenario is the deadball era and the 1920's, where stealing was still prevalent, despite abysmal success rates. In the 1920's stealing was about as lucrative as it is today, but with about a 55% success rate vs. a 73% success rate. Nevertheless, stealing was a common tactic.
Looking at the data as a whole, there's not a lot of rhyme or reason about why some eras are high stolen base eras and others are not. The rate of stolen base tends to go up and down without any real correlation between rate of success or strategic value. Part of the problem seems to come from the fact that homeruns seem to be the biggest determinant of whether teams steal or not.
However, home runs don't have a major impact on the breakeven rate. Using today's data, I kept the number of runs constant but doubled the number of homers. The breakeven point went up, but slightly (from 81.0 to 82.9). Similarly I brought the number of home runs down to zero (keeping scoring constant), and the breakeven point again changed very slightly (from 81.0 to 80.5). With the breakeven point barely moving despite dramatic differences in homerun rate, using homers or lack of homers to justify base-stealing strategy isn't a good move. However, I have a feeling that if home runs dropped precipitously today, teams would begin to employ vastly more basestealing - likely an irrational move. More important to a team's strategy is the run-scoring environment, no matter how the runs are scored.
In conclusion, baseball teams have behaved irrationally with their base-stealing strategies through history. It seems that steals have been a function of homers, or simply fashion, and not based on the actual value of the steal. But did you really expect John McGraw to have read the Hidden Game of Baseball?
| Baseball Beat | January 25, 2010 |
Graphing the Hitters: Plate Discipline
I introduced Graphing the Hitters earlier this month. The focus was on Productivity, defined as OBP and SLG.
In this week's edition of Graphing the Hitters, I'm going to concentrate on Plate Discipline. The graph below plots walk rate (BB/PA) on the x-axis and strikeout rate (SO/PA) on the y-axis for every qualified batter in 2009. The intersection of the MLB averages for BB% (8.88%) and SO% (17.96%) created quadrants that classify players as better-than-average in both (lower right), worse-than-average in both (upper left), or better-than-average in one and worse-than-average in the other (lower left and upper right).
Unlike Fangraphs, I believe the denominator for strikeout percentage should be plate appearances (rather than at-bats). For whatever reason, Fangraphs defines walk percentage as BB/PA but strikeout percentage as SO/AB. As a result, while the raw numbers were downloaded from Fangraphs, the BB% and SO% were calculated separately.
Note: You can download a spreadsheet containing the PA, BB, SO, BB%, and SO% of the 155 hitters here. This information can also be used to locate the 134 players not labeled in the graph below.
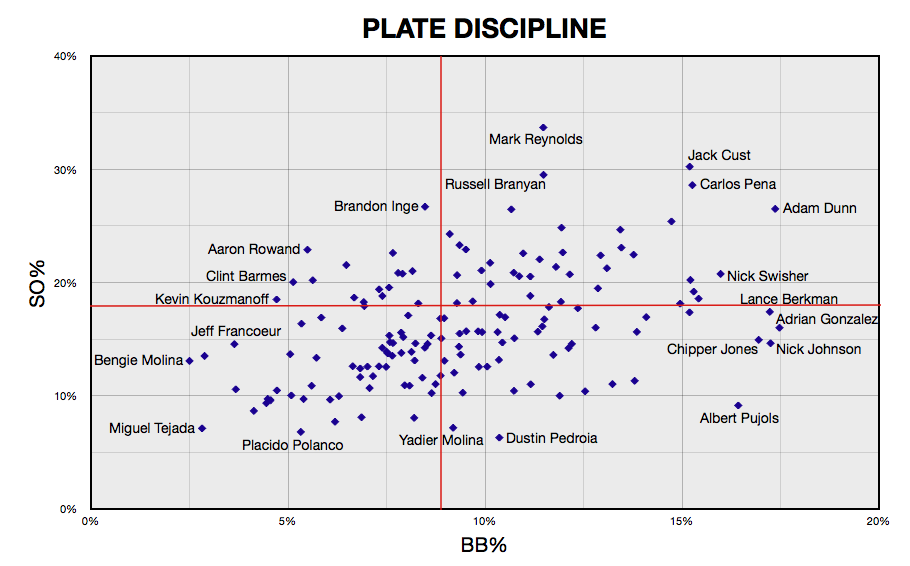
My first question following the Productivity graph was "Is Albert Pujols any good?" Well, after looking at the Plate Discipline graph, I've got to ask the same question once again. This time around, I'm going to shout out my question.
OK, I think I've made my point now. Not that it was really necessary. Everybody already knows that Pujols is better than good. I mean, this guy is great. In fact, he is on pace to become one of the greatest hitters of all time and perhaps the best or second-best righthanded hitter ever.
Pujols has played nine seasons in the major leagues. He has ranked in the top ten in batting average, slugging average, on-base plus slugging, total bases, and times on base every year. What is less known is that Albert has improved his walk rate every single season while reducing his strikeout rate by a third since his rookie campaign in 2001.
In 2009, Pujols had the sixth-highest BB% (16.43%) and the ninth-lowest SO% (9.14%). That is a remarkable combination. He was the only player in the top 50 in walk rate with a strikeout rate below 10.0%. You have to go all the way down to No. 57 in the walk rankings to find someone with a lower strikeout percentage (Dustin Pedroia). The Red Sox second baseman had the lowest SO% (6.30%) in the majors.
Pujols and Pedroia are two of only 13 qualified hitters with more walks than strikeouts.
| First | Last | Team | PA | BB | SO | BB/PA | SO/PA |
|---|---|---|---|---|---|---|---|
| Adrian | Gonzalez | Padres | 681 | 119 | 109 | 17.47% | 16.01% |
| Nick | Johnson | - - - | 574 | 99 | 84 | 17.25% | 14.63% |
| Chipper | Jones | Braves | 596 | 101 | 89 | 16.95% | 14.93% |
| Albert | Pujols | Cardinals | 700 | 115 | 64 | 16.43% | 9.14% |
| Todd | Helton | Rockies | 645 | 89 | 73 | 13.80% | 11.32% |
| Marco | Scutaro | Blue Jays | 680 | 90 | 75 | 13.24% | 11.03% |
| Joe | Mauer | Twins | 606 | 76 | 63 | 12.54% | 10.40% |
| Luis | Castillo | Mets | 580 | 69 | 58 | 11.90% | 10.00% |
| Victor | Martinez | - - - | 672 | 75 | 74 | 11.16% | 11.01% |
| James | Loney | Dodgers | 652 | 70 | 68 | 10.74% | 10.43% |
| Dustin | Pedroia | Red Sox | 714 | 74 | 45 | 10.36% | 6.30% |
| Yadier | Molina | Cardinals | 544 | 50 | 39 | 9.19% | 7.17% |
| Alberto | Callaspo | Royals | 634 | 52 | 51 | 8.20% | 8.04% |
Adrian Gonzalez led MLB in walk rate and walks (119) last year. He was one of five first basemen with more walks than strikeouts. Three second basemen, three catchers, one shortstop, and one third baseman also accomplished this feat, including three projected starters for the Boston Red Sox in 2010 (Marco Scutaro, Victor Martinez, and Pedroia). The St. Louis Cardinals are the only other team with more than one representative (Pujols and Yadier Molina).
At the other end of the spectrum, Yadier's older brother, Bengie Molina, had the lowest BB% (2.50%) in baseball. Bengie struck out in 13.08% of his plate appearances, which means he whiffed more than 5x as often as he walked.
Mark Reynolds had the highest SO% (33.69%). He set a single-season record with 223 strikeouts in 2009. The 26-year-old third baseman has played three seasons in the majors and owns the top two strikeout totals in the game's history. His SO and BB rates have increased each year. The good news is that his BB% has risen 29.2% while his SO% has advanced just 8.0% since his rookie campaign in 2007.
Russell Branyan (29.50%), Jack Cust (30.23%), Adam Dunn (26.50%), Ryan Howard (26.46%), Brandon Inge (26.69%), and Carlos Pena (28.60%) stand out for their high strikeout rates. However, Inge was the only one with a walk rate (8.48%) below the league average.
Lastly, there were 13 qualified hitters with walk rates over 15%. Other than Pujols, every player in this baker's dozen bats lefthanded or both. Therefore, I believe it is safe to say that the three-time MVP is truly unique. As the graphs have shown, Pujols is the most disciplined and productive hitter in the game today.
| Designated Hitter | January 23, 2010 |
Baseball on the Radio in New York City in 1953
Author's Note: Ernie Harwell's birthday is January 25th. When I sat down to start writing this article last month, I had that birthday in mind as a deadline. I thank Rich for allowing me to print it here in time for time for Ernie's birthday. Happy Birthday Ernie. Listening to you broadcast a game was always a pleasure.
In 1953, a baseball fan in New York City turning the radio dial had several delightful choices. The trio of Red Barber, Connie Desmond and Vin Scully were the voices for the Dodgers; Russ Hodges and Ernie Harwell called Giant games; Mel Allen, Joe E. Brown and Jim Woods were the broadcasters for the Yankees. Never before and not since have so many excellent broadcasters congregated in one city in one season to broadcast big league baseball.
Before 1939, the three New York teams, fearful that radio play by play would curtail attendance, kept radio broadcasts out of their ballparks. There were some exceptions to the radio ban. A few opening day and other scattered games were aired. All-Star games and the World Series were broadcast on New York radio stations. However, New Yorkers were unable to hear major league baseball on a regular basis until Larry MacPhail, brought to New York from the Cincinnati Reds to take over operation of a moribund Brooklyn Dodger franchise, broke the radio blackout in 1939.
Red Barber was the first of the seven legendary broadcasters of 1953 to take the air for a New York team for a full season of games. Red's first broadcasting job, taken while he was a student at the University of Florida, was at radio station WRUF in Gainesville, Florida. During his time at WRUF, Barber was able to hear the powerful signal of Cincinnati's WLW at his home in Gainesville. Red followed that radio signal to its source to audition for a job at the radio station that has long been dubbed as "The Nation's Station" because of the wide sweep of its AM transmitter.
In 1934, Red realized his goal of a job at WLW. Powel Crosley, the owner of stations WSAI and WLW in Cincinnati, took over control of the Cincinnati Reds during the Great Depression. With a team and two radio stations, Crosley naturally looked for a broadcaster to air the games of the team he owned. There were plenty of capable broadcasters in the Cincinnati area, but the job went to the young man in Florida who had never broadcast or even seen a big league baseball game.
Red's radio work involved more than sports and baseball broadcasts. Only about twenty Reds games were broadcast on the radio in 1934, so Red worked more as a staff announcer than as a baseball broadcaster in his first year in Cincinnati. The next year Red's baseball broadcasting career blossomed. Larry MacPhail brought lights to the Reds home park in 1935, and the Reds played the Philadelphia Phillies in the first night game in major league history on May 24th. Red Barber broadcast that game over the new Mutual Broadcasting network. Red's call of the major's first night game was the first sporting event ever carried by Mutual. After the end of the regular season Red was back in the national spotlight as a broadcaster for Mutual's coverage of the 1935 World Series between the Cubs and Tigers.
Red stayed in Cincinnati until the end of the 1938 season. Powel Crosley did not want to see his talented broadcaster leave. Red was offered more money to stay in Cincinnati than he would make in Brooklyn, but the lure of greater career possibilities in New York caused Red take the Dodger job.
Mel Allen will always be remembered as the voice of the Yankees. However during his early years as a baseball broadcaster Mel was actually the voice for two major league teams, the Giants and the Yankees. After Brooklyn broke the New York radio blackout, the Yankees and the Giants in 1939 joined forces to broadcast their home games over WABC. Brooklyn broadcast its entire schedule, home and away, although road games were recreated.
The principal broadcaster for the Yankee and Giant games in 1939 was Arch McDonald, a veteran broadcaster who had done Senator games in Washington, DC. McDonald's assistant was Garnet Marks. Marks was fired early in the season, and in June of 1939, Mel Allen was hired to take his place. After the 1939 season, McDonald returned to Washington and Allen became the primary broadcaster for Yankee and Giant home games in 1940.
Like Red Barber, Mel Allen was raised in the South. At the age of fifteen Mel enrolled at the University of Alabama. After completing his undergraduate degree, he began law school, also at the University of Alabama. While in law school, Mel became the public address announcer for University of Alabama football games. Shortly before the 1935 season the radio broadcaster for University of Alabama football games quit. The P.A. announcer was transferred to the radio booth to call Alabama football and a brilliant broadcast career was born.
In 1936, Mel traveled to New York for a winter vacation. While in New York he decided to audition for a job, and he landed a staff position at CBS radio in early 1937. Allen appeared in a variety of capacities for CBS including game shows, soap operas and big band broadcasts. In 1938 Mel appeared along with France Laux and Bill Dyer for CBS radio coverage of the World Series between the Cubs and Yankees. It was the first of many World Series broadcasts for perhaps the most recognizable voice in baseball broadcasting history.
Connie Desmond was the third of the seven legendary broadcasters to arrive in New York. In 1942 Desmond was hired to work at radio station WOR. Connie began his broadcasting career in 1932 in his hometown, Toledo, Ohio. During the 1942 baseball season, Connie teamed up with Mel Allen to broadcast Giant and Yankee home games over WOR. Connie also worked at WOR in a variety of capacities, including music shows that featured his own singing.
Red Barber's assistant broadcaster, Al Helfer, went into the military after the 1942 season. Desmond met with Barber and asked for Helfer's job. Connie was hired as Barber's assistant. In 1943 the Giants and Yankees did not broadcast any of their games, so Connie and Red were the only big league broadcasters on the air in New York during the 1943 season.
After World War II, a pivotal figure in New York baseball broadcasting returned from military duty. Larry MacPhail returned to New York, but not with the Dodgers. MacPhail became a co-owner of the Yankees and once again he brought change to baseball broadcasting in New York. MacPhail was not satisfied with the broadcasting partnership between the Giants and Yankees. In 1946, the Yankees began broadcasting all their games, home and away, on WINS. Mel Allen, also out of the military, returned as the principal Yankee broadcaster. The Giants hired Jack Brickhouse as their primary broadcaster in 1946. For the first time, all three New York teams were on the radio for a complete season of home and away games.
Russ Hodges was the fourth of the legendary broadcasters to reach New York. In 1946, Russ was hired to assist Mel Allen on Yankee broadcasts. Before taking the Yankee job, Hodges broadcast for the Cubs and White Sox in Chicago, and for the Senators in Washington, DC. Like Allen, Russ Hodges was a law school graduate. Hodges stayed with the Yankees until the Giants hired him to be their primary broadcaster for the 1949 season.
Ernie Harwell arrived in New York during the 1948 season to broadcast for the Brooklyn Dodgers. Ernie began his baseball career at an early age. When he was five years old he was a bat boy for visiting teams of the minor league Atlanta Crackers. At the age of sixteen, Ernie became the Atlanta correspondent for the "Baseball Bible," the Sporting News. Harwell began his broadcasting career at WSB in Atlanta in 1940 after graduating from Emory University. Ernie broadcast Atlanta Cracker games before the war, and after being discharged from the Marines, he resumed his baseball broadcasting career with the Crackers in 1946.
Ernie was brought to New York to fill in for an ailing Red Barber during the 1948 season. That year, the Dodgers began live broadcasts of their road games. Red Barber became severely ill with a bleeding ulcer during a Dodger road trip. Connie Desmond took over as the sole broadcaster for the Dodgers while Dodger management sought a replacement for Red. The Dodgers looked to Atlanta and the talented Harwell to fill in during Red's illness. However, Ernie was under contract to the Crackers, so Ernie's boss in Atlanta, Earl Mann, needed to be compensated for losing his play by play broadcaster. For the only time in major league history, a team traded a player for a baseball broadcaster when the Dodgers shipped minor league catcher Cliff Dapper to Atlanta for the services of play-by-play broadcaster Ernie Harwell.
Ernie remained with Red Barber and Connie Desmond through the end of the 1949 season. Ernie left the Dodgers to join Russ Hodges in broadcasting New York Giant games in 1950. To the delight everyone who has had a chance to listen to him during the past sixty years, Red Barber chose Vin Scully to replace Ernie in the Dodger broadcast booth.
Vin Scully graduated from Fordham in 1949. While he was in college he worked at the campus FM station and also played the outfield on the varsity baseball team. Vin sent letters to radio stations up and down the Eastern seaboard in search of a broadcasting job after graduation. He landed a temporary job as a summer replacement announcer in Washington, DC for the CBS affiliate, WTOP. Management at WTOP appreciated his talent, but at the end of the summer, they had no permanent job for him. Vin left Washington with a promise of a future job at WTOP, but no immediate employment.
Vin returned to his home in New York and contacted CBS radio in search of a job. Vin was able to meet with Ted Church, who was director of CBS radio news. Church had no job for him, but he did introduce Vin to Red Barber, who in addition to being the Dodger play-by-play broadcaster, was the director of sports for CBS radio. Red had no job to offer, though he was favorably impressed after talking with the youngster.
One of Red's primary duties as director of sports for CBS radio was selecting broadcasters to go to various college games throughout the country for the CBS college football roundup show. Luckily for Vin, in 1949 Red was unable to find a broadcaster for the Boston University-University of Maryland football game played at Boston's Fenway Park. Red remembered the young man he had met at CBS headquarters in New York and arranged for Vin to fill in at the last minute in Boston. Vin's performance impressed Red enough to give the youngster another assignment on the football roundup and a chance to be a major league broadcaster for the Dodgers.
Vin joined the Dodger broadcast booth after an eventful meeting with Red Barber and Branch Rickey that took place after Red returned to New York from a 1949 college football broadcast on the West coast. In an interview with author Ted Patterson for the splendid book, The Golden Voices of Baseball, Vin recalled the terms of his employment: "The agreement reached was that I would go to spring training on a one-month option. Either I make it, or they could lose me in the Everglades."
Jim Woods was the last of the seven legendary broadcasters to reach New York. In 1953, Jim teamed with Mel Allen to broadcast Yankee games. Joe E. Brown joined Woods and Allen for some Yankee broadcasts, but Brown primarily worked on the Yankee pre- and post-game shows. Woods had an eventful career before he arrived in New York. Jim replaced Ronald Reagan as the football radio voice of the Iowa Hawkeyes in 1939. After spending four years in the military during World War ll, Woods eventually landed in Atlanta where he replaced Ernie Harwell after Ernie left the Crackers to broadcast for the Brooklyn Dodgers. Woods followed Ernie's path to New York as a major league broadcaster in 1953.
The seven splendid broadcasters were together in New York for just one season. Ernie Harwell left the Giants to become the principal broadcaster for the Baltimore Orioles in 1954. Harwell's departure was not the only shift in the New York baseball broadcasting landscape. After the 1953 season, Red Barber left the Dodgers to join Mel Allen and Jim Woods in the Yankee broadcast booth.
Vin Scully and Connie Desmond continued as Dodger broadcasters in 1954. However, Connie missed some games because of alcoholism. In 1955, the only year Brooklyn won the World Series, Connie was gone from Dodger broadcasts. Dodger owner Walter O'Malley gave Connie a last chance to continue his career in 1956, but when Connie began drinking again, he was replaced for good by Jerry Doggett before the end of the season.
The Yankee broadcast team of Mel Allen, Jim Woods and Red Barber stayed together until the end of the 1956 season. Phil Rizzuto, whose Yankee playing career ended in 1956, was hired to replace Woods as a Yankee broadcaster. Woods was able to stay in New York by shifting to the Giants broadcast booth in 1957.
The departure of the Brooklyn Dodgers and New York Giants for Los Angeles and San Francisco after the 1957 season forever changed the face of baseball and baseball broadcasting in New York. Vin Scully and Russ Hodges relocated with their teams to the West coast. Remarkably, in 2010, Vin will begin his 61st consecutive season as a Dodger broadcaster. After the 1957 season, Jim Woods departed New York for Pittsburgh, where he teamed with Bob Prince to form one of the best play-by-play tandems in the history of baseball broadcasting.
In 1964, Mel Allen was fired by the Yankees. Mel broadcast for the Atlanta Braves and Cleveland Indians after leaving New York. Mel returned to the Yankees as a cable-TV announcer for SportsChannel in 1978. His primary fame though after 1964 was as the voice for the popular TV show, This Week in Baseball. TWIB with Mel Allen was on the air for seventeen terrific years.
Red Barber, the man who in 1939 was the first broadcaster for a New York team, was the last of the seven legendary broadcasters of 1953 to broadcast for a team in New York. After the 1966 season Red was fired by the Yankees. In the last years before his death, Red returned to radio as a regular guest of Bob Edwards on NPR's Morning Edition.
Sources:
Sports on New York Radio: A Play by Play History by David J. Halberstam is an absolute gem for anyone interested in the history of sports broadcasting. Ted Patterson's Golden Voices of Baseball is rich in pictures and commentary about the history of baseball broadcasting. The book includes two CD's containing excerpts of the author's interviews with various broadcasters. Both books are well worth their purchase price.
Also useful in this article were interviews of Vin Scully and Red Barber broadcast on Larry King's radio show for Mutual in 1982. A partial transcript of the King-Barber interview is available at Dodger Thoughts. I also used material from a radio program produced by a Cincinnati NPR station that was narrated by Marty Brennaman. The CD is available for purchase through the Cincinnati radio station's internet site.
Ross Porter's essay about Ernie Harwell, gives some details about Ernie's life that I included in my article. Also, Ernie has an audio scrapbook that is rich in information and is a delight to hear. It is available for purchase on the internet.
Some of the material about Mel Allen was taken from Mel's obituary in the New York Times. The obit from the New York Times is online. There are a few errors in the obituary though. Also helpful was a taped interview of Mel done by baseball broadcast historian Curt Smith.
Stan Opdyke grew up on the East Coast listening to baseball on the radio. He still prefers baseball on the radio (if the broadcasters are good) to baseball on TV.
| F/X Visualizations | January 22, 2010 |
How Do Pitchers Change Their Approach Against Good Hitters?
Nick Steiner, who over the last couple months has been producing some great pitchf/x content, had an interesting piece asking how many HRs Albert Pujols would hit if he saw the same pitches as Juan Pierre. He wrote the piece in mid-September and concluded he would have hit 62 HRs up to that point in the season. It is a very cool question, and implicit in it the question is the understanding that pitchers pitch differently to good hitters than they do to not-quite-as good hitters.
I think this is a very interesting idea to explore further, and the PITCHF/X data set is a great tool for it. To do that I created two groups of hitters. First the twenty regulars with the top wOBAs in 2009 (wOBA is a stat of TangoTiger's construction that measures overall offensive impact), and second the twenty regulars with the lowest wOBAs in 2009.
One common assumption is that good hitters see fewer fastballs and this analysis bears this out. The top-wOBA group saw 58.4% fastballs versus 61.5% for the bottom-wOBA group. But that actually understates the difference. The top group saw many more pitches in hitter's counts and pitchers throw more fastballs in hitter's counts. It is best to consider the difference in each count.
Fastball Frequency by count
        top   bottom
0-0   0.626    0.663
0-1   0.551    0.545
0-2   0.549    0.511

1-0   0.587    0.664
1-1   0.542    0.559
1-2   0.497    0.484

2-0   0.659    0.780
2-1   0.579    0.679
2-2   0.530    0.528

3-0   0.717    0.848
3-1   0.735    0.823
3-2   0.591    0.705
Here you can see the difference is largely driven by hitter's counts (e.g., 1-0, 2-0, 2-1, 3-0, 3-1) where the top group saw on average 10% fewer fastballs than the bottom group. Interestingly in pitcher's counts (e.g., 1-2, 2-2) the differences are very small.
The next thing we can look at is where those pitches end up. Here I plot the location of fastballs to the two groups. Areas where the top-wOBA group sees more pitches are red and where the bottom-wOBA group are blue.
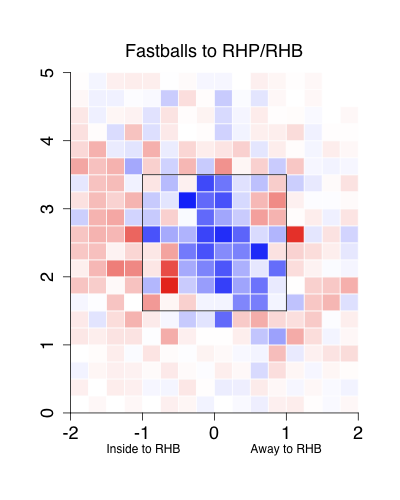
Not surprisingly the top group sees many fewer balls in the strike zone. The extra pitches end up inside more than they end up outside, which is a little surprising to me. This also shows that the pattern of good hitters seeing fewer pitches in the zone is not just a result of them seeing fewer fastballs, which are more likely to be in the zone. That is good hitters see fewer fastballs AND the ones they do see are less likely to be in the strike zone.
Overall the top group saw 47.6% of their pitches in the strike zone, compared with 51.8% for the bottom group. But again this 4% difference understates the difference because the top group gets more hitter's counts in which pitchers should be around the zone. Breaking up by count we see:
Proportion of pitches in the strike zone
        top   bottom
0-0   0.507    0.548
0-1   0.428    0.473
0-2   0.325    0.325

1-0   0.505    0.575
1-1   0.478    0.526
1-2   0.376    0.424

2-0   0.505    0.592
2-1   0.545    0.580
2-2   0.443    0.489

3-0   0.471    0.554
3-1   0.607    0.646
3-2   0.553    0.598
Here the difference increases to 4% to 7% in each count. It is clear the pitchers avoid the heart of the zone, and the zone as a whole, against the better batters.
This is another example where the pitchf/x data support the prevailing assumptions: good hitters see fewer fastballs and fewer pitches in the zone. But there are some interesting patterns: the smaller frequency of fastballs seen by good batters is largely driven by a much smaller frequency in hitter's counts -- not all counts across the board -- and the out of zone fastballs that good hitters see are more likely to be inside than outside.
| Change-Up | January 21, 2010 |
In Response to Murray Chass
Recently, former New York Times journalist and J.G. Taylor Spink Award winner Murray Chass took to the pages of his blog titled Murray Chass On Baseball to discuss Hall of Fame voting. He addressed an array of topics, from Hall voting eliciting strong opinions, to Tommy John's Hall of Fame candidacy, to my own personal "track record". There's no need to FJM someone like Chass - he's just writing on his blog that he refuses to acknowledge is a blog, snarling at (certain) stats and just sort of watching the world pass him by. Honestly, it has to be difficult. On a human level, I pity Murray Chass.
Since I guess Chass probably maintains a broad readership and has decided to come at me personally in his column, I suppose I should respond to a few of the points he made. It's evident to me that Chass doesn't like the tone of the Hall of Fame debate, and I suppose that's reasonable. Heck, we get awfully passionate around here about it, maybe excessively so on occasion. Chass points out one reader who emailed to say that one candidate "clearly deserved" enshrinement, and Chass thought that language was too strong. Fine, I suppose, but surely there are "clearly deserving" Hall candidates, no? Anyway, and Craig Calcaterra has already dealt with this nicely, problems arise when Chass veers off "can't we all just get along" course and into this:
“Clearly deserve” in whose judgment? His, of course. Does that make him right and me wrong? Of course not. Am I right? Yes. Why? Because my opinion counts and his doesn’t. My ballot was one of the 539 counted in the election. He did not have a vote. Therefore, his opinion is worthless as far as the election is concerned.That’s the real problem self-proclaimed experts have. They want to be the ones voting, but they don’t have that privilege. It’s their own fault. They chose the wrong profession. Accountants, lawyers, doctors, teachers and salesmen don’t get to vote for the Hall of Fame. Baseball writers do.
Someday, a curious individual might set out to understand why it was that baseball websites were able to amass strong followings at a time when the profession of mainstream media baseball writing was still so entrenched in American culture. How could Rob Neyer and Nate Silver and Jonah Keri and Joe Sheehan and Keith Law and David Cameron and Sky Andrecheck and Cliff Corcoran have risen to such prominence, when the baseball writing establishment was still churning out columns? Well, that individual researching why it was that new internet baseball writers succeeded will stumble across what Chass has written above, and it will all make sense.
You don't get credibility because you hung around clubhouses for 30 years. Or because you traveled on the team plane, have had cocktails with Lou Gorman, were at Fenway the day Bucky Dent hit his home run or because you can recall the fear in opposing pitchers' eyes as Jim Rice came to the plate. You don't even get credibility because you have a vote. You get credibility by doing good work. And if your work is good, it stands on its own. If a new age of writers comes along with a new way of thinking about the game, and a new medium like the internet emerges, you don't kick and scream and yearn for yester-year, you evolve and learn and continue to do good work.
As for the notion that a non-voter's opinion is "worthless", tell that to Bert Blyleven or the proprietor of this site. Blyleven has publicly expressed gratitude for Rich Lederer time after time, and recently Peter Gammons praised Rich's work as well. About a dozen writers have explicitly attributed their Blyleven support to Rich's Blyleven series. How many more writers have been persuaded and not admitted as much? Rich may not have a vote, and he may not have swayed Murray Chass, but his opinion is anything but "worthless".
To be sure, there are nobler causes to take up, but there is virtue in working to ensure the Hall of Fame voting process is more just. A baseball career is a man's life's work, and there is no more prestigious recognition than to be enshrined in Cooperstown. So if Murray Chass and Dan Shaughnessy can't be bothered to figure out who the best players were, others will have to take it up. Whether we're writers or salespeople or money managers or entrepreneurs or consultants or lawyers, we'll take it up. We'll do so by building strong cases for the candidates we think deserve enshrinement, and we'll do so by exposing and discrediting flimsy logic. Because flimsy logic, when it comes to the Hall of Fame, can lead to a man's life's work being remembered in the wrong light, or even not remembered at all. Readers, fans, other voters - they'll be the ones to decide whose judgment should be called into question. Not Murray Chass through a baseless assertion on his baseball blog.
==========
As I noted at the outset, Chass also came at me personally in his blog entry, and I want to address it quickly. It was actually quite harmless but let me just offer up a few thoughts. Chass wrote the following...
Patrick Sullivan, a name unknown to me, ridiculed Dan Shaughnessy, a highly respected columnist for the Boston Globe, for writing that … well, just about anything. I don’t know that Shaughnessy wrote a sentence that Sullivan didn’t ridicule.One of the statements he faulted Shaughnessy for was his belief that Jack Morris was better than Curt Schilling. Preposterous, Sullivan suggested. True, I say in agreement with Shaughnessy. But then I would probably take Shaughnessy’s view over Sullivan’s on any subject. Shaughnessy has a track record; Sullivan doesn’t, as far as I know.
I have had a similar debate with a reader over Morris and Bert Blyleven. Like Sullivan in his case for Schilling, the reader used statistics to argue his case for Blyleven. Most of the Hall arguments today seem to be statistics-centered.
All I can say is if you're going to be called out in public by a washed-up sportswriter on his baseball blog, this is how you want it to be done; in a fashion that is so self-evidently discrediting. We learned three things from this Chass excerpt:
1. Chass thinks Shaughnessy is right and I am wrong because Shaughnessy has a track record with which he's familiar.
2. Chass thinks Shaughnessy would be right and I would be wrong on ANY subject because Shaughnessy has a track record as a baseball sportswriter and I do not.
3. He thinks Jack Morris was better than Curt Schilling.
Two thoughts. One, how harebrained do you have to be to admit freely that you won't entertain the merits of a particular argument, but rather will simply appeal to authority? What a great way to discredit your whole philosophy in one fell swoop.
Two, and I can't be clear enough about this. If you think Jack Morris was a better pitcher than Curt Schilling, THEN YOU DON'T KNOW THE VERY FIRST THING ABOUT BASEBALL. Talk about life's work? The life's work of Murray Chass, all those days and nights hanging around a smelly clubhouse, and what does he have to show for it? A baseball mind that leads him to believe that Jack Morris is better than Curt Schilling. It's nothing short of embarrassing.
The piece ends the way so many of these do. After berating those of us who look to statistics to form the basis of our baseball-related arguments, he transitions to Tommy John's Hall of Fame case, comparing his to Blyleven's.
John had a career 288-231 record with a 3.34 earned run average. Blyleven’s record was 287-250 and his e.r.a. 3.31. John retired 57 percent of the batters he faced, Blyleven, with all his strikeouts, 59 percent.
Yup, stats. But not just any stats, moronic, wrong stats that say Tommy John yielded a career .430 on-base percentage and Bert Blyleven yielded a .410 figure. Truth is, John's career on-base against was .315 while Blyleven's was .301. I am not sure where that gets us, but at least we're dealing in reality.
Anyway, back away from the word processor, Murray. People, successful people, knowledgeable people who adore baseball, are all laughing at you.
| Touching Bases | January 21, 2010 |
I've Seen That Before
While a pitcher's stuff diminishes over the course of game, the effects I found were relatively small. So why do batters gain an edge over pitchers as the game goes on? Well, baseball is a game of adjustments. Batters get their timing down and start picking up the ball out of the pitcher's hand. All that good stuff.
The first time a batter faces a curveball, he might be caught off-guard. That’s why pitchers throw predominantly fastballs the first time through the order. And that’s why batters do so well the third time they face a pitcher. They’ve seen most of his repertoire, and are able to recognize the curve. As the saying goes, “Fool me once, shame on you. Fool me…you can’t get fooled again.”
First, here is the average run value per 100 pitches based on the number of times a batter has seen a given type of pitch. I include all data points for which I have approximately 1,000 pitches.
For reference:
F2: Sinker/Two-Seam Fastball
F4: Four-Seam Fastball
CB: Curveball
SL: Slider
CH: Changeup
FC: Cut Fastball
This chart indicates that a batter facing a fastball from the same pitcher for the 12th time will perform better than a batter facing a pitcher's first fastball. Chances are, however, that batters who face 12 fastballs are better from those who only face a few. One way to get around this bias might be to take the difference in run value between the 11th fastball and 12th fastball. This method, called the delta method, allows you to compare apples to apples as each change in measurement is at least composed of players from the same sample. This produced the following chart:
The magnitude of the results is enormous, if the results are to be believed. A batter facing a changeup for a fifth time is expected to perform over five runs per 100 pitches better than he performs the first time he saw the changeup. That's pretty much the difference between the best and worst hitter in the league. Unfortunately, I have to say that I don't think the delta method is the way to go here, and I'm not sure how to fix my sampling problems. Batters who face at least three changeups have a rv100 of 0.2 on the third changeup, but they only have an rv100 of -1.1 on the second change. This is a delta of 1.3 runs. Meanwhile, batters who face at least four changeups have an rv100 of -1.3 runs on the third change and 0.3 on the fourth, another huge delta of 1.6 runs. This would mean that batters perform three runs per 100 pitches better on the fourth changeup they see than on the second. The oddity here is that batters who face at least three changeups are above average on the third changeup, but batters who face at least four changeups are well below average on the third changeup. I think what this means is that once pitchers get burned on a given pitch, they quit throwing it to that batter the rest of the game. I don't know how to solve for these biases.
I went on and produced the same two charts, except this time at the at-bat level instead of the game level.
Batters who face seven fastballs in an at-bat are good, in that they are able to work the count. Meanwhile, pitchers who throw five sliders in an at-bat are good, in that they are either ahead in the count or can locate their breaking balls.
Using the delta method:
No pitch gains in effectiveness after its been thrown once already in an at-bat. This finding was applicable at the game level as well. However, there are differences between the at-bat and game level. Off-speed pitches such as the changeup and curveball lose more value than fastballs during the game, given an even distribution of pitches. But in an at-bat, off-speed pitches do not lose as much effectiveness as fastballs when they're repeatedly thrown. It makes sense to me that changeups are the worst pitch to show multiple times to the same batter throughout the game, since the success of changeups is built on deception. Yet I'm not sure why changeups don't lose as much effectiveness in an at-bat once thrown multiple times as fastballs do. I think it has something to do with the count in which they're thrown and the theory of the out pitch.
| Change-Up | January 20, 2010 |
Do the Cubs Need More Risk?
The Chicago Cubs boast a core group of championship caliber position players that includes Aramis Ramirez, Derrek Lee, Geovany Soto, Alfonso Soriano, Marlon Byrd, Kosuke Fukudome and Ryan Theriot. Their front three starting pitchers, Ted Lilly, Ryan Dempster and Carlos Zambrano, form a perfectly adequate top end of a World Series aspirant club. In the bullpen, arms like Carlos Marmol, Angel Guzman, John Grabow and Sean Marshall offer Manager Lou Piniella a pool of live and (often) dependable arms for late in ballgames. All of this is to say that the Cubs, as currently constituted, look like a solid club.
Of course a "solid club" when you're looking up at the St. Louis Cardinals might not do the trick and to their credit, the Cubs are looking to round out their roster with a player or two still available on the free agent market. As I concluded in my piece over the weekend, it's likely that the Cubs will still have a strong pitching staff, just not one that stacks up to their outstanding 2009 unit. They can expect some improvement offensively, but for a team looking to make a big leap from 83 wins to contender, it doesn't look like the offense will do enough to get them over that line. The Cubs are looking for another starter.
Now, if you were to diagnose what went wrong with the Chicago Cubs in 2009, you would point to four separate players. Soriano and Soto battled injuries and sub-par performance all season long, Ramirez missed too many games and Milton Bradley failed to live up to his potential. The Cubs signed three of those four players to splashy free agent contracts, and Soto was the 2008 NL Rookie of the Year. All four are stud talents, and while the Cubs SHOULD be able to pencil in improvement from Soriano, Soto and Ramirez (Byrd fills in for Bradley), there is still a high-risk high-reward element at play.
This brings me to their starting pitching decision. The Cubs are rumored to be in hot pursuit of right-handed pitcher Ben Sheets, the man whose medicals are said to be disastrous. Even for smallish money, the choice to depend on Ben Sheets for 2010 would amount to a classic high risk/reward strategy for Chicago. With lingering uncertainty offensively, why fill out a borderline contender with another player who brings along as much downside as Sheets would?
If one were to assess where the Cubs might struggle in 2010, you might start with starting pitching depth. With the likes of Tom Gorzelanny, Randy Wells, and good grief, Carlos Silva filling out the back end of the rotation, and with some injury concerns surrounding Lilly and Zambrano, I am not sure a flier on Sheets is the play. Make me in charge of Cubs personnel choices and I would opt for the guy I know will take the ball every fifth day and give the offense a chance to win the game. In my estimation, the right target for the Cubs would be Jon Garland.
Garland is by no means the superstar some might have thought he would become after his breakout 2005 campaign with the Chicago White Sox, but his 162-game career average of 208 innings at a 104 ERA+ clip could be just what the doctor ordered for a Cubs team searching for stability.
| Behind the Scoreboard | January 18, 2010 |
The Value of a Good Farm System
Baseball America's farm system rankings are one of the most respected rankings of a club's minor league talent around. Since 1984, they've been rating and ranking minor league systems in terms of their potential for major league impact. In this post, I try to determine just how much of an impact a team's farm system has on future performance.
Recently, the Baseball America came out with its December farm system rankings. Baseball America had the Houston Astros dead last, while the Rangers were ranked #1. If you're a Rangers fan, you might be smiling ear to ear, believing that the Rangers, who were also ranked #1 in 2009, would be poised for a long-term dynasty. Meanwhile Astros fans might despair, knowing that good young talent is not on the way.
But really, how predictive are these rankings? Does a good ranking actually lead to future success? If so, just how much?
To test this, I obtained Baseball America's organizational rankings from 1984-2010. I first transformed the rankings into a ratings, assuming that teams' minor league talent was normally distributed. This reflected the likely reality that the difference between having the #13 and #17 farm system is pretty small, but the difference between the #1 and #5 farm system is quite large. Transforming the ratings into normally distributed scores (which range from about -2.1 to 2.1) reflects this nicely.
I then used statistical regression to find the relationship between Baseball America ratings and team winning percentage. Doing a simple, single-term linear regression, it appears that the Baseball America rankings have predictive power for many years forward. One year's Baseball America ranking has a statistically significant effect on winning percentage for each of the next 8 years. As you would expect, those with higher rankings will tend to do better. If the only information you have is a team's 2010 Baseball America ranking, you would predict that a team with good rankings now will have an advantage come 2018.
But of course, we have more information than that. To really get at the heart of the matter, we need to take into account potential confounding variables. We can take these into account by using a multiple regression. To predict the next year's WPCT, significant important factors were:
a) WPCT from last year
b) WPCT from two seasons ago
c) Salary from this season
d) Salary from last season
e) Market size
Now, to test the effect of farm systems, we can add in the Baseball America rankings data. When we do, we get an interesting, yet difficult to interpret model, the results being the following:
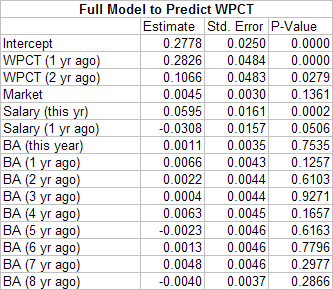
*market size was also transformed from a ranking to a normalized rating
**salary variables were expressed as a ratio of team salary to league-average salary
Clearly the salary and previous winning percentage variables are the main predictors of a team's success in a season, with market size close to significant. Less clear is the Baseball America rankings, which don't have a clear pattern. The years with most predictive power are the rankings from the previous season and from four seasons ago. Rankings from two years ago and from seven years ago show some predictive power, but not a lot. Meanwhile the other years show very little predictive power, with the effect being negative in some years.
The reason for this volatility of course is that the sample size is fairly small, so the estimates are not all that accurate. While using these weights would give the best fit, it doesn't seem to make sense that a BA ranking from one or four years ago would have much more predictive value that the BA ranking from two or three years ago. What does appear clear however, is rankings from the previous four years combined have a pretty strong correlation with WPCT, while rankings from after that time, on the whole, don't really a strong much effect.
My imperfect solution, then is to put the average of the previous four years of BA rankings into the model. When I do this, I get the following result.
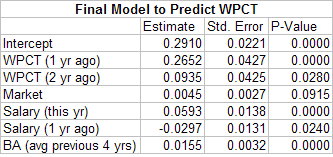
Overall, the values of the other terms are relatively unchanged, but we get a nice, highly significant, result for the Baseball America rankings. What does it all mean? Those ranked as the #1 farm system for the previous four years would get the maximum Baseball America score of 2.1. Multiplying 2.1 by .0155 gives means that it would be expected to add about .033 points to its WPCT in the next season. That translates to about 5.3 wins. Now five and a half wins is nothing to sneeze at, but it’s also not an enormous factor. Teams with weak farm systems do take a hit in future production, but it's certainly not insurmountable. The Astros, ranked last now for three consecutive years, figure to take a hit of 3.3 wins in 2010 and 4.4 wins in 2011. While that's certainly not desirable, there's no reason they still can't compete in the coming years, despite a poor farm system.
The model can be extended to predict values further into the future as well. Using only known, WPCT's, salaries, market size, and Baseball America rankings, we can build models for years down the road. For instance, using only known 2010 variables, how many wins does the #1 farm system provide in 2015? The models show that being the best farm system in 2010 correlates to about 4 extra wins in 2015.
The Rangers should feel good, but not get too overconfident, despite having the #1 system in both 2009 and 2010. The Rangers, who were ranked #1 in '09 and '10, were ranked #27 in 2008 and #15 in 2007. What do the models show the Rangers farm system producing over the next several years? The models predict the following boost in wins:
2010: 1.2 games
2011: 2.6 games
2012: 5.2 games
2013: 5.6 games
2014: 4.9 games
2015: 3.8 games
2016: 3.3 games
2017: 3.1 games
2018: 2.1 games
Since the Rangers' system was rated #27 as recently as 2008, the expected farm impact in 2010 is small. However, the impact increases dramatically starting in 2012. Overall, over the next 9 years, the Rangers farm system will likely net them 31 extra wins, meaning that while their system won't have a huge effect in any one particular year, it's likely to have a strong impact on the Rangers franchise over the next decade.
How about for their Texas counterpart, the Houston Astros? For them, the following 9-year outlook looks as follows:
2010: -3.3 games
2011: -4.4 games
2012: -6.0 games
2013: -5.6 games
2014: -4.9 games
2015: -3.8 games
2016: -3.3 games
2017: -3.1 games
2018: -2.1 games
For the Astros, it's nearly the opposite situation. Their farm system projects to cause them to lose over 36 games over the next ten years. So, is the difference between the Rangers and Astros farm systems really 67 wins over the next nine years? It would appear that way, although there are some caveats. For one, the year-to-year farm system rankings are correlated with one another, so the fact that the Rangers have a good farm system now is also indicative that they will have a good system in the future. That undoubtedly accounts for some of the large difference in wins. While the Rangers may not be still reaping fruit from their 2010 farm system in the year 2018, the fact that they have a good farm team now bodes well for their future farm teams, and hence their future major league teams.
Another factor to consider is how teams go about team-building. The fact that the Rangers have a good farm system means that they may be in strong contention in the next few years. With the team blossoming, this may spur the front-office to go out and sign free agents to supplement the team. Thus, the wins the future free agents provide are also correlated with the Rangers having a good farm team. While the Rangers may win more because of the free agents, this boost (reflected in these numbers) is not necessarily a direct product of having a good farm system in 2010.
For these reasons, I would hesitate to put a dollar value on having the #1 farm system in baseball vs. the #30 farm system in baseball - at least using this analysis. There are too many potential confounding variables here such as the ones I mentioned above. Still, if you are a fan, it matters little where your team's wins are coming from. Rangers fans really do have a reason to be smiling. While a handful of wins each year may not have a major impact, 30 wins over the next 9 season is a significant force. Whether the Rangers can parlay those wins into championships remains to be seen.
The following graph shows some trajectories for some of the more extreme teams in the league:
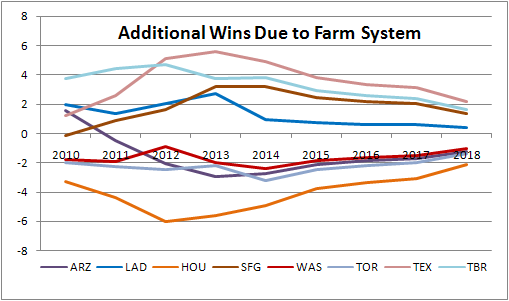
The results also are a testament to the accuracy and relevance of the Baseball America organizational rankings. While obviously a #1 ranking doesn't guarantee championships, the ranking is significant predictor of major league wins far into the future. Kudos to Baseball America for doing these rankings. Their well-respected reputation is well-deserved.
| Designated Hitter | January 18, 2010 |
Comparing the Performance of Baseball Bats
The game of baseball as played today at the amateur level is very different from the game I played growing up in Rumford, Maine in the early 1960s. In my youth, wood bats ruled. Nowadays, almost no one outside the professional level uses wood bats, which have largely been replaced by hollow metal (usually aluminum) or composite bats. The original reason for switching to aluminum bats was purely economic, since aluminum bats don’t break. However, in the nearly 40 years since they were first introduced, they have evolved into superb hitting instruments that, left unregulated, can significantly outperform wood bats. Indeed, they have the potential of upsetting the delicate balance between pitcher and batter that is at the heart of the game itself. This state of affairs has led various governing agencies (NCAA, Amateur Softball Association, etc.) to impose regulations that limit the performance of nonwood bats. The primary focus of this article is on the techniques used to measure and compare the performance of bats.
Any discussion of bat performance needs to begin with a working definition of the word “performance.” Or, said a bit differently, what is meant by the statement, “bat A outperforms bat B”? Among people who have thought about this question, a consensus has emerged that a good working definition of performance is batted ball speed (or simply BBS). Generally speaking, if you want to improve your chances of getting a hit, then you want to maximize BBS, regardless of whether you are swinging for the fences or just trying to hit a well-placed line drive through a hole in the infield. The faster the ball comes off the bat, the better are your chances of reaching base safely. So, we will say that bat A outperforms bat B if the batter can achieve higher BBS with bat A than with bat B.
Which then brings up the next question: What does BBS depend on? I answer that by writing down the only formula you will find in this article:
This “master formula” is remarkably simple in that it relates the BBS to the pitch speed, the bat speed, and a quantity q that I will discuss shortly. It agrees with some of our intuitions about batting. For example, we know that BBS will depend on the pitch speed, remembering the old adage that `'the faster it comes in, the faster it goes out.'' We also know that a harder swing—i.e., a larger bat speed--will result in a larger BBS. All the other possible things besides pitch and bat speed that BBS might depend on are lumped together in q, which I will call the “collision efficiency.” As the name suggests, q is a measure of how efficient the bat is at taking the incoming pitch, turning it around, and sending it along its merry way. It is an important property of a bat. All other things equal, when q is large, BBS will be large. And vice versa. For a typical 34-inch, 31-oz wood bat impacted at the “sweet spot” (about 6 inches from the tip), q is approximately 0.2, so that the master formula can be written BBS = 0.2*(pitch speed) + 1.2*(bat speed). This simple but elegant result tells us something that anyone who has played the game knows very well, at least qualitatively. Namely, bat speed is much more important than pitch speed in determining BBS. Indeed, the formula tells us that bat speed is six times more important than pitch speed, a fact that agrees with our observations from the game. For example, we know that a batter can hit a fungo a long way (with the pitch speed essentially zero) but cannot bunt the ball very far (with the bat speed zero). Plugging in some numbers, for a pitch speed of 85 mph (typical of a good MLB fastball as it crosses home plate) and a bat speed of 70 mph, we get BBS=101 mph, which is enough to carry the ball close to 400 ft if hit at the optimum launch angle. Each 1 mph additional pitch speed will lead to about another 1 ft, whereas an extra 1 mph of bat speed will result in another 6 ft. On the other hand, if the bat were a “hotter bat” with q=0.22, that would add 3 mph to BBS, adding a whopping 18 ft to a long fly ball.
The master formula tells us that the quantities that determine bat performance are the collision efficiency and the bat speed, leading us to ask our next question. What specific properties of a bat determine its bat speed and collision efficiency? There are two such properties: the ball-bat coefficient of restitution (BBCOR) and the moment of inertia (MOI). In the following paragraphs, I’ll explain what these properties are and how they contribute to bat performance. The interplay among the various quantities is shown schematically in the picture below.
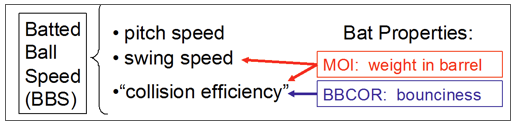
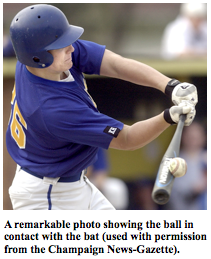 Let’s start with the BBCOR, which is a measure of the “bounciness” of the ball-bat collision. First a brief digression. During a high-speed ball-bat collision, the ball compresses by about 1/2 of its natural diameter and sort of wraps itself around the bat, as shown in the accompanying photo. It then expands back out again, pushing against the bat. During this process, much of the initial energy of the ball is converted to heat due to the friction from the rubbing of threads of yarn against each other. Try dropping a baseball onto a hard rigid surface, such as a solid wood floor. The ball bounces to only a small fraction of its initial height, reflecting the loss of energy in the collision with the floor. A wood bat with its solid barrel behaves more or less like a rigid surface. But a hollow aluminum bat is different since it has a thin flexible wall that can “give” when the ball hits it. Some of the ball’s initial energy that would otherwise have gone into compressing the ball instead goes into compressing the wall of the bat. The more flexible the wall, the less the ball compresses and therefore the less energy lost in the collision. This process is commonly called the “trampoline effect,” and the BBCOR is simply a quantitative measure of that effect. A wood bat has essentially no trampoline effect and has a BBCOR ≈ 0.50. Hollow bats can have a substantially larger BBCOR, leading to a larger q and a correspondingly larger BBS. For example, a bat with BBCOR = 0.55 will have about a 5 mph larger BBS. Indeed, the technology of making a modern high-performing bat is aimed primarily at improving the trampoline effect—i.e., increasing the BBCOR and consequently the BBS. For aluminum this is achieved by developing new high-strength alloys that can be made thinner (to increase the trampoline effect) without denting. The past decade has seen the development of new composite materials that increase the barrel flexibility beyond that achievable with aluminum, giving rise to a new generation of high-performing bats.
We now turn to the MOI, which depends on both the weight of the bat and the distribution of the weight along its length. For a given weight, the MOI is largest when a larger fraction of the weight is concentrated in the business end of the bat (i.e., the barrel). The MOI affects bat performance in two ways in that both q and the bat speed depend on it. A larger MOI means a larger q (and vice versa), in complete agreement with our intuition. A heavier bat will be more efficient than a light bat in transferring energy to the ball. But, contrary to popular belief, it is not the total weight of the bat that matters but rather the weight in the barrel, where the collision with the ball occurs. That’s why it is the MOI that matters and not just the weight. But a larger MOI also means that the bat won’t be swung as fast, which again agrees with our intuition. Once again, research has shown that it is the MOI of the bat and not just the weight that affects swing speed.
The fact that the MOI affects bat performance in two opposite ways raises an interesting question. If I have two bats with the same BBCOR but with different MOI, which one will have the larger BBS? For example, if I “cork” a wood bat, which reduces its MOI, will the resulting increase in swing speed compensate for the reduction in collision efficiency? Current research suggests that the answer is “no” and that corking a bat does not lead to a larger BBS. For a detailed account, see this article. By the way, corking a wood bat does have some important advantages, even though higher BBS is not one of them. By reducing the MOI, the batter will have a “quicker” and more easily maneuverable bat, allowing him to wait a bit longer on the pitch and to make adjustments once the swing has begun. So, although corking a bat may not lead to higher BBS, it certainly may lead to better contact more often.
For bats of a given length and weight, the MOI will generally be smaller for an aluminum bat than for a wood bat. After all, a wood bat is a solid object, so a larger fraction of its weight is concentrated in the barrel than for a hollow nonwood bat. Here is another simple experiment you can do. Take two bats of the same length and weight (e.g., 34”, 31 oz), one wood and one aluminum, and find the point on the bat where you can balance it on the tip of your finger. You will find that the balance point is farther from the handle for the wood bat than for the aluminum bat, showing that a larger concentration of the weight is in the barrel for the wood bat. However, keeping in mind the corked bat discussion, the lower MOI for an aluminum bat results in no net advantage or disadvantage for BBS. The real advantage in BBS of aluminum over wood is in the BBCOR (i.e., the trampoline effect).
Let’s talk briefly about how bat performance is measured in the laboratory. Details can be found at this web site. Briefly, the basic idea is to fire a baseball from a high-speed air cannon at speeds up to about 140 mph onto the barrel of a stationary bat that is held horizontally and supported at the handle. Both the incoming and rebounding ball pass through a series of light screens, which are used to measure accurately its speed. The collision efficiency q is the ratio of rebounding to incoming speed. The MOI is measured by suspending the bat vertically and allowing it to swing freely like a pendulum while supported at the handle. The MOI is related to the period of the pendulum. Once q and the MOI are known, these can be plugged into a well-established formula to determine the BBCOR. To calculate BBS, the master formula is used along with a prescription for specifying the pitch and bat speeds, the latter of which will depend inversely on the MOI.
Various organizations use this information in different ways to regulate the performance of bats. The Amateur Softball Association regulates BBS, using laboratory measurements of q and MOI along with the prescriptions noted above to calculate BBS using the master formula. For the past decade, the NCAA has regulated baseball bats by requiring that q is below some maximum value and the MOI is above some minimum value, the latter limiting the swing speed. Together the upper limit on q and lower limit on the MOI effectively limit the maximum BBS. The maximum q is set to be the same for nonwood as for wood. The lower limit on MOI is such that the best-performing nonwood bat outperforms wood by about 5 mph. You may have seen the words “BESR Certified” stamped on NCAA bats. The BESR is shorthand for the Ball Exit Speed Ratio; numerically, BESR = q + 1/2. Starting in 2011, the NCAA will instead regulate the BBCOR, taking advantage of the fact that for bats of a given BBCOR, the BBS does not depend strongly on MOI. Moreover, the NCAA has set the maximum BBCOR to be right at the wood level, so it is expected that nonwood bats used in NCAA will perform nearly identically to wood starting next year.
Alan Nathan has been a Professor of Physics at the University of Illinois since 1977. His research specialty is experimental nuclear/particle physics, with over 80 publications in scientific journals to his credit. He is a Fellow of the American Physical Society. For the last decade he has added the physics of baseball to his research portfolio and has written numerous papers on the subject for scientific journals, primarily on the physics of the ball-bat collision and the aerodynamics of baseball in flight. In addition, he has given many talks on the subject to both scientific and popular audiences and maintains a "physics of baseball" web site that is visited frequently. He is Chair of SABR's Baseball & Science Committee and a member of the scientific panel that advises the NCAA on issues related to bat performance.
| Change-Up | January 17, 2010 |
Jim Hendry's 2010 Strategy: Play Better
A few months back I wrote a piece on the Cubs and the merits of inaction. Sometimes when it's not your year, the best moves are the ones you don't make. Chicago battled injuries and under-performance all season long, and stumbled their way to a disappointing 83-win season.
Prompted in part by this piece from David Cameron at Fangraphs, I now realize that I had not thought through the Cubs roster and how they might project for 2010 properly. The gist of my piece was that, with their rock-solid pitching, bounceback seasons from key players could well be enough to catapult them back to the top of the National League Central. The problem, of course, is that their pitching is unlikely to hold up as well as it did in 2009.
Now, it's one thing for a guy who follows and roots for the Cubs from a distance to make a mistake of this nature. It's another thing entirely for the individual tasked with making sure the best Cubs roster possible takes the field on Opening Day to make a similar error. Consider the following remarks by Jim Hendry from yesterday's edition of suburban Chicago newspaper the Daily Herald:
"We have to have our best players play like they're our best players, and that's something they didn't do that last year,'' Hendry said in a quiet moment amid the insanity of the Cubs Convention. "We had five guys have terrible years all in the same year at the same time, and you don't figure that to happen, but it sure happened to us.''
One of the players Hendry identified was Carlos Zambrano.
"It would be huge for us if he does what he's capable of doing, which is 18-20 wins with a lot of innings and a lot of quality starts,'' Hendry said. "The good thing is he's upset about it. He knows it wasn't a good year and he says he's mad about it.
And you knew this one, a favorite of Craig Calcaterra's, was coming.
"He's also in better shape than I've seen him, so that's a real good sign.''
Of course he is. Anyway, in one sense Hendry is spot on. Leaving aside Zambrano for a moment, let's assume Hendry is referring to Alfonso Soriano, Milton Bradley, Aramis Ramirez and Carlos Marmol. Soriano has $90 million left on his contract, and turned in a .241/.303/.423 year in 117 games last year. It's safe to say Chicago needs more from their left fielder and should get a lot more output in 2010. Bradley has been shipped off to Seattle and replaced with the more dependable but less talented Marlon Byrd. Ramirez was excellent, but in only 342 plate appearances. Marmol struggled with his control all season long. You could also toss Geovany Soto in there, too. Chicago's backstop figures to be much better in 2010. So, yes, the Cubs will need better play from these roster spots and should be able to count on it.
For Cubs fans, though, there are a couple of red flags in Hendry's thinking as revealed by these comments. The first is that he thinks Zambrano was a problem for the Cubs last season. But when you look at Zambrano's career numbers, 2009 seems right in line. He threw fewer innings than you'd ideally like (169.1) and his walk rate was up but the rest of it was a typical Zambrano season. In fact, his strikeout rate was up too, and Fangraphs had Zambrano at 3.6 Wins Above Replacement (WAR), his best total since 2006. If the bedrock of an improved Cubs team in 2010 is a drastic uptick in Zambrano's output, then they're already in a hole.
The second problem with Hendry's thinking, and the one I alluded to at the outset of this piece, is the notion that the rest of the team will just stay constant while the disappointments from 2009 pick up the slack. Let's start with the starting pitching staff, an impressive 2009 unit that returns in place aside from Rich Harden. With rumors of an imminent Ben Sheets signing swirling, for our purposes, let's assume similar output from Sheets (or Gorzelanny) as the 2009 Harden. For the other four, here are their 2009 ERA's, 2009 xFIP (a fielding-independent and more accurate and predictive measure of actual pitching quality), and their 2010 CHONE and MARCEL projections.
              2009              2010
           ERA    xFIP     CHONE    MARCEL
Dempster  3.65    3.81     4.12     3.76
Lilly     3.10    3.98     4.21     3.73
Zambrano  3.77    4.27     4.28     3.84
Wells     3.05    4.24     4.53     3.66
The Cubs team ERA+ was 117 in 2009, good for 2nd best in the National League. Their starters' ERA was 3.71, another excellent figure. In 2010, Chicago's pitching will not be as good. Three of the four pitchers listed above figure to under-perform their 2009 levels, and don't even get me started on what happens if Carlos Silva starts to take a regular turn. It's a good pitching staff, but I don't see it as one of the league's very best the way it was in 2009.
Offensively, because 2009 was such a disappointment for the Cubs, it's easy to forget just how good Derrek Lee was last year. At age 33, he hit .306/.393/.579 while in his 30-32 seasons, from 2006 to 2008, he hit .301/.378/.485. As you might imagine, projections have him closer to those levels for 2010. While the Cubs offense figures to improve year over year, it figures to do so in spite of lost production from Lee.
=========
One of the most common themes in year-end performance self-evaluations at companies across America and around the world is the tendency to overstate successes and gloss over or ignore failures. Hendry's comments are not entirely analogous, but you can see a similar phenomenon taking hold. He's glossing over the great performance the Cubs got from their starting pitching in 2010. Ted Lilly and Derrek Lee were two of the very best players in baseball last season. He's brushing off the bad seasons in 2009 as though they were somehow fluky, but is someone like Soriano a guarantee to come back strong in 2010? How he thinks he's getting more out of Zambrano is beyond me. It seems like Hendry does not want to own some of his roster failures.
The best teams project future performance through an honest assessment of successes and failures, what's predictive and what's not. Taking the successes from a given season, penciling them in for the next season and banking on disappointments to return to form is a sure way to stay a few steps behind the teams more dynamically and realistically striving to improve.
| F/X Visualizations | January 15, 2010 |
The Tigers and Pirates Sign Probable Closers
Yesterday the Tigers and Pirates signed their probable closers. Both teams had question marks at the back-end of their bullpens and found free agents who should have no problem sliding in to the closing roles.
Octavio Dotel
The Pirates -- who had non-tendered Matt Capps leaving their closer position empty -- signed Octavio Dotel. Using a fielding-independent pitcher-evaluation framework that gives pitchers credit for strikeouts, ground balls and avoiding walks (a framework Rich used to rank pitchers back in February), Dotel succeeds in spite of giving up a lot of walks and not getting many grounders by striking out just under 11 batters per nine innings.
Although he also throws a slider and curve ball, Dotel throws his fastball almost exclusively. Last year he threw it over 82% of the time and you have to go back to 2003 to find a year he threw it less than eight times out of ten. Relievers who throw a fastball that often usually bring the heat -- think David Aardsma, Mike MacDougal or Matt Thornton -- but Dotel's fastball averages just 92 MPH. In fact among the ten relievers who throw a fastball most often Dotel has the slowest fastball.
Still this slow fastball is very good . Batters miss a quarter of the time they swing at it, compared to an average whiff rate of just 14%. The result is that over the past three years he is in the top fifteen among relievers for whiff rate (or the lowest fifteen for contact rate).
Part of the reason for this is Dotel pitches up in the zone where batters whiff more often, though rarely hit grounders. I broke the zone into bins and compared the fraction of his fastballs in each bin to the average RHPs fastball to RHBs, the more red the color represents bins where Dotel throws fastball more frequently and the blue less.
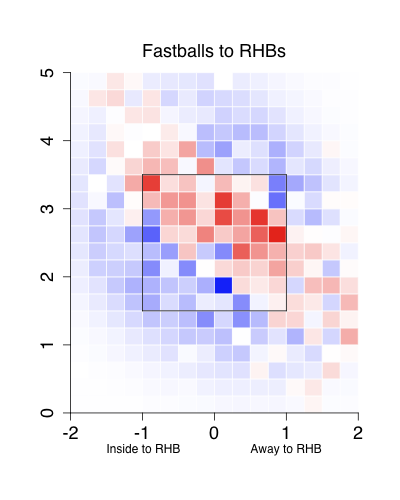
Dotel has a consistent swath, from up-and-in to down-and-away, where he throws his fastball. In that swath he throws the ball more often than the average righty and outside he throws the ball less. This is a pretty good place to be, as up-and-in and down-and-away are the most successful locations for a fastball.
The Pirates get a very good relief pitcher in Dotel: his career ERA out of the pen is 3.11, supported by a FIP of 3.36. This should make him a solid closer. (Thanks to Rich for noting my error, including his innings as a starter in his ERA, here.)
Jose Valverde
Valverde has a good pedigree of closing games for the Diamondbacks and then the Astros. He should take the Tigers' closing role, as they had three flame throwers, Ryan Perry,
Valverde is a little bit better than Dotel. He strikes out just as many batters but is a little better at limiting walks and gets a few more grounders, though still is predominately a fly-ball pitcher.
Valverde brings the heat with a 96-mph fastball, but mixes in a splittler which he throws about a quarter of the time. The splitter is a very good pitch. He throws it slightly more to lefties, and the pitch, like a changeup, has a very small platoon split. In fact over the past three years -- before that he did not throw it as often -- he has had small to negative platoon splits.
Also, while his fastball is an extreme fly-ball pitch, getting just 31% balls in play on the ground, the splittler, which 'sinks' in comparison to his fastball and is thrown lower in the zone, gets 57% ground balls per ball in play. So the pitch keeps him from being as extreme a fly-ball pitcher as Dotel.
Valverde is also a very good relief pitcher, he solidifies the back-end of the Tigers bullpen and should be a good closer. Still some found the price, a two-year 14-million dollar deal and a draft pick, a little high.
| Touching Bases | January 14, 2010 |
Pitch Counts and Pitch Classifications
Consider this part two to my study on pitch counts and pitchf/x.
The first time through a lineup, pitchers traditionally throw fastballs, and then switch to off-speed pitches when facing batters a second time. In order to isolate the effects of pitch counts on a pitcher's stuff as opposed to his pitch selection, I had to classify a whole lot of pitches. That was fun.
There were about 5,000 games in which a pitcher threw 100 pitches during the pitchf/x era. These pitchers performed admirably to have lasted that long into a game, so this sample won't be representative of all, or even most, starters. To illustrate the point that pitchers mix up their repertoire over the course of a game:
Six pitches are regularly thrown throughout any given game. The four-seam fastball (F4) belongs in most every pitcher's repertoire, though some sidearmers or sinkerball specialists will only throw fastballs of the two-seam variety (F2). These two pitches are often difficult to distinguish from one another, be it by the human eye, or by the detailed pitchf/x data. Cut fastballs (FC) are also difficult to make out at times from four-seamers and sliders at times. Sliders (SL), curveballs (CB), and changeups (CH) increase in usage over the course of the game. Knuckleballs and splitters are thrown only one or two percent of all pitches, so I won't include them in this study, and I made no attempt to classify screwballs, shuutos, or gyroballs, since I'd guess they compose about .001% of pitches in the last three years.
Perhaps some pitches are more useful later in the game than others. In theory, all pitch types should have the same effectiveness. Game theory would dictate that if a pitcher's curveball is better than his fastball, he should throw his curveball so often that batters come to expect it. Therefore his fastball gains value. Eventually, the two pitches become equal in terms of overall effectiveness. For one reason or another (maybe there is credence to the notion of the "out pitch"), this theory does not hold true for many pitchers, or at a league-wide level. The run value of fastballs is higher than the run value of breaking balls, which would signify that pitchers are under-using their secondary pitches. (Keep in mind, the main advantage to using run values is that they take the count into account.) As you will see in the below image, this trend narrows, but still exists, even as pitchers use more off-speed offerings deeper into the game.
All run values per 100 pitches.The high points and low points in the graph represent the high points and low points in the opponent's batting order.
It seems to me that changeups are ineffective pitches at the start of the game, but gain effectiveness later in the game. This makes sense intuitively. The graph also lends merit to the manager's decision to leave these pitchers in for 100 pitches, as the sample of pitchers is clearly above average through 90 pitches. However, these pitchers were also undoubtedly lucky. They would not make it to 100 pitches if they gave up runs. That's where my metric for measuring a pitcher's stuff based on a pitch's physical characteristics comes into play.
First, the two least impressive types of pitches in terms of stuff: the sinker and changeup.
As you'll see with each of these charts, there's something funky going on in the first several pitches of the ballgame. I'm not even going to attempt to form a guess as to why changeups appear to have a better StuffRV as the game goes on. The success of changeups is obviously not built on how "nasty" they are.
Again, for some reason, we should disregard the first dozen points or so. Pitchers throw fastballs an inordinate amount of time on the first pitch, and apparently, anything they throw lacks in stuff. They're warming up or something. Maybe they know batters tend to not swing at the first pitch of the game. I don't know. But you see that with all three types of fastballs, from the tenth pitch to the hundredth, a pitcher loses about a 10th to a 20th of a run in StuffRV per 100 pitches.
Finally, breaking balls.
So, even pitchers who have successful games lose a significant amount of stuff over the course of a game. Since this sample represents an above average group of pitchers, I'd imagine lesser ones deal with inferior durability. I would be comfortable saying that the quality of a generic starting pitcher's stuff decreases by at least .05 runs per 100 pitches from his first pitch to his last.
| Crunching the Numbers | January 13, 2010 |
Why You Shouldn't Bet on Baseball
Alternative title to this post: Why Tango Tiger still has a day job
I really enjoyed the feedback to my last article on why umpires should be biased in favor of control pitchers. Most of the folks with a solid statistical background responded favorably, while the unwashed masses thought I was ridiculous and should be run out of the blogosphere on a rail. (Perhaps I don't give the detractors enough credit; if they were washed and educated, then it was an equally entertaining Ask Marilyn-esque experience.) Anyhow, I thought I'd repeat the experience by picking on another low hanging fruit: betting on baseball games. I know a fair number of people who bet on sports. They don't understand that betting on sports is an investment in entertainment, not a viable means of turning baseball knowledge into cold hard cash. This post should be far less iconoclastic than the biased umpire post, but the central point doesn't appear to be widely known.
So here's the skinny: you should not bet on baseball. In the long run, you'll lose. No model that you can develop can be anticipated/demonstrated to beat Vegas. I don't care how good you (think you) are. I don't care how much you think any given line is outrageous. You can't be expected to win. You might think (as I did) that many people who bet on baseball may make poor predictions, and that the intelligent bettor may be able to profit off of them. You'd just have to be better than the average bettor, right? Wrong. I'd argue that Vegas profits off of these folks (because they set the lines), but the rest of us shouldn't get involved.
A couple caveats: First, I've been recording the Vegas odds for a couple years, and have analyzed data for 2007 and 2008. I forgot to download them this year before they disappeared off of the web service I use, so I don't have this year's odds. But I'd be happy to wager that nothing has changed because the system Vegas uses hasn't changed. Second, I am only looking at betting on who wins individual games; there are a number of other bets one could place, and maybe you could make money betting on which pitcher is most likely to start the top of the 7th inning, or which batter is likely to adjust their cup first. I'm not touching those wagers.
In 2008, Vegas came really close to being perfect. The variance between the actual outcome of all regular season games and Vegas' prediction for those games was within the range that one can attribute to random chance. If we start by assuming that Vegas' lines perfectly reflected the likelihood of each team winning each game, the variance between the predictions and the actual outcomes would be greater than it was in 2008 75 percent of the time.
That doesn't mean that Vegas is 75% likely to be perfect. We'd have to go all Bayesian and start assuming silly things to figure out precisely how good Vegas really is. But think about that statistic: if Vegas were perfect, they still would have had a 75% chance of making a worse set of predictions than they did in 2008. So somehow, by hook or by crook, they made some ridiculously accurate predictions in 2008.
It is still possible that the bookmakers got lucky, and that there is money to be made in betting on baseball. So I ran a couple more simulations. According to my numbers, it is crazy unlikely (p<.01) that Vegas is off more than 4% per game. This is because almost all baseball games have a true home-win probability of somewhere close to 50%. Even when the Yankees meet the Royals, the odds aren't far from 50%.
So let's run with my rough estimate that Vegas is off by no more than 4%. In order to make money betting on baseball, you'd have to do better than that. You won't make money if you're just better at chance (i.e., by picking the Yankees every time, or picking the home team every time). If you matched their 4% inaccuracy, you'd lose money a little more often than you won money (on a year-by-year basis). If you barely beat the 4% inaccuracy, with, say, 3.8% inaccuracy, you'd be expected to make a little money each year, but the likelihood that you would lose money each year would still be very high. If you removed 25% of the error in Vegas' estimates, so that your estimates deviated from the true probabilities by 3%, you'd make a profit 73% of the time (again, on a year-by-year basis...so 2-3 years out of every ten, you'd net a loss), for an average return of 3 cents on the dollar. I make more than that in my checking account (granted, it's a great rate for a checking account, but still...).
There are enough variables out there that there's a distinct possibility that I'm wrong. If you have the data to demonstrate that you can win reliably, I'd like to see it. But until then, I'm sticking with the numbers, which say that Vegas is really, really good, and you'd have to be considerably better (25% better) to even make a decent return on your investment.
I also have a novel answer to the question: "If you're so smart, why aren't you rich?" Because I'm smart enough to know it's a scam. Flame away :)
Update 1/14/2010
Following this post, there were a number of replies, mostly harsh ones. I expected nothing less, since there are far more people invested in baseball betting being a sound investment than the alternative. In fact, I was hoping for it; my initial analyses were run to see how large the margin for potential profit was for my own practical purposes. In the comments, I promised that if someone posted verifiable data that demonstrated that I was wrong, I would say so. I'm going to relax that standard and give Umaga credit for making a reasonable argument that I found convincing along with his own purported ROI.
Based on responses like those made by Umaga, I'll change my position: (1) No one can make money betting on the closing line, or lines that end up looking very similar to the closing line; (2) if you can predict which opening lines are particularly poor, and you bet early enough, you may be able to make money. In summary, I'd say that there are a small few (yes, likely financial quants, or ex-quants) who can leverage the peculiarities in the system to make money. I have no data for this, but I'm convinced that it's true. But for a vast majority of people, betting on something that looks like the closing line, you're not likely to make money.
Some have commented that a bookmaker's job is to balance the books, and to some extent to exploit known biases in bettors (such as to exaggerate the probability of a favorite, like the Yankees, to win). The story is that this pushes the moneyline away from the "true" probability of each team winning, creating a margin for people to put "smart money" in. I'm fully aware of how these lines are set, and how they change, but it doesn't change the story. If there are any biases such as these, the "smart money" is completely canceling them out. We know this because the closing line is as close to being a perfect measure of game outcome as is practically possible. It does not show the systematic bias that we would expect to see. Thus, if a bettor is going to exploit this, he would have to do so early, before the line drifts towards the closing line.
Others commented that I was being dense, and that "of course" the moneyline makes a "ridiculously good prediction" of game outcome. They argue that baseball betting is essentially a prediction market for baseball game outcomes. These comments absolutely miss the point: (1) a prediction market is not guaranteed to converge at a perfect prediction; (2) even if it *did* converge to the perfect prediction, the 2008 closing lines were better than you would expect a perfect prediction system to be 75% of the time. Kyle is wrong when he says "of course" bookmakers are that good; by random chance we would expect them to be measurably worse even if we predictive markets to converge to a perfect prediction (which seems to be Kyles other point, which, of course, is some combination of silly and naive).
The reason is this (in answer to TomC's question): every baseball game is a Bernoulli trial, that is there are two possible outcomes, home team wins and away team wins. There is a probability, p, that the home team wins, and a probability, q=1-p, that it loses. Thus, each baseball game is essentially a weighted coin flip. A perfect prediction system would have access to the "true" probability of each team winning (p and q). If you were to bet on whichever team has the greatest chance of winning, the outcome of your bet would also be a Bernoulli trial. This means that the variance between your optimal guess and the actual outcome has a known distribution: a binomial distribution. If we know the number of games we bet on, and we know the true odds of winning each of those bets, we can calculate a probability distribution for the variance between the actual outcome and our optimal guess. Thus, we can say things like "There is a 75% chance that the variance between our optimal guess and the actual outcome is less than some number, k."
In 2008, the variance between the bookmakers' closing line and the actual outcome was very small. In fact, it was less than we would have expected by chance 75% of the time.
What does that imply? If you were betting on the closing line, and you had perfect access to the true probability of each team winning, you would still have a 75% of being outperformed by (the average) bookmakers in 2008. If you can't outperform the bookmakers, you can't make money. Thus, you can't play the closing line, or lines that end up being similar to the closing line, and win.
But Umaga's point is a good one and well taken: I said both that you can't make money betting on baseball, and that you can't make money betting on the closing line. But these two claims are not equivalent. In the end, I'm convinced he is correct: I'll stand by the latter claim and back off of the former. You can't make money on the closing line, but you may be able to make money on the opening line or rogue lines (of which there are many). According to this story, making money on sports betting requires the bettor to be clever and look for opportunities to exploit, because the predictive market is really good. So for the vast majority of the sports bettors out there--the ones who don't have MBAs; who haven't had quant jobs at hedge funds; and who don't try to jump on opening lines before they drift away--those folks are buying entertainment every time they bet on a game.
Lastly, I'll point out that since bookmakers take a percentage of the action, this isn't even a zero-sum game; it's a negative sum game. One commenter, Garrett Weinzierl, doesn't like the implication that sports bettors are "all sailing off the edge." But since this is a negative-sum game, most bettors are sailing off the edge. For this system to work, most have to be sailing off of the edge. If you're a sports bettor, I'm not saying you're sailing in the wrong direction. Only Garrett knows where his boat is going. But if you're not at risk for going over an edge, you're an exception to the rule.
| Baseball Beat | January 12, 2010 |
Big Mac's Attacks
The big news on Monday was the admission from Mark McGwire that he used steroids on and off for a decade, including the 1998 season when he slugged 70 home runs and broke the then single-season record of 61 by Roger Maris in 1961.
Everybody seems to have his or her take on the subject (check the sidebar for news, analysis, video, and audio). As a general rule, we don't feel the need to weigh in with our opinions on such matters. But, in this case, I have a few thoughts that I'd like to share.
 My first is a tongue-in-cheek question. Based on the photo at left, which one of us do you suppose was on steroids when this photo was taken in October 1998? It wasn't I. But, then again, I never had the God-given talent and hand-eye coordination that he spoke about yesterday. Nevertheless, how many people other than Kerry Robinson can say they pinch hit for Big Mac?
On a more serious note, McGwire, in a statement prior to his interview with Bob Costas on MLB Network, said: "I used steroids during my playing career and I apologize. I remember trying steroids very briefly in the 1989/1990 off season and then after I was injured in 1993, I used steroids again. I used them on occasion throughout the '90s, including during the 1998 season. I wish I had never touched steroids. It was foolish and it was a mistake. I truly apologize. Looking back, I wish I had never played during the steroid era."
McGwire finally admitted that he used steroids. Great, it's over and all is forgiven, right? Apparently not. You see, the same critics who begged him to come clean are now upset that he didn't say something like the following: "By taking steroids, I hit 15 to 20 more home runs per season than I would have otherwise. I never would have broken the single-season record nor hit 500 for my career had I not been juiced."
I mean, get real folks. The truth of the matter is that nobody really knows for certain how much steroids helped, if at all. Maybe they did. Maybe they didn't. The whole subject is nothing more than just speculation at this point. It is what it is.
Look, I'm not naive. Steroids added muscles and bulk to McGwire's frame. The added strength probably allowed McGwire to hit a baseball farther. Hitting a baseball farther meant McGwire's long fly balls were more likely to clear outfield walls. Ergo, steroids probably resulted in McGwire slugging more home runs than he would have hit otherwise. Do we really need Mark to spell that out for us in that manner?
I'm also not here to apologize for McGwire. But goodness gracious. The guy admitted that he used steroids. He apologized. He said it was a mistake. He apologized again (and again). But, as Joe Posnanski tweeted: "People SAY they're forgiving but apologies never seem to go far enough for them." Or, as Rob Neyer noted of Big Mac's accusers: "Before Admission: 'I won't vote for McGwire until he admits it.' After: 'I won't vote for McGwire because he didn't admit it RIGHT.' Sheesh."
Rob, in fact, has had the single-greatest take on the record books for a long time: "In the vain hope of forestalling a ridiculous discussion, may I mention (again) that 'record books' simply 'record' what happened on field?" As it relates to the steroids era, McGwire (and others) hit those home runs and the record books simply recorded them. Nothing more. Nothing less.
Barry Bonds hit more home runs in a MLB single season and career than anybody else. That is a fact. It doesn't mean that you have to accept that Bonds is the greatest home-run hitter of all time. A judgment like that is subjective.
Babe Ruth held the single-season and career record for decades. However, he never competed against black players. Maris broke his single-season record in an expansion year when the American League diluted itself by adding two new teams. It took Hank Aaron 2,000 additional plate appearances to break Ruth's lifetime record. McGwire and Bonds broke home-run records during the steroids era.
Travel conditions have changed over the years. The same thing goes for equipment. Training and nutrition have improved. Ballpark dimensions have never been universal. Games are played in various cities with different altitudes, weather, and wind patterns. Strike zones and the height of the mound have been altered to fit the times. Day games. Night games. Doubleheaders. No doubleheaders. Designated hitters. Four-man rotations. Five-man rotations. Bullpen usage. Left-handed relief specialists.
The game of baseball has evolved over the past century-and-a-half. Some might think for the better. Some might think for the worse. Color barriers. Betting scandals. Spitballs. Expansion. Free agents. Corked bats. Amphetamines. Cocaine. Steroids.
OK, that was more than a few thoughts. But I just couldn't sit back and take the lectures any longer. If these gatekeepers are going to block McGwire and Bonds and Roger Clemens (and others) from the Hall of Fame for partaking in steroids, are they now going to kick out previously enshrined players who used amphetamines, the performance-enhancing drugs of the late 1950s, 1960s, and early 1970s? There's no need to mention names here but c'mon. These greenies were readily available in all locker rooms and players could reach into a jar or bowl and take a handful of these uppers before, during, or after a game, apparently endorsed by management and ownership alike.
Let's hear it from the level-headed Rob Neyer on the subject of the steroids era and the Hall of Fame:
It's not at all clear that McGwire will someday be elected to the Hall of Fame. On the other hand, it's fairly clear that the Hall of Fame will not be much of a Hall of Fame if, 20 years from now, many of the best players of the 1990s have been left out. It's fairly clear that someone will eventually realize that the players of the 1990s were a product of their times. And once someone realizes Barry Bonds and Roger Clemens belong in the Hall of Fame, it won't be easy to maintain the position that Mark McGwire does not belong.
Other than perhaps trying to minimize the effects of steroids (including emphasizing the "low dosage," which was unnecessary), most everything else McGwire said seemed not only reasonable but genuine to me. I hope we can get past the self righteousness and, with new regulations and testing in place, move on to the post-steroids era.
| Behind the Scoreboard | January 12, 2010 |
Biases of Hall of Fame Voters
Last week over at Sports Illustrated, I wrote an article on the biases of modern Hall of Fame voters. In it I highlighted five ways that Hall of Fame voters either overrated or underrated candidates. While, I provided mostly anecdotal evidence at SI, here I'll use a statistical approach to analyze whether or not my hypotheses were true (and what else I may have missed).
My goal here is to determine if voters are underrating or overrating certain types of players. But to do so, first I need to determine how to define the true "value" of each player. For example, if I say a particular player is overrated, what is the gold standard which defines how voters should consider a player?
Here I choose to use career Wins Above Replacement (WAR), taken from Rally's WAR database. Rally's WAR considers all aspects of a player's performance, including hitting, defense, baserunning and pitching, and by all accounts gives a pretty accurate picture of a player's contributions.
If the Hall of Fame voters are completely unbiased, they will simply use WAR and only WAR to consider a player's credentials for the Hall. My goal here is to determine empirically, what factors apart from WAR contribute to a player's Hall credentials - in other words how are Hall of Fame voters biased?
To set up the problem, I took all players eligible for the Hall of Fame going back to 1986. I then put them into five categories:
1. HoF on first ballot,
2. HoF in 2-4 years,
3. HoF in 5-15 years,
4. >5% of vote, but did not make HoF
5. <5% of vote on first ballot
I then used a multiple logistic regression to model the players' chances of falling into each of these categories. Obviously, the model included a player's WAR. However, the goal was to see if the model had any other significant variables. Significant variables besides WAR, would show a Hall of Fame voter bias.
Hitters
For hitters, a reduced model broke down as the following (here shown for the probability of making the Hall of Fame at all):
Probability of HoF = exp(a)/(1+exp(a))
where a is equal to:
(-38.5 + .172*WAR - 75*BB_RATE + 94.4*BAV + .0032*PA + 57.9*HR_RATE)
Here we see that, obviously, the more WAR, the better. However, what we also see is a positive bias for batting average, homerun rate, and for the total number of plate appearances. This indicates that Hall of Fame voters are biased towards guys with high batting averages who hit a lot of homeruns. In other words, voters overvalue these statistics in their evaluations. However, we see a strong negative bias towards a player's walk rate. This indicates, that players who walk a lot are being unfairly punished by Hall voters. These findings pretty much confirm what is expected. Hall voters have the same biases that most mainstream media do, in undervaluing walks and overvaluing batting average.
RBI rate, while not significant in this model, is significant if homeruns are removed (the two variables are fairly correlated). As one would expect, RBIs also are overvalued by Hall of Fame voters.
Interestingly, Hall of Fame voters are also biased towards players who have long careers. I had expected voters to possibly have a bias toward high peak performance, but instead the voters seem to have the opposite bias. They overvalue a player's longevity, rewarding mediocre and bad years from players and undervaluing peak performance. In other words, Hall Voters set the bar for replacement level too low.
Pitchers
For starting pitchers, we get an entirely different model of course:
Probability of HoF = exp(a)/(1+exp(a))
where a is equal to:
(-39.8 + .037*WAR + 40.2*WPCT + .053*Wins)
In this case, the model boils down to three key variables. As you'll notice, WAR is not a very important factor in the model. In fact, with a p-value of .37 it is not even significant! Highly significant however (p-value <.003) are a pitcher's winning percentage and career wins. In fact, these seem to be the only two variables necessary to predict Hall of Fame induction. ERA, strikeout rate, and other factors are not necessary (at least with this dataset, though it may be noted that we haven't had a short career Koufax-type pitcher inducted in the last 25 years). Obviously the message is clear, a pitcher's wins and losses are vastly overrated by Hall of Fame voters. Again, Hall of Fame voters overvalue a long career (wins is a more significant proxy for innings pitched). Surprisingly, a voters are not only biased towards wins and losses, but these statistics almost totally replace the pitcher's true WAR value as predictors.
Relievers
As for relievers, the dataset was fairly small, however, here are the results:
Probability of HoF = exp(a)/(1+exp(a))
where a is equal to:
(868.4 + .181*WAR-.446*First_Year + .022*Saves)
For relievers, I added a term for the year in which a player started his career. This year variable had a p-value of .06, indicating that voters may have given early relievers an advantage for "pioneering" the role of short reliever. Saves were only marginally significant with a p-value of .11, however, the effect appears to be positive. Since there are relatively few relievers enshrined or even considered for the Hall of Fame there is not a lot of power to figure out what's going on.
Hitters vs. Starters vs. Relievers
Another effect, not seen in the above models is the bias between hitters, starters, and relievers. Doing another model including only WAR and a dummy variable indicating whether the player was either a position player, starter, or reliever, shows strong differences between the three groups.
The results? In order to have a 50% chance of making the Hall, a reliever has to only amass 43 WAR. For a position player, he has to amass 59 WAR, while a starting pitcher has to amass 72 WAR. Here we see a big difference in the standards set up for each of the three roles. Although only four modern relievers currently occupy the Hall of Fame, voters have been giving relievers a break. Meanwhile, starting pitchers have been getting the shaft. For starters to make the Hall, they must provide more value to their teams than a position player does.
A similar analysis of just position players broken down by type of position, shows that those in "fielding positions" (2B, 3B, SS, C) have it tougher than those in "hitting positions" (OF, 1B, DH). This seems to agree with the common perception that outfielders are overrepresented in the Hall of Fame, while players such as third basemen have a tough time.
Conclusions
In all, the empirical analysis shows the following:
1) HoF voters undervalue walks (p-value .001)
2) HoF voters overvalue batting average (p-value .001)
3) HoF voters overvalue longer careers (p-value .001)
4) HoF voters undervalue starting pitchers (p-value .001)
5) HoF voters overvalue relief pitchers (p-value .001) though this bias seems to be decreasing
6) HoF voters overvalue Wins and Losses for pitchers (p-value .003)
7) HoF voters undervalue players at defensive positions (p-value .005)
8) HoF voters overvalue homeruns/RBI (p-value .06)
Fun Stuff
While, it's not the point of the exercise, you may be wondering about the values predicted for each player. To satisfy your curiosity here are the following breakdowns in order of likelihood of making the Hall of Fame:
Likely (80% or higher)
Henderson
Schmidt
Eckersley
Ripken
Carew
Brett
Jackson
Boggs
Molitor
Rose
Seaver
Yount
Gwynn
Carlton
Murray
Morgan
Dawson
Winfield
Sutton
Palmer
Gossage
Neikro
Ryan
Fingers
Probable (50-80%)
Fisk
Alomar
E. Martinez
Perez
Puckett
Sandberg
L. Smith
Rice
McGriff
W. Clark
Blyleven
Larkin
Unlikely (10-50%)
John
Dw. Evans
Trammell
Parker
Burks
Whitaker
McGraw
Raines
Carter
M. Williams
Morris
B. Bell
K. Hernandez
Oliver
Garvey
Baines
Sutter (8%)
*Ozzie Smith was removed from modeling, as he is the only player ever inducted (or really even given consideration) solely for his defensive efforts.
As Rich alluded to yesterday, some of these biases may (and hopefully will!) disappear as voters become more savvy about how to properly evaluate players. It will be interesting to see what happens during the next 25 years, and how voting will have changed after the "sabermetric revolution".
| Baseball Beat | January 11, 2010 |
Recapping a Joyous Week
Last Wednesday was a big day for Bert Blyleven and me. Blyleven was named on 74.2% of the 539 ballots cast, a gain of 62 votes and 11.5 percentage points. Within 0.8% of the 75% threshold, Rik Aalbert is now on the cusp of being elected to the Baseball Hall of Fame.
The day was made all the more memorable for me when Bert and Peter Gammons mentioned my name on the MLB Network. I was watching the Hall of Fame Class of 2010 live with my son Joe when Blyleven thanked me for my efforts shortly after the results were announced. It was also a nice surprise when Gammons, who had cited my work in his MLB.com article that morning, gave me a shout out later in the segment.
As much fun as it was for me personally, I think Blyleven's surge in the Hall of Fame voting and likelihood of getting elected next year is an even bigger day for the sabermetric movement. You might say, "That's one small step for a sabermetrician, one giant leap for sabermetrics."
While I took up the cause over six years ago to drum up support for a player whose candidacy had been grossly overlooked to that point, I was also motivated to move the discussion for awards and honors from the basic hitting/pitching stats and the "I saw him play and I know a Hall of Famer when I see one" to a more comprehensive and objective approach. With the help of others, I am confident that we are well on our way. We're not finished by any means, but there's no looking back either.
Bill James is the conductor of the sabermetric train, one that has been growing in numbers and gaining influence since he started to self-publish the Baseball Abstracts in 1977. Rob Neyer, who began his career working for James, joined ESPNet SportsZone in 1996 and was perhaps the first baseball writer to post sabermetric-oriented articles on a near-daily basis. The creation of Baseball Prospectus, Baseball-Reference.com, The Baseball Think Factory, The Hardball Times, Baseball Analysts, Fangraphs, Beyond the Box Score, Inside the Book, and other sites has made stats (both basic and advanced) more accessible than ever and generated an onslaught of sabermetric research, studies, and analysis that most of us now take for granted.
If not for the Internet, where would we be? I know the Internet has allowed me to have a voice that wouldn't be possible otherwise. It gave me the opportunity to form the predecessor to Baseball Analysts in 2003, review the Baseball Abstracts in 2004, interview Bert later that year, and meet in person and become friends with Bill and Rob (and countless other writers, analysts, and front office executives, many of whom I now correspond with on a regular basis).
In the spirit of sharing the "fame," I would like to link to the MLB Network video when Blyleven responded to a question posed by Gammons:
Peter Gammons: Bert, do you think the work of some of the guys that have been for you the past five years has really helped your case and helped players around the game that are now active understand exactly what you did as a pitcher?Bert Blyleven: I think so. You know, a guy, Rich Lederer, out of California...Long Beach, California, with BaseballAnalysts.com, I think has really put up now...You saw what happened this year with [Zack] Greinke and Tim Lincecum winning the Cy Young Awards, not leading their leagues in wins, I think, you know, just shows that there’s more behind just wins, and that’s what Rich has really kind of brought out. In the 70’s and 80’s when I pitched, that you can’t always go off of wins. You have to go off of performance and if you kept your club in the game. So yeah, I mean, I’m very, very proud to say that Rich has been in my corner, as a lot of people have.
While I don't have a link to the closing comments when Gammons mentioned me as part of his summation of the day's events, I was able to transcribe his words:
I thought Bert Blyleven's comments were terrific. He thoroughly understands the process now and I think the light that has been shone on him now has actually made people appreciate how good he was even more, and he knows he's going in. I think the next couple of years will do the same for Alomar and Larkin. I think the fact that people care so much about this now...Rich Lederer has campaigned for Blyleven we've understood. I think we'll see the same thing for Alomar and the same thing for Larkin. I just wonder if sabermetrics had been great 10-15 years ago when Ted Simmons didn't even get 4% of the vote and was only on the ballot one time whether Ted Simmons wouldn't now be a Hall of Famer?
Amen to that, Peter.
In Seven Earn Gammons' Hall Vote, Peter wrote the following with respect to Blyleven:
BlylevenWhen one thinks about his run support and career 3.31 ERA, the 13 wins he needed for 300 and first-ballot candidacy seem slight. Hats off to Rich Lederer and others who have sponsored his cause. Think about the fact that his 15 1-0 wins are the most in the last 50 years, and he had more career shutouts than the American League has had the past 18 seasons.
After the results were announced, Rob Neyer put up a "Hall adds one ... but not the one we thought" post on his Sweet Spot blog, which included this excerpt:
Also falling just short -- just five votes short -- was Bert Blyleven, in his 13th try. Consider the progress that he's made, though. In his first three tries, he couldn't clear 20 percent. Five years ago, he cleared 50 percent for the first time. And now he's at 74.2 percent, and will almost certainly join Alomar on the podium next year. And when he's up there, I suspect that Blyleven will have a word of thanks for Rich Lederer.
Bill Shaikin of the Los Angeles Times called Wednesday afternoon and interviewed me for an article that was in the newspaper's print edition the next day.
Bert Blyleven gets closer to the Hall of Fame with an assistFormer pitcher falls five votes short of election to Cooperstown after a campaign by a fan. Andre Dawson is elected.
By Bill Shaikin
January 7, 2010Bert Blyleven did not get elected to the Hall of Fame on Wednesday. He wanted to thank a few people anyway.
He thanked Harmon Killebrew and Brooks Robinson for their encouragement and support. He thanked Rich Lederer too.
"That was pretty cool," Lederer said.
Killebrew and Robinson are Hall of Fame members. Lederer is an investment advisor in Long Beach.
"I'm very proud to say Rich has been in my corner," Blyleven told MLB Network.
Andre Dawson was the only player elected Wednesday. Blyleven fell five votes short, so close that he might well be thanking Lederer in an induction ceremony next year.
This is about more than a fan on a mission, armed with arguments of all sorts, out to get his man into Cooperstown. This is about concurrent advancements in statistics and technology, enabling fans to share their own methods of evaluating players and engage in a national discussion.
"If not for the Internet," Lederer said, "I wouldn't even have a voice."
Lederer, 54, grew up in baseball. His father, George, covered the Dodgers for the Long Beach Press-Telegram from 1958 to 1968, then worked for the Angels as a publicist.
Lederer made finance his career, but he launched a blog (baseballanalysts.com) in 2003, using statistics old and new to press the case for Blyleven.
No Cy Young awards? Two All-Star game selections? Fewer wins than Tommy John?
Lederer has rebuttals for all those arguments and more on his blog, focusing in part on this question: Just how important are wins anyway?
"If wins lead to the Cy Young Award, and the Cy Young Award leads to the Hall of Fame," Lederer said, "it seems like we're double- and triple-counting the wrong things."
It is unfair, he argues, to dismiss Blyleven because he won 20 games once in a 22-year career. We might not have considered run support, defensive support and such new metrics as "runs saved above average" during his career, but we can now.
Blyleven pointed to this year's Cy Young Award voting. Zack Greinke won in the American League, with 16 victories. Tim Lincecum won in the National League, with 15.
"That shows there's more than just wins," Blyleven said. "That's what Rich has brought out. You can't always go off wins. You have to go off performance."
That's a fair point. So how about a counterpoint: If a player needs a campaign manager, is he truly worthy of the Hall of Fame?
"I realize the inner-circle Hall of Famers are no-brainer-type guys," Lederer said. "I think that is a very select group. I think there are a lot of deserving players whose record should be more closely scrutinized."
By harnessing the power of the Internet and the growing community of baseball bloggers, Lederer and friends have linked merrily, enabling his pro-Blyleven arguments to reach the voters.
And, we should add, with enormous success.
In 1999, Blyleven got 14.1% of the vote. He received 74.2% this year, without throwing a pitch in the interim. No player has ever gotten so close to Cooperstown without eventually getting in.
"It's one small step for me," Lederer said. "I think the bigger story is that people like myself, who aren't writers or voters, can have a say in how these players are viewed and perhaps help their candidacy along."
Several other writers, including MLB.com's Kelly Thesier, SI.com's Joe Lemire, and a certain pitcher-turned-writer over at NBC Sports, highlighted my efforts in raising the awareness of Blyleven's Hall of Fame credentials. Former guest columnists Chad Finn and Jonah Keri reached out as well. And even the SunSentinel's Dave Hyde mentioned me in conjunction with Tim Raines.
Blyleven (and Alomar next), then Larkin, Raines, Alan Trammell, and maybe, just maybe Peter Gammons and I will get our wish on Ted Simmons, and many of us on Ron Santo, Bobby Grich, Lou Whitaker, and ...
The Battle Cry of the Sabermetric Revolution marches on.
| Change-Up | January 10, 2010 |
Suggestion to Sunday Boston Globe: Chuck the "Bill Chuck files"
The Boston Sunday Globe's Baseball Notes column achieved must-read status for me at an early age. Peter Gammons wrote it. Gordon Edes tackled it for a number of years. More recently it's been Nick Cafardo, not necessarily a personal favorite of mine but the template was in place and he's largely done a fine job. Last week, an up and comer on the Boston sports media scene, Amalie Benjamin, handled the duties.
There is one terrible, corrosive portion of the column that I want to address. It's something called the "Bill Chuck files", it's at the very end, and it's more often than not just misleading tripe. As far as I can tell, giving Cafardo and Benjamin the benefit of the doubt, it's designed to point out interesting statistical oddities and nothing more. The end result, however, is that a mass audience is subjected to nonsense. Here are a few examples from the last few weeks:
From Benjamin's 1/3 column:
From the Bill Chuck files: Runs produced (RBIs plus runs minus home runs) is a good tool to measure batter effectiveness. Albert Pujols led the majors in 2009 with 212 runs produced. Jason Bay ended up with 186, the same as Mark Teixeira...
How terrible is that? "Runs produced is a good tool to measure batter effectiveness." Here's how "effective" the measure is:
Dustin Pedroia led Kevin Youkilis in Runs Produced.
Aaron Hill led Joe Mauer.
Brian Roberts bested Ben Zobrist.
With proper context, sure, it's fine to mention it. Runs produced is a tool. It tells you something. But good grief, a good tool to measure batter effectiveness? No.
This was another gem from the same paragraph last week:
Over the last three seasons, Stephen Drew (left) hit .264 with 45 homers and 192 RBIs, while older brother J.D. Drew hit .276 with 54 homers and 196 RBIs. Stephen made $1.5 million in 2009, while J.D. made $14 million . . .
Given my mild obsession with J.D. Drew and his treatment by the mainstream media and many fans, you can imagine this one got under my skin. Here's a portion of the email I sent Benjamin last weekend:
First of all, Stephen has not had a chance to be an unrestricted free agent. JD has. From the outset, it's an unfair comparison. JD also makes more money than Chase Utley and Joe Mauer and Jon Lester and Felix Hernandez - that's the CBA's fault, not JD's. But salaries aside, the brothers Drew are not comparable players...JD has walked 240 times since 2007, Stephen 150. JD's OBP is .390 since 2007, Stephen's .322. JD has slugged .485, Stephen .436. Stephen has made 289 more outs (albeit in 330 more plate appearances). Finally, J.D. is one of baseball's best RF according to UZR. Stephen has a spotty defensive record at SS. JD is just a way better player, a fact that might be lost on your readership given the way you framed your comment.
And now, this week, we get this from Cafardo:
Carlos Beltran and Adrian Beltre each has had 6,877 plate appearances. Beltre has 1,700 hits, Beltran has 1,705. Beltre has 348 doubles, Beltran 340. Beltran has struck out 1,086 times, Beltre 1,084 times. Beltre is a lifetime .270 hitter with 250 homers and 906 RBIs. Beltran is a lifetime .283 hitter with 273 homers and 1,035 RBIs.
All that's needed here is some context because even I find this to be interesting. Adrian Beltre and Carlos Beltran have similar names, the same amount of plate appearances and a number of similar statistics. A lead-in like this might work.
"While Beltran is a far better player, an excellent center fielder who gets on base way more often and steals bases prolifically and as efficiently as anyone in baseball, there are nonetheless statling and coincidental similarities between Beltran and new Red Sox 3B Adrian Beltre."
Ok maybe that's a run-on and I need an editor but you get the point. With just the excerpt published in the Globe, I can only imagine how many Red Sox fans think their new third baseman is every bit the player the Mets' center fielder is. Just to hammer this point home.
           PA     BB   SB   CS  Outs
Belran    6,877  730  286   38  4,556
Beltre    6,877  478  111   38  4,837
Beltre is a nice player who should help the Red Sox a lot in 2010. Beltran is a few more good seasons away from having an excellent Hall of Fame case.
In fairness, writers like Michael Silverman of the Boston Herald and Benjamin have been doing a great job of articulating the meaning of more advanced defensive metrics for their local readership as the Red Sox have undergone their off-season makeover. But cherry picking certain statistics and presenting them as though they tell a story the way Cafardo and Benjamin have with Runs Produced, the Drew brothers comparison and now the Beltre/Beltran comparison, do a disservice to their sizeable audience.
| F/X Visualizations | January 08, 2010 |
Looking at Some BBWAA Vote Trajectories
First off congratulations to Andre Dawson on his election to the Hall of Fame.
In this post I want to look at the some of the other players on the ballot and see what we can say about their possible vote trajectory based on looking at historic comparables. But just to be clear from the outset, these are not predictions, as the small sizes are quite small.
In these plots I show how the vote share of each player changed over his subsequent ballots. Along the x-axis is the number of times on the BBWAA ballot, and on the y-axis the proportion of votes he got on that ballot. Circles indicate when a player reached the 75% level. I do not indicate players elected by any manner other than the BBWAA. For each graph I highlight a group of comparable players in red.
First off let's look at Roberto Alomar. He got 73.7%; that is the closest a first-year player has come to 75%. So I compared him to all players who received less than 75% but greater than 60%.
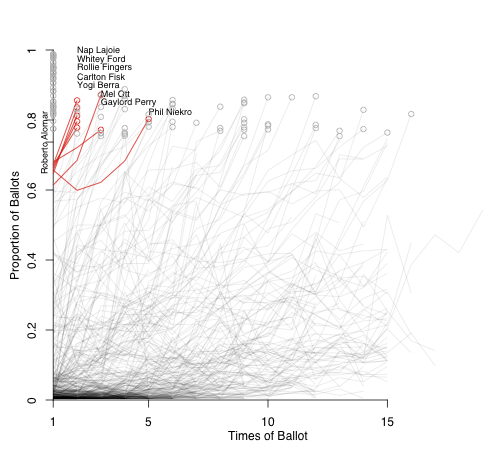
These players were all elected relatively quickly, with most elected the next year. Phil Niekro lost some support in his second year and had to wait the longest, five years, before induction.
Barry Larkin was next among first-year players. He got 51.6% and I looked at players who received within 5% points of that total.
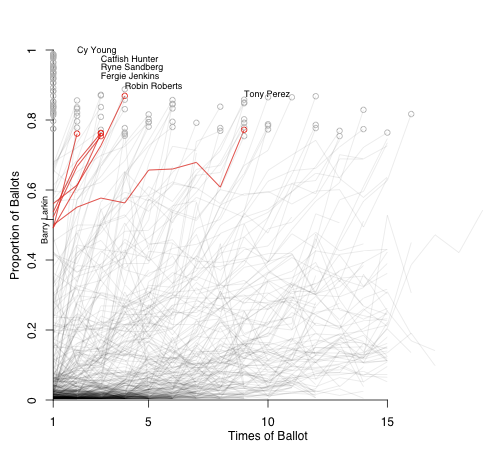
These players were, also, all eventually inducted. Cy Young, the only player in this group to get in on the second try, was not in the Hall's first class, but his vote total shot up the next year and he was elected. I don't think this is the best comparison for Larkin; he will probably have to wait more than one more year. In this group Tony Perez took the longest, as his votes meandered upward for a number of years before being elected in 2000 on his 9th ballot. But history looks good for Larkin.
Next among first-year players is Edgar Martinez, who had 36.2%. There are a lot more players in this range so I just looked at those within 2.5% points.
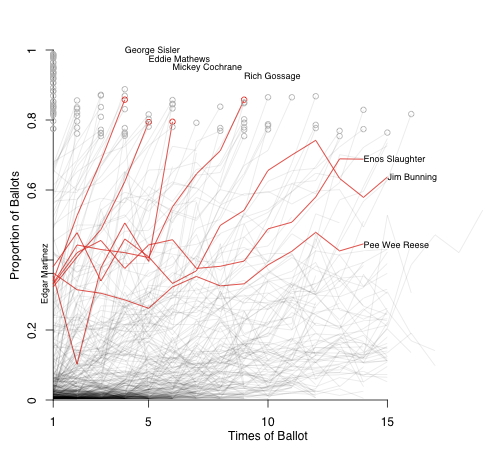
Four of these players shot up quickly and were elected before their tenth time on the ballot. The other three never reached 75% -- although Jim Bunning came painfully close on his 12th time on the ballot -- but all were, ultimately, inducted by the Veterans Committee.
The only other first-year player to reach 5% was Fred McGriff. I highlight others withing 2.5% points of his 21.5%.
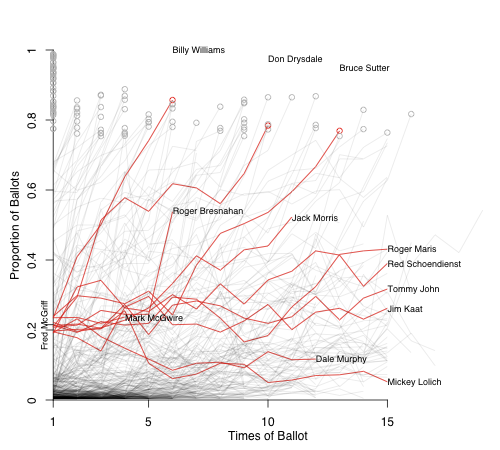
This presents a more muddled picture. Three guys reached 75%, in as fast as six years or as long as 13 ballots. Roger Bresnahan was elected by the Old Timers Committee, a precursor to the Veterans Committee. Red Schoendienst was elected by the Veterans Committee. Three of his comparables are still on the ballot and the last four didn't make it in.
Finally I am going to turn my attention to the two saber-darlings on the ballot: Tim Raines and Bert Blyleven. For these two we have more data than just their first year vote total so I am going to construct their comparables differently.
Blyleven, as Rich covered yesterday, came very close, falling just five votes shy. Here I highlight all other players who received over 70% but less than 75% on a ballot late in the process (tenth ballot or after).
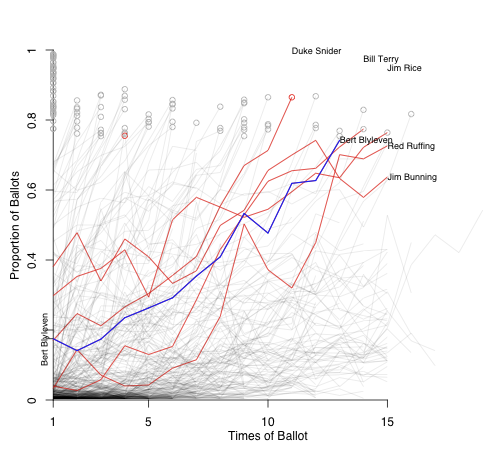
Going by initial vote starting from the highest: Bunning's first total was just under 40% and he -- as noted above -- reached 74.2%, but that was his high-water mark and was ultimately inducted by the VC. Next is Jim Rice who got 74.2% in his 14th year on the ballot and was elected on his 15th ballot last year. Duke Snider started with a total very close to Blyleven's and road a steady growth to the fastest induction among this group. Bill Terry started at just 4% -- this was before players who did not reach 5% were dropped -- and his vote share increased steadily and he was elected in his 14th year. Finally Red Ruffing, who also started below 5%, increased steadily and in his 14th year, 1967, received 72.6%. At the time if no player was elected the BBWAA would hold a runoff and the top vote getter would be inducted. Ruffing was elected in the 1967 runoff.
Tim Raines has been on the ballot for three years with the following totals: 24.3%, 22.6% and 30.4%. For his group I chose players who got between 15 and 35% in each of their first three years.
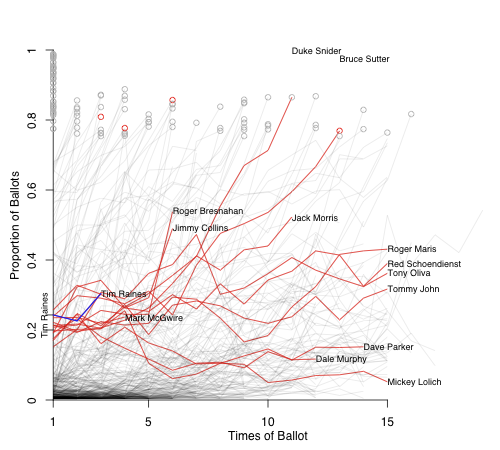
This is a mixed bag. Jimmy Collins and Bresnahan were inducted by the Old Timers Committee, and Schoendienst by the VC. Two guys reached 75%, four are still on the ballot and the other four didn't make it. We will see how it goes for Raines.
Again with the small sample size these are in no way predictions, but an attempt to put these players's vote totals in some historical perspective.
| Baseball Beat | January 07, 2010 |
400 Down and 5 to Go...
Well, the results of the Hall of Fame balloting were revealed on Wednesday, and it appears as if Bert will be Cooperstown bound Blyleven (as in 2011). The best eligible player not in the Hall received 400 votes, good for 74.2% of the 539 ballots cast. He missed out by 0.8% of the 75% threshold needed for induction.
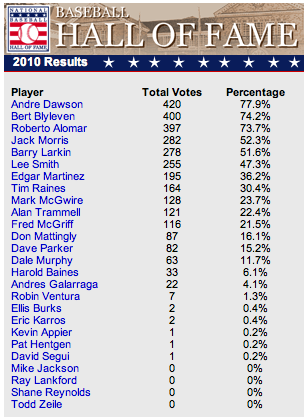 I first learned that Blyleven fell five votes short of election in an email from Bert minutes before Jeff Idelson, president of the National Baseball Hall of Fame and Museum, announced in "one of the closest votes in history" that Andre Dawson would join Veterans Committee selections Whitey Herzog and Doug Harvey as the Hall of Fame class of 2010 on July 25 in Cooperstown, New York.
From:      Blyleven Bert
Subject:   Re: One More Update
Date:      January 6, 2010 11:00:50 AM PST
To:        Lederer Richard
Reply-To:  Blyleven Bert
Missed by 5 votes
Sent via BlackBerry by AT&T
In a subsequent telephone conversation, Bert told me that he received a phone call from Brad Horn, director of communications of the National Baseball Hall of Fame and Museum, five minutes before the results were announced. Thinking this may have been the call that every Hall of Fame candidate dreams of, Bert was holding hands with his wife Gayle when Horn told him that he missed out by five votes. Blyleven laughingly said, "You've got to be kidding me, right?" Turns out it wasn't a joke or one of his friends pulling a prank on him.
I initiated the email thread that morning when I sent Bert the latest update on the Hall of Fame balloting as compiled by Repoz, the editor-in-chief of the Baseball Think Factory. Based on 125 full ballots, Blyleven was at 80.0%. I told him: "I thought it was a 1-in-3 shot this year but am now thinking 50-50 with 99.9% certainty next year (if not this year). It's gonna happen, either this time around or next time around. You deserve it, and I'm very happy for you. It's been too long of a wait already. I hope it's just a matter of an hour or so now."
As it turned out, it looks as if it will be at least 8,760 more hours before Bert is rightfully elected to the Hall of Fame. The good news is that his election is no longer a matter of if but when. We only need to round up five more votes.
These needed votes could come from Carrie Muskat, Mark Newman, and Marty Noble at MLB.com and Pedro Gomez, Tony Jackson, and Michael Knisley at ESPN.com. Or from any of the other 133 writers who voted "no."
Maybe Jay Mariotti, assuming he is still a member of the BBWAA next year, will vote for Blyleven once again rather than turning in a blank ballot. Perhaps Murray Chass will reconsider his position, putting into proper perspective Bert's 10-17 record at the age of 38 when he "pitched with a sore shoulder all season long." Heck, maybe Buster Olney and Jon Heyman, both of whom have never voted for Blyleven based on their belief (here and here, respectively) that he wasn't a "dominant" pitcher, will check out the following table and recognize that he was indeed the dominant pitcher during a large portion of the 1970s.
Bert led the majors in Runs Saved Above Average (RSAA) for FOUR CONSECUTIVE FIVE-YEAR PERIODS beginning in 1971-1975 and ending in 1974-1978. RSAA was created by Lee Sinins of the Complete Baseball Encyclopedia. It measures the number of runs that a pitcher saves his team relative to the number of runs that an average pitcher in the league would allow over the same number of innings, adjusted for ballpark effects. The beauty of RSAA is that it combines quality (runs saved per inning vs. the league average) and quantity (innings pitched).
Over the past 50 years, the five-year leaders have included Don Drysdale (1x), Sandy Koufax (3x), Juan Marichal (2x), Bob Gibson (2x), Tom Seaver (2x), Bert Blyleven (4x), Jim Palmer (1x), Steve Carlton (3x), Dave Stieb (5x), Roger Clemens (7x), Greg Maddux (5x), Pedro Martinez (4x), Randy Johnson (2x), Johan Santana (3x), and Roy Halladay (1x). While it may be too early to judge Santana and Halladay, 11 of the other 12 pitchers are either enshrined or will be enshrined (including several "inner circle" Hall of Famers). The only exception is Stieb, whose HOF case was derailed by a relatively short career.
| PERIOD | PITCHER | RSAA |
|---|---|---|
| 1960-1964 | Don Drysdale | 130 |
| 1961-1965 | Sandy Koufax | 153 |
| 1962-1966 | Sandy Koufax | 194 |
| 1963-1967 | Sandy Koufax | 173 |
| 1964-1968 | Juan Marichal | 158 |
| 1965-1969 | Juan Marichal | 179 |
| 1966-1970 | Bob Gibson | 183 |
| 1967-1971 | Tom Seaver | 174 |
| 1968-1972 | Bob Gibson | 193 |
| 1969-1973 | Tom Seaver | 191 |
| 1970-1974 | Tom Seaver | 161 |
| 1971-1975 | Bert Blyleven | 164 |
| 1972-1976 | Bert Blyleven | 161 |
| 1973-1977 | Bert Blyleven | 181 |
| 1974-1978 | Bert Blyleven | 148 |
| 1975-1979 | Jim Palmer | 147 |
| 1976-1980 | Steve Carlton | 132 |
| 1977-1981 | Steve Carlton | 149 |
| 1978-1982 | Steve Carlton | 118 |
| 1979-1983 | Dave Stieb | 113 |
| 1980-1984 | Dave Stieb | 146 |
| 1981-1985 | Dave Stieb | 183 |
| 1982-1986 | Dave Stieb | 156 |
| 1983-1987 | Dave Stieb | 124 |
| 1984-1988 | Roger Clemens | 147 |
| 1985-1989 | Roger Clemens | 173 |
| 1986-1990 | Roger Clemens | 217 |
| 1987-1991 | Roger Clemens | 221 |
| 1988-1992 | Roger Clemens | 224 |
| 1989-1993 | Roger Clemens | 189 |
| 1990-1994 | Roger Clemens | 201 |
| 1991-1995 | Greg Maddux | 225 |
| 1992-1996 | Greg Maddux | 254 |
| 1993-1997 | Greg Maddux | 265 |
| 1994-1998 | Greg Maddux | 271 |
| 1995-1999 | Greg Maddux | 232 |
| 1996-2000 | Pedro Martinez | 279 |
| 1997-2001 | Pedro Martinez | 289 |
| 1998-2002 | Pedro Martinez | 271 |
| 1999-2003 | Pedro Martinez | 276 |
| 2000-2004 | Randy Johnson | 234 |
| 2001-2005 | Randy Johnson | 194 |
| 2002-2006 | Johan Santana | 181 |
| 2003-2007 | Johan Santana | 185 |
| 2004-2008 | Johan Santana | 200 |
| 2005-2009 | Roy Halladay | 167 |
Note: You can access the complete list of leaders since 1900 here.
Should Runs Saved Above Average be too abstract for your tastes, how about if we just dumb Blyleven's Hall of Fame case down to the following four sentences:
Bert Blyleven ranks fifth in career strikeouts, ninth in career shutouts, and in the top 20 since 1900 in wins. Every eligible pitcher with 3,000 strikeouts is in the Hall of Fame except Blyleven, who has 3,701. Every eligible pitcher with 50 shutouts is in the Hall of Fame except Blyleven, who has 60. Every eligible pitcher in the top 20 in wins since 1900 is in the Hall of Fame except Blyleven and Tommy John.
For those who might wonder why Blyleven and not John, please be aware that Bert struck out 1,456 more batters, pitched 14 more shutouts, and had a superior K/BB (2.80 vs. 1.78), WHIP (1.20 vs. 1.28), and ERA+ (118 vs. 110).
Be it RSAA, strikeouts, shutouts, or the fact that he completed fifteen 1-0 shutout victories (the third-most ever and the highest total in 75 years), Blyleven was clearly a dominant pitcher. He should have been voted into Cooperstown a long, long time ago. It would defame the Hall if Blyleven weren't elected in one of his two final years of eligibility. Meanwhile, here's hoping that the same 400 writers who voted for him this year mark an "X" next to his name again *and* at least five additional writers step up and support his candidacy in 2011.
With the help of long-time advocates such as Jim Caple, Jay Jaffe, Rob Neyer, Dayn Perry, Joe Posnanski, and Joe Sheehan, I believe we can convince a number of voters who have either been on the fence in the past or may not have taken the time to understand and appreciate Blyleven's qualifications. These newbies can join the ranks of converts like Caple himself, Bill Conlin, Jerry Crasnick, Peter Gammons, Bob Klapisch, Jeff Peek, Tracy Ringolsby, Ken Rosenthal, T.R. Sullivan (and many, many others), all of whom began to vote for Blyleven at some point during the past seven years.
As they say, "If you can't beat them, join them." For added measure, you'll be on the winning side next time around.
| Change-Up | January 06, 2010 |
In Which a Baseball "Expert" Asserts Jack Morris Was Better Than Curt Schilling
I tend to think this medium is best left to its originators but I couldn't resist FJM'ing Dan Shaughnessy's latest "effort" for SI.com. It's so devoid of logic, so arrogant, so venomous towards those of us that like to think about the game, that I wanted to have a look at the column bit by bit and present it here at Baseball Analysts.
Fortunately, we expect the mood to pick up around here later today when the 2010 HOF class is announced. The latest BBTF vote tracker, through 118 ballots, has our guy Bert Blyleven trending above the 75% threshold. Let's cross our fingers.
Onto Shaughnessy...
===========
Baseball's 2010 Hall of Fame class will be announced on Wednesday, and I'm betting that Edgar Martinez comes up short in his first year of eligibility for Cooperstown. Edgar presents voters with a unique choice because he is the first candidate who compiled virtually all of his resume as a designated hitter.
This article is off to a great start. Edgar does present a tough choice. He didn't rack up a ton of plate appearances by Hall standards, and all of his value is derived from his hitting, so I am assuming we can anticipate an interesting discussion on just how good that hitter should be in order to be considered Hall-worthy as a DH.
In 18 seasons, all with the Seattle Mariners, Edgar batted .312 with an on-base percentage of .418 and a slugging percentage of .515. This makes him one of 20 players in hardball history with lifetime numbers over .300, .400 and .500, respectively. He has a higher on-base percentage than Stan Musial, Wade Boggs and Mel Ott. He is one of only eight players with 300 homers, 500 doubles and the aforementioned .300/.400/.500 line. He won a couple of batting titles and was an All-Star seven times.
Oh ok, I see where you’re going. Edgar is SO good as a hitter, that you probably have to put him in. .300/.400/.500 over a whole career is a pretty special accomplishment.
He stayed with the same team for his entire career, so there would be no controversy regarding which logo to put on his Hall cap.
Crisp writing. Way to stay on point. It's essential that we think about "Hall cap", particularly in the free agent era, as we decide which ballplayers merit consideration for the game’s most prestigious honor.
The Mariners have campaigned madly for Edgar and it pains me to withhold my vote, but I just can't bring myself to put him in Cooperstown alongside Ted Williams, Babe Ruth and Lou Gehrig.
Nobody cares at all that it “pains” you, Dan. Nobody.
And you know what, nobody is asking you to put him alongside Williams, Ruth or Gehrig. They’re three of the absolute very best of all time. Put him alongside Kirby Puckett and Tony Perez.
If I squint here, I think Dan is saying he’s a “small hall” guy. That would be fine. It really would. A Hall of Fame that enshrines fewer players, as Sky demonstrated yesterday, would be great. But Dan, not only did you vote Jim Rice in, but you were like Chuck Norris to John McCain, touting Rice's candidacy at every opportunity for what seemed like a full decade. You can’t – CAN’T – be a “small hall” proponent and also advocate for baseball’s 258th best position player of all time. It’s a complete joke.
I have been a Hall voter for more than 25 years and it's the most important task assigned to the baseball writers of America. In recent years the Hall ballot has become heavier as voters are asked to make character judgments regarding players who may have padded their statistics with illegal and/or banned substances.There's no problem with Edgar in this area. He was never tainted by the scourge of steroids, and he retired with an impeccable reputation, on and off the field.
Funny story: Tainted by the Scourge is actually the name of a Worcester garage band Dan followed around Central Massachusetts during his days at Holy Cross.
I just don't think he's a Hall of Famer, and that doesn't make him less than great. It doesn't take away his numbers. I like Dwight Evans, Dale Murphy, Alan Trammell and Andre Dawson, but I don't think they're Hall of Famers, either.
Oh, well ok. I happen to agree on all but Trammell (although I struggle badly with Dewey) but that's cool, sounds like you've been thoughtful about this. Interesting stuff. I’m eager to learn more about your thought process. These guys don't measure up to your standard and it's your ballot so hey, tell me about your standard.
Each Hall voter applies his own standards, and mine often references the famous line that Supreme Court Justice Potter Stewart applied to pornography. Stewart argued that he might not be able to define what was pornographic, "but I know it when I see it.''
/falls off chair
Indeed. Hall of Famers, just like pornography! Except, no. Just, no. You DON’T know it when you see it. Branch Rickey didn’t know it when he saw it. Robinson Cano LOOKS like a Hall of Famer to me. Sweet, powerful swing. Smooth and athletic in the field. But he’s not! He might yet become one, but I know he’s not because I can check his performance record and note that his does not stack up to others in the HOF. If I didn't know more about his numbers and that he hadn't played long enough, and I had the same standard of "knowing it when I see it" then I might conclude Cano was, right now, a Hall of Famer.
For me, it's the same with Hall of Famers. Some guys just strike you as Cooperstown-worthy and others do not. Edgar Martinez was a very fine hitter, but I never said to myself, "The Mariners are coming to Fenway this weekend. I wonder how the Sox are going to pitch to Edgar Martinez?''
YOU might not have said that but why don't you talk to Red Sox advance scouts? Because I am positive they agonized over it.
But there you have it, this is Dan’s standard. At this point, given how much we know about what makes a baseball player good, isn’t this just criminal. Isn’t this the very height of arrogance. Stat folks are often criticized for being arrogant themselves, but isn’t it the person that says “it is because I know it to be” who’s arrogant? Not the person who arrives at some sort of logical, objective and defensible conclusion based on reason?
I want to revisit a Bill James quote I used in a piece about Shaughnessy last year to reinforce this point:
"Virtually all sportswriters, I suppose, believe that Jim Rice is an outstanding player. If you ask them how they know this, they'll tell you that they just know; I've seen him play. That's the difference in a nutshell between knowledge and bullshit; knowledge is something that can be objectively demonstrated to be true, and bullshit is something that you just 'know.' If someone can actually demonstrate that Jim Rice is a great ballplayer, I'd be most interested to see the evidence."
Thanks, Bill! And great timing, because guess who Dan's going to bring up next?!?!
It was different with players like Eddie Murray and Jim Rice. They were feared. Murray got into Cooperstown in his first year of eligibility (thanks to 500 homers, no doubt), while it took Rice 15 years to finally get the required 75 percent of votes.
But what about Eddie Murray’s cap? So many teams!
Anyway, Murray and Rice were feared, but Edgar Martinez was not. That’s Shaughnessy’s point. Let's pretend this makes any sense at all - this "fear" stuff. The best way I can think to measure it is by the intentional walk.
Murray was walked intentionally 222 times (once every 57 plate appearances), an incredible figure. As a switch hitter who played for a very long time and had a ton of plate appearances, this isn’t too surprising. Beyond being a good hitter, Murray presented opposing managers late-inning bullpen match-up problems.
Edgar was intentionally walked 113 times (once every 77 plate appearances). Martinez hit in some stacked Mariner lineups though, with the likes of Ken Griffey, Jr., A-Rod, Jay Buhner, Tino Martinez, Paul Sorrento and others. It’s a respectable total, but one that was influenced downward by the excellent hitters surrounding Edgar. Remember, Roger Maris wasn’t walked intentionally once in 1961.
As for Rice, his career total of 77 intentional free passes (once every 118 plate appearances) places him tied for 180th all time. Among others, Geoff Jenkins and Terry Pendleton are tied with Rice.
So I would say it’s best not to use the “feared” argument at all, because once you start to investigate the claim in any meaningful way, you end up with a lot of information pulling you in different directions. Directions like the exact opposite one you're hoping for when you argue that Rice was a HOF'er because he was "feared."
Both were feared sluggers who spent a lot of time in the field before becoming DHs as elder statesmen.
But there you go again! With the “feared”! You just can’t help yourself! Why don’t we keep it simple? AVG/OBP/SLG – OPS+ - Plate Appearances
Murray: .287/.359/.476 – 129 – 12,817
Rice: .298/.352/.502 – 128 – 9,058
Edgar: .312/.418/.515 – 147 – 8,672
Ding Edgar for no defense. Ding him for not enough plate appearances, but good grief, admit he was a much, much better hitter than both Eddie Murray and Jim Rice!
This year I voted for Roberto Alomar, Bert Blyleven and Jack Morris.
I guess that’s good. Two of the three are deserving but there are some glaring omissions.
Alomar goes down as one of the greatest second basemen of all time and was the best at his position for just about the entire time he played. This is his first year on the ballot and I think he'll be the top vote-getter in the class of 2010.
Sure, ok.
Blyleven has been on the ballot for 13 years and may come up short again, but he won 287 games, ranks fifth all-time in strikeouts and compiled a 3.31 ERA over 22 seasons, pitching for a lot of bad ball clubs.
Yeah, you got it.
Morris won 254 games in 18 seasons and pitched one of the greatest World Series games of all time, a 10-inning, 1-0 Game 7 victory over the Braves in 1991. There's already support for Boston blowhard Curt Schilling, who won't be on the ballot for another three years, but Morris has to get in before Schilling gets in. Morris was better.
We're going to pause here so that everyone can appreciate this. Jack Morris is better than Curt Schilling. Let that sink in for a moment.
Here’s a man who covers baseball for a living. Think of what you do for a living, how you have trained to come to understand what you need to in order to carry out your job well. How you strive to learn as much as you can so that you can perform to the best of your abilities.
And now ponder for a moment what it must be like to spend your career working in baseball, to laying claim to and having others bestow upon you some measure of expertise. And you assert that Jack Morris was better than Curt Schilling. I get Dan's schtick, but it's just so beyond the pale.
Curt Schilling was a career 127 ERA+ pitcher with a 4.38 K/BB ratio in 3,261 innings. Jack Morris was a career 105 ERA+ pitcher with a 1.78 K/BB ratio in 3,824 innings. The innings difference is not insignificant, but those innings amount to an additional 563 frames of 6.46 ERA ball. Like, two or three full seasons of Adam Eaton. If you place a lot of stock in peripherals, a stat like K/BB, then although Schilling might be lacking in longevity compared to other Hall performers, he is still one of the best of all time. Jack Morris is kind of like Livan Hernandez or Tim Wakefield.
As for their post-season performance, Morris was 7-4 with a career 3.80 ERA in the playoffs. Schilling was 11-2 with a 2.23 ERA.
Now, you’re a Sports Editor. You like Shaughnessy because he’s plucky and he attracts readers because he appeals to some segment of sports fans I'll never understand while irritating another segment. But at what point does self-respect come into play? At what point do you say to yourself, “Enough’s enough. It reflects too poorly on my organization and me professionally to continue to provide this guy a forum”? Does that point ever arrive? Maybe not today, maybe not tomorrow, but with the likes of Joe Posnanski and Rob Neyer and Keith Law furthering their march into the mainstream, that day’s coming a lot sooner than Dan Shaughnessy may think. It's simply preposterous to lay any claim whatsoever to baseball expertise and simultaneously hold that Jack Morris was better than Curt Schilling. It's irreconcilable.
The toughest omissions this year were Dawson, Barry Larkin, Fred McGriff ... and Edgar.
But not Raines or Trammell. And certainly not McGwire, what with his taint of the scourge and all.
A lifetime .312 average is impressive and Edgar's OPS puts him in an elite class. But he wasn't a home run hitter (309), he couldn't carry a team, he didn't scare you, and (sorry) he rarely played defense. Edgar spent a couple of years at third for the M's in the early 1990s before taking over as full-time DH.
Two facts (a lifetime .312 average IS impressive, his OPS DOES put him in an elite class) and then meaningless and/or counter-factual assertions. He "wasn't a home run hitter" with "309" listed parenthetically. How does one amass 309 home runs without being a "home run hitter"?
"He couldn't carry a team." Good grief, well who can? 9 players HAVE to come to the plate! "He didn't scare you." He didn't scare who! You?! Why should he?! So dumb. So very dumb. Ask Andy Pettitte (career 1.132 OPS vs Edgar) or Bartolo Colon (1.049) or Chris Carpenter (1.183) if Edgar scared THEM!
The stat geeks, those get-a-lifers who are sucking all the joy out of our national pastime, no doubt will be able to demonstrate that Edgar was better than Lou Gehrig and Rogers Hornsby. I'm not buying. Stats don't tell the whole story. A man can drown in three feet of water.
Nope, nobody has said he was even close to as good as either of those players. And really, who sucks the joy out of baseball? The fan eager to enhance his or her understanding of the game or the sportswriter who trusts his eye/gut over any sort of elementary performance metics? Oh, hold on, I know, it's the third option; it's the writer who has built his career by being a know-nothing instigator. THAT guy sucks the joy out of the sport.
Edgar Martinez was a fine hitter and got on base a lot. But he was a corner infielder who didn't hit a lot of homers and then he became a guy who spent the majority of every game watching from the bench.
You know who else spends the majority of the games behind the bench? EVERY SINGLE PITCHER EVER VOTED INTO THE HALL OF FAME! But really, great point.
==========
Ok, that's done with. Hopefully Baseball Analysts readers for whom Rich Lederer's tireless work advocating for Bert Blyleven's candidacy has resonated can stop back later on today and we can all toast some good news. And to end on a positive note with Dan himself, given that he cast a vote for Bert, he will have had a hand in that potential bit of good news. So at least there's that!
| Behind the Scoreboard | January 05, 2010 |
The Hall of Fame in an Alternate Universe
The Hall of Fame will announce its 2010 class this Wednesday. While the Baseball Hall of Fame is perhaps the most prestigious of all Hall of Fames, its procedures and standards aren't exactly organized nor are they truly fair. It would be great if the Hall of Fame had one clear standard for admission which remained the same across time. Unfortunately this hasn't been the case during its 75 year history.
The Hall's caretakers would likely disagree with me, saying that throughout history, it has kept in place its requirement that players receive 75% of the vote. While this ironclad 75% requirement seemingly makes the Hall of Fame fair and consistent throughout time, in reality the Hall has tinkered with and manipulated the vote in order in increase or decrease the number of players being enshrined. In reality, the Hall has messed with the process by creating several voting bodies at various times including the Old-Timers Committees, two separate Negro League Committees, and several incarnations of the Veterans Committee, in addition to the regular BBWAA writers' election.
Part of the problem is that the concept of a "Hall of Fame" is ill-defined, particularly with regards to the quality of player who deserves to be enshrined there. One could create a Hall of Fame of 50 players, 100 players, or 500 players, and all would be equally as valid. But for the voters, the Hall's size was never well-defined. Hence, the quality deemed necessary for Hall inclusion evolved organically over-time, rather than adhering to a set standard.
Initially, the standard was 5 players selected over an approximately 40 year period of baseball. However standard necessary for the Hall of Fame quickly deteriorated after the induction of Ty Cobb, Walter Johnson, Christy Mathewson, Honus Wagner, and Babe Ruth.
After adding a handful over players later in the 1930's, by the 1940's the Hall of Fame decided that the club was too small after several years of no new elections. In reaction, they had run-off elections in 1946, and also instituted the Old Timers commission to induct more players from the olden days of baseball, which writers seemed to have forgotten.
In the 1950's the Veterans Committee was created to include even more old-time players - a move which resulted in a vast overrepresentation of players from the 1920's and 30's.
Additionally, somewhere along the line, voters picked up the peculiar habit of making players wait to enter the Hall. Rather than voting on players on their merits, voters would haze players by not voting for them right away. While this practice has lessened in recent years, most players still increase their vote totals over time. Considering the voters are largely the same, and the players accomplishments remain the same, this practice only serves to cast doubt upon the validity of the process.
As a result of all of these inanities, the Hall of Fame is now a multi-tiered structure, with Veterans Committee selections clearly adhering to a different standard of greatness, and with many modern players not immortalized clearly more deserving than many old-time players who are enshrined.
Rules for an Alternate Universe
How could the Hall of Fame have avoided all of these troubles? Here, I'll set out some rules and reconstruct what the Hall of Fame might look like today had these procedures been in place from the beginning.
First, to maintain an equal standard over time, the Hall of Fame ought to have fixed the number of players allowed to enter the Hall of Fame each year. In addition to maintaining a consistent standard, this would also give the Hall the publicity of honoring one great player each year, without the embarrassing situation of having no player selected or flooding the Hall with too many selections in a given year. A forward-thinking panel would have enacted the following rule in 1936: One player shall be inducted each year.
Of course to guarantee that exactly one player is admitted each year, the 75% rule is out the window. Instead, the BBWAA would vote for the player most worthy of induction similar to how the MVP is selected. Each voter ranks the most worthy players for induction, and the player finishing with the most points is elected to the Hall of Fame. The rest would wait until next year.
While forcing players to wait 5 years before voting on them is a reasonable rule, there is no reason take players out of consideration after 15 years as the rule is currently. In the Alternate Universe Hall of Fame, players would remain eligible indefinitely. Since voters can vote in only one player per year, the best players would usually get in on the first try. Lesser players might have to wait for a lull in newly eligible players before getting in. Meanwhile, those not worthy will soon be forgotten. Still, allowing players to remain on the ballot indefinitely allows voters to correct mistakes of the past. When voters finally realize that Ron Santo is the best player currently not in the Hall of Fame, they will have an opportunity to vote for him and include him. However, as long as voters think another player is more deserving, he'll have to wait.
Each year, voters would be instructed to vote for the most deserving player, regardless of the time he has been on the ballot. This will be easier for voters to do under this system, since voters are directly comparing players to each other, rather comparing players to some arbitrary Hall of Fame standard.
The Alternate Universe Hall of Famers
In 1936, the Hall of Fame would kick off with a mega-election which elected 15 players who had retired between the years 1910 and 1930. There would also be a separate Old-Timers election which admitted 10 19th-century players who had retired before 1910. This initial class of 25 players is a good start to the Hall of Fame and roughly adheres to the same one player-per-year standard that would be used from then on. Players who failed to be selected in this initial election would of course be eligible for election in subsequent years. Basing the selections on the actual votes at the time, the players elected would likely have been the following 15 players:
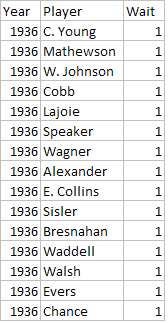
And the Old-Timers Commission likely would have selected the following 10 players:
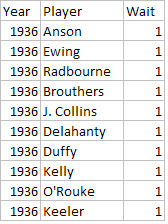
Moving on, the Hall of Fame would use its current five-year waiting rule (no exceptions) when considering new candidates. To determine who the voters likely would have selected, I ranked eligible players in each year according to how many years it took them to crack the real Hall of Fame. The highest ranked player in each year got in my "Alternate Universe" HoF. The voters would vote on the best players in each year. The likely selections through 1981 would probably be the following:
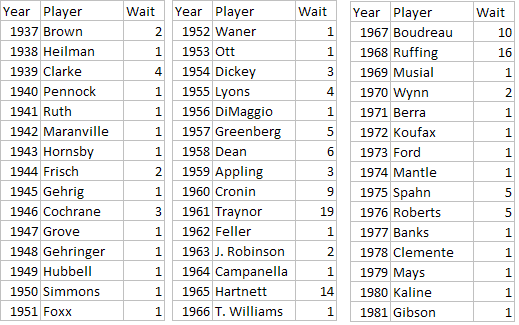
Clearly some years are tougher competition than others. The mid-1960's had a relatively weak crop of newly eligible players, and this allowed some older players to finally make the cut after a long period of waiting. Borderline Hall of Famers like Pie Traynor, Lou Boudreau, or Red Ruffing eventually make it in after a long time, while true greats like Lefty Grove or Babe Ruth are sure to make it in on the first try. Since all players are eligible indefinitely, there is no need for a Veterans Committee to water down the Hall of Fame by inducting lesser players. Since each year the voters select the best player not currently enshrined, fans can be confident that the Hall of Fame maintains a consistent standard and that the players enshrined really are the best of the best.
In 1982, the Hall of Fame realizes that it needs to expand the number of Hall of Famers due to MLB's expansion. Since there are more teams, there are more dominant players, and the Hall of Fame needs to make room for them. Major League Baseball expanded to 24 teams 13 years earlier and to keep the same amount of players per team in the Hall of Fame constant, the Hall of Fame must increase the number of players inducted into the Hall of Fame by a proportional amount. Therefore, in 1982, the Alternate Universe Hall of Fame begins electing two Hall of Famers every other year, reflecting the 50% increase in the number of teams in the majors. Doing the same process as above to get the likely selections through today, here are the rest of the players in the Alternate Universe Hall of Fame:
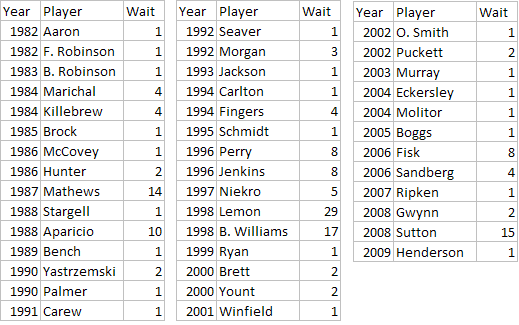
Again, the Hall of Fame goes through cycles of weak and strong classes, with the weak periods allowing some older deserving candidates to get a shot an enshrinement. In 2013, the Alternate Universe Hall of Fame would expand once again to account for the most recent expansion, now moving to enshrining two players in each year.
How does the Alternate Universe Hall of Fame look overall? The new Hall of Fame is not diluted by the Veterans Committee selections, and consists of most players elected by the BBWAA. These 112 players represent the best of the best, and it’s hard to argue against the greatness of any of these players.
There are a handful of players elected by the BBWAA, but thus far not in the Alternate Universe Hall of Fame and they are: Bill Terry, Dazzy Vance, Joe Medwick, Hoyt Wilhelm, Duke Snider, Ralph Kiner, Don Drysdale, Tony Perez, Gary Carter, Goose Gossage, Bruce Sutter, and Jim Rice. While certainly there is an argument to be made that some of these players deserve enshrinement, these players were ranked by the writers below the other 112 players - an assessment I would generally agree with. Each of these players also still has a chance to make the Hall in future years when there is the inevitable lull in new top candidates. One of those lulls occurs in 2010, when at least one of these players would likely have a chance to make the Hall of Fame in what is otherwise a fairly weak crop of new candidates.
Of course the Hall of Fame would be remiss without any Negro League players as well. In the real Hall of Fame, a Negro League Committee was created to include worthy Negro Leaguers. They inducted 9 players, while the Veterans Committee inducted a few more in later years. Then in 2006, 12 more Negro League players were inducted. Who knows how many more might be inducted in the future?
In the Alternate Universe Hall of Fame, in 1971 it was decided that a set number of 10 Negro Leaguers would be inducted into the Hall of Fame, spread over the next ten years. Considering that the Negro Leagues were only in their heyday for about 25 years, had fewer teams, and had several teams with questionable quality of play, ten players seems like about the right number to complement the 60 other Alternate Universe Hall of Famers in 1971. Of course, any players not making the cut would also be eligible for the regular BBWAA election in later years. The likely inductees would have been:
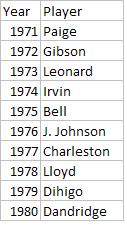
Comparing the Halls
In all, I much prefer this trimmed down, and fairer list of 122 men for the Hall of Fame, instead of the bloated, unrepresentative, and multi-tiered current Hall of Fame of 232 men. In the Alternate Universe Hall of Fame, you can say that these men are the 122 greatest players who ever played the game. You can't really say that that the current Hall includes the 232 greatest players. Does anyone really believe that Joe Gordon is a more qualified candidate than Ron Santo? No, but due to the Hall's strange election procedures, Gordon is in the Hall of Fame while Santo is not. Is there any chance that anyone thinks Rube Marquard was a better pitcher than Bert Blyleven? No, but Marquard is in and Blyleven is out. Is there any reason that hitters from the 1930's should be vastly over-represented? No, but thanks to the inanities of the Veterans Committee, we now have Lloyd Waner and his ilk permanently watering down the field. With a bit more foresight, the Hall of Fame could have set up a system similar to the Alternate Universe Hall of Fame and we would have a better Hall of Fame today.
The reason they didn't of course, is that nobody likes quotas. Players should be chosen on their merits, not based on some artificial numbers, you can hear the critics saying now. But in deciding on a shrine for the "greatest players", one way or another, the definition of how great is great enough gets defined. The Hall of Fame's founders should have taken the chance to define the size of the Hall of Fame explicitly, rather than the organic growth that has seen the Hall of Fame's standards become inconsistent over time. But the Hall of Fame didn't do that, and as a result we have the skewed, multi-tiered, irrevocably broken system we do today. I wish they had.
| Baseball Beat | January 04, 2010 |
Graphing the Hitters
Thanks to Fangraphs and Jeremy Greenhouse, I now have access to the 2009 stats in three spreadsheets covering 706 hitters, 664 pitchers, and 1,877 rows for fielders (including seven for Ben Zobrist). While combing through these numbers, it occurred to me that I had graphed pitchers and payroll efficiency over the years but never hitters. Well, that's about to change.
If a picture is worth a thousand words, then a graph is worth at least as many. Tables are nice to peruse but graphs are clearly more visual than columns and rows of stats. Although there is nothing groundbreaking as it relates to the graphs that I have chosen to present, I believe they tell their own stories. They are designed to be simple and straightforward. Two axis, four quadrants, and player names identifying outliers.
The first graph, which I call Productivity, plots on-base percentages on the x-axis and slugging averages on the y-axis for every qualified batter in 2009. The intersection of the MLB averages for OBP (.333) and SLG (.418) created quadrants that classify players as above average in both (upper right), below average in both (lower left), or above average in one and below average in the other (upper left and lower right).
Note: You can download a spreadsheet containing the AVG, OBP, SLG, and OPS of the 155 hitters here. This information can also be used to locate the 135 players not labeled in the graph below.

I've got two questions:
1. Is Albert Pujols any good?
2. Is Yuniesky Betancourt really the starting shortstop for the Kansas City Royals?
OK, I've got one more:
3. Did Royals GM Dayton Moore just sign Jason Kendall to a two-year contract for $6 million?
Bonus round:
4. Is it true that Moore signed a four-year extension with the Royals through 2014 more than a year before his current deal expired?
The answer to all four questions is ... drum roll, please ... YES!
Pujols (.443 OBP, .658 SLG) is very, very good. He carried my fantasy baseball team to a championship in 2009. Thank goodness for pulling the piece of paper with "1" out of the hat prior to our draft. He won his third National League Most Valuable Player Award unanimously, leading the senior circuit in OBP, SLG, OPS (1.101), OPS+ (188), R (124), HR (47), XBH (93), TOB (310), TB (374), and several other advanced metrics. Prince Albert doesn't turn 30 until the middle of this month, yet he has already produced over 1,700 hits and 800 walks, slugged 387 doubles and 366 home runs, and surpassed 1,000 runs scored and 1,100 runs batted in over the first nine years of his career.
Betancourt, on the other hand, had the lowest OBP (.274) and the seventh-worst SLG (.351) in the majors. The distinction of ranking dead last in SLG went to Yuniesky's newest teammate, the 35-year-old Kendall, who has "hit" .261/.336/.321 (OPS+ of 76) with 8 HR in nearly 3,000 plate appearances since being traded by the Pittsburgh Pirates (or was it the "Stealers"?) after the 2004 season.
Joe Mauer (very good) and Emilio Bonifacio (very bad) also stood out last year. Mauer was named AL MVP, sweeping the Triple Crown in rate stats with a .365 AVG, .444 OBP, and .587 SLG while winning his third batting title in the past four seasons. He also led the league in OPS (1.031) and OPS+ (170). Did I mention that Kendall is Mauer's third-most similar player through age 26?
Speaking of Bonifacio, how many fantasy owners picked him up when he was hitting .583/.600/.833 after the first week of the season? He rewarded them by putting up a .233/.288/.279 line the rest of the way.
There are a number of other interesting observations from the Productivity graph. For example, check out the names of the high-OBP and high-SLG players in the northeast quadrant. In addition to Pujols, the list includes Prince Fielder (.412/.602), Joey Votto (.414/.567), Derrek Lee (.393/.579), Ryan Howard (.360/.571), and Kendry Morales (.355/.569). First basemen all. The diamond directly below Votto's is Kevin Youkilis (.413/.548). The one down and to the right of Lee's is Miguel Cabrera (.396/.547). The diamond that is between Youk and Miggy is Adrian Gonzalez (.407/.551). Lastly, the one down and to the left of Lee is Mark Teixeira (.383/.565).
The following graph is a duplicate of the one above but it also includes a trendline. I chose a linear trendline as it is virtually the same as the other choices. The equation for the dataset of all qualified hitters is y = 1.1493x + 0.051. Or, more specifically, SLG = 1.1493 x OBP + 0.051. Due to the lack of pitchers and bench players, the qualified group produced a simple average OBP of .354 and SLG of .458, or 6.3% and 9.6%, respectively, higher than the league norm.
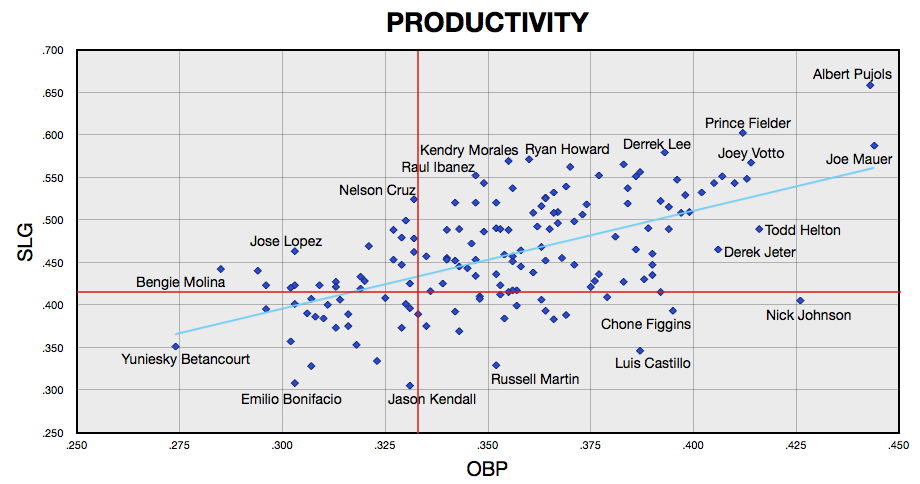
The hitters below the trendline get more of their productivity from OBP while those above the line get more from SLG. While many of the players below the trendline are not particularly skilled at reaching base (wherefore art thou Bonifacio?), they are even more inept at hitting for power.
Nick Johnson, Chone Figgins, Luis Castillo, and Russell Martin derived most of their offensive value last year from getting on base. Jose Lopez and Bengie Molina hit for some power but made far too many outs. Todd Helton and Derek Jeter were two of the more productive hitters, combining on base with slugging but generating more value from the former than the latter.
Although Mauer and Pujols led their respective leagues in OBP, both players slugged at an even higher rate relative to the league average. Given that Mauer and Pujols are standout defensive players as well, it's not difficult to understand whey they were named the Most Valuable Players in 2009.