Rich Lederer • Baseball Beat
Patrick Sullivan • Change-Up
Jeremy Greenhouse • Touching Bases
Dave Allen • F/X Visualizations
Sky Andrecheck • Behind the Scoreboard
Marc Hulet • Around the Minors
Al Doyle • Past Times
Retired Uniforms:
Bryan Smith • WTNY
Joe Sheehan • Command Post
Jeff Albert • The Batter's Eye
RSS Feed
Home
*Examining the Past, Present, and Future*
Lineup Card
Recent Entries
» Putting Together a Reality Team
» Historical Hall of Fame Vote Comparisons: 2012
» An All-Christmas Team
» The New-Look Angels
» John Denny: The Forgotten Cy Young Award Winner
» Money Isn't Everything
» What Would It Take to Hit .400 in the 21st Century?
» Halos Heaven
» Brandon McCarthy's Breakout Season
» Link-o-Rama
» Historical Hall of Fame Vote Comparisons: 2012
» An All-Christmas Team
» The New-Look Angels
» John Denny: The Forgotten Cy Young Award Winner
» Money Isn't Everything
» What Would It Take to Hit .400 in the 21st Century?
» Halos Heaven
» Brandon McCarthy's Breakout Season
» Link-o-Rama
Best of Baseball Beat
Abstracts From the Abstracts
1977 Baseball Abstract
1978 Baseball Abstract
1979 Baseball Abstract
1980 Baseball Abstract
1981 Baseball Abstract
1982 Baseball Abstract
1983 Baseball Abstract
1984 Baseball Abstract
1985 Baseball Abstract
1986 Baseball Abstract
1987 Baseball Abstract
1988 Baseball Abstract
1978 Baseball Abstract
1979 Baseball Abstract
1980 Baseball Abstract
1981 Baseball Abstract
1982 Baseball Abstract
1983 Baseball Abstract
1984 Baseball Abstract
1985 Baseball Abstract
1986 Baseball Abstract
1987 Baseball Abstract
1988 Baseball Abstract
Bert Blyleven Series
Meeting Up and Hanging Out with Bert
The Results Are In And...
Aficionado Heavily Invested in Blyleven
Latest on Blyleven's Chances for the HOF
The Internet Zealot Responds
400 Down and 5 to Go...
Bert Be Home By Eleven?
Blyleven's Forgotten Season (1973)
HeyMan, Your Comments Don't Hold Water
The Waiting is the Hardest Part
Another Addition to the Blyleven Series
Search for the Truth
As Dominant as His HOF Contemporaries
Listen, Buster
A Larger Step for Blyleven
Answering the Naysayers (Part Two)
Another Small Step for Blyleven
Q&A: Blyleven on the Twins
The Majority Rules, Right?
It's All Dutch to Some
The Hall of Fame Case for Bert Blyleven
Q&A: Blyleven on Felix Hernandez
Clemens Rocketing Up Charts
Poz: An Interview With a KC Star
A HOF Chat with Tracy Ringolsby
Up Close and Personal
A Peek Into the Mind of a HOF Voter
Answering the Naysayers
It's That Time of the Year (Again)
"If Cooperstown is Calling..."
The Bert Alert
One Small Step for Blyleven...
Only the Lonely
Exclusive Interviews
Lee Sinins
Alex Belth
David Pinto
Will Carroll
Mike Carminati
Aaron Gleeman
Joe Sheehan
Jay Jaffe
Jeff Peek
Tracy Ringolsby
Joe Posnanski
Bill James Part I, II, III
Jon Lalonde
Chuck Tiffany
Dayn Perry
Fay Vincent
Nate Silver
Alex Belth
David Pinto
Will Carroll
Mike Carminati
Aaron Gleeman
Joe Sheehan
Jay Jaffe
Jeff Peek
Tracy Ringolsby
Joe Posnanski
Bill James Part I, II, III
Jon Lalonde
Chuck Tiffany
Dayn Perry
Fay Vincent
Nate Silver
Bullpen
Rich Lederer
The Odd Couple (with Alex Belth)
The MostUnder Over Underrated Player in Baseball (with Brian Gunn)
Three Wise Men (roundtable by Alex Belth)
Infrequently Asked Questions (interview with Matt Welch)
Interview (Orioles Think Tank)
Bernie and the Yanks (Bronx Banter)
Hope and Faith: How the LAA Win the World Series (Baseball Prospectus)
NL West (The Soul of Baseball)
Greatest Living Hitter? (Sports Illustrated)
Roundtable: 2008 HOF Ballot (Armchair GM)
The Most
Three Wise Men (roundtable by Alex Belth)
Infrequently Asked Questions (interview with Matt Welch)
Interview (Orioles Think Tank)
Bernie and the Yanks (Bronx Banter)
Hope and Faith: How the LAA Win the World Series (Baseball Prospectus)
NL West (The Soul of Baseball)
Greatest Living Hitter? (Sports Illustrated)
Roundtable: 2008 HOF Ballot (Armchair GM)
Patrick Sullivan
Designated Hitters
David Bromberg (Q&A: John Denny)
Mark Armour (H. Killebrew and Versatility)
Joe Lederer (Soundtrack of a Prospect)
David Bromberg (Clemente's Autograph)
David Bromberg (Woody Fryman)
D. Baumstein (WAR Against Age: Pitchers)
Doug Baumstein (The WAR Against Age)
Doug Baumstein (A Lifetime on the Road)
John Fraser (Pick Six)
Mark Armour (How to Score More Runs?)
Bill Parker (What Opening Day Tells Us)
Stan Opdyke (Pat Rispole)
Chris Jaffe (Evaluating Baseball's Mgrs)
Stan Opdyke (Baseball Radio in NYC, 1953)
A. Nathan (Performance of Baseball Bats)
Michael Weddell (Edgar Martinez/HOF)
Jon Weisman (100 Things Dodgers Fans...)
Stan Opdyke (Connie Mack and Vin Scully)
Eric Walker (Evaluating Run Production)
Brent Mayne (The Intangibles of Catching)
Chris Moore (Best Fastballs in Baseball)
Dave Baldwin (The Batter’s Brain)
Shawn Haviland (Ivy League to MLB)
Larry Granillo (Walking Off)
Rob Iracane (Solo HR Won't Break You)
Tommy Bennett (Charm of AM Radio)
Harry Pavlidis (Johan Santana's Fast Start)
John Walsh (WAR and Remembrance)
Eric Walker (Precisely Inaccurate)
Bob Timmermann (As They See 'Em)
Geoff Young (Unicycles and Delusions)
Baseball Analysis at Tufts (Groundballers)
Baseball Analysis at Tufts (GB Out Rates)
G. Rybarczyk ('09 Hit Tracker Projections)
Joe Lederer (Curt Schilling/HoF)
Conor Gallagher (Hall of Fallacies)
Chris Green (Jim Rice, HoF, the Numbers)
Shawn Hoffman (Baseball's Bear Mkt?)
Paul Anthony (Manny Syndrome)
Ross Roley (World Series Odds)
B. Timmermann (Catcher's Interference)
R.J. Anderson (Waiting the Hardest Part)
Maury Brown (Cubs, MLB, and Cuban...)
Myron Logan (Dee-Fense, Dee-Fense)
Craig Calcaterra (Frivolity, Part I, Part II)
Chad Finn (Ode to Baseball Cards)
David Cameron (Mariners Foibles)
Chris Dial (Chipper Jones)
Pat Lederer (Memory Lane)
David Appelman (Clutch Pitching)
Bob Rittner (DH)
Jonathan Mayo (Roger Clemens)
Lisa Winston (My Son-in-Law...)
Russ McQueen (The Yellow Hammer)
Bob Rittner (I'm OK, You're OK)
Mark Armour (In Defense of the HOF)
Pat Jordan (Friends)
Dan Levitt (Analysis of Terry Ryan)
Doug Baumstein (Trading Econ 101)
Ross Roley (Runner's Reluctance II)
Ross Roley (Runner's Reluctance I)
Mark Armour (No-Longer Lovable Sox)
Bruce Regal (Stealthy and Wise)
Brian Gunn (Roid Monster)
Current/McEvoy (Value of the SB)
John Rickert (Sinister Thefts)
Nate Silver (Sabermetrics)
David Vincent (Home Run Production)
Joe P. Sheehan (Enhanced Gameday II)
Mark Armour (An Ode to Sport)
David Gassko (All-Time Worm Burners)
Joe P. Sheehan (Enhanced Gameday)
John Walsh (When Titans Clash)
Fox/Williams (Quantifying Coaches II)
Fox/Williams (Quantifying Coaches I)
Jacob Luft (Bull Durham Rant)
Chad Finn (Strat-O-Matic)
Lisa Winston (Rotisserie Baseball)
Dave Studeman (Baseball Stats)
Steve Treder (Roger Craig)
Marc Normandin (Jeff Bagwell)
D. Appelman (Expanding Strike Zone)
Jeff Sackmann (Worst MiL Defenders)
Jeff Sackmann (Best MiL Defenders)
Maxwell Kates (Van Lingle Mungo)
David Appelman (Pitch Location)
Kent Bonham (Danny Ray Herrera)
Glenn Stout (Two Baseball Poems)
Bruce Regal (The Challenge Round)
Mark Lamster (Barry & Ty)
Geoff Young (NL West)
Tom Lederer (The Ryan Express)
Brian Erts (Great Leap Forward)
David Pinto (Parity and the N.L.)
Jacob Luft (Fathers and Daughters)
Jamey Newberg (Pete's Sake)
Jeff Albert (A. Jones Swing Analysis)
Jeff Albert (A-Rod Swing Analysis)
Keith Law (Death, Taxes, and Waivers)
Peter Abraham (Tales of Torre Tales)
Larry Borowsky (Let 'er Rip II)
Dan Levitt (Empirical Analysis of Bunting)
Jonah Keri (If I Met Warren Cromartie...)
Bob Klapisch (War Stories)
Bob Timmermann (John F. Kennedy HS)
Kent Bonham (Aluminum Adjustments)
Al Doyle (More Than Superstars)
Ross Roley (Instant Replay)
David Vincent (Barry Bonds Homers)
Chad Finn (Our Favorite Obscurities)
Bill Deane (1979 NL MVP)
Mark Armour (Rise/Fall of Artificial Turf)
Jeff Angus (Wally Moon Camp)
David Berri (Money and Baseball)
Larry Borowsky (Baseball w/o the #s)
Derek Zumsteg (The Irrational Market)
David Regan (Free Agent Contracts)
Peter Schmuck (Steroids and the HOF)
David Appelman (Pitchers, Pitch by Pitch)
Dan Fox (Swinging, Taking, Fouling, Etc)
Patrick Sullivan (Study of NYY CF/BOS LF)
Will Leitch (Baseball Journalism)
Jeff Sullivan (Pitcher Release Points)
Steve Treder ('69-'70 Giants)
Maury Brown (Charlie Finley)
John Brattain (Bob Johnson)
Bob Klapisch (The Case for Bert Blyleven)
Jeff Peek (Pride and Prejudice)
Dayn Perry (Bert and Warren)
Rob Neyer (If Don Sutton Was Great...)
Lisa Winston (Minor League Memories)
Alex Belth (Otis Redding Was Right)
David Cameron (Long Live the King)
Jeff Angus (Baserunning Study)
Bert Blyleven (Baseball Playoffs)
Boyd Nation (Not a Prospect List)
James Click (Batters-Baserunners Study)
Jeff Shaw (Why I Love Baseball)
David Gassko (BIP/BFP Fielding Study)
Jay Jaffe (Milwaukee Sausage Race)
Jamey Newberg (Remember When)
Bob Klapisch (Press Box to the Mound)
Dan Levitt (Predictive Value of BB)
David Vincent (Official Scorer)
Jon Weisman (Rick Monday)
Larry Borowsky (Let 'er Rip)
Will Carroll (Fictional Short Story)
Bob Timmermann (Japanese Baseball)
Cyril Morong (Best Pitching Seasons)
Sean Forman (Monte Carlo Win-Loss)
Brian Gunn (My Little Blue Book)
Joe Lederer (My Dad and Baseball)
Bill Deane (Bob Gibson, 1968)
Mark Armour (1977 Yankees)
Darren Viola (Retrosheet)
David Pinto (RFK)
Dayn Perry (Brave Heart)
Matt Welch (Dave Hansen)
Kevin Kernan (Jack McKeon)
Tom Lederer (Dodgers Road Trip)
Steve Lombardi (Slider)
Studes (Picturing Baseball)
Mike Carminati (Luck of the Drawl)
Eric Neel (Vin Scully)
J.C. Bradbury (Leo Mazzone)
John Sickels (Bill James)
Search Baseball Analysts
Archives
By Category:
Around the Majors Content Only
Around the Minors Content Only
Baseball Beat Content Only
Baseball Beat/Change-Up Content Only
Baseball Beat/WTNY Content Only
Behind the Scoreboard Content Only
Change-Up Content Only
Change-Up/Around the Majors Content Only
Command Post Content Only
Crunching the Numbers Content Only
Designated Hitter Content Only
F/X Visualizations Content Only
Past Times Content Only
Saber Talk Content Only
The Batter's Eye Content Only
Touching Bases Content Only
Weekend Blog Content Only
WTNY Content Only
By Month:
February 2012
January 2012
December 2011
October 2011
September 2011
August 2011
July 2011
June 2011
May 2011
April 2011
March 2011
February 2011
January 2011
December 2010
November 2010
October 2010
September 2010
August 2010
July 2010
June 2010
May 2010
April 2010
March 2010
February 2010
January 2010
December 2009
November 2009
October 2009
September 2009
August 2009
July 2009
June 2009
May 2009
April 2009
March 2009
February 2009
January 2009
December 2008
November 2008
October 2008
September 2008
August 2008
July 2008
June 2008
May 2008
April 2008
March 2008
February 2008
January 2008
December 2007
November 2007
October 2007
September 2007
August 2007
July 2007
June 2007
May 2007
April 2007
March 2007
February 2007
January 2007
December 2006
November 2006
October 2006
September 2006
August 2006
July 2006
June 2006
May 2006
April 2006
March 2006
February 2006
January 2006
December 2005
November 2005
October 2005
September 2005
August 2005
July 2005
June 2005
May 2005
April 2005
March 2005
February 2005
January 2005
December 2004
November 2004
October 2004
September 2004
August 2004
July 2004
June 2004
May 2004
April 2004
March 2004
February 2004
January 2004
December 2003
November 2003
October 2003
September 2003
August 2003
July 2003
June 2003
Reference
Organizational Stats
Arizona Diamondbacks Bat / Pitch
Atlanta Braves Bat / Pitch
Baltimore Orioles Bat / Pitch
Boston Red Sox Bat / Pitch
Chicago Cubs Bat / Pitch
Chicago White Sox Bat / Pitch
Cincinnati Reds Bat / Pitch
Cleveland Indians Bat / Pitch
Colorado Rockies Bat / Pitch
Detroit Tigers Bat / Pitch
Florida Marlins Bat / Pitch
Houston Astros Bat / Pitch
Kansas City Royals Bat / Pitch
Los Angeles Angels Bat / Pitch
Los Angeles Dodgers Bat / Pitch
Milwaukee Brewers Bat / Pitch
Minnesota Twins Bat / Pitch
New York Mets Bat / Pitch
New York Yankees Bat / Pitch
Oakland Athletics Bat / Pitch
Philadelphia Phillies Bat / Pitch
Pittsburgh Pirates Bat / Pitch
St. Louis Cardinals Bat / Pitch
San Diego Padres Bat / Pitch
San Francisco Giants Bat / Pitch
Seattle Mariners Bat / Pitch
Tampa Bay Devil Rays Bat / Pitch
Texas Rangers Bat / Pitch
Toronto Blue Jays Bat / Pitch
Washington Nationals Bat / Pitch
All-Star Links
Official Websites
News and Notes
Baseball News Blog
Baseball Newstand
ESPN Baseball
Fox Sports Baseball
Pro Sports Daily
Roto World
The Roto Times
USA Today Baseball
Baseball Newstand
ESPN Baseball
Fox Sports Baseball
Pro Sports Daily
Roto World
The Roto Times
USA Today Baseball
Reference and Analysis
Baseball Almanac
Baseball America
Baseball Archive
Baseball Contracts
Baseball Cube
Baseball Graphs
Baseball Library
Baseball Musings Player Database
Baseball Page
Baseball Primer
Baseball Prospectus
Baseball Reference
Baseball Statistics
Baseball Truth
Boxscore Central
Diamond Mind Baseball
Doug's Stats
FanGraphs
Fast Balls (pitchfx catalog)
Hardball Dollars
Hardball Times
Hit Tracker
Retrosheet
Rotobase/Rotoblog
Stat Corner
STATS
Tango on Baseball
Yahoo Sports MLB
Web Gems
Bill James Primer
Sabermetric Manifesto (Grabiner)
Pitching and Defense (McCracken)
Pitching and Defense (Tippett)
Transactions Primer (Neyer)
Baseball Stats (Batter's Box)
Prospect Report (Cameron)
Pitcher Workloads (Sheehan)
Goodbye to Old Baseball Ideas (Rickey)
Sabermetric Manifesto (Grabiner)
Pitching and Defense (McCracken)
Pitching and Defense (Tippett)
Transactions Primer (Neyer)
Baseball Stats (Batter's Box)
Prospect Report (Cameron)
Pitcher Workloads (Sheehan)
Goodbye to Old Baseball Ideas (Rickey)
Columnists
Baseball Blogs
Around the Majors
Athletics Nation
Baseball Crank
Baseball Musings
Baseball-Reference Blog
Batter's Box
Big League Stew
Bronx Banter
Catfish Stew
Cub Town
Dan Agonistes
Dodger Thoughts
DRays Bay
Ducksnorts
Futility Infielder
Halos Heaven
Inside the Rockies
It Might Be Dangerous
Knuckle Curve
LoHud Yankees Blog
Lookout Landing
Management by Baseball
Metaforian
Metsgeek
Mike's Baseball Rants
Only Baseball Matters
Redbird Nation
Red Reporter
Sabernomics (Braves)
Seth Speaks
ShysterBall
6-4-2 (Angels/Dodgers)
The Book
TheCubdom
The Cutting Edge
The House That Dewey Built
The View From The Bleachers
Tiger Blog
U.S.S. Mariner
Viva El Birdos
Where's Kernan
Minor Leagues
Arizona Fall League
BA Player Finder
Cal Leaguers
Jamey Newberg
JDM's Scoresheet Baseball
Minor League Baseball
Minor League Park Factors
Minor League Splits
No Pepper
Sickels' Minor League Ball
Warm October Nights
BA Player Finder
Cal Leaguers
Jamey Newberg
JDM's Scoresheet Baseball
Minor League Baseball
Minor League Park Factors
Minor League Splits
No Pepper
Sickels' Minor League Ball
Warm October Nights
Amateur
Boyd's World (College)
Cape Cod Baseball League
College Baseball Blog
College Baseball Insider
Collegiate Baseball Newspaper
College Splits
College Splits Blog
Dirtbags Baseball (Long Beach State)
NCAA Baseball
NCBWA
Team One Baseball (High School)
Texas A&M & Baseball
Cape Cod Baseball League
College Baseball Blog
College Baseball Insider
Collegiate Baseball Newspaper
College Splits
College Splits Blog
Dirtbags Baseball (Long Beach State)
NCAA Baseball
NCBWA
Team One Baseball (High School)
Texas A&M & Baseball
Historical
Cuban Baseball
House of David
Jim "Mudcat" Grant's Web Page
Negro League Baseball Players Assoc
Negro Leagues Baseball Museum
1919 Black Sox
Pacific Coast League
Philadelphia Athletics Historical Society
Shoeless Joe Jackson Society
SABR-L Archives
Walter O'Malley
House of David
Jim "Mudcat" Grant's Web Page
Negro League Baseball Players Assoc
Negro Leagues Baseball Museum
1919 Black Sox
Pacific Coast League
Philadelphia Athletics Historical Society
Shoeless Joe Jackson Society
SABR-L Archives
Walter O'Malley
Miscellaneous
Forums
Credits
Ticket Center
Tickets to Baseball -
Premium Red Sox Tickets - Tickets to Marlins Games - Cardinals Game Tickets - NY Yankee Tickets - Tickets Oakland Athletics - Dallas Cowboys Tickets - Arizona Cardinals Tickets - Tickets Seattle Seahawks - Buffalo Bills Tickets Online - Tickets to Dolphins Football
Buy Boston Red Sox tickets,
Philadelphia Phillies tix,
NY Yankees tickets,
NY Mets tickets, and
MLB All Star game tickets at ABC tickets
Not sure where to find the best online sportsbooks? Start your search with PlayersJet.
Get deals at SportsMemorabilia.com on baseball apparel, including Phillies jerseys and more for adults and children.
Shop the largest selection baseball equipment on sale at Sports Unlimited. Check out tons of baseball gloves, youth baseball gloves and catchers gear from Rawlings, Wilson, Nike & Under Armour.
2011 Draft Order
Courtesy of Baseball America
First-Round:
 1. Pirates (57-105)
 2. Mariners (61-101)
 3. Diamondbacks (65-97)
 4. Orioles (66-96)
 5. Royals (67-95)
 6. Nationals (69-93)
 7. Diamondbacks (for B. Loux)
 8. Indians (69-93)
 9. Cubs (75-87)
10. Padres (for Karsten Whitson)
11. Astros (76-86)
12. Brewers (77-85)
13. Mets (79-83)
14. Marlins (80-82)
15. Brewers (for Dylan Covey)
16. Dodgers (80-82)
17. Angels (80-82)
18. Athletics (81-81)
19. Red Sox (from DET for Martinez)
20. Rockies (83-79)
21. Blue Jays (85-77)
22. Cardinals (86-76)
23. Nationals (from CWS for Dunn)
24. Rays (from BOS for Crawford)
25. Padres (90-72)
26. Red Sox (from TEX for Beltre)
27. Reds (91-71)
28. Braves (91-71)
29. Giants (92-70)
30. Twins (94-68)
31. Rays (from NYY for Soriano)
32. Rays (96-66)
33. Rangers (from PHI for Lee)
Supplemental First Round:
34. Nationals (Dunn)
35. Blue Jays (Downs)
36. Red Sox (Martinez)
37. Rangers (Lee)
38. Rays (Crawford)
39. Phillies (Werth)
40. Red Sox (Beltre)
41. Rays (Soriano)
42. Rays (Balfour)
43. Diamondbacks (LaRoche)
44. Mets (Feliciano)
45. Rockies (Dotel)
46. Blue Jays (Buck)
47. White Sox (Putz)
48. Padres (Garland)
49. Giants (Uribe)
50. Twins (Hudson)
51. Yankees (Vazquez)
52. Rays (Benoit)
53. Blue Jays (Olivo)
54. Padres (Torrealba)
55. Twins (Crain)
56. Rays (Choate)
57. Blue Jays (Gregg)
58. Padres (Correia)
59. Rays (Hawpe)
| F/X Visualizations | July 31, 2009 |
Measuring a Pitcher's Ability to Locate a Pitch
In many of my past posts I have displayed heat maps showing how a specific value, HR rate, run value, BABIP, varies over pitch location. One thing I mentioned in passing in the BABIP post, but probably should have been mentioning all along is that just because a location is the best to pitch to does not mean a pitcher should attempt to throw it there. We must think about a pitcher's ability to locate and what happens if he misses his spot. MGL put it best in asking this question, in this post at the Book Blog:
Let’s say that pitch f/x data tells us the following about a particular pitcher or group of pitchers:On the average, the run value of a high inside fastball is -.001 where minus is good for the pitcher. The run value of a low outside fastball is +.001. In other words, the run value of the former is better than the run value of the latter.
Now, put all pitch sequence and game theory stuff aside.
In an average situation against an average batter, where those run values above absolutely apply, which pitch should a pitcher attempt to throw, and why? We are just talking about one pitch, and again, put aside anything to do with pitch sequences and game theory.
Zach Sanders provided the answer.
Low and away.Your phrasing: “which pitch should a pitcher attempt to throw, and why?” The key word is attempt. If you make a mistake down and away, you probably won’t get burned as much as if you make a mistake going up.
If he has perfect control, then by all means take the one which the better value, but there is human error involved.
And MGL's further explanation.
You CANNOT use the run values of pitch locations based on hit f/x data to make any decisions about what pitches to throw unless you consider what happens when you miss your exact location (and the distribution of those misses, location-wise), which will happen some non-trivial percentage of the time.I was thinking about the pitch f/x article or two a while back that told us exactly what I told you - that the high inside fastball was a very effective pitch. What the data and article did NOT tell you was the run value of a pitch that was ATTEMPTED to be thrown high and inside. ...
In general the reason why pitchers do NOT throw high and/or inside that much in this day and age is not because they are not man enough anymore as some broadcasters would have you believe, but it is not necessarily because a high inside fastball is a bad pitch (if it hits that location). It is because a miss on that pitch will more often result in a HR (or extra base hit) or a hit batter. As well, batters will take a difficult to hit high and inside pitch more often now than they would in the old days when the strike zone was higher than it is now.
Here is a visual representation of what he is talking about. Below is the run value of a pitch from a right handed pitcher to a left handed batter.
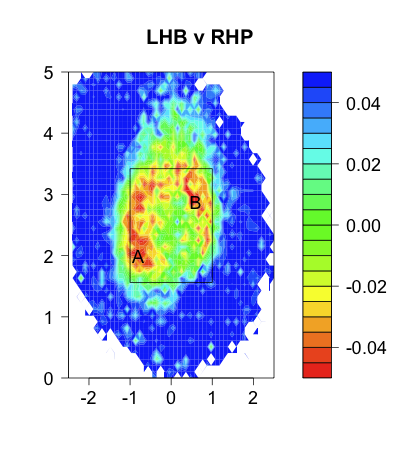
Suppose location B, up and in, has a slightly better for the pitcher run value than location A. So if a pitcher could hit location B exactly that would be the best place to pitch. But if in throwing to B some fraction of the time he misses and the pitch will end up in less favorable place than if he misses pitching to location A. Depending how often he hits his spot, and by far how off he misses he might be better off pitching to spot with a worse run value.
Ultimately what we would want to know is for a particular pitcher, pitch type and pitch location the probability density function of where the pitch will end up. This combined with the run value map would give us an expectation of the run value if that pitcher attempts to throw to a given location.
We do not have that information now, and we will probably never have anything that specific. But, if we knew the location of the catcher's mitt we would have some indication of where a pitch was intended. This was brought up at both pitchf/x summits and Marv White of Sportvision said that is it possible given the current technology, but not at the top of their list of things to do. There is some discussion over at the Book Blog about how hard it would be to collect this data and how much information it would give us. Either way I add my vote to that of other analysts interested in that data.
Without that though, I wanted to see if I could estimate how close a pitcher comes to hitting his spots. Again, without knowing where each pitch was intended to go this is impossible, but I think we can get an estimate for at least one pitcher. Again I turn to Mariano Rivera. Check out the location of his pitches to LHBs.
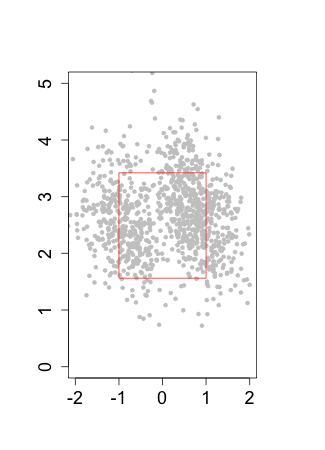
The vertical location varies quite a bit, but there are two clear horizontal areas he pitches to. If we assume that he intends to throw all of his pitches to just either inside the right edge of the zone or just inside the left edge of the zone we can then see how close he is, along the horizontal axis, to hitting his spot.
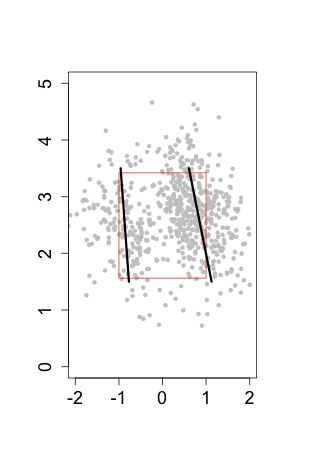
I do think he probably varies the intended horizontal location by count. Probably intending to pitch closer to the zone when he has three balls, and pitching even farther on the edge when he is ahead in the count. So I am goign to restrict my attention to pitches from 0-0, 1-0, 0-1 and 1-1 counts.
Since the horizontal location varies by vertical location I am going to look at the deviation from the black lines below.
Here is a histrogram of the deviations from these black lines.
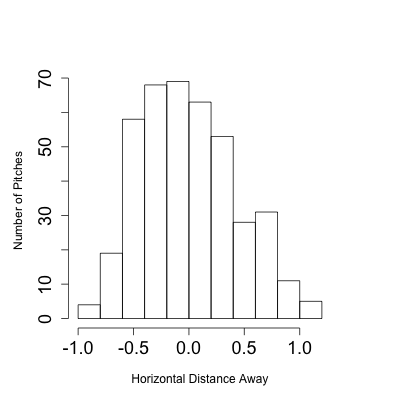
Over 75% of his pitches are within half a foot to either side of the target along the horizontal axis. In other words 75% of the time he can get his pitch within a 1-foot horizontal strip. Over 50% of his pitches are within 1/3 of a foot to either side of his target along the horizontal axis. So half the time he gets it in a 8-in horizontal strip.
This all assumes that you believe that he is always throwing at one of two targets. If you think he aims at a range of horizontal locations, then the variation I have measured is partially from those range of locations and partially from his ability to locate. In that case I am ascribing some variation in intended location to his ability to locate, so I think you can these numbers as the least accurate he could possibly be. They, also, says nothing about how far he is from his intended target along the vertical axis, because I have no way of knowing his intended vertical target.
I think of this as a first attempt at measuring how close a pitcher is to hitting his intended location. Catcher mitt location data will get us closer to measuring it, but it is probably something we will never be able to fully measure.
| Designated Hitter | July 30, 2009 |
The Staticky Charm of AM Radio
There's something human in static. Record collectors are fond of saying vinyl recordings have a warmer sound than their digital brethren, but I think the real humanity is in the airwaves.
I.
Medium wave amplitude modulation radio broadcasting was invented just a few years after the dawn of the modern era in baseball (when the rules we are familiar with today became codified). Guglielmo Marconi was awarded the first patent for the radio in the United States in 1900. Six years later, Reginald Fessenden propagated the first AM transmission from Brant Rock, Massachusetts. Radio remained a hobbyist's pursuit until it exploded in the wake of World War I. The 1920s heralded the beginning of the Golden Age of radio. It is no coincidence that the 1920s also represented the Golden Era of baseball.
Radio represented one of the first mass-media in the United States. Just as mass media were fueling national culture and the development of full-fledged consumer culture in the 1920s, so too was radio building the very first media markets. The first radio call of a live baseball game was broadcast on the first commercial radio station, Pittsburgh's KDKA. On August 5, 1921, Harold Arlin used a shoestring setup (he used a modified telephone) at Forbes Field to announce a contest between the Pirates and the Phillies.
The Pirates won 8-5. It was a brief game, lasting less than two hours, but featured a home run by Phillies centerfielder Cy Williams and a triple by Pirates third baseman Clyde Barnhart. It must have been thrilling to hear Arlin describe that moment when a runner approaches second base so fast that it dawns upon the announcer that the runner might just be headed for third.
For several years, subsequent broadcasts were not conducted live, but rather were recreations from play-by-play wire accounts. They often lagged innings behind the action on the field. But they also opened up the game to a broader audience. Despite owners' fears that radio would discourage fans from showing up at the ballpark in person, the prevalence of baseball radio broadcasts grew apace. As radios became centerpieces of the American living room, baseball enmeshed itself as part of the daily life of millions.
II.
The reality of a live broadcast is that the time is difficult to fill, and the long pauses or awkward attempts at filler make the broadcasts intimate. Indeed, Harold Arlin remembered not being exactly sure what to do or say:
"Nobody told me I had to talk between pitches [...] Sometimes the transmitter didn't work. Often the crowd noise would drown us out. We didn't know whether we'd talk into a total vacuum or whether somebody would hear us."
What's remarkable about baseball on the radio is just how much sense it makes. Most sports are chaotic, with infinite possible constellations of players on the playing surface. In baseball, there is only the count (of which there are only twelve states), the base/out situation (of which there are 24 states), and the inning (which of course there are usually nine). When the announcer relays that the shortstop, batting in a 2-2 count with runners on the corners, has roped a line drive down the third base line, you can imagine just what it looks like. With that sort of information alone, millions of boys and girls have surreptitiously used a transistor radio to reconstruct the Polo Grounds or Shibe Park right there in English class.
For decades' worth of Opening Days, the transistor radio was a shibboleth for manic baseball fans celebrating for the first time all winter the rich sounds of staticky play-by-play in their ear. You can make us work or go to school, they secretly shared, but you cannot make us pay attention.
And the broadcasters were our friends. They spent so much time talking into the emptiness and to each other that radio broadcasts became intimate. Radio announcers Graham McNamee, Red Barber, Mel Allen, Jack Brickhouse, Vin Scully, Harry Caray, and Harry Kalas (and countless others) became as members of an extended family.
III.
A few select stations pumped their frequencies with such potency that their broadcasts arced along the contours of the earth, through hills and mountains all but unimpeded, to even rural communities (the places we today call exurbs). Clear channel AM stations (like New York's WFAN and Chicago's WGN today) had no competition on their particular frequencies for hundreds of miles, allowing them to reach hundreds of thousands of households with every broadcast.
Slowly, radio broadcasters cottoned on to the cadence and style of a live broadcast. They began to fill up the empty space between pitches with players' statistics, provided to them on mimeographed sheets reproduced from media guides. Their catchphrases became just as reconstructable as the base-out state on the field. They were indelibly marked into memory.
Slowly, media markets emerged. Regional rivalries heightened as fans followed every play of every game and homer announcers embellished and enlarged the truth. Before there were regional television deals or network-neutrality violating online streaming video websites, a team's radio station provided the crucial link between fans and teams that remains the solitary reason why baseball became America's pastime.
IV.
The beginning of the decline of baseball on the radio was marked by one of baseball's iconic moments. It was one of those giants of broadcasting, the voice of the Giants, Russ Hodges, who penned its first epitaph. On October 3, 1951, Bobby Thomson roped a line drive off Ralph Branca over the left field fence at the Polo Grounds, giving the Giants a ticket to the World Series. Even to someone like me, much too young to have experienced the Shot Heard 'Round the World myself, it sounds more like this:
"There's a long drive--it's gonna be, I believe--THE GIANTS WIN THE PENNANT! THE GIANTS WIN THE PENNANT!"
Coincidentally, the third game of the three-game tiebreaker was also the first coast-to-coast live broadcast of a baseball game on a different frequency band: VHF television. NBC broadcaster Ernie Harwell's pedestrian call ("It's gone!") goes unremembered. In fact it is a sort of cosmic accident that Hodges's radio call was recorded at all, as a fan happened to record the final few innings to share with a friend.
Even though millions caught the game on the radio, the fact that something so spectacular happened on the live television broadcast made everyone who saw it an instant convert. Brian Biegel, in Miracle Ball (which chronicles his search for the Thomson home run ball) quotes Hall of Fame curator Ted Spencer:
"It was a special moment because it may have been the first thing we saw on TV in our house--1951 was the year we got a TV. I've always talked about it as baseball's first TV event. That home run was played continually all that night. Remember, there's no satellite, there's no twenty-four-hour-a-day news. News was fifteen minutes in those days--6:00 to 6:15 local and 7:00 to 7:15 NBC. But it was all over the place. It was fabulous. I think from that point on, baseball and TV really came together."
Regularly scheduled television programming had begun just four years prior to the Shot Heard 'Round the World. In 1950, just 9.0% of American households had a TV set. By 1951, the number was 23.5%, the largest year-over-year percentage point increase on record. And for all those early adopter households, this was one of the first "event television" moments. While radio remained an important part of baseball broadcasting, it never again held the place it once did.
V.
My experience with baseball on the radio has been very personal. As a young boy (an only child, no less), I would sneak to my family computer, which was the first I had used with a microphone. I would imagine a situation--inevitably the ninth inning and certainly with the bases loaded. Somehow it always seemed that Darren "Dutch" Daulton was at the plate (although on his nights off, John Kruk could pinch hit). Huddled next to the Macintosh SE, I would record myself doing Harry Kalas's home run call over and over again: "Outta heeeeere!" I can only imagine how many other kids have done the same thing (or perhaps some slightly less technological analog) since baseball was first broadcast over AM radio.
I don't dislike baseball on television; of course I enjoy watching it. I enjoy following a game on the computer with Gameday because it allows me the same sort of constructed reality that the radio did. Now that streaming video and audio are available on cell phones and laptops I wonder about the fate of that essential baseball institution, the radio broadcast. We live in a world of blackouts and interrupted coverage, of Joe Buck and Scooter the animated baseball. They spend so much time filling the pauses, and they say so little of much importance, because they really don't have to say anything. The action, after all, is right there to watch on the field. With the recent news that Vin Scully plans to retire after the 2010 season, I worry that we may be witnessing the final years of baseball on the radio.
I hope that the radios--the ones on workbenches and in cars, the ones stowed away in school lockers and backpacks, the ones perched on radiators in bathrooms and high up on the shelf at gas stations--I hope they don't disappear. Because to listen to baseball on the radio is to imagine the game, to imagine yourself there, to imagine the men in the booth. If it dies, I fear we will lose that imagination as well.
----------
Tommy Bennett writes for Beyond the Boxscore. He is a law student living in New York and a lifelong Phillies fan.
| Change-Up | July 29, 2009 |
How Close Are the O's?
 Just like each of the previous 11 seasons, it's been a tough year of baseball in Baltimore. They're 42-57 and in last place in the American League East. Almost without question, they will end up in last place, too. The Orioles will not even sniff 80 wins, a mark the franchise has failed to reach every season since 1997. You could forgive an Orioles fan for losing hope.
Compounding matters is the fact that Major League Baseball forces Baltimore to play an unbalanced schedule against some of the league's best teams. They will have played 57 games against the New York Yankees, Boston Red Sox and Tampa Bay Rays by the end of the season, clubs sporting the top three run differentials in the American League and three of the top five in all of baseball. The Toronto Blue Jays, the other American League East team, is not so bad either.
Despite all of this, there is ample cause for optimism in the Charm City. The Orioles boast an offensive core they can build around to go along with some of the most promising pitching prospects in all of baseball. Moreover, close to $46 million of payroll will come off the books after the 2009 season. The Orioles will be in a position both to promote good players from within and leverage new-found financial flexibility to fill holes. And before we get too far ahead of ourselves, they might also be able to address the 2010 club and beyond before Friday's trade deadline.
Let's take a look at what their 2010 lineup and pitching staff might look like and try and figure out what they might do to give themselves the best shot to compete next season (2009 stats shown below).
The Lineup
POS Name       Age  Level(s)   AVG   OBP   SLG
C   Wieters    23   AAA/MAJ   .289  .356  .446
1B  Snyder     22    AA/AAA   .300  .371  .501
2B  Roberts    31     MAJ     .279  .342  .434
3B  Wigginton  31     MAJ     .256  .303  .385
SS  Izturis    29   MAJ/AA    .263  .296  .320
LF  Reimold    25   AAA/MAJ   .327  .413  .565
CF  Jones      23     MAJ     .297  .352  .488
RF  Markakis   25     MAJ     .292  .348  .463
DH  Scott      31   MAJ/L-A   .283  .367  .546
Baltimore can count on average or better production from catcher, second base, all three outfield positions and designated hitter. From there, Baltimore President of Baseball Operations Andy MacPhail will be forced to make a series of judgment calls, beginning this week. Will Brandon Snyder be ready to fill everyday duties at first base (or DH if you want to slide Luke Scott to 1st)? What can George Sherrill get in the form of a third baseman or shortstop? Might Brian Fuentes' recent struggles compel the Angels to bid for Sherrill's services? Have they soured on Brandon Wood given his career .188/.250/.280 Major League mark? Wood would almost certainly be too much for Sherrill alone but what about Dodgers third base prospect Josh Bell? The National League's best club is rumored to be interested in Sherrill.
There are also a number of options on the free agent market. Adrian Beltre's offensive struggles this season might mean that he could be had on the cheap. He remains a top-notch defender and is a strong bounce-back candidate at the plate given how precipitous his decline has been. Chone Figgins might be another option at third, an all-around good guy who has won a lot and could be a terrific influence on a young team.
If Baltimore does not think Snyder is ready for an everyday job and decides to move Scott to first, maybe they could pursue a full-time DH like Vladimir Guerrero or Jermaine Dye. The 2010 free agent class of shortstops is thin but a number of them would represent an upgrade over Izturis. If Baltimore could acquire Marco Scutaro, Jack Wilson, Adam Everett or Orlando Cabrera at a reasonable price, it may be well worth their while.
In Matt Wieters, Brian Roberts, Nolan Reimold, Adam Jones, Nick Markakis and Luke Scott, the Orioles have a legitimate offensive nucleus. What they do to fill in the holes will go a long way in determining the type of season they have in 2010.
Pitching
Name      Age  Level(s)   IP    K/BB   WHIP   ERA
Uehara    34     MAJ     66.1   4.00   1.25  4.07
Guthrie   30     MAJ     115.1  1.82   1.38  5.23
Bergesen  23   AAA/MAJ   127.0  2.06   1.24  3.47
Hernandez 24  AA/AAA/MAJ 106.0  3.12   1.17  3.23
Tillman   21     AAA     96.1   3.81   1.15  2.71
Matusz    22   H-A/AA    111.1  3.87   1.05  1.94
Arrieta   23    AA/AAA   104.1  2.83   1.26  3.36
Berken    25  AA/AAA/MAJ 95.1   1.63   1.42  4.81
This is the part where O's fans should start to salivate. Chris Tillman will start tonight against Zack Greinke and the Kansas City Royals, which may well be the beginning of an era in Baltimore. Tillman, along with Brian Matusz, are both top-10 Baseball America prospects. Jake Arrieta gets honorable mention on the Baseball America midseason top-25 list.
Add some combination of these three to a healthy Koji Uehara (awesome periphs), David Hernandez and Brad Bergesen (two youngsters who have made the jump), and Jeremy Guthrie (a track record of MLB success) and all of a sudden the Orioles are looking at a very nice starting pitching staff. Baltimore's rotation will be its meal ticket for 2010 and beyond.
==========
Given their youth, Baltimore might consider tacking on a free agent to the rotation. They will also have to cobble together a bullpen. But as it stands right now this Orioles starting staff looks like it will be able to post a season's worth of above average pitching in 2010 and quite a bit better than that in 2011 and out. When you combine this with their offensive nucleus, the Orioles appear positioned to make the moves necessary to put a contender on the field.
Regardless of what they do at the trading deadline and during this upcoming off-season, Baltimore will field a young, talented group of players in 2010. But given the amount of salary coming off the books, Andy MacPhail has an opportunity to compete sooner rather than later and he should go for it. While Baltimore might be out of it for 2009, with Tillman on the bump and Wieters behind the plate tonight, there will be no mistaking for O's fans that the future has indeed arrived for a franchise looking to reclaim its proud history.
Thanks to Cot's Contracts and Baseball-Reference for much of the data contained herein.
| Behind the Scoreboard | July 28, 2009 |
Two Strikes, You're Out? Could Baseball Improve the Game By Altering One of Its Fundamental Rules?
Last week I wrote an article analyzing how batters and pitchers work the count. I led off the piece by talking about how the rules codifying four balls for a walk and three strikes for an out were fundamental foundations of the game. While it's hard to imagine otherwise, there's no real rhyme or reason why these numbers were chosen - they simply worked well and over time they became tradition.
The rules weren't always the same. In 1879, the rules were originally nine balls for a walk. The number of balls for a walk were gradually reduced to four balls to a walk by 1889. The number of strikes for an out was also temporarily changed in 1887 from three strikes to four. For the last 120 years however, the rules have been the same.
Of course, today nine balls to a walk sounds ludicrous - pitchers would simply dally and work around the strike zone trying to get a batter to chase a pitch outside, leading to interminable at-bats and increasingly long games. Clearly, reducing the number of balls required for a walk was a wise move and the same goes for reducing the number of strikes from four to three. But did the founders of the game go far enough?
The Long Count
One thing I noticed last week when I looked at how pitchers and hitters work the count, is how most of the action happens deep into the count. The ball is rarely hit into play on the first pitch. Why this occurs is understandable. With plenty more opportunities, the batter wants to swing only at pitches he thinks he can drive. Meanwhile the pitcher, with four balls to work with, is not going to give in and throw a get-me-over pitch on the first pitch. Hence, the pitcher nibbles and the batter takes the pitch a large majority of the time. The result is while 46% of all pitches are swung at, batters swing at only 28% of first pitches. Meanwhile, while 19.7% of all pitches are put into play, this is reduced to only 12.6% on the first pitch. A table of the percentage of pitch outcomes in each count is reproduced from last week's article below.
This is fine from a player's standpoint, but from the stands, this is an unappealing outcome - it's simply not exciting to watch a batter take a pitch - it prolongs the at-bat and doesn't add a lot to the game. As you can see, the counts involving no balls or no strikes have lower in-play rates than deeper counts. This is especially true when the count is 3-0 - the batter swings just 3% of the time - not exactly action packed excitement. From the fans point of view, if these types of actionless counts could be eliminated, it might be a good thing.
What If?
So, what if the founders had continued reducing the number of pitches required for a walk or a strikeout? Would the game look basically the same, except with the number of pitches reduced, or would the game be radically altered?
What would happen if it only took three balls for a walk and two strikes for an out? We can get a fair approximation of what that would look like by taking a look at how hitters fared once the count had already reached 1-1. At that point, it takes three balls for a walk and two strikes for an out - exactly the rule change we are considering. Now, things of course might be slightly different with the batter essentially starting from a 1-1 count rather than working to a 1-1 count, but I think the parallel is a fair one.

Taking a look at the above chart (for 2007 data), I'm struck by how similar the data for 1-1 counts are to the overall data. Granted, the overall production is slightly less - instead of a .268 BAV, players would hit just .250, with similar reductions in OBP and SLG, but the change is hardly drastic. Additionally, the doubles, triples, and homers would be very similar to what they are now.
What is most surprising perhaps, is how constant the walk and strikeout rates are. With the rules set at three balls and two strikes, one would think there would be vastly more walks and strikeouts than currently exist - and if this were true, it would likely be an aesthetic drawback. But surprisingly, the walk rate with a 1-1 count is nearly exactly the same as the walk rate with an 0-0 count! Despite the fact that pitchers only have three balls to work with, they are able to limit base-on-balls to the same levels as when they have four balls to work with. There would be slightly more strikeouts with a 3 ball, 2 strike rule, but the number is not vastly different - an increase from 17% to 21%.
Comparing these numbers to those from other eras in baseball history, we see that the game under this proposed rule change fits right in with other periods of baseball history. The chart above shows the rates of hitter outcomes under the new rule change, and rates of outcomes during various eras of baseball history. As we can see, many other fluctuations in the game's history were much stronger than what we would likely see if the game adopted the three ball, two strike rule. In fact, the game, in terms of run scoring, would look very similar to the game in 1985, with very similar BAV/OBP/SLG splits. The only real difference would be that a higher proportion of the outs would be strikeouts.
While one can debate the aesthetic merits of the strikeout, the number of strikeouts has steadily increased throughout baseball history and nobody has seemed to mind all that much. The proposed rule change would increase the number of strikeouts by about 25% over its current level. That may sound like a lot, until you consider that baseball has increased the number of strikeouts by about that same percentage during the last 25 years and nobody has really seemed to complain or notice much at all.
Advantages of a 2-1 Full Count
The advantages of the reduction in the number of balls and strikes required for a walk or a strikeout respectively is obvious. Less downtime and more action. The rule change would force pitchers and batters to get down to business sooner. The pitch data indicates that the batter and pitcher are nibbling and being selective early in the count (with good reason), and the fact that the hitter outcomes are basically the same with a 1-1 count indicates that there is no fundamental reason for such a long count.
With three balls to a walk and two strikes to an out, a fair amount of the fat would be cut out of the game. Currently, there are 3.77 pitches per plate appearance. With the reduced count, this number would decrease to just 2.81 pitches per plate appearance. This would cause a 25% reduction in pitches, meaning that the games would be much shorter and pitchers would be able to go much deeper into games. Instead of the average game taking 146 pitches to complete, the average game would take just 109 pitches, meaning that pitchers could once again consistently throw a complete game - another aesthetic plus (from my point of view). Of course, since the best pitchers could now pitch longer, this would likely reduce scoring even a bit more than the table above, but it's not clear by just how much. Game lengths, if they were reduced by the same percentage, would be cut from 2 hours 47 minutes down to 2 hours 6 minutes - all while keeping basically the same amount of action and excitement in the game.
If the rule were truly adopted, it might be wise to couple it with an advantage for the hitter, such as a lowering of the mound, to limit the increase in the strikeouts and keep run scoring more similar to the current levels. Still, even if no such rules were adopted, the run scoring environment would likely be similar to that of many other eras in baseball history.
Blasphemy!
Of course, such a change in practicality is unimaginable. Baseball simply doesn't change 100 year old rules and purist fans simply would never have it. The public outcry would be huge. The association of three strikes to an out is so strong that it has permeated not only the consciousness of every baseball fan, but has worked its way into many other parts of American society. To many, it just wouldn't be right to be called out on only two strikes. Of course, tradition alone does not make something right.
While I propose this rule change in half-jest, I do believe that had the founders reduced the number of balls and strikes in the 19th century, we might have a better and more enjoyable game today - one that at its core is essentially unchanged, with the same outcomes and action we are used to, without a lot of the downtime which many fans find unappealing about the game.
| Baseball Beat | July 27, 2009 |
A Tribute to the Society for American Baseball Research
The Society for American Baseball Research meets for its annual convention in Washington, D.C. this week (July 30-August 2).
Known as SABR 39, the schedule includes 42 research presentations by members, including incoming president Andy McCue (American League Expansion of 1961), Mike Emeigh (Bullpen Evolution, 1960-2008), Retrosheet founder David W. Smith (Does Running the Bases Harm Pitching Performance?), Steve Treder (The Value Production Standings, 1946-2008), Chris Jaffe (The Baseball Philosophy of Charles Comiskey), Phil Birnbaum (Do Players Try Harder When a Big Goal is in Sight?), and Mark Armour (A Tale of Two Umpires).
The schedule of events also includes MLB and Negro Leagues player panels, more than 20 committee meetings, a Library of Congress presentation, Retrosheet's annual meeting, an awards luncheon, and three ballgames (Red Sox @ Orioles on Friday night, the Potomac Nationals on Saturday evening, and the Southern Maryland Blue Crabs on Sunday afternoon.
One of the many benefits of being a member of the Society for American Baseball Research (which I originally joined during the early 1980s and returned more than five years ago) is access to the organization's SABR-List Digest, a moderated research and information forum that is circulated via email to subscribers on a daily basis. In honor of SABR and its annual convention, I wanted to share highlights of the SABR-L for the past week.
1. September 6, 1995: Cal Ripken breaks Lou Gehrig’s consecutive games played record at Camden Yards
2 (tie). 1954: Major league baseball returns to Baltimore as the transplanted St. Louis Browns become the new Orioles
2 (tie). April 6, 1992: Camden Yards opens, the first of the nouveau-retro style ballpark copied by major- and minor-league teams since
4. October 15, 1970: Orioles win the World Series at Memorial Stadium; Brooks Robinson named Series MVP
5. October 9, 1966: Orioles first World Series championship at Memorial Stadium
6 (tie). February 6, 1895: Babe Ruth is born in Baltimore
6 (tie). 1971: The Orioles boast four 20-game winners in their starting rotation: Dave McNally, Jim Palmer, Mike Cuellar and Pat Dobson
8. December 9, 1965: Frank Robinson, an “old 30,” joins Baltimore in a trade with Cincinnati for Milt Pappas, and wins the Triple Crown in ‘66
9. 1988: The Orioles’ 21-game losing streak to start the season
10. 1901: Major league baseball returns to Baltimore as the Orioles join the American League
Billy Hamilton, 05/17/1893 @ PHI
Vic Power, 05/07/1957 @ KC
Darin Erstad, 06/25/2000 @ ANA
Reed Johnson, 06/15/2003 @ TOR
7/4/1908—George Wiltse, NY Giants vs. Philadelphia Phillies, (hit George McQuillen with pitch; Wiltse finished with a 10-inning no-hitter)
8/5/1932—Tommy Bridges, Detroit vs. Washington, Dave Harris
6/27/1958—Billy Pierce, Chicago White Sox vs. Washington, Ed FitzGerald (2B)
9/2/1972—Milt Pappas, Chicago Cubs vs. San Diego, Larry Stahl (walk; Pappas finished with a no-hitter)
4/15/1983—Milt Wilcox, Detroit at Chicago White Sox, Jerry Hairston
5/2/1988—Ron Robinson, Cincinnati vs. Montreal, Wallace Johnson
8/4/1989—Dave Stieb, Toronto vs. New York Yankees, Roberto Kelly (2B)
4/20/1990—Brian Holman, Seattle vs. Oakland, Ken Phelps (HR)
9/2/2001—Mike Mussina, New York Yankees at Boston, Carl Everett
You can access additional no-hit esoterica compiled by Thornley.
The purpose of the Society for American Baseball Research, which was formed in August 1971, is to foster the research, preservation, and dissemination of the history and record of baseball. According to its "About Us" page, SABR shall carry out that mission through programs:
1) To encourage the study of baseball, past and present, as a significant athletic and social institution;
2) To encourage further research and literary efforts to establish and maintain the accurate historical record of baseball;
3) To encourage the preservation of baseball research materials; and
4) To help disseminate educational, historical and research information about baseball.
You can sign up to become a member of the Society for American Baseball Research here.
| Change-Up | July 25, 2009 |
Please Know This: Dwight Evans was Much Better Than Jim Rice
Living in Boston I can tell you that the ridiculous tenor of the Jim Rice adulation and yes, revisionism, is in high gear on this induction weekend. It's to the point where people are now just making stuff up about the guy. Roger Clemens and Wade Boggs will watch Jim Rice's #14 retired at Fenway Park before #21 or #26 decorate the right field facade. It's all very silly.
But that's ok. The Rice ship has sailed. He's going to be inducted into Cooperstown tomorrow and he will not be the worst player in the Hall of Fame. What grates as a Red Sox fan, however, is just how overlooked Dwight Evans has become. In that spirit, I am going to re-run my first columnn that I wrote for Rich here at Baseball Analysts, a comparison of Evans and Rice.
The debate is a bit played out in baseball internet circles but nonetheless the timing is right. If the Boston Globe can devote full sections to Jim Rice, I can remind our little audience of just how good Dwight Evans was; how he was a better hitter, fielder and baserunner than Rice. Oh and he played longer. We've moved so far beyond the AVG/HR/RBI era of evaluating baseball players that Rice's inclusion and Evans's exclusion serves only to discredit a once venerable institution.
Without further ado, here is my post from January 10, 2007.
==============================
For my introductory Change-Up post at Baseball Analysts, I thought I would tackle something near and dear to my heart. It's a topic that also represents a hat-tip of sorts to my past, both as a fan and blogger. So let's get to it.
Based on the numbers below, which player would you contend had the better career?
           GAMES  AVG  OBP  SLG  OPS+
Player A:  2,089 .298 .352 .502  128
Player B:  2,606 .272 .370 .470  127
Here are some additional numbers, including plate appearances, total bases, bases on balls, outs made and times the player grounded into a double play:
           PA     TB     BB     OUTS   GIDP
Player A:  9,058  4,129  670    6,221  315
Player B: 10,569  4,230  1,391  6,965  227
To give you a sense of peak value, here are their respective best five seasons in terms of OPS+:
Player A    Player B
  158         163
  154         156
  148         148
  141         147
  137         137
To my eye, they look pretty comparable, though I would take Player B's career. He played longer, had a slightly better peak, and derived more of his offensive value from his on-base percentage than he did from his slugging percentage. Quality and quantity. The best of both worlds.
Now what if I told you that Player B played right field and Player A left field? The same output from a right fielder as a left fielder will always be more valuable from the guy playing right because it is a more demanding defensive position. And then what if I told you Player B also won eight Gold Gloves while Player A was considered a mediocre defender at best?
And then what if I told you that the two were not only contemporaries, but teammates? Wouldn't it stand to reason that the media and general public could come to a fair assessment of who the better player was?
Well in case you haven't yet figured it out, Jim Rice is Player A and Dwight Evans is Player B. Rice received 63.5% of Hall of Fame votes yesterday, making him a likely bet to get in on next year's thin ballot. Dewey, on the other hand, never managed 8% of the votes and only managed to stay on the ballot for three years.
So why the perception gap? I have a few theories. For one, Rice had his best seasons early in his career and leveled off some thereafter while Evans started relatively slowly and became a superstar during the middle part of his career. It seems that each had their reputations solidified during their early years - Rice as the superstar and Evans as the good defender with an OK bat.
Also, Rice's best seasons, particularly 1977 and 1978, came for some very good Boston Red Sox teams while Evans did his best work for more mediocre editions of the Carmine Hose in the early 80's. Further, Rice excelled in the back-of-the-trading-card AVG/HR/RBI numbers whereas Evans stood out because he walked a lot, mixed in some pop and played great defense. Evans's statistical edges come in categories less valued by the mainstream. Take all of this together and the inexplicable, that fans and media alike recall Rice's work more favorably than Dewey's, becomes a little easier to account for.
Fan opinion is one thing. Fans are busy. Fans have jobs. Fans do not devote their professional lives to the coverage of baseball. But the media owes the game and the integrity of the Hall of Fame more - not the least of which is a good faith attempt at understanding the sport. Wouldn't it be more useful for you to know, say, that Evans twice led the American League in OPS while Rice did just once (something I had no idea of before researching for this piece) than to listen to story after story about how "Rice was the most feared hitter in the league for a decade?"
Dwight Evans was a better player than Jim Rice and yet the Baseball Writers' Association of America would have you believe that they were not even in the same galaxy as players, with the conventional wisdom being that Rice was better. Well you can take the more "feared" guy. I'll take the more durable player who was the superior offensive force, defender and baserunner.
| Baseball Beat | July 24, 2009 |
Breaking News: Cards Deal For Holliday
ESPN's Buster Olney is reporting that the St. Louis Cardinals and Oakland Athletics have completed a trade, sending outfielder Matt Holliday in exchange for third baseman Brett Wallace, outfielder Shane Peterson, and righthanded pitcher Clayton Mortensen.
Shortly after the news broke, Brian Gunn, everyone's favorite Cardinals blogger when he was maintaining Redbird Nation during the middle part of the decade (has it really been four years, Brian?), sent me an email with his initial thoughts and asking for my "more objective opinion." Here is our exchange, which took place only minutes ago...
Brian: Supposedly the Cardinals just traded Brett Wallace, Clayton Mortensen, and Shane Peterson for Matt Holliday. This is an email I wrote to some friends of mine about my reaction. Any thoughts? (My gut reaction to this deal was very negative, so I might be trying to talk myself into something. I need a more objective opinion.)
As I see it, the pros to the deal are:
1. It makes us better this year (we have a very winnable division, and Rick Ankiel can no longer start)
Rich: Yes, for sure.
Brian: 2. We can sign Holliday long term (he's not that old -- 30 in January, and we don't really have any major league OFers in the pipeline).
Rich: Uhh, maybe (although I don't see that happening unless the market for corner outfielders remains as weak as it was last year). No hometown discounts from Boras. Just check with the Angels re Mark Teixeira.
Brian: 3. Holliday runs and fields well, and he rarely gets injured, so he could age well.
Rich: I would agree with that. He is a good athlete (one of the best HS QB when Carson Palmer was a senior). He is also a good clubhouse-type presence from what I can tell. The latter might be more important down the stretch than how he ages because I don't see the Cardinals signing him longer term.
Brian: 4. Wallace is impressive, but not THAT impressive -- he took a tiny step backwards this year and he can't field and you can't move him to first.
Rich: Right. He can hit, more for average than power. I see him as a .300 type with 20 HR (maybe 25-30 in his peak season). He has big, thick thighs and will be a liability on the bases and at third base longer term. His future is at first base, which was taken last time I checked. However, he could have filled the gap at the hot corner, then moved to first just about the time Albert Pujols leaves STL to don the pinstripes.
Brian: 5. The move placates Tony La Russa and Pujols -- keeping Pujols happy is huge, and keeping TLR happy is also fairly necessary, especailly if you want Dave Duncan to stick around.
Rich: Makes sense on all fronts.
Brian: 6. If Holliday walks after this year, we could get a type A draft pick (which is basically how we got Wallace just 2 years ago).
Rich: Or two type A's, no?
Brian: 7. Mortensen hasn't shown he's any good. (Peterson, I don't know much about, but he does look like he can get on base, and he's only 21, so who knows. Although I don't know why Billy Beane was in the driver's seat so much that he could demand those 2 extra players. Wallace should've been enough.)
Rich: I'm very familiar with Peterson as he played his college ball at Long Beach State. A good average, gap power-type hitter. Could play corner OF or 1B. I like him but am unsure as to whether he projects as a starter on a championship-caliber team, a starter on a second-division club, or as a backup.
Brian: The cons:
1. We gave up too much. We probably could've had Adam Dunn (a better player, despite his awful fielding) much more cheaply, and I doubt the A's were getting any better offers, plus they basically had to move Holliday, so we should've been in more of a position of strength with them.
Rich: I prefer Holliday over Dunn in the NL. I think the latter's outfield defense is so "poorish" that he would be a problem, particularly on a "pitch to contact" type staff like STL.
Brian: 2. Holliday is not a huge bat -- he's never slugged .500 away from Coors (not in any season on the road, and not this season in Oakland).
Rich: I pointed out his good but not great road stats last year and many sabermetricians made a big deal out of his outstanding OPS+ rather than his home/road splits, thinking this was a better way to evaluate him. I beg to differ but what do I know?
Brian: 3. Holliday is overpaid -- important when you consider trying to sign Pujols (plus Joel Pineiro after this season, plus arb to Ryan Ludwick), and with Boras as his agent will stay overpaid.
Rich: Yes, yes, and yes.
Brian: 4. The move might indicate that La Russa, and not John Mozeliak, wears the pants in the Cardinals family -- not terribly encouraging.
Rich: I wouldn't let that minor issue, if true, bother me too much. Mike Scioscia has a say in personnel with the Angels and that's totally fine by me.
Brian: 5. Holliday is about to turn 30 and his defensive stats have been slipping -- perhaps he won't age so well.
Rich: Again, not terribly important in my mind.
Brian: 6. Combined with the Chris Perez/Mark DeRosa deal, this is another sign the Cards are cutting corners on 2010-2015 at the expense of 2009, and I'm still not sure we're good enough to get past the Dodgers or Phillies in 2009 (then again, people have estimated the value of making the playoffs -- in terms of increased ticket sales, etc. -- at $25 million on up, so this could play for itself).
Rich: Yes, an important takeaway. Not the first time either, right?
Brian: All in all, the more I think about this deal, the more I think it could be worth it. I think we gave up more value than we needed to, and I don't think Holliday is quite the player people think he is, but I think it's fair to try to go for it now. I guess the deal hinges on whether or not you think of the Cards as a win-now team (and with Pujols and Chris Carpenter at their peaks, and the window closing on both of them -- Carp b/c he's not the most durable guy, Pujols b/c we don't have him signed forever -- I can see the argument for that) or a team of the future (when you look at Colby Rasmus and our decent farm system and all our rookies this year, I can see some argument for that, too). I suppose I lean a little more toward "win now," which sorta outweighs my reservations about the pure value-per-dollar aspects of this trade.
Rich: Flags fly forever.
| Behind the Scoreboard | July 24, 2009 |
Perfect Games and Probabilities
As everyone is surely aware, Mark Buehrle pitched baseball's 18th perfect game yesterday afternoon. Now that Buehrle has joined one of baseball's most exclusive clubs, let's see where he fits in. Buehrle is an outstanding pitcher, but not one of the game's all-time greats, and likely not a Hall-of-Famer. However, the group of players to throw a perfect-game ranges from legends (Cy Young and Randy Johnson) to scrubs (Charlie Robertson). Was Buehrle's feat a mere fluke, or did he "deserve" to throw a perfect game.
A very simple analysis shows the probability of throwing a perfect game in one's career. Taking each pitcher's opponent's on-base-percentage and adding the percentage of players reached on errors we can estimate the probability of a hitter reaching base. Using the following formula, we can see the probability of throwing a perfect game as the following:
Probability of Perfect Game = (1-%onbase)^27
And we can use this number and the number of games started to estimate the probability that the pitcher throws a perfect game over his entire career:
Probability of Perfect Game in Career = 1-(1-probPerfect)^#GS
Of course, this assumes that the probability of throwing a perfect game is equal in each of a pitcher's career games, which is not true. A player usually has a peak in which the probability of a perfect game is higher, and thus the formula underestimates the probabilities especially for pitchers who had a peak much higher than the rest of his career, such as Sandy Koufax, Randy Johnson, or Cy Young (actually Young remained quite consistent, but his chances were much higher in the latter half of his career due to the context of the game).
For what it's worth here is a quick list of the 16 modern-era pitchers to have thrown a perfect game, and their rough chances of doing so.
In general, the probability of throwing a perfect game is very low, so all perfect games are "flukes" to some extent. Even a great like Cy Young only had about an 8% chance to throw a perfecto in his career during all of those games he pitched.
As we can see, Mark Buehrle is one of the more unlikely pitchers to have thrown a perfect game. Despite having a very good ERA+, the high scoring era in which pitches makes it difficult to throw a perfect game.
At the top of the list is Addie Joss, but Cy Young should be. He is unfairly hurt by the formula for having pitched in a hitters environment in the first part of his career, raising his career OBP. Taking the second half of his career alone, his probability of throwing a perfect game is over 8%.
There are a few other things that stand out. For being an above average, but not fantastic pitcher, Catfish Hunter enjoyed a very high probability of throwing a perfect game. His Achilles' heel was the homerun ball, which hurts effectiveness as a pitcher but doesn't much affect the chances of throwing a perfect game. He also enjoyed a pitcher's environment.
The luckiest pitcher to throw a perfect game, not surprisingly, was Charlie Robertson who threw a perfect game for the 1922 White Sox. At 49-80 and a 90 ERA-plus, he wasn't great, but he sure had his moment in the sun. Still, at least he had a career - the list of players who have thrown simply a no-hitter is littered with players far inferior to Robertson.
Nevertheless, throwing a perfect game is a rare feat, and anyone who was there yesterday afternoon will have memories to savor for a lifetime.
| Baseball Beat | July 24, 2009 |
Light Up the Halo
Down 3-0 in the first inning, the Los Angeles Angels rallied to beat the Minnesota Twins, 6-5, in 10 innings last night at the Big A. It was the Halos MLB-leading 31st "come-from-behind" victory of the season.
The Angels, with the third-most wins in the majors and second-most in the American League, have opened up a 3 1/2 game lead over the Texas Rangers in the AL West. The team has won six in a row, 10 of its last 11, and is now 27-9 since June 11 when it was just 29-29 and tied for second place in the division.
The Comeback Kids tied yesterday's game by scoring twice in the ninth inning against Minnesota's closer Joe Nathan, who had converted his last 20 save opportunities and had not allowed a run in 24 appearances covering 22 2/3 IP.
Bobby Abreu drew a walk to open the bottom of the ninth, Mike Napoli was hit by a pitch, and Gary Matthews and Howie Kendrick singled with two outs to produce a couple of runs to send the contest into extra innings. With the score tied at 5, Mike Scioscia sent southpaw Brian Fuentes, his best reliever, to the mound in the top of the 10th — a move too few managers make — to face lefthanded batters Justin Morneau and Jason Kubel, and Michael Cuddyer, the opposing team's top righthanded hitter. Fuentes got Morneau, who is tied for the AL lead with 24 HR, to pop out; Kubel, who had homered and singled to drive in three runs earlier in the game, to ground out to second base; and Cuddyer to strike out looking in a ten-pitch, 1-2-3 inning.
With Jesse Crain working the home half of the tenth, Chone Figgins lined a single to left, Brandon Wood bunted him to second, Abreu was intentionally walked, Kendry Morales struck out ending his 20-game hitting streak, and Napoli doubled to right center, scoring Figgy with the game winner and his league-leading 75th run.
Call it clutch or call it luck (as Kendrick's game-tying hit in the ninth glanced off Nathan's glove and struck second base), but, either way, the events led to another "W". It's a cliche but the Angels are winning as a team with significant contributions by everyone ranging from veterans like Figgins to youngsters such as Morales, Jered Weaver, and Erick Aybar to newcomers Abreu and Fuentes to career minor leaguers (Matt Palmer), relative unknowns (Jason Bulger and Kevin Jepsen), and reserves (Maicer Izturis).
What's remarkable is that the Angels not only suffered the loss of Nick Adenhart, the club's No. 1 prospect, in a tragic death after his first start; as well as injuries to John Lackey, Ervin Santana, and Kelvim Escobar that have curtailed up to 30 starts from this trio; but setbacks, most recently, to Vladimir Guerrero, Torii Hunter, and Juan Rivera, arguably the three best hitters going into the season.
It's all starting to feel a bit like 2002.
(For more on the Angels, be sure to check out Rev Halofan's Halos Heaven and Rob McMillin's 6-4-2 blogs.)
| Baseball Beat | July 23, 2009 |
First Basemen and Home Runs
Eight of the top 13 home run hitters this year play first base. The position has been known for its power output since the advent of the "live ball" in the 1920s, but it appears to be producing more four baggers among the league leaders than any other year this decade.
| PLAYER | POS | HR | |
|---|---|---|---|
| 1 | Albert Pujols | 1B | 34 |
| 2 | Adrian Gonzalez | 1B | 25 |
| Raul Ibanez | LF | 25 | |
| Mark Reynolds | 3B | 25 | |
| 5 | Adam Dunn | LF | 24 |
| Prince Fielder | 1B | 24 | |
| Ryan Howard | 1B | 24 | |
| Justin Morneau | 1B | 24 | |
| Carlos Pena | 1B | 24 | |
| 10 | Nelson Cruz | RF | 23 |
| Ian Kinsler | 2B | 23 | |
| Mark Teixeira | 1B | 23 | |
| 13 | Russell Branyan | 1B | 22 |
Interestingly, there are no designated hitters among the league leaders in HR. Now one might argue that some of these hitters shouldn't be playing defense, but the reality is that there is no DH among the top 18 HR sluggers in the majors. It's even a bit of a stretch to include Adam Lind (20) as the No. 1 HR-hitting DH as he has played over 30 games in left field. You have to go all the way down to Jim Thome, who is tied for 36th in HR with 16, to find the first pure DH. Whatever became of the David Ortizes, Travis Hafners, and Frank Thomases?
Is this a one-year aberration or is there something else at work here?
| Change-Up | July 23, 2009 |
Adam LaRoche to the Red Sox
The Red Sox traded for Adam LaRoche yesterday in a move that, on its own, underwhelms given Boston's potential to get something big done and the fierce competition they are sure to face for a playoff spot. But the trade deadline is still a week away.
LaRoche makes sense for the Red Sox because Mike Lowell is hobbled and aging quickly. He is no longer the fielder he once was and while he still can swing the bat a little bit, he can no longer move. He might be Major League Baseball's slowest baserunner and his ability to get to balls laterally has diminished severely. He has also demonstrated a more drastic platoon split of late, continuing to hit lefties nicely while struggling against right-handers.
Here's why the Red Sox did the deal. LaRoche is a career .269/.338/.486 hitter whom they acquired for two players that do not figure into their future plans. He has hit .296/.357/.544 in the 2nd Half for his career (he slugged .613 in the '08 2nd half). He also hits well against right-handers, posting a .275/.347/.500 clip for his career. All of this sets up a tidy straight-up platoon with Lowell, getting LaRoche in there when he is positioned to succeed and offering the gimpy Lowell much-needed regular rest. Kevin Youkilis's ability to play third affords Boston this kind of flexibility.
| Change-Up | July 22, 2009 |
One Night in Philadelphia
Momentum doesn't exist in baseball, at least as far as I can tell. Last night's thriller in Philadelphia will probably not propel the Phillies to another 10 consecutive wins and by the same token, it's not yet time for Cubs fans to "wait 'til next year" either. But the game seemed to accentuate so much about the constitution and performance of each team in 2009. It was a great game, one of the very best I have seen this season, and yet even well before Jayson Werth's game-winning home run, I couldn't help but marvel at Philadelphia's resilience and Chicago's offensive futility
Phillies starter Joe Blanton is exactly the kind of pedestrian right-hander the Cubs pounded on in 2008. Blanton's ERA has improved a bit since last year but make no mistake, he's the same pitcher he has always been. He has good control, can mix in some decent strikeout numbers from time to time and still gives up the long ball with the best of them. Coming off of a 10-1 loss at the hands of Rodrigo Lopez (Rodrigo Lopez!) and in the thick of the NL Central, the Cubbies had a chance to bounce back against Blanton.
On the hill for Chicago was Rich Harden, sort of the anti-Blanton. Whereas Harden's former Oakland teammate puts up strong innings numbers at right around a league average clip, Harden battles injuries and inconsistency constantly but sports the potential to dazzle on a given night. His performance last evening against the National League's best lineup was yet another painful reminder of just how good the Cubs pitching has been this year with so little to show for it.
A look at the Cubs and Phillies rosters, and even their 2009 statistics, would suggest that the teams are not too far apart.
       OPS+   ERA+
PHI     107    96
CHC      88   114
The Phillies hit the hell out of the ball and pitch just ok, while the Cubs are lights out on the mound and can't hit for their lives. But look at their respective lineups (cOPS+ = career OPS+).
     PHI      cOPS+  CHI       cOPS+
C    Ruiz     79     Soto      112
1B   Howard   141    Lee       122
2B   Utley    131    Fontenot  99
3B   Feliz    85     Ramirez   113
SS   Rollins  97     Theriot   91
LF   Ibanez   116    Soriano   114
CF   Victrno  99     Fukudome  97
RF   Werth    112    Bradley   116
As constructed, it doesn't seem like there should be a whole lot of difference between the two clubs. And I suppose in reality, there is not. The Cubs are just 6.5 games worse than Philadelphia. It is easy to get swept up in the negativity that can surround a club and with such high expectations coming into this season and a high-profile free agent flop (to date) like Milton Bradley on the roster, the Chicago media is already trying to figure out whom to blame for the Cubs' failed campaign. And yet they are just two games out of a playoff spot. It's funny, too. I wonder how many in the Chicago media who are crushing the Cubs are card-carrying members of the "pitching wins" club.
In last night's game, Chicago managed to take Philadelphia out of their comfort zone. The Phillies win by outslugging teams, but here they were at their hitter-friendly home ballpark going deep into the game in a 1-1 tie. Blanton and Harden were both very good, and then each handed the ball over to their respective bullpens. The relievers would somehow outdo both of them.
The devil is in the details, however. Both bullpens were excellent but here is what the Cubs mustered against Philadelphia relievers over the final six inning of the game. They managed to get on base just once when Brad Lidge plunked Aramis Ramirez. They saw just 61 pitches over that six-inning stretch. They did not get a hit, they could not work a walk. They rolled over. Philadelphia, on the other hand, saw 86 pitches in 5.2 innings. They made Chicago's bullpen work. Aesthetically, it was easy to tell the team that has been playing winning baseball and the one who has been underachieving all year, even as they were locked up 1-1 long into the night.
Here is the best analogy I can think of. Think of the 5th set of Wimbledon this year. Neither Andy Roddick nor Roger Federer could break the other, not until the 30th game at least. But that was because each dominated on their own serve. I liken the Cubs performance in extra innings last night to a tennis player that holds serve, only to make a bunch of unforced errors on their opponent's second serve. Sure Chicago's pitchers deserved credit for getting that far into the game but Cubby batters could not manage one base-runner against Chan Ho Park. Ryan Madson I understand, but Chan Ho Park!?!?
One mark of a great team is the ability to win games consistently in a variety of ways. Philadelphia hung tough for 12+ innings last night and finally delivered in dramatic fashion in the bottom half of the 13th. For their part, the Cubs pitched it well as they had all year but didn't hit and didn't show a whole lot of character. In other words, on a big stage in a big game playing the hottest team in baseball they squandered a golden opportunity - not by playing particularly badly but rather just by being the team they have been all season.
| Behind the Scoreboard | July 20, 2009 |
Do Pitchers and Hitters Work the Count Efficiently?
The count is one of the most basic parts of the game of baseball. The rules have been the same for over 100 years: 4 balls for a walk, 3 strikes and you're out. The pitcher/batter interaction is also one of the most fascinating parts of the game, with each side often trying to out-think and out-guess the other. The batter may think he knows what's coming, but he can never really be sure, while the pitcher may think he can outfox a hitter, but he never really knows what the batter is looking for either.
Of course, everybody knows that the count is integral to a player's chances of success. Give even a mediocre pitcher an 0-2 count to work with and he can retire the game's greats with ease, while even the best pitcher has trouble pitching to a batter with a 3-0 count. But does the count really change the pitcher's and the batter's strategy, or do players essentially approach each pitch the same, regardless of count. Furthermore, if the strategy and approach does change, does either side gain an advantage?
Pitch Outcomes by Count
Using Retrosheet data from the 2007 season, I first looked to see how often each potential outcome of the pitch occurred. Excluding any at-bats in which there were bunt attempts or intentional balls, the results were the following:
36.8% of the time, the pitch was thrown for a ball.
26.6% of the time, the pitch was thrown for a clean strike (either called, or swinging).
16.9% of the time, the pitch was fouled off (which means 43.5% of pitches were either clean strikes OR fouls).
19.7% of the time, the pitch was hit into play
But, do these numbers stay constant no matter the count? After all, the goal remains the same. For the pitcher: get a strike past the batter. For batters: either take a ball or hit the ball hard. Perhaps strategy remains the same as well? The following table shows the same breakdown by count. If the pitcher and batter do not adjust their strategies according to the count at all, we would expect these percentages to stay the same no matter the count. Do they?
To even casual fans of baseball, it is no surprise that the rates of balls, strikes, fouls, and hits changes depending on the count. It comes as no shock that the percentage of strikes goes up in hitters counts such as 3-0 and 3-1, and the percentage of balls rises in pitchers' counts such as 0-2. Likewise, the batter is much more likely to put the ball into play in deep counts, while he is not very likely to hit it into play on the first pitch, or especially on a 3-0 count. None of this really comes as a surprise to anyone, and falls in line with conventional baseball wisdom.
It's clear then, that players do indeed change their strategy based on the count. But how does this shift in strategy change the final outcome of each plate appearance? To test this, I ran a simulation to simulate whether each at-bat turned out to be a walk, strikeout, or a ball in play, assuming that each pitch had the same ball/strike/foul/inplay probability regardless of count. I then compared this to the actual outcomes.
The following chart shows the difference between the BB/K/In-play rates in the simulation (where it is assumed both the batter and pitcher are blind to the count) and the real outcomes.
One thing to notice is that the overall walk and strikeout rates are generally slightly higher in the simulation than in real life. This is due to the fact that the batter and pitcher are more cautious on the first pitch - the pitcher is less likely to throw a strike and the batter is less likely to put the ball into play (12.6% in-play on the first pitch vs. 19.7% in-play overall). When all pitches are averaged, this lack of action carries over into other counts and decreases the in-play rate and increases the amount of K's and BB's for the simulation.
However, this effect is small and many of the simulation estimates are quite close to the real outcomes. For instance, on the 1-0 count, the simulation, which assumes that the batter and pitcher do not change their strategies, shows a strikeout occurring 14.6% of the time, while real 1-0 count data shows that the batter strikes out 13.8% of the time. Meanwhile the walk rate changed from 17.2% in the simulation, to 16.6% in real life. This indicates that there is not a major strategy shift on a 1-0 count, but in fact pitchers and batters go after each other much in the same way as they would if they did not factor the count into their approach.
Major differences occur mainly in hitters counts, such as 2-1, 3-1, and 3-2, where the true propensity to put the ball in play is higher than the simulated results, and the walk rate is much less than the simulated results. This also is no surprise, seeing that the pitcher is more likely to throw a hittable pitch when he is down in the count, and hence the batter is more likely to put it into play and less likely to walk.
A Simulation to Find Who Gains A Strategic Edge
These first two charts leave no doubt that the pitcher and batter do change their strategies, especially on more extreme counts such as 0-2, 2-0, 2-1, 3-0, 3-1, and 3-2. Of course, this shift in strategy changes the outcome of the at-bats. For instance, on a 3-0 pitch, the pitcher may change his strategy to throw a fat strike just to get one over the plate. The batter, knowing that it is a 3-0 count is more likely to try to take a pitch to draw a walk. Of course, the batter knows that the pitcher is likely to groove one, so this changes his strategy too. The pitcher in turn knows that the batter knows and he has to adjust his strategy as well. Eventually an equilibrium is reached.
Now, theoretically, If both hitters and pitchers are equally able to adjust, the equilibrium will result in neither the batter or pitcher gaining an advantage. For instance, by throwing a pitch down the middle, the pitcher may indeed avoid more walks on a 3-0 pitch, but he will have to pay for it in the form of harder hit balls and more home runs. If this trade-off becomes so extreme as to become disadvantageous to him, he will scale back this tactic and pitch more normally, varying his pitches so that the batter cannot hit him so hard, but at the expense of giving up a few more walks. The batter, likewise, is making similar adjustments. His natural inclination is to take a 3-0 pitch, but if the pitcher is consistently throwing a get-me-over fastball for a strike, he may find himself at a disadvantage, in which case he will mitigate the pitcher's change in strategy by swinging more normally. The result of all this cat-and-mouse should be theoretically that neither side gains and advantage. This final equilibrium may still be less walks and more hard hit balls, but the expected run value of the at-bat should be the same as if neither the pitcher nor the batter were paying attention to the count at all.
Of course, this is in theory. If this is not true, it indicates that the one side is gaining an advantage because the other side either cannot adjust or is playing a bad strategy and failing to adjust his thinking to the situation. We can see if this is happening by looking at the run value outcome in various counts and comparing the simulation to the real data. Below is a chart doing just that.
The chart above gives the BAV, OBP, and SLG percentages for both the simulation and the real data. It also gives the wOBA for each. The last column uses Pete Palmer's Linear Weights and shows the difference between the simulation and the real data over the course of 600 PA's at each count. This is perhaps the most useful column. Those with a positive value indicate that the batter is creating more runs than would be expected in that count via the simulation, while a negative value indicates that the batter is under-performing relative to the count.
In many counts, the simulation and the real data both produce about the same amount of runs. For instance, on the 2-0 pitch, the hitter's batting average is higher than we would expect if the players were blind to the count (.292 vs. .279 in the simulation) and the batter hits the ball much harder (.497 SLG vs. .440 SLG in the simulation), but it comes at the expense of fewer walks, with the OBP falling from .519 to .487. The overall difference in production is less than a run over 600 PA's with a 2-0 count. As we would expect, the net result is that the increased power is offset by fewer walks, and neither the pitcher nor the hitter gain an upper hand. This indicates both players are likely using an efficient strategy and not allowing the opposition to use the knowledge of the count to their advantage.
However, this offsetting does not occur at every count. The 3-0 count is obviously a hitter's count - the simulation predicts a .290/.714/.457 line from hitters with a 3-0 count. However, the true data shows hitters taking an even greater advantage of the count. The real line is .295/.720/.516 (intentional walks are removed from the data), indicating that hitters hit the ball with much greater power without sacrificing walks. The result is an advantage for the hitter above and beyond what we would expect a 3-0 count to entail if players were not strategizing about the count. This indicates that the pitcher is not able to effectively counter the batter's 3-0 strategy.
Is this true for other highly favorable hitter's counts? Looking at the 3-1 count, we see that in fact the opposite is true! In this case, the pitcher takes the strategic edge. The expected hitting line is .252/.656/.397, while the true line is .292/.590/.500. Here we again see a big increase in power, with both the slugging average and batting average increased, but it comes at a cost of fewer walks. The result is a loss of about 6 runs due to the strategizing about the count. Pitchers are more likely to throw a strike to avoid a walk, but unlike on the 3-0 count, the batters are unable to generate enough power to offset the loss of walks. The result is that the pitchers are gaining an edge.
The 0-2 count is another extreme count, in which either the pitcher or batter may take a strategic edge. In this case, it's a pitcher's count and the expected line is .192/.207/.302. This is better however, than the real line of .180/.201/.265. In this case, the batter is sacrificing power and average, without increasing his on-base percentage. The result again is a loss of 6 runs by the batter over the course of 600 PA's. The pitcher is throwing more balls dancing around the plate, and the result is less power for the hitter, but without a corresponding increase in walks. Thus the pitcher is gaining an upper-hand on the hitter.
The result of the other counts don't show either the pitcher or hitter gaining a huge edge. 3-2 and 2-2 show the batter gaining a slight strategic edge, and 2-1 and 0-1 show the pitcher taking a slight strategic edge, but the effect is small. These results don't account for the fact that potentially stronger batters are more likely to reach 3-0 counts, and weaker batters are more likely to reach 0-2 counts, which may somewhat explain the advantages seen in the real data vs. the simulation. However, this does not explain the fact that 3-1 counts seem to show the pitcher gaining an edge.
Conclusion
It's interesting to find inefficiencies in how pitchers and hitters handle the count, and it appears that the extreme counts of 3-2, 3-1, and 0-2 expose the most inefficiencies. Unfortunately, though we can see who gains an upper-hand due to knowledge of the count, it's hard to tell whether the reason is that the players are not adjusting properly due to a lack of strategy or simply have an inability to adjust. It also is difficult to see exactly how players should change their strategy to put the game back into a neutral equilibrium. Because we only have the outcome data and not how exactly the pitcher and hitters are adjusting independently, it's hard to see how hitters and pitchers could improve.
Perhaps with data such as Pitch F/X, it might be possible to tell who is adjusting in what way and recommend how hitters or pitchers can adjust differently to erase the edge that the other enjoys. For now we see that pitchers enjoy a strategic edge on 0-2 and 3-1 counts, while hitters enjoy a strategic edge on 3-0 counts. It's something to think about next time a you're watching a big at-bat.
| Baseball Beat | July 20, 2009 |
Blue Moon
"That's one small step for [a] man, one giant leap for mankind."
- Neil Armstrong, July 20, 1969
Where were you 40 years ago? I know some of you had not yet occupied your space here on Earth. And nobody other than Neil Armstrong and Edwin "Buzz" Aldrin had stepped foot on the Moon.
I turned 14 earlier that month and spent that momentous Sunday at Anaheim Stadium where the California Angels were hosting the Oakland A's in a doubleheader. The Angels won the first game, 7-3, and lost the second, 9-6.
My Dad had joined the Angels as Director of Public Relations and Promotions in February 1969. I had only been a fan of the Angels for less than six months when I found myself sitting in what would now be called a suite on the first base side of the press box as the Apollo 11 lunar module landed on the Moon at 20:17 UTC (or 1:17 p.m. for those of us in the Pacific Time Zone).
I don't recall the exact inning when the Eagle touched down on the Moon, but I remember that the public address announcer and scoreboard informed the 17,835 in attendance of this occasion. The event either stopped the game or was reported between one of the early innings during the first game of the twin bill. It was definitely a time for national pride.
While man was making its first visit on the Moon, Vida Blue, not to be confused with teammate Johnny "Blue Moon" Odom, was making his major-league debut that day. A week short of his 20th birthday, Blue had been recalled from Birmingham, Oakland's Double-A affiliate, after excelling in the Southern League with a 10-3 record, 3.20 ERA, and 112 strikeouts in 104 innings.
The teenage sensation allowed solo home runs to Aurelio Rodriguez and Jim Spencer in the first and third innings, respectively, and was saddled with the loss after giving up six hits and five runs (three earned) in 5 1/3 IP. Andy Messersmith, in just his second season in the bigs, was credited with his eighth win on the way to a 16-11, 2.52 ERA (fourth in the AL), 211 strikeouts (third) campaign.
Two years later, Blue (24-8, 1.82 ERA) was on the cover of Sports Illustrated en route to the Cy Young and Most Valuable Player awards. Messersmith, for his part, went 20-13 with a 2.99 ERA in 1971.
Doug Miller of MLB.com wrote an article today, recalling the historic day, on and above Earth.
About 400 miles south of San Francisco, a launch of a different kind was taking place on July 20, 1969.There, in Anaheim Stadium, in the first game of a double-header, a hard-throwing 19-year-old Oakland Athletics left-hander from Mansfield, La., by the name of Vida Rochelle Blue toed the rubber in a Major League game for the first time in what would be a storied career.
Blue, eight days shy of his 20th birthday and straight out of Double-A ball, skipping an entire level of the Minor Leagues, says now that he had no doubts when he stepped on that mound.
"Well, I thought I was ready, and the folks that brought me up thought I was ready," says Blue. "So why wouldn't I have thought that way?"
Blue had been following the news stories chronicling the space program, something he still does to this day, having "TiVo'd just about every shuttle launch in the last 10 years," he says.
But as soon as he began warming up that day, throwing to catcher Phil Roof, the significance of the situation hit him with the force of the 100-mph fastballs he threw.
"I was fresh out of the Southern League," he says with a laugh. "The crowd itself was so different. It was the classic deer-in-the-headlights syndrome. As cool and as calm as you think you are, you're really not. You're thrust into a situation you've never experienced before.
"I mean, seriously, before that game, attendance at one of my games might have been 5,000, maybe 10,000. And now it's 35,000. And these were big league hitters. I'd never seen that type of talent before."
Blue would go on to win 209 career games, make six All-Star teams and take the American League Cy Young and Most Valuable Player awards in his watershed season of 1971, when he went 24-8 with a 1.82 ERA, eight shutouts and 301 strikeouts in 312 innings.
But on that day he was a regular 19-year-old kid.
He lasted 5 1/3 innings, giving up five runs -- three earned -- on six hits, including two home runs, in the A's 7-3 loss to the Angels. His career began with an 0-1 record.
"I was a young, cocky kid, and when you're young and cocky, you think you have it all and know it all," Blue says. "I was no different. That was the attitude I had. That's what kids that age do, and I certainly did it."
At some point during the game, Blue remembers, he heard about the moon landing and, for at least a moment, was able to escape the whirlwind of nerves unfolding around him to focus on something bigger than baseball.
Forty years later, Blue says that he's touched to even be asked about that day.
"I just remember it was obviously a great chance for me, and, as it turns out, it was a unique thing to pitch on the day this country landed a man on the moon.
"It's pretty cool and kind of flattering that it happened on the same day."
I returned home from the doubleheader in time to watch Armstrong and Aldrin walk on the moon that evening on our black and white television. My parents had received a color TV as a Christmas present from Walter O'Malley after the Dodgers won the World Series in 1959, a gift that would be strictly prohibited today. They held onto the TV for a few years, then sold it for the latest technology, a Hi-Fi (high fidelity stereo). The TV and the Hi-Fi were both housed in huge pieces of walnut or mahogany furniture, which was the norm in those days.
Things were big back then. Or so they seemed.
| Baseball Beat | July 18, 2009 |
The Heat Is In (the Shrine of the Eternals)
The Baseball Reliquary will induct Steve Dalkowski, Roger Maris, and Jim Eisenreich into its Shrine of the Eternals in a public ceremony on Sunday, July 19 at the Pasadena Central Library in Pasadena, California.
In a press release, Terry Cannon, the Executive Director of the nonprofit organization dedicated to fostering an appreciation of American art and culture through the context of baseball history, announced that Dalkowski, Maris, and Eisenreich "will join thirty other baseball luminaries who have been inducted into the Shrine of the Eternals since elections began in 1999, including, in alphabetical order, Jim Abbott, Dick Allen, Emmett Ashford, Moe Berg, Yogi Berra, Ila Borders, Jim Bouton, Jim Brosnan, Bill Buckner, Roberto Clemente, Rod Dedeaux, Dock Ellis, Mark Fidrych, Curt Flood, Josh Gibson, William 'Dummy' Hoy, Shoeless Joe Jackson, Bill James, Bill 'Spaceman' Lee, Marvin Miller, Minnie Minoso, Buck O'Neil, Satchel Paige, Jimmy Piersall, Pam Postema, Jackie Robinson, Lester Rodney, Fernando Valenzuela, Bill Veeck Jr., and Kenichi Zenimura."
Dalkowski, a resident of the Walnut Hill Care Center in New Britain, Connecticut, arrived in Los Angeles on Friday and threw out the ceremonial first pitch at last night's Dodgers-Astros game at Dodger Stadium. The now 70-year-old career minor leaguer emerged from a wheelchair in front of the mound and tossed a "fastball" that bore no resemblance to the 100+ mph heater the southpaw reportedly threw as a matter of routine back in the 1950s and 1960s.
The closest the bespectacled Baltimore Orioles farmhand came to the major leagues was appearing on a 1963 Topps Rookie Stars baseball card along with three other young pitchers (Fred Newman of the Los Angeles Angels, Carl Bouldin of the Washington Senators, and Jack Smith of the Los Angeles Dodgers). With no help from Dalkowski, the quartet recorded a combined total of 38 wins and 49 losses in the majors (with Newman earning 33 of those victories). However, to the extent that this card has any value whatsoever, it is solely due to the legend that is Dalkowski, the inspiration for Nick LaLoosh, the character portrayed by Tim Robbins in "Bull Durham."
Ron Shelton, who wrote and directed the 1988 movie classic, will introduce Dalkowski at tomorrow's induction ceremony. Shelton was a minor league second baseman for the Orioles during the '60s, yet, according to George Vecsey in an article in today's The New York Times, he and Dalkowski have surprisingly never met.
Dalkowski, who has been in and out of hospitals and halfway houses for the past two or three decades, is in town with his once estranged younger sister Patti Cain. An administrator at a hospital not far from the facility that houses her brother (and just a block from the ballpark where he was a high school star and a bonus baby over 50 years ago), Patti is responsible for rescuing her brother in Oklahoma City in 1994 after the death of his wife. She told Tim Hoffarth, a columnist for the Daily News, "The doctors once told us he'd only have a year to live, so how remarkable is it that he's here and has a run of the place? Of course, some days are better than others. Same with me. When he wants to talk baseball, he's still full of stories. But nothing's easy. He's laying down now. He needs his rest."
You can read more from Hoffarth about Dalkowski and his story here and here, as well as older articles from Sports Illustrated (Where Are They Now? Steve Dalkowski by Pete McEntegart and The Wildest Fastball Ever by Pat Jordan) and The Hardball Times (Delving into the Dalkowski depths by Steve Treder). The latter piece includes Dalkowski's year-by-year and career minor league record plus links to several other articles. The Los Angeles Times is scheduled to publish an article by Shelton in tomorrow's newspaper, which I will link to when it is up.
For those of you who live in Southern California, you can meet Dalkowski and Eisenreich on Sunday at 2 p.m. at the Donald R. Wright Auditorium of the Pasadena Central Library, 285 E. Walnut Street. Admission is free and open to the public.
* * *
Update: Although Paul Richards never managed Steve Dalkowski, The Wizard of Waxahachie was Baltimore's field boss from 1955-1961. He handled the "Kiddie Korps," a collection of young Oriole pitchers, including Steve Barber, Chuck Estrada, Jack Fisher, Milt Pappas, and Jerry Walker, during the late 1950s and early 1960s. Dalkowski was born in the same year as Fisher, Pappas, and Walker and was 16 months younger than Barber and Estrada.
The Wizard of Waxahachie: Paul Richards and the End of Baseball as We Knew It by Warren Corbett is available for pre-order. I previewed the book and believe it is a worthwhile read for baseball historians, especially those interested in the teams that he played on (Brooklyn Dodgers, New York Giants, Philadelphia Athletics, and Detroit Tigers), managed (Chicago White Sox and Baltimore Orioles), and served as an executive (Houston Colt .45s, Atlanta Braves, White Sox, and Texas Rangers). Richards would be 100 years old if he hadn't passed away in 1986 in his hometown of Waxahachie.
Competition and conflict marked Richards's sixty-year career, from his first week as a professional player, when the seventeen-year-old may have punched his manager. As a manager, Richards was thrown out of games more frequently than anyone else. In his first year as a general manager, he was threatened with suspension for cheating. He brought the first black players to the White Sox and the first important black players to the Orioles, but several of them denounced him as a racist. In his later years his was one of the loudest and most reactionary voices opposing the rising players' union.When his catchers couldn't handle a knuckleball, he invented a mitt as big as an elephant's ear so they could at least knock it down. He was the first manager known to enforce pitch counts to protect young arms from injury. Previously undiscovered documents reveal that Richards tracked his hitters' on-base percentages before that statistic even had a name and decades before it became a cornerstone of baseball analysis. He computed catchers' earned run averages years before the sabermetric community thought of it.
Corbett, a contributor to the Society for American Baseball Research's Biography Project headed up by fellow author and Baseball Analysts guest columnist Mark Armour, handles the Richards story in a thorough and balanced manner. The book includes a Foreword by Brooks Robinson and an Introduction by Tony La Russa, as well as a bibliography that cites more than a couple of hundred published works, interviews, and personal correspondence.
| F/X Visualizations | July 17, 2009 |
Can Pitchers Control Their BABIP by Controlling Pitch Location?
At the PITCHf/x summit I gave a presentation about making the type of contour and heat maps that I often show here. In the presenatation I listed some of the things one could do with such maps and I said 'for example you can see how BABIP varies by pitch location.' A questioner at the end of the talk asked if I had done so. He thought if BABIP did in fact vary by pitch location, and pitchers can control the locatoin of their pitches then pitchers could control their BABIP. I, at that point, had to fess up that it was just an example and I had not in fact looked at it. Unfortunately I don't know the name of the person who asked the question, but here it is.
There is a long history of examination of how much control a pitcher has of his BABIP (batting average of balls in play). The first major work was by Voros McCracken who, in 2001, suggested that pitchers do not have the ability to prevent hits on balls in play. In 2003, Tom Tippett found that some pitchers, in particular knuckleballers, had the ability to suppress hits on balls in play throughout their career. In addition, the BABIP of a ground ball is higher than that of a fly ball and we know pitchers do control their ground ball rate. So, we should expect BABIP differences between ground ball and fly ball pitchers. The general understanding, at this point, is that pitcher's have some, but probably a very small, amount of contrl over their BABIP beyond their control over batted ball type.
Obviously pitcher's control the location of their pitches, so if BABIP varies by pitch location could this be how some pitcher's have the ability to depress their BABIP? Let's see how BABIP varies by location. Here I am just looking at RHB.
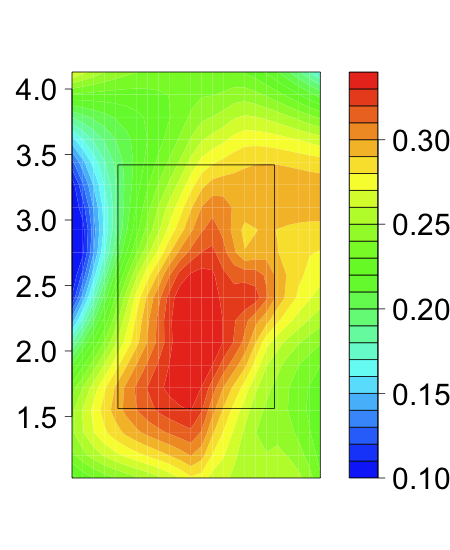
There is some trend for pitches down in the zone to have a higher BABIP. I am sure this is driven by the fact that high-BABIP ground balls are more likely on hits low in the zone while low-BABIP fly balls are more likely up in the zone.
EDIT: In my initial post I had the outside/inside orientation flipped in my interpretation. Below I have corrected that. I would like to thank Mike Fast for bringing this to my attention and apologize for any confusion this might have caused. As always the images are from the catcher's perspective.
Along the horizontal axis pitches in the middle of the plate have the highest BABIP, which is not surprising. Beyond that, though, on pitches low in the zone those inside have a higher BABIP than those away, and pitches up in the zone those away have a higher BABIP than those inside. For those down in the zone, which will most likely be ground balls, those inside pitches will be pulled and pulled ground balls to the left side of the infield are more likely to be hits. On pitches up and in are most likely to be home runs, which are not counted as balls in play. This might be partially responsible for the drop in BABIP up there. Also maybe these pitches 'tie up' the hitter causing popups which have a near zero BABIP.
I wanted to examine the horizontal gradient further, so I took a one-foot-high band of pitches centered at y = 2.5. My hope is to see how much the BABIP changes by horizontal location to see if it is reasonable for a pitcher to depress his BABIP based on the location of his pitches. Again this is just for RHB.
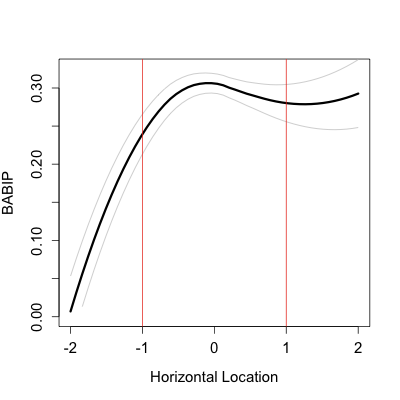
So there is definitely a trend. The farther inside a pitch is hit the lower the BABIP. But look at the error bars the BABIP is effectively unchanged from x = 2 to x = -0.5. A pitch really has to be on the inside fourth of the plate before there is a significant drop in BABIP. From there to outside the zone away there is a big drop in BABIP.
It looks to me for a pitcher to seriously decrease his BABIP based on the horizontal loation of his pitches he either needs to induce swings (and contact) inside of the zone or be able to locate on the inner fourth of the plate.
If a pitcher could regularity locate pitches in the string zone, but just on the inner edge he could drastically lower his BABIP. I am not sure there are a lot of pitches with the control to pitch with the speed and movement required to get out major league hitters AND locate the ball that finely. If they miss too much to one side it is a ball, too much to the other it hits the heart of the plate. The one pitcher, off the top of my head, who I think might be able to do this is Mariano Rivera. Check out the location of his cutters to RHBs.
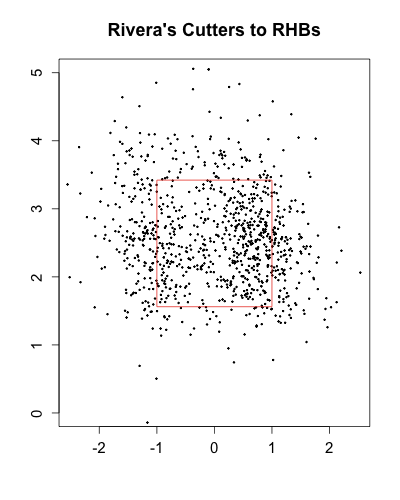
While most of the pitches are on the outer half, he locates a good number on the inner quarter. Exactly the type of pitches that are in the zone AND can depress BABIP.
| Around the Minors | July 16, 2009 |
The 2009 Draft: Sign On the Dotted Line
It's been just over a month since the dust settled on the Major League Baseball 2009 amateur draft. The event featured a no-brainer first-overall pick (Stephen Strasburg), a surprise Top 10 selection (Tony Sanchez at No. 4), and a few other interesting first-round choices (Randal Grichuk, LeVon Washington).
Of the 32 picks taken in the first round of the draft, 12 players (37.5%) have signed. There are exactly 31 more days for teams and players to come to an agreement on terms or players will have to wait at least one more year to pursue their MLB aspirations in professional baseball (or at least three more years for prep players entering a college program).
Last season, two players failed to come to terms: Aaron Crow (Ninth overall to Washington) and Gerrit Cole (28th overall to New York AL). Crow returned to the draft this season and went 12th overall to Kansas City.
Of the 2008 players who signed, most appeared in at least a handful of games in the minors during their draft year. Players who failed to sign in time to make their pro debuts in '08 included Pedro Alvarez (Pittsburgh), Brian Matusz (Baltimore), Josh Fields (Seattle), and Brett Lawrie (Milwaukee). The debut for Ethan Martin (Los Angeles NL) was delayed due to injury. Some of the selections who got on to the playing field early have already made their Major League debuts, such as Gordon Beckham (Chicago AL), Ryan Perry (Detroit), and Daniel Schlereth (Arizona). Corner infielders Justin Smoak (Texas) and Brett Wallace (St. Louis) are both in triple-A knocking on the big-league door.
Let's have a look at the 2009 first-round draftees who have signed so far:
4. Pittsburgh: Tony Sanchez | Catcher | Boston College
The highest-drafted pick to have already signed on the dotted line, Sanchez played in four short-season games before moving up to low-A ball. In nine games at that level, he's hitting .405/.522/.622 with one homer in 37 at-bats. Sanchez also has five walks and five Ks. The right-handed hitter is also 6-for-6 (1.000) versus left-handed pitchers.
5. Baltimore: Matt Hobgood | RHP | California high school
Although he's signed, Hobgood has yet to pitch in a professional game.
10. Washington: Drew Storen | RHP | Stanford
The first pick to sign, Washington had to choose someone that was willing to go pro because this pick was compensation for failing to come to terms with Aaron Crow last season. Failure to sign Storen would not have resulted in a 2010 compensation pick. As a result, the right-hander was a bit of a stretch as the 10th overall pick. So far in 2009 while playing in low-A ball, Storen has a 3.95 ERA in 13.2 innings. He's allowed 11 hits, no walks and he's struck out 23 batters.
17. Arizona: A.J. Pollock | Outfielder | Notre Dame
Pollock is holding his own in low-A ball. The former college star is hitting .293/.323/.414 with two steals in five tries over a 13-game span. He has four extra-base hits (including two doubles and a homer).
21. Houston: Jiovanni Mier | Shortstop | California high school
One of the more recent signings, Mier is enjoying professional baseball. The shortstop is currently hitting .308/.416/.492 with four triples and three steals in 65 at-bats. He also has 13 RBI in 17 games; not bad for a player whose strength was supposed to be his glove.
23. Chicago AL: Jared Mitchell | Outfielder | Louisiana State
Mitchell was placed on the disabled list before taking his first pro at-bat.
24. Los Angeles AL: Randal Grichuk | Outfielder | Texas high school
One of the surprise picks of the first round, Grichuk is looking pretty good so far. The outfielder is currently hitting .291/.318/.418 with four doubles and three triples in 79 rookie at-bats. The teenager needs to alter his approach a bit at the plate, though, as he has just three walks to go with 27 Ks.
25. Los Angeles AL: Mike Trout | Outfielder | New Jersey high school
Trout has joined Grichuk in the Arizona rookie league but he's appeared in just four games, but he has nine hits in 17 at-bats (including a double and two triples). He's showing a better approach at the plate with six walks and four Ks.
26. Milwaukee: Eric Arnett | RHP | Indiana
Arnett has made four appearances, including two starts. In 6.2 overall innings, the right-hander has allowed seven hits and five walks. He's also struck out seven batters.
28. Boston: Reymond Fuentes | Outfielder | Puerto Rico high school
The speedy Fuentes has gotten off to a flying start in rookie ball for Boston. The left-handed hitter is currently batting .382/.436/.441 with 13 hits in 34 at-bats. He's taken three base-on-balls and struck out four times. Fuentes has two steals in four attempts.
31. Chicago NL: Brett Jackson | Outfielder | California
This surprise first-round selection began his pro career in rookie ball and hit .455 in three games. He was then moved up to short-season ball where he is hitting .300/.417/.425 with one homer in 40 at-bats. Jackson has walked seven times, while also striking out in 10 at-bats.
32. Colorado: Tim Wheeler | Outfielder | Sacramento State
Playing in short-season ball, Wheeler is currently hitting .272/.355/.370 with one homer and five doubles in 77 at-bats. He's walked 11 times, with 18 strikeouts. Wheeler has stolen three bases in five attempts.
Overall, seven of the first 12 picks to have signed were college selections, while the other five came from the high school ranks. Seven of the signees are outfielders and three others are right-handed pitchers.
In the supplemental first round, nine of the 17 selections have officially come to terms. High school catcher Steven Baron was the first player taken in the round and he recently signed with Seattle. Also signing were Rex Brothers (Colorado), Matt Davidson (Arizona), Aaron Miller (Los Angeles NL), Josh Phegley (Chicago AL), Mike Belfiore (Arizona), Matt Bashore (Minnesota), Tyler Kehrer (Los Angeles AL), and Victor Black (Pittsburgh).
Both the New York Mets and the Philadelphia Phillies did not have their first selections until the second round (due to free agent signings during the 2008-09 off-season). The Mets chose New York prep lefty Steve Matz 72nd overall, but have yet to come to terms. The Phillies took California high school outfielder Kelly Dugan 75th overall and have already inked the youngster. He is batting .281 in 16 rookie ball games.
Overall, Toronto and Tampa Bay are the only two clubs that have yet to sign at least one of their Top 4 selections. Toronto had five selections in the first three rounds and has yet to come to terms with any of them and media reports suggest none of them are overly close to signing, which is highly unusual for Toronto. The Jays organization is normally one of the most aggressive when it comes to getting its top picks under contract and into the system. The highest drafted player to sign so far is seventh rounder Egan Smith, a left-handed pitcher who was taken out of a Nevada community college. Tampa Bay's highest signee is sixth round selection Devin Fuller, a right-handed pitcher out of an Arizona community college.
Hopefully we'll see the signings start to pick up. Major League Baseball's pressure on teams to avoid announcing over-slot signings prior to the signing deadline takes a little fun out of the post-draft coverage - and it also keeps players from getting much-needed pro experience.
| Change-Up | July 15, 2009 |
Buc to the Bump
![]() More than four years after drafting Clay Buchholz out of Angelina County Junior College in the supplemental round of the 2005 Amateur Draft, the Boston Red Sox will send the 24-year old righty to the mound on Friday night for his 19th career Major League start. He will face the Toronto Blue Jays, a team rumored to be shopping their best player, Roy Halladay. Whether he is being "showcased" or given a shot to stick remains to be seen, but let's take a look at Buchholz's roller coaster professional career to see how we got to this point.
More than four years after drafting Clay Buchholz out of Angelina County Junior College in the supplemental round of the 2005 Amateur Draft, the Boston Red Sox will send the 24-year old righty to the mound on Friday night for his 19th career Major League start. He will face the Toronto Blue Jays, a team rumored to be shopping their best player, Roy Halladay. Whether he is being "showcased" or given a shot to stick remains to be seen, but let's take a look at Buchholz's roller coaster professional career to see how we got to this point.
When the Red Sox drafted him, the only questions about Buchholz seemed to center on his makeup. Here is Baseball America, recapping the Boston draft pick:
While Buchholz hoped to become a regular shortstop, Angelina coaches saw him pitch at 88-89 mph at a tryout camp and thought he had upside on the mound if he could make mechanical adjustments. They were right. Buchholz' fastball sat at 92 mph and touched 97 this spring. When he's on, his slider grades as a 65 and his curveball as a 55 on the 20-80 scouting scale. Buchholz still needs to improve the consistency of his breaking pitches and his changeup, but it's hard to argue with his pure stuff. He went 11-1, 1.19 with 112 strikeouts in 76 innings as the ace of a prospect-laden pitching staff ...The biggest concern is his makeup, stemming from an incident in high school that has some clubs avoiding him entirely.
Here is Nick Cafardo of the Boston Globe, recapping the 2005 draft for the Sox.
With their next pick, the 42d, the Sox took Angelina (Texas) Junior College righthander Clay Buchholz, Stanford second baseman Jed Lowrie at No. 45, Waubonise Valley (Ill.) High School righthander Michael Bowden at No. 47, and Cross Creek (Ga.) high school catcher Jonathan Egan at No. 57.Buchholz has 97-mile-per-hour stuff and 13.6 strikeouts per nine innings. McLeod said he spent a lot of time on background checks with Buchholz, who has had off-field issues, and came away convinced that those issues were behind him.
Buchholz had two arrests to his name, one for theft and another for breaking and entering, but the Sox came away convinced that both incidents amounted to little more than youthful hijinks and were not indicative of the type of kid he was. It seems they were both right and wrong, to the extent that one can connect behavioral dots throughout different points in an individual's life. When Buchholz would eventually reach the Big Leagues, let's just say he would enjoy himself and did not always display the kind of maturity and professionalism his teammates, manager and front office personnel would have liked to have seen from him.
On the field, Buchholz dominated pro ball from the moment he took to the mound. He was excellent in short-season ball in the New York/Penn League in the summer of 2005, he tore through the Sally and Carolina Leagues in 2006 and then the Eastern and International Leagues in 2007, earning a late-season call-up from the eventual World Series champion Red Sox that year. Here is how he had fared throughout his Minor League career to that point.
          IP    K/9   K/BB   WHIP   ERA
2005     41.1   9.8   2.00   1.04  2.61
2006    119.0  10.6   4.24   1.02  2.42
2007    125.1   9.4   4.89   0.97  2.44
He would make his debut on August 14th, 2007, three days before his 23rd birthday. In three starts and one relief appearance, he was excellent - everything the Sox could have hoped for and more. There was, of course, this, a no-hitter in just his second career Major League start. While Boston management determined there was no need for Buchholz on the Red Sox post-season roster, he had secured his future. He would begin the 2008 season in the Boston rotation.
Unfortunately, he would also struggle mightily. Here is how he fared in his two Big League seasons. Note the contrast between 2007 and 2008.
          IP    K/9   K/BB   WHIP   ERA
2007     22.2   8.7   2.20   1.06  1.59
2008     76.0   8.5   1.76   1.76  6.75
 His command and seemingly his focus were off in 2008. The word that is tossed around in interviews with club personnel is "maturity". A consensus seemed to emerge that Buchholz lacked it both on and off the field between the time he threw the no-hitter and the time he landed back in the Minor Leagues for good in August of 2008. He was a known partier - no major black mark given his age, level of fame and good looks in a baseball-crazed town. On the mound he would try to strike too many guys out or fail to consider the situation or shake off the captain Jason Varitek. Add it all up and he left a little bit of a bad taste in the mouths of some key Red Sox.
He has returned to dominance since his demotion. Here are his Minor League stats in 2008 and 2009.
          IP    K/9   K/BB   WHIP   ERA
2008     58.2   9.4   3.39   1.04  2.30
2009     99.0   8.1   2.97   0.98  2.36
All of this brings us to Friday night, when Buchholz will make his first Major League start of 2009. Why Friday night? Well the Red Sox say that since Buchholz is on rest, it's an opportunity to allow them to align their rotation since they had two starting pitchers in the All-Star Game. It's one of those statements that sounds logical enough but when you apply any scrutiny at all, it just doesn't add up. Neither Josh Beckett nor Tim Wakefield actually pitched last night in St. Louis and even if they had, it would have been no more than an inning or so. Besides, why couldn't they start their three other starters and then turn to Beckett and Wake?
So then you get the other end of the spectrum. People say the reason that he is starting on Friday night, in Toronto no less where they are shopping this deadline season's prize, is that they are "showcasing" Buchholz. It's as though were it not for the sight of him on a Major League mound, teams' front office personnel might question Buchholz's very existence. That doesn't make much sense to me either. He's been an incredibly consistent and dominant Minor League pitcher and he has tossed a no-hitter in the Big Leagues. A July start in Toronto will do little to enhance or detract from his value.
That leaves two possibilities. One is that the Sox just want to give the kid a nod. He's been great all season long and deserves a chance at the Big League level - nothing more, nothing less. The other possibility is that they want to see how he performs Friday night and beyond in case they decide they want to move, say, Brad Penny. I think this is the most likely scenario. Other than Halladay, I am not sure of another player who could be available before the deadline for whom Boston would move Buchholz.
But make no mistake, the Red Sox are going to be involved in what is shaping up to be one of the most active and exciting trading seasons in recent memory. While Boston cherishes its organizational depth, it is also a team that is not afraid to go for it. As they say, "flags fly forever." They boast enough depth and possess the financial wherewithal to replenish with free agent stopgaps, that they can match just about any offer another team could without suffering too badly in the long term. And if you don't think they have the stomachs to deal with trading great talent, consider the Beckett (and Mike Lowell) for Hanley Ramirez and Anibal Sanchez trade.
On the night of September 6, 2006, Sanchez threw a no-hitter for the Florida Marlins, Ramirez was well on his way to winning the National League Rookie of the Year award while Beckett had a 5.11 ERA and Mike Lowell was plodding along with an ok, .286/.340/.474 mark. The Red Sox trailed the Yankees by 9 games in the AL East and the Minnesota Twins by 7 games in the Wild Card. Talk to the Red Sox brass about that night - it was a true low point - and yet just a year later, Lowell would win the World Series MVP with Beckett leading the way on the mound as the Red Sox won their second title in four seasons.
Now think about the 2009 Red Sox lineup and all of the question marks. Lowell's health is a major question so with Kevin Youkilis playing third base, Mark Kotsay or Jeff Bailey start regularly at first. Nick Green struggles defensively and his bat comes and goes. Julio Lugo is just awful. Youkilis and Dustin Pedroia have missed time with injuries this season. You have to figure J.D. Drew has at least one DL stint in him, no? Are you ready to conclude that David Ortiz is completely back, or could he slump badly again? Is Jason Varitek's .826 OPS likely to hold up?
Meanwhile, Boston features ten starting pitchers who I think can consistently get outs at the Major League level. There are the five starters currently in the rotation, Justin Masterson in the bullpen, Buchholz, Michael Bowden, and finally Junichi Tazawa and Felix Doubront in Portland. Every Boston reliever is worthy of high-leverage Big League work. Daniel Bard, currently Terry Francona's last option out of the bullpen, features a 10.6 K/9 and a 183 ERA+ in 2009. You get the point. A lot of these guys are worth more to other teams than they are to the Sox, while the only thing standing between the Red Sox and what could be their third title in six seasons is lineup depth.
When Buchholz takes to the hill to start the second half of the season for the Red Sox on Friday night, it will also signal the kick-off of what is sure to be the most exciting deadline for Boston since they dealt Nomar Garciaparra en route to winning the 2004 World Series (I omit last season's deadline and the Manny trade because it was an altogether different feel). They have the opportunity once again either to shore up organizational weaknesses or, if they so choose, go big and net another superstar.
Or maybe both?
| Behind the Scoreboard | July 14, 2009 |
How to Manage the All-Star Game
One of the most exciting events of the season takes place tonight, as the AL and NL All-Stars play in the 80th annual All-Star game. The game, as I showed last week, takes on great importance to some teams, particularly those likely to make the World Series. Managers have always faced a series of competing interests in their managing strategies, and these dilemmas are perhaps even more pronounced since the game now “counts”. The main competing interest is between managing to win and managing to play everybody, but managers also have to have an eye for entertaining the fans, preventing injuries, and of course making sure that enough pitchers are available to finish the game.
These goals appear to be mutually exclusive. For instance, it would seem that if all players get in the game, then that means less time for the best players, and a lessened chance of victory. However, the purpose of this article is to show how, if a manager plays it properly, all of these goals can be satisfied. A smart manager can maximize his team’s chances to win as well as get most players in the game, while simultaneously showcasing the game’s greatest stars and making sure that the team is well equipped to go deep into extra innings without jeopardizing the health of any of his players. How can a manager do such a thing?
Managing the Pitchers
First of all, let’s address the pitching problem. The problem was brought to a head in 2002 when both managers ran out of pitchers and forced a tie. It nearly happened again last year when reliever Brad Lidge was brought in for the NL and a gimpy and unrested Scott Kazmir was brought in for the AL in the 15th inning. Had the game gone on only a couple more innings, both managers would have had a major crisis on their hands. How to prevent such potential disasters? The solution here is simple: Have the last pitcher in the bullpen be a well-rested starter who has the ability to throw a complete game if necessary. The manager should wait until the 13th or 14th inning to put him in and he should be able to finish the game. As a starter on full rest, he’ll be able to pitch 7 or 8 strong innings if necessary, which should be enough to finish even the longest of All-Star contests.
Had Carlos Zambrano, on 5 days rest, been the last man in the bullpen instead of Brad Lidge, he could have pitched well past the 20th inning without difficulty. Similarly, in 2002, if Freddy Garcia had pitched the 3rd and the well-rested Roy Halladay pitched the 10th instead of the other way around, the AL squad would have been able to potentially last 18 innings, forcing an NL forfeit instead of a tie. Instead, managers seem to have short-men or fragile pitchers as their pitcher of last resort, leading to potentially disastrous scenarios as occurred in 2002 and almost happened again in 2008.
Since this emergency pitcher will usually not get in the game at all, ideally this well-rested last man isn’t one of the squad’s best pitchers and has already made an All-Star appearance so he won’t mind not getting into the game. The emergency man strategy is a good one because most pitchers can still get into the game even if it doesn’t go extra innings, but if the game does go into extra frames, the team is equipped to go 20 innings or more without risk of injury or overwork.
The rest of the pitching staff is usually fairly well handled by the managers, with a few exceptions. With 13 pitchers on the staff, it’s not a bad idea to throw pitchers one inning at a time, as current managers usually do, so that they can leave it all out on the mound. Combining this with the fact that each pitcher is not necessarily well-rested, and this is a fairly good strategy for getting a lot of players into the game as well as maximizing (or at least not decreasing) the chance of winning.
While managers consistently use starters earlier in the game and relievers later in the game, statistically there is no difference as to when the pitcher enters the game – in a one-game situation, each inning is equally important since the expected value of the leverage in each inning is equal for all innings. The result is that a manager should make sure to get his best pitchers in the game regardless of the inning or score. This is opposed to Clint Hurdle’s strategy last year of leaving Brad Lidge, one of the better NL pitchers, in the bullpen, waiting for a traditional save situation. Hence, the pitchers reserved in case of extra innings should be among the staff’s worst, used in order of talent as the game gets deeper into extra innings, until the emergency pitcher is called in to finish the game.
Managing the Position Players
Except for an occasionally mismanaged bullpen, managers have handled their pitching staffs fairly competently over the years. However, when it comes to playing the position players, most All-Star managers have been baffled. Managers seem to be torn between playing the starters and maximizing their chances of winning, and replacing the starters to give the reserves more playing time. It’s possible to do both, but not when managers traditionally resort to the most caveman of strategies: position-for-position wholesale changes midway through the game. I had hoped for a change in this strategy when the All-Star game was given more meaning, but the basic tactic has still been employed. The only difference is that instead of removing the starters after 3 innings, they are removed in the 6th or 7th.
In fact, maximizing the chances of winning actually does involve the use of most of the team's 33 players on the roster. First of all, in NL parks, teams should always pinch-hit for the pitcher. There are too many great pitchers and players on the roster to burn an at-bat with a pitcher hitting. This sounds obvious, but the manager has chosen to send a pitcher to bat as recently as 1998 when David Wells hit in the second inning (Mark Mulder also hit in 2004, but he was forced to remain in the game since he had not yet faced a batter). Pinch hitting for the pitcher every time up is an obvious way to use an additional 3-5 players and increase the probability of winning, but what to do with the other 7 or 8 other players left on the bench?
Similar to what good American League managers do every day, All-Star managers can pinch-hit good-hitting, powerful reserves for (relatively) poor-hitting players at defensive positions. Usually, there are a few positions on each squad which are relatively weak. In key situations with runners on base, these players can be removed for better hitting first basemen/outfielders/etc who are sitting on the bench. This maximizes the team's chance of winning by putting better hitters at the plate in key situations.
This tactic also has the benefit of getting an additional two players in the game - the pinch-hitter and the player who replaces him on defense in the next half inning. It also gets these players in the game without removing the presumably outstanding starter at the offensive position. If the 2009 NL team were to use this tactic, Albert Pujols could play the entire game, while Fielder, Howard, and Gonzalez could all hit in high leverage situations with runners on base. Using this tactic just twice gets an additional 4 players into the game, without removing the heavy-hitting starters who are the best players on the team. In AL parks this tactic can be used even more often since the manager does not have to worry about running out of players to pinch-hit for the pitcher.
The remaining 3 or 4 players on the bench can be used as either platoon guys, who can be substituted for the starter when a handedness advantage presents itself, or used as pinch runners or defensive replacements. All of these useful and legitimate reasons are preferable to the gratuitous replacement strategy which managers currently employ. The result is that usually all but 1 to 3 players can get in the game (most with an at-bat) and the four or so best players on the team end up playing the entire game. Imagine that - the same amount of players get into the game, but the biggest stars are showcased for the entire night and the team's chances of winning are dramatically increased!
One tactic All-Star managers do seem to employ is the double-switch, pushing the pitcher's spot further down in the order. While it's a good move in the regular season, it's not one I generally endorse in the All-Star game. For one, the manager wants to get a lot of players into the game, so being forced to pinch-hit is not necessarily a bad thing. Two, the players off the bench may be better hitters than the player who just entered in the double-switch, meaning that the team is actually hurt by the switch. And three, the having the pitcher's spot come up gives the manager extra flexibility in just who will come up in that spot, and that flexibility is a good thing. In fact, in some cases, it's reasonable to double-switch in order to bring the pitcher's spot closer in the order for the above reasons, especially if the new position player is a relatively weak hitter compared to his benchmates.
The key to employing the overall substitution strategy that I just outlined is patience and the ability to alter the game plan on a moment's notice. This is probably the reason that no manager has employed this strategy to date - they want to have a relaxing time and a predetermined plan to assure that everybody has a role. However, employing this technique requires much more strategy and thinking than even a regular season game does, precisely because so many players are available. Managers are also not practiced at this style of substitution, since the All-Star game is a unique situation. However, a few practice games of Strat-o-Matic (or even the simplest baseball board game) should get them the feel for their roster so that the moves they should make will become routine.
So how can this strategy be specifically employed by Joe Maddon and Charlie Manuel tonight? Here are a few guidelines:
American League
Pitchers:
Maddon has announced Roy Halladay as his starter, and I can't quibble with that. He should go two unless the AL bats around after two innings. After that, a good rotation would be Greinke, Hernandez, Jackson, Verlander, Nathan, Rivera, and Papelbon. Maddon needs an emergency extra-inning guy, and for me that player is Tim Wakefield. I feel bad since this means he likely won't get into his only All-Star game, but frankly he doesn't deserve to be there anyway. The only other pitchers on full rest are Greinke, Halladay, and Hernandez - all far too good to be left sitting in the bullpen. Josh Beckett and Mark Buehrle, guys who have been to the game before and are not the aces of this staff, are the other two guys left for extra inning duty. Fuentes, the only lefty reliever, can be used to play the lefty/righty matchup game along with Andrew Bailey as his right-handed counterpart.
Hitters:
Of the starters, Mauer, Teixeira, Longoria, Bay, and Ichiro are either head and shoulders above their peers at their position, or far too good of hitters to remove, so Maddon should plan to play them the entire game (the exception is Ichiro who can be pinch-hit for if the situation desperately calls for power). Second base (Aaron Hill) and shortstop (Derek Jeter) are the "weak" hitting positions that can be pinch-hit for if they come up with multiple runners on base. As righties against an almost entirely righty pitching staff, pinch-hitting for these players is even more appealing. After the pinch hitters take their hacks, Ben Zobrist can take the field at second and Jason Bartlett can play shortstop. Centerfield can be platooned, with Hamilton removed for Adam Jones when facing a lefty. He in turn can be replaced by Granderson if a righty re-enters the game for the NL.
I'm not a fan of the way Joe Maddon has constructed his bench, leaving two of the league's best hitters - A-Rod and Cabrera - off the roster entirely and leaving it surprisingly bereft of proven mashers. Off the bench, Justin Morneau is by far the best lefty and the biggest power threat. Kevin Youkilis is the best option from the right side. It doesn't matter if they are used early or late, as long as they hit in a big spot with runners on base. With three spots in the batting order to choose from (2B, SS, or P) that big spot is all but guaranteed to come.
Victor Martinez, Carl Crawford, and Carlos Pena are the other best pinch-hitting options since they are either lefties or switch hitters against a mostly right-handed NL pitching staff. They can be used according to the game situation. If Crawford enters the game late, he can also replace Bay in left field for defense. Nelson Cruz, Michael Young, and Brandon Inge should be held in reserve in case of extra innings. Young can also take over at either second or short in case a second big pinch-hitting opportunity arises at either of those spots in the lineup. In the case of Cruz, pinch-running late in the game is also an option, presuming Maddon has enough players left on the bench.
National League:
Pitchers:
Charlie Manuel has announced Tim Lincecum as his starter, and as the ace of the staff he should go two innings, followed by Santana, Haren, and Billingsley. Ted Lilly and the hometown Franklin can divide the 6th, with Lilly coming in to face the left-handers. The 7th through 9th can be handled by Cordero, Hoffman, and K-Rod. The emergency pitcher should clearly be Zack Duke, a pitcher who is only a marginal All-Star and will be on three days rest. The only other NL starter on four days rest is Lincecum, who is clearly too good to be an option there.
With no left-handed relievers, Manuel can't play the matchup game effectively. Heath Bell, Josh Johnson, and Jason Marquis are the other pitchers who can go in case of extra-innings. Bell can also fill in if another starter gets into trouble (or if the NL surprisingly bats around in the bottom of the first and Lincecum must be removed for a pinch hitter).
Hitters:
Starters Albert Pujols, Chase Utley, Hanley Ramirez, David Wright, and Ryan Braun should be left in for the duration, as they are head and shoulders above their peers. While it was previously reported that Brad Hawpe would be forced to start the All-Star game in Carlos Beltran's absence, recent news lists Shane Victorino as Manuel's starter. If the former were true, I would advise Manuel to remove Ibanez from the order after taking his first at-bat in order to shore up the shoddy outfield defense. That doesn't appear necessary now.
The "weak" positions which can be removed for pinch hitters are centerfield and catcher. Molina, clearly the weakest hitter on the squad should be pinch-hit for early and then replaced by the superior, left-handed Brian McCann. Manuel should also pinch-hit for Victorino if a big situation arises, and then replace the pinch hitter with Hunter Pence. Pence in turn can also removed for a pinch-hitter if another key situation arises, and Jayson Werth can take over in center field.
Manuel has three incredibly dangerous left-handed bats on his bench in Howard, Fielder, and Gonzalez, and he should use them for pinch-hitting situations with runners on base when any of the three light-hitting positions come up in the order.
Other options for pinch-hitting for the pitcher are Miguel Tejada, Ryan Zimmerman and Justin Upton. Brad Hawpe provides yet another potent left-handed bat. If a left-handed pitcher enters the game, Manuel should also take the opportunity to replace Ibanez with Werth or Upton - this should also be done if the NL gets a lead to improve the outfield defense. Freddie Sanchez and Orlando Hudson can be used as the last men on the bench if the game goes to extra innings - they should by no means be replacing Wright or Utley in the batting order.
Conclusion
Will Manuel and Maddon follow this advice, playing their best starters the whole game, while still getting a majority of players into the game? If they are anything like the previous All-Star managers, we'll see wholesale changes mid-way through the game, and hence the inferior reserves will be taking the big at-bats at the end of the game.
Taking my own advice and playing several sets of simulated games, I was very successful in getting 26 to 29 players for each side into the game (about as many as previous managers have done), while still making sure that the biggest bats are up in the biggest situations and keeping the best players in the whole time. Of course, sometimes the game played perfectly into my strategy and other times I was not as lucky, but no matter the course of the game, the main goals were achieved every time. The key is to stay flexible and let the game dictate the decisions. It's a strategy that's best for the players, the fans, the teams, and the game. I'd love to see it tonight, but I'm not holding my breath.
| Baseball Beat | July 13, 2009 |
Nobody Came By on the Noon Balloon from Saskatoon...
In honor of my nephew Brett, who is playing on the Canadian Professional Golf Tour and finished tied for 39th (in a field of 155) in the Saskatchewan Open at Dakota Dunes this week, nobody came by on the noon balloon from Saskatoon and asked me but...
I'm not sure if Weaver is a victim of not selecting enough starting pitchers, picking the wrong ones, or requiring that each team must be represented by at least one player, but his exclusion is an injustice that makes me wonder why so many Hall of Fame voters look to All-Star appearances as one of the reasons why they would support (or not support) a candidate for enshrinement in Cooperstown? Yes, I'm looking at you, Mr. Olney.
Question to all the Blyleven Weaver naysayers out there: When is he supposed to morph into his brother Jeff?
Through the Weaver brothers first four seasons:
| Wins | Losses | % | ERA | IP | H | R | ER | HR | BB | SO | HBP | ERA+ | WHIP | H/9 | HR/9 | BB/9 | SO/9 | SO/BB | |
|---|---|---|---|---|---|---|---|---|---|---|---|---|---|---|---|---|---|---|---|
| Jered | 44 | 22 | .667 | 3.60 | 575.0 | 540 | 243 | 230 | 64 | 166 | 467 | 13 | 125 | 1.228 | 8.5 | 1.0 | 2.6 | 7.3 | 2.81 |
| Jeff | 44 | 54 | .449 | 4.30 | 792.2 | 809 | 410 | 379 | 88 | 224 | 534 | 57 | 105 | 1.303 | 9.2 | 1.0 | 2.5 | 6.1 | 2.38 |
As Al Michaels, in his best Howard Cosell impersonation asked, "Who goofed? I've got to know."
| F/X Visualizations | July 09, 2009 |
Felix Hernandez's Power Change
A while ago I looked at the success of a changeup based on its speed separation from the preceding fastball. Since then I had the pleasure of answering some of Dave Cameron's questions on the Mariners. He asked me about Felix Hernandez's changeup, which keeps getting faster.
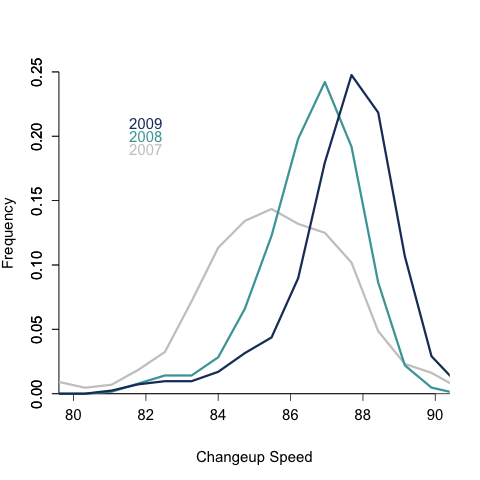
At the same time his fastball has actually slowed slightly, so that the separation between the two pitches has gotten smaller. The difference averaged 9mph in 2007 and is down to 5mph this year. My work suggests that on a pitch by-pitch basis a separation between 5 mph and 10 mph is optimal, while others showed that on an overall average basis the bigger separation the better. Either of these results would suggest that Hernandez's changeup should be getting worse every year. But that is not he case. Remember that the run value is the change in run expectancy so negative is good for Hernandez.
+-------+------------------+-----------------+
| Year  | Changeup Run Val |  Aver CH/FB Dif |
+-------+------------------+-----------------+
| 2007  |           -0.017 |         9.0 mph |
| 2008  |           -0.022 |         7.1 mph |
| 2009  |           -0.032 |         5.2 mph |
+-------+------------------+-----------------+
At this point Hernandez's changeup is amazing, one of the top few in the game. It is interesting that his success runs counter to the prevailing trend. To examine it further I plotted the run value of his changeup based on its speed.
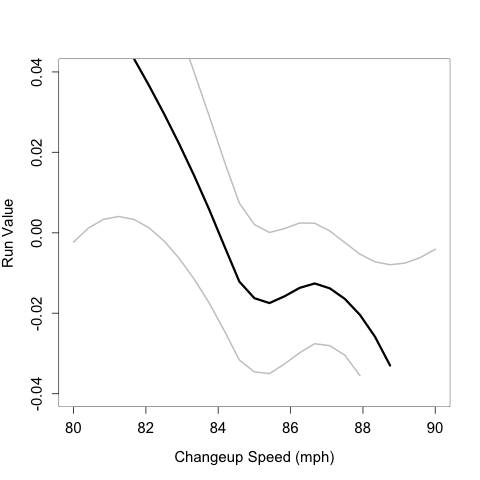
Overall felix's changeup gets better with increasing speed, which is very unlike the average player's changeup. As most pitcher's changeups get faster they start looking just like slow fastballs and get crushed, but since Hernandez throws such a fast changeup he can succeed throwing as his changeup fast as some pitchers throw their fastballs. Next I wanted to check out the success of his changeup based on how much slower it was than the preceding fastball.
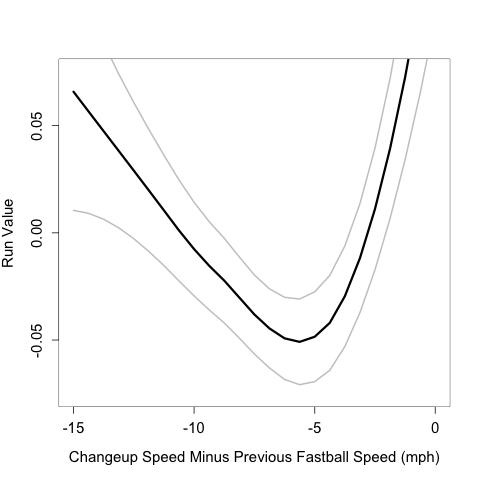
Where as for the average pitcher there is a plateau in which the changeup is equally successful between 5 and 10 mph slower than the preceding fastball for Hernandez success peaks at 5 mph and falls off rapidly if it gets any slower. This again shows the Hernandez is succeeding with a fast changeup.
There are important limitations to studies that show trends for all pitchers averaged together; all pitchers are different. In this case Felix Hernandez succeeds with a power change that has little separation from his fastball. That same separation for the average pitcher, with a slower fastball, would be big trouble.
| Baseball Beat | July 09, 2009 |
The Defense Never Rests
I returned as a guest last Friday evening on the St. Louis radio station 590 KFNS, also known as The Fan. The show was once again hosted by The Benchwarmers, Brendan Wiese and Nick Barrale. We discussed defensive metrics, including zone ratings, as well as Wins Above Replacement, and the traditional Triple Crown stats vs. rate stats such as AVG/OBP/SLG.
Nick, a former minor league play-by-play announcer, is a bit old school, expressing his skepticism over the more advanced defensive metrics and his preference for a batter who can hit as opposed to those who are proficient at drawing walks. Brendan, on the other hand, seems to appreciate the insights of these newer stats and measurements of player value.
Ozzie Smith, Franklin Gutierrez, Nyjer Morgan, Albert Pujols, and Jim Edmonds were all mentioned.
Speaking of defense, Morgan, who was recently traded from the Pirates to the Nationals, leads the majors in Ultimate Zone Rating. David DeJesus and Colby Rasmus rank second and third among outfielders in UZR. Morgan leads all LF, Gutierrez tops all CF, and Jay Bruce is No. 1 among RF.
Moving to the infield, Paul Konerko and Miguel Cabrera, much to my surprise, are first and second in UZR at first base. Brandon Phillips sits atop the defensive rankings at 2B, Jack Wilson ranks first at SS, and Joe Crede is the top-rated 3B (with a whopping 27.0 UZR/150 games). Fangraphs doesn't list UZRs for pitchers and catchers.
| Change-Up | July 08, 2009 |
Capitol Crisis?
**Update below**
 The Washington Nationals took to the field in Denver last night for the 81st time in regular season play and just as they had 56 other times in 2009, they lost a baseball game. At the halfway mark of their season the Nats are now 24-57, "good" for a .296 win percentage that puts them on pace to win 48 games. It would be the lowest win total in a 162-game season since the 1962 New York Mets won 40. No other National League team has won less than 50 since those Mets and just the 2003 Detroit Tigers have failed to win 50 in either league since the advent of the 162-game season. What I want to know is this; will the Nationals win 50 games?
Let's take a close look at the Nats and also analyze the makeup of the other historically awful teams in recent memory to try and identify differences and similarities. In this morning's Washington Post, Tom Boswell diagnoses what's wrong with the Nats. He has me for a while but then he writes this:
As if that weren't enough, the Nats have few situational hitters. Zimmerman was excellent as a rookie; now, he thinks he's past such humble duties. Put a man on second with nobody out or a man on third with one out and no Nat changes his plan of attack. Bunt for a hit, hit-and-run, squeeze? The Nats? You could die waiting.
When a team is on pace for a sub-50 win season, it's safe to say that a lack of situational hitting is in all likelihood not one of the top, oh, 100 problems or so with that team.
First the bright side for the Nats. They are 7 wins off of their Pythagorean-win pace and even further off if you look at Baseball Prospectus's third order wins, which looks more closely at how a team is hitting and pitching and assigns expected run totals. That number has them 11 wins short of where they ought to be and not even the worst team in the National League. That distinction belongs to the San Diego Padres. So it would appear that they have been unlucky.
The Nationals are also getting better. They started the season with a 5-16 April and backed it up with an 8-20 May. They are 11-21 since June 1st, which may not sound all that great - heck it's terrible - but it does represent marked improvement over their 13-36 record in the first two months. Some of that is the result of better luck and some of that, to management's credit, is the result of some personnel changes.
They acquired the tall right hander in the first place so it's hard to give too much credit here but Washington did replace Daniel Cabrera with promising youngster Jordan Zimmerman. That they optioned Shairon Martis, he of the 5-3 win-loss record, tells me that they are thoughtful about peripheral statistics. It will be interesting to see how long they can tolerate one disastrous Scott Olsen start after another.
They haven't sat idly with their position players, either. They acquired Nyjer Morgan from the Pittsburgh Pirates. Morgan is exactly the kind of defensive player they need patrolling their outfield with some combination of Adam Dunn, Austin Kearns and Josh Willingham flanking the center fielder at the corner outfield spots. While Washington's pitching has been nothing to write home about, much of their horrendous run prevention can be attributed to its defense, which ranks worst in Major League Baseball according to Defensive Efficiency Rating.
There are rays of hope for the Nationals, something that could not be said for some of the other historically bad teams over the last 50 years or so. Look at the 1962 Mets roster and there is no recipe for consistency with those ingredients. It's loaded with players that had no real shot of succeeding as Major League regulars. And they were an expansion team, so you would expect as much.
The 2004 Arizona Diamondbacks, winners of 51 games, managed to hit .253/.310/.393 as a team, all while playing home games in an absolute hitters paradise. Their starting pitchers not named Randy Johnson and Brandon Webb combined for 459 innings of 7.22 ERA performance. Again, there was just no way a team like that could string together wins.
The 2003 Detroit Tigers, who went 43-119, were sort of like the 1962 Mets. There was just nothing there. Their best starting pitcher in 2003 in terms of ERA was Nate Cornejo, who posted a 4.67 figure. My favorite part of Cornejo's season is that he was ostensibly the best pitcher on the team while featuring 2.1 K/9 and .79 K/BB ratios. He was awful, and yet a big reason the Tigers pitching numbers were merely bad and not a complete disaster is because Cornejo managed a 95 ERA+. The team ERA+ was 81.
Washington is different. Ryan Zimmerman has blossomed into a top-20 MLB position player. Dunn is having one of his better seasons at the plate. Nick Johnson and Cristian Guzman are both healthy and playing solidly. Josh Bard is having a nice year and getting more time behind the plate now. John Lannan currently sports a 145 ERA+. Their pitching is bad, but not that bad. Maybe with Morgan in the fold, their run prevention improves a bit.
If the Nationals play the same way in the second half and simply hit their Pythag number, they win 55 games. If they hit their third-order wins number, they're looking at closer to 60 wins. Factor in personnel changes - some of the players contributing to their awful numbers are no longer in the mix - and maybe you can even push 65 wins. The biggest threat to the 2009 Nationals is what happens at the trade deadline. Just about any deal that retrieves young, cheap talent would be defensible so I am not saying that they should avoid making deals in order to avoid infamy. But this team as currently constituted is bad, just not historically so. Swap out Johnson or Guzman or Joe Beimel for some Minor Leaguers and then sure, things will look different.
Short of blowing up their Major League roster, however, I would say that they've got the 50-win threshold in the bag.
**Update**
This is one of the funniest reads I've seen in a while, courtesy of the DC Sports Blog. Last night's loss to Colorado was straight out of Major League, right down to the Austin Kearns Willie Mays Hayes-style headfirst slide to nowhere and the Harry Doyle/Monte "what the *^%& is this *&%#" announcing. Seriously, go read it.
| Behind the Scoreboard | July 06, 2009 |
Is The All-Star Game The Biggest Remaining Game for Dodgers?
A week from today, the Major League All-Star Game will be played between the American and National leagues. Traditionally the greatest exhibition in all of sports, the game changed in 2003 when Bud Selig decreed that the winner of the All-Star game would have home field advantage during the World Series. While the move (which I love) has largely accomplished its purpose of rejuvenating the game and inspiring competitive instincts in the players, the game is still somewhat treated as an exhibition. Players still occasionally beg out of the game and the managers still try to get everybody in the game, even if it means taking some of the best players out. Terry Francona actually said he was hoping for a game ending NL homer last year as the game went to extra-innings. For him, the All-Star game was secondary to regular season games.
The All-Star game's slogan is "This Time It Counts", but how much does it really count? Obviously Francona and company don't think it counts for very much. Is home field advantage in the World Series really worth playing for? Or are players better off focusing on the regular season?
Earlier this season, I debuted Championship Leverage Index, an attempt to measure the impact and importance of a game on a team's chances of winning the World Series. We can apply this same methodology to the All-Star game. Of course, during the regular season, an additional win adds to the probability of winning the World Series by increasing the team's chances of making the playoffs and thus winning a championship. In the case of the All-Star game, winning the game helps only if the team makes it to the World Series.
How Much Is An All-Star Game Win Worth?
Assuming that a team does make it to the Fall Classic, how much does having the home field help? Historically, having home field in an individual game adds about 4% to a team's probability of victory. This number has been larger during the playoffs, but this likely has something to do with the best teams playing more home games, so it's a misleading guide. Taking this 4% mark and assuming the teams are even, a World Series team would have a 54% chance of victory in its home games and a 46% chance of victory in its road games. How does this translate during an entire 7-game series? Turns out that the mathematics show that a team which has the home field advantage in the series as a whole will win 51.26% of series.
Overall, the extra 1.26% is pretty small - there's probably a reason that MLB doesn't tout this number in its "This Time It Counts" promos for the All-Star game - but in something as big as the World Series, it helps to have every advantage possible. Of course, the game only adds 1.26% for a team actually playing in the World Series - to other teams, the game is worthless. Apportioning this advantage blindly among an average of 15 teams per league, an All-Star win adds 0.084% to each team's chances of winning the World Series. Thus, if you were oblivious to the standings, and your league won the All-Star game, you could rejoice that your team's chances had just gone up by 8 one hundredths of one percent. This time it counts, eh?
Indeed, 0.08% sounds impossibly small, until you consider that the average regular season win doesn't help you much more, clocking in at a mere 0.28% according to my prior work linked to above. Dividing these figures, we find that the All-Star game has a Championship Leverage Index of .30, meaning that the game is about 30% as meaningful as the average regular season game.
You can be the judge of whether 30% of an average regular season game is more or less than you might have thought. I suspect it's more. 30% of an average game is not a lot, but it's more meaningful than any Nationals game has been since May, and it's more meaningful than many teams' regular season games will be in about a month's time. What's more, I doubt that Francona would be willing to wish away even 30% of a regular season Sox game.
All-Star Championship Leverage Index by Individual Team
Of course, while on average the All-Star game is worth about 30% of an average regular season game, we can calculate this separately for individual teams, with dramatically differing results. Teams which are far back in the race need every win they can get their hands on, and home field advantage in the World Series means little. The chance that one regular season win will prove decisive is low, but the chance that home field advantage in the World Series will make a whit of difference is even lower. For teams in the thick of a pennant race, the World Series advantage is useful, however each regular season win has a fairly high chance of being crucial, rendering a regular season win far more valuable than an All-Star game win.
However, the All-Star game takes on the most importance to teams which are far ahead in the standings and have a high likelihood of making it to the Fall Classic. For these teams, a regular season game also means relatively little, since a playoff berth is all but locked up. In this scenario, is the All-Star game actually more important than a regular season game?
Looking at this year's Dodgers, let's aim to find out. As of Sunday night, the Dodgers were sitting at 52-30 with a 7.5 game lead in the NL West and a 9 game lead in the NL Wild Card. When I previously calculated Leverage Index, I assumed each team had a 50% chance to win each game and that each team had a 50% chance to win each playoff series. Here I used a more refined method, using Baseball Prospectus' PECOTA-adjusted winning percentages as the probability of victory and playing out the play-off series according to baseball's home field advantage rules.
Using this methodology and simulating 10 million seasons, I calculated that the Dodgers have a 39.0923% chance of advancing to the World Series. After a regular season win, this chance increased to 39.2781%, while after a regular season loss, this chance decreased to 38.8368%. On average, this resulted in a change of 0.215% in probability to advance to the World Series and hence, a 0.108% change in probability of winning the World Series (0.215% times 50%). Thus, a regular season game is worth about 0.108% in championship probability to the Dodgers (only about 39% as important as an average game). An All-Star win, however, will increase their chances of winning the World Series from 19.5462% (39.0923*.5) to 20.0387% (39.0923*.5126), a difference of 0.4925%. Comparing this mark to 0.108% for a regular season game and we find that the All-Star game is not only worth more than a regular season game to Los Angeles, it is worth vastly more than than a regular season game. In fact, the All-Star game is worth somewhere on the order of 4 to 5 times more than a current regular season Dodgers game.
A fuss was made over Chad Billingsley bowling over the catcher during a Dodgers-Padres game this past weekend. Would Billingsley have done so at the All-Star game? Likely not. But this analysis shows that if there is one game the rest of the season in which LA players should sacrifice life and limb, it is Tuesday night's "exhibition" contest.
The following chart shows a few other teams, and the All-Star game vs. regular season game impact on the team's chances of winning the World Series. The Championship Leverage Index for each was computed relative to the baseline of the average game (0.28%).
As you can see, only the Dodger players have more incentive in the All-Star game than in their next regular season game. With an All-Star game Championship Leverage Index of 1.76, the All-Star game is not only more important than their next regular season game, but is likely the most important game of the entire season. Regular season Champ LI's don't usually get that high until at around mid-season, and considering the way that the Dodgers have run away with the NL West, they likely have not had a game this important during the entire year.
However, the game also means a great deal to Boston and other AL East contenders who expect to be playing October baseball. For these teams the game is not merely an exhibition, but a game nearly as important as any other on the schedule. For the Red Sox, the All-Star game is about 66% more important than the average game, although not as important as the key games they are playing now. Still, for Francona's Sox, the All-Star game is about 85% as important as their next regular season game. For the other teams listed, the All-Star game is not nearly as important as their next regular season game, drifting to nearly meaningless for fringe teams like the Astros.
For baseball fans, the All-Star game is must-see TV because it's the one chance to see baseball's stars compete against each other. For fans of the Dodgers, it's must-see TV because it's by far the most important game LA will play until October.
| Baseball Beat | July 06, 2009 |
The Mid-Season Report
With all but eight teams having played 81 games thus far, it's fair to say that the 2009 Major League Baseball season is at the halfway point. While the All-Star Game typically marks the end of the first half and the beginning of the second in the eyes of most fans as well as season splits, the truth of the matter is that we've already reached that juncture.
Ten of the 30 teams have played exactly 81 games, the mode, if you'd like to harken back to your statistics courses in high school or college. Twelve have completed more than 81 and eight have played fewer than 81. St. Louis leads the majors with 84, while the Chicago Cubs are tied with Philadelphia and Washington for the fewest with 79. As a result, the Cardinals have five more off days than one of their division rivals the rest of the way. STL has an extra day off at the All-Star break, which I believe to be advantageous plus three more during the "dog days" of August and a couple more during the middle of September.
The Los Angeles Dodgers sport the best record in baseball and, along with the Boston Red Sox, are one of only two teams with W-L percentages of .600 or better. If the Dodgers and Red Sox meet in the World Series, it would be the first time since 1916 when Boston beat the Brooklyn Robins in five games.
On the other end of the spectrum, the Nationals have the worst record and, along with the Cleveland Indians, are one of just two teams with W-L % below .400. The Nats, in fact, are making a run at the .300 mark, ensuring the No. 1 draft pick for the second year in a row. Signing Stephen Strasburg and next year's top draftee (most likely Bryce Harper) is going to cost the franchise a ton of money and make Scott Boras and his clients happy and wealthy (or, in the case of the super agent, happier and wealthier).
If the season ended now, the division champions in the American League would be Boston in the East and Detroit in the Central, with Texas and the Los Angeles Angels battling for the title in a one-game playoff. You could even think of that game as the one that is being played tonight in Anaheim, pitting the Rangers' ace Kevin Millwood against the hometown team's No. 1 this season, Jered Weaver. The New York Yankees would be the Wild Card representative from the AL.
Over in the National League, the division champs would be Philadelphia in the East, St. Louis in the Central, and the Dodgers in the West. The San Francisco Giants would be the Wild Card entrant.
However, with EIGHTEEN teams within four games of the division lead and at least two more in the thick of the Wild Card race, fully two-thirds of the clubs are thinking in terms of October as the season heads into the second half of its schedule.
Let's take a closer look division-by-division:
AMERICAN LEAGUE EAST
TEAM         W    L   PCT  GB
Red Sox      49   32  .605  -
Yankees      48   33  .593   1
Rays         44   39  .530   6
Blue Jays    42   41  .506   8
Orioles      36   46  .439  13.5
The AL East is the toughest division in baseball, bar none. There's rarely any debate about this matter most years and there is NO rational argument that can be made against this statement this season. Three of the top four teams and four of the top six in run differential reside in this division. That is an incredible accomplishment considering that these five clubs have played against one another more than a third of the time. By definition, the team that finishes in third place will be eliminated from the postseason even though it just may be the fourth-best club in all of baseball. That means either the Red Sox, Yankees, or Rays will be on the outside looking in this October. (I didn't include the Blue Jays in this mix because Toronto has played the fewest games against its East opponents and, at 7-14, has fared worse than the others in intra-division play.)
AMERICAN LEAGUE CENTRAL
TEAM         W    L   PCT  GB
Tigers       44   37  .543  -
Twins        43   40  .518   2
White Sox    42   40  .512   2.5
Royals       35   46  .432   9
Indians      33   50  .398  12
Plain and simple, the AL Central is a three-team race. It's hard to separate this trio. The Tigers have won the most games, the Twins have the best Pythagorean record (45-38), and the White Sox have lost the most one-run games. In the meantime, the Kansas City Royals are about where most expected and the Indians have fallen short of even their biggest detractors this season.
As a side note, Joe Mauer (.389/.465/.648) is leading the league in AVG/OBP/SLG and has been the AL MVP, no questions asked. The 26-year-old catcher has slugged more home runs (14) in 256 plate appearances this campaign than he has in any single season in his six-year career. He is playing Gold Glove defense once again and has walked more than he has struck out for the fourth consecutive year. Given Mauer's age and position, it could be argued that he is the most valuable player in the game although I wouldn't argue vehemently against those supporting Albert Pujols and perhaps even Hanley Ramirez. I know Minnesota fans don't want to read this, but it'll be interesting to see if Mauer becomes Jorge Posada's or Jason Varitek's replacement in 2011 upon free agency. The timing couldn't be better for Mauer, the Yankees, or the Red Sox.
AMERICAN LEAGUE WEST
TEAM         W    L   PCT  GB
Rangers      45   35  .563  -
Angels       45   35  .563  -
Mariners     42   39  .519   3.5
A's          34   46  .425  11
The AL West is up for grabs this year with only the Oakland A's not having a realistic shot at the division title. While the Rangers have hung in there longer and tougher than most prognosticators predicted, the Angels deserve a lot of credit for overcoming the early-season injuries to John Lackey and Ervin Santana (not to mention Kelvim Escobar's virtual yearlong stint on the DL) as well as the tragic death of Nick Adenhart, the club's No. 1 prospect, after pitching six scoreless innings in his first and only start of 2009. TEX and LAA have similar positive run differentials while SEA has won four more games than its Pythagorean record would suggest, the most in the AL.
With respect to Oakland, it will be interesting to see which team free agent-to-be Matt Holliday winds up on later this month. He could be a difference maker down the stretch for the right team. GM Billy Beane would like to get the equivalent of two No. 1s, which is what the A's will receive if they lose Holliday to free agency at the end of the year.
NATIONAL LEAGUE EAST
TEAM         W    L   PCT  GB
Phillies     42   37  .532  -
Marlins      43   40  .518   1
Mets         39   42  .481   4
Braves       39   42  .481   4
Nationals    24   55  .304  18
The defending World Series champs sit atop the NL East while the surprising Florida Marlins are making (another) run at a world championship. In the meantime, the New York Mets, winners of just two of their last ten, and the Atlanta Braves are floundering at three games below .500. At 26-15, the Phillies have the best road record in the majors and are the only team in the division with a positive run differential.
With Ricky Nolasco once again pitching like he did last season, the young Marlins could pose a legitimate threat to Philadelphia's hopes of winning back-to-back titles. Nolasco and Josh Johnson (7-1 with a 2.76 ERA this season and 14-2 since returning from Tommy John surgery one year ago) could be as tough of a 1-2 punch as there is in the division and any team with HanRam (.346/.409/.574) at shortstop must be taken seriously. Ramirez is leading the league in AVG and 2B (26) and playing at an acceptable level in the field. In the non-Albert Pujols division of the MVP award, only Chase Utley can give his division rival a run for his money.
NATIONAL LEAGUE CENTRAL
TEAM         W    L   PCT  GB
Cardinals    45   39  .536  -
Brewers      43   39  .524   1
Cubs         40   39  .506   2.5
Reds         40   40  .500   3
Astros       39   41  .488   4
Pirates      37   45  .451   7
The top two teams in the NL Central are facing off in a three-game set beginning tomorrow night in Milwaukee. Ryan Braun (.326/.409/.557), the NL's No. 1 vote getter among outfielders for the second year in a row, would like management to add an arm or two to the club's pitching staff before it's too late. Meanwhile, the Cubs, Reds, and Astros, and perhaps even the Pirates, are still hoping to make noise in the second half.
But let's take a second to review Pujols' numbers. As my good friend Brian Gunn (the former proprietor of the now defunct Redbird Nation, one of the best team blogs during its reign) told me when we were discussing Prince Albert's Baseball-Reference page, "I frequently get lost there. It's like the Sistine Chapel of B-R pages — not a flaw on it." So true. I mean, he is hitting .336/.460/.739 while leading the NL in games, runs, home runs, RBI, walks, IBB, times on base, OBP, SLG, OPS, OPS+, total bases, runs created, and, most importantly, all the stats that measure wins, such as Wins Above Replacement. He's the MVP of the season and is now looking like the MVP of the decade.
NATIONAL LEAGUE WEST
TEAM         W    L   PCT  GB
Dodgers      52   30  .634  -
Giants       44   37  .543   7.5
Rockies      42   39  .519   9.5
Padres       35   46  .432  16.5
Diamondbacks 33   49  .402  19
While the NL West is all about the Dodgers, the Giants and Rockies are Nos. 1 and 3 in the Wild Card race. Los Angeles, San Francisco, and Colorado are 1-2-3 in run differential in the league. At 30-12, the Dodgers are making mince meat of its division foes, yet the five teams are playing a combined .500 in interleague play.
What makes the Dodgers record all the more remarkable is the fact that the team was without its best player, Manny Ramirez, for 50 games (or more than 60 percent of the season to date). LA is winning at home, on the road, during the day, at night, one-run games, extra-inning games, you name it. This is a legitimately excellent team and one that should be favored to represent the NL in the Fall Classic this October, provided that manager Joe Torre doesn't wear out his bullpen (headed by Jonathan Broxton), as he is wont to do, down the stretch.
| F/X Visualizations | July 03, 2009 |
Angle of Ball in Play by Pitch Type and Speed
Last week I looked at the horizontal angle of a ball in play as a function of the location in the zone where it was hit. Although there is some trend for lower pitches to be pulled more, most of the trend is dictated by the horizontal location of the pitch. As expected inside pitches tend to be hit to the pull field and outside pitches more to the opposite field.
Below I reproduce the trend for just the horizontal location. I found the average angle of a ball in play as a function of the horizontal location of the pitch. The center of the strike zone is 0 and negative numbers indicate pitches that are inside to right hand batters and positive numbers outside. The strike zone extends from -1 (inside edge to a RHB ) to 1 (outside edge to a RHB). The angle of a ball in play follows the -45/0/45 convention (-45 is the third base line, 0 2nd base and 45 the first base line), so negative numbers indicate the pull field for a righty.
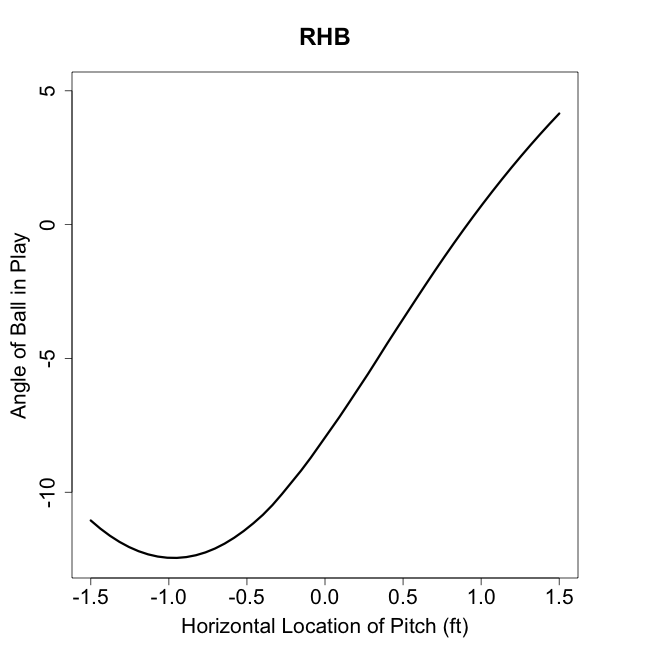
Starting away and moving towards the batter more and more balls are pulled, with the trend slowing and stopping at about the inside edge of the plate. Here you can see the overall pull tendency. At x=0, the middle of the plate, the average ball is hit to about 7.5° to the pull field and at x=1, the outside edge of the plate, the average ball is hit right up the middle.
I was interested in how this varied by pitch type. I expected that slower pitches would be pulled more, as hitter have more time to 'get around' on such pitches.
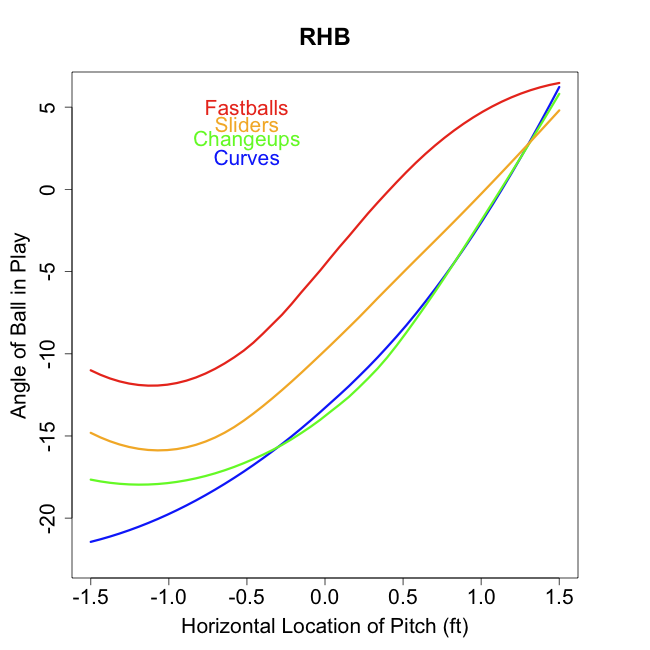
The results confirm our expectations. The slower a pitch type the more it is pulled, so that through much of the strike zone the average curveball or changeup is pulled 10° more than the average fastball in the same horizontal location. This shows part of the danger of coming inside with breaking and off-speed pitches. These pitches, if they are hit, will tend to be pulled heavily, which is where most hitters have the greatest power.
I also wanted to see how much speed affected pull, regardless of pitch type. Here I plot the average angle of a ball in play by pitch speed for three horizontal locations, away (but in the zone), down the middle and inside (but in the zone).
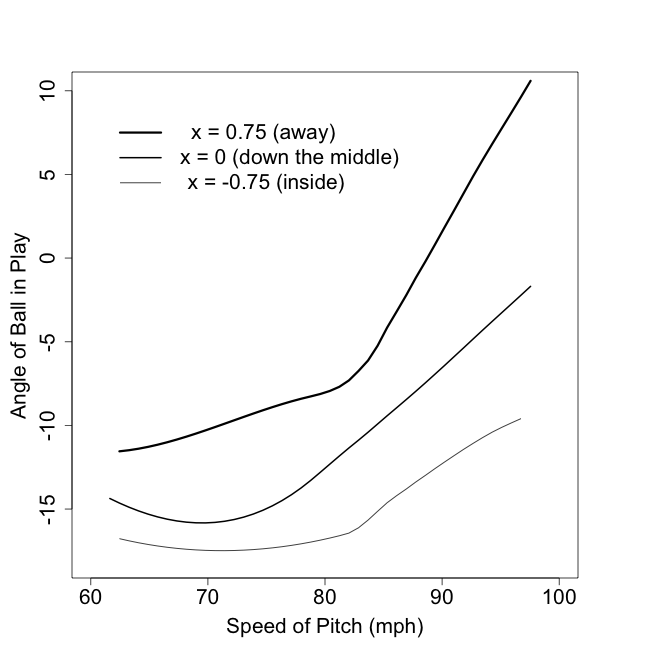
The effect of pitch speed is strong, nonlinear and interacts with location. So for inside pitches there is not much effect of speed, the pull rate of a very slow and very fast pitch are not that far off. Similarly there is not a lot of difference in the pull rate of very slow pitches across location, they are all pulled heavily. But outside pitches are strongly affected by pitch speed, with slow ones being pulled and fast ones going to the opposite field. And very fast pitches are strongly influenced by location, with inside ones being pulled and outside ones going to the opposite field.
The results here are not that surprising, but nicely confirm long-held baseball expectations.
| Behind the Scoreboard | July 02, 2009 |
Team Draft Success: Calculating the Effect of a General Manager's Drafting Ability (WAR and the Draft Part 3)
This is the third part of what has been a three part series on the MLB Draft. Part one created a model for the expected value of each draft pick, while part two calculated probabilities of becoming a certain caliber player, as well as expanded on the conclusions in part one.
Today's article focuses on individual teams and how much control they have over the draft process. Is drafting more or less a complete crapshoot, or does the success of a draft vary greatly depending on the front office and the team who is doing the drafting (and oftentimes developing the players as well). Is there much to distinguish a great drafting franchise from a poor one, or is the difference mostly due to luck?
To review, the data I had at hand was gleaned from Sean Smith's WAR database and Baseball Reference, and contained overall picks #1-50, as well as a handful of picks after that (every 5th pick through #100, every 10th pick through #500, and every 25th pick through #1000). While not every pick for every team is covered, this data gives each team a sample of well over 100 draft picks, including all of a team's very high selections. Data used in this study, will focus only on each player's "first six year" WAR, since the team only gains from drafting a valuable player during the years in which it does not have to pay market value. The data is also limited to those players drafted in 2001 or earlier, since more recently drafted players have not had a chance to come up and show their full value.
Draft WAR By Team
So, how did the teams fare? For what it's worth, the table below shows team's drafts based on the sample of picks which I have (which includes all top picks and a smattering of picks after that).
As you can see, the Red Sox are the clear #1, while the Padres, Cubs, and Rangers rank near the bottom. As a Cubs fan, the news comes as no surprise, since for nearly all of my first several years of following the team (I started following in 1987), the Cubs never seemed to have a home grown player contribute to meaningfully to the team. Likewise, it seems as though the Red Sox have had an endless array of talent coming up through their farm system.
Of course, this still doesn't account for the fact that teams have undoubtedly changed a great deal since 1965, and the philosophy and scouting behind a team's drafting and development strategy when the draft first began likely bears no resemblance to the operation of today. Additionally, the WAR Above Average per Pick value is tough to extrapolate to the entire draft since the data I have is heavy on top picks and those top picks have higher WAR and a higher variability in WAR.
While the numbers are interesting, and give a snapshot of how teams have done with their past drafts (again, this is only a sample of picks, not all picks - perhaps another study has shown WAR by team for all picks - if so, that would be superior to the above table), we can't fully get at the question of how large a difference there is between a smart drafting organization and a poor drafting organization without fuller data and a more refined unit of analysis.
Draft WAR by General Manager
Perhaps more relevant than a team's drafting record is the record of individual general managers. For study this I compared 10 current general managers with substantial draft records dating to back before the 2001 draft. I went back and obtained all picks (not just the sample I previously had) for each of these GM's during their tenure so that I had a substantial amount of data to work with.
Comparing each GM's actual WAR to the expected WAR from the model and then comparing the GM's to each other, gives us an idea of how successful each GM has been relative to the others. The table below shows each GM and his drafting record.
As you can see, of the 10 GM's studied, Billy Beane is unsurprisingly at the top of the heap, followed closely by Walt Jocketty, former GM of the Cardinals and current GM of the Cincinnati Reds. Bringing up the rear are Brian Cashman of the Yankees and Brian Sabean of the Giants.
So, Beane has had good drafts and the Sabean has had bad drafts. Is this a real difference, or is this a simple artifact of luck? To investigate this, we first calculate the weighted variance of the GM's WAR Above Average per pick. This observed weighted variance is .036. Then we calculate the expected weighted variance if all teams were equally good at drafting (with an expected WAR Above Average value of 0 and a SD of 2.0, which is the SD of WAR Above Average over all picks). This expected variance is .013. Taking the square root of the difference of the two variances gives an estimate of the standard deviation of the true drafting talent across GM's. (Observed Variance - Expected Variance due to Noise = True Variance). Calculating this with our numbers tells us that the true distribution of GM talent (including scouting, development, etc.) has a standard deviation of .150 WAR per pick.
With each team making about 45 picks per year, this means that the SD of the GM talent over an entire draft is a staggering 6.75 WAR. Basically a good GM will net his team an extra 6 or 7 wins above that of an average GM in a single draft. An outstanding GM (top 3% of all GM's) can net his team 13 wins above that of an average GM. Of course the signs can be reversed when talking about poor GM's. This distribution shows just how valuable a good GM can be. As we can see here, the difference in draft quality is more due to skill than chance (though of course, chance plays a major role), and a good GM and scouting system can make all the difference.
According to Moneyball, Billy Beane at one point was to be essentially traded for Kevin Youkilis. While Youkilis has become an outstanding player, the trade would not have been a good one. Beane, in just 4 years of the draft between 1998-2001, brought the A's essentially the equivalent of a Hall of Fame player, giving the A's 46 extra WAR over what the average GM would have been able to acquire. This advantage was gained on his drafting skills alone, not even accounting for his ability to make expert trades or sign free agents. Of course, time will tell how Beane's drafts will turn out during the years that followed the proposed trade, but the point is made - GM's have an enormous impact on a team's successes, even when considering their ability to draft alone.
Even when we scale back the WAR Above Average per Pick by about 25% to account for the regression effect (.15 estimated true standard deviation divided by the .20 observed standard deviation = .75), we still find that Beane is good for about 9 extra WAR per draft, while Sabean and Cashman are losing their teams about 9 WAR per draft.
Unfortunately, because draft picks take so long to develop, it makes it difficult to tell in "real time" how a GM is doing. However, this short study of 10 current long-time GM's shows us just how valuable a good GM can be.
| Change-Up | July 01, 2009 |
A Different Sort of Mid-Year Report
It's July 1, three months into the baseball season. With another three months remaining, it's a popular time for mainstream media members and basement dwellers alike to look back and determine their respective all-star teams, evaluate trade needs and look forward to what we might be able to expect the rest of the way.
In baseball we have grown accustomed to certain start and end points. The "first half" equals pre-All Star Game. So readily available, monthly splits are now popular. Understandably, the beginning of any given season represents the most widely cited starting point. There have been no shortage of great 10-game stretches by ballplayers in 2009, but remember when Emilio Bonifacio was making an MVP push back in mid-April?
One of many gifts that Fangraphs has given baseball enthusiasts is the ability to sort 365-day leaders in any number of statistics. So at the halfway mark of the 2009 season, I am going to take a different approach and put together an All-MLB team of sorts based on players' performances over the last 365 days - more or less a full season's worth of baseball. The only difference is that I will be using start and end points less commonly cited.
I will list my three top players since July 1st, 2008 at each position, toss in a starting rotation and then three relievers. You will notice that I highlight wOBA, as good a measure of offensive output as any. It combined on-base and slugging, but in a way that more accurately reflects their true respective values. Whereas OPS weights on-base and slugging equally, wOBA makes the proper adjustments. Its creator, Tom Tango, describes it this way:
Do we really need another statistic? Yes, we do. Instead of trying to take two statistics (OBP, SLG) and combine and correct their flaws in the hopes of getting one number, we prefer to start from scratch. Furthermore, by recasting the number onto the OBP scale, it makes it much easier for the reader to get a grasp on the number. wOBA is weighted on-base average (we call it an average rather than a percentage). When you look at wOBA numbers throughout the book, just think OBP, and you’ll be fine. In other words, an average hitter is around 0.340 or so, a great hitter is 0.400 or higher, and a poor hitter would be under 0.300.
Without further ado...
Catcher
             AVG   OBP   SLG   wOBA
Mauer       .356  .434  .547   .420
McCann      .308  .389  .509   .390
Soto        .263  .351  .441   .344
Notes: Joe Mauer is your clear leader here.
1st Base
             AVG   OBP   SLG   wOBA
Pujols      .345  .448  .702   .466
Teixeira    .309  .414  .591   .425
Youkilis    .314  .419  .592   .424
Notes: I can see an argument of Miguel Cabrera over Kevin Youkilis here, since Miggy has played 22 more games than Youk since last July 1.
2nd Base
             AVG   OBP   SLG   wOBA
Utley       .294  .403  .508   .398
Pedroia     .320  .388  .467   .378
Kinsler     .283  .353  .508   .378
Notes: Ben Zobrist didn't play enough games to get in the mix here but in case you had not noticed, he has been ridiculously awesome this season.
3rd Base
             AVG   OBP   SLG   wOBA
Wright      .331  .417  .537   .413
A-Rod       .267  .389  .535   .398
Longoria    .291  .366  .553   .391
Notes: Chipper Jones misses this list by a hair. Given how much more durable he has been than A-Rod, Longoria and Chipper, the extent to which David Wright (at least at the plate) has separated himself from the MLB third base pack is notable.
Shortstop
             AVG   OBP   SLG   wOBA
Ramirez     .325  .412  .559   .414
Jeter       .312  .382  .437   .368
Tulowitzki  .287  .367  .471   .354
Notes: There is a real logjam for that third slot. Jose Reyes did not play enough games, while Michael Young, Stephen Drew and Jhonny Peralta are all right there.
Left Field
             AVG   OBP   SLG   wOBA
Braun       .305  .383  .564   .406
Ibanez      .309  .371  .576   .401
Holliday    .292  .387  .479   .386
Note: Matt Holliday edges Jason Bay and Adam Dunn because the latter two don't play any defense.
Center Field
             AVG   OBP   SLG   wOBA
Beltran     .314  .400  .523   .399
Hunter      .309  .371  .529   .388
Granderson  .266  .361  .486   .372
Notes: Due to his standout defense, Matt Kemp may deserve a slot on this list. No matter how you cut it, these three plus Kemp have really separated themselves.
Right Field
             AVG   OBP   SLG   wOBA
Hawpe       .315  .396  .560   .405
Choo        .306  .403  .508   .398
Ethier      .297  .381  .538   .390
Notes: There are a lot of good right fielders in baseball right now. There are a few more players who may have a justified claim to this list.
Designated Hitter
             AVG   OBP   SLG   wOBA
Thome       .253  .382  .517   .385
Huff        .305  .359  .529   .373
Lind        .306  .361  .501   .369
Note: There is a pretty underwhelming crop of DH's in MLB these days.
======
Starting Pitching
               IP     K/BB   ERA
1. Lincecum   231.1   4.10   2.61
2. Greinke    211.2   5.20   2.68
3. Halladay   233.2   5.91   2.50
4. Sabathia   247.2   3.64   2.58
5. Haren      220.1   6.19   2.98
Notes: I leave Johan Santana off because he lags these guys on his fielding independent numbers and has a high strand rate.
Relievers
             K/9    K/BB    ERA
1. Rivera   10.23  12.50    2.45
2. Broxton  13.13   3.89    2.50
3. Nathan   10.52   4.22    1.38
Notes: Look at Mariano Rivera's K/BB!
======
There's my All-365 team. What would yours look like? Who's going to make a strong push over the next 365 days and show up on this thing next July 1? A couple of Justins - Verlander and Upton - come to mind.
As we get set for what is shaping up to be one of the most exciting second halfs in a while, whether looking back or ahead, we definitely welcome your take in the comments section on where things stand at the 2009 midway mark.