Rich Lederer • Baseball Beat
Patrick Sullivan • Change-Up
Jeremy Greenhouse • Touching Bases
Dave Allen • F/X Visualizations
Sky Andrecheck • Behind the Scoreboard
Marc Hulet • Around the Minors
Al Doyle • Past Times
Retired Uniforms:
Bryan Smith • WTNY
Joe Sheehan • Command Post
Jeff Albert • The Batter's Eye
RSS Feed
Home
*Examining the Past, Present, and Future*
Lineup Card
Recent Entries
» Putting Together a Reality Team
» Historical Hall of Fame Vote Comparisons: 2012
» An All-Christmas Team
» The New-Look Angels
» John Denny: The Forgotten Cy Young Award Winner
» Money Isn't Everything
» What Would It Take to Hit .400 in the 21st Century?
» Halos Heaven
» Brandon McCarthy's Breakout Season
» Link-o-Rama
» Historical Hall of Fame Vote Comparisons: 2012
» An All-Christmas Team
» The New-Look Angels
» John Denny: The Forgotten Cy Young Award Winner
» Money Isn't Everything
» What Would It Take to Hit .400 in the 21st Century?
» Halos Heaven
» Brandon McCarthy's Breakout Season
» Link-o-Rama
Best of Baseball Beat
Abstracts From the Abstracts
1977 Baseball Abstract
1978 Baseball Abstract
1979 Baseball Abstract
1980 Baseball Abstract
1981 Baseball Abstract
1982 Baseball Abstract
1983 Baseball Abstract
1984 Baseball Abstract
1985 Baseball Abstract
1986 Baseball Abstract
1987 Baseball Abstract
1988 Baseball Abstract
1978 Baseball Abstract
1979 Baseball Abstract
1980 Baseball Abstract
1981 Baseball Abstract
1982 Baseball Abstract
1983 Baseball Abstract
1984 Baseball Abstract
1985 Baseball Abstract
1986 Baseball Abstract
1987 Baseball Abstract
1988 Baseball Abstract
Bert Blyleven Series
Meeting Up and Hanging Out with Bert
The Results Are In And...
Aficionado Heavily Invested in Blyleven
Latest on Blyleven's Chances for the HOF
The Internet Zealot Responds
400 Down and 5 to Go...
Bert Be Home By Eleven?
Blyleven's Forgotten Season (1973)
HeyMan, Your Comments Don't Hold Water
The Waiting is the Hardest Part
Another Addition to the Blyleven Series
Search for the Truth
As Dominant as His HOF Contemporaries
Listen, Buster
A Larger Step for Blyleven
Answering the Naysayers (Part Two)
Another Small Step for Blyleven
Q&A: Blyleven on the Twins
The Majority Rules, Right?
It's All Dutch to Some
The Hall of Fame Case for Bert Blyleven
Q&A: Blyleven on Felix Hernandez
Clemens Rocketing Up Charts
Poz: An Interview With a KC Star
A HOF Chat with Tracy Ringolsby
Up Close and Personal
A Peek Into the Mind of a HOF Voter
Answering the Naysayers
It's That Time of the Year (Again)
"If Cooperstown is Calling..."
The Bert Alert
One Small Step for Blyleven...
Only the Lonely
Exclusive Interviews
Lee Sinins
Alex Belth
David Pinto
Will Carroll
Mike Carminati
Aaron Gleeman
Joe Sheehan
Jay Jaffe
Jeff Peek
Tracy Ringolsby
Joe Posnanski
Bill James Part I, II, III
Jon Lalonde
Chuck Tiffany
Dayn Perry
Fay Vincent
Nate Silver
Alex Belth
David Pinto
Will Carroll
Mike Carminati
Aaron Gleeman
Joe Sheehan
Jay Jaffe
Jeff Peek
Tracy Ringolsby
Joe Posnanski
Bill James Part I, II, III
Jon Lalonde
Chuck Tiffany
Dayn Perry
Fay Vincent
Nate Silver
Bullpen
Rich Lederer
The Odd Couple (with Alex Belth)
The MostUnder Over Underrated Player in Baseball (with Brian Gunn)
Three Wise Men (roundtable by Alex Belth)
Infrequently Asked Questions (interview with Matt Welch)
Interview (Orioles Think Tank)
Bernie and the Yanks (Bronx Banter)
Hope and Faith: How the LAA Win the World Series (Baseball Prospectus)
NL West (The Soul of Baseball)
Greatest Living Hitter? (Sports Illustrated)
Roundtable: 2008 HOF Ballot (Armchair GM)
The Most
Three Wise Men (roundtable by Alex Belth)
Infrequently Asked Questions (interview with Matt Welch)
Interview (Orioles Think Tank)
Bernie and the Yanks (Bronx Banter)
Hope and Faith: How the LAA Win the World Series (Baseball Prospectus)
NL West (The Soul of Baseball)
Greatest Living Hitter? (Sports Illustrated)
Roundtable: 2008 HOF Ballot (Armchair GM)
Patrick Sullivan
Designated Hitters
David Bromberg (Q&A: John Denny)
Mark Armour (H. Killebrew and Versatility)
Joe Lederer (Soundtrack of a Prospect)
David Bromberg (Clemente's Autograph)
David Bromberg (Woody Fryman)
D. Baumstein (WAR Against Age: Pitchers)
Doug Baumstein (The WAR Against Age)
Doug Baumstein (A Lifetime on the Road)
John Fraser (Pick Six)
Mark Armour (How to Score More Runs?)
Bill Parker (What Opening Day Tells Us)
Stan Opdyke (Pat Rispole)
Chris Jaffe (Evaluating Baseball's Mgrs)
Stan Opdyke (Baseball Radio in NYC, 1953)
A. Nathan (Performance of Baseball Bats)
Michael Weddell (Edgar Martinez/HOF)
Jon Weisman (100 Things Dodgers Fans...)
Stan Opdyke (Connie Mack and Vin Scully)
Eric Walker (Evaluating Run Production)
Brent Mayne (The Intangibles of Catching)
Chris Moore (Best Fastballs in Baseball)
Dave Baldwin (The Batter’s Brain)
Shawn Haviland (Ivy League to MLB)
Larry Granillo (Walking Off)
Rob Iracane (Solo HR Won't Break You)
Tommy Bennett (Charm of AM Radio)
Harry Pavlidis (Johan Santana's Fast Start)
John Walsh (WAR and Remembrance)
Eric Walker (Precisely Inaccurate)
Bob Timmermann (As They See 'Em)
Geoff Young (Unicycles and Delusions)
Baseball Analysis at Tufts (Groundballers)
Baseball Analysis at Tufts (GB Out Rates)
G. Rybarczyk ('09 Hit Tracker Projections)
Joe Lederer (Curt Schilling/HoF)
Conor Gallagher (Hall of Fallacies)
Chris Green (Jim Rice, HoF, the Numbers)
Shawn Hoffman (Baseball's Bear Mkt?)
Paul Anthony (Manny Syndrome)
Ross Roley (World Series Odds)
B. Timmermann (Catcher's Interference)
R.J. Anderson (Waiting the Hardest Part)
Maury Brown (Cubs, MLB, and Cuban...)
Myron Logan (Dee-Fense, Dee-Fense)
Craig Calcaterra (Frivolity, Part I, Part II)
Chad Finn (Ode to Baseball Cards)
David Cameron (Mariners Foibles)
Chris Dial (Chipper Jones)
Pat Lederer (Memory Lane)
David Appelman (Clutch Pitching)
Bob Rittner (DH)
Jonathan Mayo (Roger Clemens)
Lisa Winston (My Son-in-Law...)
Russ McQueen (The Yellow Hammer)
Bob Rittner (I'm OK, You're OK)
Mark Armour (In Defense of the HOF)
Pat Jordan (Friends)
Dan Levitt (Analysis of Terry Ryan)
Doug Baumstein (Trading Econ 101)
Ross Roley (Runner's Reluctance II)
Ross Roley (Runner's Reluctance I)
Mark Armour (No-Longer Lovable Sox)
Bruce Regal (Stealthy and Wise)
Brian Gunn (Roid Monster)
Current/McEvoy (Value of the SB)
John Rickert (Sinister Thefts)
Nate Silver (Sabermetrics)
David Vincent (Home Run Production)
Joe P. Sheehan (Enhanced Gameday II)
Mark Armour (An Ode to Sport)
David Gassko (All-Time Worm Burners)
Joe P. Sheehan (Enhanced Gameday)
John Walsh (When Titans Clash)
Fox/Williams (Quantifying Coaches II)
Fox/Williams (Quantifying Coaches I)
Jacob Luft (Bull Durham Rant)
Chad Finn (Strat-O-Matic)
Lisa Winston (Rotisserie Baseball)
Dave Studeman (Baseball Stats)
Steve Treder (Roger Craig)
Marc Normandin (Jeff Bagwell)
D. Appelman (Expanding Strike Zone)
Jeff Sackmann (Worst MiL Defenders)
Jeff Sackmann (Best MiL Defenders)
Maxwell Kates (Van Lingle Mungo)
David Appelman (Pitch Location)
Kent Bonham (Danny Ray Herrera)
Glenn Stout (Two Baseball Poems)
Bruce Regal (The Challenge Round)
Mark Lamster (Barry & Ty)
Geoff Young (NL West)
Tom Lederer (The Ryan Express)
Brian Erts (Great Leap Forward)
David Pinto (Parity and the N.L.)
Jacob Luft (Fathers and Daughters)
Jamey Newberg (Pete's Sake)
Jeff Albert (A. Jones Swing Analysis)
Jeff Albert (A-Rod Swing Analysis)
Keith Law (Death, Taxes, and Waivers)
Peter Abraham (Tales of Torre Tales)
Larry Borowsky (Let 'er Rip II)
Dan Levitt (Empirical Analysis of Bunting)
Jonah Keri (If I Met Warren Cromartie...)
Bob Klapisch (War Stories)
Bob Timmermann (John F. Kennedy HS)
Kent Bonham (Aluminum Adjustments)
Al Doyle (More Than Superstars)
Ross Roley (Instant Replay)
David Vincent (Barry Bonds Homers)
Chad Finn (Our Favorite Obscurities)
Bill Deane (1979 NL MVP)
Mark Armour (Rise/Fall of Artificial Turf)
Jeff Angus (Wally Moon Camp)
David Berri (Money and Baseball)
Larry Borowsky (Baseball w/o the #s)
Derek Zumsteg (The Irrational Market)
David Regan (Free Agent Contracts)
Peter Schmuck (Steroids and the HOF)
David Appelman (Pitchers, Pitch by Pitch)
Dan Fox (Swinging, Taking, Fouling, Etc)
Patrick Sullivan (Study of NYY CF/BOS LF)
Will Leitch (Baseball Journalism)
Jeff Sullivan (Pitcher Release Points)
Steve Treder ('69-'70 Giants)
Maury Brown (Charlie Finley)
John Brattain (Bob Johnson)
Bob Klapisch (The Case for Bert Blyleven)
Jeff Peek (Pride and Prejudice)
Dayn Perry (Bert and Warren)
Rob Neyer (If Don Sutton Was Great...)
Lisa Winston (Minor League Memories)
Alex Belth (Otis Redding Was Right)
David Cameron (Long Live the King)
Jeff Angus (Baserunning Study)
Bert Blyleven (Baseball Playoffs)
Boyd Nation (Not a Prospect List)
James Click (Batters-Baserunners Study)
Jeff Shaw (Why I Love Baseball)
David Gassko (BIP/BFP Fielding Study)
Jay Jaffe (Milwaukee Sausage Race)
Jamey Newberg (Remember When)
Bob Klapisch (Press Box to the Mound)
Dan Levitt (Predictive Value of BB)
David Vincent (Official Scorer)
Jon Weisman (Rick Monday)
Larry Borowsky (Let 'er Rip)
Will Carroll (Fictional Short Story)
Bob Timmermann (Japanese Baseball)
Cyril Morong (Best Pitching Seasons)
Sean Forman (Monte Carlo Win-Loss)
Brian Gunn (My Little Blue Book)
Joe Lederer (My Dad and Baseball)
Bill Deane (Bob Gibson, 1968)
Mark Armour (1977 Yankees)
Darren Viola (Retrosheet)
David Pinto (RFK)
Dayn Perry (Brave Heart)
Matt Welch (Dave Hansen)
Kevin Kernan (Jack McKeon)
Tom Lederer (Dodgers Road Trip)
Steve Lombardi (Slider)
Studes (Picturing Baseball)
Mike Carminati (Luck of the Drawl)
Eric Neel (Vin Scully)
J.C. Bradbury (Leo Mazzone)
John Sickels (Bill James)
Search Baseball Analysts
Archives
By Category:
Around the Majors Content Only
Around the Minors Content Only
Baseball Beat Content Only
Baseball Beat/Change-Up Content Only
Baseball Beat/WTNY Content Only
Behind the Scoreboard Content Only
Change-Up Content Only
Change-Up/Around the Majors Content Only
Command Post Content Only
Crunching the Numbers Content Only
Designated Hitter Content Only
F/X Visualizations Content Only
Past Times Content Only
Saber Talk Content Only
The Batter's Eye Content Only
Touching Bases Content Only
Weekend Blog Content Only
WTNY Content Only
By Month:
February 2012
January 2012
December 2011
October 2011
September 2011
August 2011
July 2011
June 2011
May 2011
April 2011
March 2011
February 2011
January 2011
December 2010
November 2010
October 2010
September 2010
August 2010
July 2010
June 2010
May 2010
April 2010
March 2010
February 2010
January 2010
December 2009
November 2009
October 2009
September 2009
August 2009
July 2009
June 2009
May 2009
April 2009
March 2009
February 2009
January 2009
December 2008
November 2008
October 2008
September 2008
August 2008
July 2008
June 2008
May 2008
April 2008
March 2008
February 2008
January 2008
December 2007
November 2007
October 2007
September 2007
August 2007
July 2007
June 2007
May 2007
April 2007
March 2007
February 2007
January 2007
December 2006
November 2006
October 2006
September 2006
August 2006
July 2006
June 2006
May 2006
April 2006
March 2006
February 2006
January 2006
December 2005
November 2005
October 2005
September 2005
August 2005
July 2005
June 2005
May 2005
April 2005
March 2005
February 2005
January 2005
December 2004
November 2004
October 2004
September 2004
August 2004
July 2004
June 2004
May 2004
April 2004
March 2004
February 2004
January 2004
December 2003
November 2003
October 2003
September 2003
August 2003
July 2003
June 2003
Reference
Organizational Stats
Arizona Diamondbacks Bat / Pitch
Atlanta Braves Bat / Pitch
Baltimore Orioles Bat / Pitch
Boston Red Sox Bat / Pitch
Chicago Cubs Bat / Pitch
Chicago White Sox Bat / Pitch
Cincinnati Reds Bat / Pitch
Cleveland Indians Bat / Pitch
Colorado Rockies Bat / Pitch
Detroit Tigers Bat / Pitch
Florida Marlins Bat / Pitch
Houston Astros Bat / Pitch
Kansas City Royals Bat / Pitch
Los Angeles Angels Bat / Pitch
Los Angeles Dodgers Bat / Pitch
Milwaukee Brewers Bat / Pitch
Minnesota Twins Bat / Pitch
New York Mets Bat / Pitch
New York Yankees Bat / Pitch
Oakland Athletics Bat / Pitch
Philadelphia Phillies Bat / Pitch
Pittsburgh Pirates Bat / Pitch
St. Louis Cardinals Bat / Pitch
San Diego Padres Bat / Pitch
San Francisco Giants Bat / Pitch
Seattle Mariners Bat / Pitch
Tampa Bay Devil Rays Bat / Pitch
Texas Rangers Bat / Pitch
Toronto Blue Jays Bat / Pitch
Washington Nationals Bat / Pitch
All-Star Links
Official Websites
News and Notes
Baseball News Blog
Baseball Newstand
ESPN Baseball
Fox Sports Baseball
Pro Sports Daily
Roto World
The Roto Times
USA Today Baseball
Baseball Newstand
ESPN Baseball
Fox Sports Baseball
Pro Sports Daily
Roto World
The Roto Times
USA Today Baseball
Reference and Analysis
Baseball Almanac
Baseball America
Baseball Archive
Baseball Contracts
Baseball Cube
Baseball Graphs
Baseball Library
Baseball Musings Player Database
Baseball Page
Baseball Primer
Baseball Prospectus
Baseball Reference
Baseball Statistics
Baseball Truth
Boxscore Central
Diamond Mind Baseball
Doug's Stats
FanGraphs
Fast Balls (pitchfx catalog)
Hardball Dollars
Hardball Times
Hit Tracker
Retrosheet
Rotobase/Rotoblog
Stat Corner
STATS
Tango on Baseball
Yahoo Sports MLB
Web Gems
Bill James Primer
Sabermetric Manifesto (Grabiner)
Pitching and Defense (McCracken)
Pitching and Defense (Tippett)
Transactions Primer (Neyer)
Baseball Stats (Batter's Box)
Prospect Report (Cameron)
Pitcher Workloads (Sheehan)
Goodbye to Old Baseball Ideas (Rickey)
Sabermetric Manifesto (Grabiner)
Pitching and Defense (McCracken)
Pitching and Defense (Tippett)
Transactions Primer (Neyer)
Baseball Stats (Batter's Box)
Prospect Report (Cameron)
Pitcher Workloads (Sheehan)
Goodbye to Old Baseball Ideas (Rickey)
Columnists
Baseball Blogs
Around the Majors
Athletics Nation
Baseball Crank
Baseball Musings
Baseball-Reference Blog
Batter's Box
Big League Stew
Bronx Banter
Catfish Stew
Cub Town
Dan Agonistes
Dodger Thoughts
DRays Bay
Ducksnorts
Futility Infielder
Halos Heaven
Inside the Rockies
It Might Be Dangerous
Knuckle Curve
LoHud Yankees Blog
Lookout Landing
Management by Baseball
Metaforian
Metsgeek
Mike's Baseball Rants
Only Baseball Matters
Redbird Nation
Red Reporter
Sabernomics (Braves)
Seth Speaks
ShysterBall
6-4-2 (Angels/Dodgers)
The Book
TheCubdom
The Cutting Edge
The House That Dewey Built
The View From The Bleachers
Tiger Blog
U.S.S. Mariner
Viva El Birdos
Where's Kernan
Minor Leagues
Arizona Fall League
BA Player Finder
Cal Leaguers
Jamey Newberg
JDM's Scoresheet Baseball
Minor League Baseball
Minor League Park Factors
Minor League Splits
No Pepper
Sickels' Minor League Ball
Warm October Nights
BA Player Finder
Cal Leaguers
Jamey Newberg
JDM's Scoresheet Baseball
Minor League Baseball
Minor League Park Factors
Minor League Splits
No Pepper
Sickels' Minor League Ball
Warm October Nights
Amateur
Boyd's World (College)
Cape Cod Baseball League
College Baseball Blog
College Baseball Insider
Collegiate Baseball Newspaper
College Splits
College Splits Blog
Dirtbags Baseball (Long Beach State)
NCAA Baseball
NCBWA
Team One Baseball (High School)
Texas A&M & Baseball
Cape Cod Baseball League
College Baseball Blog
College Baseball Insider
Collegiate Baseball Newspaper
College Splits
College Splits Blog
Dirtbags Baseball (Long Beach State)
NCAA Baseball
NCBWA
Team One Baseball (High School)
Texas A&M & Baseball
Historical
Cuban Baseball
House of David
Jim "Mudcat" Grant's Web Page
Negro League Baseball Players Assoc
Negro Leagues Baseball Museum
1919 Black Sox
Pacific Coast League
Philadelphia Athletics Historical Society
Shoeless Joe Jackson Society
SABR-L Archives
Walter O'Malley
House of David
Jim "Mudcat" Grant's Web Page
Negro League Baseball Players Assoc
Negro Leagues Baseball Museum
1919 Black Sox
Pacific Coast League
Philadelphia Athletics Historical Society
Shoeless Joe Jackson Society
SABR-L Archives
Walter O'Malley
Miscellaneous
Forums
Credits
Ticket Center
Tickets to Baseball -
Premium Red Sox Tickets - Tickets to Marlins Games - Cardinals Game Tickets - NY Yankee Tickets - Tickets Oakland Athletics - Dallas Cowboys Tickets - Arizona Cardinals Tickets - Tickets Seattle Seahawks - Buffalo Bills Tickets Online - Tickets to Dolphins Football
Buy Boston Red Sox tickets,
Philadelphia Phillies tix,
NY Yankees tickets,
NY Mets tickets, and
MLB All Star game tickets at ABC tickets
Not sure where to find the best online sportsbooks? Start your search with PlayersJet.
Get deals at SportsMemorabilia.com on baseball apparel, including Phillies jerseys and more for adults and children.
Shop the largest selection baseball equipment on sale at Sports Unlimited. Check out tons of baseball gloves, youth baseball gloves and catchers gear from Rawlings, Wilson, Nike & Under Armour.
2011 Draft Order
Courtesy of Baseball America
First-Round:
 1. Pirates (57-105)
 2. Mariners (61-101)
 3. Diamondbacks (65-97)
 4. Orioles (66-96)
 5. Royals (67-95)
 6. Nationals (69-93)
 7. Diamondbacks (for B. Loux)
 8. Indians (69-93)
 9. Cubs (75-87)
10. Padres (for Karsten Whitson)
11. Astros (76-86)
12. Brewers (77-85)
13. Mets (79-83)
14. Marlins (80-82)
15. Brewers (for Dylan Covey)
16. Dodgers (80-82)
17. Angels (80-82)
18. Athletics (81-81)
19. Red Sox (from DET for Martinez)
20. Rockies (83-79)
21. Blue Jays (85-77)
22. Cardinals (86-76)
23. Nationals (from CWS for Dunn)
24. Rays (from BOS for Crawford)
25. Padres (90-72)
26. Red Sox (from TEX for Beltre)
27. Reds (91-71)
28. Braves (91-71)
29. Giants (92-70)
30. Twins (94-68)
31. Rays (from NYY for Soriano)
32. Rays (96-66)
33. Rangers (from PHI for Lee)
Supplemental First Round:
34. Nationals (Dunn)
35. Blue Jays (Downs)
36. Red Sox (Martinez)
37. Rangers (Lee)
38. Rays (Crawford)
39. Phillies (Werth)
40. Red Sox (Beltre)
41. Rays (Soriano)
42. Rays (Balfour)
43. Diamondbacks (LaRoche)
44. Mets (Feliciano)
45. Rockies (Dotel)
46. Blue Jays (Buck)
47. White Sox (Putz)
48. Padres (Garland)
49. Giants (Uribe)
50. Twins (Hudson)
51. Yankees (Vazquez)
52. Rays (Benoit)
53. Blue Jays (Olivo)
54. Padres (Torrealba)
55. Twins (Crain)
56. Rays (Choate)
57. Blue Jays (Gregg)
58. Padres (Correia)
59. Rays (Hawpe)
| Baseball Beat | November 30, 2010 |
What's a Free Agent Worth?
I have been troubled for a couple of years with the consensus belief in the sabermetric community that free agents are worth between four to five million dollars per Win Above Replacement (WAR). For the ESPN Stats and Info blog, Tom Tango of Inside the Book stated that "the value of a win on the free-agent market is between $4 million and $5 million dollars." In a recent New York Times piece, Sean Forman of Baseball-Reference.com wrote, "2009 free agents received nearly $4.5 million per win added." Led by Dave Cameron's input, Fangraphs has based its dollars per win value at approximately $4M for 2007, $4.5M for 2008 and 2009, and $4M for 2010.
I respect all three of these esteemed analysts. However, I believe there is a flaw in applying $4 million, $4.5 million, or $5 million to estimate the value of all free agents. To see if I could set the record straight, I began by using ESPN's Free Agent Tracker to create a database for the 2009-2010 crop. Of the 201 free agents last year, 121 signed MLB contracts, 66 inked MiLB deals, and 14 retired. For the purposes of my study, I excluded free agents who signed for less than $3 million per season. Most of these players were part-timers, backups, pinch hitters, or injured. In hindsight, the best of this lot included Alex Gonzalez, Kevin Gregg, Miguel Olivo, Kelly Johnson, John Buck, Jim Thome, and Jonny Gomes. In addition, I eliminated foreign players Aroldis Chapman, Noel Arguelles, and Ryota Igarashi, as well as Colby Lewis, who played in Japan in 2008 and 2009.
All in all, there were 53 free agents who qualified, a sampling that captured the most significant signees between the 2009 and 2010 seasons. The players in the table below are ranked by their total compensation. I also included the number of years, the average annual salary, the average Fangraphs WAR for the 2007-09 period, and the average annual dollars per WAR.
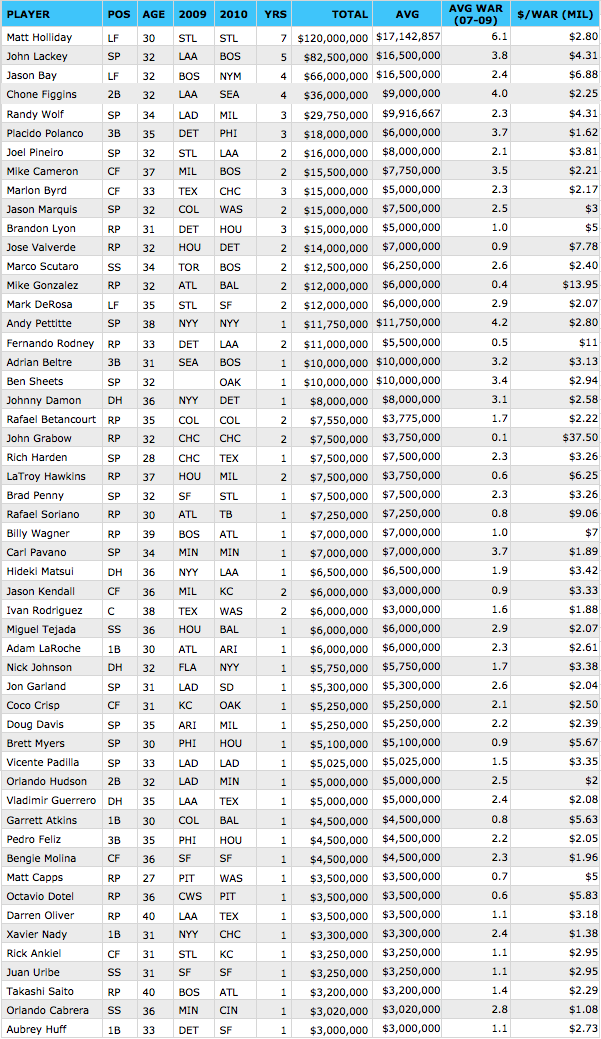
Let's take a look at Matt Holliday. He signed a seven-year contract with the St. Louis Cardinals for $120 million, equal to an average of $17.142 million per season. Holliday averaged 6.1 WAR during 2007-09. As a result, he was paid $2.80M per WAR.
Based on $/WAR, the major outliers were relievers John Grabow ($37.5M), Mike Gonzalez ($13.95M), Fernando Rodney ($11M), Rafael Soriano ($9.06M), Jose Valverde ($7.78M), and Billy Wagner ($7M), all of whom had a higher $/WAR than Jason Bay ($6.88M), the highest-paid position player based on the average WAR for 2007-09. It's pretty obvious to me that there is virtually no correlation between the salaries of relief pitchers (be it closers or setup men) and WAR. As a result, I believe it makes sense to exclude them when trying to determine what a free agent is worth. Nonetheless, I have calculated the arithmetic mean, weighted average, and median $/WAR including and excluding relief pitchers.
Here are my findings:
- The arithmetic mean $/WAR for all players was $4.36 million. Excluding relief pitchers, it was $2.88M.
- The weighted average $/WAR for all players was $3.03 million. Excluding relief pitchers, it was $2.73M.
- The median $/WAR for all players was $2.95 million. Excluding relief pitchers, it was $2.73-2.80M.
I realize this study is based on one year only. In addition, the salaries may have been negatively influenced by the overall economy. That said, no matter how you slice and dice it, excluding relief pitchers, the average free agent signed for about $2.7-$2.9M/WAR last offseason. I believe this finding is significant in that most analysts have routinely used $4.5M per win added.
Based on their performance in 2010, the biggest bargains from the list above were Marlon Byrd ($1.22M/WAR), Adrian Beltre ($1.41M), Orlando Hudson ($1.61M), and Placido Polanco ($1.62M). Beltre and Hudson are free agents once again. The biggest busts were Chone Figgins ($15M/WAR), Randy Wolf ($14.17M), and Jason Bay ($11.79M). Figgins and Bay have three years left on their contracts and Wolf has two years to go. Due to injuries, Mike Cameron (-0.3 WAR), Nick Johnson (0.1), and Rich Harden (-0.7) didn't pan out as their new employers expected.
Let's check out how this year's free agents are doing:
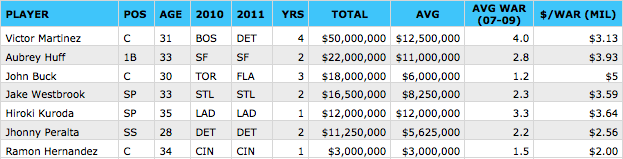
I excluded RP Joaquin Benoit and Jose Contreras from this table. For consistency, I also excluded Geoff Blum, who signed a two-year contract for $2.7 million (which was less than the $3M minimum I required for the 2009-2010 free agents).
With seven precincts reporting, the sample size is small. Nevertheless, the results are as follows:
- Excluding relief pitchers, the arithmetic mean $/WAR was $3.41 million.
- Excluding relief pitchers, the weighted average $/WAR was $3.37 million.
- Excluding relief pitchers, the median $/WAR was $3.59 million.
While it may be too early to get a definitive read for this year's class, excluding relief pitchers, the average free agent has signed for about $3.4-$3.6M/WAR this offseason.
There are several big-name players who haven't signed yet. The crop is headlined by Cliff Lee (6.97 average WAR from 2008-2010), Carl Crawford (5.0), Jayson Werth (5.0), Beltre (4.53), and Derek Jeter (4.43). Rounding up last year's $/WAR to $3M and using the mid-point of $3.5M/WAR this year produces the following average annual salaries: Lee ($20.9M-$24.4M), Crawford and Werth ($15M-$17.5M), Beltre ($13.6M-$15.9M), and Jeter ($13.3M-$15.5M). Unless the Yankees cave in to their captain, I would be surprised if any of these players sign for an average annual salary outside of these ranges. If so, it would help confirm my belief that free agents (sans relievers) are worth about $3M-$3.5M per WAR rather than the $4.5M that seems to be universally accepted.
Of note, one can reach slightly different conclusions by using Baseball-Reference WAR instead of Fangraphs WAR. I'm not necessarily more partial to one over the other. One can also weight the WAR differently. I used a simple average of the past three years, tweaking a few players based on injuries and playing time. There might be merits in going with a weighted system, such as a 3-2-1, in certain situations. In reality, teams are trying to project WAR but most estimates are going to be heavily influenced by observed WAR.
Furthermore, there are many other factors that teams consider when making offers to free agents, including a player's age, his position, current health status and history of injuries, the consistency and arc of his career, the supply and demand for that type of player, the length of contract, and whether he is a Type A or B free agent. Put it all together and shake it up, and it is my contention that the going rate for starting pitchers and position players who are free agents is somewhere in the range of $3,000,000 to $3,500,000 per the three-year trailing average WAR.
| Touching Bases | November 26, 2010 |
The Decade in Basic Fielding: Adjustments
Last week, I looked at the decade's leaders in plays made per ball in play. Now, I'll take a look at the context in which they played.
This might not qualify as basic anymore, given the intensive amount of computation time that goes into these adjustments, but I do find them intuitive. I attempted to replicate the "without" part of Tom Tango's "With or Without You" system by finding how many plays the average fielder would have made given a specific fielder's set of circumstances. That entails deciding on a situation to control for, finding how often a fielder was in that situation, and calculating the rate of plays other fielders made in that situation. For example, third basemen are twice as likely to record an out on a ball in play if the batter is right-handed as opposed to left-handed. Therefore, if Eric Chavez faced right-handed batters 60% of the time this decade, while the league normally faces 58%, then we would need to take away a couple dozen plays made by Chavez to adjust for his advantage.
Below, I present the chart for batter handedness adjustments. The adjustment figure is the number of plays you would need to add to or subtract from each fielder's plays made due to context. The adjusted rate incorporates that adjustment.
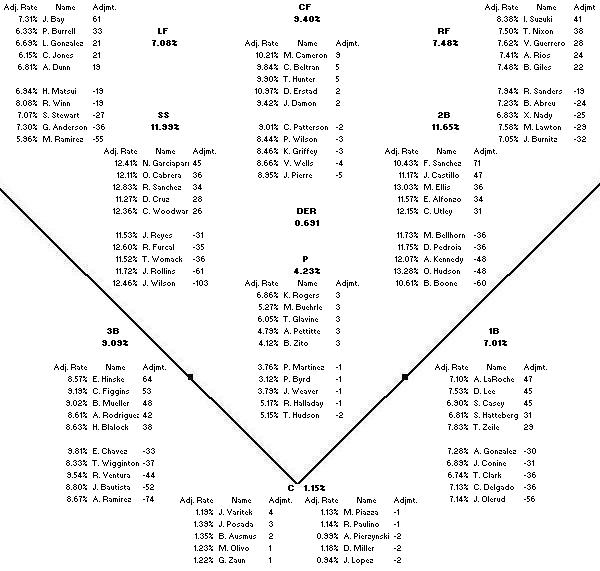
A batter handedness adjustment doesn't make much of a difference for catchers, pitchers, or center fielders, but for players in the corners, it can be huge.
Last week, I found that Freddy Sanchez had the lowest rate of plays made at 2b, and Jack Wilson the highest at SS, and here we see that the Pirates must have faced a ridiculous number of RHBs.
The number of left-handed hitters the Yankees roll out could impact the numbers, as Nomar Garciaparra and Bill Mueller earn large adjustments, while Manny Ramirez comes out even worse than before.
Feel free to click on the links below to see similar charts to the one above.
Pitcher handedness adjustments correlate with batter handedness adjustments. It seems to me, however, that batter handedness adjustments are way more useful in measuring fielding.
Those are easy to calculate and to comprehend. he next several are trickier. Calculating park adjustments when some players play every single day limits the "without" part of the sample. Here, take a look.
Let's use, you guessed it, Derek Jeter and the Yankees as our starting point. Both Yankee stadiums have seemingly played exceedingly difficult for shortstops. Shortstops make plays in the Bronx on under 11% of balls in play, and the average is 12%. You might be thinking that Jeter drags down the average, but remember, I controlled for this by finding the rate of plays made when he wasn't on the field. You might also be thinking that the Yankees wide array of left-handed hitters drag down the average. That, I didn't account for. So it's tough to say what can be attributed to the ballpark. Maybe the grass is shorter or greener or something. Or maybe the Yankees play with poor fielding shortstops and hit with players who don't hit to that side of the field. The same could be said for Jimmy Rollins, who has dominated the shortstop position for the Phillies over the last decade, and his own lineup is also dominated by left-handed hitters. I think it would be too hard and probably not worthwhile to try to determine ballpark adjustments for infielders.
The conclusion that I think can be drawn from these ballpark adjustments is that Coors Field kills outfielders.
I think there's some good stuff in there.
Jimmy Rollins and Orlando Cabrera have played in front of stingy pitchers, whereas Miguel Tejada and Rafael Furcal have benefited from pitcher generosity. Chipper Jones as both a left fielder and third baseman moves close to average when you control for the pitchers he's had to deal with.
Rollins, playing behind pitchers who were unfriendly, fielded in front of hitters who helped him out a fair deal.
These next two will be heavily biased, but I thought they might be interesting.
There are a lot of conflating factors here, as first basemen and center fielders might play every day with their teammates, killing the "without" sample, and they share a ballpark every day, bringing in other effects.
Anyway, I wasn't surprised to see that Chase Utley and Jimmy Rollins might have made more plays with a different first baseman.
With center fielders, I was looking for evidence of ball-hogging, but don't think I found any.
This is the only time I'm not using the entire 2000-2009 dataset, as a significant portion of balls were not classified. Most, if not all, unclassified balls went for hits, so the adjusted rates are all higher than the league average rates.
Three of the top five pitcher adjustments go to guys who played for the Braves, which means they generated a lot of ground balls. This results in the Joneses getting underappreciated as outfielders, especially Andruw, who I showed last week was one of the best at catching balls in the air, and now we see that he had hundreds of fewer opportunities than he would have playing for another team.
The information used here was obtained free of charge from and is copyrighted by Retrosheet. Interested parties may contact Retrosheet at 20 Sunset Rd., Newark, DE 19711.
| Touching Bases | November 18, 2010 |
The Decade in Basic Fielding: Leaderboards
The Gold Gloves were announced last week, and I know what you're thinking; if only there was another metric to evaluate fielders. Well, sorry to disappoint, but I don't have it in me to come up with an original acronym. Anyway, there was this really interesting thread on The Book Blog in which Tangotiger posted a simple yet powerful leaderboard consisting of outs made per ball in play for all active shortstops. Derek Jeter came in last. Spanning the entire 2000-2009 timeframe, one would have to have faced extraordinary luck to not deserve one's place at the very top or bottom of such a basic leaderboard. There's really no arguing with it. (If you want to argue, Colin Wyers went in depth on the subject at Baseball Prospectus.)
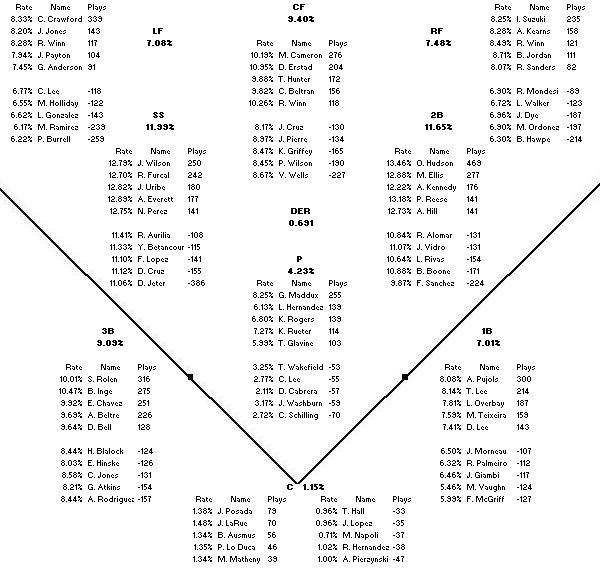
I found every fielder's out-per-ball-in-play rates as well as the average conversion rates at each position. Nothing special. No handedness or batted-ball adjustments, no plays-to-runs conversion. Below, I present the top five and bottom five at each position sorted by total plays above and below average.
Going from one to nine:
Greg Maddux was probably something like three standard deviations from the Major League mean with his pitching ability. That pales in comparison to his fielding prowess. He turned balls in play into outs as often as Carl Crawford and Ichiro Suzuki. Daniel Cabrera did not do a single thing well on the baseball field other than throw hard.
I've always said that Yankee fans should give Jorge Posada more credit for his fielding. Wait, that's not right. Maybe I mean Brett Gardner. Seeing Posada top a defensive leaderboard is throwing me off.
Albert Pujols: good at baseball.
Orlando Hudson is over 100 plays better than the next closest fielder at any position. You might say he's the basic man's Adam Everett. Freddy Sanchez rates as well as Hudson in several advanced fielding metrics. Considering Jack Wilson played counter Sanchez for many years, there could be a large ball-hogging effect going on.
There has been no ball-hogging effect on the left side of the Yankee infield. A-Rod finishes last for third basemen, and of course Jeter lags all shortstops.
I wonder why Carl Crawford never picked up center field, considering his greatness in left. I've noticed that Garret Anderson is often called underrated by television announcers, given his ability to rack up hits. When I learned about secondary offensive skills, I decided then he was overrated. Then I saw his fielding numbers, and it turns out he's pretty good in left. Maybe he's been rated properly all along.
Darin Erstad had a run where he was something like a true +30-run center fielder. The astute reader will notice a similarity between the LF and CF leaderboards. Foreshadowing.
Yes, Randy Winn appears in the top five of all three outfield positions. Also, Brad Hawpe: bad at fielding.
I made a bunch more leaderboards by varying the data I used as opposed to adjusting the original dataset, which I will do next week. For example, I restricted my sample to only RHBs or only LHBs.
If you click on the links, you will see an image similar to the one I used in this article. Different data, same methodology. I don't expect anyone to click on more than a couple, so I will provide brief commentary.
Batters pull grounders and go the other way on fly balls. This results in shortstops making fewer outs against left-handed batters than second basemen, first basemen, left fielders, or center fielders. At some point, it must be optimal for fielders to switch positions depending on the batter's tendencies. I'm sure once that started to happen, a rule would be put in place to deter such delays.
Mariano Rivera turned 10.55% of balls in play into outs himself when facing LHBs. Maddux was 7.52%, the league average was 4.36%, and Cabrera came in at 1.76%. That 10.55% mark can explain a fair amount of Rivera's extraordinary .263 career BABIP. He's a gifted athlete who is said to play a quality defensive center field. Plus jamming LHBs with his cutter can result in easy bouncers right back to the mound.
I don't know if any advanced fielding metrics control for pitcher handedness, but I'd imagine any adjustments made would be negligible.
Jeter has been very good at catching balls in the air in his career, but that only highlights his inability to field grounders. At least he might be better than Yuniesky Betancourt. A-Rod showed up in the top five among shortstops on air ball plays, but bottom five among shortstops and third basemen on grounders. Robin Ventura blew away the third base field by converting over 20% of grounders into outs. Damion Easley was first on grounders and close to last on balls in the air. Jason Varitek was last on grounders and first on popups.
Ichiro has forced out four players on ground balls.
There's a massive range for pitchers in how often they field their own bunts. Javier Vazquez and Carlos Zambrano control 50% of bunts themselves, while Jon Lieber and Ben Sheets make outs on under 25%.
Overall defensive efficiency is ten points higher with two outs than it is otherwise. I don't know if it follows that their should be a fielding adjustment.
DERs at Coors and Fenway were .665 and .676, respectively. Brad Hawpe and Manny Ramirez were both 80 plays below average in their respective parks. It's tough to say if Jason Bay played good defense in Fenway or if Manny's insane awfulness made it appear that way. I've been under the impression that J.D. Drew is a really good defensive outfielder, yet he's made only 6.6% of plays in Fenway's oddly-shaped right field, while most RFs turn around 7.5% of balls into outs. Maybe there's a Coco Crisp ball-hog effect?
Juan Pierre showed up on the bottom five overall list for center fielders, but he played in an impossibly difficult Coors Field, and actually did well there.
Next week I'll take a look at basic fielding adjustments.
The information used here was obtained free of charge from and is copyrighted by Retrosheet. Interested parties may contact Retrosheet at 20 Sunset Rd., Newark, DE 19711. 2010 data is out!
| Change-Up | November 16, 2010 |
Japanese Pitchers & the Hot Stove
I had been planning a write-up of the Japanese pitchers currently in Major League Baseball who could change uniforms this off-season but one of those players won’t be changing teams. Hiroki Kuroda will return to the Los Angeles Dodgers thanks to a 1-year, $12 million deal that was announced last night.
Kuroda’s numbers might not leap off the page but he pounds the strike zone and, when healthy, is a legitimate number 2 or 3 in a championship caliber rotation. There are 87 starting pitchers who have tossed 400 innings since 2008. Among them, Kuroda ranks 20th with a 3.18 K/BB ratio and also sports the 11th lowest BB/9.
That still leaves a number of Japanese pitchers who could impact the 2011 Hot Stove in a significant way. There’s Kenshin Kawakami, whose $6.67 million price tag is one the Braves are reportedly looking to shed. They may have a taker back in Japan, but Kawakami may be worth a look for teams here in the States. His ground ball rates are well below average, so the best fit would be on a team with superb outfield defense and deep pockets. Maybe the Yanks think about it and save themselves a Dustin Moseley start or five. Kawakami’s no superstar but he could make for nice rotation depth, particularly if the Braves would be willing to pick up a little of his salary.
With Kuroda now locked up, that leaves two compelling free agent options, Koji Uehara and Hisanori Takahashi. Here are their respective MLB numbers to date, Uehara with the Baltimore Orioles and Takahashi with the New York Mets:
| IP | GS | K/9 | BB/9 | K/BB | |
|---|---|---|---|---|---|
| Takahashi | 122.0 | 12 | 8.41 | 3.17 | 2.65 |
| Uehara | 110.2 | 12 (0 in '10) | 8.38 | 1.38 | 6.06 |
Takahashi had an excellent first season, and is now looking for a 3-year deal. He won’t come cheaply to whichever team inks him. Uehara, on the other hand, is the better pitcher and likely to cost a lot less. The risk lies in Uehara’s health but if a team can get comfortable with his medicals, he could offer big-time returns.
Finally, there are two Red Sox I would not be surprised to see suiting up elsewhere in 2011. Daisuke Matsuzaka can be frustrating, but he’s a perfectly fine turn-taker for any rotation. Matsuzaka has a career 5.52 ERA against the Yankees and a 5.09 figure against the Rays. For his career in Inter-League action, his ERA is 3.97. It makes sense beyond the simple quality-of-opposition adjustment, too. Matsuzaka walks too many batters and often cannot last long into games. The National League mitigates this weakness for a couple of reasons. First, facing a pitcher means less nibbling, which means fewer pitches, fewer walks, and the potential to last longer. Second, the strategic imperative in the Senior Circuit, regardless of how the pitcher is performing, is sometimes to pull the pitcher for a pinch hitter in a middle-innings high leverage run scoring opportunity. I really think Matsuzaka could thrive in the NL.
There’s also Hideki Okajima. Like Dice-K, he’s played an integral role in Boston’s run of success over the last four seasons. But despite a second half rebound last season, the long-term trend on Okajima is ugly. He’s been regressing pretty steadily. I imagine scouts could offer more insight as to why that might be the case, but it’s my belief that hitters have simply caught on. He has a unique delivery that was deceptive for a few seasons, but now hitters have a beat on him. He’s arbitration-eligible and will likely be due somewhere in the neighborhood of $3 million for the 2011 campaign. Boston has not yet decided if they would like to tender Okajima or not.
There’s no shortage of compelling story-lines this Hot Stove season. Jayson Werth and Carl Crawford will be huge-impact players, and the Cliff Lee sweepstakes are already underway in earnest. But it looks like Japanese pitchers in new roles on new teams could also influence the 2011 season, something to look out for in the coming weeks and months.
| Touching Bases | November 11, 2010 |
Thoughts on the AL Cy Young
I don't much mind groupthink so long as I'm part of the group. Well, then I don't really consider it groupthink, do I? Just a bunch of people being right. And I like being right.
So when Baseball Prospectus released its Internet Baseball Awards, I was confused. Felix Hernandez won the greatest consensus of any category. My pick for AL Cy Young was Cliff Lee. Either I'd badly miscalculated, or people have been converging on an opinion that could well be wrong.
Now, I'm not saying people are wrong. (Of course I do think they're wrong. I chose Cliff Lee.) It's just that there's no way Felix was so dominant that he deserves 80% of the vote. Lee and Price and Liriano and Lester and Weaver and Sabathia were all fantastic. So what makes Felix stand out?
Felix led the league in both innings pitched and ERA. I'm not really sure that I care about innings or ERA, though. Hold on. I obviously do care about innings pitched and ERA. But I see the numbers and I just think wouldn't it be nice if some smart people converted those numbers into a total value metric? Fortunately, the good folks at Baseball Reference, FanGraphs, and StatCorner have taken it upon themselves to provide us with WAR. Felix tops the AL on B-Ref, while Cliff Lee leads the Majors in WAR according to FanGraphs and StatCorner.
The difference between the methodologies is that Baseball Reference relies on ERA, whereas the others use defense-independent metrics. And why did Felix have such a superior ERA compared to Lee's all-time great strikeout-to-walk ratio?
Cliff Lee suffered a .347 BABIP with men on base while Felix Hernandez held opponents to a .239 mark.
It's easy to attribute ball-in-play results and event sequencing to luck, but if I were to do that I wouldn't have much else to write about. Therefore I looked into Lee's and Felix's pitching approaches with men on base and nobody on.
Felix's first full season was 2006, when he allowed a .357 BABIP with men on base. Since then, he has lowered his BABIP by at least 24 points in each successive year. If you believe in such trend analysis, then this would be evidence that Felix is doing something right with men on. Cliff Lee, in the two years since his reinvention, has allowed .306 and .264 BABIPs in man-on situations, indicating this year could have been nothing more than a fluke.
Most pitchers throw somewhat softer with men on base than with nobody on. Pitching from the stretch can lead to diminished velocity. Trying to induce groundballs means sacrificing velocity for movement. Justin Verlander is one guy who pitches with another gear at times. I found that he adds over a mile per hour to his fastball with men on, while previously it was shown that he adds velocity in high leverage spots and with higher pitch counts. On the other hand, Stephen Strasburg not only went to his two-seamer more often with men on base, but he also suffers pitching from the stretch.
Both Felix and Lee throw slightly harder with men on base, and both also significantly up their groundball rates. Lee throws more cutters with men on while Felix throws more tailing fastballs. The thing is, they've kept rather constant approaches from 2009-2010. Considering that Lee has better DIPS numbers with men on than does Felix, I fail to see evidence that Felix deserves credit for achieving better results than Lee. Felix added a full win in Clutch value this year. Lee lost a win. I don't think either deserved their respective fortunes.
I've looked at the numbers for quite a while, and I'm not all too confident with my pick. But I don't see how everyone else can be that confident with theirs. The competition was really really tight. I think Felix winning the AL Cy would mark a sign of progress for sabermetric thought. Felix winning by a landslide could mark a step backwards.
| Touching Bases | November 08, 2010 |
Batted Ball Location Leaderboards
There has been a distinct void in batted ball leaderboards this year, as Dave Studeman has been saving up all the good stuff for this year's THT Annual. (Buy it!) This is the third and final year I'll be writing my tangential column, and now you can find the relevant data yourself in FanGraphs' player splits section. Without further ado, here are the best and worst pull hitters of 2010. I have a feeling who will be number one.
Value of Pulled Batted Balls
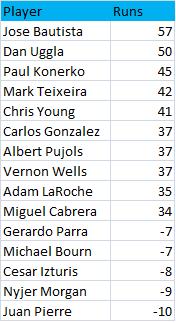
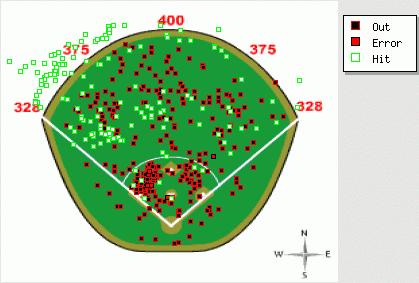
The past couple of years, I've had an idea who would be the top pull hitter. Some hitters like Ryan Howard, Jim Thome, Adrian Gonzalez, and Derek Jeter are renowned for their opposite-field prowess. But this year, Jose Bautista's batted ball distribution made the mainstream, getting written up in Sports Illustrated, USA Today, and ESPN. His 57-run mark is the highest I've ever seen, and his 47 pulled homers are the fourth most in the Retrosheet era. The requisite spray chart:
There was definitely something about the Blue Jays approach this year as a team. They led the league in home runs with 257, 46 more than any other team. They hit fewer line drives but more fly balls than anyone. Their 13.6 home run per fly ball rate was also tops, and way higher than last year's 10.4% mark. Bautista added ten percentage points to both his fly ball rates and home run per fly ball rates. Less noise was made over Vernon Wells, who somehow went from 0 WAR to 4 WAR, also posting a career-high number of pulled homers.
Dan Uggla, aided by Florida's short left-field fences, has added at least 30 pulled runs of value in every year of his career. Albert Pujols is the only player to appear in the top ten each of the last three years.
Juan Pierre appeared at the plate 734 times this year. Is that not dumbfounding? He is a really good baserunner, I suppose.
Value of Center Field Batted Balls
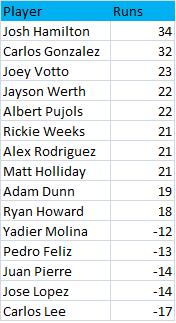
Josh Hamilton hit 19 homers out to center, which is impressive. But I'm more interested to know about the ground rules concerning that lawn out there in straightaway center in the Ballpark at Arlington. Is it like the black at the old Yankee Stadium?
Good things happened when Hamilton, Carlos Gonzalez, and Joey Votto got the bat on the ball, as they boasted respective BABIPs of .384 and .390 and .361. Gonzalez and Votto have the 22nd and 23rd highest BABIPs of all-time. Only Shin-Soo Choo, Ichiro Suzuki, and Derek Jeter have higher BABIPs among active players, and I wouldn't be surprised to see CarGo or Votto pass all three of them.
Carlos Lee hit more balls to center field this year than he did last but wound up with 23 fewer hits
Value of Opposite Field Batted Balls
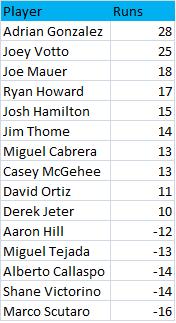
The pull list is dominated by right-handed hitters while the opposite-field list is dominated by left-handed hitters, which suggest there is value to hitting the ball to left field. The BABIP on balls to left is about 40 points higher than on balls to right.
It's crazy that Adrian Gonzalez does this damage in PETCO. As a Padre he's hit only a third of his home runs at home. He'd make a lot of sense on the Marlins or Red Sox.
Votto did it. He ended the year without a single popup. He hits the ball with power to all fields. His worst results came from pulling the ball, and when he did so he still added 16 runs thanks to a 47.6% HR/FB.
Jim Thome slugged .125 on grounders and 1.405 on balls he put in the air. On first thought, I thought that might be something to exploit, but interestingly, according to Baseball Reference, he has the exact same career .958 OPS facing groundball pitchers and flyball pitchers.
Aaron Hill had a .196 BABIP, so unless he was pulling the ball in the air, it wasn't happening for him.
Remember, you can now find all of this stuff on FanGraphs. My hope is that soon we'll be able to take the next step and analyze these numbers using HITf/x.
| F/X Visualizations | November 05, 2010 |
Tim Lincecum's New Slider
First off congratulations to the Giants on their first World Series title since moving to San Francisco, and first title in 56 years. They played very good baseball since September 1st in order to pass the Padres to get into the playoffs, and then beat the Braves, Phillies and Rangers once they got there. One of the keys was, of course, very good pitching from their two top pitchers, Matt Cain and Tim Lincecum. I wrote about Matt Cain throwing lots of change ups over at FanGraphs, and interestingly Tim Lincecum has also drastically changed his pitch usage in the past couple months.
Lincecum's pitch usage shift went more noticed in the media, with reports that he had changed the grip on his slider and was throwing it more. Classifying Lincecum's pitches from the pitchf/x data is not as easy as some other pitchers from; particularly troublesome is differentiating his slider and his change up. Here is one example game where you can see how closely they cluster. I think the best way to tell the pitches apart is to look at the spin direction and speed of each pitch. Here is a polar plot comparing these two values with the different pitch types color coded.
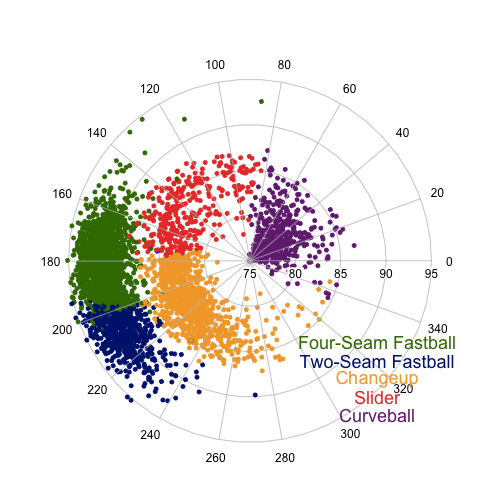
His sliders and change ups are still very close together, but you can vaguely see that they constitute two separate 'blobs'. The exact breakpoint might be a little arbitrary, but I am fairly comfortable with the classification.
At least one report claimed that Lincecum changed his grip on September 12th, so I wanted to see whether his slider was any different since then. Here I plot the spin and speed of his slider, this time on a rectangular, non-polar plot. Sliders since September 12th are circled.
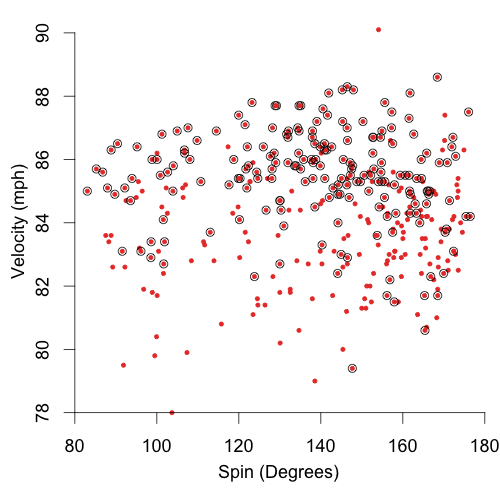
It is very clear that those since Sept 12 are not just a random sample of his sliders. Since then his sliders have been noticeably faster, about 3mph. His other pitches -- fastballs, change ups and curves -- are only about 0.2 mph faster in since then. So it does look like the new grip has resulted in a new, faster slider. Since that date he has also thrown the slider much more often. Here are the fraction of his pitches that are sliders and curves by start (his change up and fastball fraction are much more consistent).
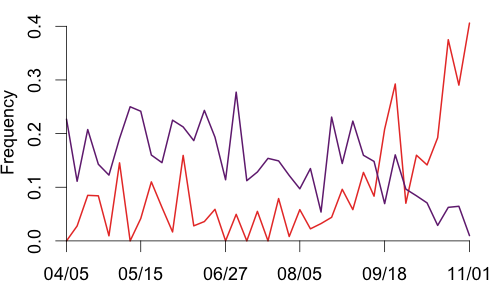
You can see the increase beginning in early September and continuing through to the end of the season, with a resultant drop in curves. In fact on the final game of the season, Game Five of the World Series, 41 of Lincecum's 101 pitches were sliders (with just one curveball). Those 41 pitches induced 23 with an amazing 13 misses. The 10 contacted sliders resulted in five fouls, three outs, a single and the Nelson Cruz home run. He also got six called strikes.
In Lincecum's two Cy Young years, 2008 and 2009, he complemented his great fastball with a with a mix of about 15% curves and 20% change ups and under 5% sliders. Up until September of this year his pitch selection was similar. But since early September he has embraced his slider and thrown it often (18% of the time). That culminated in the last game of the season when he threw it 40% of the time. It will be interesting to see how he decides to pitch next year having established multiple excellent secondary pitches.
| Touching Bases | November 04, 2010 |
| Change-Up | November 03, 2010 |
The 2011 San Francisco Giants Lineup
The San Francisco Giants just won the World Series. They wear gorgeous uniforms, and they play in a world-class city performing in front of a rabid fanbase who jam one of the best ballparks in the world to watch their team. Whatever the lackluster television ratings might say, I think it was a great post-season for Major League Baseball. The Giants won and and the Dallas baseball market had a chance to experience World Series baseball as well. That's two big markets that the game can count on for years to come.
I offer that preface because I don't want to come off as though I am not allowing the Giants their moment. Really, I couldn't be happier for them. I've been digging into their roster over at B-Ref and Fangraphs and I think it's a fascinating mix of players. But what I am also finding is that there's a lot of work to do in order to put together anything resembling a championship-caliber lineup together for 2011, even when you factor their remarkable pitching. Jeff Fletcher addressed the topic at Fanhouse yesterday, and ends his column this way:
So you can expect next year's Giants to look a lot like this year's, with good young pitching and a patchwork lineup.Worked this year.
"If these (pitchers) stay healthy, they have a chance to do a lot of good things," Huff said. "Get some guys that pop the ball out, and that's all you need. Two or three runs is all you need."
Let's start with this year's lineup. Four - FOUR - players had a wOBA of over .330 who had 100 or more plate appearances.
Player       PA      wOBA
A. Huff      668     .388
P. Burrell   341     .371
B. Posey     443     .368
A. Torres    570     .363
Cody Ross came over from the Marlins and posted a .352 wOBA in 82 plate appearances, too. But that's it. For frame of reference, the lowly Houston Astros had five guys better the .330 mark. The Cincinnati Reds had ten. You get the picture.
For much of the season, the Giants were hanging on by a thread. On August 30th, they trailed the San Diego Padres by 5 games and were on the outside looking in for the Wild Card race, too. They finished the year on a tear, going 18-8 over the last month and clinching a post-season berth on the season's final day. Here is where the offense came from over that stretch:
Player       PA      OPS
C. Ross      65     .886
P. Burrell   94     .870
F. Sanchez   98     .840
A. Huff      121    .834
B. Posey     115    .818
J. Uribe     100    .800
"Smoke and mirrors" does a disservice to a team whose pitching dominates the way San Francisco's can and whose General Manager papered over his own roster blunders with mid-season fixes. Ross and Burrell paced the Giants playoff push, and then Ross was terrific into the post-season, too. It's important to ask what's sustainable and what's not. So, what about next year?
Huff is a free agent, but Fletcher seems to think he'll be back.
Look for them to re-sign Huff to at least a two-year deal, worth around $8 to $10 million a year.
That's fine, but it's not hard to see how such a move could go wrong. He's one season removed from .241/.310/.384 and turns 34 in December. I'd liken re-upping Huff now to the Red Sox re-signing Mike Lowell after his standout 2007, which Lowell capped by winning the World Series MVP. Great clubhouse guy, veteran, winning reputation, aging, solid performance track record. Plenty of people might feel good about a Huff extension because of all the goodwill generated in 2010, but that doesn't mean it will work out.
As for Burrell, he's gone. Uribe is unrestricted, too, and if I were Brian Sabean, he'd be getting a much longer look than Huff. Uribe's fielding versatility and sneaky pop make make him the type of player good teams should always try and carry, even if there won't be 650 plate appearances for him. Like Huff, Uribe will have his suitors but if you're going to overpay, do so for the younger middle infielder. The market is awful for middle infield types, anyway, and the Giants will have a gaping hole at shortstop since they're unlikely to pick up World Series MVP Edgar Renteria's option.
So let's say Uribe is back. Here is what we have:
C - Posey
1B - Open
2B - Sanchez
3B - Sandoval
SS - Uribe
OF - Ross
OF - Torres
OF - Rowand
That's still a lineup screaming for an impact bat. After all, even with Huff's career year, the Giants still were a below average offense. Posey could improve, I would expect some bounce-back from Sandoval and a full season of Ross's bat should help, but other than that, it's hard to see where the Giants might get increased production over and above 2010 without Huff's monster year mixed in.
There are a few necessary moves here. First, that's not a viable outfield at all. Thankfully, Ruben Amaro is reported rumored to be feeling sentimental for Rowand so the Giants could move him. It won't solve any money issues since the Giants would have to pick up a lot of his tab, but it frees up roster space and an outfield slot. I think the Giants would be nuts not to hop in the mix for one of Carl Crawford or Jayson Werth. Sure you'd have to pay up, but if you're not going to invest now, then when? The rotation is cost-controlled and as deep as can be. Both players field excellently, an added bonus in spacious AT&T Park. Finally, the team should be flush coming off the World Series win. A payroll bump has to be in the cards. It seems like too good a fit not to consider. Werth or Crawford paired with Posey could form an excellent offensive core for years to come, supporting a truly outstanding group of pitchers.
At first base, another position they'll need to address if Huff walks, I might opt for another buy-low guy like the Giants netted with Huff in 2010. Carlos Pena looks as good as any other there, but Derrek Lee could be an attractive short-term option, too.
I don't think that Brian Sabean should feel satisfied with his "patchwork" offense. It worked but he got lucky, like all World Series winning teams do, and should recognize as much by taking a big swing for 2011. He oversees one of the great franchises in the game, one that should be a choice destination for stars like Werth and Crawford given the atmosphere we've all just witnessed.
Strike while the iron's hot, Sabes.
| Baseball Beat | November 02, 2010 |
The Morning After
Congratulations to the San Francisco Giants on winning the 2010 World Series. The team won the NL West by two games and then sailed through the postseason by winning 11 of 15 games in capturing the NLDS, NLCS, and World Series titles.
I have to admit, I never saw it coming. Not before the season. Nor during the season. Nor before the World Series. While I picked the Giants to beat the Atlanta Braves in the NLDS, I thought San Francisco would fall to the Philadelphia Phillies in the NLCS and to the Texas Rangers in the World Series. Rather than the Giants winning it in five, I had the Rangers winning in five. On second thought, maybe I got it half right. Just kidding.
Where did I go wrong? Let me count the ways:
1. Small sample size. (Rule No. 1 of forecasting: When you make a mistake, blame the sample size.)
2. Three games in the NLCS were decided by one run. The Giants won all three.
3. The Phillies outscored the Giants, 20-19, but won only two of the six games.
3. I had no idea that the Phillies would "hit" .216/.314/.321 in the NLCS.
4. I didn't foresee Cody Ross slugging three doubles and three home runs in the NLCS.
5. The Giants outscored the Rangers, 29-12. What can I say?
6. I had no idea that the Rangers would "hit" .190/.259/.288 in the World Series.
7. I had no clue that Josh Hamilton and Vladimir Guerrero would combine to go 3-for-34.
8. I failed to anticipate that Edgar Renteria would go 7-for-17 with two HR in the World Series. He went deep three times during the regular season.
9. Although I was never a fan of Texas' bullpen aside from Neftali Feliz, I would not have guessed that the set-up relievers would implode to the tune of of a 10.97 ERA over 10.2 innings.
10. I thought Cliff Lee and the Rangers would win Games 1 and 5. Instead, Tim Lincecum and the Giants won both of these crucial battles.
11. Don't forget Rule No. 1.
Look, San Francisco won the World Series fair and square. The Giants are worthy champions. The fact that I got it wrong is neither here nor there. As they say, flags fly forever. Conversely, predictions aren't worth the paper they're written on (or the pixels on your computer screen), especially those involving ... yes, small sample sizes. The staff at Baseball Analysts make such forecasts for fun and are not afraid of being wrong. To Patrick Sullivan's credit, he picked the Giants to win it in six. Not too bad.