Rich Lederer • Baseball Beat
Patrick Sullivan • Change-Up
Jeremy Greenhouse • Touching Bases
Dave Allen • F/X Visualizations
Sky Andrecheck • Behind the Scoreboard
Marc Hulet • Around the Minors
Al Doyle • Past Times
Retired Uniforms:
Bryan Smith • WTNY
Joe Sheehan • Command Post
Jeff Albert • The Batter's Eye
RSS Feed
Home
*Examining the Past, Present, and Future*
Lineup Card
Recent Entries
» Putting Together a Reality Team
» Historical Hall of Fame Vote Comparisons: 2012
» An All-Christmas Team
» The New-Look Angels
» John Denny: The Forgotten Cy Young Award Winner
» Money Isn't Everything
» What Would It Take to Hit .400 in the 21st Century?
» Halos Heaven
» Brandon McCarthy's Breakout Season
» Link-o-Rama
» Historical Hall of Fame Vote Comparisons: 2012
» An All-Christmas Team
» The New-Look Angels
» John Denny: The Forgotten Cy Young Award Winner
» Money Isn't Everything
» What Would It Take to Hit .400 in the 21st Century?
» Halos Heaven
» Brandon McCarthy's Breakout Season
» Link-o-Rama
Best of Baseball Beat
Abstracts From the Abstracts
1977 Baseball Abstract
1978 Baseball Abstract
1979 Baseball Abstract
1980 Baseball Abstract
1981 Baseball Abstract
1982 Baseball Abstract
1983 Baseball Abstract
1984 Baseball Abstract
1985 Baseball Abstract
1986 Baseball Abstract
1987 Baseball Abstract
1988 Baseball Abstract
1978 Baseball Abstract
1979 Baseball Abstract
1980 Baseball Abstract
1981 Baseball Abstract
1982 Baseball Abstract
1983 Baseball Abstract
1984 Baseball Abstract
1985 Baseball Abstract
1986 Baseball Abstract
1987 Baseball Abstract
1988 Baseball Abstract
Bert Blyleven Series
Meeting Up and Hanging Out with Bert
The Results Are In And...
Aficionado Heavily Invested in Blyleven
Latest on Blyleven's Chances for the HOF
The Internet Zealot Responds
400 Down and 5 to Go...
Bert Be Home By Eleven?
Blyleven's Forgotten Season (1973)
HeyMan, Your Comments Don't Hold Water
The Waiting is the Hardest Part
Another Addition to the Blyleven Series
Search for the Truth
As Dominant as His HOF Contemporaries
Listen, Buster
A Larger Step for Blyleven
Answering the Naysayers (Part Two)
Another Small Step for Blyleven
Q&A: Blyleven on the Twins
The Majority Rules, Right?
It's All Dutch to Some
The Hall of Fame Case for Bert Blyleven
Q&A: Blyleven on Felix Hernandez
Clemens Rocketing Up Charts
Poz: An Interview With a KC Star
A HOF Chat with Tracy Ringolsby
Up Close and Personal
A Peek Into the Mind of a HOF Voter
Answering the Naysayers
It's That Time of the Year (Again)
"If Cooperstown is Calling..."
The Bert Alert
One Small Step for Blyleven...
Only the Lonely
Exclusive Interviews
Lee Sinins
Alex Belth
David Pinto
Will Carroll
Mike Carminati
Aaron Gleeman
Joe Sheehan
Jay Jaffe
Jeff Peek
Tracy Ringolsby
Joe Posnanski
Bill James Part I, II, III
Jon Lalonde
Chuck Tiffany
Dayn Perry
Fay Vincent
Nate Silver
Alex Belth
David Pinto
Will Carroll
Mike Carminati
Aaron Gleeman
Joe Sheehan
Jay Jaffe
Jeff Peek
Tracy Ringolsby
Joe Posnanski
Bill James Part I, II, III
Jon Lalonde
Chuck Tiffany
Dayn Perry
Fay Vincent
Nate Silver
Bullpen
Rich Lederer
The Odd Couple (with Alex Belth)
The MostUnder Over Underrated Player in Baseball (with Brian Gunn)
Three Wise Men (roundtable by Alex Belth)
Infrequently Asked Questions (interview with Matt Welch)
Interview (Orioles Think Tank)
Bernie and the Yanks (Bronx Banter)
Hope and Faith: How the LAA Win the World Series (Baseball Prospectus)
NL West (The Soul of Baseball)
Greatest Living Hitter? (Sports Illustrated)
Roundtable: 2008 HOF Ballot (Armchair GM)
The Most
Three Wise Men (roundtable by Alex Belth)
Infrequently Asked Questions (interview with Matt Welch)
Interview (Orioles Think Tank)
Bernie and the Yanks (Bronx Banter)
Hope and Faith: How the LAA Win the World Series (Baseball Prospectus)
NL West (The Soul of Baseball)
Greatest Living Hitter? (Sports Illustrated)
Roundtable: 2008 HOF Ballot (Armchair GM)
Patrick Sullivan
Designated Hitters
David Bromberg (Q&A: John Denny)
Mark Armour (H. Killebrew and Versatility)
Joe Lederer (Soundtrack of a Prospect)
David Bromberg (Clemente's Autograph)
David Bromberg (Woody Fryman)
D. Baumstein (WAR Against Age: Pitchers)
Doug Baumstein (The WAR Against Age)
Doug Baumstein (A Lifetime on the Road)
John Fraser (Pick Six)
Mark Armour (How to Score More Runs?)
Bill Parker (What Opening Day Tells Us)
Stan Opdyke (Pat Rispole)
Chris Jaffe (Evaluating Baseball's Mgrs)
Stan Opdyke (Baseball Radio in NYC, 1953)
A. Nathan (Performance of Baseball Bats)
Michael Weddell (Edgar Martinez/HOF)
Jon Weisman (100 Things Dodgers Fans...)
Stan Opdyke (Connie Mack and Vin Scully)
Eric Walker (Evaluating Run Production)
Brent Mayne (The Intangibles of Catching)
Chris Moore (Best Fastballs in Baseball)
Dave Baldwin (The Batter’s Brain)
Shawn Haviland (Ivy League to MLB)
Larry Granillo (Walking Off)
Rob Iracane (Solo HR Won't Break You)
Tommy Bennett (Charm of AM Radio)
Harry Pavlidis (Johan Santana's Fast Start)
John Walsh (WAR and Remembrance)
Eric Walker (Precisely Inaccurate)
Bob Timmermann (As They See 'Em)
Geoff Young (Unicycles and Delusions)
Baseball Analysis at Tufts (Groundballers)
Baseball Analysis at Tufts (GB Out Rates)
G. Rybarczyk ('09 Hit Tracker Projections)
Joe Lederer (Curt Schilling/HoF)
Conor Gallagher (Hall of Fallacies)
Chris Green (Jim Rice, HoF, the Numbers)
Shawn Hoffman (Baseball's Bear Mkt?)
Paul Anthony (Manny Syndrome)
Ross Roley (World Series Odds)
B. Timmermann (Catcher's Interference)
R.J. Anderson (Waiting the Hardest Part)
Maury Brown (Cubs, MLB, and Cuban...)
Myron Logan (Dee-Fense, Dee-Fense)
Craig Calcaterra (Frivolity, Part I, Part II)
Chad Finn (Ode to Baseball Cards)
David Cameron (Mariners Foibles)
Chris Dial (Chipper Jones)
Pat Lederer (Memory Lane)
David Appelman (Clutch Pitching)
Bob Rittner (DH)
Jonathan Mayo (Roger Clemens)
Lisa Winston (My Son-in-Law...)
Russ McQueen (The Yellow Hammer)
Bob Rittner (I'm OK, You're OK)
Mark Armour (In Defense of the HOF)
Pat Jordan (Friends)
Dan Levitt (Analysis of Terry Ryan)
Doug Baumstein (Trading Econ 101)
Ross Roley (Runner's Reluctance II)
Ross Roley (Runner's Reluctance I)
Mark Armour (No-Longer Lovable Sox)
Bruce Regal (Stealthy and Wise)
Brian Gunn (Roid Monster)
Current/McEvoy (Value of the SB)
John Rickert (Sinister Thefts)
Nate Silver (Sabermetrics)
David Vincent (Home Run Production)
Joe P. Sheehan (Enhanced Gameday II)
Mark Armour (An Ode to Sport)
David Gassko (All-Time Worm Burners)
Joe P. Sheehan (Enhanced Gameday)
John Walsh (When Titans Clash)
Fox/Williams (Quantifying Coaches II)
Fox/Williams (Quantifying Coaches I)
Jacob Luft (Bull Durham Rant)
Chad Finn (Strat-O-Matic)
Lisa Winston (Rotisserie Baseball)
Dave Studeman (Baseball Stats)
Steve Treder (Roger Craig)
Marc Normandin (Jeff Bagwell)
D. Appelman (Expanding Strike Zone)
Jeff Sackmann (Worst MiL Defenders)
Jeff Sackmann (Best MiL Defenders)
Maxwell Kates (Van Lingle Mungo)
David Appelman (Pitch Location)
Kent Bonham (Danny Ray Herrera)
Glenn Stout (Two Baseball Poems)
Bruce Regal (The Challenge Round)
Mark Lamster (Barry & Ty)
Geoff Young (NL West)
Tom Lederer (The Ryan Express)
Brian Erts (Great Leap Forward)
David Pinto (Parity and the N.L.)
Jacob Luft (Fathers and Daughters)
Jamey Newberg (Pete's Sake)
Jeff Albert (A. Jones Swing Analysis)
Jeff Albert (A-Rod Swing Analysis)
Keith Law (Death, Taxes, and Waivers)
Peter Abraham (Tales of Torre Tales)
Larry Borowsky (Let 'er Rip II)
Dan Levitt (Empirical Analysis of Bunting)
Jonah Keri (If I Met Warren Cromartie...)
Bob Klapisch (War Stories)
Bob Timmermann (John F. Kennedy HS)
Kent Bonham (Aluminum Adjustments)
Al Doyle (More Than Superstars)
Ross Roley (Instant Replay)
David Vincent (Barry Bonds Homers)
Chad Finn (Our Favorite Obscurities)
Bill Deane (1979 NL MVP)
Mark Armour (Rise/Fall of Artificial Turf)
Jeff Angus (Wally Moon Camp)
David Berri (Money and Baseball)
Larry Borowsky (Baseball w/o the #s)
Derek Zumsteg (The Irrational Market)
David Regan (Free Agent Contracts)
Peter Schmuck (Steroids and the HOF)
David Appelman (Pitchers, Pitch by Pitch)
Dan Fox (Swinging, Taking, Fouling, Etc)
Patrick Sullivan (Study of NYY CF/BOS LF)
Will Leitch (Baseball Journalism)
Jeff Sullivan (Pitcher Release Points)
Steve Treder ('69-'70 Giants)
Maury Brown (Charlie Finley)
John Brattain (Bob Johnson)
Bob Klapisch (The Case for Bert Blyleven)
Jeff Peek (Pride and Prejudice)
Dayn Perry (Bert and Warren)
Rob Neyer (If Don Sutton Was Great...)
Lisa Winston (Minor League Memories)
Alex Belth (Otis Redding Was Right)
David Cameron (Long Live the King)
Jeff Angus (Baserunning Study)
Bert Blyleven (Baseball Playoffs)
Boyd Nation (Not a Prospect List)
James Click (Batters-Baserunners Study)
Jeff Shaw (Why I Love Baseball)
David Gassko (BIP/BFP Fielding Study)
Jay Jaffe (Milwaukee Sausage Race)
Jamey Newberg (Remember When)
Bob Klapisch (Press Box to the Mound)
Dan Levitt (Predictive Value of BB)
David Vincent (Official Scorer)
Jon Weisman (Rick Monday)
Larry Borowsky (Let 'er Rip)
Will Carroll (Fictional Short Story)
Bob Timmermann (Japanese Baseball)
Cyril Morong (Best Pitching Seasons)
Sean Forman (Monte Carlo Win-Loss)
Brian Gunn (My Little Blue Book)
Joe Lederer (My Dad and Baseball)
Bill Deane (Bob Gibson, 1968)
Mark Armour (1977 Yankees)
Darren Viola (Retrosheet)
David Pinto (RFK)
Dayn Perry (Brave Heart)
Matt Welch (Dave Hansen)
Kevin Kernan (Jack McKeon)
Tom Lederer (Dodgers Road Trip)
Steve Lombardi (Slider)
Studes (Picturing Baseball)
Mike Carminati (Luck of the Drawl)
Eric Neel (Vin Scully)
J.C. Bradbury (Leo Mazzone)
John Sickels (Bill James)
Search Baseball Analysts
Archives
By Category:
Around the Majors Content Only
Around the Minors Content Only
Baseball Beat Content Only
Baseball Beat/Change-Up Content Only
Baseball Beat/WTNY Content Only
Behind the Scoreboard Content Only
Change-Up Content Only
Change-Up/Around the Majors Content Only
Command Post Content Only
Crunching the Numbers Content Only
Designated Hitter Content Only
F/X Visualizations Content Only
Past Times Content Only
Saber Talk Content Only
The Batter's Eye Content Only
Touching Bases Content Only
Weekend Blog Content Only
WTNY Content Only
By Month:
February 2012
January 2012
December 2011
October 2011
September 2011
August 2011
July 2011
June 2011
May 2011
April 2011
March 2011
February 2011
January 2011
December 2010
November 2010
October 2010
September 2010
August 2010
July 2010
June 2010
May 2010
April 2010
March 2010
February 2010
January 2010
December 2009
November 2009
October 2009
September 2009
August 2009
July 2009
June 2009
May 2009
April 2009
March 2009
February 2009
January 2009
December 2008
November 2008
October 2008
September 2008
August 2008
July 2008
June 2008
May 2008
April 2008
March 2008
February 2008
January 2008
December 2007
November 2007
October 2007
September 2007
August 2007
July 2007
June 2007
May 2007
April 2007
March 2007
February 2007
January 2007
December 2006
November 2006
October 2006
September 2006
August 2006
July 2006
June 2006
May 2006
April 2006
March 2006
February 2006
January 2006
December 2005
November 2005
October 2005
September 2005
August 2005
July 2005
June 2005
May 2005
April 2005
March 2005
February 2005
January 2005
December 2004
November 2004
October 2004
September 2004
August 2004
July 2004
June 2004
May 2004
April 2004
March 2004
February 2004
January 2004
December 2003
November 2003
October 2003
September 2003
August 2003
July 2003
June 2003
Reference
Organizational Stats
Arizona Diamondbacks Bat / Pitch
Atlanta Braves Bat / Pitch
Baltimore Orioles Bat / Pitch
Boston Red Sox Bat / Pitch
Chicago Cubs Bat / Pitch
Chicago White Sox Bat / Pitch
Cincinnati Reds Bat / Pitch
Cleveland Indians Bat / Pitch
Colorado Rockies Bat / Pitch
Detroit Tigers Bat / Pitch
Florida Marlins Bat / Pitch
Houston Astros Bat / Pitch
Kansas City Royals Bat / Pitch
Los Angeles Angels Bat / Pitch
Los Angeles Dodgers Bat / Pitch
Milwaukee Brewers Bat / Pitch
Minnesota Twins Bat / Pitch
New York Mets Bat / Pitch
New York Yankees Bat / Pitch
Oakland Athletics Bat / Pitch
Philadelphia Phillies Bat / Pitch
Pittsburgh Pirates Bat / Pitch
St. Louis Cardinals Bat / Pitch
San Diego Padres Bat / Pitch
San Francisco Giants Bat / Pitch
Seattle Mariners Bat / Pitch
Tampa Bay Devil Rays Bat / Pitch
Texas Rangers Bat / Pitch
Toronto Blue Jays Bat / Pitch
Washington Nationals Bat / Pitch
All-Star Links
Official Websites
News and Notes
Baseball News Blog
Baseball Newstand
ESPN Baseball
Fox Sports Baseball
Pro Sports Daily
Roto World
The Roto Times
USA Today Baseball
Baseball Newstand
ESPN Baseball
Fox Sports Baseball
Pro Sports Daily
Roto World
The Roto Times
USA Today Baseball
Reference and Analysis
Baseball Almanac
Baseball America
Baseball Archive
Baseball Contracts
Baseball Cube
Baseball Graphs
Baseball Library
Baseball Musings Player Database
Baseball Page
Baseball Primer
Baseball Prospectus
Baseball Reference
Baseball Statistics
Baseball Truth
Boxscore Central
Diamond Mind Baseball
Doug's Stats
FanGraphs
Fast Balls (pitchfx catalog)
Hardball Dollars
Hardball Times
Hit Tracker
Retrosheet
Rotobase/Rotoblog
Stat Corner
STATS
Tango on Baseball
Yahoo Sports MLB
Web Gems
Bill James Primer
Sabermetric Manifesto (Grabiner)
Pitching and Defense (McCracken)
Pitching and Defense (Tippett)
Transactions Primer (Neyer)
Baseball Stats (Batter's Box)
Prospect Report (Cameron)
Pitcher Workloads (Sheehan)
Goodbye to Old Baseball Ideas (Rickey)
Sabermetric Manifesto (Grabiner)
Pitching and Defense (McCracken)
Pitching and Defense (Tippett)
Transactions Primer (Neyer)
Baseball Stats (Batter's Box)
Prospect Report (Cameron)
Pitcher Workloads (Sheehan)
Goodbye to Old Baseball Ideas (Rickey)
Columnists
Baseball Blogs
Around the Majors
Athletics Nation
Baseball Crank
Baseball Musings
Baseball-Reference Blog
Batter's Box
Big League Stew
Bronx Banter
Catfish Stew
Cub Town
Dan Agonistes
Dodger Thoughts
DRays Bay
Ducksnorts
Futility Infielder
Halos Heaven
Inside the Rockies
It Might Be Dangerous
Knuckle Curve
LoHud Yankees Blog
Lookout Landing
Management by Baseball
Metaforian
Metsgeek
Mike's Baseball Rants
Only Baseball Matters
Redbird Nation
Red Reporter
Sabernomics (Braves)
Seth Speaks
ShysterBall
6-4-2 (Angels/Dodgers)
The Book
TheCubdom
The Cutting Edge
The House That Dewey Built
The View From The Bleachers
Tiger Blog
U.S.S. Mariner
Viva El Birdos
Where's Kernan
Minor Leagues
Arizona Fall League
BA Player Finder
Cal Leaguers
Jamey Newberg
JDM's Scoresheet Baseball
Minor League Baseball
Minor League Park Factors
Minor League Splits
No Pepper
Sickels' Minor League Ball
Warm October Nights
BA Player Finder
Cal Leaguers
Jamey Newberg
JDM's Scoresheet Baseball
Minor League Baseball
Minor League Park Factors
Minor League Splits
No Pepper
Sickels' Minor League Ball
Warm October Nights
Amateur
Boyd's World (College)
Cape Cod Baseball League
College Baseball Blog
College Baseball Insider
Collegiate Baseball Newspaper
College Splits
College Splits Blog
Dirtbags Baseball (Long Beach State)
NCAA Baseball
NCBWA
Team One Baseball (High School)
Texas A&M & Baseball
Cape Cod Baseball League
College Baseball Blog
College Baseball Insider
Collegiate Baseball Newspaper
College Splits
College Splits Blog
Dirtbags Baseball (Long Beach State)
NCAA Baseball
NCBWA
Team One Baseball (High School)
Texas A&M & Baseball
Historical
Cuban Baseball
House of David
Jim "Mudcat" Grant's Web Page
Negro League Baseball Players Assoc
Negro Leagues Baseball Museum
1919 Black Sox
Pacific Coast League
Philadelphia Athletics Historical Society
Shoeless Joe Jackson Society
SABR-L Archives
Walter O'Malley
House of David
Jim "Mudcat" Grant's Web Page
Negro League Baseball Players Assoc
Negro Leagues Baseball Museum
1919 Black Sox
Pacific Coast League
Philadelphia Athletics Historical Society
Shoeless Joe Jackson Society
SABR-L Archives
Walter O'Malley
Miscellaneous
Forums
Credits
Ticket Center
Tickets to Baseball -
Premium Red Sox Tickets - Tickets to Marlins Games - Cardinals Game Tickets - NY Yankee Tickets - Tickets Oakland Athletics - Dallas Cowboys Tickets - Arizona Cardinals Tickets - Tickets Seattle Seahawks - Buffalo Bills Tickets Online - Tickets to Dolphins Football
Buy Boston Red Sox tickets,
Philadelphia Phillies tix,
NY Yankees tickets,
NY Mets tickets, and
MLB All Star game tickets at ABC tickets
Not sure where to find the best online sportsbooks? Start your search with PlayersJet.
Get deals at SportsMemorabilia.com on baseball apparel, including Phillies jerseys and more for adults and children.
Shop the largest selection baseball equipment on sale at Sports Unlimited. Check out tons of baseball gloves, youth baseball gloves and catchers gear from Rawlings, Wilson, Nike & Under Armour.
2011 Draft Order
Courtesy of Baseball America
First-Round:
 1. Pirates (57-105)
 2. Mariners (61-101)
 3. Diamondbacks (65-97)
 4. Orioles (66-96)
 5. Royals (67-95)
 6. Nationals (69-93)
 7. Diamondbacks (for B. Loux)
 8. Indians (69-93)
 9. Cubs (75-87)
10. Padres (for Karsten Whitson)
11. Astros (76-86)
12. Brewers (77-85)
13. Mets (79-83)
14. Marlins (80-82)
15. Brewers (for Dylan Covey)
16. Dodgers (80-82)
17. Angels (80-82)
18. Athletics (81-81)
19. Red Sox (from DET for Martinez)
20. Rockies (83-79)
21. Blue Jays (85-77)
22. Cardinals (86-76)
23. Nationals (from CWS for Dunn)
24. Rays (from BOS for Crawford)
25. Padres (90-72)
26. Red Sox (from TEX for Beltre)
27. Reds (91-71)
28. Braves (91-71)
29. Giants (92-70)
30. Twins (94-68)
31. Rays (from NYY for Soriano)
32. Rays (96-66)
33. Rangers (from PHI for Lee)
Supplemental First Round:
34. Nationals (Dunn)
35. Blue Jays (Downs)
36. Red Sox (Martinez)
37. Rangers (Lee)
38. Rays (Crawford)
39. Phillies (Werth)
40. Red Sox (Beltre)
41. Rays (Soriano)
42. Rays (Balfour)
43. Diamondbacks (LaRoche)
44. Mets (Feliciano)
45. Rockies (Dotel)
46. Blue Jays (Buck)
47. White Sox (Putz)
48. Padres (Garland)
49. Giants (Uribe)
50. Twins (Hudson)
51. Yankees (Vazquez)
52. Rays (Benoit)
53. Blue Jays (Olivo)
54. Padres (Torrealba)
55. Twins (Crain)
56. Rays (Choate)
57. Blue Jays (Gregg)
58. Padres (Correia)
59. Rays (Hawpe)
| Touching Bases | December 31, 2010 |
The Bert Blyleven Awards
In all likelihood, Bert Blyleven will be inducted into the Baseball Hall of Fame next week. This marks Blyleven's 14th year on the ballot, which places his year of retirement at 1992. I have never, not once in my life, watched Bert Blyleven pitch, but I sure have read a lot about the man. Blyleven was a workhorse who amassed piles of strikeouts, shutouts, and wins. His HOF candidacy over the years has taken a roller coaster ride. Detractors point to his merely decent winning percentage and lack of cultural impact, whereas his supporters make note of Byleven's sterling postseason record and legendary curveball.
What current pitcher is most similar to Bert Blyleven? The nominees:
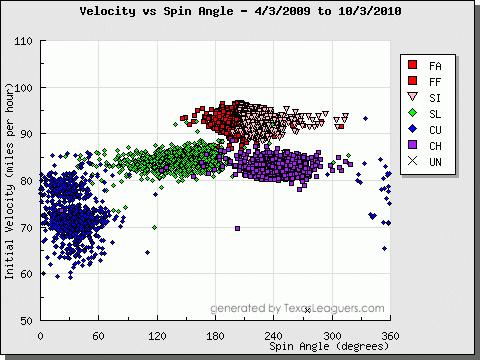
When you think of big curveballs nowadays, you think of Adam Wainwright. Over the last two years, Wainwright’s curveball has been worth 45.7 runs according to FanGraphs, 20 runs better than the runner-up. Wainwright doesn’t shy away from the pitch, throwing it a quarter of the time, the third-highest rate in the Majors. However, nobody can match the 40% rate Blyleven estimated that he threw in 1978. Blyleven was known for freezing batters with his curve, and Wainwright had at least one such famous moment. Both Wainwright and Blyleven threw their curveballs in unusual fashions. According to pitch grip expert Mike Fast, Wainwright's curve "is not quite a standard curveball grip in that his index finger is completely off the ball. Most pitchers lay it down alongside the middle finger on the ball." Blyleven, on the other hand, said that he "holds both his fastball and curveball across the seams." Blyleven recalled Sandy Koufax and Bob Feller pitching the same way, but at the time knew of no one else who did. I asked Mike Fast, and he is unaware of any current pitcher who exhibits this trait. Here's an image of a potential Blyleven curve.
Like Blyleven, Oswalt has been a durable pitcher, averaging 200 innings per year in his career. According to Blyleven's manager Ray Miller, Blyleven was able to hold up year after year thanks to a smooth delivery with "a lot of leg drive," and Blyleven himself said "my durability as a pitcher comes from my legs more than my arm." 60ft6in's Sven Jenkins describes Roy Oswalt as "the ultimate 'drop and drive' pitcher.' He uses his legs to get the most out of his slight frame."
Blyleven's curve was the subject of Baseball Digest stories in 1978 and then again in 1989. Both times, he described two different variations of his curve. One, a "roundhouse curve" had a big, lazy break. The other, his "overhand drop" became his specialty. Several current pitchers throw multiple curves, including Bronson Arroyo, who can add and subtract from all of his pitches, and Chad Billingsley, who mixes in up to seven distinct pitch types. And Mike Mussina would have been a great Blyleven comp, given their durability, their propensity to throw breaking pitches, throw breaking pitches for strikes, and willingness to pitch to both sides of the plate. But Moose retired, so I'm not including him as a nominee. Instead, I think Roy Oswalt's array of curveballs aligns best with Blyleven's description. Oswalt has a standard overhand curve that clocks in the high 70s, but Oswalt has explained that he also throws a slower curveball by choking the ball deep into his hand. Jenkins notes that Oswalt can vary the velocity on his signature 12-to-6 curve from the upper 70s to down into the 60s. On the left side of this image, you can see the distinct clusters forming Oswalt's curveballs. You can also see that the ball's axis of rotation approaches zero degrees at times.
Verlander throws a monster breaking ball. He is generally around the plate with his curve, too. Verlander's curve baffles hitters, but more importantly, it fools umpires as well. In one famous incident, Blyleven got so fed up with an umpire's refusal to call his curveball for strikes that he began to throw batting-practice fastballs, afterward saying, "if he's not going to call my curveball for strikes, then I'm just going to throw my fastball down the middle." Verlander had a notable argument with an umpire this year for "not getting the strike call on back-to-back breaking balls around the inside corner."
Here is the called strike zone for Verlander's curve over the last two years.
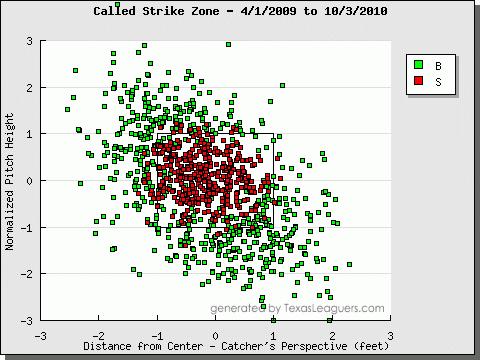
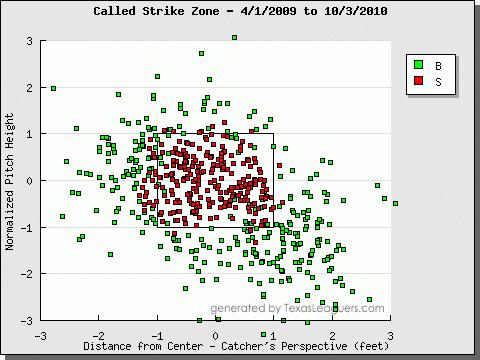
I guess the only way you can tell whether the zone is fair or not is by counting the number of green points inside the strike zone box and the red points outside it. The method I used in determining that Verlander's curveball was the most umpire-unfriendly in baseball controlled for batter handedness, batter height, and pitch movement. It showed that Verlander has been screwed out of about 50 strikes, 20 more than anyone else. By comparison, here's the curveball strike zone for Javy Vazquez, to whom umpires have been more generous. Pay particular attention to the area down and away from RHBs.
Ranking in terms of "stuff," Stephen Strasburg and a plethora of relievers boast the nastiest curveballs. But for starters with some degree of longevity, Burnett's is the hardest to hit. Burnett's curveball induces whiffs on 45% of swings, an obscene number. That's partially because he's so wild, throwing his curve in the zone under a third of the time. Blyleven and Burnett had similar philosophies about where to throw their curves, if not similar execution. Blyleven said that he "keeps the ball low and away to a righty," which appears to be Burnett's intention. Against lefties, Blyleven would try to "nick the outside corner" or "break it low and in." Again, this fits a visualization of Burnett's curve vs. LHBs. The problem is that where Blyleven threw strikes, Burnett throws wild pitches. Like Blyleven, Burnett is almost exclusively a two-pitch fastball/curveball pitcher, at times tinkering with a show-me change. Blyleven said that he threw his fastball in the low 90s and his curveball in the mid 80s. Burnett comes as close as it gets to fitting that profile.
Burnett also gets a nod for reportedly loosening up the Yankee clubhouse. His trademark is the cream pie, while Blyleven was a master at the hot foot.
Carpenter, like Wainwright, throws a whole lot of curveballs, and he throws them well. Carp and Waino throw with similar velocity, movement, and release points. Few can spin the ball like these two. What sets Carpenter apart is that, like Blyleven, his fastball might be his better pitch. Wainwright's curveball has dominated baseball over the last two years, but Carpenter is the only pitcher in baseball with a fastball ranking in the top ten in terms of run value in addition to his top ten curveball. Blyleven said that, "my fastball was my best pitch, because it set up my curve. The control of your fastball is the key to success for any pitcher -- and not being afraid to pitch hard inside." Just last week, he said on the Jonah Keri Podcast, "my curveball was a very good pitch for me, but it’s my fastball that set it up. Establishing the fastball on both sides of the plate set up my curveball." Carpenter pitches to both sides of the plate with his fastball. Pretty much anywhere so long as it's a strike. And when he is able to set up his curveball with a fastball, nobody has a chance. Carpenter's curve is on average 1.5 runs per 100 pitches above average, but when preceded by his fastball, it's 3.5 runs above average.
I submitted my ballot to Rich Lederer, who was given the final say on whom to elect for the Bert Blyleven Award:
-----
Rich: Jeremy sent an email a few days ago informing me that he wanted to "compare Blyleven to modern-day pitchers using PITCHf/x data for people like me, who never got to see Blyleven pitch." Here is my return email to Jeremy.
I believe Roy Oswalt, Adam Wainwright, Mike Mussina, Josh Beckett, and Chris Carpenter are good comps. Those would be my top five. All of these pitchers make sense if you think in terms of fastball velocity, wCB and wCB/C, WHIP, and K/BB.Blyleven was a fastball/curveball pitcher. He threw an occasional changeup but it wasn't a significant part of his repertoire. His roundhouse was the so-called "slow curve" and the overhand drop the "12-to-6 hammer curve" that was his out pitch. With no public postings of radar-gun readings in those days to measure his fastball, my guess is that Blyleven threw a low-90s heater with the ability to dial it up to the mid-90s on occasion during the first half of his career. He definitely threw hard but his fastball more or less set up his curve. He could throw strikes with his fastball and curveball on both sides of the plate and at any point in the count.
Bert was also a workhorse. He threw more than 270 innings in eight different seasons. Of note, the 293.2 innings he pitched in 1985 has not been surpassed in the past 25 years. Leading the AL in home runs allowed in 1986 and 1987 had as much to do with ranking first and fourth, respectively, in innings pitched as it did with being around the plate a lot and hanging a few curveballs. However, for Blyleven's career, he was right at the MLB average for allowing homers (2.1% vs. 2.0%) and, in fact, gave up fewer HR/9 than a composite of his eight most similar HOF pitchers.
As it relates to his comps, Oswalt's fastball has averaged 93.1 mph during his career. Wainwright 90.6. Mussina 88.3 since 2002, probably more like 90ish in the earlier part of his career. Beckett 94. Carpenter 91.5 since 2002. The latter took much longer to develop and has missed more time to injuries than Blyleven. I think these are all good comps though. 90-94 mph fastballs with outstanding curveballs, excellent control and command, and somewhat similar K and BB rates.
I didn't realize I had final say on the Bert Blyleven Award (singular) until Jeremy returned with his nominations. The truth of the matter is that I believe a composite of Oswalt and Wainwright would be one heck of a match. A righthanded starting pitcher with a 92 mph fastball and a hellacious curveball with outstanding control and the ability to miss bats.
The winner? Roy Wainwright. Or is it Adam Oswalt? OK, make it Roy Oswright. Or even Adam Wainwalt. Yeah, it's one of those guys.
For what it's worth, here is a statistical comparison between Blyleven's career through his 32-year-old season and Oswalt:

Similarly, here is a statistical comparison between Blyleven's career through his 28-year-old season and Wainwright:

-----
This marks my final piece as a regular contributor to Baseball Analysts. I'm no longer a student, which means that I now have to make my way out in the real world--the one with all the hard knocks. I'm much obliged to Rich for giving me a writing platform and always providing thoughtful comments on my work. Thanks to my fellow authors at Baseball Analysts for giving it 100% and no more because they knew doing so would be mathematically impossible. And thanks to the readers, especially to those who were generous enough to offer criticism. Catchphrase.
| Change-Up | December 29, 2010 |
Jim Rice, Chet Lemon, and How I Think About Wins Above Replacement
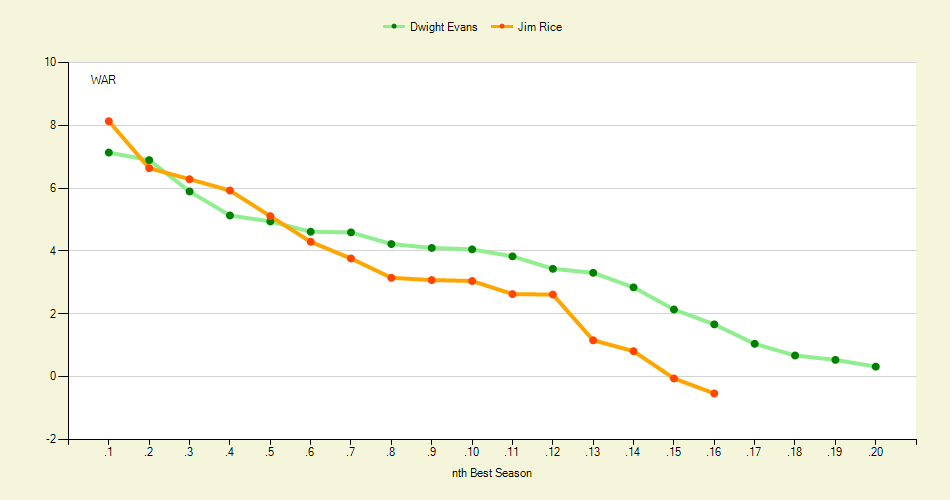
Inspired by Mike Axisa's new Twitter feed, @WARGraphs, I have been playing around with a new tool, or at least one that's new to me. As you may know, WAR Graphs is a Fangraphs feature where you can compare up to four players by Wins Above Replacement. Once one enters their desired search, three graphs appear. One shows how the players compare in their nth best seasons. The second shows how they compare year-by-year over the course of their careers. The final one shows how they stack up by age.
It's a neat tool, and a handy one when like-minded folks are looking to settle a quick dispute. For instance, as a Red Sox fan, a pet issue of mine has been the travesty that is Jim Rice's Hall of Fame enshrinement while Dwight Evans never amassed more than eight percent of the vote. Anyway, here are two of the three WAR Graphs for a Rice and Evans comparison.
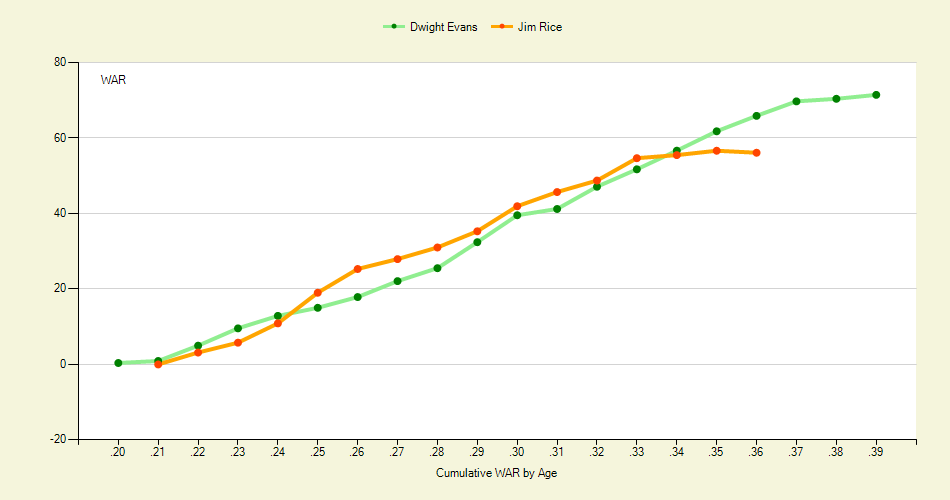
Because the topic is something of an obsession for me, I tweeted my findings from this WAR Graphs search last night.
Jim Rice & Dewey were similar, if you ignore Dewey's 35-40 seasons when he hit .283/.387/.470 (133 OPS+) http://is.gd/jFVpA Patrick Sullivan
PatrickSull
When he saw this, Dave Cameron responded with the following:
@PatrickSull My favorite - run Jim Rice against Chet Lemon; pick up jaw. David Cameron
d_a_cameron
And sure enough, here is the WAR Graphs comparison of Rice and Chet Lemon.
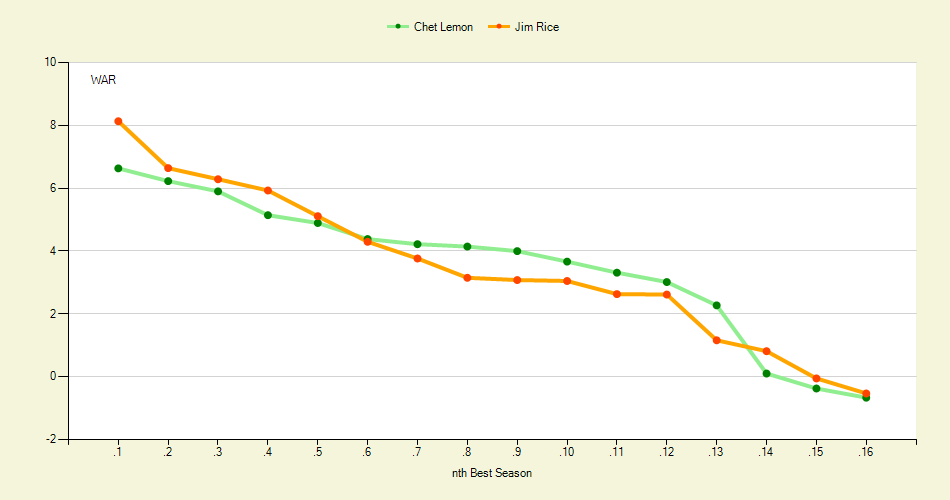
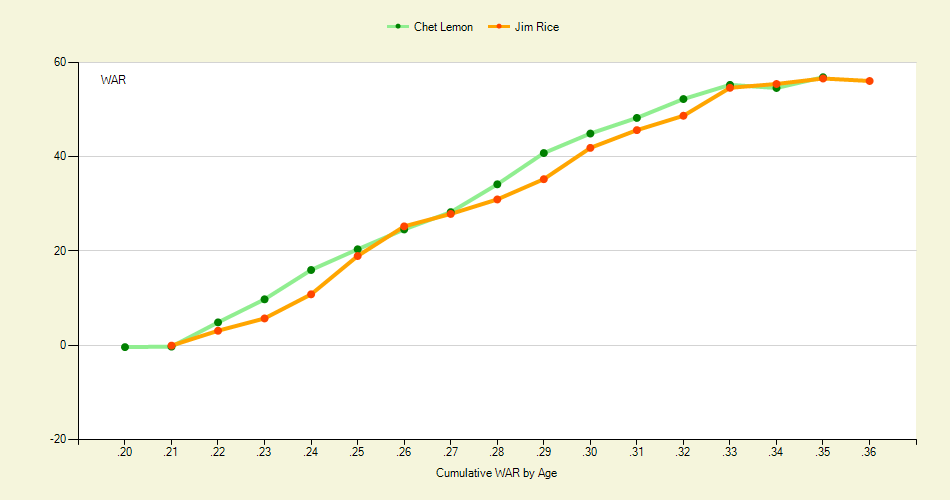
Chet Lemon and Jim Rice are more or less indistinguishable. Chet. Lemon.
**********
All of this was a long and graphical way of setting up the point of this post, which is to articulate a coherent way to think about WAR in the context of Hall of Fame voting. Jonah Keri has done a really nice job advocating for Tim Raines in a more visceral way than Rich Lederer has for Bert Blyleven. Rich has gradually won over voters by reminding them time and again of Blyleven's statistical dominance. Keri, on the other hand, will make his case with stats, but also with well-supported assertions along the lines of had Rickey Henderson never come along, Raines may well be regarded as the finest lead-off man ever. That resonates more than a WAR Graph with many.
To take it a step further, not only is something like WAR altogether unpersuasive to some, but when many see the WAR Graph above of Jim Rice and Chet Lemon, their gut may be to write off the statistic itself altogether. In other words, it's not that the graph shows that Rice and Lemon were comparable. No, the graph shows that WAR as a statistic is moronic.
But here's the thing about WAR. It lines up with so much of what we understand to be true, even before we start in on any sort of advanced statistical analysis. Here's a list of the top-10 position players by B-Ref WAR:
1. Babe Ruth
2. Barry Bonds
3. Ty Cobb
4. Willie Mays
5. Hank Aaron
6. Tris Speaker
7. Stan Musial
8. Rogers Hornsby
9. Eddie Collins
10. Ted Williams
The next five on the list are Mickey Mantle, Lou Gehrig, Honus Wagner, Rickey Henderson and Mel Ott. We are talking baseball royalty. It's not as though Nomar Garciaparra or someone crept into the top of the list because of some quirk in the statistic. It actually aligns beautifully with a list your grandfather might furnish you of the very best baseball players of all time.
Here are the top pitchers:
1. Roger Clemens
2. Walter Johnson
3. Tom Seaver
4. Pete Alexander
5. Lefty Grove
6. Phil Niekro
7. Greg Maddux
8. Gaylord Perry
9. Warren Spahn
10. Randy Johnson
The next five? BERT BLYLEVEN, Christy Mathewson, Bob Gibson, Nolan Ryan and Steve Carlton. Nobody is saying that this is the definitive list of the best pitchers of all time, ranked perfectly in order. Peak matters, for instance, and I don't want to speak for anybody else but I don't think you'll find too many stat heads saying that Niekro, Perry or Blyleven were better than Pedro Martinez or Sandy Koufax. But the point remains the same: that's a pretty darn good list in terms of how it compares to common baseball wisdom of the very best pitchers ever.
There are single-season examples, too, of the visceral or instinctive aligning with analytical conclusions. Growing up, I heard non-stop stories from my father and grandfather of how great Carl Yastrzemski was for the 1967 Impossible Dream Boston Red Sox. We would listen regularly to the WHDH-produced soundtrack to that season, including the ragtime adaptation a song whose chorus went "Caaaahhhhrrrll Yastrzemski" over and over again. Later in life, my father in law, a Long Beach, California native who studied law in Boston during the 1967 season, would tell me one story after another about how incredible Yaz was. This is a man who is no Red Sox supporter, and as prone to hyperbole as anyone you could meet. Given everything I had heard throughout my life about Yaz in 1967, you'd have thought he had one of the very best seasons ever. Having bought in more and more to advanced statistical analysis, I just assumed all of this was overblown.
Well you know what? Yaz did have one of the very best seasons ever. Go on and check it out. Aside from three insane Barry Bonds seasons, Yaz's 1967 stands as the finest year by a position player since 1958. All of that wonderful stuff I had heard about Yaz, all of what seemed like folklore, it ALL lined up perfectly with what WAR would tell you about Yaz's heroics in 1967. It was one of the truly great single seasons in baseball history.
When I see a graph like the one above of Lemon and Rice, I don't immediately assume Lemon was better than Rice or even that Lemon was the same caliber of player Rice was. I'm more skeptical of defensive data than offensive, and I have a ton of respect for what Rice did at his peak. But that's not how WAR is supposed to work, or at least it's not how I think it should work. Instead, I believe it should be your first pass.
Oh, I see here that Blyleven ranks 11th all time and Morris 119th. I probably would be wrong to vote in Morris then, and not Blyleven.
Huh, look at this: Tim Raines ranks 55th all time and Lou Brock 121st. Maybe I need to think a little differently about Raines's candidacy?
In the Rice and Lemon case, it just shows that maybe we've thought a bit disproportionately about both players. Rice is in the Hall of Fame while Lemon, well I hadn't even thought about Chet Lemon in over a decade. That doesn't seem right to me anymore now that I have taken Dave Cameron's suggestion to run the comparison.
WAR is not perfect but it cannot be ignored, either. My hope is that more Hall of Fame voters will look to the stat to help frame their decisions. If a certain player amassed many of his Wins Above Replacement in exceedingly favorable conditions, no problem. Dock him. If WAR sells short a player like Morris or Rice for whatever reason, you can make that case too. All I ask is that voters recognize how well the statistic holds up to everything we understand to be true about baseball. More often than not for the attentive baseball fan or writer, a quick pass at WAR will serve more as affirmation than an eyebrow-raising contradiction. That being the case, when it does not quite align with pre-conceived beliefs, it merits further investigation and not immediate write-off.
| Touching Bases | December 24, 2010 |
The Year in PITCHf/x Calibration
This week, I handed in potentially the final paper of my academic career. It was titled, "The History of PITCHf/x." That is to say that I greatly enjoy thinking about, reading about, and writing about PITCHf/x data. So I don't mean to cast PITCHf/x in a negative light by bringing up its calibration issues, but data is kind of worthless without knowing the error involved. And while PITCHf/x is precise within a fraction of an inch, the accuracy is not always there, as some ballparks can report errors more along the lines of fractions of a foot.
The list of public analysts who have completed data correction systems is only a few names long. I believe Mike Fast, Josh Kalk, Harry Pavlidis, and Ike Hall have done some quality work in the area. My first pass is likely not as rigorous as their methods, but I feel I stumbled upon enough points of interest to warrant writing something up. My sample consisted of the fastest 25% of pitches thrown by each pitcher in each game. I compared the actual properties of those pitches to a set of expected values. These expected values were generated by finding the average properties of pitches thrown in other ballparks by the same pitchers. There were five values that I tested: the initial horizontal and vertical position (release point), the resultant horizontal and vertical position (plate location), and the pitch velocity.
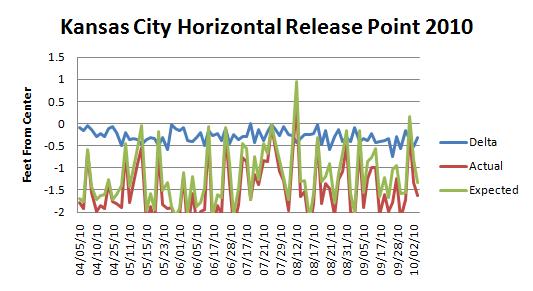
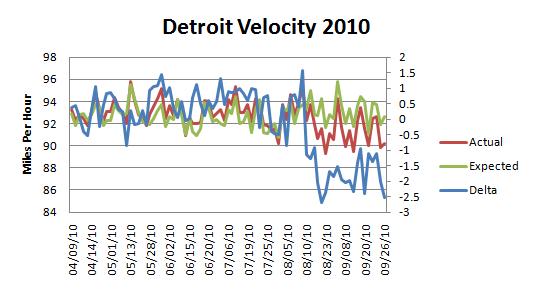
One mid-august homestand in Houston jumped out at me. The graphs I present below contain the actual and expected values as detailed above, as well as the difference between the two, which loosely represents the magnitude of correction needed.
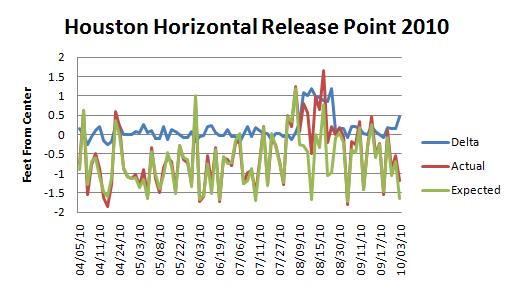
You can see that the actual release points and the expected release points follow each other quite well over the first half of the season. For instance, when two left-handed pitchers start, the average release point jumps to the opposite side of the graph. But then in August, the blue delta line spikes by a foot. I created a gif comparing all of Brett Myers' release points leading up to his August 13 game and his recorded release points in that game. Without context, it would be easy to draw the conclusion that Myers had altered his approach.
Some parks were consistently miscalibrated the entire year. Or perhaps the rubber on the pitching mound was off-center. Kansas City had on average a three-inch difference between the actual and expected horizontal release points. This was certainly the fault of Dayton Moore.
More importantly, Kansas City overstated velocity, a trend fortunately spotted by Jeff Zimmerman early on in the season. Here, the delta line is plotted on a different axis.
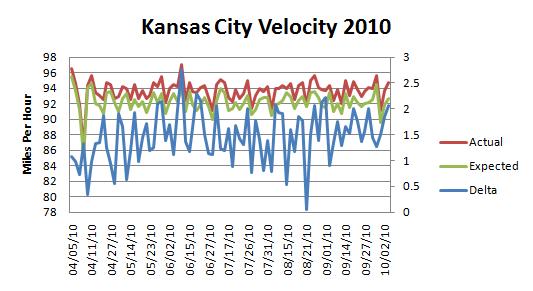
On average, the delta was 1.1 miles per hour, the exact same number reported by Mike Fast.
Mike published his own 2010 velocity corrections on THT, and I found the correlation coefficient between his and mine to be 0.8.
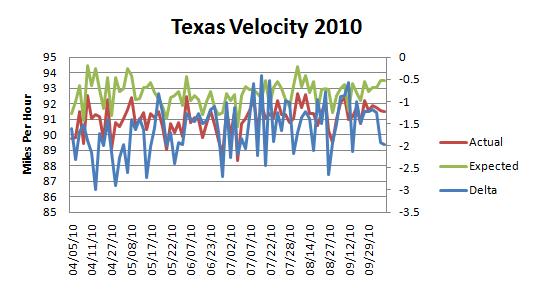
Texas was at the other end of the spectrum.
And Detroit was fine until the final months of the season.
Like Kauffman, Dodger Stadium was on average three inches off with its horizontal release points. Several parks deviated a couple inches from what we'd expect with their vertical release points. Again, rubber position and mound heights are not standardized across MLB, so it could be that pitchers do throw from different release points depending on the stadium. Citizens Bank and Yankee Stadium reported high release points, while Safeco and Petco came in lower.
Plate location adjustments are much harder to nail down. For one, the values reported by PITCHf/x around the plate are generally accurate, as they are more directly observed by cameras, as opposed to the release points which are extrapolated. Furthermore, pitchers vary their intended pitch locations much more than they do their release points. The park with the greatest pitch location abnormality is Yankee Stadium, and the reason is clear. The Yankees possess such a disproportionate number of left-handed batters that pitchers throw to the third-base side of the plate more than they would against any other team.
Correcting PITCHf/x data seems hard. Differences in a ballpark's configurations and a pitcher's intentions are difficult to separate from an oddity in PITCHf/x calibration. Including batter handedness appears vital, given that pitchers shift their position on the rubber or throw to a different side of the plate depending on batter handedness. I do not think that an automated correction system is the answer to correcting PITCHf/x data. I envision how hard it would be to pick up on sudden shifts in the data that stem from recalibrations without picking up on the random game-to-game noise. It would possibly be easiest to simply eyeball a span of time during which one fixed level of adjustment is needed.
| Baseball Beat | December 22, 2010 |
The Internet Zealot Responds
One Blyleven Internet supporter is such a zealot that he has guessed as to the motives for the non-support, and even on occasion taken to outing non-supporters or ridiculing them, perhaps in an attempt at persuasion. Let me just say that I have nothing against Blyleven, and have been consistent in my non-support of him. My "no'' vote has nothing to do with the Internet campaign, which has only become apparent in Blyleven's final few years on the ballot, and appears to be effective, as Blyleven's totals have risen precipitously.
- Jon Heyman
After reading Heyman's column on si.com Monday late afternoon, my son Joe sent me the following text, "New Christmas gift request... bumper sticker that reads: 'My Dad is a zealot.'" I wrote back, "One Blyleven Internet detractor is such a zealot that he writes about why he is NOT voting for him every year."
Heyman released his Hall of Fame ballot on Twitter several days ago but devoted his entire column on Monday (sans his picks on the second page) to "Why I didn't cast a Hall of Fame vote for Bert Blyleven, again." Incredible. He mentions Blyleven specifically or refers to him in 24 of the 26 paragraphs that comprise nearly 2,000 words. By comparison, he writes one paragraph on Roberto Alomar, his top candidate; four paragraphs defending his selection of Jack Morris over Blyleven; and a few sentences on a separate page on each of his five other picks (Barry Larkin, Dave Parker, Tim Raines, Don Mattingly, and Dale Murphy).
I'd like to respond to the following excerpts from Heyman's column:
Heyman tries to use the fact that Blyleven has received "less than half the votes" against him, yet he himself is voting for Mattingly, Murphy, and Parker, none of whom has even sniffed 50 percent of the vote in a single year. In fact, the individual high among these three is 28.2% (Mattingly in his first year of eligibility in 2001). All three players were greats at their respective peaks but the truth of the matter is that the trio has been polling about 10-20 percent of the vote every year they have been on the ballot.
Here we go with "impact" and being "around as long as every player on the ballot" again. I tackled these obsessions two years ago.
"I saw him play his entire career."Congratulations, Jon. If you "saw him play his entire career," then so did I. But the truth of the matter is that neither one of us saw him play his entire career. In fact, nobody has seen Blyleven play his entire career. Not his parents. Not his wife. Not his kids. Not any one teammate. Not any announcer, writer, or team executive.
Like me, you may have been alive back then. Like me, you may have even seen him pitch many times. Like me, you may have watched him perform on TV. Like me, you may have even read about him in the newspapers or magazines when he was playing.
Unlike me, you covered Blyleven when he pitched for the Angels toward the end of his career. Unlike you, I umpired a game behind the plate that he pitched. In other words, I saw Bert's curveball, the one that Bill James and Rob Neyer ranked as the THIRD-BEST EVER in The Neyer/James Guide to Pitchers, up close and personal.
But, when it comes to judging Blyleven's career, none of these facts really matter all that much. You see, I never once saw Babe Ruth play. Or Ty Cobb, Honus Wagner, Christy Mathewson, or Walter Johnson. Or Tris Speaker, Rogers Hornsby, Lou Gehrig, or Joe DiMaggio. But I can still say with 100 percent certainty that all of these players are Hall of Famers. By the same token, I didn't need to see thousands of other players in action to know they weren't Hall of Famers. Being there is great. It's fun. It's memorable. But it doesn't mean you know who is and who isn't a Hall of Famer.
"It's not about stats...it's about impact."You gotta love this one. Shame on me. I have always been led to believe that stats lead to impact. I guess not. Rather than spending so much time on making the case for Blyleven via the numbers, maybe I should have emphasized the fact that Blyleven pitched for TWO World Championship teams. I won't mention that he was 5-1 with a 2.47 ERA in five postseason series, including 2-1 with a 2.35 ERA in those two World Series because "it's not about stats." According to you, "it's about impact." And, thanks to you, I have now come to realize that Blyleven had little or no impact on the Pirates winning the World Series in 1979 or the Twins winning it all in 1987.
There you go again with impact. You see, it's difficult to argue against impact. There are no numbers. Instead, it's all about feelings and beliefs and all those other intangible goodies that only certain people possess. Just close your eyes and relive the memories, however tainted they may be, of these, ahem, human beings!
Fame. I always love that one. Another touchy-feely qualification. Alomar, Larkin, and Parker. Now those guys were famous. Even though Blyleven won two World Championships, struck out more batters than all but four pitchers and threw more shutouts than all but eight in the history of baseball, completed the third-most 1-0 shutout victories ever and the highest total in 75 years, pitched a no-hitter, and had the greatest curveball of his era and one of the best of all-time, he wasn't famous. Or at least not in Jon Heyman's world.
Sheesh. I have shown otherwise numerous times. Just because Blyleven didn't win the American League Cy Young Award in 1973 doesn't mean he wasn't the best pitcher in the league. He led the AL in WAR (9.2), ERA+ (158), K/BB (3.85), and SHO (9). He ranked second in ERA (2.52), SO (258), BB/9 (1.86), and WHIP (1.12), third in K/9 (7.15) and CG (25), and fourth in IP (325) and HR/9 (0.44). That's one heck of a résumé, no? Nonetheless, he received one point and finished seventh in the Cy Young balloting that season. As I reported six years ago, "One voter out of 24 saw fit to pencil Bert's name into the third slot on the ballot. The other 23 writers ignored him completely. Instead, they voted for Jim Palmer #1, Nolan Ryan #2, Catfish Hunter (and his 3.34 ERA in a pitcher's ballpark) #3, John Hiller #4, Wilbur Wood #5, and Jim Colborn #6. Palmer had two more wins than Blyleven and an ERA that was 0.12 lower. Otherwise, Palmer had inferior stats across the board, including WAR (6.1), ERA+ (156), K/BB (1.40), SHO (6), SO (158), BB/9 (3.4), WHIP (1.14), K/9 (4.8), CG (19), IP (296.1), and HR/9 (0.49), yet he received 88 points, including 14 first-place votes. Go figure.
Did I mention that Palmer also received much better run and defensive support than Blyleven? The Baltimore Orioles scored 4.7 runs per game for Palmer while the Minnesota Twins scored 4.2 for Blyleven. The Orioles led the AL in Defensive Efficiency (.731) while the Twins (.696) ranked eighth out of 12 teams. Looked at it another way, Baltimore (119 FRAA) was 137 fielding runs better than Minnesota (-18). These fielding differences showed up in Palmer's and Blyleven's batting average on balls in play. Palmer had a .234 BABIP and Blyleven had a .292 BABIP. With an infield that included Bobby Grich, Mark Belanger, and Brooks Robinson, the O's (184) also turned a lot more double plays than the Rod Carew-Danny Thompson-Steve Braun Twinkies (147).
Look, if you're into performance, you take Blyleven. On the other hand, if you're like Heyman and care more about impact, you take Palmer because he was selected as the Cy Young Award winner.
As for "a series of seasons," Blyleven led the major leagues in Runs Saved Against the Average (RSAA) over four-consecutive, five-year rolling periods (1971-75, 1972-76, 1973-77, and 1974-78). As I highlighted last January, "Over the past 50 years, the five-year leaders have included Don Drysdale (1x), Sandy Koufax (3x), Juan Marichal (2x), Bob Gibson (2x), Tom Seaver (2x), Bert Blyleven (4x), Jim Palmer (1x), Steve Carlton (3x), Dave Stieb (5x), Roger Clemens (7x), Greg Maddux (5x), Pedro Martinez (4x), Randy Johnson (2x), Johan Santana (3x), and Roy Halladay (1x). While it may be too early to judge Santana and Halladay, 11 of the other 12 pitchers are either enshrined or will be enshrined (including several "inner circle" Hall of Famers). The only exception is Stieb, whose HOF case was derailed by a relatively short career."
The operative word here is "considered." While Blyleven "was never considered among the two best pitchers in the his league," he was one of the two best pitchers in his league three times as measured by WAR (including twice leading the league in that all-encompassing counting stat) and four times as measured by the rate stat ERA+. He was as overlooked and underappreciated during his playing career as he has been over the first 13 years of being on the Hall of Fame ballot.
There's that word "considered" again. Heyman can side with opinions and I'll side with the facts, thank you. The facts in this case tell us that Blyleven was one of the game's best pitchers during his career. I've given multiple examples of the facts already. As for "simply outlasting almost everyone else and pitching effectively into his 40s," that's not entirely accurate. Blyleven pitched only one season in his 40s and it wasn't very effective (8-12, 4.74 ERA, 84 ERA+ in 133 IP) if the truth be told.
This is not only misleading, but it's clearly a low blow. Blyleven led the league in home runs in 1986 and 1987 when he was 35 and 36 years old. He led the league in earned runs in 1988 when he was 37. Of note, Morris, whose HOF candidacy Heyman supports, gave up the second-most number of HR in 1986 and 1987 and was sixth in earned runs allowed in 1988. For what it's worth, Morris led the league in ER and BB, as well as wild pitches six times. All I'm asking for is some consistency in judging players.
Once again, Heyman looks for a reason *not* to vote for Blyleven. Morris ranks 770th all-time in MVP shares at 0.18. No on the guy at 936th. Yes on the guy at 770th. Yup, I get it.
Morris never finished in the top ten in MVP voting. If it doesn't apply to Morris, why should it apply to Blyleven? My goodness. Besides, Blyleven dominated in several seasons and was regularly among the very best. I didn't even know who Heyman was six years ago but this article could have been written just for him.
Now that is one strange compound sentence. While I'm glad that Heyman promoted Felix for the CYA, this point proves how illogical or biased he is when it comes to evaluating Blyleven. Hernandez was 13-12 in 2010. He won one more game than he lost, yet Heyman supported him as the best pitcher in the league whereas he won't vote for Blyleven because he only won 37 more games than he lost during his career. Bert's career W-L percentage? .534. Felix's 2010 W-L percentage? .520.
Heyman admits Morris' career totals aren't as good as Blyleven's. But, you see, with Morris, you just had to be there. I don't get it. You had to be where? If you were there, I was there. Maybe not literally. But I was paying close attention all along. Unlike you, I don't think that means all that much. I mean, did you see every game he pitched? If so, what did you think about this one? Or are you just referring to that one? How much better was that Game Seven performance than Mickey Lolich's 8 2/3 scoreless innings and 4-1 complete-game victory over Bob Gibson and the St. Louis Cardinals in Game Seven of the 1968 World Series? By the way, Morris and Lolich, both of whom were World Series heroes, had career ERA+ of 105 in a comparable number of innings. Did you ever vote for Lolich for the Hall of Fame? His impact was historic. But maybe you weren't there.
Who cares if he was the ace in those particular years? Blyleven "pitched very well in the postseason" by your admission. It doesn't matter what you call him. You think it's all about impact and human beings and fame and having to be there and being called an ace. I say performance trumps them all. And, in this regard, Morris was 7-4 with a 3.80 ERA in the postseason, including 4-2, 2.96 in the World Series. Blyleven was 5-1 with a 2.47 ERA in the postseason with better peripherals and 2-1, 2.35 ERA in the World Series.
Nice try. If you exclude Morris' last two seasons, he had an ERA of 3.73 (with a ERA+ of 109). By the same token, if you exclude Blyleven's last two seasons, he had an ERA of 3.22 (with a ERA+ of 122). No matter how you cut it, so to speak, Blyleven had a much better ERA and ERA+ than Morris.
As for "pitching to the scoreboard," Jay Jaffe, who was just elected to the Baseball Writers Association of America, debunked that nonsense in his recent annual review of the Hall of Fame cases of starting pitchers, linking to research by Greg Spira and Joe Sheehan that "has long since put the lie to this claim." Sheehan's conclusion? "I can find no pattern in when Jack Morris allowed runs. If he pitched to the score—and I don't doubt that he changed his approach—the practice didn't show up in his performance record."
Gosh, shame on me. I thought being consistently good and pitching for a long time were huge positives. In fact, in Blyleven's case, he ranks 13th all-time among pitchers in Baseball-Reference WAR with 90.1 because he combined quantity and quality like so few others. By comparison, Morris ranks 140th with 39.3. This stat would suggest that Blyleven was worth 50 more wins above replacement than Morris. Not that WAR is the be all and end all to performance measurement, but that gap is so wide that it would be virtually impossible to bridge via impact alone.
By the way, the four pitchers in front of and behind Blyleven in WAR? Greg Maddux Phil Niekro, Gaylord Perry, Warren Spahn, Randy Johnson, Christy Mathewson, Bob Gibson, Nolan Ryan, and Steve Carlton. The four pitchers in front of and behind Morris in WAR? Ed Reulbach, Dizzy Dean, Noodles Hahn, Carl Mays, Ted Breitenstein, Murry Dickson, Harry Brecheen, and Al Leiter.
Wow. That's really something. Blyleven finished with 287 wins and 242 complete games while leading the league at various times in shutouts (3x), strikeouts-to-walks (3x), innings pitched (2x), games started, complete games, and strikeouts, as well as WHIP and ERA+. Seems pretty straightforward to me. If Morris is a Hall of Famer, he needs to wait until after Blyleven has been inducted to be taken seriously. As Craig Calcaterra has said repeatedly, "You can vote for Jack Morris for the Hall of Fame. You can vote for Bert Blyleven for the Hall of Fame. You can also keep both of them out if you’re a small-Hall kind of guy. You cannot, however, vote for Jack Morris and not vote for Bert Blyleven."
I agree with Craig, which is another way of saying that if Heyman were intellectually honest and consistent, I wouldn't have a problem with him voting for Morris or not voting for Blyleven. To quote Craig, "There are no right and wrong Hall of Fame votes. There are right and wrong approaches to voting however." Well said, my friend.
Blyleven fell five votes shy of the Hall of Fame last year. If everybody who voted for him does so again, this should be the year as it appears that there may be enough voters who are reconsidering his candidacy to finally make it happen.
| Baseball Beat | December 20, 2010 |
And Then There Were Three
Phil Cavaretta (1916-2010) died of complications from a stroke on Saturday. Based on an Associated Press story that appeared on ESPN Chicago, Cavaretta also had been battling leukemia for several years but that disease was in remission according to his son Phil Jr. The elder Cavaretta was 94.
Cavaretta was signed by the Chicago Cubs at the age of 17 in 1934 and made his major-league debut that same year, playing seven games in September and going 8-for-21, including a homer in his first start to account for the only run of the contest. He broke his ankle in 1939 and 1940 but bounced back and was named the National League MVP in 1945 when he topped the league in AVG (.355) and OBP (.449) while leading the Cubs to the World Series.
The first baseman/outfielder served as the team's player-manager from 1951-53. After being fired by his hometown Cubs, he signed with the White Sox in May 1954 and played parts of two seasons on the South Side of Chicago before being released in May 1955. After his playing career was over, Cavaretta managed in the minors, coached and scouted for the Detroit Tigers, and wound up his baseball career as a batting instructor for the New York Mets' organization.
Cavaretta was the last surviving player from his debut season in 1934. Buddy Lewis of the Senators is now the only survivor from the 1935 season. As reported by Peter Ridges on SABR-L, Cavaretta was the only man alive who had appeared in a World Series in the 1930s. According to Who's Alive and Who's Dead, he was the 13th-oldest former major leaguer when he passed away.
In addition, Cavaretta was one of the last four living players mentioned in David Frishberg's 1969 classic Van Lingle Mungo. He is survived by Eddie Joost (born 1916), Johnny Pesky (1919), and Eddie Basinski (1922). A photo in the music video linked in the opening sentence of the paragraph would suggest that John Antonelli, a major-league pitcher from 1948-61, is also a survivor. I don't mean to imply that the lefthander is not alive today, but he was generally known as Johnny. The John Antonelli referred to in the song is more likely the infielder who played for the St. Louis Cardinals and Philadelphia Phillies in 1944-45.
Joost turned 94 last June. With Cavaretta's death, he becomes the 13th-oldest living player. He also is the only surviving member of the Cincinnati Reds team that won the 1940 World Series. Eddie had a fascinating career. The Baseball Library carries the following biography:
Joost became the Reds' regular shortstop in 1941 and committed 45 errors. After his 45 errors in '42 led the league, he was traded to the Braves. There, Joost suffered further ignominy in 1943, setting a record by hitting just .185, the lowest batting average ever for a player with 400 or more at-bats. He then retired voluntarily but gained a second life with the Athletics beginning in 1947. Though his hitting improved, he found a better way to reach base: walking. From 1947 through 1952, he walked more than 100 times a season, twice gaining more walks than hits. He was an All-Star in 1949 (reaching highs of 23 HR and 81 RBI), and again in '52, after having led AL shortstops in putouts four times to tie the league record. Joost was the A's manager in 1954 but led his untalented crew to a last-place finish.
Frishberg, an American composer, jazz pianist, and vocalist, will turn 78 next March. He immortalized 37 different ballplayers in his baseball hit, including Van Lingle Mungo four times (plus an extra Van Lingle for good measure) and five others twice.
Here are the lyrics to Van Lingle Mungo, a three-time All-Star pitcher for the Brooklyn Dodgers in the 1930s.
Heeney Majeski
Johnny Gee
Eddie Joost
Johnny Pesky
Thornton Lee
Danny Gardella
Van Lingle Mungo
Whitey Kurowski
Max Lanier
Eddie Waitkus
and
Johnny Vander Meer
Bob Estalella
Van Lingle Mungo
Augie Bergamo
Sigmund Jakucki
Big Johnny Mize
and
Barney McCosky
Hal Trosky
Augie Galan
and
Pinky May
Stan Hack
and
Frenchy Bordagaray
Phil Cavarretta
George McQuinn
Howard Pollet
and
Early Wynn
Roy Campanella
Van Lingle Mungo
Augie Bergamo
Sigmund Jakucki
Big Johnny Mize
and
Barney McCosky
Hal Trosky
John Antonelli
Ferris Fain
Frankie Crosetti
Johnny Sain
Harry Brecheen
and
Lou Boudreau
Frankie Gustine
and
Claude Passeau
Eddie Basinski
Ernie Lombardi
Huey Mulcahy
Van Lingle
Van Lingle Mungo
Following Johnny Sain's death in November 2006, Maxwell Kates wrote a guest column for Baseball Analysts, simply titled "Van Lingle Mungo." It highlights Sain, Van Lingle Mungo, and the other 35 players mentioned in the song.
Rest in peace, Phil Cavaretta. Long live Eddie Joost, Johnny Pesky, Eddie Basinski, Dave Frishberg, and the song Van Lingle Mungo.
| Touching Bases | December 16, 2010 |
More Observations on Pace
One month ago, Lucas Apostolereris explored how much time pitchers take in between pitches, and FanGraphs added pace to its player pages shortly thereafter. Dave Allen went on to analyze batter's pace and make some other observations. It's taken awhile for this PITCHf/x timestamp data to be mined, but I've finally decided to get my hands dirty with it.
Like Dave, the way I'm calculating pace results in a 22.4-second difference between pitches, which is slightly slower than the FanGraphs calculation. (FanGraphs' method excludes pickoffs, which I'm not sure I agree with. I've always felt that a pitcher is pitching slowly if he throws to first a bunch.) Dave found that two-strike counts are the most time-consuming. There's certainly something there, but even more significant might be the pitch sequence of the at-bat. On average, 20 seconds pass between the first and second pitches of an at bat, while 30 seconds pass between the 10th and 11th pitches.
| 1-2 | 19.7 |
| 2-3 | 22.2 |
| 3-4 | 23.2 |
| 4-5 | 24.3 |
| 5-6 | 26.0 |
| 6-7 | 27.4 |
| 7-8 | 28.2 |
| 8-9 | 28.7 |
| 9-10 | 29.0 |
| 10-11 | 30.0 |
Batters are more likely to step out of the box the deeper into the at bat they go, and pitchers take more time to determine about their pitch selection. There is no such clear trend in the relationship between overall pitch count and pace.
Pitchers start out blazing coming out of the gate. Many pitchers don't even think, but rather try to solely establish the fastball. Pitches 10-20 cover the most difficult part of the batting order, when it is also likely that there are runners on base, so the pace slows down dramatically. After that, the data smooths out, and pitchers slow down the further along they go.
Back in April, Mike Fast* used the timestamp data to check on why Yankees vs. Red Sox games take so long, and he found that the reason was more than simply batters and pitchers taking a lot of time between pitches. It turns out that the average time between innings is a little over two-and-a-half minutes, which can fluctuate depending on teams. I believe that the umpire, under directions to restart the game following commercial breaks, controls the time between innings. Home teams with a lot of nationally-televised games (Dodgers, Mets, Yankees, Braves) are those that take over 2:40 between innings, while others (Royals, Blue Jays, Athletics) take under 2:30.
Mike has also done a very cool study on pace and defense.
Mid-inning relief changes last on average 3:15. Interestingly, Colorado, where there is an average break length between innings, allows pitchers the most time to warm up at 3:29. It is notoriously difficult to pitch in Coors, so it would make sense for relievers to be given some leeway with warm-up time. In Oakland, mid-inning changes only last 2:54 on average. Furthermore, the incoming reliever can dictate when he resumes play. Mike Adams and, unsurprisingly, Jonathan Papelbon, are in a league of their own, as it takes them four minutes to pick up play. A few A's pitchers (Andrew Bailey, Brad Ziegler, Jerry Blevins) keep it well under three.
The average time between at bats is 50 seconds. Carlos Pena is slow.
Pitchers only spend 11 seconds between pitches when issuing intentional walks. Otherwise, the game moves most quickly following called strikes. Balls in the dirt result in a loss of 10 seconds as compared to regular balls. Fouls with the runner going result in a loss of 10 seconds as compared to regular fouls.
How else might a game's pace be affected?
| Baseball Beat | December 15, 2010 |
Another Historical Perspective of the Phillies New Big Four
With the announcement that the Philadelphia Phillies had signed Cliff Lee late Monday night, the baseball world began to contemplate whether a starting rotation consisting of Lee, Roy Halladay, Cole Hamels, and Roy Oswalt was perhaps the greatest in the history of the game.
When most of us think about the best pitching rotations, we tend to point to the Oakland A's of 2001-2003, the Atlanta Braves of the 1990s, the New York Mets of the 1970s, the Los Angeles Dodgers of the 1960s, the Cleveland Indians of the 1950s, or maybe the 1971 Baltimore Orioles if you're into wins.
In the Greatest Starting Rotations of All-Time, Andrew Johnson of Fanhouse writes, "Only 25 pitching staffs since 1901 have ever boasted four or more pitchers who qualified for the ERA title with an ERA+ equal to or greater than 120, according to Baseball-Reference.com." He highlights six rotations and includes a link to his Play Index findings.
At the Baseball Reference blog, Steve Lombardi ups the ante a bit, creating a post on teams with four starting pitchers with at least 30 GS and ERA+ of 130 or above. It's happened just once: the 1997 Atlanta Braves with Tom Glavine, Greg Maddux, Denny Neagle, and John Smoltz. He includes a link to his Play Index results as well.
Dave Cameron of Fangraphs uses Wins Above Replacement (WAR) totals for the past three years to determine where the Phillies Big Four stacks up in Best. Rotation. Ever? Halladay (21.5) ranks No. 1, Lee (20.9) No. 2, Hamels (11.9) No. 16, and Oswalt (11.2) No. 21 for a cumulative total of 65.5. The 1993 to 1995 and 1996 to 1998 Braves featuring Maddux, Glavine, Smoltz, and Steve Avery/Neagle totaled 56 and 66.8, respectively. Maddux's three-year totals exceeded Halladay's, Smoltz's '96-'98 run fell just shy of Lee's, Glavine's '93-'95 is slightly worse than and his '96-'98 is superior to Hamels', and the fourth starter of Avery or Neagle is worse than Oswalt's totals.
With respect to Avery and Neagle, Cameron adds, "That was part of what made that Braves run so spectacular. They kept swapping out guys behind The Big Three and getting high-level performances even with all the changes. There were times where they got equivalent production to what we might expect from Philly’s rotation in 2011, but they never had four guys who had established themselves at this level going into a season."
In conclusion, Cameron says:
If there’s a four-man rotation that has ever looked this dominant heading into a new year, I can’t find it. It is almost certainly in the discussion for the greatest four-man rotation of all time.
Taking a slightly different approach, my brother Tom forwarded to me the following table from Baseball-Reference's Play Index. It is a list of all the teams with four starting pitchers in the rotation generating at least four WAR while qualifying for the league ERA title. Seven teams made the cut, including the Braves in 1991 (without Maddux) and 1997. Aside from those Atlanta staffs and the 1967 Cincinnati Reds, you have to go back almost 100 years to find a 4x4 rotation.
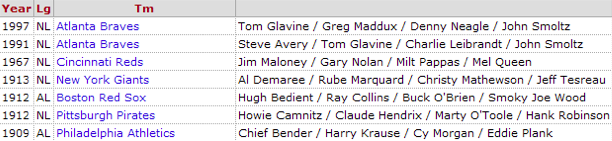
Note: Pitching WAR differs between Fangraphs and Baseball-Reference in that the former uses Fielding Independent Pitching (FIP) and the latter uses Sean Smith's defense-adjusted Run Average.
Wanting to drill down deeper to look at the individual and cumulative totals produced the next table.
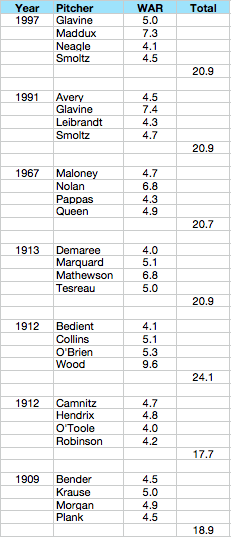
There are several interesting observations:
1. The 1912 Pittsburgh Pirates had four pitchers with at least four WAR but none with five. A very solid 1-4 but no real ace.
2. The 1909 Philadelphia A's had four pitchers with at least four WAR but none with more than five. These four starters, including Hall of Famers Chief Bender and Eddie Plank, had ERAs of 1.76 or below. It wasn't known as the Deadball Era for nothing. The league average ERA was 2.47. The league-wide run average was 3.44. Lots of errors back then. Despite the smaller gloves, the official scorekeepers held the fielders to a high standard.
3. The other five staffs all had at least one starter with a WAR of six or more. Of those five, two had three pitchers with at least five WAR.
4. The Braves, in a couple of different renditions, had the best starting four as measured by B-R WAR since the early part of the last century.
5. Led by Joe Wood, the 1912 Boston Red Sox had the most productive staff among those teams with 4x4 since 1900. With 9.6 WAR, Wood had the highest single-season total among all the pitchers on this list. Furthermore, the Red Sox had the highest four-man, single-season cumulative WAR at 24.1.
How does the Phillies staff compare to these all-time great rotations? Last year, the foursome produced 21 WAR (although not on the same team). Halladay had 6.9, Oswalt 5.1, Hamels 4.7, and Lee 4.3. Oswalt split his WAR among the Houston Astros (2.3) and the Phillies (2.8) while Lee split his among the Seattle Mariners (2.6) and Texas Rangers (1.7).
If these Philadelphia starters can repeat their 2010 performance, the Phillies could surpass the Braves and become the greatest four-man rotation since Smoky Joe and the 1912 Red Sox, at least as measured by Baseball-Reference's Wins Above Replacement.
| Around the Minors | December 11, 2010 |
Reviewing the 2010 Rule 5 Draft
The Rule 5 draft has lost some luster since the MLB Collective Bargaining Agreement was re-worked to allow teams an extra year of control before having to add minor league players to the 40-man roster or expose them to the draft. The 2009 Rule 5 draft was an absolute yawn. This year, though, teams were able to unearth a few gems.
1. Aneury Rodriguez, RHP (Houston from Tampa Bay)
As weird as it might sound, Rodriguez is probably talented enough to land on Houston's Top 10 prospect list for 2011. I recently completed Houston's list at FanGraphs.com and he'd probably slide in after Vincent Velasquez, who's out after Tommy John surgery. Rodriguez has the ceiling of a No. 3 starter and those types of prospects (sadly) are far and few between in the Astros system. The right-hander recently turned 23 and spent the majority of 2010 in triple-A where he posted a 4.04 FIP in 113.2 innings. He started 17 games and came out of the bullpen for another 10. Rodriguez' fastball ranges from 88-94 mph and both his secondary pitches - breaking ball and changeup - are average offerings right now. He should serve as a long man out of the Astros 'pen in 2011 but with some experience and good coaching he could reach his ceiling as a No. 3 starter.
2. Brad Emaus, 2B/3B (New York NL from Toronto)
Emaus was the one position player that I just didn't understand why he was left unprotected. As a Canadian, I cover Jays prospects a lot so I've been familiar with the infielder since he was drafted in 2007. Two years ago, I even wrote an article for the Toronto Sun newspaper that spoke highly of him. Now, Emaus does have some limitations - mostly on the defensive spectrum - but he projects to be a solid MLB utility player in the Scott Spiezio or Eric Hinske mold and can play both second base and third base, and could probably pick up first base pretty quickly too. I'm glad he's headed over to the National League where he has a chance to be more valuable. The organization will also have some pretty good scouting reports on him, as Special Assistant to the GM J.P. Ricciardi was Toronto's General Manager when Emaus was drafted out of Tulane University. The infielder spent the majority of 2010 in triple-A where he hit .298/.395/.495 in 309 at-bats. He's a stocky player with line-drive power and a good eye at the plate. Emaus has a nice quiet, open stance at the plate. He's not gifted with great bat speed and the swing occasionally gets loopy.
3. Joe Paterson, LHP (Arizona from San Francisco)
I love this pick for the Diamondbacks, more so than any other reliever they've picked up recently through free agency or trade. I've mentioned Paterson in a few articles both at FanGraphs.com and here at BaseballAnalysts.com suggesting that he'd be a perfect LOOGY in the Majors. His ceiling isn't huge, obviously, as a future Ron Mahay or Brian Shouse, but most teams are in need of a good left-handed reliever. Paterson, who throws with a sidearm angle, had a solid college career at Oregon State University and his minor league numbers have also been impressive. He had a solid showing in the Arizona Fall League after posting good numbers in 46 triple-A games in 2010. Paterson, 24, also has solid ground-ball numbers. Left-handed hitters batted .220 against him in 2010, while right-handers produced a batting average of .280. In '09 at double-A, lefties hit just .112. The year prior to that, they hit .108 in high-A ball.
4. Josh Rodriguez, SS/2B (Pittsburgh from Cleveland)
Like Emaus above, Rodriguez comes from a solid college baseball background and he appears to be near-MLB-ready with a modest ceiling as a utility player. Clubs made a bit of switch away from a Rule 5 trend that saw teams nab raw hitters with good speed and/or defensive abilities. Both infielders mentioned here are solid bats with questionable defensive skills. Rodriguez is not a MLB shortstop, but he should hold his own at either second base or third base. At the plate, he hit .293/.372/.486 in 364 triple-A at-bats in 2010 after missing much of the 2009 season to injury. He has a nice, compact swing, and he does a good job of keeping the bat level through the zone. His strikeout rates have been high throughout his career, but he gets on base at a good clip thanks to above-average patience (11.0% walk rate in '10). He'll provided excellent depth to the Pirates' 25-man roster in 2011, especially with Andy LaRoche and Delwyn Young gone.
5. Pedro Beato, RHP (New York NL from Baltimore)
The Mets club originally nabbed Beato out of a New York high school during the 2005 draft but was unable to come to terms with him. He attended junior college and was then picked up by Baltimore in the 2006 draft. He signed for $1 million. Beato's career was slowed by command issues, although he posted OK control numbers, including a walk rate of 2.87 BB/9 in 2010 at double-A. He was moved to the bullpen full-time this past year and flourished thanks to a more consistent fastball - both in terms of command and velocity. I have to admit that I was a little confused by Baltimore's approach to compiling its 40-man roster for the off-season. The club has one of the worst minor league organizations in terms of depth and it left three quality players unprotected - Beato, Ryan Adams, and Wynn Pelzer; all three could arguably show up as members of the organization's Top 15 prospects.
6. Mason Tobin, RHP (Texas via Chicago NL from Los Angeles AL)
Tobin was nabbed by the Cubs and then sold to Texas, an organization that is clearly hoping the right-hander can stay off the disabled list from here on out. He missed all of 2010 and pitched in just three games in ’09 and eight games in ’08. Tobin, 23, could be stashed on the DL for much of 2011 but it will significantly damage his future potential as he’s already lost two years of development time. From the Rangers’ perspective, though, it’s a worthwhile gamble as Tobin has shown a plus fastball and good slider. He has a three-quarter arm slot and throws with some effort, which helps to explain the health woes.
7. Robert Fish, LHP (New York AL from Los Angeles AL)
It's been a rough off-season for the Angels organization. After a miserable regular season, the club missed out on a number of key free agents (specifically Carl Crawford) and now it lost two pretty nice arms in the draft. Unfortunately, the club's minor league system just isn't that deep so it's a little shocking that both Tobin and Fish were left unprotected. I would argue that Anthony Ortega and Matt Palmer both had better chances of remaining in the organization than Fish or Tobin... even if they had been designated for assignment to get them off of the 40-man roster. There isn't much need to keep Ryan Budde or Freddy Sandoval on the roster, either.
Back to Fish. The southpaw will clearly have an uphill battle to win a spot on a club like the Yankees. Just 22, he split the year between high-A and double-A. He's battled some health issues and control problems throughout his five-year pro career. On the plus side, Fish has flashed some nice strikeout numbers in his career, including 10.20 K/9 in 42.1 innings in double-A. He posted an 8.93 ERA but his FIP was better at 5.40, in part due to a massively-high BABIP at .457. His ground-ball rates have been pretty average in his career. Fish's repertoire includes a good fastball at 88-92 mph, a curveball and a changeup. His body is maxed out from a projectability standpoint and he throws from a high three-quarter angle. He does a nice job of throwing his pitches all from the same arm slot but he does slow his arm down from time-to-time on the breaking ball.
Elvin Ramirez, RHP (Washington from New York NL): Ramirez was considered a lock to be lifted from the Mets in the draft because he has plus fastball velocity. It remains to be seen if his control is good enough for him to succeed in the Majors. He's with the right club to get a fair shot.
Jose Flores, RHP (Seattle from Cleveland): Flores posted some impressive numbers but it was in low-A ball and was also his first year in North America. The chance that he'll be able to stick - even with solid control for his age - is very slim.
Adrian Rosario, RHP (Baltimore from Milwaukee): To be honest, I don't get the interest in Rosario. He seems like a pretty run-of-the-mill pitcher. He posted solid but unspectacular numbers in low-A. When he's got his good command, he induces a solid number of ground-ball outs.
Nathan Adcock, RHP (Kansas City from Pittsburgh): Adcock spent a second straight year in high-A ball while displaying good control and a solid ground-ball rate. The right-hander has an average fastball, a plus curveball and a changeup. I'm a little surprised the pitching-starved Pirates would look the other way on this prospect.
Patrick Egan, RHP (Milwaukee from Baltimore): Egan is a tall right-hander that does a nice job of throwing on a downward plane, which helps him produce above-average ground-ball rates. He held up pretty well in the Arizona Fall League but may not strike out enough batters to succeed at the MLB level.
George Kontos, RHP (San Diego from New York AL): The former Northwestern grad has a big, strong pitcher's body but he got beat around in triple-A and the Arizona Fall League in 2010. He has the chance to be a long man in the bullpen - especially in San Diego. He's flashed OK stuff in the past but he's been haunted by inconsistencies and command issues.
Scott Diamond, LHP (Minnesota from Atlanta): This Canadian prospect doesn't have the best stuff but he induces a solid number of ground balls. He's a potential - and inexpensive - long reliever in the Twins' bullpen.
Cesar Cabral, LHP (Tampa Bay from Boston): Cabral is a southpaw that produces above-average ground-ball rates but he gave up a lot of hits in high-A ball in 2010. He had a BABIP-allowed of .391 and a very unlucky LOB-rate; Cabral had a favorable FIP of 2.60 (His ERA was 5.81).
Michael Martinez, IF/OF (Philadelphia from Washington): Martinez is extremely versatile, but he's a small player that doesn't produce much power at all and he doesn't walk nearly as much as he should given his offensive profile. He's a dime-a-dozen player.
Brian Broderick, RHP (Washington from St. Louis): Broderick is a big, strong pitcher who uses his size to help generate good ground-ball rates. He doesn't have much of a fastball, though, and succeeds with above-average control.
Lance Pendleton, RHP (Houston from New York AL): As a Rice University grad it should come as no surprise that Pendleton's early pro career was derailed by injuries. Healthy now for the past few seasons, he could settle in at the back-end of the rotation or as a middle reliever at the MLB level.
Daniel Turpen, RHP (New York AL from Boston): Turpen is your basic right-handed middle reliever and it will be a shock if he can break through into the Yankees' 2011 bullpen. There is nothing overly impressive about his resume and he wasn't all that good in the Arizona Fall League, despite an OK fastball.
| Baseball Beat/Change-Up | December 08, 2010 |
Back & Forth: Hot Stove Edition
We talked some baseball over email last night and decided to share our conversation as a post on Baseball Analysts. Hope you enjoy.
=========
Sully: Rich, you did a nice job covering the Red Sox Adrian Gonzalez acquisition but as a Boston fan it's definitely still at the forefront of my mind this Hot Stove season. What's most of interest to you now that we're a couple of days into the Winter Meetings?
Rich: Thanks, Sully. Adrian Gonzalez is likely to remain at the forefront of your mind at least through September… OK, October. Maybe even November if the World Series schedule repeats itself. As an Angels fan, I'd like to see the team pick up an impact player or two. Other than that, I guess we're all interested in the whereabouts of the big-name free agents like Cliff Lee, Carl Crawford, and Adrian Beltre, as well as guys like Zack Greinke.
Sully: What do you see the Angels doing? I have heard they're in big on both Beltre and Crawford, and I think Hisanori Takahashi is one of the nice under-the-radar signings of this offseason. I suppose ideally you'd like to see him inducing more grounders (just a 38.4 GB%) but other than that, he was excellent for the Mets in his first Major League season. What is your sense for Tony Reagins's other priorities?
Rich: Takahashi was a nice pickup. He gives the Angels a much-needed lefty in the bullpen and could also serve as an insurance for a fifth starter if Scott Kazmir continues to implode. I hope it's as a reliever though as Takahashi was much more effective coming out of the bullpen (2.04 ERA, 1.13 WHIP) than starting (5.01 ERA, 1.45 WHIP). A good guy to go to when the opposing team has two LHB out of three coming to the plate in an inning, such as, ahem, Adrian Gonzalez and David Ortiz or Joe Mauer and Justin Morneau. But the reality is that Takahashi is just a role player. The Halos need to do something big this offseason like sign Crawford and/or Beltre, if the club wants to compete for a championship next year. How do you see the Angels from the other coast?
Sully: Seems to me the rotation's fine, if not very good. The Angels biggest problem to me is that the once promising prospect core of Erick Aybar, Brandon Wood, Mike Napoli and Howie Kendrick has failed to produce a very good player much less a star or two the way many thought. Like you, I think they will need an impact position player or two in order to regain their standing atop the AL West. Speaking of Crawford, I was impressed with this article by Jayson Stark discussing the market for him in light of the Jayson Werth blockbuster. Like many others, my gut was to assume Crawford would make way more than Werth since he's the younger and better player. Stark makes the great point that just because one team - in this case the Nats - goes way above market for a player, that does not mean it necessarily resets the market. What's your sense for what it will take to lock up Crawford?
Rich: Prior to the Werth signing, I thought it would take more than five years and more than $100 million. Maybe 6 years/$108 million. Or something close to that. The Werth deal may not reset the market but, remember, it only takes one team to step up. With the big-market clubs like the Yankees, Red Sox, and Angels, among others, showing interest in Crawford, it's my guess that he will get a Werth-like contract. Maybe not more as some people now think but in that ballpark. If it means going 8 years and $160 million, I would say "No thanks." What do you think it will take to sign Crawford, Beltre, and Lee?
Sully: Tough to say. I will call it 6/115 for Crawford and 6/140 for Lee. As for Beltre, his market seems to be drying up a tad. Boston's out, and it would seem the O's are out as well now with Mark Reynolds in the mix. I bet he ends up around 5/60 or so.
Rich: My sense is that you might be light on all three. Unless Lee has his heart on signing with Texas, I believe it will take a seventh year to lure him to New York or one of the other rumored teams. It's also my belief that Beltre will do better than $12M per year.
Sully: When you look at the current FA class, do you think there might be some nice values to be had for teams that wait out the silly season and the biggest names going off the board? Maybe a Derrek Lee type?
Rich: I thought the Aaron Harang signing was a real bargain. The San Diego native might give the Padres 180-200 decent innings. Not bad for no more than $4 million. As to free agents who are currently available, I think Orlando Hudson is still a valuable second baseman. If O-Dog could be had on the cheap again and my club needed a second baseman, I'd ink him to another one-year deal for a few million bucks. I can't believe I'm saying this but Miguel Olivo might present a bargain on a one-year deal with an option for a second year. The glut of defensively challenged, offensive types is sure to leave a couple of players without a chair when the music stops. As such, there could be some values like Magglio Ordonez, Vladimir Guerrero, Hideki Matsui, and Jim Thome for a patient AL team in search of a DH.
Sully: I like the Harang signing too. He's still a decent pitcher but has problems when teams lift the ball for extra base hits. He's always had a below average gopher-ball rate. That should change at Petco given the size of the ballpark and Jed Hoyer's emphasis on outfield defense. As for other values, I think you have it exactly right. When a David Ortiz is under contract for $12.5 million, some of the names you mention will be shooting higher than what's realistic. That should leave a nice slugger or two hanging around late in the Hot Stove season.
Rich: How about Paul Konerko? He apparently wants as much or more as Adam Dunn in terms of both years and money. Does that seem reasonable to you? Do you think he will be back with the White Sox?
Sully: Dunn's three years younger and has had a considerably better long-term track record, which the Fangraphs wOBA, um, graph shows below. With that said, you could hardly blame a man for trying to capitalize on a huge contract year, which Konerko certainly had.

I think Konerko returns to the White Sox. This negotiation has a "Derek Jeter and New York Yankees" feel, with a revered player trying to get as much as he can while the team tries to stay as chained to reality as possible.
Rich: Switching gears here, I don't believe for a second that Boston is going to be satisfied with Jarrod Saltalamacchia as its starting catcher. C'mon now, who do you see the Red Sox adding between now and spring training?
Sully: I couldn't disagree with you any more. I think the Red Sox are very comfortable with the combo. That's not to say that they won't remain open to other options, but don't expect them to give up much in a trade or spend above market for anyone as though it remains a need. A Salty and Jason Varitek platoon actually looks somewhat formidable to me given the way Tek has hit righties the last few seasons.
Rich: If Boston doesn't sign Crawford, do you think the Red Sox and the Mets might reach a deal for Carlos Beltran? Seems to me that he would be worth a shot if New York picked up half of his $18.5M salary. I'm not sure Beltran can play center anymore, but his 30 walks and 39 strikeouts suggest he still has a good approach at the plate and the switch-hitter put up a line of .321/.365/.603 in September and October. If nothing else, the guy is intriguing.
Sully: Yeah, I think that's right - he is intriguing. Boston - perhaps bizarrely at this point given the way 2010 went on the injury front - has a lot of faith in its ability to gain an edge by performing strong medical due diligence. If the reports are true that Boston is in fact interested in Beltran, they must be very comfortable with his health. The other fourth outfielder options appear to be Josh Willingham or Magglio Ordonez, something Marc Normandin addressed yesterday at Red Sox Beacon.
Rich: What happens to Greinke? Do the Royals trade him or does he stay put for another year?
Sully: Sounds to me like they want to move him. Given the premium Lee seems poised to command, why the heck not? Who's the second best pitcher on the free agent market right now? Carl Pavano? Dayton Moore, particularly given some of Greinke's public comments, would be crazy not to consider dealing him in this market. I expect Toronto to be a key player there. Rightly, I think the Jays believe they have a real chance in 2011 and beyond.
Rich: Albert Pujols is interested in signing a long-term extension with the Cardinals. I'm setting the line at 10 years and $275 million, which is exactly what A-Rod received the last time around. Are you taking the overs or the unders?
Sully: Ooooh. Give me the under there, but he'll get a huge number.
Rich: Time for a lightning round. Match the player with the team. First up: Cliff Lee. I say Texas. You say?
Sully: Angels
Rich: Carl Crawford?
Sully: Red Sox
Rich: Adrian Beltre?
Sully: Angels
Rich: Circling back to A-Gon, I know you talked to Carson Cistulli at Fangraphs Audio about him. How many years and dollars do you think he will coax from John Henry?
Sully: The reports say 8 years (including 2010, I believe) and $155-$165 million.
Rich: Lastly, who owns the Dodgers a year from now? Frank, Jamie, their attorneys, the taxpayers, Bank of America, or … ?
Sully: I'll leave that one to my Southern California pal. You have the feet on the street!
| F/X Visualizations | December 06, 2010 |
Two Yankees Re-Sign
It was a crazy weekend leading up to the Winter meetings. Yesterday as I was planning and writing this post, the Adrian Gonzalez trade was off and then back on, in between the Nationals signed Jayson Werth to a huge deal, and then the Brewers and Blue Jays swapped Shaun Marcum and Brett Lawrie. Because of the timing of these developments I didn't include these transitions here, and anyway Rich had a great take on the Gonzalez deal and lots will be written about the moves anyway. Instead I focused on two smaller deals that happened over the past couple days: the Yankees re-signing Derek Jeter and Mariano Rivera. Thought neither was terribly surprising, I wanted to check in on each player's 2010 and what they portend for 2011 and beyond.
Derek Jeter
Of course there is a big back story in these negotiations, but in the end is played out pretty much as everyone expected it would. Jeter re-signed with the Yankees for three years and $51 million dollars. Probably a bit over the value he will give them, but in the ballpark for the Yankees and Jeter.
With Jeter signed we can turn our attention to his performance. Although 2010 was his worst year since his rookie season (both fWAR and brWAR see it that way), 2009 was his best year since 1999 (again fWAR and brWAR agree on that). No one expects another 2009-like, six-win season, but a rebound from 2010 is perfectly reasonable. A big question looms of how much longer Jeter can stay at short, but here I wanted to check in on his offense. His near career-worse WAR was driven by his first sub-100 RC+ (under league-average offense) since his rookie year.
The big culprit here was his career high 65.7% GB rate, that lead the league by a big margin, and was the highest full-season rate since Luis Castillo's 66.7% in 2007. Jeter has always hit a lot of ground balls, but hitting nearly two-thirds of his balls in play on the ground makes it very hard to hit for much power and results in tons of GDPs. Here I show Jeter's GB% base on pitch height for 2010 compared to 2007-2009, with standard error indicated.

For a given pitch height in the strike zone Jeter hit about 10% more ground balls in 2010 compared to the previous years. If Jeter is going to regain some of his offensive value it is going to have to start with getting his GB% back to a reasonable level.
Mariano Rivera
Rivera signed a two-year $30 million dollar contract, and said that it might be his last. There is not much new to say about Rivera on the pitchf/x front: no other player has been more pitchf/x-dissected . For those who might have missed a couple recent additions: a cool by-count breakdown by Albert Lyu, In Depth Baseball's look at Rivera, and a great New York Times video. The take-home message of all that is Rivera routinely hits both edges of the plate without hitting the heart against both RHBs and LHBs with his cutter. No other pitcher has his ability to pitch strikes without getting the fat of the plate.
Although his overall numbers have been amazing forever, his strikeout numbers took a little dip this year. Digging into it a little more it looks to me like the whiff rate on his cutter versus LHBs was the big culprit (17% from 2007 to 2009, just 9% in 2010). Here is what the whiff rate looks like based on the horizontal location of the pitch.
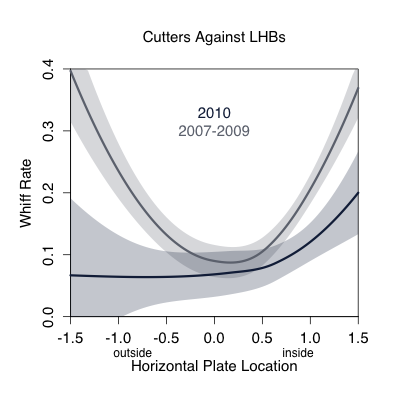
You can see how the whiff rate is high on the edges of the plate (where he pitches the most), but that in 2010 it was lower on both sides, and much lower away. This could just be noise, a one year fluke, but age has to catch up to everyone, even Rivera. But even if his strikeout rate is a little lower Rivera will most likely still be a great pitcher in 2011 and 2012 (as he was in 2010). His other skills are just too good: he doesn't walk many batters, gets lots of ground balls, and as a walking counter-example to DIPS has the ability to depress his BABIP and HR/FB (career rates of .273 and 6.3%).
So as expected going into the offseason Jeter and Rivera re-signed with the Yankees, and anything else would have been just wrong. Now we will see how these two aging Yankees perform over the next couple years.
| Baseball Beat | December 04, 2010 |
News and Views: The Adrian Gonzalez Trade
News: The Red Sox and Padres have reportedly agreed to a deal in principle that will send first baseman Adrian Gonzalez to Boston in exchange for three prospects — pitcher Casey Kelly, first baseman Anthony Rizzo, and outfielder Reymond Fuentes — plus a minor league player to be named later.
Views: While it's difficult to not like the trade from the perspective of the Red Sox, this agreement may be one of those deals that truly benefits both teams. There was no way that the Padres were going to re-sign Gonzalez before, during, or after the 2011 season. Therefore, it makes sense that San Diego GM Jed Hoyer would try to move him sooner rather than later. Hoyer and AGM Jason McLeod worked under Boston GM Theo Epstein for years and know the Red Sox talent as well as anyone.
Kelly, Rizzo, and Fuentes were ranked as the first-, third-, and sixth-best Red Sox prospects by Baseball America last month. All three were projected to be part of Boston's starting lineup in 2014 (with Kelly and Rizzo reaching the majors no later than 2012 by most estimates). According to Baseball America, Kelly had the best curveball, Rizzo the best power, and Fuentes the best athlete in the system.
As touted as this threesome may be, I would have expected San Diego to hold out for either Jose Iglesias or Ryan Kalish as the fourth player in the puzzle. Instead, it appears as if the PTBNL is not on the 40-man roster and is eligible for the Rule 5 Draft next week. Look for this player to be nothing more than a throw-in, perhaps a mid-level minor league pitcher whose upside might be as a major league reliever.
Meanwhile, Gonzalez is a monster. The lefthanded-hitting slugger ranked fifth in on-base percentage (.393) and times on base (271), sixth in total bases (302) and runs created (119), seventh in on-base plus slugging (.904), and ninth in slugging average (.511) in the National League while playing in the least-friendly home ballpark for hitters in the majors. His ballpark-adjusted OPS (or OPS+) ranked third in the league at 152, trailing only 2010 MVP Joey Votto and three-time MVP Albert Pujols.
For proof as to how much Petco Park has damaged Gonzalez's stats, look no further than his career record at Petco and on the road.

The above splits may not even tell the whole story. You see, Petco is death on lefthanded sluggers. According to the Bill James Handbook, from 2008-2010, Petco Park has produced park factors of 87 for AVG and 59 for HR (with 100 equivalent to the MLB average), meaning it reduces the former by 13 percent and the latter by 41 percent for LHB. By comparison, Petco's PF were 89 and 96 for RHB.
Despite the ballpark handicap, Gonzalez ranked as the most productive opposite-field hitter last season, according to our own Jeremy Greenhouse. His inside-out swing is a perfect fit for Fenway Park.
Check out Gonzalez's 2010 spray chart at Petco Park, then take a look at Fenway's dimensions. He pulls the vast majority of his ground balls but hits the bulk of his fly balls to the opposite field, which should be just what the doctor ordered in Boston.
Petco Park
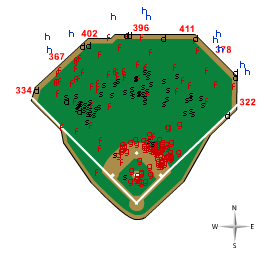
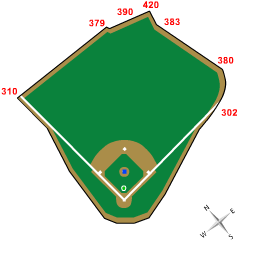
Courtesy of River Ave Blues, here's Gonzalez's spray chart overlaid onto Fenway Park (h/t Patrick Sullivan).
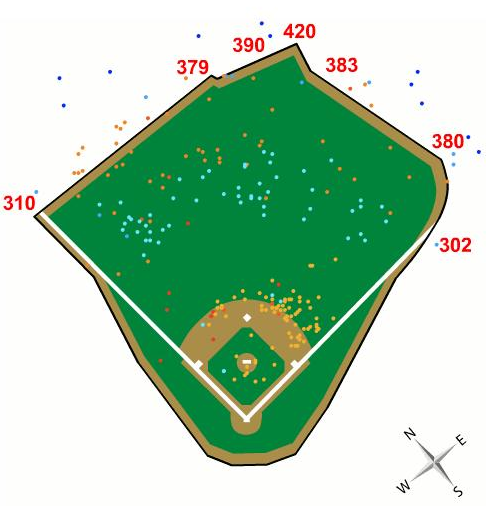
I count 30 home runs. In 81 home games. With 14 fly outs turning into four baggers. Ten of those fly-outs-would-be-home runs were hit to straightaway left field. Whether Gonzalez slugs 30 or 25 or even 20 HR at Fenway, the impact is going to be huge as Adrian has averaged 11-12 jacks at Petco since joining the Padres in 2006. Add the 21 HR he has averaged on the road during this period and it doesn't take too much imagination to project the newest Red Sox banging 40 or more homers in each of the next few seasons.
We can also view Gonzalez's home *and* road taters via HitTracker. Thirteen of his 31 HR were hit to left field, a phenomenal rate for a lefthanded batter. The image on the right displays the location of all home runs at Fenway Park last year.
![]()
![]()
Gonzalez looks like a pretty good fit for Fenway, no? Importantly, he doesn't turn 29 until next May. While he had shoulder surgery in October, he is expected to be fully recovered by the time the 2011 season opens. You can be sure that the Red Sox put him through a full physical this weekend and wouldn't proceed with the trade if management had any doubts about his health.
In addition to the exam, the Red Sox have been given a negotiating window by MLB to work out an extension with Gonzalez. If it's true that he wants a Ryan Howard-like, 5-year/$125M contract, I would combine the last year of his current deal that pays him $6.2M into a new 6-year/$132M pact that allows him to earn an average of $22M right off the bat.
Should the Red Sox not sign Gonzalez and proceed with the deal anyway, the organization gets his services at a discount of $15M-$20M in 2011 plus two valuable picks in the 2012 draft for the loss of a Type A free agent. As a result, short of Gonzalez suffering a major injury after signing a long-term contract, I don't see how Boston can lose.
San Diego might win, too. Maybe in a big way. Only time will tell. But the Padres could lose if the three prospects don't pan out.
| Touching Bases | December 04, 2010 |
Thoughts on In Depth Baseball
I like baseball heat maps. Really like them. They have captured the heat map that is my heart. I feel I should get that out of the way before I provide my thoughts on In Depth Baseball, TruMedia's baseball analytics platform.
During the 2010 postseason, I became aware of a new baseball analytics blog that specialized in such heat mappery. Behind the blog was one Rafe Anderson. Anderson had been a Boston Red Sox employee for six years before moving to TruMedia Networks, where he holds the titles of President and CEO. Now, Anderson has, along with programmer Jeff Stern, developed an analytics platform being marketed to MLB teams. I've had the opportunity to speak with Anderson on a couple of occasions, and he was generous enough to offer me a demo of In Depth Baseball (IDB).
IDB enters the marketplace in the same year as Bloomberg Sports (BBG). As they are in direct competition, I thought it would be natural to start by comparing IDB to BBG. Admittedly, I have had little experience with BBG.
BBG has a far sleeker layout than IDB. Here, take a look at screenshots of leaderboards from BBG and IDB. But IDB prides itself on not being "flashy," a possible dig at BBG's Flash-based platform. Consequently, IDB runs much more smoothly than BBG, while potentially at the same time making more sophisticated computations.
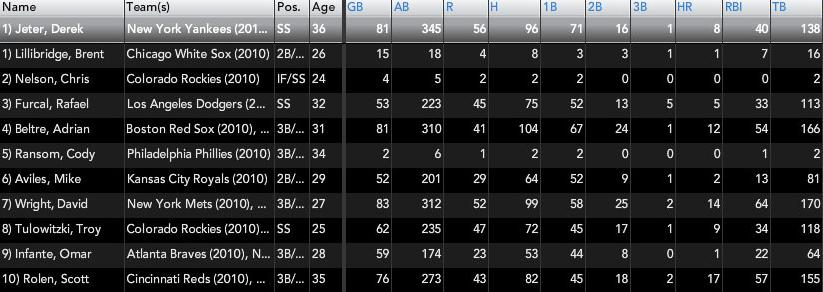
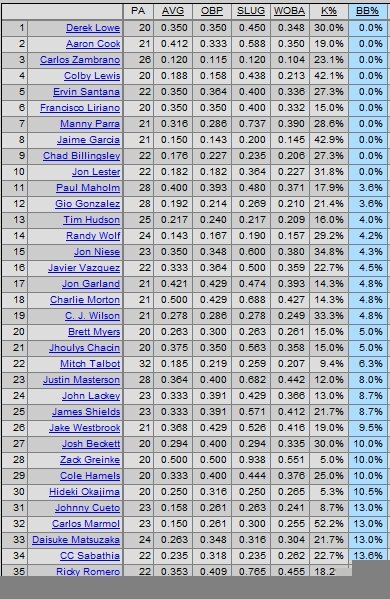
Now we arrive at the heat maps, a department that sets IDB apart from any platform I've seen before. Let's say you want to see the best contact hitters in the league. You go to the leaderboard and sort by contact rate, just as you would do on FanGraphs or anywhere else. But meanwhile, you can see an adjacent heat map showing the league average contact rate by strike zone location. And then, if you want to break that down into splits, such as LHBs vs. LHPs, both the leaderboards and heat maps update instantaneously. Furthermore, the heat maps are interactive in that you can isolate zones you want to look at by dragging your mouse into a certain area. After that, you can see who the best player in the league is in that zone, click on his name, and be taken to his player page, where the chosen filters remain constant. Other heat maps that I'm aware of are created in R, and it would take, conservatively, over a minute to process that much data. But it's not like the R ones even look any better than IDB's. The explanation I've been given is that Stern custom developed his own program, borrowing some fancy techniques that are used by chemical engineers. Well it's great, whatever it is. You can find quality heat mapping using IDB here and here.
Where IDB's heat maps sometimes fail are with smaller samples. For example, check the in play slugging heat maps used here. It's impossible to tell whether the observed trends are anything more than noise. Anderson says that the heat maps consider statistical significance, but from my experience, I've found that determining the right smoothing parameters is often more art than science. I would rather have an over-smoothed heat map than an under-smoothed one, as a heat map that shows no trends will at least tell you the player's mean performance, whereas a heat map with too much noise can lead you to draw false conclusions. It might be a failing of the analyst more so than the system to draw conclusions from such heat maps, because when you're looking at individual players, you probably want to choose metrics that stabilize quickly, like contact rate, called strike rate, or pitch frequency. But for analysts who don't regularly work with this sort of data, it would help if the smoothing parameters were refined for metrics such as in play slugging, which will rarely have a large enough sample to be highly consistent for individual players.
While the heat map is the bread and butter of In Depth Baseball, I feel that the most important part of any database system is how well it integrates video. Just as you can click on a player's splits to view different heat maps or spray charts instantaneously, his pitch-by-pitch log also updates. I don't think I can overstate how strongly I feel that every team should be using something more sophisticated than BATS to view video, and IDB obviously qualifies as a solution. The problem is that the pitches aren't directly linked to video streams, and instead, one must select certain pitches to a queue before watching them. If you want, you can pull up video of all Ryan Howard vs. LHP off-speed pitches in the last two years, but it would take a lot of clicks. I think it would make more sense if every video from the pitch log started on the queue, and then if you wanted to filter from there by using the splits section, videos would subsequently be removed.
I was highly impressed by the video quality, an area where IDB truly is "flashy." The Flash Player allows one to use slow motion, go frame by frame, or even change camera angles if multiple ones are available. I'm sure the playlists can be exported easily to hard drives if scouts don't want to come up with them on their own.
Bloomberg Sports holds an agreement with MLBAM, but IDB is fully independent outside of its team partnerships. Therefore, IDB has no license to video, and must borrow from teams. IDB has been able to work around this, as one thing Anderson stresses is that they use an Open API. You might be able to infer what that means, but from the TruMedia site, "This enables our partners to seamlessly integrate MLB analytics with relevant pitch by pitch video play lists within their own customizable user interface. Most importantly it allows organizations to keep their algorithms and metrics confidential." IDB has tools to incorporate HITf/x data or any other advanced data.
IDB already has an impressive advisory board, which gives them saber cred. I wouldn't be surprised if the fine folks at Complete Game Consulting have already played a hand in developing some of IDB's more advanced metrics. They have incorporated the "paint" set of metrics I believe to have been invented by Dan Brooks. IDB features "expected" values, too, and although I'm not quite sure how these are calculated, any metric with the word expected before it grabs my attention.
Another big thing is their "PZX" and "PVX" values, which measure angular velocity at the plate. They sound like something Matt Lentzner and Mike Fast discussed at this year's PITCHf/x summit, and if if I understand PVX and PVZ correctly, they could be the future way we measure movement (from the batter's point of view as opposed to the ball's). In addition, there are PVX vs. PVZ heat maps, so you can break down players by pitch movement the same way as by pitch location.
Alongside player heat maps are standard spray charts. The spray charts unfortunately use Gameday data, showing where the ball was picked up as opposed to where it was hit. Though you can mouse over a single hit to see the pitch details and video of it, for some reason you can't isolate zones like you can with the heat maps. So if I don't have the option of seeing video of all of a player's ground balls to the right side of the infield. It would make sense for IDB to add this feature.
There are other tools besides the league leaderboards and player dashboards, which contain the spray charts, heat maps, and video. One section which I didn't spend much time on is the "graphs" section, where you see a bunch of line graphs: a pitcher's fastball usage over the course of the season; a batter's contact rate by pitch velocity; a frequency distribution of a batter's ground ball angle. Pretty much any stat in line graph form. There's also a "comparisons" section, where you get an assortment of a player's heat maps side by side, such as how he does in different counts or by pitcher/batter handedness.
According to Anderson, umpire reports will be launched for the 2011 season, and they plan to venture into defense eventually as well.
While Bloomberg employs a team of programmers in research and development, Stern mostly by himself has created an incredibly powerful and efficient tool. Now, I've been wildly blown away by every database platform I've come across, but IDB certainly exceeds what is out there at all but a handful of MLB teams. What I could see making IDB so attractive to teams is that it is web based, and therefore available at all times. IDB looks fantastic on the iPad (I don't own one, so I guess everything I've seen on an iPad looks fantastic). Imagine watching a game in real time with iPad in hand and taking one click to instantly update a set of heat maps based on a change in the count or batter. So far, according to the Sports Business Journal, IDB calls the Padres and one other undisclosed team their clients. I have little doubt that IDB will continue to expand into a number of front offices, and with the news that TruMedia will be collaborating with Sportvision to provide MLB clubs with a minor league analytics platform, I am confident that the product will be that much better come Opening Day. I just hope that by then I'll still have the chance to see what IDB has had in store.