Rich Lederer • Baseball Beat
Patrick Sullivan • Change-Up
Jeremy Greenhouse • Touching Bases
Dave Allen • F/X Visualizations
Sky Andrecheck • Behind the Scoreboard
Marc Hulet • Around the Minors
Al Doyle • Past Times
Retired Uniforms:
Bryan Smith • WTNY
Joe Sheehan • Command Post
Jeff Albert • The Batter's Eye
RSS Feed
Home
*Examining the Past, Present, and Future*
Lineup Card
Recent Entries
» Putting Together a Reality Team
» Historical Hall of Fame Vote Comparisons: 2012
» An All-Christmas Team
» The New-Look Angels
» John Denny: The Forgotten Cy Young Award Winner
» Money Isn't Everything
» What Would It Take to Hit .400 in the 21st Century?
» Halos Heaven
» Brandon McCarthy's Breakout Season
» Link-o-Rama
» Historical Hall of Fame Vote Comparisons: 2012
» An All-Christmas Team
» The New-Look Angels
» John Denny: The Forgotten Cy Young Award Winner
» Money Isn't Everything
» What Would It Take to Hit .400 in the 21st Century?
» Halos Heaven
» Brandon McCarthy's Breakout Season
» Link-o-Rama
Best of Baseball Beat
Abstracts From the Abstracts
1977 Baseball Abstract
1978 Baseball Abstract
1979 Baseball Abstract
1980 Baseball Abstract
1981 Baseball Abstract
1982 Baseball Abstract
1983 Baseball Abstract
1984 Baseball Abstract
1985 Baseball Abstract
1986 Baseball Abstract
1987 Baseball Abstract
1988 Baseball Abstract
1978 Baseball Abstract
1979 Baseball Abstract
1980 Baseball Abstract
1981 Baseball Abstract
1982 Baseball Abstract
1983 Baseball Abstract
1984 Baseball Abstract
1985 Baseball Abstract
1986 Baseball Abstract
1987 Baseball Abstract
1988 Baseball Abstract
Bert Blyleven Series
Meeting Up and Hanging Out with Bert
The Results Are In And...
Aficionado Heavily Invested in Blyleven
Latest on Blyleven's Chances for the HOF
The Internet Zealot Responds
400 Down and 5 to Go...
Bert Be Home By Eleven?
Blyleven's Forgotten Season (1973)
HeyMan, Your Comments Don't Hold Water
The Waiting is the Hardest Part
Another Addition to the Blyleven Series
Search for the Truth
As Dominant as His HOF Contemporaries
Listen, Buster
A Larger Step for Blyleven
Answering the Naysayers (Part Two)
Another Small Step for Blyleven
Q&A: Blyleven on the Twins
The Majority Rules, Right?
It's All Dutch to Some
The Hall of Fame Case for Bert Blyleven
Q&A: Blyleven on Felix Hernandez
Clemens Rocketing Up Charts
Poz: An Interview With a KC Star
A HOF Chat with Tracy Ringolsby
Up Close and Personal
A Peek Into the Mind of a HOF Voter
Answering the Naysayers
It's That Time of the Year (Again)
"If Cooperstown is Calling..."
The Bert Alert
One Small Step for Blyleven...
Only the Lonely
Exclusive Interviews
Lee Sinins
Alex Belth
David Pinto
Will Carroll
Mike Carminati
Aaron Gleeman
Joe Sheehan
Jay Jaffe
Jeff Peek
Tracy Ringolsby
Joe Posnanski
Bill James Part I, II, III
Jon Lalonde
Chuck Tiffany
Dayn Perry
Fay Vincent
Nate Silver
Alex Belth
David Pinto
Will Carroll
Mike Carminati
Aaron Gleeman
Joe Sheehan
Jay Jaffe
Jeff Peek
Tracy Ringolsby
Joe Posnanski
Bill James Part I, II, III
Jon Lalonde
Chuck Tiffany
Dayn Perry
Fay Vincent
Nate Silver
Bullpen
Rich Lederer
The Odd Couple (with Alex Belth)
The MostUnder Over Underrated Player in Baseball (with Brian Gunn)
Three Wise Men (roundtable by Alex Belth)
Infrequently Asked Questions (interview with Matt Welch)
Interview (Orioles Think Tank)
Bernie and the Yanks (Bronx Banter)
Hope and Faith: How the LAA Win the World Series (Baseball Prospectus)
NL West (The Soul of Baseball)
Greatest Living Hitter? (Sports Illustrated)
Roundtable: 2008 HOF Ballot (Armchair GM)
The Most
Three Wise Men (roundtable by Alex Belth)
Infrequently Asked Questions (interview with Matt Welch)
Interview (Orioles Think Tank)
Bernie and the Yanks (Bronx Banter)
Hope and Faith: How the LAA Win the World Series (Baseball Prospectus)
NL West (The Soul of Baseball)
Greatest Living Hitter? (Sports Illustrated)
Roundtable: 2008 HOF Ballot (Armchair GM)
Patrick Sullivan
Designated Hitters
David Bromberg (Q&A: John Denny)
Mark Armour (H. Killebrew and Versatility)
Joe Lederer (Soundtrack of a Prospect)
David Bromberg (Clemente's Autograph)
David Bromberg (Woody Fryman)
D. Baumstein (WAR Against Age: Pitchers)
Doug Baumstein (The WAR Against Age)
Doug Baumstein (A Lifetime on the Road)
John Fraser (Pick Six)
Mark Armour (How to Score More Runs?)
Bill Parker (What Opening Day Tells Us)
Stan Opdyke (Pat Rispole)
Chris Jaffe (Evaluating Baseball's Mgrs)
Stan Opdyke (Baseball Radio in NYC, 1953)
A. Nathan (Performance of Baseball Bats)
Michael Weddell (Edgar Martinez/HOF)
Jon Weisman (100 Things Dodgers Fans...)
Stan Opdyke (Connie Mack and Vin Scully)
Eric Walker (Evaluating Run Production)
Brent Mayne (The Intangibles of Catching)
Chris Moore (Best Fastballs in Baseball)
Dave Baldwin (The Batter’s Brain)
Shawn Haviland (Ivy League to MLB)
Larry Granillo (Walking Off)
Rob Iracane (Solo HR Won't Break You)
Tommy Bennett (Charm of AM Radio)
Harry Pavlidis (Johan Santana's Fast Start)
John Walsh (WAR and Remembrance)
Eric Walker (Precisely Inaccurate)
Bob Timmermann (As They See 'Em)
Geoff Young (Unicycles and Delusions)
Baseball Analysis at Tufts (Groundballers)
Baseball Analysis at Tufts (GB Out Rates)
G. Rybarczyk ('09 Hit Tracker Projections)
Joe Lederer (Curt Schilling/HoF)
Conor Gallagher (Hall of Fallacies)
Chris Green (Jim Rice, HoF, the Numbers)
Shawn Hoffman (Baseball's Bear Mkt?)
Paul Anthony (Manny Syndrome)
Ross Roley (World Series Odds)
B. Timmermann (Catcher's Interference)
R.J. Anderson (Waiting the Hardest Part)
Maury Brown (Cubs, MLB, and Cuban...)
Myron Logan (Dee-Fense, Dee-Fense)
Craig Calcaterra (Frivolity, Part I, Part II)
Chad Finn (Ode to Baseball Cards)
David Cameron (Mariners Foibles)
Chris Dial (Chipper Jones)
Pat Lederer (Memory Lane)
David Appelman (Clutch Pitching)
Bob Rittner (DH)
Jonathan Mayo (Roger Clemens)
Lisa Winston (My Son-in-Law...)
Russ McQueen (The Yellow Hammer)
Bob Rittner (I'm OK, You're OK)
Mark Armour (In Defense of the HOF)
Pat Jordan (Friends)
Dan Levitt (Analysis of Terry Ryan)
Doug Baumstein (Trading Econ 101)
Ross Roley (Runner's Reluctance II)
Ross Roley (Runner's Reluctance I)
Mark Armour (No-Longer Lovable Sox)
Bruce Regal (Stealthy and Wise)
Brian Gunn (Roid Monster)
Current/McEvoy (Value of the SB)
John Rickert (Sinister Thefts)
Nate Silver (Sabermetrics)
David Vincent (Home Run Production)
Joe P. Sheehan (Enhanced Gameday II)
Mark Armour (An Ode to Sport)
David Gassko (All-Time Worm Burners)
Joe P. Sheehan (Enhanced Gameday)
John Walsh (When Titans Clash)
Fox/Williams (Quantifying Coaches II)
Fox/Williams (Quantifying Coaches I)
Jacob Luft (Bull Durham Rant)
Chad Finn (Strat-O-Matic)
Lisa Winston (Rotisserie Baseball)
Dave Studeman (Baseball Stats)
Steve Treder (Roger Craig)
Marc Normandin (Jeff Bagwell)
D. Appelman (Expanding Strike Zone)
Jeff Sackmann (Worst MiL Defenders)
Jeff Sackmann (Best MiL Defenders)
Maxwell Kates (Van Lingle Mungo)
David Appelman (Pitch Location)
Kent Bonham (Danny Ray Herrera)
Glenn Stout (Two Baseball Poems)
Bruce Regal (The Challenge Round)
Mark Lamster (Barry & Ty)
Geoff Young (NL West)
Tom Lederer (The Ryan Express)
Brian Erts (Great Leap Forward)
David Pinto (Parity and the N.L.)
Jacob Luft (Fathers and Daughters)
Jamey Newberg (Pete's Sake)
Jeff Albert (A. Jones Swing Analysis)
Jeff Albert (A-Rod Swing Analysis)
Keith Law (Death, Taxes, and Waivers)
Peter Abraham (Tales of Torre Tales)
Larry Borowsky (Let 'er Rip II)
Dan Levitt (Empirical Analysis of Bunting)
Jonah Keri (If I Met Warren Cromartie...)
Bob Klapisch (War Stories)
Bob Timmermann (John F. Kennedy HS)
Kent Bonham (Aluminum Adjustments)
Al Doyle (More Than Superstars)
Ross Roley (Instant Replay)
David Vincent (Barry Bonds Homers)
Chad Finn (Our Favorite Obscurities)
Bill Deane (1979 NL MVP)
Mark Armour (Rise/Fall of Artificial Turf)
Jeff Angus (Wally Moon Camp)
David Berri (Money and Baseball)
Larry Borowsky (Baseball w/o the #s)
Derek Zumsteg (The Irrational Market)
David Regan (Free Agent Contracts)
Peter Schmuck (Steroids and the HOF)
David Appelman (Pitchers, Pitch by Pitch)
Dan Fox (Swinging, Taking, Fouling, Etc)
Patrick Sullivan (Study of NYY CF/BOS LF)
Will Leitch (Baseball Journalism)
Jeff Sullivan (Pitcher Release Points)
Steve Treder ('69-'70 Giants)
Maury Brown (Charlie Finley)
John Brattain (Bob Johnson)
Bob Klapisch (The Case for Bert Blyleven)
Jeff Peek (Pride and Prejudice)
Dayn Perry (Bert and Warren)
Rob Neyer (If Don Sutton Was Great...)
Lisa Winston (Minor League Memories)
Alex Belth (Otis Redding Was Right)
David Cameron (Long Live the King)
Jeff Angus (Baserunning Study)
Bert Blyleven (Baseball Playoffs)
Boyd Nation (Not a Prospect List)
James Click (Batters-Baserunners Study)
Jeff Shaw (Why I Love Baseball)
David Gassko (BIP/BFP Fielding Study)
Jay Jaffe (Milwaukee Sausage Race)
Jamey Newberg (Remember When)
Bob Klapisch (Press Box to the Mound)
Dan Levitt (Predictive Value of BB)
David Vincent (Official Scorer)
Jon Weisman (Rick Monday)
Larry Borowsky (Let 'er Rip)
Will Carroll (Fictional Short Story)
Bob Timmermann (Japanese Baseball)
Cyril Morong (Best Pitching Seasons)
Sean Forman (Monte Carlo Win-Loss)
Brian Gunn (My Little Blue Book)
Joe Lederer (My Dad and Baseball)
Bill Deane (Bob Gibson, 1968)
Mark Armour (1977 Yankees)
Darren Viola (Retrosheet)
David Pinto (RFK)
Dayn Perry (Brave Heart)
Matt Welch (Dave Hansen)
Kevin Kernan (Jack McKeon)
Tom Lederer (Dodgers Road Trip)
Steve Lombardi (Slider)
Studes (Picturing Baseball)
Mike Carminati (Luck of the Drawl)
Eric Neel (Vin Scully)
J.C. Bradbury (Leo Mazzone)
John Sickels (Bill James)
Search Baseball Analysts
Archives
By Category:
Around the Majors Content Only
Around the Minors Content Only
Baseball Beat Content Only
Baseball Beat/Change-Up Content Only
Baseball Beat/WTNY Content Only
Behind the Scoreboard Content Only
Change-Up Content Only
Change-Up/Around the Majors Content Only
Command Post Content Only
Crunching the Numbers Content Only
Designated Hitter Content Only
F/X Visualizations Content Only
Past Times Content Only
Saber Talk Content Only
The Batter's Eye Content Only
Touching Bases Content Only
Weekend Blog Content Only
WTNY Content Only
By Month:
February 2012
January 2012
December 2011
October 2011
September 2011
August 2011
July 2011
June 2011
May 2011
April 2011
March 2011
February 2011
January 2011
December 2010
November 2010
October 2010
September 2010
August 2010
July 2010
June 2010
May 2010
April 2010
March 2010
February 2010
January 2010
December 2009
November 2009
October 2009
September 2009
August 2009
July 2009
June 2009
May 2009
April 2009
March 2009
February 2009
January 2009
December 2008
November 2008
October 2008
September 2008
August 2008
July 2008
June 2008
May 2008
April 2008
March 2008
February 2008
January 2008
December 2007
November 2007
October 2007
September 2007
August 2007
July 2007
June 2007
May 2007
April 2007
March 2007
February 2007
January 2007
December 2006
November 2006
October 2006
September 2006
August 2006
July 2006
June 2006
May 2006
April 2006
March 2006
February 2006
January 2006
December 2005
November 2005
October 2005
September 2005
August 2005
July 2005
June 2005
May 2005
April 2005
March 2005
February 2005
January 2005
December 2004
November 2004
October 2004
September 2004
August 2004
July 2004
June 2004
May 2004
April 2004
March 2004
February 2004
January 2004
December 2003
November 2003
October 2003
September 2003
August 2003
July 2003
June 2003
Reference
Organizational Stats
Arizona Diamondbacks Bat / Pitch
Atlanta Braves Bat / Pitch
Baltimore Orioles Bat / Pitch
Boston Red Sox Bat / Pitch
Chicago Cubs Bat / Pitch
Chicago White Sox Bat / Pitch
Cincinnati Reds Bat / Pitch
Cleveland Indians Bat / Pitch
Colorado Rockies Bat / Pitch
Detroit Tigers Bat / Pitch
Florida Marlins Bat / Pitch
Houston Astros Bat / Pitch
Kansas City Royals Bat / Pitch
Los Angeles Angels Bat / Pitch
Los Angeles Dodgers Bat / Pitch
Milwaukee Brewers Bat / Pitch
Minnesota Twins Bat / Pitch
New York Mets Bat / Pitch
New York Yankees Bat / Pitch
Oakland Athletics Bat / Pitch
Philadelphia Phillies Bat / Pitch
Pittsburgh Pirates Bat / Pitch
St. Louis Cardinals Bat / Pitch
San Diego Padres Bat / Pitch
San Francisco Giants Bat / Pitch
Seattle Mariners Bat / Pitch
Tampa Bay Devil Rays Bat / Pitch
Texas Rangers Bat / Pitch
Toronto Blue Jays Bat / Pitch
Washington Nationals Bat / Pitch
All-Star Links
Official Websites
News and Notes
Baseball News Blog
Baseball Newstand
ESPN Baseball
Fox Sports Baseball
Pro Sports Daily
Roto World
The Roto Times
USA Today Baseball
Baseball Newstand
ESPN Baseball
Fox Sports Baseball
Pro Sports Daily
Roto World
The Roto Times
USA Today Baseball
Reference and Analysis
Baseball Almanac
Baseball America
Baseball Archive
Baseball Contracts
Baseball Cube
Baseball Graphs
Baseball Library
Baseball Musings Player Database
Baseball Page
Baseball Primer
Baseball Prospectus
Baseball Reference
Baseball Statistics
Baseball Truth
Boxscore Central
Diamond Mind Baseball
Doug's Stats
FanGraphs
Fast Balls (pitchfx catalog)
Hardball Dollars
Hardball Times
Hit Tracker
Retrosheet
Rotobase/Rotoblog
Stat Corner
STATS
Tango on Baseball
Yahoo Sports MLB
Web Gems
Bill James Primer
Sabermetric Manifesto (Grabiner)
Pitching and Defense (McCracken)
Pitching and Defense (Tippett)
Transactions Primer (Neyer)
Baseball Stats (Batter's Box)
Prospect Report (Cameron)
Pitcher Workloads (Sheehan)
Goodbye to Old Baseball Ideas (Rickey)
Sabermetric Manifesto (Grabiner)
Pitching and Defense (McCracken)
Pitching and Defense (Tippett)
Transactions Primer (Neyer)
Baseball Stats (Batter's Box)
Prospect Report (Cameron)
Pitcher Workloads (Sheehan)
Goodbye to Old Baseball Ideas (Rickey)
Columnists
Baseball Blogs
Around the Majors
Athletics Nation
Baseball Crank
Baseball Musings
Baseball-Reference Blog
Batter's Box
Big League Stew
Bronx Banter
Catfish Stew
Cub Town
Dan Agonistes
Dodger Thoughts
DRays Bay
Ducksnorts
Futility Infielder
Halos Heaven
Inside the Rockies
It Might Be Dangerous
Knuckle Curve
LoHud Yankees Blog
Lookout Landing
Management by Baseball
Metaforian
Metsgeek
Mike's Baseball Rants
Only Baseball Matters
Redbird Nation
Red Reporter
Sabernomics (Braves)
Seth Speaks
ShysterBall
6-4-2 (Angels/Dodgers)
The Book
TheCubdom
The Cutting Edge
The House That Dewey Built
The View From The Bleachers
Tiger Blog
U.S.S. Mariner
Viva El Birdos
Where's Kernan
Minor Leagues
Arizona Fall League
BA Player Finder
Cal Leaguers
Jamey Newberg
JDM's Scoresheet Baseball
Minor League Baseball
Minor League Park Factors
Minor League Splits
No Pepper
Sickels' Minor League Ball
Warm October Nights
BA Player Finder
Cal Leaguers
Jamey Newberg
JDM's Scoresheet Baseball
Minor League Baseball
Minor League Park Factors
Minor League Splits
No Pepper
Sickels' Minor League Ball
Warm October Nights
Amateur
Boyd's World (College)
Cape Cod Baseball League
College Baseball Blog
College Baseball Insider
Collegiate Baseball Newspaper
College Splits
College Splits Blog
Dirtbags Baseball (Long Beach State)
NCAA Baseball
NCBWA
Team One Baseball (High School)
Texas A&M & Baseball
Cape Cod Baseball League
College Baseball Blog
College Baseball Insider
Collegiate Baseball Newspaper
College Splits
College Splits Blog
Dirtbags Baseball (Long Beach State)
NCAA Baseball
NCBWA
Team One Baseball (High School)
Texas A&M & Baseball
Historical
Cuban Baseball
House of David
Jim "Mudcat" Grant's Web Page
Negro League Baseball Players Assoc
Negro Leagues Baseball Museum
1919 Black Sox
Pacific Coast League
Philadelphia Athletics Historical Society
Shoeless Joe Jackson Society
SABR-L Archives
Walter O'Malley
House of David
Jim "Mudcat" Grant's Web Page
Negro League Baseball Players Assoc
Negro Leagues Baseball Museum
1919 Black Sox
Pacific Coast League
Philadelphia Athletics Historical Society
Shoeless Joe Jackson Society
SABR-L Archives
Walter O'Malley
Miscellaneous
Forums
Credits
Ticket Center
Tickets to Baseball -
Premium Red Sox Tickets - Tickets to Marlins Games - Cardinals Game Tickets - NY Yankee Tickets - Tickets Oakland Athletics - Dallas Cowboys Tickets - Arizona Cardinals Tickets - Tickets Seattle Seahawks - Buffalo Bills Tickets Online - Tickets to Dolphins Football
Buy Boston Red Sox tickets,
Philadelphia Phillies tix,
NY Yankees tickets,
NY Mets tickets, and
MLB All Star game tickets at ABC tickets
Not sure where to find the best online sportsbooks? Start your search with PlayersJet.
Get deals at SportsMemorabilia.com on baseball apparel, including Phillies jerseys and more for adults and children.
Shop the largest selection baseball equipment on sale at Sports Unlimited. Check out tons of baseball gloves, youth baseball gloves and catchers gear from Rawlings, Wilson, Nike & Under Armour.
2011 Draft Order
Courtesy of Baseball America
First-Round:
 1. Pirates (57-105)
 2. Mariners (61-101)
 3. Diamondbacks (65-97)
 4. Orioles (66-96)
 5. Royals (67-95)
 6. Nationals (69-93)
 7. Diamondbacks (for B. Loux)
 8. Indians (69-93)
 9. Cubs (75-87)
10. Padres (for Karsten Whitson)
11. Astros (76-86)
12. Brewers (77-85)
13. Mets (79-83)
14. Marlins (80-82)
15. Brewers (for Dylan Covey)
16. Dodgers (80-82)
17. Angels (80-82)
18. Athletics (81-81)
19. Red Sox (from DET for Martinez)
20. Rockies (83-79)
21. Blue Jays (85-77)
22. Cardinals (86-76)
23. Nationals (from CWS for Dunn)
24. Rays (from BOS for Crawford)
25. Padres (90-72)
26. Red Sox (from TEX for Beltre)
27. Reds (91-71)
28. Braves (91-71)
29. Giants (92-70)
30. Twins (94-68)
31. Rays (from NYY for Soriano)
32. Rays (96-66)
33. Rangers (from PHI for Lee)
Supplemental First Round:
34. Nationals (Dunn)
35. Blue Jays (Downs)
36. Red Sox (Martinez)
37. Rangers (Lee)
38. Rays (Crawford)
39. Phillies (Werth)
40. Red Sox (Beltre)
41. Rays (Soriano)
42. Rays (Balfour)
43. Diamondbacks (LaRoche)
44. Mets (Feliciano)
45. Rockies (Dotel)
46. Blue Jays (Buck)
47. White Sox (Putz)
48. Padres (Garland)
49. Giants (Uribe)
50. Twins (Hudson)
51. Yankees (Vazquez)
52. Rays (Benoit)
53. Blue Jays (Olivo)
54. Padres (Torrealba)
55. Twins (Crain)
56. Rays (Choate)
57. Blue Jays (Gregg)
58. Padres (Correia)
59. Rays (Hawpe)
| Baseball Beat | February 28, 2011 |
Adam Wainwright and Bert Blyleven
Adam Wainwright tore the ulnar collateral ligament in his throwing elbow and is scheduled to undergo Tommy John surgery today. The normal rehabilitation time for pitchers following this reconstructive surgery is approximately one year, although many pitchers don't fully recover for two years. As a result, if everything goes well, Wainwright could return for the opening of the 2012 season.
The St. Louis Cardinals righthander skipped his final start in 2010 due to what the team described in a press release last September as a "right forearm muscle strain." He had experienced a tightening sensation in his elbow during his previous two starts after sleeping awkwardly on it the night before his 19th victory. Wainwright suffered a partial tear of the same ligament in 2004, missing a large portion of that season only a handful of months after the Redbirds had acquired the former first-round draft pick from the Atlanta Braves in a trade involving J.D. Drew.
Today's operation will be performed in St. Louis by team physician Dr. George Paletta, who has also repaired the elbows of Chris Carpenter, Jaime Garcia and Kyle McClellan. Ironically, the latter pitcher is the most likely internal candidate to replace Wainwright in the rotation this year. Meanwhile, Carpenter, who won the National League Cy Young Award in 2005, will regain his status as the club's ace. Garcia placed third in the NL Rookie of the Year balloting last season after posting a 13-8 record with a 2.70 ERA in 163 1/3 innings.
Wainwright, 29, who may possess the best curveball in baseball, might be following in the path of none other than Bert Blyleven. The Hall of Famer was 31 when he hurt his elbow early in the 1982 season. He appeared in only four games that spring and had an uneven campaign in 1983, missing time in July, August, and September. Blyleven bounced back in 1984 and enjoyed what Bert believes was the best year of his career. He won 19 games for the sixth-place Cleveland Indians despite missing four starts in May and June due to a freak foot injury. Blyleven finished third behind two relievers (Willie Hernandez and Dan Quisenberry) in the AL Cy Young voting.
In Jeremy Greenhouse's final article for Baseball Analysts, he pointed out the similarities between Blyleven and Wainwright.
When you think of big curveballs nowadays, you think of Adam Wainwright. Over the last two years, Wainwright’s curveball has been worth 45.7 runs according to FanGraphs, 20 runs better than the runner-up. Wainwright doesn’t shy away from the pitch, throwing it a quarter of the time, the third-highest rate in the Majors. However, nobody can match the 40% rate Blyleven estimated that he threw in 1978. Blyleven was known for freezing batters with his curve, and Wainwright had at least one such famous moment. Both Wainwright and Blyleven threw their curveballs in unusual fashions. According to pitch grip expert Mike Fast, Wainwright's curve "is not quite a standard curveball grip in that his index finger is completely off the ball. Most pitchers lay it down alongside the middle finger on the ball." Blyleven, on the other hand, said that he "holds both his fastball and curveball across the seams." Blyleven recalled Sandy Koufax and Bob Feller pitching the same way, but at the time knew of no one else who did. I asked Mike Fast, and he is unaware of any current pitcher who exhibits this trait. Here's an image of a potential Blyleven curve.
As shown below, Blyleven amassed about 1,750 more innings than Wainwright through their 28-year-old seasons. Nonetheless, the rate stats are nearly identical.

Buster Olney spotlighted Wainwright's usage of his breaking ball in a recent column (Insider subscription required). He threw 1,471 breaking balls in 2010, ranking fourth behind Brett Myers (1,619), Carpenter (1,589), and Dan Haren (1,482). At 44% of his total pitches, Wainwright placed third behind Myers (47%) and Carpenter (45%) among hurlers who threw over 1,500 pitches. According to Olney, the league-average mark was 24.8%. Buster also reported that the league batted .183 against Wainwright's breaking stuff.
Although Blyleven avoided surgery on his UCL, he may serve as a proxy for Wainwright's future performance. If so, look for Wainwright to struggle next season, put up one of his best years in 2013, and perhaps lead the league in innings pitched in 2014 and 2015.
As the saying goes, short-term pain, long-term gain.
| Change-Up | February 24, 2011 |
The Cubs in 2011
Sometimes it just all goes wrong. You could say that was the story of the 2010 Red Sox. They suffered injuries all over the roster. Kevin Youkilis, Dustin Pedroia, Jacoby Ellsbury, Mike Cameron, Josh Beckett, you name the Red Sox player and it's likely they missed a chunk of time. John Lackey also fell short of expectations, Jonathan Papelbon imploded down the stretch, and the end result was a 3rd place finish.
But then again, what about the MVP season Adrian Beltre put up? And didn't Clay Buchholz somehow post a 2.33 ERA? Jon Lester had another Cy Young caliber season. Jed Lowrie posted a better OPS+ than Troy Tulowitzki in limited time. You get the point. There were bright spots for the Red Sox, and it's how they managed to win 89 games.
For the Cubs, things went south quickly. They started terribly out of the gate, and a short-tempered Lou Piniella, on his last managerial legs, reacted poorly. He mishandled Carlos Zambrano, whose awful April and delicate temperament seemed to overwhelm Piniella. Inexplicably, Piniella actually played Koyie Hill regularly while one of the game's best hitting catchers sat on the bench. In an unceremonious end to his career, Pinella quit over the summer when the Cubs were 51-74.
It wasn't just Piniella's fault, of course. From 2004 to 2009, Aramis Ramirez hit .303/.368/.551 in over 3,300 plate appearances. In 2010, he hit .241/.294/.452 on the heels of his worst BABIP, .245, since his 21-year old season for the Pirates. Derrek Lee hit .304/.384/.515 from 2007 to 2009 and then fell to .251 /.335/.416 last season for the Cubs. Sure it's probably just one of those things and not attributable to much at all, but the fact that Lee went and hit .287/.384/.465 for the Braves over the last 39 games does little to discredit the notion that there was a corrosiveness surrounding the Cubs in 2010.
There were also the 412 plate appearances of .647 OPS output that Ryan Theriot contributed. Indeed, the most productive Cubs infielder in 2010 was Starlin Castro, an exciting development that bodes well for the North Siders' future. But let's be honest. If a 20-year old shortstop is your best hitting infielder, chances are you're doing it very, very wrong.
On the pitching side, Zambrano notwithstanding, things started out pretty good for the Cubs. The problems arose over the summer. In June and July, they yielded 323 runs over a 55-game stretch. That amounts to 5.87 runs per game, or 951 allowed extrapolated over a full season. No National League team in the last 10 seasons has managed 951 runs. It was a disaster. On the bright side, the Cubs did finish 24-13 under new Manager, Mike Quade, who returns this season.
So what about 2011? Lee is gone and Carlos Pena is in. While it may be a lot to ask of an antsy fan base to grin and bear such a low batting average and a ton of strikeouts, Pena looks poised for a big bounce-back. Dan Szymborski's ZIPS has Lee at .239/.363/.508 with 31 home runs. On the other corner, Ramirez is another great candidate to return to form. At second, Theriot's out of the picture and while Blake DeWitt and Jeff Baker might not amount to much, Theriot gone, and playing for the rival Cards no less, may well amount to addition by subtraction. Baker has hit .308/.363/.545 in his career against lefties, so Quade may have a tactical lever to pull in order to squeeze a bit more production out of second. At short, Castro's another year older and projects as a star one day. He might not get there this year but you never know when a player of his talent might make that leap. They're not the Phillies, the Red Sox or the Yankees but it should be a productive infield, which is a lot more than the Cubbies could say in 2010.
Behind the plate, Quade's mandate is simple. Play Geovany Soto. Play him as much as possible without risking injury. DH him in the AL parks. It was only nine games but I found this to be one of the very saddest things about the 2010 Cubs. Their pitchers hit .132/.170/.159 last season. In their nine interleague games in AL ballparks, Cubs DH's hit .154/.175/.179. They might as well have stuck with their pitcher. Sorry to get off topic but the point here is straightforward. Play Soto a lot. Play Hill as little as possible.
The outfield of (left to right) Alfonso Soriano, Marlon Byrd and Kosuke Fukudome returns in place and while it's old and not the most prolific bunch, it's also steady. None of them figures to turn in a stinker of a season provided they can stay healthy. I'm not a big Tyler Colvin fan but he's versatile and fine enough as a fourth option.
On the pitching side, Ryan Dempster returns and Quade has already named him the Opening Day starter. It's a small thing but I like the early announcement for a few reasons. First, it shows that Quade appreciates what Dempster has managed to accomplish over the last few seasons. Since 2008, he ranks 14th in Fangraphs Wins Above Replacement among all Major League pitchers. Rewarding Dempster for that sort of output reflects well on Quade. Second, it takes a hint pressure off of Zambrano and newcomer Matt Garza. Zambrano hasn't always reacted well to the expectations that come with a big paycheck in a media market like Chicago. And, like Zambrano, Garza is a fiery competitor who can feed off of, or be done in by, his emotions. Again, it's not a big deal but it reflects a level of thoughtfulness that was lacking during the Piniella days. The Cubs had a 103 team ERA+ last season, they return four of five starters, swap Garza in for Tom Gorzelanny and have added Kerry Wood to a bullpen that returns key pieces Carlos Marmol and Sean Marshall.
If the Cubs fail to make a playoff push this season, it will likely be due to a lack of depth. That's a shame for a club with Chicago's payroll but it's the reality. A Soriano injury means everyday Tyler Colvin. If Pena or Ramirez miss time, does Baker move to a corner infield position? There's not much rotation depth at all, and outside of the top three or four or five options depending on how you feel about live arms Andrew Cashner and Thomas Diamond, the bullpen gets thin quickly.
Nonetheless there's a path to success for the Cubs this season. It's tenuous because of how thin they are, but it's there. With health, more of the same from the pitching staff, above average corner infield production, continued excellence and more playing time for Soto and a leap forward from Castro, the Cubs have the look of a contender. They look even more like one with yesterday's Adam Wainwright news, and if you compare the Cubs' reaction to the news to Cincinnati's, who knows? Karma monitors these things, and maybe the Cubs will find it on their side this year?
| Designated Hitter | February 13, 2011 |
Remembering Woodie Fryman and the 1966 Pirates
Woodie Fryman died last week at the age of 70. He was as average a pitcher as you can be. 141-155 during an 18 year career. He used a double-pump windup, which you didn't see very much of anymore when he broke into the majors in 1966. He was 12-9 that year with a 3.81 ERA — not bad for a rookie. Until you consider that Forbes Field was a huge pitcher's park, this was during the enormous strike zone era, and he pitched three consecutive shutouts in a two-week stretch. The rest of his season was absolutely average. The one thing that stands out is that he threw four one-hitters. I was at the first of them.
I was a rabid Pirate fan living just a few miles from Shea Stadium. July, 1966 and Fryman is pitching a Friday night game at Shea. One aside. The 1966 Pirates will forever be my favorite team. Matty Alou won the batting title, Willie Stargell had his first big power year, and shortstop Gene Alley and second baseman Bill Mazeroski helped set the all-time record for double plays in a season. And then there was Roberto Clemente. He won the National League Most Valuable Player award that year. If your only memory of Roberto is the 1971 World Series, picture him dominating games like that for an entire season. He was something to see. The Pirates were thrilling to watch and I almost never missed a game when they came to town.
Pittsburgh led the NL for most of that season, eventually finishing third to the Dodgers and Giants, three games out of first place. Whenever they team played in San Francisco or Los Angeles, I'd stay up very late listening to the games, trying to get Bob Prince coming in above the static calling the games on WWVA radio, out of Wheeling, West Virginia. The crime of that season was the Dodgers had Sandy Koufax and Don Drysdale, the Giants had Juan Marichal and Gaylord Perry, and we had only Bob Veale and Al McBean!! You call that fair???
Back to Fryman's gem. Ron Hunt leads off the game for the Mets. Chops a ball over Woodie's head. Gene Alley, at short, charges it and tries to one-hand it and throw to first, but the truth is not even Ozzie Smith or Omar Vizquel could've made that play. Infield single. Hunt gets thrown out trying to steal second base and then 26 up and 26 down. A one-hit shutout. Faced only 27 batters. No incredible fielding plays, just 26 up and 26 down. Easily the best pitched game I've ever seen in person. Stargell hit two home runs and the Pirates won 12-0.
After the game, Pirates manager Harry Walker insisted on speaking to Dick Young of the Daily News, the official scorer that night. These were two rather hot-headed guys. Walker wanted Young to change the infield hit to an error, so at least Fryman could have his no-hitter. The whole thing escalates, pushing, shoving and cursing. Walker was suspended for one game and Young wrote articles for days afterward about what a jerk Harry Walker was.
By the time the Pirates became an NL power (five NL East titles between (1970-75), Woodie Fryman was long gone. But I'll never forget that night 45 years ago.
David Bromberg has been going to baseball games since 1955. He was at Yankee Stadium two days before Don Larsen's perfect game in 1956 and at Shea Stadium two days before Jim Bunning's perfect game in 1964. He's never attended a no-hit game.
| Change-Up | February 10, 2011 |
It's Kila Time in KC
It's February, when Hot Stove season slows, teams’ depth charts look more or less set, prospect rankings have come and gone, and pitchers and catchers are just beginning to trickle into their respective Spring Training homes. It feels early to start previewing teams in earnest. While we wait for the games to start, even the Spring games, time just seems to drag.
In baseball no-man’s land, projection season tides me over. “No way is A-Rod going to be better than Kevin Youkilis!” Really, I somehow become invested in this stuff. Baseball Prospectus released a revamped PECOTA this year, and I suggest subscribers have a look for themselves. Search by any which way you’d like.
One filter that I ran produced a surprising result. BP has Kila Ka’aihue as the 14th best hitter by True Average in MLB, 8th in the American League. I mentioned that prospect rankings have come and gone but for this post's purposes, it's worth mentioning that the one constant, even one truth it seems, is that the Kansas City Royals boast baseball’s best farm system. Ka’aihue factors into that in one sense, but he’s on the old side for a prospect. It’s hard to say whether or not he will be a part of the next contending Royals club.
While the future is bright, the 2011 Royals are a nightmare. Their starting pitching, with Zack Greinke now a Milwaukee Brewer, may well be the worst rotation we have seen in a long time. But their system is so stacked that enthusiasm is returning bit by bit, at least on the Kansas City Royals blogs. I suspect the more casual fans might take some more time.
The Royals will need to wage a PR battle to bridge their current product to the much better one coming down the pike. And they know this, as evidenced by the exhibition they plan to hold between their AAA and AA affiliates at Kauffman Stadium after their 12:10 game against the Los Angeles Angels on April 2nd. It’s a brilliant move. The fans know the good players are coming, so why not let them have a peek?
One other source for enthusiasm this season should be Ka’aihue. About to play in his 27-year old season, he’s a career .266/.391/.460 Minor League hitter in 4,148 plate appearances. For perspective, that’s more PA’s than Scott Podsednik has notched in his entire Major League career, and more than Nomar Garciaparra had from 2000 through the end of his career. Kila’s been around a while.
In AAA alone over the last three seasons, he’s hit .285/.424/.521 in 1,110 PA’s. In 2010 he broke out, hitting .319/.463/.598 for Omaha before getting the call up to Kansas City. There, he struggled. In 206 PA’s he hit just .217/.307/.394. Nonetheless his body of work over the course of his professional career should excite Royals fans.
PECOTA has had its share of famous misses with young players. Remember when Matt Wieters was going to win the MVP his rookie season? But it’s also been as good a barometer as any in many regards, and the fact that Kila ranks as highly as he does isn’t a sign that he should be penciled into the All Star Game now (although since there’s one player from every team, and this is the Royals…). Instead, it’s just something to look forward to, something in Kansas City to rally around. He’s paid more than his share of dues and finally, he’s set to begin a Big League season with a starting job. While Royals fans wait for talent to fill in around Kila and Billy Butler, they can take a rooting interest in the big Hawaiian as the losses mount.
| Baseball Beat | February 09, 2011 |
Graphing the Hitters: Plate Discipline
Last week, I published Graphing the Hitters: Productivity with a focus on OBP and SLG. Today's version of Graphing the Hitters is on Plate Discipline, which I introduced in this format just over a year ago.
The graph below plots walk rate (BB/PA) on the x-axis and strikeout rate (SO/PA) on the y-axis for every qualified batter in 2010. The intersection of the MLB averages for BB% (8.50%) and SO% (18.49%) created quadrants that classify players as better-than-average in both (lower right), worse-than-average in both (upper left), or better-than-average in one and worse-than-average in the other (lower left and upper right).
Unlike Fangraphs, I believe the denominator for strikeout percentage should be plate appearances (rather than at-bats). For whatever reason, Fangraphs defines walk percentage as BB/PA but strikeout percentage as SO/AB. As a result, while the raw numbers were downloaded from Fangraphs, the BB% and SO% were calculated separately.
Note: You can download a spreadsheet containing the BB, SO, BB%, SO%, and BB/SO of the 151 qualified hitters here. This information can also be used to locate the 124 players not labeled in the graph below.
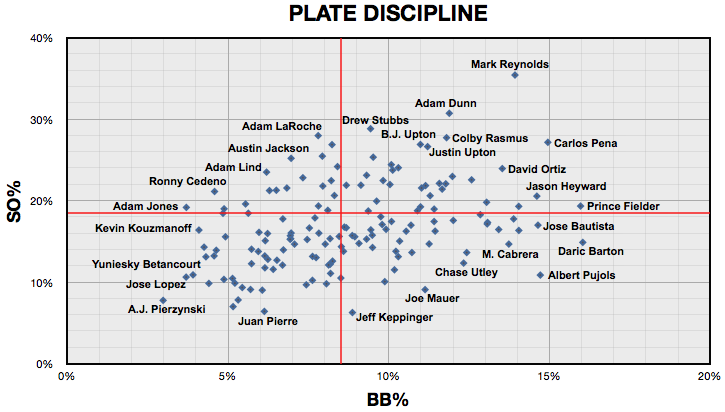
Three of the players in the bottom right quadrant ranked in the top five in OPS last year. Not only did Jose Bautista, Miguel Cabrera, and Albert Pujols produce outstanding on-base and slugging averages but they also displayed strong plate discipline. All three hitters walked at least 60% more than the MLB average while striking out less than the MLB average.
Pujols had the fourth-highest BB% (14.71%) and the 20th-lowest SO% (10.86%). No one else comes close to matching that combination of BB% and SO%. Joe Mauer was 36th in BB% (11.13%) and 7th in SO% (9.08%).
Daric Barton (16.03%), whose name is situated between Bautista and Pujols on the graph above, edged out Prince Fielder (15.97%) for the highest BB% in the majors. A.J. Pierzynski (2.98%) had the lowest BB%.
Mark Reynolds (35.40%) had the highest SO% by a wide margin, beating out Adam Dunn by nearly five percentage points. Reynolds struck out over 200 times for the third straight season. He now holds the top three spots on the all-time single-season list for strikeouts. No other player has ever whiffed 200 times in a campaign. The top nine in SO have all occurred since 2004 with Reynolds (3), Dunn (3), and Ryan Howard (2) manning eight of the nine places. As it relates to Reynolds, if one wants to look for hope and change, he has increased his walks and BB% every year since his rookie season in 2007.
Jeff Keppinger (6.26%) had the lowest SO%, squeezing past Juan Pierre (6.40%) for top honors. He also generated the No. 1 BB/SO ratio with an impressive 1.42. Adam Jones (0.19) had the worst BB/SO. The toolsy center fielder is far from a finished product. By the same token, Carlos Gonzalez, firmly in the top left quadrant with a 6.29% BB and 21.23% SO, may not be the superstar-in-making unless he improves his dismal BB/SO ratio of 0.30. With or without better plate discipline, the 25-year-old outfielder is unlikely to ever approach the rate stats (.363/.412/.679) he put up in the second half last year.
Just five qualified hitters had a BB/SO ratio of 1.0 or better (vs. 13 in 2009). Pujols and Mauer were the only players to repeat.
| Player | BB | SO | BB% | K% | BB/SO |
|---|---|---|---|---|---|
| Jeff Keppinger | 51 | 36 | 8.87% | 6.26% | 1.42 |
| Albert Pujols | 103 | 76 | 14.71% | 10.86% | 1.36 |
| Joe Mauer | 65 | 53 | 11.13% | 9.08% | 1.23 |
| Daric Barton | 110 | 102 | 16.03% | 14.87% | 1.08 |
| Chase Utley | 63 | 63 | 12.33% | 12.33% | 1.00 |
Combining the features of the Productivity and Plate Discipline graphs allows us to determine the players who had above-average BB% (> 8.50%), SO% (< 18.49%), OBP (> .325), and SLG (> .403). The 29 hitters in the table below are ranked by OPS.
| Player | BB | SO | BB% | K% | BB/SO | OBP | SLG | OPS |
|---|---|---|---|---|---|---|---|---|
| Miguel Cabrera | 89 | 95 | 13.73% | 14.66% | .94 | .420 | .622 | 1.042 |
| Albert Pujols | 103 | 76 | 14.71% | 10.86% | 1.36 | .414 | .596 | 1.010 |
| Jose Bautista | 100 | 116 | 14.64% | 16.98% | .86 | .378 | .617 | .995 |
| Paul Konerko | 72 | 110 | 11.41% | 17.43% | .65 | .393 | .584 | .977 |
| Troy Tulowitzki | 48 | 78 | 9.07% | 14.74% | .62 | .381 | .568 | .949 |
| Matt Holliday | 69 | 93 | 10.22% | 13.78% | .74 | .390 | .532 | .922 |
| Adrian Gonzalez | 93 | 114 | 13.42% | 16.45% | .82 | .393 | .511 | .904 |
| Ryan Zimmerman | 69 | 98 | 11.44% | 16.25% | .70 | .388 | .510 | .898 |
| Aubrey Huff | 83 | 91 | 12.43% | 13.62% | .91 | .385 | .506 | .891 |
| Shin-Soo Choo | 83 | 118 | 12.85% | 18.27% | .70 | .401 | .484 | .885 |
| Joe Mauer | 65 | 53 | 11.13% | 9.08% | 1.23 | .402 | .469 | .871 |
| Andre Ethier | 59 | 102 | 10.09% | 17.44% | .58 | .364 | .493 | .857 |
| Billy Butler | 69 | 78 | 10.18% | 11.50% | .88 | .388 | .469 | .857 |
| Scott Rolen | 50 | 82 | 9.31% | 15.27% | .61 | .358 | .497 | .855 |
| Hanley Ramirez | 64 | 93 | 10.34% | 15.02% | .69 | .378 | .475 | .853 |
| Alex Rodriguez | 59 | 98 | 9.92% | 16.47% | .60 | .341 | .506 | .847 |
| Mark Teixeira | 93 | 122 | 13.06% | 17.13% | .76 | .365 | .481 | .846 |
| Chase Utley | 63 | 63 | 12.33% | 12.33% | 1.00 | .387 | .445 | .832 |
| Brian McCann | 74 | 98 | 13.07% | 17.31% | .76 | .375 | .453 | .828 |
| Carlos Quentin | 50 | 83 | 9.49% | 15.75% | .60 | .342 | .479 | .821 |
| Hideki Matsui | 67 | 98 | 12.01% | 17.56% | .68 | .361 | .459 | .820 |
| Torii Hunter | 61 | 106 | 9.44% | 16.41% | .58 | .354 | .464 | .818 |
| Andrew McCutchen | 70 | 89 | 10.72% | 13.63% | .79 | .365 | .449 | .814 |
| Stephen Drew | 62 | 108 | 9.79% | 17.06% | .57 | .352 | .458 | .810 |
| Nick Markakis | 73 | 93 | 10.30% | 13.12% | .78 | .370 | .436 | .806 |
| Daric Barton | 110 | 102 | 16.03% | 14.87% | 1.08 | .393 | .405 | .798 |
| Raul Ibanez | 68 | 108 | 10.69% | 16.98% | .63 | .349 | .444 | .793 |
| Gaby Sanchez | 57 | 101 | 8.86% | 15.71% | .56 | .341 | .448 | .789 |
| Michael Cuddyer | 58 | 93 | 8.59% | 13.78% | .62 | .336 | .417 | .753 |
As I concluded last year with no particular revelation, "Pujols is the most disciplined and productive hitter in the game today." Albert may still be the "most disciplined" hitter but might not be the "most productive" anymore. You see, there is another guy out there who is a lot more like Pujols than not. In fact, this impostor had a higher AVG (.328 vs. .312), OBP (.420 vs. .414), SLG (.622 vs. 596), OPS (1.042 vs. 1.011), OPS+ (179 vs. 173), wOBA (.429 vs. .420), and wRC+ (170 vs. 165) than the three-time NL MVP (who, by the way, also has FOUR second-place finishes). No, it's not Joey Votto. It's none other than Miguel Cabrera, who sits atop the list above.
| F/X Visualizations | February 04, 2011 |
US-Born Baseball Players' Birthplaces over Time
The composition of MLB players had changed dramatically over MLB's history, with the game opening up to new groups and the rising popularity of the game internationally. For example, the number of foreign-born players has increased over the history of the game, though it dropped back down to its lowest rate since 2006 last year. But I was interested in changes over time in the birthplaces of US-born players. As the population of the United States moved west and south, and MLB opened up to blacks and others I wanted to see how that changed where US-born players came from.
To look at this I color-coded a US map by number of MLB players born in each county during five time periods. I got birthplaces from the Lahman database and then linked those up with the current county that birthplace is in. The maps are color-coded by raw number of players per county rather than the more desirable players per capita. The problem is that some of these counties are new entities, so there is no population data for them going back that to the 1800s or early 1900s.
I broke up the time periods so that the number of players born during each is close to equal (about 3000). Here is the first map for players born before 1887.
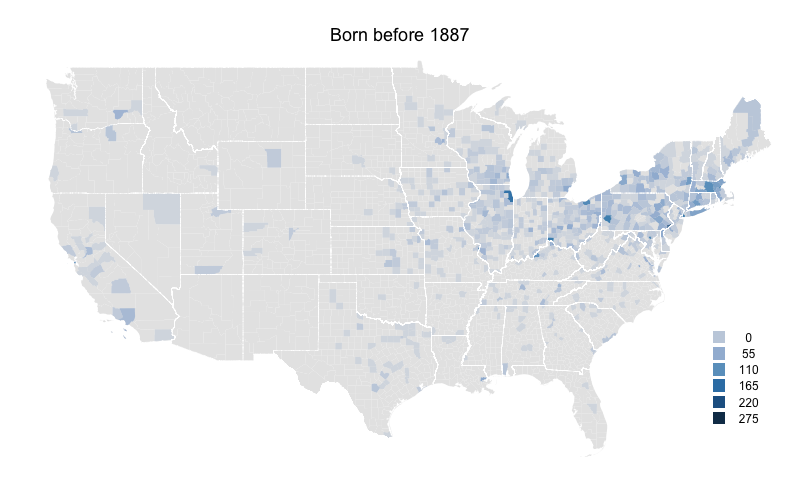
Not surprisingly the northeast has the highest levels. The population of the US was heavily concentrated in the northeast at this time. Cook County (Chicago), Philadelphia County (very small right on the southern border of PA and NJ), and New York County (also hard to see right at the base of Long Island) have the highest. There are very few players from counties south of the Ohio river or west of the Mississippi river.
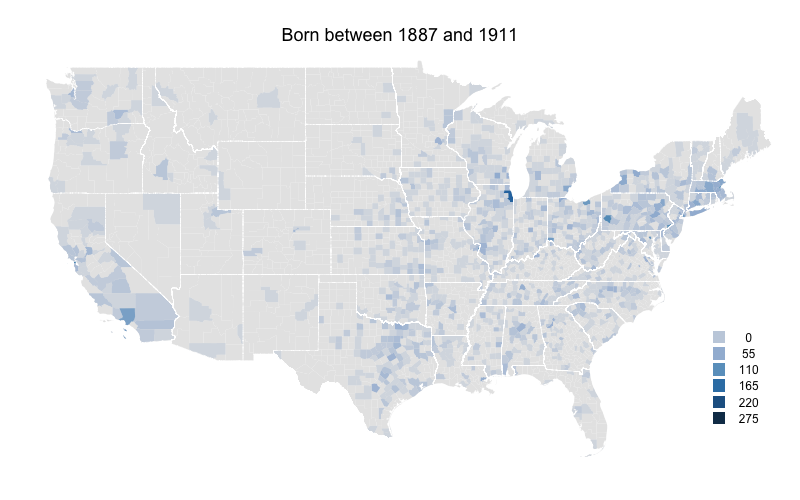
Already there is a shift south and west. The southeastern states, those just west of the Mississippi, Texas and southern California all see increases.
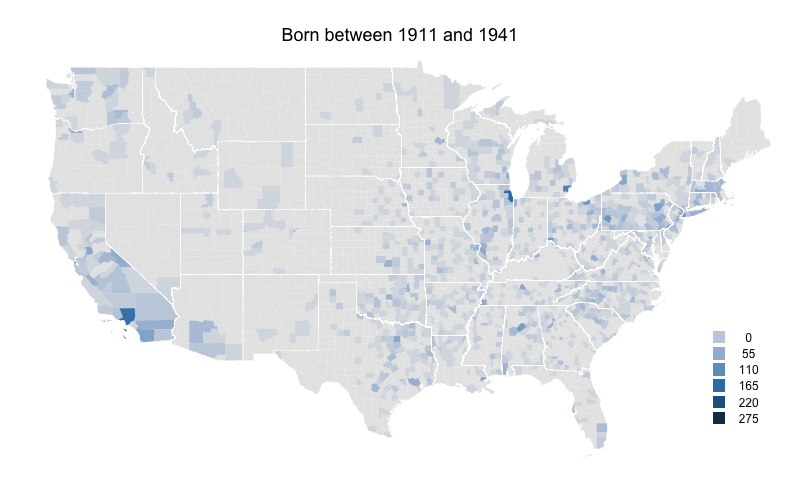
The decline in part of the northeastern US continues. Northern New England and upstate New York are now almost devoid of players. But the Northeast's large cities are still solid, and Wayne County, MI (Detroit) has a big increases. But the main story is southern California where the number of players counties to increase.
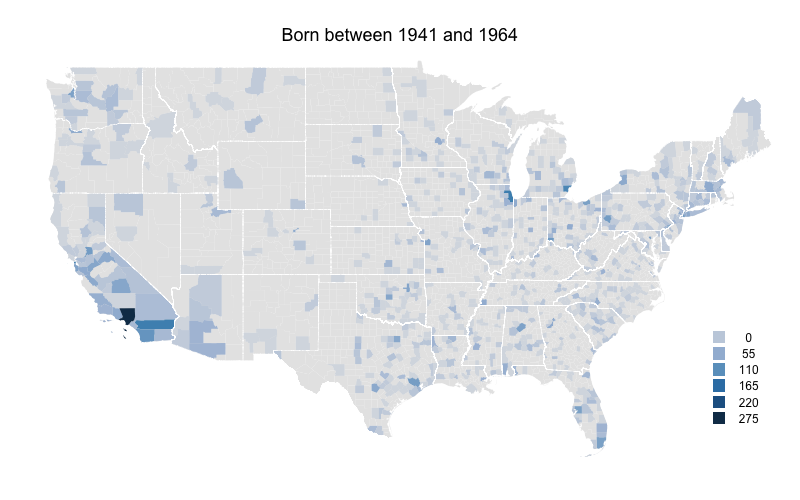
Rural areas in most of the country really start to fall off here. Outside of major metropolitan areas the eastern US has considerably fewer players. The one exception is Florida which has its highest numbers yet. Arizona and Washington also see increases in their numbers. Southern California increases further.
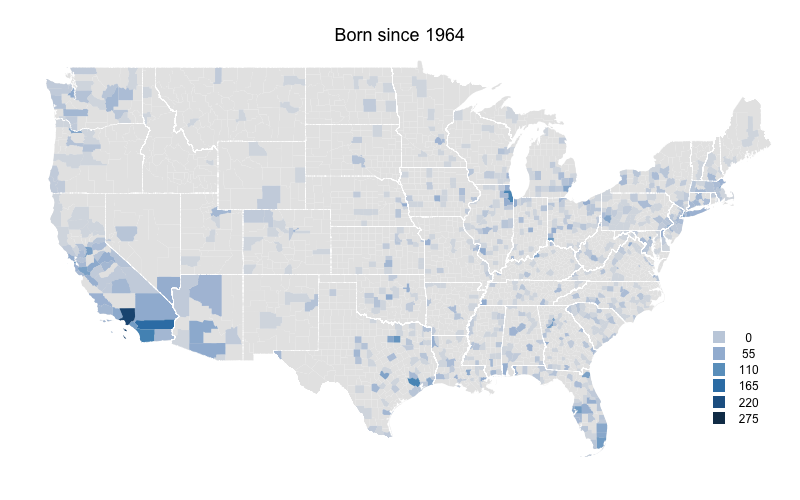
Again rural counties throughout most of the country have very low numbers. On the other hand Florida, Arizona, and to a lesser extent Washington state continue their increases. Clark County, NV (Las Vegas) sees a big increase and southern California still has very high levels.
As a whole these numbers mirror the south and west movement of people in the US, and the movement from more rural counties to more urban/sub-urban counties. At the same time I think that southern California (and the adjacent Clark County, NV and areas of Arizona) are far over represented by baseball players even when accounting for this areas large population.
Though the maps would be better in per capita form, I still think this offers an interesting picture of the history of US-born baseball players. Here they are in animated gif form.
| Change-Up | February 02, 2011 |
Is the Phillies Starting Rotation a Luxury or a Necessity?
Throughout the leadup to Cliff Lee's signing with the Philadelphia Phillies, most fans and media members believed it was only the Texas Rangers and New York Yankees vying for Lee's services. Many, including his prominent sportswriting peers, mocked Sports Illustrated's Jon Heyman for inserting a "mystery team" into the mix in the days leading up to the signing. Heyman was vindicated when Lee shocked the baseball world by signing with the Phillies, the team he helped reach the 2009 World Series.
Understandably, Phillies fans rejoiced. The rest of us pondered what a Roy Halladay, Lee, Roy Oswalt and Cole Hamels starting rotation might accomplish. They're four of the best - what - 30 pichers in baseball? Lee and Halladay are probably two of the five best. Heck, maybe the two best.
It's a stacked rotation, and one that promises to keep Philadelphia contending. But what about the rest of the team? It's worth examining how the offense and defense look so that we can determine whether this rotation puts an already excellent Phillies team over the top, or if they actually need those four starters.
We'll start with the offense. The Phillies last season managed a 99 wRC+, which means on a park and league adjusted basis, their offense was below average. Now, there are a few reasons why that's less concerning than it may appear. For one, the Phillies had a lot of injuries. You try running Juan Castro and his 29 OPS+ out there for 146 plate appearances and see what it does to your lineup! Next, the year the Phillies won the World Series, 2008, their team wRC+ was that same exact figure of 99. If your run prevention is good enough, an averagish offense is just fine. Finally, the figure is a bit misleading in that most of baseball's best offenses reside in the American League, even adjusted for league and park. 99 may be below average MLB-wide, but it was good enough for fourth best in the NL in both 2008 and 2010.
On the other hand, let's take a look at how Philadelphia managed that 99 wRC+ in 2010. There's Jayson Werth, far and away the best hitter on the 2010 team. He's now in Washington. Dom Brown and Ben Francisco are fine players, but they're not Werth. Carlos Ruiz hit every bit as well as Ryan Howard in 2010. Whether that speaks to Ruiz's career year or Howard's reputation and paycheck exceeding his real value, I'll let you decide. For his part, Howard's walk percentage dropped for the fourth consecutive season. I don't know that it's appropriate to expect significant bounce-back from the big first baseman. Raul Ibanez, now playing his 39-year old season, took a major step back in 2010 and is penciled in at left field.
Philadelphia hopes to get full seasons from their middle infield, which could mitigate the productivity losses they may take on elsewhere. Chase Utley played in only 115 games in 2010, Jimmy Rollins 88. What kind of player is Rollins at this point, though? UZR still likes him as a defender but between 2009 and 2010 he was a .248/.304/.406 hitter, "good" for a .316 wOBA. How much better of an offensive player is Rollins than, say, Alexei Ramirez? Below is a table comparing 2010 wOBA figures to how CAIRO (unfortunate timing on the acronym, I realize) sees them performing in 2011, courtesy of the Replacement Level Yankee Weblog.
| Name | 2010 | 2011 Cairo |
|---|---|---|
| Ruiz | .366 | .341 |
| Howard | .367 | .374 |
| Utley | .373 | .377 |
| Polanco | .323 | .325 |
| Rollins | .317 | .319 |
| Ibanez | .341 | .352 |
| Victorino | .339 | .338 |
| Werth/Francisco | .397 | .326 |
That looks about right to me, maybe slightly optimistic for someone like Ibanez. Modest upticks up and down the lineup, with a precipitous decline at catcher and in right field. The hope for the Phillies is that they can make up for what they figure to lose in output at catcher and right field with good health. If Utley and Rollins can play full seasons, Philadelphia stands a chance at putting together a similar offense to the one they had in 2010. Short of that, it's an attack in decline despite the name recognition up and down the lineup.
Of course there's that other part of baseball, too. When the Phillies won the World Series in 2008, their defense was the best in the National League according to UZR. In 2009, they dropped to fourth best. In 2010, with an aging roster another year older, they were eighth. Is there any reason to think that number will improve in 2011, when only one position player, Francisco or Brown, will be in his twenties?
The Phillies lost their biggest bat this offseason, and addressed the issue by signing Lee. With a full season of Oswalt and improved health throughout the roster, it may just work. But before we crown the 2011 Philadelphia Phillies, it's worth remembering that they can't really hit or field all that well. They'll need every last bit of that fantastic rotation they've assembled.