Rich Lederer • Baseball Beat
Patrick Sullivan • Change-Up
Jeremy Greenhouse • Touching Bases
Dave Allen • F/X Visualizations
Sky Andrecheck • Behind the Scoreboard
Marc Hulet • Around the Minors
Al Doyle • Past Times
Retired Uniforms:
Bryan Smith • WTNY
Joe Sheehan • Command Post
Jeff Albert • The Batter's Eye
RSS Feed
Home
*Examining the Past, Present, and Future*
Lineup Card
Recent Entries
» Putting Together a Reality Team
» Historical Hall of Fame Vote Comparisons: 2012
» An All-Christmas Team
» The New-Look Angels
» John Denny: The Forgotten Cy Young Award Winner
» Money Isn't Everything
» What Would It Take to Hit .400 in the 21st Century?
» Halos Heaven
» Brandon McCarthy's Breakout Season
» Link-o-Rama
» Historical Hall of Fame Vote Comparisons: 2012
» An All-Christmas Team
» The New-Look Angels
» John Denny: The Forgotten Cy Young Award Winner
» Money Isn't Everything
» What Would It Take to Hit .400 in the 21st Century?
» Halos Heaven
» Brandon McCarthy's Breakout Season
» Link-o-Rama
Best of Baseball Beat
Abstracts From the Abstracts
1977 Baseball Abstract
1978 Baseball Abstract
1979 Baseball Abstract
1980 Baseball Abstract
1981 Baseball Abstract
1982 Baseball Abstract
1983 Baseball Abstract
1984 Baseball Abstract
1985 Baseball Abstract
1986 Baseball Abstract
1987 Baseball Abstract
1988 Baseball Abstract
1978 Baseball Abstract
1979 Baseball Abstract
1980 Baseball Abstract
1981 Baseball Abstract
1982 Baseball Abstract
1983 Baseball Abstract
1984 Baseball Abstract
1985 Baseball Abstract
1986 Baseball Abstract
1987 Baseball Abstract
1988 Baseball Abstract
Bert Blyleven Series
Meeting Up and Hanging Out with Bert
The Results Are In And...
Aficionado Heavily Invested in Blyleven
Latest on Blyleven's Chances for the HOF
The Internet Zealot Responds
400 Down and 5 to Go...
Bert Be Home By Eleven?
Blyleven's Forgotten Season (1973)
HeyMan, Your Comments Don't Hold Water
The Waiting is the Hardest Part
Another Addition to the Blyleven Series
Search for the Truth
As Dominant as His HOF Contemporaries
Listen, Buster
A Larger Step for Blyleven
Answering the Naysayers (Part Two)
Another Small Step for Blyleven
Q&A: Blyleven on the Twins
The Majority Rules, Right?
It's All Dutch to Some
The Hall of Fame Case for Bert Blyleven
Q&A: Blyleven on Felix Hernandez
Clemens Rocketing Up Charts
Poz: An Interview With a KC Star
A HOF Chat with Tracy Ringolsby
Up Close and Personal
A Peek Into the Mind of a HOF Voter
Answering the Naysayers
It's That Time of the Year (Again)
"If Cooperstown is Calling..."
The Bert Alert
One Small Step for Blyleven...
Only the Lonely
Exclusive Interviews
Lee Sinins
Alex Belth
David Pinto
Will Carroll
Mike Carminati
Aaron Gleeman
Joe Sheehan
Jay Jaffe
Jeff Peek
Tracy Ringolsby
Joe Posnanski
Bill James Part I, II, III
Jon Lalonde
Chuck Tiffany
Dayn Perry
Fay Vincent
Nate Silver
Alex Belth
David Pinto
Will Carroll
Mike Carminati
Aaron Gleeman
Joe Sheehan
Jay Jaffe
Jeff Peek
Tracy Ringolsby
Joe Posnanski
Bill James Part I, II, III
Jon Lalonde
Chuck Tiffany
Dayn Perry
Fay Vincent
Nate Silver
Bullpen
Rich Lederer
The Odd Couple (with Alex Belth)
The MostUnder Over Underrated Player in Baseball (with Brian Gunn)
Three Wise Men (roundtable by Alex Belth)
Infrequently Asked Questions (interview with Matt Welch)
Interview (Orioles Think Tank)
Bernie and the Yanks (Bronx Banter)
Hope and Faith: How the LAA Win the World Series (Baseball Prospectus)
NL West (The Soul of Baseball)
Greatest Living Hitter? (Sports Illustrated)
Roundtable: 2008 HOF Ballot (Armchair GM)
The Most
Three Wise Men (roundtable by Alex Belth)
Infrequently Asked Questions (interview with Matt Welch)
Interview (Orioles Think Tank)
Bernie and the Yanks (Bronx Banter)
Hope and Faith: How the LAA Win the World Series (Baseball Prospectus)
NL West (The Soul of Baseball)
Greatest Living Hitter? (Sports Illustrated)
Roundtable: 2008 HOF Ballot (Armchair GM)
Patrick Sullivan
Designated Hitters
David Bromberg (Q&A: John Denny)
Mark Armour (H. Killebrew and Versatility)
Joe Lederer (Soundtrack of a Prospect)
David Bromberg (Clemente's Autograph)
David Bromberg (Woody Fryman)
D. Baumstein (WAR Against Age: Pitchers)
Doug Baumstein (The WAR Against Age)
Doug Baumstein (A Lifetime on the Road)
John Fraser (Pick Six)
Mark Armour (How to Score More Runs?)
Bill Parker (What Opening Day Tells Us)
Stan Opdyke (Pat Rispole)
Chris Jaffe (Evaluating Baseball's Mgrs)
Stan Opdyke (Baseball Radio in NYC, 1953)
A. Nathan (Performance of Baseball Bats)
Michael Weddell (Edgar Martinez/HOF)
Jon Weisman (100 Things Dodgers Fans...)
Stan Opdyke (Connie Mack and Vin Scully)
Eric Walker (Evaluating Run Production)
Brent Mayne (The Intangibles of Catching)
Chris Moore (Best Fastballs in Baseball)
Dave Baldwin (The Batter’s Brain)
Shawn Haviland (Ivy League to MLB)
Larry Granillo (Walking Off)
Rob Iracane (Solo HR Won't Break You)
Tommy Bennett (Charm of AM Radio)
Harry Pavlidis (Johan Santana's Fast Start)
John Walsh (WAR and Remembrance)
Eric Walker (Precisely Inaccurate)
Bob Timmermann (As They See 'Em)
Geoff Young (Unicycles and Delusions)
Baseball Analysis at Tufts (Groundballers)
Baseball Analysis at Tufts (GB Out Rates)
G. Rybarczyk ('09 Hit Tracker Projections)
Joe Lederer (Curt Schilling/HoF)
Conor Gallagher (Hall of Fallacies)
Chris Green (Jim Rice, HoF, the Numbers)
Shawn Hoffman (Baseball's Bear Mkt?)
Paul Anthony (Manny Syndrome)
Ross Roley (World Series Odds)
B. Timmermann (Catcher's Interference)
R.J. Anderson (Waiting the Hardest Part)
Maury Brown (Cubs, MLB, and Cuban...)
Myron Logan (Dee-Fense, Dee-Fense)
Craig Calcaterra (Frivolity, Part I, Part II)
Chad Finn (Ode to Baseball Cards)
David Cameron (Mariners Foibles)
Chris Dial (Chipper Jones)
Pat Lederer (Memory Lane)
David Appelman (Clutch Pitching)
Bob Rittner (DH)
Jonathan Mayo (Roger Clemens)
Lisa Winston (My Son-in-Law...)
Russ McQueen (The Yellow Hammer)
Bob Rittner (I'm OK, You're OK)
Mark Armour (In Defense of the HOF)
Pat Jordan (Friends)
Dan Levitt (Analysis of Terry Ryan)
Doug Baumstein (Trading Econ 101)
Ross Roley (Runner's Reluctance II)
Ross Roley (Runner's Reluctance I)
Mark Armour (No-Longer Lovable Sox)
Bruce Regal (Stealthy and Wise)
Brian Gunn (Roid Monster)
Current/McEvoy (Value of the SB)
John Rickert (Sinister Thefts)
Nate Silver (Sabermetrics)
David Vincent (Home Run Production)
Joe P. Sheehan (Enhanced Gameday II)
Mark Armour (An Ode to Sport)
David Gassko (All-Time Worm Burners)
Joe P. Sheehan (Enhanced Gameday)
John Walsh (When Titans Clash)
Fox/Williams (Quantifying Coaches II)
Fox/Williams (Quantifying Coaches I)
Jacob Luft (Bull Durham Rant)
Chad Finn (Strat-O-Matic)
Lisa Winston (Rotisserie Baseball)
Dave Studeman (Baseball Stats)
Steve Treder (Roger Craig)
Marc Normandin (Jeff Bagwell)
D. Appelman (Expanding Strike Zone)
Jeff Sackmann (Worst MiL Defenders)
Jeff Sackmann (Best MiL Defenders)
Maxwell Kates (Van Lingle Mungo)
David Appelman (Pitch Location)
Kent Bonham (Danny Ray Herrera)
Glenn Stout (Two Baseball Poems)
Bruce Regal (The Challenge Round)
Mark Lamster (Barry & Ty)
Geoff Young (NL West)
Tom Lederer (The Ryan Express)
Brian Erts (Great Leap Forward)
David Pinto (Parity and the N.L.)
Jacob Luft (Fathers and Daughters)
Jamey Newberg (Pete's Sake)
Jeff Albert (A. Jones Swing Analysis)
Jeff Albert (A-Rod Swing Analysis)
Keith Law (Death, Taxes, and Waivers)
Peter Abraham (Tales of Torre Tales)
Larry Borowsky (Let 'er Rip II)
Dan Levitt (Empirical Analysis of Bunting)
Jonah Keri (If I Met Warren Cromartie...)
Bob Klapisch (War Stories)
Bob Timmermann (John F. Kennedy HS)
Kent Bonham (Aluminum Adjustments)
Al Doyle (More Than Superstars)
Ross Roley (Instant Replay)
David Vincent (Barry Bonds Homers)
Chad Finn (Our Favorite Obscurities)
Bill Deane (1979 NL MVP)
Mark Armour (Rise/Fall of Artificial Turf)
Jeff Angus (Wally Moon Camp)
David Berri (Money and Baseball)
Larry Borowsky (Baseball w/o the #s)
Derek Zumsteg (The Irrational Market)
David Regan (Free Agent Contracts)
Peter Schmuck (Steroids and the HOF)
David Appelman (Pitchers, Pitch by Pitch)
Dan Fox (Swinging, Taking, Fouling, Etc)
Patrick Sullivan (Study of NYY CF/BOS LF)
Will Leitch (Baseball Journalism)
Jeff Sullivan (Pitcher Release Points)
Steve Treder ('69-'70 Giants)
Maury Brown (Charlie Finley)
John Brattain (Bob Johnson)
Bob Klapisch (The Case for Bert Blyleven)
Jeff Peek (Pride and Prejudice)
Dayn Perry (Bert and Warren)
Rob Neyer (If Don Sutton Was Great...)
Lisa Winston (Minor League Memories)
Alex Belth (Otis Redding Was Right)
David Cameron (Long Live the King)
Jeff Angus (Baserunning Study)
Bert Blyleven (Baseball Playoffs)
Boyd Nation (Not a Prospect List)
James Click (Batters-Baserunners Study)
Jeff Shaw (Why I Love Baseball)
David Gassko (BIP/BFP Fielding Study)
Jay Jaffe (Milwaukee Sausage Race)
Jamey Newberg (Remember When)
Bob Klapisch (Press Box to the Mound)
Dan Levitt (Predictive Value of BB)
David Vincent (Official Scorer)
Jon Weisman (Rick Monday)
Larry Borowsky (Let 'er Rip)
Will Carroll (Fictional Short Story)
Bob Timmermann (Japanese Baseball)
Cyril Morong (Best Pitching Seasons)
Sean Forman (Monte Carlo Win-Loss)
Brian Gunn (My Little Blue Book)
Joe Lederer (My Dad and Baseball)
Bill Deane (Bob Gibson, 1968)
Mark Armour (1977 Yankees)
Darren Viola (Retrosheet)
David Pinto (RFK)
Dayn Perry (Brave Heart)
Matt Welch (Dave Hansen)
Kevin Kernan (Jack McKeon)
Tom Lederer (Dodgers Road Trip)
Steve Lombardi (Slider)
Studes (Picturing Baseball)
Mike Carminati (Luck of the Drawl)
Eric Neel (Vin Scully)
J.C. Bradbury (Leo Mazzone)
John Sickels (Bill James)
Search Baseball Analysts
Archives
By Category:
Around the Majors Content Only
Around the Minors Content Only
Baseball Beat Content Only
Baseball Beat/Change-Up Content Only
Baseball Beat/WTNY Content Only
Behind the Scoreboard Content Only
Change-Up Content Only
Change-Up/Around the Majors Content Only
Command Post Content Only
Crunching the Numbers Content Only
Designated Hitter Content Only
F/X Visualizations Content Only
Past Times Content Only
Saber Talk Content Only
The Batter's Eye Content Only
Touching Bases Content Only
Weekend Blog Content Only
WTNY Content Only
By Month:
February 2012
January 2012
December 2011
October 2011
September 2011
August 2011
July 2011
June 2011
May 2011
April 2011
March 2011
February 2011
January 2011
December 2010
November 2010
October 2010
September 2010
August 2010
July 2010
June 2010
May 2010
April 2010
March 2010
February 2010
January 2010
December 2009
November 2009
October 2009
September 2009
August 2009
July 2009
June 2009
May 2009
April 2009
March 2009
February 2009
January 2009
December 2008
November 2008
October 2008
September 2008
August 2008
July 2008
June 2008
May 2008
April 2008
March 2008
February 2008
January 2008
December 2007
November 2007
October 2007
September 2007
August 2007
July 2007
June 2007
May 2007
April 2007
March 2007
February 2007
January 2007
December 2006
November 2006
October 2006
September 2006
August 2006
July 2006
June 2006
May 2006
April 2006
March 2006
February 2006
January 2006
December 2005
November 2005
October 2005
September 2005
August 2005
July 2005
June 2005
May 2005
April 2005
March 2005
February 2005
January 2005
December 2004
November 2004
October 2004
September 2004
August 2004
July 2004
June 2004
May 2004
April 2004
March 2004
February 2004
January 2004
December 2003
November 2003
October 2003
September 2003
August 2003
July 2003
June 2003
Reference
Organizational Stats
Arizona Diamondbacks Bat / Pitch
Atlanta Braves Bat / Pitch
Baltimore Orioles Bat / Pitch
Boston Red Sox Bat / Pitch
Chicago Cubs Bat / Pitch
Chicago White Sox Bat / Pitch
Cincinnati Reds Bat / Pitch
Cleveland Indians Bat / Pitch
Colorado Rockies Bat / Pitch
Detroit Tigers Bat / Pitch
Florida Marlins Bat / Pitch
Houston Astros Bat / Pitch
Kansas City Royals Bat / Pitch
Los Angeles Angels Bat / Pitch
Los Angeles Dodgers Bat / Pitch
Milwaukee Brewers Bat / Pitch
Minnesota Twins Bat / Pitch
New York Mets Bat / Pitch
New York Yankees Bat / Pitch
Oakland Athletics Bat / Pitch
Philadelphia Phillies Bat / Pitch
Pittsburgh Pirates Bat / Pitch
St. Louis Cardinals Bat / Pitch
San Diego Padres Bat / Pitch
San Francisco Giants Bat / Pitch
Seattle Mariners Bat / Pitch
Tampa Bay Devil Rays Bat / Pitch
Texas Rangers Bat / Pitch
Toronto Blue Jays Bat / Pitch
Washington Nationals Bat / Pitch
All-Star Links
Official Websites
News and Notes
Baseball News Blog
Baseball Newstand
ESPN Baseball
Fox Sports Baseball
Pro Sports Daily
Roto World
The Roto Times
USA Today Baseball
Baseball Newstand
ESPN Baseball
Fox Sports Baseball
Pro Sports Daily
Roto World
The Roto Times
USA Today Baseball
Reference and Analysis
Baseball Almanac
Baseball America
Baseball Archive
Baseball Contracts
Baseball Cube
Baseball Graphs
Baseball Library
Baseball Musings Player Database
Baseball Page
Baseball Primer
Baseball Prospectus
Baseball Reference
Baseball Statistics
Baseball Truth
Boxscore Central
Diamond Mind Baseball
Doug's Stats
FanGraphs
Fast Balls (pitchfx catalog)
Hardball Dollars
Hardball Times
Hit Tracker
Retrosheet
Rotobase/Rotoblog
Stat Corner
STATS
Tango on Baseball
Yahoo Sports MLB
Web Gems
Bill James Primer
Sabermetric Manifesto (Grabiner)
Pitching and Defense (McCracken)
Pitching and Defense (Tippett)
Transactions Primer (Neyer)
Baseball Stats (Batter's Box)
Prospect Report (Cameron)
Pitcher Workloads (Sheehan)
Goodbye to Old Baseball Ideas (Rickey)
Sabermetric Manifesto (Grabiner)
Pitching and Defense (McCracken)
Pitching and Defense (Tippett)
Transactions Primer (Neyer)
Baseball Stats (Batter's Box)
Prospect Report (Cameron)
Pitcher Workloads (Sheehan)
Goodbye to Old Baseball Ideas (Rickey)
Columnists
Baseball Blogs
Around the Majors
Athletics Nation
Baseball Crank
Baseball Musings
Baseball-Reference Blog
Batter's Box
Big League Stew
Bronx Banter
Catfish Stew
Cub Town
Dan Agonistes
Dodger Thoughts
DRays Bay
Ducksnorts
Futility Infielder
Halos Heaven
Inside the Rockies
It Might Be Dangerous
Knuckle Curve
LoHud Yankees Blog
Lookout Landing
Management by Baseball
Metaforian
Metsgeek
Mike's Baseball Rants
Only Baseball Matters
Redbird Nation
Red Reporter
Sabernomics (Braves)
Seth Speaks
ShysterBall
6-4-2 (Angels/Dodgers)
The Book
TheCubdom
The Cutting Edge
The House That Dewey Built
The View From The Bleachers
Tiger Blog
U.S.S. Mariner
Viva El Birdos
Where's Kernan
Minor Leagues
Arizona Fall League
BA Player Finder
Cal Leaguers
Jamey Newberg
JDM's Scoresheet Baseball
Minor League Baseball
Minor League Park Factors
Minor League Splits
No Pepper
Sickels' Minor League Ball
Warm October Nights
BA Player Finder
Cal Leaguers
Jamey Newberg
JDM's Scoresheet Baseball
Minor League Baseball
Minor League Park Factors
Minor League Splits
No Pepper
Sickels' Minor League Ball
Warm October Nights
Amateur
Boyd's World (College)
Cape Cod Baseball League
College Baseball Blog
College Baseball Insider
Collegiate Baseball Newspaper
College Splits
College Splits Blog
Dirtbags Baseball (Long Beach State)
NCAA Baseball
NCBWA
Team One Baseball (High School)
Texas A&M & Baseball
Cape Cod Baseball League
College Baseball Blog
College Baseball Insider
Collegiate Baseball Newspaper
College Splits
College Splits Blog
Dirtbags Baseball (Long Beach State)
NCAA Baseball
NCBWA
Team One Baseball (High School)
Texas A&M & Baseball
Historical
Cuban Baseball
House of David
Jim "Mudcat" Grant's Web Page
Negro League Baseball Players Assoc
Negro Leagues Baseball Museum
1919 Black Sox
Pacific Coast League
Philadelphia Athletics Historical Society
Shoeless Joe Jackson Society
SABR-L Archives
Walter O'Malley
House of David
Jim "Mudcat" Grant's Web Page
Negro League Baseball Players Assoc
Negro Leagues Baseball Museum
1919 Black Sox
Pacific Coast League
Philadelphia Athletics Historical Society
Shoeless Joe Jackson Society
SABR-L Archives
Walter O'Malley
Miscellaneous
Forums
Credits
Ticket Center
Tickets to Baseball -
Premium Red Sox Tickets - Tickets to Marlins Games - Cardinals Game Tickets - NY Yankee Tickets - Tickets Oakland Athletics - Dallas Cowboys Tickets - Arizona Cardinals Tickets - Tickets Seattle Seahawks - Buffalo Bills Tickets Online - Tickets to Dolphins Football
Buy Boston Red Sox tickets,
Philadelphia Phillies tix,
NY Yankees tickets,
NY Mets tickets, and
MLB All Star game tickets at ABC tickets
Not sure where to find the best online sportsbooks? Start your search with PlayersJet.
Get deals at SportsMemorabilia.com on baseball apparel, including Phillies jerseys and more for adults and children.
Shop the largest selection baseball equipment on sale at Sports Unlimited. Check out tons of baseball gloves, youth baseball gloves and catchers gear from Rawlings, Wilson, Nike & Under Armour.
2011 Draft Order
Courtesy of Baseball America
First-Round:
 1. Pirates (57-105)
 2. Mariners (61-101)
 3. Diamondbacks (65-97)
 4. Orioles (66-96)
 5. Royals (67-95)
 6. Nationals (69-93)
 7. Diamondbacks (for B. Loux)
 8. Indians (69-93)
 9. Cubs (75-87)
10. Padres (for Karsten Whitson)
11. Astros (76-86)
12. Brewers (77-85)
13. Mets (79-83)
14. Marlins (80-82)
15. Brewers (for Dylan Covey)
16. Dodgers (80-82)
17. Angels (80-82)
18. Athletics (81-81)
19. Red Sox (from DET for Martinez)
20. Rockies (83-79)
21. Blue Jays (85-77)
22. Cardinals (86-76)
23. Nationals (from CWS for Dunn)
24. Rays (from BOS for Crawford)
25. Padres (90-72)
26. Red Sox (from TEX for Beltre)
27. Reds (91-71)
28. Braves (91-71)
29. Giants (92-70)
30. Twins (94-68)
31. Rays (from NYY for Soriano)
32. Rays (96-66)
33. Rangers (from PHI for Lee)
Supplemental First Round:
34. Nationals (Dunn)
35. Blue Jays (Downs)
36. Red Sox (Martinez)
37. Rangers (Lee)
38. Rays (Crawford)
39. Phillies (Werth)
40. Red Sox (Beltre)
41. Rays (Soriano)
42. Rays (Balfour)
43. Diamondbacks (LaRoche)
44. Mets (Feliciano)
45. Rockies (Dotel)
46. Blue Jays (Buck)
47. White Sox (Putz)
48. Padres (Garland)
49. Giants (Uribe)
50. Twins (Hudson)
51. Yankees (Vazquez)
52. Rays (Benoit)
53. Blue Jays (Olivo)
54. Padres (Torrealba)
55. Twins (Crain)
56. Rays (Choate)
57. Blue Jays (Gregg)
58. Padres (Correia)
59. Rays (Hawpe)
| Change-Up | February 27, 2009 |
National League East Division Preview (Featuring Kevin Kernan)
It’s preview season, folks, and we're shifting gears for 2009. We are scrapping the Two on Two format we have run the past few years. It was fun, conversational and we had some talented guests. But they were looooong and light on numbers. We're changing it up this season.
Here’s the deal. For hitters we take PECOTA and the four projection systems on Fangraphs. Fangraphs, by the way, is awesome. They are doing terrific, differentiated, value-add work and if you are a regular reader of Baseball Prospectus and/or The Hardball Times, you should add Fangraphs to your favorites as well. Anyway, we average all five of these projection systems to give you a sense for how the number crunchers see the players performing this season.
For pitchers, in the interest of keeping things simple and consistent, we go with the three projection systems readily available on the Fangraphs player pages. No PECOTA because the data presentation was not as compatible with the numbers we wanted to display.
We went with depth charts from ESPN.com. Some of the players penciled in below will not be starting, and some might not break camp. But we figured this was a pretty good way to go. As we draw closer to Opening Day with the other divisions, we will look to implement as accurate of an indication as possible with regard to who figures to start at each position.
You will then get brief commentary from me, from another Baseball Analysts contributor (today it’s Papa Bear, Rich) and then a member of the mainstream media. What’s a preview without someone who managed to emerge from their Mom’s basement?
Today we kick off with the NL East, and we are grateful to Kevin Kernan of the New York Post for participating.
Catcher
                AVG   OBP   SLG
Ruiz, C.       .253  .332  .378
Schneider, B.  .249  .326  .368
Baker, J.      .259  .337  .394
McCann, B.     .296  .362  .506
Flores, J.     .249  .306  .408
Kevin: Mets have to get some offense from Brian Schneider, who insists he is better prepared for the challenge of playing in New York this year.
Sully: The 25-year old Brian McCann is the strongest of this bunch but I will be interested to see if John Baker can build on his .299/.392/.447 stint in the Big Leagues last season.
Rich: McCann, hands down. His 2008 season was about halfway between his 2006 and 2007 campaigns. I see no reason why he won't put up similar numbers this year. In the meantime, I've got the unders on Baker repeating those rate stats as a sophomore.
First Base
                AVG   OBP   SLG
Howard, R.     .271  .369  .562
Delgado, C.    .265  .350  .492
Cantu, J.      .270  .321  .455
Kotchman, C.   .281  .348  .431
Dunn, A.       .246  .378  .506
Rich: Ryan Howard is in the prime of his career and reportedly in great shape. What's not to like? I meant with respect to Howard, not Florida's and Atlanta's first basemen.
Kevin: Over a 23 day span in September the revitalized Carlos Delgado slugged seven home runs and drove in 19 runs. Over that same stretch Ryan Howard hit 11 home runs and drove in 31 runs. Enough said.
Sully: Some announcer is going to remark in September that Jorge Cantu, with 23 home runs and 89 RBI is having "another productive year". Take it to the bank.
Second Base
                AVG   OBP   SLG
Utley, C.      .295  .376  .515
Castillo, L.   .276  .354  .340
Uggla, D.      .259  .340  .477
Johnson, K.    .281  .362  .453
Hernandez, A.  .245  .295  .337
Sully: In a division loaded with individual stars, Chase Utley remains the very best. Now 30, it will be interesting to see how long he can keep up the HOF-caliber output (with the bat and glove) that we have seen from Utley since he burst onto the MLB scene in 2005. Four second basemen have had a better OPS+ in their 26-29 seasons: Rogers Hornsby, Nap Lajoie, Eddie Collins and Rod Carew. Not bad.
Rich: If Utley is healthy from the get go, he is the class of this group, followed by Dan Uggla, Kelly Johnson, and . . . yuck . . . I'll leave it at those three.
Kevin: Draw up a second baseman that is a winner and you have Chase Utley. Jerry Manuel is trying to pump new life in Luis Castillo, saying he could bat leadoff. Utley, who is always self-motivating, is coming back from hip surgery.
Third Base
                AVG   OBP   SLG
Feliz, P.      .251  .297  .417
Wright, D.     .307  .397  .536
McPherson, D.  .228  .310  .439
Jones, C.      .322  .420  .545
Zimmerman, R.  .288  .351  .472
Sully: When you factor durability, it's hard to take Chipper Jones over David Wright but my goodness, how good is Chipper? If he can muster another excellent full season or two and steer clear of too steep of a decline phase, he has an outside chance of finishing up as the finest third baseman ever to play. Go look for yourself. It's nuts.
Rich: It is nuts. Nobody is passing Mike Schmidt anytime soon. As close as Chipper and Michael Jack are offensively, don't forget defense. Jones is a no brainer Hall of Famer but Schmidt is the best third baseman in the history of baseball.
Kevin: Look for Wright to make big-time adjustment this season as Mets are working on hitting the ball the other way in special drills designed by Manuel. Chipper is the model third baseman.
Shortstop
                AVG   OBP   SLG
Rollins, J.    .281  .343  .454
Reyes, J.      .294  .355  .456
Ramirez, H.    .306  .383  .524
Escobar, Y.    .291  .362  .409
Guzman, C.     .298  .337  .423
Sully: Not a bad one in the group, but give me the perennial MVP candidate, defensive warts and all.
Rich: Now we're talking, Sully. I love Jose Reyes but Hanley Ramirez might be the most valuable property in the game.
Kevin: Numbers don’t tell the entire story of this position. Jimmy Rollins has an inner toughness that enables him to lift his game at the most vital times. This is the Division of Shortstops. Not a bad duo for Dominican team in WBC with Reyes and Ramirez.
Left Field
                 AVG   OBP   SLG
Ibanez, R.      .282  .346  .466
Murphy, D.      .281  .347  .438
Ross, C.        .264  .329  .483
Anderson, G.    .280  .319  .433
Willingham, J.  .264  .361  .466
Sully: Whereas the NL East is loaded with talent around the infield, it is much thinner in the outfield. I am unsure as to who the best left fielder in the division is, but I do not think that one of Raul Ibanez, Cody Ross or Josh Willingham should be the best at their position in any division! On a side note, isn't Matt Diaz better than Garret Anderson?
Rich: Aren't left fielders supposed to hit? I mean, really hit? Take the best batting, on-base, and slugging average and you only get .282/.361/.483. Yikes!
Kevin: Just think how much fun this division would be if Mets had signed Manny Ramirez. Look for Mets Daniel Murphy to establish himself this season.
Center Field
                 AVG   OBP   SLG
Victorino, S.   .284  .345  .429
Beltran, C.     .278  .366  .502
Maybin, C.      .268  .332  .427
Anderson, J.    .283  .329  .376
Milledge, L.    .277  .345  .433
Sully: It's rare that someone joins a big market team and then becomes underappreciated but is that what we are seeing with Carlos Beltran? After his ridiculous 2004 post-season, Beltran joined the Mets and save for a lackluster first season in Flushing, has been one of the best players in baseball. He's on a HOF track.
Rich: No contest here. Beltran is the man. He's the full package, a five-tool player capable of changing games with his bat, glove, arm, or legs.
Kevin: No one has more confidence than Shane Victorino and that cannot be undersold. Beltran says his knees are healthy again. For all the money the Mets spent on Beltran, they have one playoff appearance to show for it.
Right Field
                 AVG   OBP   SLG
Werth, J.       .272  .365  .468
Church, R.      .266  .345  .448
Hermida, J.     .271  .352  .447
Francoeur, J.   .271  .319  .433
Dukes, E.       .260  .366  .458
Sully: If Elijah Dukes can stay healthy and clean up his act, the sky's the limit. He's an excellent defender with a good handle on the strike zone and solid pop.
Rich: Wow, this division really is thin in the outfield. While there is some talent in this group, it's been more promise than production thus far.
Kevin: Jeff Francouer has made some big changes in his swing. If Ryan Church falters, Mets will go out and get big-time right-fielder at the trade deadline.
Starting Pitching
Philadelphia
              W-L    K/9   BB/9   WHIP   ERA
Hamels, C.    14-8   8.42   2.35   1.13  3.36
Myers, B.     10-9   7.90   3.10   1.33  4.17
Blanton, J.   11-10  5.54   2.57   1.33  4.02
Moyer, J.     10-10  5.45   2.88   1.41  4.57
Kendrick, K.   8-8   4.44   2.87   1.45  4.81
New York
               W-L    K/9   BB/9   WHIP   ERA
Santana, J.   15-8   8.82   2.38   1.12  3.19
Maine, J.     10-10  7.78   3.81   1.34  3.99
Perez, O.     10-10  8.56   4.55   1.42  4.34
Pelfrey, M.   10-10  5.77   3.36   1.43  4.26
Garcia, F.     6-6   6.56   2.75   1.34  4.28
Florida
               W-L    K/9   BB/9   WHIP   ERA
Nolasco, R.   11-9   7.53   2.25   1.24   3.92
Johnson, J.    7-5   7.69   3.46   1.38   3.93
Volstad,C.     8-7   5.88   3.74   1.43   4.32
Sanchez, A.    6-6   7.29   4.04   1.43   4.32
Miller, A.     6-7   7.63   4.57   1.53   4.67
Atlanta
               W-L    K/9   BB/9   WHIP   ERA
Lowe, D.      13-9   5.99   2.46   1.27   3.60
Vazquez, J.   13-10  8.54   2.45   1.22   3.75
Jurrjens, J.  10-8   6.73   3.28   1.36   3.93
Kawakami, K.  --------
Glavine, T.    6-6   4.94   3.62   1.51   4.81
Washington
               W-L    K/9   BB/9   WHIP   ERA
Olsen, S.     9-12   6.45   3.47   1.44   4.66
Cabrera, D.   8-10   6.83   4.63   1.52   4.81
Lannan, S.    8-11   5.68   3.63   1.40   4.27
Hill, S.       4-5   5.69   2.76   1.41   4.32
Balester, C.   6-8   6.45   3.31   1.43   4.80
Sully: Live arms and long games in Miami this season!
Rich: While the Phillies and Mets sport the two best pitchers in the division (if not the league), don't underestimate Atlanta's starters, especially if Kenshin Kawakami is as good as his breaking ball. Derek Lowe has been underrated for far too long and Javier Vazquez's outstanding peripherals are bound to result in a better ERA in the NL than the AL.
Kevin: Johan Santana and Cole Hamels will fight it out for Cy Young. Little known Hamels fact: A former Mets farmhand named Fred Westfall was Hamels first pitching coach when he was in the Carmel Mountain Ranch Little League in San Diego and was the first to begin to teach Hamels the changeup.
Bullpen
Philadelphia
                 K/9    BB/9   WHIP   ERA
Lidge, B.      11.10    4.13   1.27   3.39
Madson, R.      7.22    2.92   1.33   4.00
Durbin, C.      6.48    3.42   1.37   4.15
New York
                 K/9    BB/9   WHIP   ERA
Rodriguez, F.  10.86    4.01   1.21   2.91
Putz, J.        9.89    3.21   1.19   3.21
Sanchez, D.     6.94    3.51   1.35   3.94
Florida
                 K/9    BB/9   WHIP   ERA
Lindstrom, M.   7.64    3.85   1.43   4.00
Nunez, L.       7.05    2.95   1.29   3.81
Kensing, L.     8.66    4.68   1.42   4.20
Atlanta
                 K/9    BB/9   WHIP   ERA
Gonzalez, M.    9.41    3.91   1.28   3.43
Acosta. M.      7.07    4.97   1.48   4.26
Boyer, B.       7.85    3.89   1.45   4.49
Washington
                 K/9    BB/9   WHIP   ERA
Hanrahan, J.    8.74    4.19   1.43   4.10
Rivera, S.      6.73    3.85   1.44   3.98
Shell, S.       7.46    3.14   1.33   4.18
Sully: Philadelphia and New York are head and shoulders above the rest of the division, at least as we look at it at this point. Bullpens are tough to predict and maybe some arms will emerge for the other teams but for now, it is the bullpen that seems to represent the biggest area of separation between the class of the division and the also-rans.
Rich: Brad Lidge was 48-for-48 in save opportunities (including the postseason) and led all relievers in Win Probability Added last season. Get this, he has averaged 12.50 K/9 over the course of his six-year career. K-Rod and J.J. are upgrades for the Mets, at least versus the post-Billy Wagner days last season.
Kevin: K-Rod t-shirt ($28) is four dollars more than David Wright t-shirt. Omar has put his money in the bullpen to try to match up with Lidge after Mets blew 29 saves in 2008.
Bench
Sully: I like Philadelphia's bench. Ronny Paulino might help, and Geoff Jenkins could bounce back and once again pound on righties the way he had his whole career.
Rich: The benches don't look all that great to me. Look for a late free agent signing or a rookie (Jordan Schafer?) making the difference here.
Kevin: Phils seem to understand this concept better than most teams.
Who are the awards candidates from the NL East?
Kevin: The MVP and Cy Young will come out of this division, Hamels or Santana. Reyes will be in the MVP race.
Rich: Kevin may be right. The MVP and Cy Young winners could very well come from the NL East. I'd like to see Utley get his due, but I think the Mets third baseman has all the Wright stuff this year. If the Cy Young Award winner emerges from this division, look for Hamels to nab his first or Santana his third. However, Ricky Nolasco's K-BB-GB rates were just as good as those put up by Hamels and Santana last year, and there wasn't a better pitcher in the league from June 10 - through the end of the season.
Sully: There are some obvious ones in Philadelphia and New York but how about Hanley or Chipper? Hanley may need the fish to surprise to get any attention and Chipper will have to defy the medical odds but I think both are MVP caliber talents.
Any surprises this year?
Sully: Rich alluded to this above, but I think Atlanta's starting pitching allows them to hang around deep into the season.
Rich: Uggla gets traded in July and winds up in the postseason.
Kevin: Mets will not choke.
Predictions?
Rich: I will be shocked if the Phillies or Mets don't wind up on top this year. The club that finishes second will win the wild card. Let's say, Mets, Phillies, Braves, Marlins, and Nationals with Florida closer to third than fifth.
Kevin:
1. Mets
2. Phils (wild card winner)
3. Atlanta
4. Florida
5. Nationals
Sully: Well isn't this boring? I think I am with both of you guys here. That looks right to me.
Thanks, Rich and thanks especially to Kevin! Until next Friday...
| Saber Talk | February 26, 2009 |
Leveling the Playing Field
The Rule 4 draft is, without question, one of the most important events of the year for Major League teams. One great draft can change the future of a franchise. The draft gives teams an opportunity to acquire young, talented players for a relatively small financial commitment. If one of them reaches the bigs, and becomes even an average player, you’ll garner yourself a ton of value over that player’s first six years.
Naturally, then, the draft, and studying the amateur players, is a major part of each organization’s yearly workload. Consider this response from Chris Long, Padres’ Senior Quantitative Analyst, in an interview with us last year:
What's so amazing about the baseball draft, and I'm sure the draft in other sports, is the sheer number of players to consider. Different ages, sizes, polish, playing environments, growth potentials, levels of competition faced, ability components, injury tendencies, and it goes on. Then there's the information you get from the scouts. Which scouts are better? Are they looking at the right players, in the right way, the right number of times? What's the best way to integrate all of the information you have? Overlaying all of this are considerations of finance, utility, need, risk and the poker game of the actual draft. Draft the right player and he could be worth $50 or even $100 million in value to your club (see Pujols). Draft the wrong players and you'll waste millions and negatively impact your club for years. It's an extremely difficult, messy, noisy, and thoroughly insane problem to work on. It's beautiful.
We all know about scouting. It's crucial to the game, especially in college and high school, and it isn't going anywhere. But a more unexplored area (at least on the 'net), and perhaps an equally important one, is the thorough analysis of college statistics. Many times, people will bring up what Chris brought up in the above passage, saying there are too many factors to consider, too much noise in the data. There's varying levels of competition, parks, player aging, limited sample sizes, switching from aluminum bats to wood, etc. It goes on and on.
They are, of course, right on the money. Looking at the raw stats of two college players is probably a hapless endeavor. Let's look at a quick, made-up example:
Player A: .300/.480/.680
Player B: .280/.420/.600
They are somewhat close, but if that's all we know about each player, we’ll probably go with Player A every time. But, let's say Player B played against the third-toughest opponents in Division 1 and also played in a big pitcher's park. Player A played in a small conference, against relatively weak competition, and a great hitter's park. Now who are you goin' with? And not to mention, this is a simplified example, which leaves out many significant factors. But it just serves as a reminder that the numbers, alone, are just numbers; they have relatively little utility in sorting out baseball players on the college level.
Anyway, as you can see, the reservations people have about college stats are real. However, there's no reason why we can't try to make some adjustments, and make some sense of the madness.
We've spent the last four months importing and adjusting collegiate baseball statistics in an attempt to neutralize the numbers to allow for cross-conference comparisons. To do this, we've discovered that Boyd's World is an invaluable tool. He gets much of the credit for accumulating a lot of the data and making it available online.
Now, our methods were actually pretty simple. We're judging the players in our system on a few things that we feel are a solid scope for the offensive skills necessary to succeed in professional baseball. They include:
- Weighted On-Base Average (wOBA)
- Isolated Power (IsoP; slugging percentage minus batting average)
- Strikeout percentage (K%; strikeouts divided by plate appearances)
- Walk percentage (BB%; walks divided by plate appearances)
- Speed score
All of the above are pretty self-explanatory, especially with the Wins Above Replacement explosion that happened in November and December of 2008 around the sabermetric blogosphere. However, the wOBA formula we used did not include stolen bases. Honestly, it wasn't for any particular reason, we just happened to grab the one copy of the formula that did not include it.
As for speed score, it's measuring "baseball speed," or, at least, that's the intended goal. It's actually a fairly generic speed score that is not much unlike the one Bill James used in his earlier works.
But, what do we take into account when adjusting these numbers? For us, it was park factors and level of competition faced. Those two components can vary from team-to-team in such a dramatic fashion that you'd initially swear they aren't right. For instance, Air Force had a 4-year park factor from 2005-2008 of 145. Conversely, a school like Longwood University had a park factor over that time of just 72. With such drastic discrepancies, it was important to address this. Again, drawing from Boyd's World, we have multiple-year park factors. He lists two for each team, one being a PF and one being TPF – or Park Factor and Total Park Factor. The former is just rating that team's home park, while the latter is rating all of the parks that team played in over the course of time it was tracked. So, Air Force's 145 park factor is just their home park. Playing in the Mountain West, they frequent some of the most hitter friendly parks in collegiate baseball, and their Total Park Factor was 128 from 2005-08. Basically, over those years, Air Force's team played in environments that were 28 percent more offense-friendly than a neutral ballpark, which would have a rating of 100.
To neutralize for park factors, we take the wOBA for each hitter, and simply run it through this: wOBA*square root(100/Total Park Factor). This nets us a Park-Adjusted wOBA (PAwOBA).
But that's just the first part of the components to neutralize. You also have to take into account the competition these numbers are being tested against. As mentioned previously, two stat lines, unadjusted, are not equal. Thankfully, Boyd's World comes through again with his Strength of Schedule ratings. To neutralize this, we do pretty much the same from above.
PAwOBA*square root(Strength of Schedule/100)
This gets us a wOBA for the players that are now both park and competition adjusted. We do this for IsoP's as well, using the same methods just substituting IsoP for the wOBA's. And before we jump straight to the table (even though this is going on long enough), we'd like to give a brief introduction to our "Score" category. We don't have a catchy name for it yet (although we're open to all suggestions), but what it encompasses is all of the categories that we're tracking. It weights the adjusted wOBA's, adjusted IsoP's, K and BB% and throws in our speed score, as well. But, we've rambled enough. On to the 2008 stats for the first five college bats taken in the 2008 Rule 4 draft:
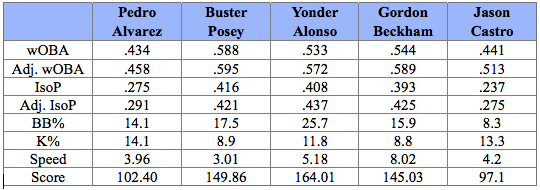
A note on speed score: It's scaled down so it goes as such: -5 is terrible, 0 is bad, 5 is average, 10 is good, 15 is great, 20+ is flat-out burner.
The above are nothing more than just the 2008 numbers for the first five college bats taken last June. They are not meant to be a predictor of talent moving from aluminum to wood bats. Instead, it's just, at the moment, adjusting to see who had the best statistical seasons when you account for who they were playing and where. When the 2009 draft comes around, we'll have a better tool to judge player performance than just the raw stats, and hopefully it will shed some light onto who the top prospects are.
Also, don't forget that we haven't considered positional values or defense. A player's position is very important at this level. Players that start on the left of the spectrum (1b, left field, right field) have to hit a ton to make it in the bigs. Most great prospects start on the right side of the spectrum as amateurs and gradually shift to the left as they age, provided that their bats can play at those less-demanding defensive positions.
Additional Resources
Earlier in the article, it was mentioned that this type of stuff has been somewhat unexplored on the Internet. While that may be the case, there's certainly been plenty of research into the area:
- Right here at Baseball Analysts, Kent Bonham did some very similar work back in 2006.
- Jeff Sackmann, partnering with Bonham, runs collegesplits.com. He also does great work at The Hardball Times, much of it focusing on the college game and its numbers.
- This post at Sons of Sam Horn details how to go about some of these adjustments.
- Lincoln Hamilton, at Project Prospect, has also done some similar analysis.
| Change-Up | February 25, 2009 |
Glory Days
"I had a friend who was a big baseball player back in High School." - Bruce Springsteen
I played high school baseball with three players who went on to play at Princeton University and others who played at smaller, Division 3 schools such as Brandeis, Williams College and Trinity College. I faced Big Leaguers Rich Hill, Mike Smith and Jonah Bayliss and was invited to participate in regional combines and team tryouts like the Area Code Games. All in all, I think I was exposed to some decent baseball.
But Jesus of Nazareth, I could not imagine facing the Long Beach Poly baseball teams of the mid 1990's with one potential future Hall of Famer, Chase Utley, and another standout, Milton Bradley, who is coming off a 163 OPS+ season. Bradley was taken in the second round of the 1996 Amateur Draft and signed immediately with the Montreal Expos. The Dodgers selected Utley in the 2nd round the very next season but Utley chose to go to UCLA instead of signing. Since, Bradley has shown flashes of greatness when he could stay on the field while Utley has had a steadier developmental timetable. He was never truly spectacular until his breakout 2005 campaign. Since, he's been as good as most any other second baseman in baseball history.
There have been other notable, productive high school teammate combos in the Major Leagues. Jason Giambi and Jeremy Giambi played alongside the late Cory Lidle, Shawn Wooten and Aaron Small at South Hills High School in West Covina, California. That's right, FIVE Major Leaguers on one high school team. Recent first rounders Mike Moustakas and Matt Dominguez played on the same team at Chatsworth High School; they were the first pair of position player teammates to be drafted in the first round since 1972, when Jerry Manuel and Mike Ondina were taken out of Rancho Cordova High School in California. High School teammates were also selected in the first round in 2002 (Scott Kazmir among them), 2000 and 1997 (including Michael Cuddyer).
Now, however, there is a new premier duo ready to take their talents to the Bigs. Baseball America released their top-100 prospects yesterday and numbers 1 and 23 batted 3 and 4 for Stratford High School in Goose Creek, SC. Matt Wieters is a 23 year-old, switch-hitting catcher who has hit .355/.454/.600 in his brief Minor League career. He might be the best player in the American League right now. Justin Smoak hit .304/.355/.518 in a brief Minor League stint after being drafted by the Texas Rangers last year but to give you a more complete sense for his potential, he is a former Cape League MVP who hit .383/.505/.757 in his final year playing for the University of South Carolina Gamecocks. Both should be contributing to their respective Major League teams this season.
Gregg Zaun currently stands in Wieters's way as the Baltimore backstop, but that won't last long. Wieters will be starting for the majority of the year. The path for Smoak is a little less clear. Chris Davis has earned a shot as the starting first baseman and Texas has moved veteran Hank Blalock to designated hitter. Smoak stands to begin the season down on the farm but will get his chance at one point or another. He will have to make the most of it if he wants to stick for good at the outset.
What I am interested in is some of the high school teammates that I am missing. Who are the best high school teammates to come out of your local area? Are there other Major Leaguers who played high school ball together going back further that I am not considering? Please feel free to share in the comments section.
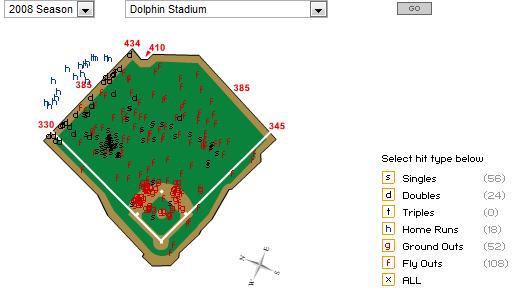
| Touching Bases | February 24, 2009 |
Batted Ball Location Leaderboards
With apologies to Dave Studeman, whose batted ball leaderboards on The Hardball Times are always must reads, I decided to try a similar data presentation, breaking up batted ball stats by fields of play instead of by type. Using linear weight run values, I developed lists showing who the most productive players were in 2008 when pulling the ball, taking the ball back up the middle, or going to the opposite field.
Value of Pulled Batted Balls
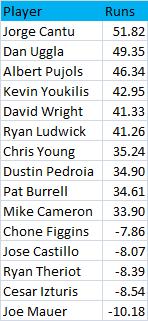
Every one of the top ten players when it came to pulling the ball happened to bat right-handed, which can be explained by their relative advantage when hitting ground balls. Righties who pull grounders force longer throws than lefties who pull grounders. These players are mainly fly ball hitters. In the case of switch-hitters like Chone Figgins, I combined their pulled/center/opposite field stats from each side of the plate, so right-handed balls to left are added to left-handed balls to right to come up with pulled batted balls.
Jorge Cantu and Dan Uggla—who would’ve thunk? Uggla is a former Rule 5 pick and Cantu spent time last year in two different minor league systems before both found their rightful spots on the Marlins. I’d have to attribute their appearance on the leaderboard to coincidence. Dustin Pedroia and Kevin Youkilis, on the other hand, are given a bit of an extra push, as both are clearly aided by the green monster. Pedroia might be the perfectly suited player for Fenway. Just check out his home run chart. He has yet to hit a 400-foot homerun in his career. You have to wonder whether he’d be the MVP outside of that park, as it would certainly be a challenge to find a voter who checks park-adjusted stats.
I don’t think I ever expected to see the universally beloved Joe Mauer on the bottom of any list, but he gets murdered by pulled groundballs. Only three of his nine long balls went to right field in 2008, as he unfortunately never developed the 20 homerun power people were hoping for. Chone Figgins, Ryan Theriot, and Cesar Izturis all had one homerun apiece last year, while Castillo tallied six, so it appears that a minimal amount of power is necessary to be successful pulling the ball.
Value of Center Field Batted Balls
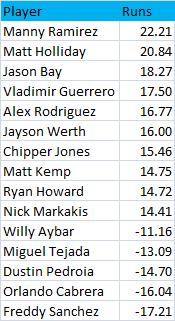
It’s interesting that the top six players on this list bat right-handed. But the bottom four players do too, so that would suggest that the trend of righties is random. It’s tough to choose between the hitters best at pulling the ball and best at going up the middle, but I’m siding with the latter set of players. I’d classify the first set of hitters more as homerun hitters and the second set as line drive types. Pedroia appears at the bottom of this list, likely because in Fenway he doesn’t derive the same benefit from his fly balls to center as he does to the left-field wall. He picked up just three hits on 73 center-field flies.
Value of Opposite Field Batted Balls
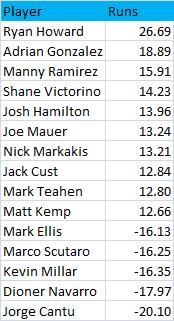
What Mauer lacks in pulled balls he makes up for with his approach going the other way, as he is the only catcher to appear on a leaderboard. Nick Markakis, Matt Kemp, and Manny Ramirez all show up as top center and opposite field hitters. These guys are at times described as "pure" hitters, and there's why. I'd presume each one is quite talented at going with the pitch.
Without trying to sound hyperbolic, I have to ask: is Ryan Howard the greatest opposite-field power-hitter ever? His 2006 and 2008 seasons in which he crushed 25 and 20 opposite-field blasts, respectively, are the only years in the last four in which any player has hit more than even 15 homers to their weak side. Howard does have his opposite-field numbers skewed by his groundball run value, which is likely only positive due to the vacated side of the infield.
Analyzing Howard’s trends piqued my interest in a specific batted ball type and location: pulled groundballs. There were seven players who cost their team 20 runs on pulled grounders: Mark Teahen, Prince Fielder, Adrian Gonzalez, Ryan Howard, Jimmy Rollins, Casey Kotchman, and Carlos Delgado. Several of these players do indeed receive the defensive shift, but I immediately noticed one of these names is not like the other. Jimmy Rollins sticks out like a sore thumb. He’s a switch-hitter, and as such is the only non-lefty to appear on the list. He is far and away the fastest player in the group and an absolutely awesome baserunner, but he apparently wasn’t able to make the most of his speed last year when he put the ball in play, compiling a well below league average 19% hit rate on grounders and legging out a single bunt hit in seven attempts.
Adrian Gonzalez might actually have power that approaches Howard’s but we’ll never know until he gets out of Petco. At the other end, one thing’s for certain: pitchers need to find ways to prevent Cantu from pulling the ball. Here's what the spray chart for Cantu—perhaps the best pull hitter and worst opposite field hitter in the game—looks like.
| Baseball Beat | February 23, 2009 |
Comparing First-Year Eligible Arbitration Signings
The 2009 salary arbitration process, which was collectively bargained and implemented in 1974, has come and gone with the players making out just fine. Of the 111 players who filed for arbitration last month, 65 settled prior to exchanging salary figures, 43 negotiated contracts after submitting numbers, and only three cases were heard by arbitration panels (with the players winning two and losing one).
Florida Marlins second baseman Dan Uggla won his arbitration case and will make $5.35 million rather than the $4.4 million the team offered. Washington Nationals righthander Shawn Hill was awarded his asking price of $775,000 instead of the $500,000 submitted by the club. Tampa Bay Rays catcher Dioner Navarro, on the other hand, lost his arbitration case and will make $2.1 million rather than the $2.5 million he was seeking. Don't feel too badly for Navarro as he will still pull down $1,667,500 more than the $432,500 he earned in 2008.
Maury Brown of The Biz of Baseball has compiled all of the vital stats. According to Maury, the average year-over-year increase in salary for the 111 players who filed was a "whopping 751 percent."
As Fred Claire observed, "The arbitration-generated salaries are in sharp contrast to what has happened in this year's free-agent market where a number of high-profile players have had to sign contracts far below their expectations and a number of other 'name' players remain on the sidelines without contracts."
What was of interest to me were the number of contracts that were negotiated at or near the midpoint with little interest on the part of players and owners to "win." I put together a list of ten first-year eligible position players who signed one-year contracts earlier this month to avoid salary arbitration with the objective of analyzing these deals. There were several others who avoided arbitration by signing longer-term agreements. The latter transactions are much more difficult to compare than the relatively simple and straightforward one-year deals.
Before we get too far ahead of ourselves here, I thought it would be instructive to review the ins and outs of salary arbitration. The Major League Baseball Players Association provides the following primer on its website.
Q: When does a player become eligible for salary arbitration?A: A player with three or more years of service, but less than six years, may file for salary arbitration. In addition, a player can be classified as a "Super Two" and be eligible for arbitration with less than three years of service. A player with at least two but less than three years of Major League service shall be eligible for salary arbitration if he has accumulated at least 86 days of service during the immediately preceding season and he ranks in the top 17 percent in total service in the class of Players who have at least two but less than three years of Major League service, however accumulated, but with at least 86 days of service accumulated during the immediately preceding season.
The details of the ten negotiated contracts referred to above are provided in the following table, along with positions, ages, major league service time, and career batting (AVG/OBP/SLG/OPS+) and fielding (Ultimate Zone Rating per 150 games) rate stats:
                    POS    BORN     ML SERV   CONTRACT    AVG    OBP    SLG    OPS+  UZR/150
Andre Ethier        RF    4/10/82    2.153    $3.100M    .299   .364   .482    116     0.1
Jeff Francoeur      RF    1/08/84    3.088    $3.375M    .268   .312   .434     92     9.6
Corey Hart          RF    3/24/82    3.038    $3.250M    .277   .323   .485    106    -0.5
Conor Jackson       LF    5/07/82    3.067    $3.050M    .287   .367   .443    105    11.5
Mike Jacobs         1B   10/30/80    3.047    $3.250M    .262   .318   .498    110    -8.6
Kelly Johnson       2B    2/22/82    3.127    $2.825M    .273   .356   .440    108    -9.1
Ryan Ludwick        RF    7/13/78    3.109    $3.700M    .273   .345   .512    122    10.3
Rickie Weeks        2B    9/13/82    3.131    $2.450M    .245   .352   .406     97   -10.9
Josh Willingham     LF    2/17/79    3.123    $2.950M    .266   .361   .472    117    -6.0
Ryan Zimmerman      3B    9/28/84    3.032    $3.325M    .282   .341   .462    110    10.0
The average contract calls for a 2009 salary of $3,127,500. Ryan Ludwick ($3.7M) received the highest amount of money and Rickie Weeks ($2.45M) the lowest with the other eight tightly bunched in a range of $2.95M (Josh Willingham) to $3.375M (Jeff Francoeur).
Although Andre Ethier only had 2.153 years of MLB service, he was eligible for arbitration as a "Super Two." Ethier ranks first in AVG, second in OBP, fourth in SLG, and third in OPS+, yet agreed to a deal that was only the sixth highest overall and last among his peers in right field. This one looks like a better deal for the Dodgers than Ethier.
Francoeur and the Braves agreed to a salary that was exactly in the middle of the figures that were exchanged ($3.95M and $2.8M). He has the worst OBP and OPS+ of them all despite manning a corner outfield position. He is the second-youngest player in the group but that is neither here nor there when it comes to salary arbitration. He is one of the most overrated players in baseball and his contract is a huge win for him and a disservice to the arbitration process.
Corey Hart re-signed with the Brewers for the average of what each side wanted ($3.8M and $2.7M). No performance bonuses were attached to the deal. Hart's stats pale in comparison to Ethier but his back-to-back 20 HR/20 SB seasons give his numbers more sizzle in an arbitration hearing than his similarly aged counterpart. I would call this one a fair deal for both sides.
Like Hart, Conor Jackson and the Arizona Diamondbacks reached a settlement that split the difference between what each side submitted ($3.65M to $2.45M). There were no performance bonuses. His UZR rating in left field is based on a small-sample size, and it is still possible that he could end up at first base (where he sports a -3.5 UZR/150 games rating) if Eric Byrnes is healthy and productive enough to win back his job in left. Let's call this one a draw.
Mike Jacobs signed with the Royals at a price ever so slightly below the mid-point of what he asked for ($3.8M) and what the club offered ($2.75M). The first baseman can make up the gap of $25,000 by being named to the All-Star team. He has the second-highest SLG but plays a position that demands power, especially when one doesn't get on-base more often or contribute in a more positive manner defensively. When KC acquired him, I figured he wouldn't make more than $3M in arbitration. I stand corrected and believe his contract is a bit on the high side given his overall production.
Kelly Johnson and the Braves met at the halfway point of their submissions ($3.3M and $2.35M, respectively). The second baseman can earn $50,000 if he reaches 620 PA and another $25,000 for 670 PA. At best, Johnson can make $2.9M, which would be the second-lowest agreed-upon salary in this group. I believe this deal is the opposite of Francoeur's — a good one for the team and a bad one for the player. If anything, this contract is another in a long line of examples where second basemen are treated unfairly by the system.
The gap between the Cardinals offer ($4.25M) and Ludwick's asking price ($2.8M) was the largest in this sample. It appears as if St. Louis tried to lowball him initially because he wound up receiving a salary that was much closer to his side plus the following performance bonuses: $25,000 each for 625 and 650 PA and an additional $50,000 for 675 PA. Ludwick ranks first in career SLG and OPS+ and is coming off the best season, by far, of any of these players. However, he was rewarded handsomely for his contributions.
Weeks and the Brewers avoided arbitration by agreeing to a $2.45M deal, which was just above the mean of what each side submitted ($2.8M and $2M). Weeks can also earn the following performance bonuses: $25,000 each for 575, 600, 625, 650 PA although it should be pointed out that he has never reached any of those levels in a four-year career that has been marred with injuries and disappointments. It looks like a fair deal based on actual performance but potentially a smart one on the part of the team if Weeks finally fulfills his promise.
Willingham signed with the Nats at a price below the mid-point of the salary ranges ($3.6M-$2.55M). He will earn $25,000 at each of the following plate appearance totals: 525, 550, 575, 600. All told, Willingham can make $3.050M in salary and bonuses, which is just below the average of what each side submitted. His contract is lower than any other outfielder and appears to favor the team slightly more than the player.
Ryan Zimmerman was re-signed by Washington exactly between what the Nationals offered ($3.9M) and what the player submitted ($2.75M). He will receive the following performance bonuses: $75,000 for 500 PA and an additional $50,000 each for 550 and 600 PA. If he reaches 600 plate appearances, Zimmerman will make $3.5M in salary and bonuses. Zimmerman has the fourth-highest career OPS+ and is undoubtedly the best fielder in the peer group at one of the most challenging positions. This is a deal that will most likely pay off for both sides should the youngest player earn his performance bonuses.
| Baseball Beat | February 21, 2009 |
A Doubleheader in February
"It's a beautiful day for a ballgame... Let's play two!"
- Ernie Banks
Is there anything better than a doubleheader? In February, mind you?
Well, my brother Tom and I attended two college season openers yesterday. Two games. Two ballparks. Two of the top-ranked prospects in the country and two of the best pitching performances on the opening weekend of the year. All in all, it was a beautiful day, one that Mr. Cub would have loved.
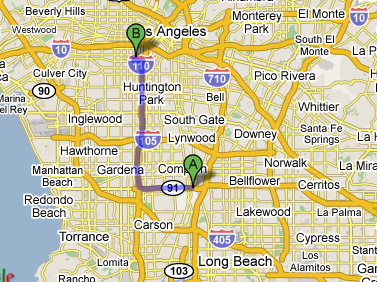 The first game of our day/night doubleheader matched San Diego State against Bethune-Cookman at the Major League Baseball Urban Youth Academy's Collegiate Baseball Tournament in Compton. The second contest was the opener of a three-game set between Long Beach State and the University of Southern California at Dedeaux Field.
Tom and I were joined by general managers, scouting directors, area scouts, and agents in making the 15-mile, 25-minute trip from Compton College to USC. Of the nearly 1,000 fans at each of the two games, approximately 5 percent were employed by MLB teams.
Come the draft in June, we may look back and say there were closer to 6 percent. Scratch that. Not June. But August. You see, Scott Boras represents Stephen Strasburg and Grant Green, who just may go 1-2 in the draft. If not for the weak economy, I could see Boras asking eight figures for Strasburg, the first college player to be named to the U.S. Olympic team since the decision was made to use minor leaguers beginning in 2000.
Boras, whose son Shane is a freshman infielder for USC, was at the evening game. The agent must have been in a great mood after getting the lowdown from one of his scouts on Strasburg's pitching performance earlier that afternoon. While not perfect, the 6-4, 220-pound righthander was dominating, striking out 11 of the 23 batters he faced without allowing an earned run over 5 2/3 innings while leading the Aztecs to a 6-3 victory over the Wildcats.
              IP    H   R   ER  BB  SO
Strasburg     5.2   3   1   0   2   11
Strasburg's fastball lit up the radar guns. While a couple of scouts had him at 100 in the first inning, his gas was sitting at 96-99 from the windup and 93-96 from the stretch all afternoon. His curveball, which is more of a tight-rotation slurve than a 12-to-6 drop, was 79-81, a few mph below his normal 81-84 range according to a scout who has followed him closely. Strasburg's breaking ball didn't have as much depth as you might like, especially when he released it away from his body, but it is an effective companion to his heater.
If Strasburg's fastball is a "plus plus" or a 75/80 on the 20-80 scale that scouts use, his curveball was more like "solid average" or a 55 on Friday. He experienced occasional problems in landing his front foot correctly, causing him to be a bit off balance when throwing his slurve.
As for a third pitch, Strasburg didn't show much. Out of 103 pitches, the 20-year-old junior threw his changeup one time. ONCE. As in one more time than zero and one less time than two. At 88 mph, it's a pitch that many major leaguers would welcome as their fastball. The one scout would like to see him throw it more often and another scout I spoke to told me that it "looked good in the bullpen" before the game.
Aside from the 11 Ks, Strasburg induced four groundball outs and two opposite-field flies to left. He hit one batter, walked two more, and gave up three hits: a first-inning double, a grounder that was pulled just inside the third-base line on a well-located curve below the knees; an infield single to lead off the third that could have gone either way; and a run-scoring single to right field in the sixth, which was the last pitch he threw before being taken out of the game by manager Tony Gwynn.
Strasburg is undoubtedly a special talent and only a major injury or unreasonable bonus demands will keep the Washington Nationals from drafting him No. 1 in the MLB Draft in June.
After getting our fill of one "burg" in the day game and knowing we were going to be watching a "berger" (as in USC RHP Brad Boxberger) in the nightcap, Tom and I opted not to get a hamburger between games and instead settled for prime rib sandwiches at Quizno's. We took the 91 freeway to the 110 and avoided traffic – not bad for rush hour on a Friday in Los Angeles – until a few exits short of our destination, arriving in plenty of time to snag seats in the second row directly behind home plate.
We were treated to another superb pitching performance, one that looked every bit as outstanding as Strasburg's in the box score but not quite up to the same level from a scouting perspective. Not to be outdone, Boxberger allowed just one hit and no runs while striking out a career-high 11 batters en route to USC's 5-3 victory over Long Beach State.
              IP    H   R   ER  BB  SO
Boxberger     6.0   1   0   0   6   11
Boxberger was most impressive in the first inning when he struck out the side after allowing the first two Dirtbags to reach base on a walk and an infield error. His fastball was electric in the opening frame, hitting 92-94, but quickly dropped to 90-92 in the second, and sat mostly in the 80s thereafter.
The 20-year-old junior whiffed two more batters in each of the next three innings (although only one of the three non-strikeouts was put into play as the other two were recorded on runners attempting to steal second base), running his K total to nine through four innings. He failed to punch anybody out in the fifth but nailed two more in the sixth to give him 11 for the evening.
Boxberger not only had a combined 17 strikeouts and walks but found himself in several 3-and-2 counts, throwing a total of 123 pitches on the night. However, the 6-2, 200-pounder came up big when needed, overpowering the opposition's slow bats and keeping them just enough off balance with his slider and curve. An area scout who pitched in the majors during the 1990s told me that Boxberger "probably needs to choose one or the other because you need a lot of feel to throw both."
Unless Boxberger can build up his arm strength, he might make a better reliever than a starter. If so, it wouldn't be the first time that he was asked to pitch out of the bullpen. He was the closer for the Chatham A's of the Cape Cod Baseball League last summer, appearing in 19 games and recording nine saves while striking out 28 without allowing a home run in 18 2/3 innings. Boxberger has good bloodlines as his father went 12-1 with a 2.00 ERA and was named the Most Valuable Player of the 1978 College World Series in leading the Trojans to a national championship.
Robert Stock, a junior who doubles as the starting catcher and closer, went 2-for-3 with a walk, threw out two runners (one in which he made a quick release and great throw after backhanding a pitch) and tossed a perfect ninth (while hitting 90-91 on the radar gun) for his first save of the season. The 6-1, 190 LHB/RHP cranked a double to right-center to lead off the bottom of the second inning and lined a single to left on a curveball from a southpaw that was on the outer half of the plate in what can only be described as a nice piece of hitting. His only out was another liner to left that looked like a hit upon contact but was run down.
Stock, who skipped his senior year in high school and just turned 19 three months ago, hasn't fulfilled the lofty expectations placed upon him since being named Baseball America's Youth Player of the Year in 2005. He has hit .248 (59-for-238) with only 14 XBH in two summers in the Cape for the Cotuit Kettleers. But it is important to remember that Stock is still young and has always played against older competition. This just might be the year that he breaks out.
The main disappointment of the day was watching Green go hitless in four at-bats while striking out three times, twice looking. The 6-3, 180-pound shortstop was fit to be tied, perhaps trying to do too much in his debut. He swung and missed with a pronounced upper cut on several hittable pitches and took a few others that were in the strike zone but not in his wheelhouse. With USC pitchers striking out 15 and nailing two trying to steal, he didn't have a lot of activity in the field but made a nice play ranging to his left on a chopper over the mound.
A scout sitting in the row behind us said Green "doesn't look as strong as he did in the Cape" (when he hit .348/.451/.537 and was among the league leaders in most offensive categories) and believes he's not as physical as Troy Tulowitzki, a comparison that I mentioned after watching him make his collegiate debut two years ago and others have made as well. He likes his hands and thinks Green can stick at shortstop in the pros, yet seemed unconcerned because the only thing that could keep him from manning that position is getting too big, which wouldn't necessarily be the worst thing in the world.
The USC-Long Beach State weekend series will resume tonight at 5 p.m. at Blair Field while San Diego State faces Southern University in the MLB Urban Youth Academy Tournament at 6:00 p.m. The latter game will be televised live on the MLB Network. I'm going to the Trojans-Dirtbags contest and will be in my seat in time to see actress Sandra Bullock, who lives with her husband Jesse James in nearby Sunset Beach, throw out the first pitch.
Update: Sandra Bullock and the Long Beach State hitters pulled a no-show on Saturday night as the Trojans shut out the Dirtbags 4-0 in the second game of the weekend series before a record crowd of 3,342 at Blair Field.
| Baseball Beat | February 20, 2009 |
Using Z-Scores to Rank Pitchers
If you're not a stathead, fantasy geek, or a baseball nerd, then you might want to skip ahead to the rankings of pitchers in the middle and at the bottom of this article. Or you just may want to skip this article altogether and check out Deadspin, the Onion, or read the latest story or opinion on Alex Rodriguez and his cousin.
You see, I've been sorting and manipulating spreadsheets on the computer in my parents' basement (kind of embarrassing when you're 53) for the past several days. However, I'm not only planning on seeing the light of day this afternoon, I will be one of the fortunate souls who will attend two season openers today: Stephen Strasburg and San Diego State are facing Bethune-Cookman at 2 p.m. PT at the MLB Youth Academy in Compton and the Dirtbags are meeting the Trojans at 6:30 p.m. at Dedeaux Field on the campus of USC. I'll be sure to trade in my pajamas and green eyeshade for a pair of jeans and a Long Beach State (my hometown team) and USC (my college) baseball caps.
In the meantime, thanks to loyal reader and baseball enthusiast Ryan Thibodaux, I have developed a system to rank pitchers based on their strikeout, walk, and groundball rates. I had categorized pitchers by K and GB rates last week before adding BB to the mix earlier this week. The K and GB rankings were grouped in quadrants while the K-BB-GB rankings were presented in eight different sets.
On average, we know that pitchers in the northeast quadrant and those with above-average K-BB-GB rates fared better than their peers, yet many of the top hurlers fell into the southeast quadrant despite sporting strikeout rates – the most important variable of the three – that were superior to many of their counterparts in the more tony neighborhood of the NEQ. So which one is better? A pitcher with above-average K and GB/K-BB-GB rates or one with an outstanding K rate and more modest BB-GB rates?
To help answer that question, Ryan posted a spreadsheet with z-scores on a fantasy baseball website that linked to one of my articles above. After reading the thread and a comment that he left on our site, I contacted him and proposed that he weight the three variables by their relative impact rather than evenly. The deltas in above-average and below-average ERA and R (vs. their means) for each of the various classifications as well as the individual K, BB, and GB correlations to ERA and RA suggested to me that strikeout rates were nearly two times as important as walk rates and five times as important as groundball rates. The best-fit ratio was approximately 5:3:1 or 5:2.5:1.
If you're one of the statheads, fantasy geeks, or baseball nerds still with me, here are the correlation coefficients for strikeout, walk, and groundball rates to ERA and RA for the universe of 135 starting pitchers with 100 or more innings last year:
           K          BB          GB
ERA     -0.5786     0.3306     -0.1121
RA      -0.5918     0.3118     -0.0796
Using standard deviations (4.32% for K, 2.29% for BB, and 6.70% for GB), Ryan created z-scores (which indicate how many standard deviations an observation is above or below the mean) and then weighted them using the 5:2.5:1 ratios as mentioned above. The latter produced correlations of -0.7228 for ERA and -0.7203 for RA. By squaring these correlations, we produce coefficient of determinations (R²) that provide measures of how well outcomes are predicted by the model. Accordingly, the 5:2.5:1 weighting explains about 50 percent of a pitcher's ERA and RA, which is incredibly high given that team defense accounts for the lion's share of the unexplained balance. While we can improve the R² by substituting HR rates for GB, the former is not as reliable as the latter in terms of predicting future performance.
The K-BB-GB rates and z-score rankings can be accessed in this spreadsheet. The 135 qualifying pitchers were separated in quintiles by color. As such, there are 27 starters in each grouping or about one per team. If you'd like, think in terms of each quintile as No. 1s, No. 2s, No. 3s, No. 4s, and No. 5s in starting rotations. The reality is that front, middle, and back of the rotation starters are determined based on quality (which is the sole determinant of these rankings) and quantity (ability to pitch every fifth day, go deep into games, and amass a lot of innings over the course of a season).
The top quintile is presented below.
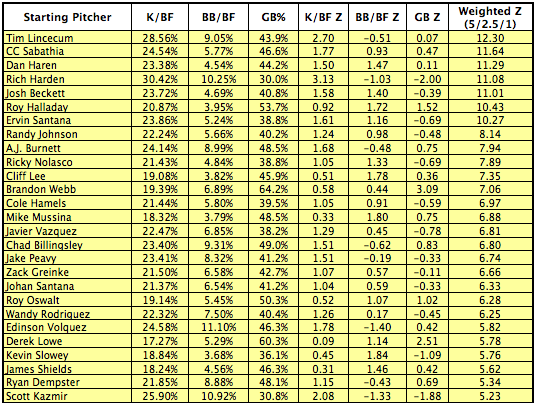
Tim Lincecum, CC Sabathia, Dan Haren, Roy Halladay, A.J. Burnett, Cliff Lee, Brandon Webb, Mike Mussina, Chad Billingsley, Roy Oswalt, Edinson Volquez, Derek Lowe, James Shields, and Ryan Dempster are all residents of the northeast quadrant. Sabathia, Haren, Halladay, Lee, Webb, Mussina, Oswalt, Lowe, and Shields are nine of the dozen pitchers from the K+/BB+/GB+ grouping. The other three are John Lackey, who heads up the second quintile; Andy Pettitte, ranked fourth in the second quintile and 31st overall; and Jon Lester, another member of the second quintile.
For purposes of illustration, I have included Lincecum's z-scores for K/BF and BB/BF (top row) and GB (bottom row) below. The colored portion of the normal distribution represents the area of probability. (You can compute your own z-scores in this applet.)
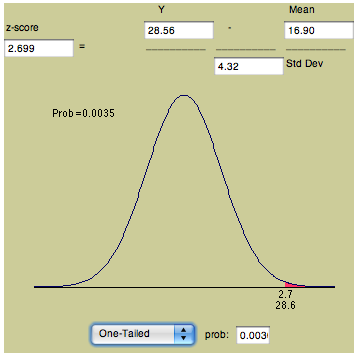
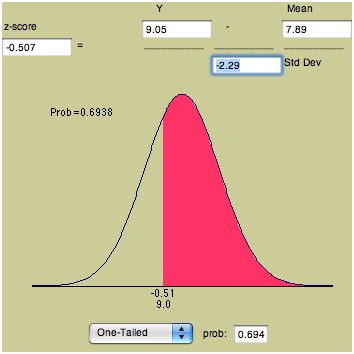
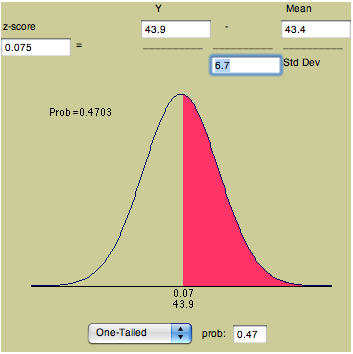
Lastly, here are the top 30 relievers as measured by z-scores.
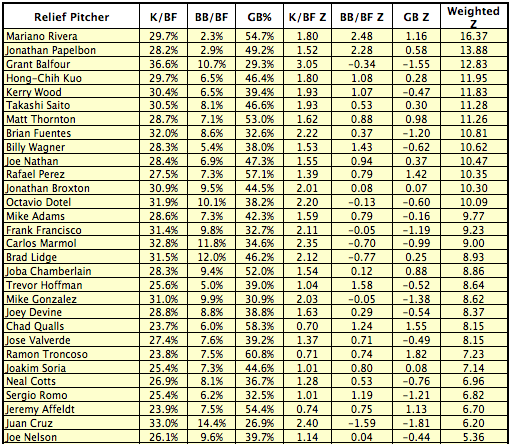
Mariano Rivera and Jonathan Papelbon 1-2. There must be something to this methodology.
| Designated Hitter | February 19, 2009 |
Groundballers
Last week, we looked at how we can interpret groundball averages and what they tell us about the defensive overshift. Now, we'd like to examine some of the more interesting points in our dataset. Of all left-handed batters with at least 200 grounders since 2002, who had the most success with the worm-burner?
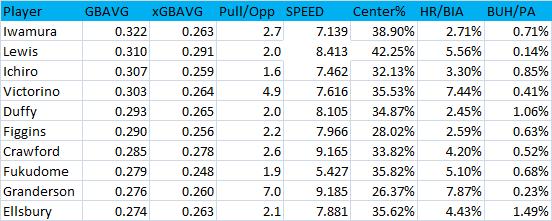
The chart is sorted by groundball average, which for lefties averages out around .225-.230. It is followed by expected groundball average based on pull-to-opposite-field-groundball ratio, speed score, percentage of groundballs to center field, homers per ball in air, and bunts per plate appearance.
Fred Lewis is quite the ballplayer. He has one of the top speed scores in our sample, and according to Pizza Cutter’s speed scores, he was one of the top 35 fastest players in the game last year. But he makes the most of his abilities. Not only can he leg out grounders, but by advanced metrics, he’s an above average left-fielder and baserunner. He stretches hits into triples and is willing to draw a walk to boot. Just wanted to make that observation before we get to...
Land of the Rising GBAVG
Ever notice that all four current Japanese Major League regular position players bat left handed? Though Ichiro Suzuki, Akinori Iwamura, Hideki Matsui, and Kosuke Fukudome all slugged at least 95 points higher in Japan than they have in America, there is one department in which they presumably haven’t suffered since coming overseas. All four players have a strong propensity to reach base via the groundball. Iwamura, Ichiro, and Fukudome all show up on the top 10 list, while Matsui checks in with a .246 groundball average, impressive considering his affliction going the other way. Calculating the difference between their groundball average, and their “expected” groundball average, all four come up in the 20 most “lucky” hitters. However, we wouldn’t attribute their success to luck at all. Ichiro is famous for his unique swing, in which he opens his bottom half and basically is halfway down the line by the time he makes contact. Could this be a method that is taught in Japan? If so, it would probably give someone a much better chance than other lefties of reaching base on grounders. Looking at cherry-picked at-bats, we can say that Iwamura, Matsui, and Fukudome all at times follow similar approaches.
We can estimate that without this skill, over the observed years, Iwamura would have a .260 batting average instead of .280, while Ichiro would be a .310 hitter instead of .330, Matsui .285 instead of .295 and Fukudome .245 instead of .255. This is a remarkable ability. It would be difficult to quantify, but perhaps teams can start timing how long it takes for a batter to get to first following contact. While Matsui has yet to bunt in his career, Ichiro, Iwamura, and Fukudome all get hits on over half their bunt attempts. Perhaps in Japan they emphasize getting down the line, and perhaps in America they should start looking into that. (Cough, Manny, Cough.)
The players we've looked at so far all make the most of their speed and groundball opportunities. But who doesn't? Without further ado...
The Willie Mays Hayes All-Stars
“You gotta stop swingin’ for the fences though, Hayes. All you’re gonna do is give yourself a hernia. With your speed you should be hittin’ the ball on the ground, leggin’ ‘em out. Every time I see you hit one in the air, you owe me twenty pushups.” --Lou Brown (Major League)
Disclaimer: It would be quite a rare instance to find a player who would actually benefit from hitting more grounders than flyballs. We suggest referencing The Hardball Times Baseball Annuals to find specific run values for players' different batted ball types. These are simply players who do a great job reaching base on grounders but fail to do so often.
Chone Figgins: From the right side, it’s acceptable that he doesn't hit many groundballs. Batting righty, he has hit only .230 on grounders over the last six years, while he is also more likely go earn a hit when he gets underneath the ball from that side of the plate than when he does so from the left side. Meanwhile, Figgins not only bats a robust .290 on grounders from his left side but is also very successful bunter. So when Figgins swings for the fences with his career .100 ISO from the left-handed box, know he might be better off legging out grounders.
Iwamura: Aki may have been a 30 homerun a year hitter in Japan, but not anymore, as he is twice as likely to have his groundballs go for hits than his fly balls. His homerun per flyball ratio has decreased to 3.7% this year, and the average true distance of his homeruns has gone down nearly ten feet as well, according to hit tracker. But he’s still a monster when he puts the ball into the turf, except he does so at only a league average rate.
Mark Bellhorn is the final player on this list, and oddly, another 2b/3b combo. Bellhorn may never get another cup of coffee, so it is likely too late for him to change his approach. But it warrants mentioning that he's always been underappreciated in his career due to his strong secondary skills, and he's been able to compile a nice groundball average despite a low groundball percentage.
Curtis Granderson and Brian Roberts could also be on this list, except that they're able to hit however they please and remain successful. Both players hit balls in the air almost twice as often as on the ground, though they hold solid career GB averages in the .265-.275 range. But Roberts consistently hits for decent power, and while Granderson has been excellent at reaching base on ground balls all four full years of his Major League career, he has done a good job of decreasing his groundball percentage as his power has increased--perhaps a conscious decision. Take a look at these graphs:
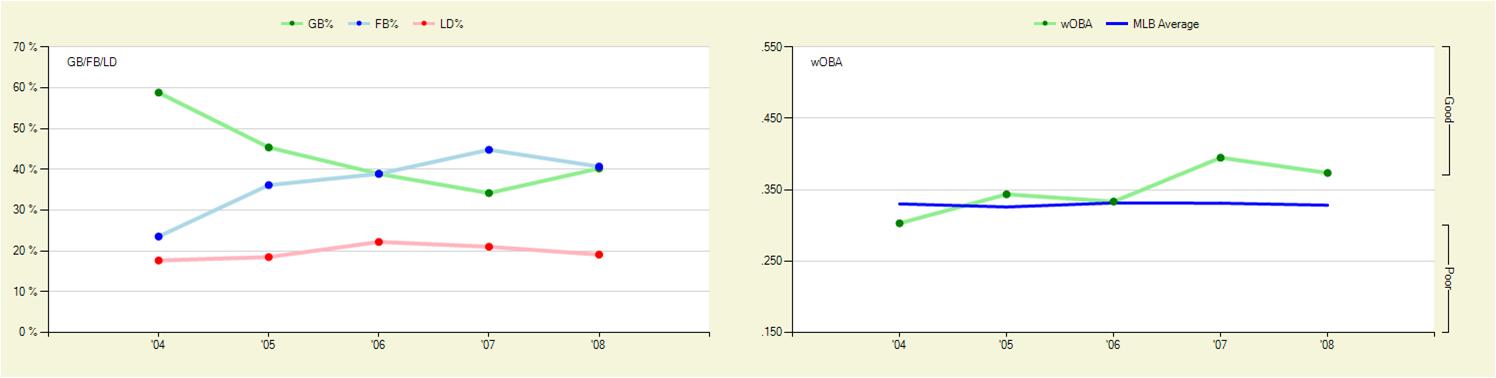
Follow the green lines. As his groundball percentage decreases, his production as measured by wOBA has increased. Though he hit .305 on grounders this year, putting the ball on the ground actually hurt his overall line it appears. He's a better hitter when hitting fewer groundballs, or he hits fewer groundballs to be a better hitter. Either way, he's done a great job improving at the plate
Taking a quick look at righties who weren’t in our dataset: Over the last three years, the only player to have popped up 20% of his fly balls was Eric Byrnes, with a 25.2 infield flyball percentage. As one of the faster players in the game, he could probably use to hit a few more grounders, and he has hit .296 on them since 2002. Carlos Gomez has a similar batted ball profile to that of Byrnes, except without the same type of pop, so he'll either want to develop some muscle or stop racking up 140 strikeouts with a .360 SLG when he might be better off at times pounding the ball into the ground and beating out the throw.
On the reverse end, grounders have been death to Mark Sweeney, Casey Kotchman, and Russ Adams, to the tune of a sub-.200 average, yet they still hit more balls on the ground than in the air.
That's it for our findings on batted ball data. Big thanks to FanGraphs and BillJamesOnline for making this type of data available. And we'd also like to express our deepest gratitude to Rich Lederer for hosting our research.
Leanne Brotsky, David Estabrook, Jeremy Greenhouse, Kimberly Miner, and Steven Smith assisted in writing this article. We would also like to thank Evan Chiachiaro and Dan Rathman, and Anthony Doina who participated in Baseball Analysis at Tufts’ research committee. Any questions can be directed to TuftsBAT@gmail.com.
| Baseball Beat | February 17, 2009 |
Categorizing Pitchers: Adding Walks to the Mix
I have added a new wrinkle to our series of categorizing pitchers by including walks as well as strikeout and groundball rates. The best pitchers miss bats (K), keep batted balls in the park (GB), and command and control the strike zone (BB).
By evaluating all three variables, we can focus on what a pitcher exercises the most authority over. While this study is not intended to quantify a pitcher's Defense Independent Pitching Statistics or Fielding Independent Pitching ERA, it borrows from these concepts for the primary purpose of categorizing pitchers by types (high K, low BB, high GB to low K, high BB, and low GB and the other six combinations of highs and lows).
Tangotiger has written an easy-to-understand primer on the subject of the Defensive Responsibility Spectrum, which discusses DIPS and introduces FIP. As we know, pitchers have the greatest influence over items such as K, BB, HBP, and HR (as well as balks, pickoffs and, to a lesser degree, wild pitches).
While I intend to use HBP in the future by combining them with BB, I did not include the former in this first attempt at categorizing K, BB, and GB types. I also chose to substitute GB% for HR rates two years ago when I began this series because the latter tends to fluctuate more based on ballpark factors (distances, altitude, and wind) and perhaps, to a certain extent, luck.
The results detailed in the table below are based on 135 pitchers who completed 100 or more innings and started in at least 33 percent of their appearances in 2008. Among these qualifiers, the average K/BF rate was 16.90%, the average GB rate was 43.45%, and the average BB/BF rate was 7.89%.
For ease of understanding and consistency, I have designated "better" than average with a plus sign ( + ) and "worse" than average with a minus sign ( - ). Based on these labels, one can readily see how different groups of pitchers fared last season.
As shown, strikeouts had the greatest impact on ERA and RA, followed by walks, and groundballs (which could also be thought of as batted balls as a more generic type). Accordingly, K+ BB+ GB+ > K+ BB+ GB- > K+ BB- GB+ > K+ BB- GB- > K- BB+ GB+ > K- BB+ GB- > K- BB- GB+ > K- BB- GB-.
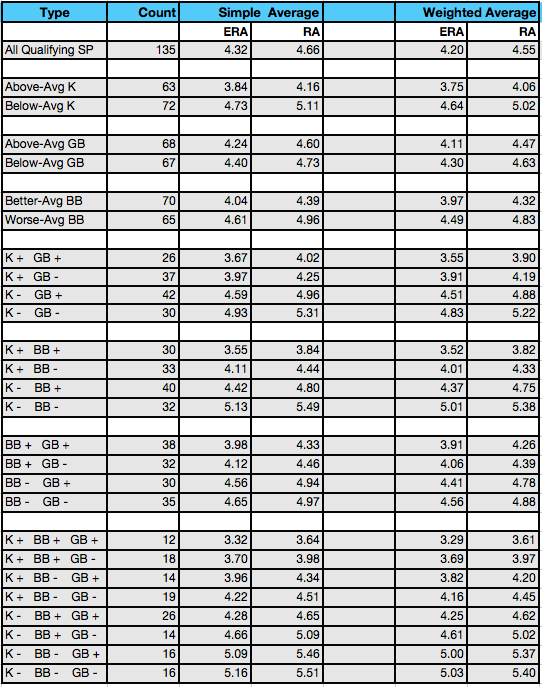
As a rule of thumb, pitchers with plus strikeout rates will have a better-than-average ERA and RA. Conversely, pitchers with minus strikeout rates will have a worse-than-average ERA and RA. Both of these general principles apply irrespective of the other variables with one exception: pitchers with minus K rates combined with plus BB and GB rates will typically sport average ERA and RA.
Another key takeaway is that pitchers with plus K, BB, and GB rates as a group will produce ERA and RA that are about 1.00 better than average. At the other end of the spectrum, pitchers with minus K, BB, and GB rates as a group will fashion ERA and RA that are about 0.85 worse than average. Therefore, the difference between the best and worst groups is nearly two runs per nine innings. Disparities among the best and worst Individual pitchers will obviously be greater than these averages.
Let's take a look at these eight classifications of pitchers.
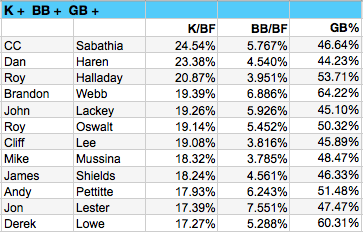
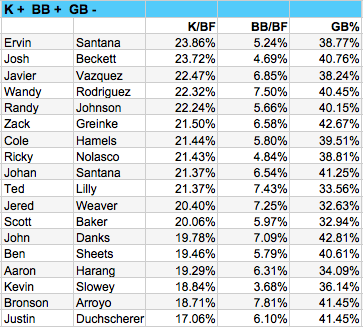
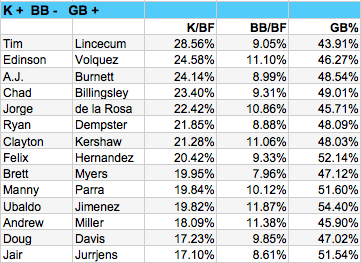
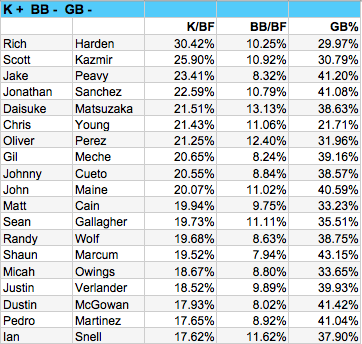
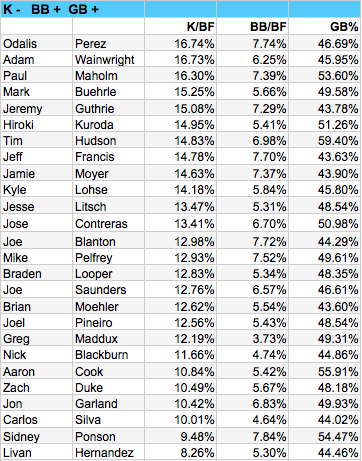
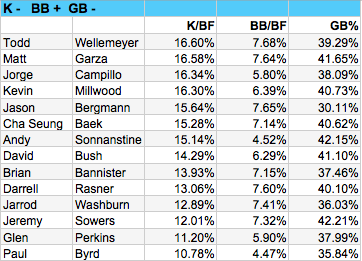
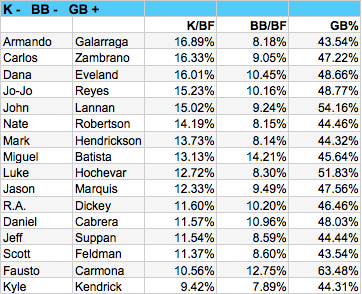
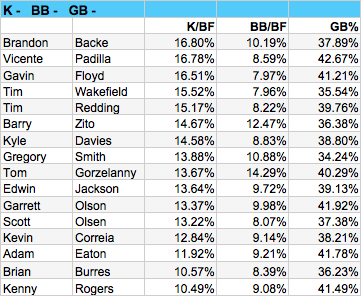
A valuable aspect of categorizing pitchers and listing K, BB, and GB rates is the ability to see comparable pitchers. Without applying similarity scores, one can see that John Lackey and Roy Oswalt are more alike than not with the latter producing slightly better walk and groundball rates. Both righthanders are fastball-slider-curveball types with Oswalt throwing a couple of miles-per-hour harder than Lackey. Oswalt gets the nod but probably not by as much as the differences in their career ERA+ (139 to 117).
Cliff Lee, Mike Mussina, and James Shields are bunched with the former getting the edge over the latter for his superior K and BB rates. Ervin Santana and Josh Beckett are hard-throwing (94.4 and 94.3 mph, respectively) righthanders with comparable K, BB, and GB rates. Dan Haren has a nearly identical K rate as Santana and Beckett but slightly better BB and GB rates. Although Javier Vazquez throws right and Wandy Rodriguez left, their fielding independent stats are not all that different even though the Houston starter is a relative unknown compared to the well-traveled, newly acquired Atlanta pitcher.
One of my favorite comps is Cole Hamels and Johan Santana, two of the best southpaws with plus-plus changeups. Ricky Nolasco may be just as good, or at least he was last year! The main difference between Jered Weaver and Scott Baker is that the latter has a roughly 20 percent better walk rate. Both righties are FB-SL-CH flyball types although Baker throws his heater about a mile per hour harder than Weaver.
A.J. Burnett and Chad Billingsley are two peas in a pod with respect to K, BB, and GB rates. Both throw gas and a hammer curve with A.J. lighting up the radar guns and his investment portfolio a bit more than his younger counterpart. When it comes to Felix Hernandez and Ubaldo Jimenez, there are more similarities (including the two hardest average fastballs in 2008) than differences as I first pointed out last July.
Other comps include Gil Meche and Johnny Cueto, Jesse Litsch and Braden Looper, Matt Garza and Gavin Floyd (and Todd Wellemeyer, Armando Galarraga, and Vicente Padilla, for that matter), and three back-to-back southpaw pairings: Dana Eveland and Jo-Jo Reyes (sporting similar FB-SL-CH repertoires), Nate Robertson and Mark Hendrickson, and, best of all, Jeff Francis and Jamie Moyer, two soft-tossing lefties with only 18 years separating them.
I will have a follow-up piece on Friday with a methodology to rank pitchers across all classifications.
| Baseball Beat | February 16, 2009 |
Let the Games Begin...Please
With pitchers and catchers reporting to camp (and a third of the position players as of Monday), the Major League Baseball season can't be too far away. Seven weeks to be exact. About the same time between now and then as it was between now and Christmas. It's just a matter of whether you like to open your presents in late December or early April.
The first spring training games will take place on Wednesday, February 25. With the Dodgers relocating to Arizona, there are now 16 teams in the Grapefruit League and 14 in the Cactus League. The American League clubs are split evenly between Florida and Arizona while the National League has nine of its 16 franchises training on the east coast.
Round one of the World Baseball Classic opens in Tokyo on Thursday, March 5. There are four pools consisting of four teams each for a total of 16 participants. Pool A consists of China, Chinese Taipei, Japan, and Korea. Pool B is comprised of Australia, Cuba, Mexico (host), and South Africa. Pool C is made up of Canada (host), Italy, USA, and Venezuela. Pool D includes Dominican Republic, Netherlands, Panama, and Puerto Rico (host). The winners and runners-up will advance to round two with the survivors from Pool A and B squaring off at Petco Park and Pool C and D meeting up at Dolphin Stadium. The semi-finals and finals will take place on March 21-23 at Dodger Stadium. The tournament will be televised by MLB Network (16 games) and ESPN (23 games). The full schedule (with dates, times, and TV network) can be viewed here. (Note: Several players listed on the rosters have opted not to play.)
In the meantime, Baseball America is counting down to the college baseball season. (Hint: It takes place this week.) Aaron Fitt, the site's lead college writer, provides scouting reports on the top 25 teams in the country (complete with projected lineups and 2008 stats).
I'm looking forward to attending the opening series between Long Beach State and USC next weekend. The Trojans will play host on Friday and Sunday while the Dirtbags will host the Saturday game. USC (ranked 24th by Collegiate Baseball) features Grant Green, a preseason first team All-America shortstop who is projected to be a top five overall pick in the MLB draft in June.
Green impressed me when I saw him (and fellow freshman Robert Stock, whose status has slipped since being named Baseball America's Youth Player of the Year in 2005) make his collegiate debut two years ago:
Green, Stock's freshman teammate, reminds me of Tulowitzki, the former Dirtbag who played 25 games for the Colorado Rockies in September. The 6-3, 180-pound shortstop has added about 15 pounds of muscle since being drafted by the San Diego Padres in the 14th round last June. He runs well, as evidenced by his 4.23 speed to first, a time that scouts would rate as a 55 or 60 for a RHB on their 20-80 scale.
After losing 11 players to the draft last year, Long Beach State is in the midst of a rebuilding campaign. Devin Lohman, who was selected in the 42nd round by the Rockies in 2007, will follow Danny Espinosa (WAS, 3rd round, 2008), Troy Tulowitzki, Bobby Crosby, and Chris Gomez (as well as a stint by Evan Longoria during his sophomore season in 2005 when Tulo missed 18 games with a hand injury), as the school's next shortstop. The sophomore hit a home run at cavernous Blair Field and made a couple of defensive gems in an intra-squad scrimmage on Saturday.
I am also hopeful of catching righthander Stephen Strasburg, the No. 1 prospect in the country, at the MLB Urban Invitational in Compton next weekend. San Diego State is scheduled to play Bethune Cookman on Friday and Southern on Saturday. If Strasburg is going, I will be, too.
If you don't know much about Strasburg, the following excerpt from a Baseball America article will whet your appetite:
The Washington Nationals have the first pick in the 2009 draft. Strasburg, a junior righthander at San Diego State, is the odds-on favorite for the first choice. So just how does a pitcher go from obscurity to the top of the draft?• By hitting 101 mph on a radar gun.
• By outdueling the first pitcher selected in last year's draft.
• By striking out 23 batters in a game.
• By being the first collegiate player selected to the U.S. Olympic team since professionals were put on the roster in 2000.
Strasburg did all that and more last year, making him The Next Big Thing. Everyone, it seems, is now on board.
College baseball this week. Spring training next week. World Baseball Classic next month. Opening Day the following month.
Bring 'em all on. I'm ready.
Meanwhile, if you're looking for some reading material, be aware that The Hardball Times Season Preview 2009 is now shipping. The book includes projections and commentaries for all 30 teams and over 1,000 players, draft strategies and values, and key rookies for 2009. You can read the first page of an eight-page preview of the Dodgers that I wrote. The other 29 teams are covered by THT's staff writers and many of the best baseball bloggers on the Internet.
| Around the Majors | February 13, 2009 |
Seasons of Change, Part 2 (of 2)
As we saw last week in part one of Seasons of Change, MLB rosters can really evolve in 10 seasons. As fans, it's also fun to look back and remember some of the key moments - and players - that made 1999 so entertaining.
The Atlanta Braves | 103-59 (First)
The Braves club was a powerhouse 10 years ago, led by some excellent pitching, which included The Big Three of Tom Glavine, John Smoltz and Greg Maddux. Those three pitchers, combined, earned more than $25 million. The club also relied on two young, promising starters named Kevin Millwood, 24, and Odalis Perez, 22. Millwood went on to have a pretty decent career (until he hit Texas), while Perez never did realize his full potential. Millwood was actually second on the team in wins in 1999 with 18 (Maddux had 19) and led with 205 strikeouts. Chipper Jones led the club with 45 home runs and his 110 RBI total was second to Brian Jordan's 115. Chipper received all but three first-place votes to win the NL MVP. Has any (active) player in the last 10 years fallen further than Andruw Jones talent-wise? He hit .275/.365/.483 with 26 home runs at the age of 22 - and his offense was not even the best part of his game.
The New York Mets | 97-66 (Second)
Catcher Mike Piazza was the top salary earner for the Mets in 1999 at $7.1 million but he earned his paycheck by slugging 40 home runs and driving in 124 runs. Robin Ventura had his best season as a Met and hit 32 home runs with 120 RBI. He hit .301 in 1999 and never reached .250 again in his final five seasons. The third highest paid player on the club at $5.9 million was Bobby Bonilla, but he hit just .160/.277/.303 in 119 at-bats (60 games). The Mets' starting rotation was fairly old, with the top four pitchers aged 33 or higher, with No. 1 starter Orel Hershiser at 40. It's hard to believe the Mets won 97 games considering the top win total was 13 by both Hershiser and Al Leiter. The closer's role was shared by the Young n' Old combo of Armando Benitez, 26, (22 saves) and John Franco, 38, (19 saves).
The Florida Marlins | 64-98 (Fifth)
This club is famous for taking one step forward and two steps back. After winning the World Series in 1997, the club jettisoned most of its talent. In 1999, only four players made more than $1 million, including Alex Fernandez who raked in $7 million and earned seven wins in 24 starts. Fernandez earn more money than the next 13 highest paid players on the roster. The team lead in wins was secured by Brian Meadows with 11 (He also lost 15 and had an ERA of 5.60). Antonio Alfonseca led the club with 21 saves. Rookies A.J. Burnett and Vladimir Nunez appeared to have bright futures, while sophomore Ryan Dempster was also being counted on for big things. Offensively, not one hitter was above the age of 30 when the season began. Luis Castillo played his first full season as a regular and stole 50 bases. Preston Wilson, 24, hit 26 home runs and finished second in the Rookie of the Year voting. He also struck out 156 times, though. Mike Lowell also showed promise in his rookie season.
The Philadelphia Phillies | 77-85 (Third)
Paul Byrd and Curt Schilling led the Phillies in wins in 1999 with 15 a piece. Schilling was also tops with 152 strikeouts. Left-handed prospect Randy Wolf made his debut and posted a 5.55 era in 21 starts. Wayne Gomes led the club with 19 saves after veteran Jeff Brantley went down due to injury and appeared in just 10 games. The offense was led by catcher Mike Lieberthal, who hit 31 home runs and batted .300. Rico Brogna was first on the club in RBI with 102. Bobby Abreu, 25, had a breakout season that saw him hit 20 home runs, 11 triples, score 118 runs, steal 28 bases and walk 109 times. Oh, and he batted .335. Doug Glanville had 204 hits and also stole 34 bases.
The Montreal Expos | 68-94 (Fourth)
The now Washington Nationals organization had just five players making $1 million or more, and Rondell White was the top earner at $3 million. He had a nice season with a line of .312/.359/.505. The offensive leader, though, was Vladimir Guerrero, 23, who was in his third season. He hit 42 home runs and drove in 131 runs. Catcher Chris Widger was third on the club with 14 home runs. The middle infield consisted of Jose Vidro, 24, and Orlando Cabrera, 24, both of whom were promising young players. Michael Barrett was a rookie in 1999 and split his time between catcher and third base. Dustin Hermanson, a converted reliever, and Javier Vazquez, 22, both led the team with nine wins. Ugueth Urbina was the saves leader with 41. Left-hander Steve Kline appeared in 82 games, while Anthony Telford pitched in 79, which should tell you a little bit about the starting pitchers. A 23-year-old southpaw named Ted Lilly made nine appearances. The club had a ridiculous amount of young talent in 1999... it's too bad the club could not afford to keep all the players together for any significant period of time.
The Cincinnati Reds | 96-67 (Second)
Only one player hit more than 25 home runs and topped 100 RBI (Greg Vaughn at 45 homers and 118 RBI), but 10 players hit more than 10 taters. Sean Casey was second on the club in dingers, during a rare power display, with 25. Pokey Reese hit .285/.330/.417 with 38 steals and looked like he would man second base for quite some time, but he never reached those numbers again. Pete Harnisch was the staff ace with a record of 16-10 and 198.1 innings pitched. His 120 strikeouts were second only to Brett Tomko's 132. The Reds appeared to have a dynamic, young one-two punch in the pen with Danny Graves, 25, who saved 27 games, and Scott Williamson, 23, who had 19. Injuries ruined both careers - although both had limited success. Williamson pitched well enough to take the NL Rookie of the Year award in 1999. Ironically, the club traded rookie B.J. Ryan to the Reds after just one MLB game. He arguably has had a better career than both Graves and Williamson.
The Milwaukee Brewers | 74-87 (Fifth)
Hideo Nomo led the club with 12 wins and 161 strikeouts. The only other pitcher to approach triple-digit strikeouts was Steve Woodard with 119. Veterans Jim Abbott and Cal Eldred both made 15 starts and had horrible seasons with ERAs over 6.90. Former first round pick Kyle Peterson, 23, looked promising in 17 games but appeared in just three more MLB games in his career. Bob Wickman saved 37 games. Jeromy Burnitz was the leader in home runs with 33. Australian catcher Dave Nilsson had a nice season with a line of .309/.400/.554 and 21 home runs. Geoff Jenkins played his first full season and had 43 doubles and 21 home runs.
The Pittsburgh Pirates | 78-83 (Third)
The biggest earner in 1999 for the Pirates was Al Martin at $2.7 million, with Kevin Young second at $2.1 million. Martin hit .277/.337/.506 with 24 home runs and 24 steals. Young hit .298/.387/.522 with 26 homers and 106 RBI. Brian Giles was the offensive star, though, with a line of .315/.418/.614 to go with 39 home runs and 115 RBI. He earned just $1.1 million. Warren Morris, 25, had a solid rookie season at second base but was a one-year (maybe a two-year) wonder. The Pirates had a promising young pitching staff with the top four starters at or below the age of 27, including Todd Ritchie, Kris Benson, Jason Schmidt and Francisco Cordova. Mike Williams saved 23 games.
The Chicago Cubs | 67-95 (Sixth)
The year 1999 was not kind to the Cubs organization, which finished in last place in the Central Division. The only positive part of the season (at the time) was Sammy Sosa's race with Mark McGwire and his 63 home runs (as well as 141 RBI). Henry Rodriguez had a nice season with 26 home runs and a .301 batting average. Only one regular player was under the age of 30 - Jose Hernandez at shortstop. In the starting rotation, Jon Lieber led the way with just 10 wins. Steve Trachsel pitched 205 innings but managed a record of just 8-18. Terry Adams stepped into the closer's role and saved 13 games, after Rod Beck was ineffective despite saving 51 games in 1998. Rookie Kyle Farnsworth, 23, made 21 starts and looked loaded with potential thanks to a big fastball. Fifteen players made $1.1 million or more for the last-place Cubs.
The Houston Astros | 97-65 (First)
Remember when the Astros had good pitching (beyond Roy Oswalt?). I certainly had forgotten. In 1999 Jose Lima and Mike Hampton, both 26, won 21 and 22 games, respectively. Shane Reynolds won 16 games and led the club with 197 strikeouts. Sophomore Scott Elarton looked like he would move into the rotation in 2000 and thrive. Billy Wagner saved 37 games with a 1.57 ERA and 124 strikeouts in 74.2 innings. In the batter's box, Jeff Bagwell finished second in the MVP race after slugging 42 home runs, driving in 126 and adding 149 walks. Craig Biggio hit 56 doubles. Between the two players, they stole 58 bases. A rookie by the name of Lance Berkman appeared in 34 games.
The St. Louis Cardinals | 75-86 (Fourth)
Another Central League club had a disappointing season, but brought fans to the seats thanks to Mark McGwire's 65 home runs. Fernando Tatis, 24, hit 34 home runs in his second full season and drove in 107 runs. Rookie J.D. Drew began his career of disappointing people with a line of .242/.340/.424. League-average hurler Kent Bottenfield parlayed an uncharacteristic 18-9 season into a $4 million paycheck from the Angels in 2000 (and subsequently won just seven games). Once promising Jose Jimenez went 5-14 in his rookie season and never did reach his potential. Pitching phenom Rick Ankiel, who was 19 when the year began, debuted and had a 3.27 ERA in nine games (five starts). Ricky Bottalico saved 20 games.
The Colorado Rockies | 72-90 (Fifth)
Offense was the name of the game in 1999, obviously. Four players had 30 or more homers: Todd Helton, Vinny Castilla, Dante Bichette, and Larry Walker. Walker's line was insane at .379/.458/.710, but he finished 10th overall in MVP voting. Terry Shumpert hit .347/.413/.584 as a part-time utility player. Promising rookies Ben Petrick and Edgar Clemente failed to develop. Four pitchers made 30 starts or more, but only Pedro Astacio had an ERA below 6.00 (at 5.04). He also led the club with 210 strikeouts. Brian Bohanon was second on the club with 12 wins despite a 6.20 ERA. Dave Veres saved 31 games. Young starters John Thomson, Jamey Wright, and Mark Brownson failed to realize their potentials.
The San Francisco Giants | 86-76 (Second)
Barry Bonds was not involved in the great home run chase of 1999, in part because injuries limited him to just 102 games. Regardless, he still hit 34 home runs. Ellis Burks carried the offense in Bonds' absence and hit 31 home runs. Rich Aurilia (making less than $1 million), Jeff Kent, and J.T. Snow also all had 20 or more home runs. Catcher Brent Mayne was the only regular to hit more than .300 (at .301). Pitcher Russ Ortiz went 18-9 with 164 strikeouts and 125 walks. Not bad for a guy making $220,000, eh? Robb Nen saved 37 games. A former catcher Joe Nathan, 24, made a successful conversion to pitcher and started 14 games.
The San Diego Padres | 74-88 (Fourth)
Trevor Hoffman saved 40 games for the Padres in 1999, but there wasn't much else to celebrate. Andy Ashby was tops in wins with 14. Sterling Hitchcock punched out 194 batters, which was his career high by an easy margin (36 Ks). Matt Clement, 24, had a promising rookie season and won 10 games with a 4.48 ERA in 31 starts. Outfielder Ruben Rivera inexplicably played 146 games despite hitting .195/.295/.406. Four regulars hit .248 or below. Reggie Sanders led the offense with 26 home runs. Phil Nevin drove in the most runs with just 85. Tony Gwynn hit .338/.381/.477 and was first in hits with 139. It was the last season he would play regularly and his third last overall. The club did have some speed, as four players stole 30+ bases. Shortstop Damian Jackson had 34 despite hitting just .224.
The Los Angeles Dodgers | 77-85 (Third)
Kevin Brown started off his Dodgers career pretty well in 1999 with an 18-9 record and 221 strikeouts. Ismael Valdes was second amongst the starters with a 3.98 ERA but he won just nine games. Jeff Shaw saved 34 games. Rookie relievers Jamie Arnold and Onan Masaoka were worked pretty hard and failed to have much success ever again. A young Canadian starter named Eric Gagne, 23, made his debut and posted a 2.10 ERA in five starts. On offense, Raul Mondesi, Gary Sheffield, and Eric Karros each passed the 30 home runs mark. Twenty-year-old third baseman Adrian Beltre played his first full season and hit .275/.352/.428. He looked like a superstar in the making. Eric Young stole 51 bases.
The Arizona Diamondbacks | 100-62 (First)
In just its second season, the Arizona organization finished first in the NL West (but lost to the Mets in the NL Division Series). The club was offensive-minded to say the least. Two outfielders (who - eyebrows raised - improved significantly as they entered their 30s) Luis Gonzalez and Steve Finley had great seasons. Gonzalez hit .336/.403/.549 with 206 hits and 111 RBI. Finley slammed 34 homers and drove in 103 runs. Jay Bell (another eyebrow raise) and Matt Williams (clearing of throat) both joined the 30 homer club. Williams led with 142 RBI and finished third in the MVP race. On the rubber, Randy Johnson was king with a 17-9 record and 364 whiffs. He edged Mike Hampton for the NL Cy Young award. Omar Daal came out of nowhere to go 16-9. Matt Mantei saved 22 games and Gregg Olson had 14. Byung-Hyun Kim made his debut at the age of 20 and struck out 31 in 27.1 innings.
The game has changed a lot, but many still remain - most in different uniforms. It's also amazing to look back and see just how many players were hitting 30+ home runs with ease - well into their 30s. It will certainly be interesting to see what the 2009 season, as well as future years, have in store for baseball fans.
| Designated Hitter | February 12, 2009 |
BABIP: Progressing and Regressing Groundball Out Rates
A couple of weeks ago, Rich Lederer asked what variables account for extraordinarily low groundball out rates. So, using a similar method to that which Peter Bendix and Chris Dutton used to find expected BABIP, we dug deeper and ran a regression to find expected average on groundballs.
Intuitively, one would think that faster players with the ability to find holes in the infield have the best success rates on groundballs. As Lederer pointed out, defensive alignments and batter handedness are also variables that will affect groundball average. While infield shifts are difficult to quantify, we still attempted some statistical approaches to analyze their effects. And to account for handedness, we limited our sample to only left-handers or switch-hitters batting lefty. Our sample included 206 players with at least 200 total ground balls since 2002. We then ran a linear regression to find the factors that influence a batter's groundball average.
Five variables were significant at a one percent level in our regression—a ratio of pulled groundballs to opposite field groundballs, the percentage of grounders hit to center field, a speed score developed by Bill James, bunt hits per plate appearance, and homers per ball in air. The R-squared is .4648. Here is the regression output, if you're into that sort of stuff.
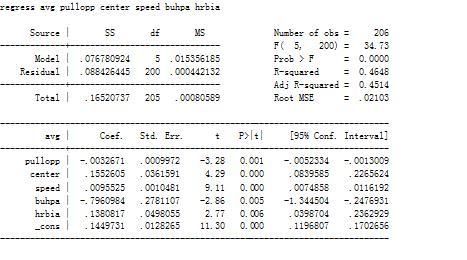
The location of groundballs along with the batter’s speed seem to have the most influence on groundball hit rate, confirming our suspicions. Hitting the ball the other way forces a longer throw, and busting it down the line on grounders is probably the most advantageous way a player can utilize his speed. Velocity of groundballs was difficult to account for. Line drive percentage and grounded into double play percentage, which are likely tied with the hardness of a groundball hit, proved insignificant. Many of you might know the split in batted ball hit average is about .715 on liners, .235 on grounders, and .140 on fly balls. Now, we can break that down further with this data. Lefties hit for a lower average on grounders than righties by about 10-15 points. Opposite field grounders and grounders up the middle from lefties go for hits on average about 30% of the time, while pulled grounders go for hits only 15-20% of the time. Interestingly, hitting homeruns has a negative impact on pulled and total groundball average, but is one of the most significant positively correlated variables that go into opposite field average. One guess is that power hitters tend to hit weaker groundballs to the right side when they roll over their wrists. Or perhaps they pull the ball into a shift, which seems to be supplied only to power hitters due to a likely managerial bias. But when these homerun hitters do hit opposite field groundballs, however rarely, they are apparently more likely to go for hits than opposite field grounders from slash hitters.
One of the main reasons we calculated our expected average value was to examine the exaggerated infield shift more closely. In our sample, we came up with nearly 20 players who we believed to have been “overshifted,” a defensive alignment in which the shortstop plays on the second-base side of the bag and the second-baseman goes to short right field. The shift was originally introduced as a way to get Ted Williams out, and it was brought back in vogue to foil Barry Bonds. By comparing a player’s expected average with his actual average, and using several more basic methods, we were able to draw conclusions about the use of the shift. An average significantly greater than the corresponding expected average indicates that our regression model does not account for something affecting the hitter – maybe a defensive shift.
The players whose expected groundball average most exceeded actual groundball average were Barry Bonds, Rafael Palmeiro, Mark Teixeira, Adam Dunn, and Jack Cust. Their averages all fell at least 20 points below their expected averages, while Jack Cust’s came up almost 30 points short. With this information, we looked at their traditional BABIPs with men on base and nobody on base as a loose measure to determine when these batters are being shifted, and when they’re not. We should note that the average BABIP with men on is slightly higher than with nobody on, and for pull-hitting lefties, there will be an even greater difference as the first baseman will often have to hold on a runner, opening up the hole between first and second base. Bonds, Palmeiro, and Cust all gained at least 30 extra points of BABIP with men on, and Bonds had a .265 BABIP with nobody on and .338 with men on. Dunn showed little split, while we could not isolate Teixeira’s situational left-handed at-bats from his right-handed at-bats. All of these players pull their groundballs at least six times as much as they hit grounders to the opposite field, and they all have slow speed scores, making them prime candidates to be victims of the shift.
Other players who get shifted and who have averages below their expected averages include: Prince Fielder, Justin Morneau, Mike Jacobs, and Jason Giambi. Giambi’s BABIP has been an astounding 95 points higher with men on than with nobody on.
What was almost as interesting was the list of shifted players whose average exceeds their expected average – potentially meaning the shift is not effective against them. David Ortiz, Carlos Pena, and Travis Hafner all fit into this category. There was no noticeable difference between skill sets of these player and the first group, so some other factors must explain this difference. Perhaps this second group includes hitters who are better at locating their hits against the shift. Ortiz does have a split of 45 points between his BABIP with men on vs. nobody on, so we won’t discount the impact of the shift on him.
Within this group of shifted batters, there were some other noteworthy discoveries. Ryan Howard has an incredibly high pull-to-opposite-field-groundball ratio of 11.875—the largest in our sample—yet his average and expected average were about equal, as both values fell within the .200-.205 range. Given his dramatic pull/opp ratio, we have little doubt that the shift has affected him, so we dug deeper to find the answer. Looking at the MLB.com provided hitting charts, and checking the locations of his groundball outs, there is a cluster of outs in short right field over the last two years, but not prior, meaning the decision to shift him might have been recent. Indeed, in 2005-2006, Howard hit .237 on grounders, and then when the shift came into play regularly in 2007-2008, he hit only .175 on grounders. Also notable were Hafner's and Morneau’s extremely low pull/opp ratios, which were 3.98 and 2.99 respectively. According to this statistic, neither player would be an obvious candidate for the shift – yet both are shifted, and as said earlier, it would appear that the shift is detrimental to Morneau. However, the 3-4 defense applied to Hafner never made much sense, as he has rather moderate pull-to-opposite-field-groundball and groundball-to-flyball ratios.
Finally, we looked for any left-handed batters with high pull percentages, who would therefore be good candidates for the defensive shift. Nate McLouth had a pull/opp ratio of 10.208, but his speed statistic is quite high, explaining why teams probably choose not to shift him. If you’re fielding balls in short right field, you won’t get a fast player out. Nick Swisher’s pull/opp ratio 10.92 yet teams do not shift him. Russell Branyan and David Dellucci are also strong candidates for a shift, but none of these players follow the hulking power hitter profile, so managers don’t think twice about creative ways to get them out.
We ran a logistic regression using a value of one if we had evidence that the player had been shifted and zero if not. It turns out that homerun-per-flyball and groundball-to-flyball ratios have been the most significant factors in determining what players get shifted. Bonds’ expected shift score was one, meaning that he is truly the prototype of shifted players. Pull percentage and intentional walks per plate appearance were also significant at a five percent level, but we believe that opposite field groundball rate should be taken into account as well. Evacuating that side of the infield against a hitter who hits any significant amount of opposite field groundballs is simply giving away hits, no matter how many pulled grounders get taken away. There is a clear managerial bias to shift power hitters, while not taking enough into account batted ball location.
Our study is not perfect. We found no good way to quantify the shift, which would allow us to distinguish between players who receive a full shift and those who receive a partial one, or those who are shifted all the time and those for whom only some teams put on the defensive shift. Nevertheless, our study shows some interesting results. By comparing expected ground ball and actual averages, we believe that the shift had the most significant impact on Bonds, Palmeiro, and Cust, and that it had a surprisingly little impact on batters like Ortiz and Pena. In addition, we suggest that Swisher might be a good candidate to shift, and we suggest that managers make decisions based on evidence rather than player reputation. These are only basic observations, yet they shed some light on the hard-to-quantify defensive shift.
Leanne Brotsky, David Estabrook, Jeremy Greenhouse, Kimberly Miner, and Steven Smith assisted in writing this article. We would also like to thank Evan Chiachiaro and Dan Rathman, and Anthony Doina who participated in Baseball Analysis at Tufts’ research committee. Any questions can be directed to TuftsBAT@gmail.com.
| Change-Up | February 11, 2009 |
Uncle!
We do not like to address the topic of steroids around here. By now, it is evident that steroids played a prevalent role in the game for a significant period of time. I am not sure why anyone acts so shocked when it comes out (illegally of course, but no outrage there) that any one individual used steroids. And yet, since Saturday, to turn on your television or open your newspaper or navigate on over to your mainstream sports website of choice was to subject yourself to an endless loop of the three S's - silliness (release A-Rod!), sanctimony (what about the kids?!?!) and schadenfreude (A-Roid, A-Fraud, etc).
Anyway, we give up. Instead of continuing on with the analysis we love - a look ahead at the 2009 season, maybe some work on prospects (did you know PECOTA has Matt Wieters as the best player in the AL in 2009?!?) or even do some prep on the college season, I decided we shouldn't completely ignore the subject of steroids. While I don't think I have any incremental insight or value to add to the discussion that is taking place, I thought I would point you to some work and commentary that caught my eye.
==========
Writers at The Hardball Times had an interesting roundtable discussion on A-Rod and steroids more broadly:
Dave Studeman: My reaction is...meh. Why are we surprised that a slugger from the early part of the decade (or any time in the 1990's) took steroids? Can't we just say that lots of players took steroids, the time wasn't a good one for competitive and fair spirit, and move on? I don't have any negative reaction toward A-Rod as a result of this. In the grand scale of things, I think cheating on your wife is a much bigger lapse of ethics.As for the union, I don't know enough to have an opinion.
Geoff Young: One of the great ironies of this witch hunt is that while it attempts to solve a problem (or more accurately, gives the *appearance* of attempting to solve a problem), the process itself has desensitized many of us. We know lots of players took steroids and at this point we just don't care.
Dave Studeman: Geoff, I don't know if you're reacting directly to my comment, but the "witch hunt" hasn't desensitized me. I've never been focused on trying to uncover the past—I've always thought it was fruitless. Clearly, lots of parties are to blame for the steroids era, and trying to pin down who did what is only useful, IMO, if it helps us better handle the future. I don't see that it does. Once it became clear that many players had taken steroids (and this has been pretty clear for a long time), I never saw the point in determining who did what.
==========
Dan Shaughnessy, God bless him, had a pretty good piece in this morning's Boston Globe. I particularly liked the part when he compared New Englanders' reaction to the A-Rod news with their reaction to the news that Rodney Harrison, the Patriots All-Pro safety, had cheated.
But why do they hate him so much in New York ("A-Fraud") and everywhere else across this great land?....And remember how quickly New England forgave Rodney Harrison when the beloved safety explained he was just trying to get back on the field to help the team?...
Red Sox fans, gleeful over this A-Rod scandal, need to remember that there are 103 other players who tested positive in 2003. Someday, those names could be released. There's a pretty good chance that one or two of the Sox stars from 2003 will be on it. What do you say about A-Rod when that happens?
==========
To his credit, Jerry Crasnick of ESPN managed to track down Marvin Miller, the former MLBPA Union Boss. Miller, 91, is still as sharp as a tack.
On the media's role in perpetuating steroid use by referring to the drugs as "performance enhancers": "A kid who would love to be a professional athlete reads the sports pages or watches ESPN and is told over and over again, 'These are performance-enhancing drugs. They will make you a Barry Bonds or an A-Rod or a Roger Clemens.' The media, without evidence, keep telling young people all over the country, 'All you have to do to be a famous athlete with lots of money is take steroids.' The media are the greatest merchants of encouraging this that I've ever seen."Miller also criticized the Justice Department for engaging in "union-busting tactics" by using the confidentiality provision in the drug testing to get information from players, and said many of the "experts" who advocate for greater testing in sports have an inherent conflict because they run labs and stand to profit.
"It's a witch hunt in baseball, for sure, but it also extends to cycling and the Olympics," Miller said. "And the victims are the athletes. They're obviously the ones being hunted down here."
==========
And finally, here is Dan Szymborski, creator of the ZIPS projection system. He generally sticks to numbers over at Baseball Think Factory but he chimed in on this matter with an excellent article about how we are all complicit.
For fans, the belief has always been that athletic excellence is something that an athlete should risk everything for. Playing in pain, running into walls, brutal crushing tackles, are the currency of fandom's love and abiding respect.The famous Pete Rose-Ray Fosse collision in the 1970 All-Star Game provides a compelling example of this phenomenon. Played over and over again, fans bring this up as an example of hard-nosed play from Charlie Hustle. But the negative effects of that play still affect Ray Fosse. Nearly 40 years later, Fosse still has trouble lifting his arm on some days. His shoulder still occasionally throbs with the same pain he experienced constantly for years after that fracture...
...I dare anyone to try to name an era in sports in the last in which any semblance of purity, now suddenly demanded by the public, actually existed. By all means, please direct us to this golden time where no currently banned performance-enhancing drugs were available, but went unused by the wholesome players of yesteryear. It's certainly not the 80s or 90s or 2000s, when steroid use apparently came most popular. It certainly wasn't the 60s and 70s, when players were distributing now-banned amphetamines and starting to experiment with steroids themselves. The only difference between a slugger in 1938 and a slugger in 2008 is the quality of the goodies he can get his hands on.
==========
So there you have different takes on this situation, some commentary that stood out in a sea of talking heads feigning shock and outrage over A-Rod taking steroids. Some media members like to talk of the PR nightmare A-Rod has brought on himself (wow, wonder how that happens?!) Well the pieces linked and excerpted above managed to steer away from the emotions and take a look at this incident for what it is; something (another high profile player being outed) we should have all been able to see coming by this point.
I can't wait for the games to start.
| Baseball Beat | February 10, 2009 |
Categorizing Relief Pitchers by Strikeout and Groundball Rates - 2008 Edition
After categorizing starting pitchers by strikeout and groundball rates yesterday, today's article is focused on relievers. Previous entries with supporting information as to the whys and wherefores of this study can be accessed at the following links: 2008 SP, 2007 SP, 2007 RP, 2006 SP and 2006 RP.
The universe includes strikeout and groundball data for every reliever in the majors (defined for this exercise as those with 30 or more innings who started less than one-third of the time). There were 231 pitchers who met these requirements in 2008. Among these qualifiers, the average K/BF rate was 19.68% and the average GB rate was 43.74%. By comparison, starters had a mean K/BF rates of 16.90% and GB% of 43.45%, respectively. While the groundball rates were virtually the same, the average strikeout rate among relievers was 2.78 percentage points higher or 16.4%.
The mean K and GB rates are highlighted in red in the graph below. These averages separate the starting pitchers into four quadrants. By placing pitchers in quadrants, one can easily distinguish those with above-average strikeout and groundball rates (referred herein as the northeast quadrant), above-average strikeout and below-average groundball rates (southeast quadrant), above-average groundball and below-average strikeout rates (northwest quadrant), and below-average groundball and strikeout rates (southwest quadrant).
The simple average and weighted average (by innings) ERA and RA are detailed in the table below.
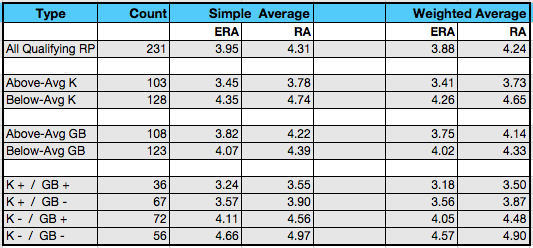
The message is the same for relievers as it was in yesterday's table for starters:
- Pitchers with above-average K rates outperform those with below-average K rates.
- Pitchers with above-average GB rates outperform those with below-average GB rates.
- Pitchers who combine above-average K and GB rates outperform all others.
As with the starters, it is always fun to look at the outliers. Starting at the upper end of the graph, Roy Corcoran had the highest percentage of groundballs among all pitchers (starters or relievers). Moving clockwise, the other outliers consist of Scott Downs, Ramon Troncoso, Rafael Perez, Mariano Rivera, Takashi Saito, Brad Lidge, Jonathan Broxton, Octavio Dotel, Carlos Marmol, Grant Balfour, Juan Cruz, Alex Hinshaw, Troy Percival, Eddie Guardado, Brad Hennessey, Todd Jones, Horacio Ramirez, and Chad Bradford. Saito, Broxton, and Bradford also stood out in their respective quadrants the previous year.
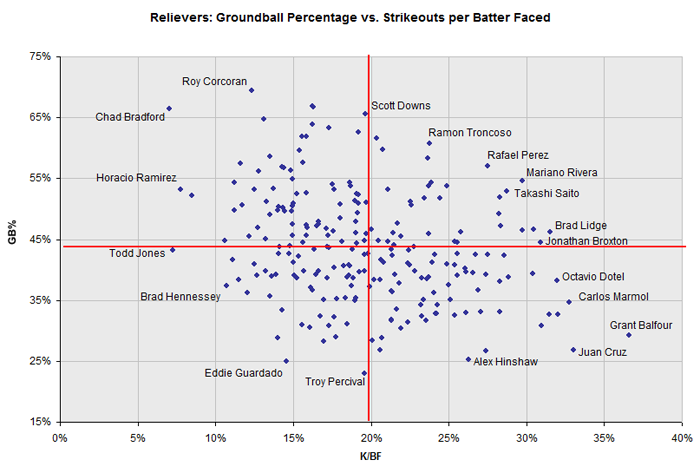
Data and graph courtesy of David Appelman, FanGraphs.
Let's drill down and take a closer look at each of the quadrants. The NE, SE, and SW quadrants are listed by K/BF, while the pitchers in the NW quadrant are in order of GB%.
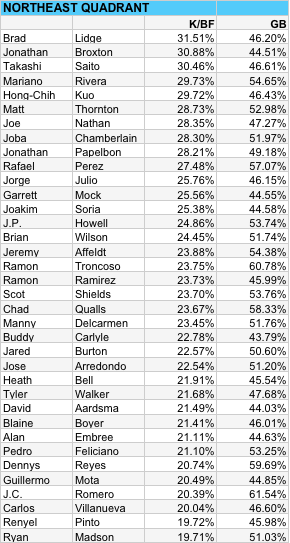
Lidge not only tops this elite group of relievers but is one of only two pitchers to exceed a 30% strikeout rate for three consecutive seasons. He was 48-for-48 in save situations (including the postseason) and led all relievers in Win Probability Added. For my money, Lidge was the best relief pitcher in baseball last year.
Saito is the other reliever who has whiffed at least 30% of the batters faced during the past three campaigns. He suffered a sprained ligament in his elbow last summer and was not tendered a contract by the Dodgers. The 39-year-old righthander signed a one-year deal with the Red Sox with a team option for 2010. Along with the newly acquired Ramon Ramirez and holdovers Jonathan Papelbon and Manny Delcarmen, Boston will have four members of the NE quadrant in its bullpen in 2009, tied for the most in baseball. Despite losing Saito, the Dodgers will also head to camp with four relievers from the NE quadrant: Broxton, Hong-Chih Kuo, Troncoso, and Guillermo Mota, who was signed in January.
Rivera and Perez qualified for the 25-50 club for the second straight year. Matt Thornton and Joba Chamberlain, who split his season between the starting rotation and the bullpen, are also card-carrying members of the 25-50 organization. Joba will either hook up with Mo to form a "lights out" eighth and ninth inning tandem or join fellow NE quadrant starters A.J. Burnett and CC Sabathia in the rotation. It's a nice "problem" for Yankees manager Joe Girardi to figure out this spring.
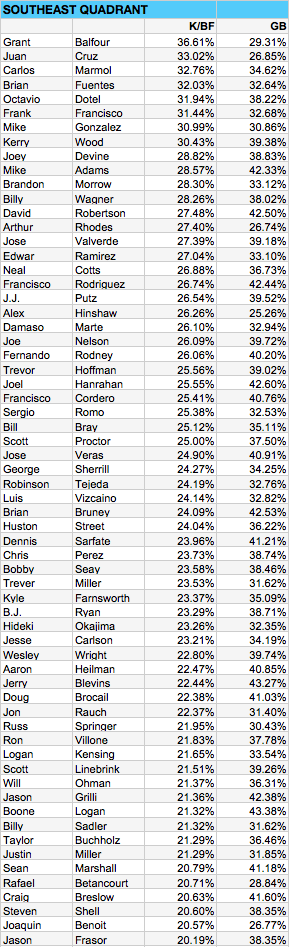
![]()
Balfour had the highest strikeout rate of any big league pitcher last year. Although the 31-year-old righthander got knocked around in October, he put up remarkable stats during the regular season (summarized by a 1.54 ERA and 0.89 WHIP). It will be interesting to see how the well-traveled and hard-throwing Balfour performs in 2009.
Cruz and Marmol are no strangers to the upper end of the southeast quadrant, placing third and second, respectively, in 2007. The strikeout artists swapped places in 2008. Cruz became a free agent after the season and remains unsigned days before pitchers and catchers report to spring training, primarily due to the fact that the acquiring team will be forced to part with a first-round draft pick as compensation for a Type A player. Marmol, who has struck out 210 batters while allowing only 81 hits in 156.2 IP over the past two seasons, is the favorite to succeed the departed Kerry Wood as the Cubs closer in 2009.
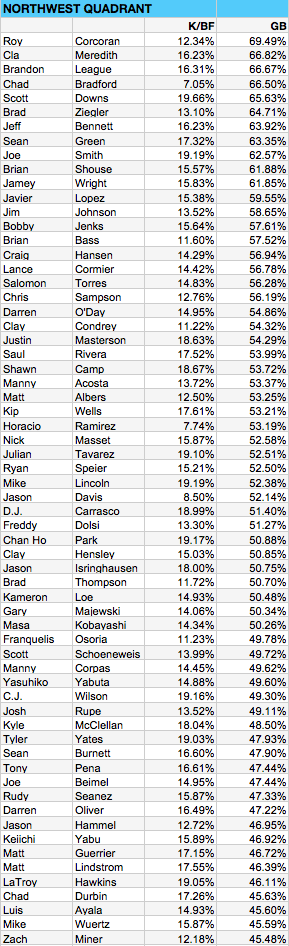
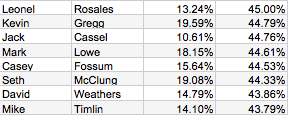
The NWQ is comprised of 11 relievers with groundball rates in excess of 60%, including Cla Meredith and Brandon League, both of whom have eclipsed the 70% mark in one of the past two seasons.
As measured by WPA, Downs (14th), Brad Ziegler (9th), and Bobby Jenks (5th) were the most successful relievers in this group. Ziegler posted a 3-0 record with a 1.06 ERA while saving 11 out of 13 opportunities for the Oakland A's even though he wasn't called up to the bigs until the last day of May. Jenks fell out of the NEQ for the first time as his K/BF has dropped from 29.76% in 2005 to 26.67% in 2006 to 22.49% in 2007 to 15.64% in 2008. The trend is not his friend.
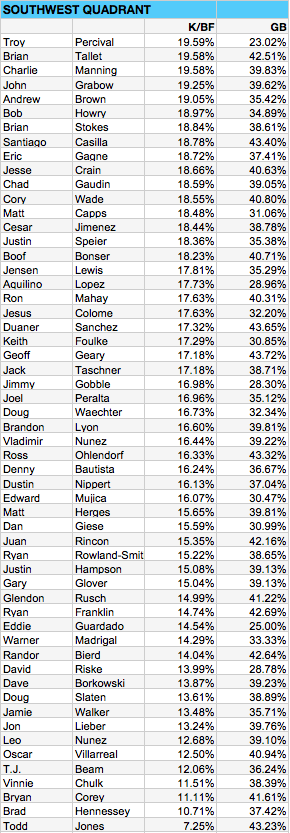
I don't think there is a single reliever in the bottom half of this quadrant that I would sign with your money, much less mine. At the bottom of the heap is Todd Jones, who lost his role as closer to Fernando Rodney, a member of the SEQ, in July and thankfully announced his retirement in September. To his credit, Jones is 14th on the all-time list for career saves. I don't know if that says more about him or the validity of the save statistic.
| Baseball Beat | February 09, 2009 |
Categorizing Starting Pitchers by Strikeout and Groundball Rates - 2008 Edition
Strikeout and groundball rates have become my favorite way to evaluate pitchers. While I also pay close attention to walk rates, I am most interested in whether pitchers can miss bats and keep batted balls in the park.
The reasons are simple and straightforward: (1) strikeouts are the out of choice and (2) groundballs are preferred over flyballs and line drives. Except for the rare missed third strike, a strikeout always produces an out and no chance for runners to advance bases (other than a stolen base). Among batted ball types, infield flies are the least harmful, followed by groundballs, outfield flies, and line drives.
Thanks to the advancements in play-by-play data, we can even place a value on the run impact of each event. For example, according to information gathered from The Hardball Times, strikeouts have had a run impact of approximately -0.11, infield flies -0.09, groundballs 0.04, outfield flies 0.18, and line drives 0.39 per incident over the past few seasons.
Although groundballs generate more hits and errors than flyballs, their run impact is lower because the hits are usually limited to singles and an occasional double down the first or third base line, whereas balls in the air that turn into hits more often become doubles, triples, or home runs. By definition, groundball pitchers give up fewer flyballs and line drives. In addition, groundball rates fluctuate less than home run rates because park effects, weather, and other forms of randomness play a huge role when it comes to the outcome of long flyballs, especially among pitchers. Therefore, if you want to maintain a low home run rate, the best thing to do is to keep batted balls on the ground.
Based on the above information, it follows that just as pitchers with high strikeout rates would generally fare better than those with low rates, pitchers with high groundball rates would normally fare better than those with low rates. Furthermore, it also suggests that pitchers who combine higher strikeout and groundball rates will outperform those with lower rates.
With the foregoing in mind, I introduced the idea of categorizing pitchers by strikeout and groundball rates for the 2006 season in January 2007 (Part I: Starters/Part II: Relievers). I also generated this information for the 2007 season in March 2008 (Part I: Starters/Part II: Relievers) and will once again provide it for the 2008 campaign, beginning with starters today and relievers tomorrow.
Consistent with the methodology that I have used in the past, the universe of starters consists of all pitchers who completed 100 or more innings and started in at least 33 percent of their appearances. There were 135 pitchers who met these requirements in 2008. Among these qualifiers, the average K/BF rate was 16.90% and the average GB rate was 43.45%. The mean K and GB rates are highlighted in red in the graph below. These averages separate the starting pitchers into four quadrants.
By placing pitchers in quadrants, one can easily distinguish those with above-average strikeout and groundball rates (referred herein as the northeast quadrant), above-average strikeout and below-average groundball rates (southeast quadrant), above-average groundball and below-average strikeout rates (northwest quadrant), and below-average groundball and strikeout rates (southwest quadrant).
The simple average and weighted average (by innings) ERA and RA are detailed in the table below. Whether using simple or weighted, ERA or RA, the message is crystal clear:
- Pitchers with above-average K rates outperform those with below-average K rates.
- Pitchers with above-average GB rates outperform those with below-average GB rates.
- Pitchers who combine above-average K and GB rates outperform all others.
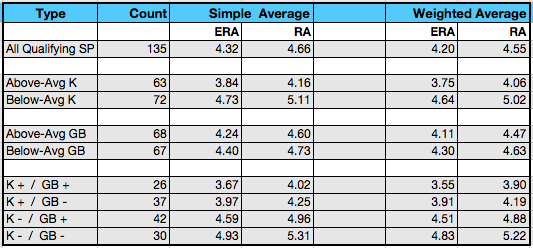
Not surprisingly, pitchers with the highest strikeout and groundball rates had the lowest average ERA, while those with the lowest K and GB rates had the highest average ERA. In the hybrid categories, pitchers with above-average strikeout and below-average groundball rates beat those with below-average K and above-average GB rates. The order of preference is the northeast quadrant, followed by the southeast, northwest, and southwest.
Looking at the outliers in the graph is one of the most interesting aspects of this study. Starting with the northeast quadrant and going clockwise, Derek Lowe, Brandon Webb, and, to a lesser extent, Ubaldo Jimenez, Roy Halladay, Chad Billingsley, A.J. Burnett, CC Sabathia, and Edinson Volquez, plus Tim Lincecum, Rich Harden, Scott Kazmir, Chris Young, Jason Bergmann, Brian Burres, Livan Hernandez, Aaron Cook, Fausto Carmona, and Tim Hudson all stand out for their extreme (good or bad) strikeout and/or groundball rates. Is there anybody who wouldn't take the outliers in the northeast quadrant over the outliers in the southwest quadrant? Lowe (3.24), Webb (3.30), Jimenez (3.99), Halladay (2.78), Billingsley (3.14), Burnett (4.07), Sabathia (2.70), Volquez (3.21), and Lincecum (2.62) all had much lower ERAs than Bergmann (5.09) and Burres (6.04).
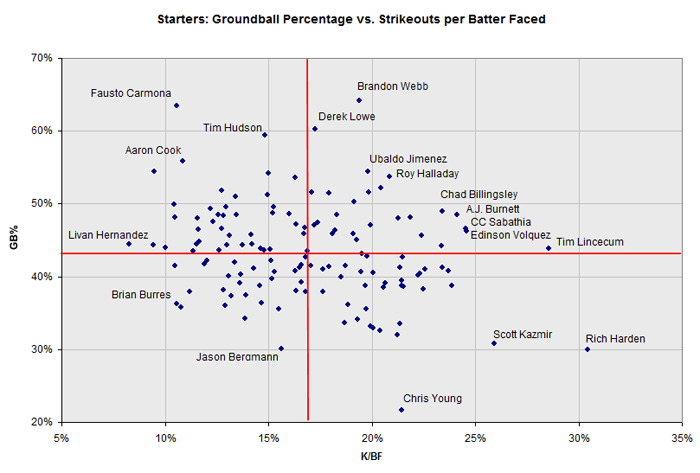
Data and graph courtesy of David Appelman, FanGraphs.
Let's take a closer look at the results. Pitchers in the northeast, southeast, and southwest quadrants are sorted by K/BF rates. Pitchers in the northwest quadrant are listed in the order of GB rates.
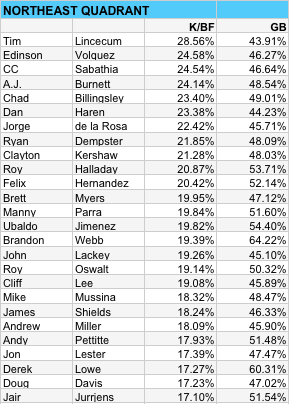
The two Cy Young award winners headline this year's northeast quadrant. Lincecum had the second-highest K/BF rate in the majors (trailing only Harden) while generating an above-average GB rate. Cliff Lee made the highly unusual leap from the dreaded southwest quadrant in 2006 (14.63%, 32.70%) and 2007 (14.89%, 35.28%) to the more tony northeast quadrant in one fell swoop, primarily owing to a harder fastball and improved movement that produced a career-best O-Swing%.
Burnett, Doug Davis, Dan Haren, Felix Hernandez, Roy Oswalt, Sabathia, and Webb have inhabited the northeast quadrant in each of our studies covering the past three seasons. If asked, "Which one is not like the others?" I'm confident that we would all answer, "Doug Davis." The 33-year-old lefthander has been near the bottom of the NE rankings in all three campaigns, barely exceeding the hurdle in both metrics each time. Davis also had the highest walk rate of this otherwise elite group in 2006, 2007, and 2008. He is what he is, an ever-so-slightly, better-than-average starting pitcher who gives up his share of hits and walks while doing a reasonably good job at missing bats and keeping the ball in the yard.
There have been just nine cases in the past three seasons of pitchers combining a 20% K rate with a 50% GB rate. King Felix is the only pitcher to accomplish this feat all three years. He posted the same K rate in 2008 as in 2007, but his GB rate dropped from 60.83% to 52.14%. Nonetheless, his three-peat is impressive, especially when you consider that he won't turn 23 until after the 2009 season starts.
Burnett is a two-time member of the 20-50 club, coming up just short on the GB side of the equation in 2008. Halladay joined the ranks this year, whiffing at least 20% for the first time since 2001. Known as a groundball pitcher, Roy was part of the northwest quadrant the previous two seasons.
Potential breakout candidates and fantasy sleepers include Jorge de la Rosa, Clayton Kershaw, Manny Parra, and Andrew Miller. Besides above-average K and GB rankings, these pitchers share two things in common: all four youngsters are southpaws with a high walk rate.
I am intrigued by de la Rosa, who was 5-2 with a 2.45 ERA and compelling peripheral stats in August and September, a period covering 11 games and nine starts (including five at Coors Field) and 58.2 innings.
Miller (6th) and Kershaw (7th) were selected back-to-back by the Tigers and Dodgers in the first round of the 2006 draft. Miller (University of North Carolina) was widely considered the top college pitcher and Kershaw (Highland Park HS, Dallas) the best high school hurler. Detroit traded Miller and Cameron Maybin (and four others) to Florida for Miguel Cabrera and Dontrelle Willis in December 2007, while Los Angeles has held on to Kershaw. Both lefties pitched an almost identical number of innings in the majors last season with the soon-to-be 21-year-old Kershaw getting the better of Miller, who turns 24 in May. Note that Clayton's K/BF and GB rates were also higher than Andrew's and his BB rate (11.06% to 11.38%) was slightly better as well.
             IP     H    R    ER  HR   BB   SO   ERA
Kershaw     107.7  109   51   51  11   52  100   4.26
Miller      107.3  120   78   70   7   56   89   5.87
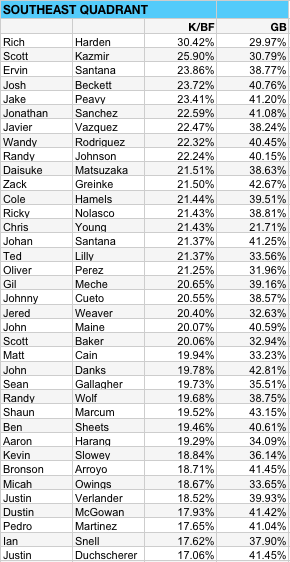
Harden stands out as the only starting pitcher in the majors with a K/BF over 30%. Over the past three years, just one starter per season has achieved this status with Francisco Liriano (30.44% in 2006) and Erik Bedard (30.15% in 2007) preceding Harden in the 30-something club. Liriano and Bedard fell victim to injuries. Following in their footsteps wouldn't be something particularly new to Harden, now would it?
Kazmir has ranked second, first, and second in the southeast quadrant for three straight seasons although it is a bit disturbing to note that his GB rate fell more than 10 percentage points below his 2006 and 2007 levels. Josh Beckett dropped out of the northeast and into the southeast grouping for the first time while slightly topping his K rate from his outstanding summer in 2007 (23.60%).
Jake Peavy, Wandy Rodriguez, Gil Meche, and Ian Snell have been a member of the northeast or southeast quadrant for each of the past three seasons, while Ervin Santana, Javier Vazquez, Cole Hamels, Chris Young, Johan Santana, Ted Lilly, Oliver Perez, Jered Weaver, Matt Cain, Ben Sheets, Aaron Harang, Bronson Arroyo, and Justin Verlander have been firmly ensconced in the SE quadrant for three years running.
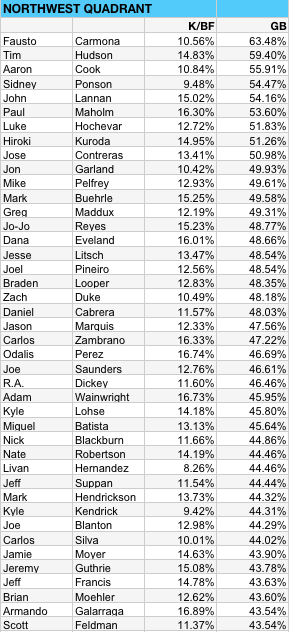
The northwest quadrant always produces a mixed bag of pitchers. Opposite of those in the SE, hurlers in the NW succeed by inducing grounders and keeping the ball in the park, whereas their counterparts thrive on strikeouts.
Carmona tops the list for the second consecutive year. Although Fausto's GB rate exceeded the rarefied 60% mark once again, his K rate fell off the cliff (from a reasonable 15.59% in 2007 when he finished fourth in the AL CYA voting to a dangerously low 10.56% in 2008). Worse yet, his K/BB rate plummeted from 2.25 to 0.83. The good news for Indians fans is that Carmona just turned 25 in December so he still has time to get his mojo back.
Paul Maholm, Carlos Zambrano, Odalis Perez (yes, Odalis Perez), Adam Wainwright, and Armando Galarraga (whose K and GB rates are essentially league average) are within hailing distance of meeting the minimum standards of the NE quadrant. With a solid K rate and a top ten GB%, the 26-year-old Maholm deserves attention as a pitcher coming into his own. Zambrano fell out of the NE for the first time since this study began, pitching to contact more often than before while improving his walk rate to a level not seen since his stellar season in 2004. Meanwhile, don't bet on Galarraga to improve his W-L record or ERA as his BABIP of .247 was unsustainably low.
At the other end of the spectrum, Livan Hernandez and Kyle Kendrick aren't long for the majors with K rates below 10%. A free agent, Hernandez may find it difficult to convince an employer to allow him to wear a big league uniform in 2009, even at the minimum salary.
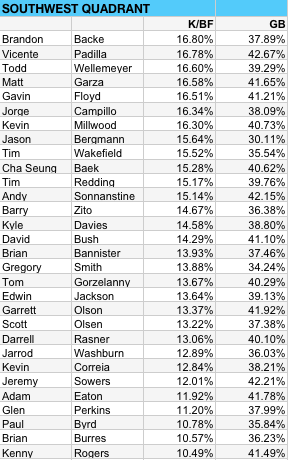
Repeating my comments from each of the past two series, "[The southwest] is the quadrant that you want to avoid. It is inhabited by some of the worst starters in the game. If you fail to miss bats and don't keep the ball on the ground when it is put into play, you are going to run into trouble." The only way to survive in this quadrant is to put up as close to league-average K and/or GB rates as possible (see Brandon Backe, Vicente Padilla, Todd Wellemeyer, Matt Garza, Gavin Floyd, Jorge Campillo, Kevin Millwood, and Andy Sonnanstine) or to throw strikes, maintain a low walk rate, and duck when the ball is put into play. However, all of these types of pitchers live on the edge with very little margin for error.
As I am wont to say, "When it comes to evaluating pitchers, I would rather know their strikeout and groundball rates than their ERA. Throw in walk rates and you have almost everything you need to know about a pitcher. Focusing on these components gives one a much more comprehensive understanding of a pitcher's upside and downside than looking at a single metric such as ERA."
Tomorrow: Categorizing Relievers by Strikeout and Groundball Rates.
| Around the Majors | February 06, 2009 |
Seasons of Change, Part 1 (of 2)
What a difference 10 years can make.
We are not far from the beginning of spring training - which also marks the beginning of the 2009 Major League Baseball season - and this can be hard to fathom for those of us in the snowy, cold northern states and Canada. The baseball landscape has changed a lot since the Philadelphia Phillies organization put the final touches on its championship season at the end of 2008. Some rosters have had significant changes (Chicago NL, New York AL), while other clubs look (unfortunately) the same (Toronto, Pittsburgh).
As we all know, the days of a player staying with the same team for his entire career are all but over. In Oakland, players are lucky to remain with the organization through their arbitration years. With spring training almost upon us, let's take a look back at how each American League club's rosters looked 10 years ago in 1999.
The Baltimore Orioles | 78-84 (Fourth)
The opening day starter for the Orioles in 1999 was none other than Mike Mussina, who announced his retirement this off-season. Outfielder Brady Anderson led off the first game of the season for the birds. Albert Belle made $11.9 million, which led the club, and was about $6 million more than the second most expensive player, Mussina. Both Belle and B.J. Surhoff drove in more than 100 runs. Cal Ripken Jr. batted .340 at the age of 38, but played in just 86 games. Mussina led the team with 18 wins, and that was followed by Scott Erickson's 15. Mike Timlin paced the bullpen with 27 saves. A rookie pitcher by the name of B.J. Ryan caught everyone's attention with 28 strikeouts in 18.1 innings of work. The club had some trouble developing hitting prospects, including Calvin Pickering, Ryan Minor, and Gene Kingsale.
The Boston Red Sox | 94-68 (Second)
Pedro Martinez was the face of the franchise in 1999 and was paid handsomely at $11.1 million, followed by... John Valentin (?!?!?) at $6.35 million. Martinez posted a 2.03 ERA that season and won 23 games. The only other pitcher with 10 or more wins was 35-year-old Bret Saberhagen, who went 10-6 in 22 games. He was out of baseball in 2000 after appearing in just three games that season. It was bullpen-by-committee for Boston with both Tim Wakefield and Derek Lowe picking up 15 saves. Tom Gordon compiled 11 game-stoppers. The Red Sox' global search for pitching was underway as the club tried rookies Jin Ho Cho (South Korea), Juan Pena (Dominican Republic), and Tomokazu Ohka (Japan) with varying degrees of success. Left-fielder Troy O'Leary led the club with 28 home runs and his 103 RBI total was second to shortstop Nomar Garciaparra who, in his third full season, looked like a future Hall of Famer. He led the club with a .357 average.
The Toronto Blue Jays | 84-78 (Third)
Pat Hentgen was the highest paid Jay at $8.6 million, while Carlos Delgado was the highest paid hitter at $5.075 million. Hentgen won just 11 games with a 4.79 ERA, in what would be his final season in Toronto. The former Cy Young winner (1996) spent 10 seasons in Toronto over the course of his career. Delgado led the club with 44 home runs and drove in 134 runs at the age of 27. In mid-season, the club stole infielder Tony Batista, 25, from the Arizona Diamondbacks, in a trade for aging LOOGY Dan Plesac. Batista hit 26 home runs in 98 games for Toronto that season and then went on to slug 41 in 2000. Former No. 1 draft pick Shawn Green had a breakout season and hit 42 home runs with 123 RBI, 20 stolen bases and a .300+ average. He was traded to the Dodgers prior to the 2000 season for Raul Mondesi. A 20-year-old by the name of Vernon Wells got his first taste of the Major Leagues.
The New York Yankees | 98-64 (First)
The Yankees had eight players making $5 million or more in 1999, with the highest paid player being outfielder Bernie Williams at $9.8 million, followed by pitcher David Cone at $9.5. Derek Jeter batted .349 and drove in 100+ runs for the only time in his career. Rookie Ricky Ledee was given an opportunity to seize an everyday role, but he failed to impress and was shipped off to Cleveland in 2000. Joe Girardi spent his final season in pinstripes as a player while backing up Jorge Posada behind the dish. Two young Dominican infielders - who were oozing with talent - made their MLB debuts in 1999: D'Angelo Jimenez, 21, and Alfonso Soriano, 23. Jimenez was considered by some to be a more promising prospect than Soriano. Mariano Rivera led the club with 45 saves (surprise, surprise), while both Roger Clemens and Andy Pettitte had down years with ERAs of 4.60 and 4.70, respectively. They combined for just 28 wins (a low total for those two), but they still did better than every New Yorker's favorite player Hideki Irabu, who posted a 4.84 ERA.
The Tampa Bay Rays | 69-93 (Fifth)
The Devil Rays club has arguably come further than any other organization in 10 years. The 1999 season was just the second season in the brief history of the club. The organization received 34 home runs out of Jose Canseco and 32 bombs from Fred McGriff. Hall of Fame third baseman Wade Boggs played his final MLB season and finished the year with a .301 batting average and a .328 career average. Closer Roberto Hernandez led the club with a salary of $6.1 million (Why does an expansion team need a top-tiered closer?). He did earn his money, though, by saving 43 games. Wilson Alvarez led the club in wins with nine. Bobby Witt threw a team-leading 180.1 innings and managed a record of 7-15. Thirty-five-year-old rookie Jim Morris made headlines by appearing in his first Major League game.
The Chicago White Sox | 75-86 (Second)
Frank Thomas led the club with a $7 million salary in 1999. But he managed just 15 home runs in 135 games, the lowest total since his rookie season, when he appeared in just 60 games. It was also the first full season in which he did not drive in 100 or more runs (breaking the string at eight seasons). Paul Konerko took over first base at the age of 23 and hit .294/.352/.511. Mike Caruso played his second full season at shortstop at the age of 22, but fell off the map in 2003. Rookie Carlos Lee, 23, hit .293 and drove in 83 runs. The pitching imploded with four starting pitchers posting ERAs above 5.10, including James Baldwin, Jim Parque, Jamie Navarro, and John Snyder. Neither Snyder nor Parque, former promising prospects, realized their potential. Bob Howry led the club with 28 saves.
The Minnesota Twins | 63-97 (Fifth)
The Twins had just seven players who made $1 million or more, led by closer Rick Aguilera ($4.3 million), who saved just six games and appeared in 17 games due to injuries. Mike Trombley picked up the slack and saved 24 games, which was the only time he reached double-digits in saves in his career. Brad Radke led the club in wins (12) and losses (14), but was tied in the latter category by LaTroy Hawkins. The Twins trotted out a slick-fielding, 21-year-old rookie shortstop by the name of Cristian Guzman. He showed promise in the field but hit just .226/.267/.276. The club also featured a rookie in center-field named Torii Hunter. Ron Coomer led the club with 16 home runs, Marty Cordova had 70 RBI, and rookie third baseman Corey Koskie led the club with a .310 batting average.
The Detroit Tigers | 69-92 (Third)
The Tigers paid a lot of money to Willie Blair ($3.75 million, third on the team) to win three games and post a 6.85 ERA. Dave Mlicki led the club with 14 wins. Promising lefty Justin Thompson had the last mildly productive year of his career before injuries ruined it. Rookie Jeff Weaver, 22, looked like the Next Big Thing in Detroit. Todd Jones saved 32 games, while keeping the closer's role warm for the Other Next Big Thing Matt Anderson, 22. Offensively, Dean Palmer led the way with 38 home runs and 100 RBI. Tony Clark slugged 31 home runs but drove in just 99. Back from the Mexican Leagues where he spent two seasons, Luis Polonia, 35, had the best average at .324, and was in fact the only hitter to bat above .300 that season. Karim Garcia hit 14 home runs at the age of 23 and looked like he might finally make good on his massive potential. Or not.
The Kansas City Royals | 64-97 (Fourth)
The Royals had just five players making $1 million or more, led by pitcher Kevin Appier and infielder Jeff King, both of whom broke the $4 million mark. Jose Rosado, 24, looked like a future pitching star after allowing just 197 hits in 208 innings in 1999. He also posted a 3.85 ERA, but injuries destroyed his career, which ended in 2000. Jeff Suppan, 24, also provided 200+ innings in 1999. Promising pitching prospects Dan Reichert, Jim Pittsley, and Orber Moreno failed to develop. Long-time Royals closer Jeff Montgomery faced the end of his pitching career after saving just 12 games and posting an ERA of 6.84. Rookie Carlos Febles looked like a long-term solution at second base after a solid debut, but he failed to make adjustments and regressed. Former catcher Mike Sweeney made good on his conversion to first base and hit 22 home runs, drove in 102 runs and hit .322. Carlos Beltran, 22, won the Rookie of the Year award after hitting .293 with 22 home runs, stealing 27 bases and driving in 108. Jermaine Dye, playing full-time for the first time in his career, led the club with 27 home runs and 119 RBI.
The Cleveland Indians | 97-65 (First)
The veteran powerhouse had 15 players that made $1 million or more in 1999. Offense was the name of the game in Cleveland in 1999, with three players slugging 30 or more home runs, including Manny Ramirez (44), Jim Thome (33), and Richie Sexson (31), in his first full season. Roberto Alomar and David Justice also had more than 20. Rookie Einer Diaz took over behind the plate for the aging Sandy Alomar Jr., who was injured. Bartolo Colon, 26, led the club in wins with 18 in just his second full season. Veteran Charles Nagy was next with 17, in what would be his last productive season at the age of 33. Former rookie phenom Jaret Wright, 23, imploded with an 8-10 record and ERA of 6.06. Mike Jackson led the club with 39 saves.
The Seattle Mariners | 79-83 (Third)
Ken Griffey Jr. was still "The One" in Seattle in 1999, but Alex Rodriguez was hot on his heels. Griffey hit 48 home runs with 134 RBI, but Rodriguez matched him in average (.285) and trailed him with 41 home runs and 111 RBI at the age of 23. It was, though, Griffey's swan song in Seattle, as he was moved to Cincinnati prior to the 2000 season. Other key offensive contributors included Edgar Martinez (.337 average), David Bell (21 homers), and Brian Hunter (44 stolen bases). On the mound, Freddy Garcia came in second in Rookie of the Year voting after winning 17 games, to lead the club. Gil Meche was another budding superstar with an 8-4 record in 16 games at the age of 20. Jamie Moyer, 36, and surely at the end of his career, was second in wins with 14. Jeff Fassero posted a hideous 7.38 ERA in 30 games (24 starts). Jose Mesa led the way in the 'pen with 33 saves.
The Los Angeles Angels | 70-92 (Fourth)
Known as the Anaheim Angels, the club struggled mightily in 1999. The club was old - especially in the pitching department. The five starters that made 20 or more starts were 31 or older. Chuck Finley, 36, led the club with 12 wins, followed by reliever Mark Petkovsek with 10 and starter Omar Olivares with eight. Two young hurlers under the age of 25 got their feet wet: Jarrod Washburn made 10 starts and Brian Cooper made five. Troy Percival anchored the bullpen with 31 saves. Offensively, Mo Vaughn slugged 33 home runs and drove in 108. Tim Salmon was bitten by the injury bug and had his first unproductive season with just 17 home runs and 69 RBI. Troy Glaus provided hope for the future by slugging 29 home runs in his first full MLB season.
The Oakland Athletics 87-75 (Second)
The A's were still bashing away in 1999 with five players slamming 21 home runs or more. Matt Stairs, back from Japan, led the way with 38 dingers, followed by scrap heap recovery John Jaha with 35. Jason Giambi also broke the 30 mark by three. Top prospect Eric Chavez spent his first full season in the Majors with modest results. Left-fielder Ben Grieve slammed 28 home runs and looked like another homegrown star-in-the-making. In the beginning, the Big Three began with the appearance of Tim Hudson, who went 11-2 in 21 games in his debut season at the age of 23. Veteran Gil Heredia led the club with 13 wins and 200 innings. Billy Taylor, 37, led the club with 26 saves. Rookie Chad Harville and Luis Vizcaino were seen as potential replacements.
The Texas Rangers | 95-67 (First)
The Texas Rangers club powered its way to an AL West title and bested the club's Pythagorean record by seven wins. Catcher Ivan Rodriguez won the AL MVP award after hitting 35 home runs, driving in 113 and batting .332. Rafael Palmeiro slugged 47 home runs and drove in 148. Juan Gonzalez had 39 home runs and drove in 128. Four regulars batted .300 or better. Mark McLemore and Rusty Greer each scored 100 runs or more. Superstar-in-waiting Ruben Mateo made his Major League debut and appeared in 32 games with a .238 average and five home runs. The pitching was not as pretty as the hitting, although Aaron Sele won 18 games despite a 4.79 ERA. Rick Helling won 13 games with a 4.84 ERA and Mike Morgan won 13 with a 6.24 ERA. Mark Clark made 13 starts despite an 8.60 ERA. John Wetteland, 32, led the club with 44 saves and no one thought that he would retire after just one more season. Jeff Zimmerman and Dan Kolb were expected to anchor the bullpen for years to come.
Thanks for reading and be sure to check back next week for a look at the National League teams from 1999.
With spring training almost here, it also means that Fantasy Baseball season is heating up. If you're looking for some great advice throughout the season (as well as the pre-season), be sure to check out John Burnson's Heater Magazine, which provides weekly statistical analysis from some of the smartest minds from across the Internet. The magazine is introducing a new, weekly feature this spring called Radar Tracking, which helps track each team's moves and ever-changing rosters and player roles to help you prepare for the 2009 Fantasy Baseball season. Each team is being analyzed by writers and bloggers who regularly follow the clubs. Here is a sneak peek at some of the first week's Radar Tracking.
| Designated Hitter | February 05, 2009 |
2009 Projections with Hit Tracker
Oh, no, not another projection system! Why would someone want to join the logjam of current systems? In no particular order, we have ZiPS, CHONE, Oliver, Marcel, Bill James, PECOTA and no doubt some others I haven’t stumbled across (sorry). All of these systems are designed to tell us how MLB players will perform next season, but none of them can convincingly claim to be more accurate than all the rest. When I look at any particular player’s projections in the various systems, I see a lot of similarity, which makes me suspect there must be some degree of groupthink going on. I believe there is some potential to improve performance forecasting by doing something different.
In the following paragraphs, I will outline a system for forecasting using Hit Tracker, an aerodynamic model for flying baseballs that is well-known for providing accurate home run measurements. I can guarantee that the Hit Tracker system will be different. Better? I won’t be able to say for sure until the 2009 season is over.
Background: How We Forecast Now
Why is it so difficult to forecast a player’s performance accurately? One huge reason is that every one of the current systems for performance projection starts from a set of data — the player’s prior year’s "box score stats" — that is positively riddled with statistical noise (chief among these uncontrolled noise factors are the dramatic differences in ballpark configurations and playing conditions across the 2,430 games played in 30 different parks over the course of six months).
Let’s consider another familiar form of forecasting: weather. In the 19th century, after the invention of the telegraph, weathermen began to form their predictions by first learning the weather "upwind," and then adjusting those measurements to come up with a forecast. "How hot will it be tomorrow? Well, it was 85 degrees today in the state where our weather seems to be coming from, so we’ll start with 85 and then adjust it up or down according to our experience. It’s usually a little hotter there than it gets here, so let’s say 82 degrees…" They didn’t call them "city factors" back then, but they could have.
After computers became available in the mid-20th century, weathermen became meteorologists, and the process of forecasting weather has continued to become more involved and mathematical as the years have gone by. Contemporary meteorologists now monitor a much larger array of parameters, and they feed these lower-order parameters into elaborate computer-based models to arrive at predictions for the higher-order outcomes like temperature, or winds, or precipitation. Thanks to more accurate measurements, and more detailed models, weather forecasts are dramatically more accurate today than those of even only 10 years ago.
In my opinion, baseball forecasting systems resemble the "19th century weatherman" system described above: to forecast something, measure something (well, in baseball we should say "count" something) that has happened already, then adjust this number to predict what hasn’t happened yet. So, to predict a player’s home runs, for example, the starting point is always his prior year’s total for home runs (or perhaps a weighted total from several seasons). From this starting point, various adjustments are applied to arrive at a final projection. Never mind where those home runs were hit, or how far they flew, or how much help or hindrance the weather may have provided them. Just count and adjust.
Starting from last year’s total assigns an equal value to what may in reality be very different events. For example, Jeremy Hermida hit two radically dissimilar fly balls last year, each of which cleared the home run fence: first, a windblown 321 foot homer in San Francisco on Aug. 20th, and second, a 443 foot rocket in Miami on July 19th. In a game context, they count the same, but when we are trying to measure the likelihood of future home runs, we should acknowledge that the outcome of one of those fly balls (the short one) was entirely dependent on its ballpark and weather context, while for the other fly ball, the ballpark and weather were irrelevant to the outcome. The short fly ball could only have become a home run in a park with a very shallow RF fence like AT&T Park, and only with the help of a tail wind. The long one would have been a homer in every park major league baseball has ever been played in, in any wind short of a hurricane blowing towards home plate.
Any system that cannot recognize the difference between two events such as these Hermida home runs cannot hope to consistently generate highly accurate predictions. I don’t mean this as a criticism of anyone who has created a projection system, don’t get me wrong. But I do believe that those systems have reached the limit of their capabilities, with average errors of around 60-70 points of OPS, and any further refinement of these models will probably just chase the statistical noise around in circles.
Something Different
How can we get away from the practice of predicting future outcomes by using prior outcomes? I believe that the key is to consider the lower-level processes that lead to the final result of any particular batted ball. Some of these are the landing point of the hit, how hard the ball was hit, and the physical environment that the ball was hit in. For those batted balls where the physical environment is crucial (i.e. long fly balls), we need to measure the trajectory of the ball, the fence dimensions of the park, and the weather. For the rest of the batted balls, where the physical environment isn’t very important to the final result, we don’t need to.
In Hit Tracker, I have developed a method for analyzing the trajectory of long fly balls and projecting them into each of the 30 MLB ballparks for the purpose of generating a performance forecast. It is my hope that this system will yield more accurate performance forecasts.
How It Works: Steps in the Hit Tracker Forecasting Method
- Observe all long fly balls hit by a player in the past 1-3 years.
- A long fly ball is defined as any ball the player hit that might have approached or cleared the fence, if hit in any of the 30 MLB ballparks in any reasonable weather conditions.
- This very liberal standard is applied to ensure that all the long fly balls are captured. Having a few not-so-deep flies in the data set won’t cause any problems, because if a particular ball turns out to be a flyout in every park, this is equivalent to not including that ball in the analysis.
- Analyze each long fly ball in its actual weather conditions, to determine its launch characteristics (Speed Off Bat, Horizontal and Vertical Launch Angles, Spin).
- Note each long fly ball’s original result (2B, 3B, HR, Flyout, etc.).
- Project each long fly ball into each of the 30 MLB ballparks, in the average weather conditions for that ballpark (calculated over a 5-year period).
- Note the hypothetical result of each projected fly ball in each ballpark.
- Balls that fly far enough to clear the fence are judged to be home runs.
- Balls that hit the fence more than 8 feet above field level are judged to be extra base hits.
- All other balls are considered to be "catchable," and are analyzed further using a range model.
- The range model uses standard assumed initial positions of outfielders, a distance vs. time model for an average outfielder, the actual landing point of the ball and the time of flight of the ball to determine if the ball would have been caught.
- An empirical method was used on approximately 1,000 actual fly balls to determine the 50/50 likelihood boundary between outs and hits, in terms of time and distance from the closest outfielder. This boundary is then used as the evaluation criteria for catchable balls: balls inside the range circle of any outfielder for a given time of flight are flyouts, and balls outside it are extra base hits.
- For each ballpark, count the net hits and bases for the long fly ball data set:
- For each ball that was originally a hit, but projected as an out, give a -1 for hits and –X for bases (e.g. for a ball that was originally a short home run to RF in Yankee Stadium, but which projects to be caught in Fenway Park, give -1 hit and -4 bases.)
- For each ball that was originally an out, but projected as a hit, give +1 for hits and +X for bases (e.g. for a ball that was originally a flyout to LF at Yankee Stadium, but which projects to hit the Green Monster in Fenway Park more than 8 feet up, give +1 hit and (usually) +2 bases.)
- For each ball that was originally a hit, but which projects to be another sort of hit, give ± X bases (e.g. for a home run to RCF in Shea Stadium that projects to be an extra base hit in Citi Field, give -2 or -1 bases, depending on the speed of the runner, the location of the hit and the time of flight.)
- Apply the net adjustments to hits and bases for all the long flies to the player’s actual stats for the season in question. Calculate OBP/SLG with the adjustments. This becomes the player’s projection for that ballpark.
- For projections based on multiple years of long fly balls, apply appropriate weighting factors (e.g. 3-2-1) to the projections for each ballpark.
- Using the MLB schedule for the season of the projection, create a projection for the player as a member of each team by multiplying their performance averages in each ballpark by a weighting factor proportional to the number of games each team plays in each park.
Case Study: Manny Ramirez
To further illustrate the method, I am going to highlight some of the findings from the Hit Tracker Analysis of Manny Ramirez over the years 2006-08, and his forecast for 2009.
First and foremost, I hope Manny Ramirez re-signs with the Los Angeles Dodgers for 2009, because Dodger Stadium is an absolutely perfect place for him to hit. I am not saying it is perfect for everyone; in fact, Dodger Stadium is a difficult place to hit for average or below average hitters, because its fences are deep in the corners where lesser hitters typically place their home runs. I am saying that Dodger Stadium is perfect for Manny. Manny’s swing, particularly his phenomenal power to center and right-center field, is ideally suited for the dimensions and environmental conditions of Dodger Stadium. I described the unique layout of Dodger Stadium (deep corners, shallow alleys and center field) in detail in my article, "Hit Tracker 2008," which was published in the 2009 Hardball Times Annual earlier this off-season.
At the opposite extreme, Manny’s home from 2000 to the 2008 trade deadline, Fenway Park, has robbed him of a great number of home runs over the years, perhaps as many as 50, as well as many other extra-base hits. Fenway’s very deep right-center and right fields have turned many of Manny’s towering opposite field drives into outs, and its 37-foot high Green Monster has turned many of his blistering drives to left and left-center field into doubles (or even singles).
A popular image exists of the Green Monster adding lots of extra-base hits to a hitter’s total by turning shallow fly balls into wall-scraping doubles, but this hasn’t been the case for Manny: in the three seasons 2006-08, Manny only hit 6 doubles at Fenway that would have been outs at Dodger Stadium. Over the same period, Manny hit 23 flyouts, 5 doubles and 1 triple at Fenway that would have been home runs at Dodger Stadium.
In the first 4 months of 2008, Manny encountered a particularly bad run of luck with his deep fly balls; despite racking up 20 home runs during that time, Manny could have gotten a lot more. Here is a list of Manny’s deep fly balls for the Boston Red Sox in 2008 that were not actually home runs, but which would have been home runs on an average day in Dodger Stadium. Where the weather negatively impacted his fly ball to a significant degree, this is listed as well:
- April 2, 2008 at Oakland, 407 ft. flyout to deep CF, lost 11 ft. of distance from wind and temperature.
- April 5, 2008 at Toronto, 387 ft. double to LCF.
- April 8, 2008 at Boston, 395 ft. triple to RCF, lost 25 ft.
- April 11, 2008 at Boston, 361 ft. flyout to RF, lost 7 ft.
- April 17, 2008 at New York Yankees, 395 ft. flyout to CF, lost 3 ft.
- April 24, 2008 at Boston (7th inning), 383 ft. double to RCF
- April 24, 2008 at Boston (9th inning), 402 ft. flyout to CF
- May 5, 2008 at Detroit (2nd inning), 415 ft. double to RCF
- May 5, 2008 at Detroit (3rd inning), 416 ft. flyout to CF
- May 6, 2008 at Detroit, 404 ft. flyout to LCF
- May 7, 2008 at Detroit, 402 ft. flyout to CF
- May 18, 2008 at Boston, 368 ft. flyout to RF, lost 9 feet
- May 19, 2008 at Boston, 386 ft flyout to CF, lost 11 feet
- May 23, 2008 at Oakland, 356 ft. flyout to RF, lost 6 feet
- June 4, 2008 at Boston, 364 ft. flyout to RF, lost 18 feet
- July 9, 2008 at Boston, 429 ft double to LCF off top of Monster
- July 19, 2008 at LA Angels, 378 ft double off RF wall
- July 27, 2008 at Boston, 410 ft flyout to RCF triangle
- July 30, 2008 at Boston, 367 ft flyout to LCF, lost 11 ft
Now, to be fair we have to look at the good luck Manny encountered during that same time frame. Here’s the list of Manny’s deep fly balls for the Boston Red Sox in 2008 that were actually home runs, but which would have not have been home runs on an average day in Dodger Stadium (there are 4):
- May 12, 2008 at Minnesota, 354 ft home run to RF
- May 27, 2008 at Seattle, 361 ft home run to RF
- June 1, 2008 at Baltimore, 382 ft home run to RF, got +23 ft help
- July 8, 2008 at Boston, 384 ft home run to LF, got +32 ft help
That’s a net of 15 balls hit by Manny in the first 4 months of 2008 that had the power to fly out of Dodger Stadium, but which didn’t make it out where Manny actually hit them. Watching the video of these hits, the disbelief and disgust on Manny’s face was apparent after several of his blasts came up short due to deep fences, cold/windy weather or a combination of the two. Once he was traded to LA, those balls started making it out at a much higher rate: Manny connected for 9 home runs in only 80 at-bats in Dodger Stadium in 2008.
Forecast: Manny Ramirez 2009
Manny’s forecast for 2009 is based on analysis of all 248 long fly balls he hit during the 2006, 2007 and 2008 seasons. In 143 games in 2009, Manny should continue to perform extremely well in a Dodger uniform: the Hit Tracker forecast projects him to post the following numbers:
Los Angeles Dodgers: .430 OBP, .641 SLG, 1.071 OPS and 36 home runs (including 21 at Dodger Stadium).
As of the posting of this article, Manny is still a free agent, so here are forecasts for some other teams Manny might sign with:
San Francisco: .428 OBP, .618 SLG, 1.047 OPS, 32 home runs.
NY Mets: .417 OBP, .566 SLG, .983 OPS, 26 home runs.
More Forecasts
Here are the Hit Tracker forecasts for several other MLB players. Some of the projections are based on three years of data (2006-08), while some are based only on one year of data (2008). The three-year forecasts are expected to be more accurate.
Forecasts Based on 2006-08 Data
Jason Bay, Boston Red Sox
Boston: .368 OBP, .501 SLG, OPS .869, 27 HR’s
Adam Dunn, free agent
LA Dodgers: .394 OBP, .587 SLG, .981 OPS, 47 HR’s
Washington: .389 OBP, .555 SLG, .944 OPS, 43 HR’s
NY Mets: .382 OBP, .506 SLG, .888 OPS, 35 HR’s
Atlanta: .387 OBP, .543 SLG, .930 OPS, 41 HR’s
Boston: .392 OBP, .549 SLG, .941 OPS, 39 HR’s
Forecasts Based on 2008 Data Only
Mark Teixeira, New York Yankees
New York Yankees: .420 OBP, .588 SLG, 1.008 OPS, 32 HR’s
Matt Holliday, Oakland Athletics
Oakland: .418 OBP, .563 SLG, .981 OPS, 28 HR’s
San Francisco: .426 OBP, .593 SLG, 1.019 OPS, 32 HR’s
Boston: .420 OBP, .557 SLG, .977 OPS, 25 HR’s
New York Yankees: .422 OBP, .584 SLG, 1.006 OPS, 32 HR’s
New York Mets: .417 OBP, .546 SLG, .963 OPS, 24 HR’s
Nate McLouth, Pittsburgh Pirates
Pittsburgh: .348 OBP, .484 SLG, .833 OPS, 29 HR’s
Validation
In an attempt to validate the Hit Tracker forecasting method, I analyzed the 2007 long fly balls of three players who changed teams during the 2007-08 off-season: Torii Hunter, Aaron Rowand and Jim Edmonds. Using this data, I projected their 2008 results as a member of the teams they ended up with, and compared to their actual performances in 2008.
Torii Hunter
HT Projection as Los Angeles Angel: .325 OBP, .485 SLG, .810 OPS, 25 HR’s
Actual as Los Angeles Angel: .344 OBP, .466 SLG, .810 OPS, 21 HR’s
Slightly off on the home runs, but overall a very good projection.
Aaron Rowand
HT Projection as San Francisco Giant: .373 OBP, .507 SLG, .880 OPS, 25 HR’s
Actual as San Francisco Giant: .339 OBP, .410 SLG, .749 OPS, 13 HR’s
This is terrible, but there is an explanation: on June 6th, Rowand sustained a right quadriceps injury that hindered him the rest of the year. His actual production splits are as follows:
Through June 6th: .396 OBP, .526 SLG, .922 OPS, 23 HR’s (pro-rated for a full year)
After June 6th: .303 OBP, .338 SLG, .641 OPS, 9 HR’s (pro-rated for a full year)
The HT projection matched the pre-injury Rowand reasonably well, considering the small sample size of about 1/3 of a season. Since the forecast was based on a relatively injury-free 2007 season, this is a fair comparison to make, I think. By the way, if anyone ever comes up with a way to predict the performance of a player who plays hurt through the final 96 of his 152 games, do me a favor: a) tell me what the stock market is going to do in the next year, b) wait a couple days, c) tell the world. In a year, I’ll be rich, and you’ll be famous!
Jim Edmonds
HT Projection as SD/CHC: .346 OBP, .488 SLG, .834 OPS, 18 HR’s
Actual as SD/CHC: .343 OBP, .479 SLG, .822 OPS, 20 HR’s
This is another good projection. Edmonds hit a lot of deep fly balls to left-center field in 2007 that were caught in his home park, Busch Stadium. That tendency carried over to the following season, but it didn’t help him in San Diego, where he started the year. However, after a May trade to the Cubs, Edmonds found a place where that swing worked well. Left-center field is the most favorable spot in Wrigley Field for home runs, and Edmonds took advantage, hitting 6 of his 11 Wrigley home runs into the bleachers in front of Waveland Ave. On the road he picked his spots well also, hitting 7 of his 9 away homers to left and left-center field. A projection that either didn’t factor in Edmonds’ home park, or which couldn’t discern his tendency to hit the other way with power, would be at a disadvantage when trying to accurately forecast Jim Edmonds.
More Thoughts About Forecasting
Here are some possible adjustments I considered, but decided not to include in the Hit Tracker system:
BABIP Adjustment
Regressing a player’s numbers towards the league average BABIP is a common tactic in projection systems. Instead of leaving alone all the non-long fly balls, I considered trying to adjust these hits according to the hitter’s BABIP, e.g. taking away an appropriate number of hits from the projection if the player showed an unusually favorable BABIP during the prior season(s).
My objection to this method is that I don’t feel that I can be certain that a player’s unusually high (or low) BABIP was due to luck instead of due to some underlying real factor. I don’t want to assume that a player’s BABIP should be a certain value, and regress back towards that value, because I don’t feel confident enough that I can pinpoint what that value should be for each individual player. I definitely don’t want to regress all hitters towards a common BABIP. In any event, the use of three years of data to generate projections should minimize any possibility of a player’s wildly aberrant BABIP ruining his projection.
Age Adjustment
Adjusting a projection for a player’s age is another common tactic which has some merit when one’s objective is to be correct "on average," for a large group of players. However, I feel uncomfortable applying an aging correction factor "across the board," without any regard for a player’s particular situation. Perhaps on average hitters lose a small amount of their power each year, but I don’t feel like I can say for which hitters that is true, and for which hitters that is not true, so I have chosen to leave out an aging factor.
I freely admit that an ideal forecasting system of the future will include some method for predicting the effects of aging on future performance, and that I am leaving it out. In the future I hope to be able to incorporate predictive aging into the HT model in terms of lower-level parameters such as speed off bat, or the direction of hits, rather than a crude adjustment of the final results. Such changes in hitters’ spray patterns can readily be detected (a good example is Jim Edmonds, whose long fly balls have decreased in distance and shifted from RF towards LF for the past several seasons.)
Modeling aging in this more detailed manner should also allow for situations where a decline in raw hitting performance does not manifest in a decline in results, such as a power hitter who loses a bit of distance on his fly balls, but still clears the fence with room to spare. I don’t want to paint that hitter, or any hitter for that matter, with the broad brush of "aging means the numbers get smaller"…
Overall "Regression to the Mean"
Some systems regress all of a player’s box score stats towards a selected value, typically a mean value for a subset of the population such as the AL, NL or all of MLB. The purpose of doing so is to account for the possibility that, due to limited sample size, a player has fortuitously outperformed or underperformed their true talent level. The league mean values are used because it is believed that it is impossible to accurately pinpoint a player’s true talent level.
It is certainly true that in any large sample of players, there will be some players that significantly outperform their true talent, some who significantly underperform, and some who perform roughly at their true talent level. In a system where box score outcomes are the only form of data, it makes sense to regress the outcomes to the mean: even though such a system might make some strange predictions (a career high 3 homers in 2009 for Juan Pierre, who has hit one ball out of the park in his last 1,097 at bats?), overall it will perform better than it could without applying such regression.
However, the Hit Tracker system accounts for variation from true talent level in a different way: by including all long flies instead of just homers, the luck factor for ballparks and weather is removed. By including multiple years of data, the sample size becomes even bigger, further decreasing the need to compensate via some form of regression to the mean. With these methods in use, I don’t feel it is appropriate to also add 75 or 80 at-bats from Gabe Gross to the reigning NL MVP’s numbers from 2008 before trying to predict how Prince Albert will do next year.
Advantages of the Hit Tracker System
- The Hit Tracker system goes a long way towards removing statistical noise from the projection. Most good or bad luck a player may have had because they hit a particular ball in a large or small park, in favorable or unfavorable weather, will be removed.
- Analyzing all long fly balls increases the sample size for evaluating power potential, which is one of the most important variables in performance projection. This method makes it possible to detect unlucky trends (Adam Dunn hit 16 balls more than 400 feet that were not home runs in 2008), or lucky trends (9 of Mark DeRosa’s 21 homers in 2008 were blown over the fence by the wind.)
- Team-specific projections are created, but without the use of the extremely blunt instrument known as Park Factors. Because park-based projections are used, the fit of a player’s spray profile to a park’s dimensions and weather is included, and is crucial. The frequency of visits to other parks is also included, capturing the importance of the unbalanced schedule and the vagaries of the interleague schedule.
- Hit Tracker projections are based entirely on what a player does, rather than what an average player does. Since the HT method is focused on making an accurate projection for a single player (and not an entire league), it does not use across the board regression to the mean. Regression to the mean compensates for variables that are missing from a model: Hit Tracker measures those variables instead.
Disadvantages
- The HT method is time-consuming. The observation data required for this method is not for sale, and the analysis can only be done by me.
- The HT method requires video of all batted balls for the player in question. If any hits are not available, the accuracy of the forecast may be reduced proportionally to the percentage of missing balls.
- Because the method depends on analysis of long fly balls, there is a limited ability to evaluate rookies.
Between now and the beginning of the 2009 season, I hope to post some more forecasts for other players, or perhaps expand some of the one-year forecasts listed above to three years. After the 2009 season we’ll have a chance to see how well this method did. I’m hoping that Hit Tracker will be able to bring the process of making projections forward to where weather forecasting was in the 1970’s: occasionally way off, more often on the money, but still far short of perfection (which is forever out of reach). Then we’ll figure out what the next step is…
Greg Rybarczyk is the creator of Hit Tracker, an aerodynamic model and method for recreating the trajectory of batted baseballs. With Hit Tracker, Greg has analyzed more than 15,000 MLB home runs over the past 3 seasons; a multitude of data on hitters, pitchers, ballparks and more can be found at hittrackeronline.com. While not tracking hits, Greg works as a reliability engineer, and he lives in the Portland, OR area with his wife and two children. Feel free to contact Greg at grybar@hittrackeronline.com.
| Change-Up | February 04, 2009 |
While the Gettin' Was Good
Raul Ibanez has been one of the most consistent offensive producers over his last three seasons in Seattle. His fielding leaves quite a bit to be desired, however, and he is entering his 37 year-old season.
Dave Ross will be 32 for the 2009 campaign. While he has shown flashes of proficiency with the bat, he has never eclipsed 350 plate appearances and has been known to struggle mightily over long stretches. Last season he was released outright by the Cincinnati Reds in August, cleared waivers and was subsequently picked up by the Red Sox.
What do these two men have in common? They were both free agents coming out of the 2008 campaign and signed a week apart from one another early on in the hot stove season - Ross with the Atlanta Braves on December 5th and Ibanez with the Philadelphia Phillies on December 12th.
Most seasons, or rather most off-seasons, two free agents receiving contracts more or less in line with what they figure to be worth would not make for interesting material. But this year, with their respective above average outfielder and dependable backup catcher peers still in the unemployment line, Ibanez and Ross (or at least their agents) come out looking awfully smart.
There happens to exist a perfectly compatible peer group for Ibanez this off-season. Outfielders Pat Burrell, Adam Dunn, Manny Ramirez and Bobby Abreu, like Ibanez, are all excellent offensive performers who struggle badly with the glove. Below are their ages and what one projection system, Marcel, has in store for them in 2009 (here are links to Marcel's projection system as well as a definition of wOba thanks to FanGraphs).
          Age       Marcel Projected wOba
Dunn       29               .372
Burrell    32               .369
Abreu      35               .365
Ramirez    37               .389
Ibanez     37               .344
So how has this off-season shaken out for this group? Ibanez, who looks like the least attractive option on that list, signed for three years and a guaranteed $30 million back in early December. In January, Burrell signed for two years and $16 million with the Tampa Bay Rays. Ramirez, Abreu and Dunn remain unemployed and will not even sniff what they might have received had they jumped on initial offers that are now surely off the table.
A free agent peer group for Dave Ross does not fit quite as nicely. He is younger than many of the other back-up catchers on the market and has performed, for the most part, a bit better than them. Still, I think a group of Johnny Estrada, Pudge Rodriguez, Sal Fasano, Adam Melhuse and Toby Hall could reasonably be labeled free agent "peers" of Ross. Let's apply the same numbers as we did with the outfielders above.
          Age       Marcel Projected wOba
Estrada    33               .305
Pudge      37               .309
Fasano     37               .298
Melhuse    37               .293
Hall       33               .281
Ross       32               .323
In this group, Estrada, Pudge and Fasano all remain free agents, Melhuse and Hall are headed to MLB Spring Training with Minor League deals and Ross has a two-year, $3 million guaranteed contract with the Atlanta Braves. If you looked solely at the numbers above, that might make some sense but it's worth pointing out that if you consult the Fangraphs page for Ross, you see that Marcel is easily his most optimistic projection. Remember, in 2007, the year in which he played more than any other in his career, Ross posted a .203/.271/.399 line. This is not necessarily a guy who stands out from the crowd listed above. Two years guaranteed, in this market, appears to be a coup.
Like Ibanez, Ross received the contract he did at least in part because he jumped on the initial offer(s) coming his way. Whether that was the result of foresight or dumb luck nobody will ever know. But what we do know for sure is that the gettin' was good early, not so good in the middle, and now it appears that All-Star and HOF caliber players will have to suit up teams they felt were low-balling them all along; all while Raul Ibanez - Raul Ibanez! - toils care-free knowing he will be clearing $300,000 or so every couple of weeks during baseball season for the next three years.
| Baseball Beat | February 02, 2009 |
Heyman "Breaks" Another Story
"Just a puppet on a lonely string
Oh who would ever want to be king?"
- Coldplay, Viva La Vida
Jon Heyman has done it again. He broke another story on Friday when reporting that Jason Varitek had "reached a two-year agreement with the Red Sox."
In typical Heyman fashion, he wanted to make sure that everyone knew that "SI.com was the first to report that Varitek had an agreement with Boston." To that, I say "big deal." OK, maybe I didn't use the word "deal." I mean, this doesn't go down as some sort of exclusive or investigative reporting.
While the signing won't be officially announced until Varitek completes his physical, the Red Sox had placed a Friday deadline on an official proposal that was delivered via registered mail to him and agent Scott Boras on January 23. In other words, it was no secret that something was going to happen that day. Either Varitek was going to accept or reject Boston's offer.
If you're wondering how Heyman got wind of the news before any of the Boston beat writers or columnists, be aware that he had Mark Teixeira going to the Yankees before anyone else and, according to his biography, also "broke the story of Barry Bonds going to the Giants in 1992...Alex Rodriguez going to the Yankees in 2004, A-Rod opting out of his $252-million contract in 2007 and Manny Ramirez going to the Dodgers in 2008."
Varitek. Teixeira. Manny. A-Rod 2x. Bonds, vintage 1992. Do you notice anything in common? Yes, all of these players are or were represented by Boras at the time of their signings. It is plainly obvious that Heyman, known among fellow writers as scottboras.com, is getting fed such stories by Scott himself, which is fine and dandy except there is more going on here than meets the eye.
You see, Boras throws Heyman a bone on a Tek or Tex signing but also uses him to spread rumors about the level of interest and terms in ongoing free agent negotiations to create a false sense of demand. Teams that fall for this trick wind up competing against themselves, which is exactly what Boras desires.
While Boras is no fool, Heyman is a tool for the Scott Boras Corporation. Boras knows how to game the system to get the best deals for his clients and will gladly use Heyman as long as the latter plays along or until the market realizes what is going on. As it stands now, it's almost as if Heyman, who is no stranger to the Boras suites during the winter meetings, is on the SBC payroll.
You can see these shenanigans at work in Heyman's recent stories about a few other Boras clients, including Joe Crede, Oliver Perez, and Derek Lowe. But these are relatively innocent in comparison to following the Boras, Heyman & Co. saga as it relates to Manny.
D'oh!
Heyman not only is a mouthpiece for Boras but is wrong more often than he is right. Look, if you throw enough mud against the wall, some of it is bound to stick. That doesn't make you a soothsayer or the next Carl Bernstein or Bob Woodward.
The remaining stories are presented without comment as to let you be the judge (although I took the liberty to add emphasis for ease of reading).
While folks were understandably upset over Ramirez's terrible behavior leading up to the trade, no one could reasonably expect MLB to actually tie Ramirez's childish antics to Boras. Ramirez's lay-down behavior was so outrageous that MLB should indeed investigate him. But there's no belief from anyone credible that they'll find anything, certainly nothing against Boras. The reality is that Ramirez behaved beautifully for half a season under Boras, then became irritated over the club options that could tie him to Boston for two more years. But let's not forget that Ramirez's behavior had been erratic throughout his eight years in Boston, including long before he hired Boras, and Red Sox people have covered up a lot of it in the past. Is it possible that Boras mentioned to him that the club options in his Red Sox contract were not a good thing? It is. Will Boras benefit from the options being dropped? Presumably he will, assuming the erratic Ramirez stays with Boras for the signing of his next contract. But the real question is: Would Boras risk his seemingly excellent relationship with the Red Sox and overall reputation to orchestrate Ramirez's ridiculous behavior? According to one GM, it's just the opposite, that perhaps no agent is better than Boras at dealing with off-field issues of players. Anyway, the orchestration idea is farfetched and nothing more than misguided media musings advanced in some cases by sworn Boras enemies.
It's impossible to calculate the true worth of Manny. Though, I'm quite sure his agent Scott Boras will have an idea or two about that while shopping the good Manny around this winter.
Ramirez is believed to be seeking a six-year deal for as much as $25 million per year . . . Ramirez's agent, Scott Boras, declined to name a target price in an interview with SI.com on Wednesday. That $150 million total price tag is an estimate based on Boras' use of the word "iconic'' to describe the 36-year-old Ramirez, combined with Ramirez's own constant mention of a "six-year deal'' during frequent media interviews this postseason."He pays for himself. You've got a free player with Manny,'' Boras said. "He's an iconic player who's changed the face and fortunes of the franchise.''
The Manny Derby surely will be limited by the stratospheric price, but at least three teams are emerging as potential suitors. The Yankees' will "take a look at Manny,'' according to someone familiar with their thinking, the Mets are said to be weighing a run despite deep pitching needs, and the pitching-strong Blue Jays are also believed to be considering a run. While it's hard to imagine Ramirez embracing New York after complaining for 7 1/2 years about Boston's fishbowl existence, the Yankees and Mets have an inherent financial advantage over L.A. in owning their own TV networks (McCourt, meanwhile, is said to have a poor relationship with Fox) and introducing new stadiums. It shouldn't be forgotten that Ramirez followed the money when he took $160 million over eight years from Boston before the 2001 season.
The Orioles are another team that has been suggested as a possible landing spot, but they are more than one player away from competing in the ultra-tough AL East. Besides, new baseball chief Andy MacPhail appears to be getting away from the big-ticket buys of the Orioles past, and if they do go for a major free agent, it's more likely to be Severna Park, Md., native and Angels star Mark Teixeira. The Angels make some sense for Ramirez, but are more likely to try to keep the much younger Teixeira, whom they love.
Indeed, the pressure to retain Ramirez at almost any price in [sic] intense. As one friend of Manny's put it, "There's going to be a deep depression inside and outside the clubhouse -- among the manager, players, fans, everyone -- if Ramirez leaves.''
"I don't know how [McCourt] doesn't bring him back. It's got to be as much a business decision as a baseball decision. He's got the Dodgers by the ....'' another AL executive said.
That same executive predicted a deal for either three years plus an option or four years for $20 to $25 million annually, which would represent a major windfall from the two $20 million option years Ramirez found so onerous before working hard to get those club options dropped from his just-expired contract.
The Dodgers' early interest in keeping Ramirez to a short (but rich) deal -- first reported by SI.com on Wednesday -- might explain Ramirez's rhetoric following the season in which he professed no special interest in staying in L.A., and candidly added that his only goal was in going to the highest bidder, especially one who'd like to give him a six-year deal. Perhaps by then Manny knew of L.A.'s intentions. In any case, the Manny Derby appears as to have opened up a tad. Though while Philly, the Jays and some others might make for an interesting alternative, it's still entirely possible that the battle for Manny and the other two mega-stars comes down to a competition between the two biggest markets -- New York and Los Angeles.The Dodgers' intention to try to keep Ramirez to a short-term deal -- they're expected to make an initial offer of a two-year contract for about $55 million, perhaps a little bit more, as reported on SI.com Wednesday -- could leave an opening for one of a few other teams to try for Ramirez. And one of those clubs could be the Phillies, who would lock down baseball's best lineup by adding Manny to a batting order that already includes two MVPs.
The field may be somewhat limited for a 36-year-old player seeking a six-year deal for $25 million per, but potential Ramirez suitors include the Mets, Yankees, Blue Jays and Orioles in addition to the Phillies, who may have two things going for them: 1) Manager Charlie Manuel was Ramirez's hitting coach in Cleveland, not that Manny ever needed a hitting coach, and 2) Stiff and streaky left fielder Pat Burrell, who is behind Manny in terms of defense and personality (not to mention hitting, of course), is also a free agent.
Meanwhile, Manny Ramirez should soon expect to receive a shorter offer at close to a record annual salary from the incumbent Dodgers, perhaps a two-year deal for near the $27.5-million Yankees salary of Alex Rodriguez, as SI.com reported several days ago.Ramirez. He's not going to like the Dodgers' short-term bid and will play the field. The Yankees, Mets, Blue Jays and Phillies are among those expected to check in. My call: Dodgers, three years, $75 million.
One reason the Dodgers haven't yet made their official offer for superstar free-agent outfielder Manny Ramirez is that his agent, Scott Boras, apparently isn't fielding offers that aren't in the ballpark of the five or six years that Manny wants.As SI.com reported two weeks ago, the Dodgers intended to offer Ramirez a short-term deal at a high annual salary, perhaps $55-$60 million for two years. (Dodgers GM Ned Colletti confirmed their interest in a shorter deal here the other day and also expressed his belief that they any possible deal would take time.)
But Boras pointed out that he and Colletti negotiated a five-year deal for Barry Bonds back in 2001 when Colletti was the Giants' assistant GM, when Bonds was 37 years old (Ramirez is 36). Ramirez has said publicly that he wants a six-year deal (but probably would take five, or perhaps four) after hitting .396 with 17 home runs and 53 RBIs for the Dodgers. It apepars [sic] that if the Dodgers don't change their stance, the Yankees and others (the Phillies and Blue Jays are possibly interested) may battle for Ramirez without them.
Dodgers general manager Ned Colletti met with agent Scott Boras on Tuesday night and made an offer for Manny Ramirez. Colletti revealed in a meeting with reporters Wednesday that the offer would be the "second-highest average annual value in baseball."While the Dodgers' proposal for Ramirez calls for a high annual salary, the issue appears to be the number of years. The Dodgers' offer is believed to be a two-year deal in the neighborhood of $50 million.
The sides are so far apart that the Blue Jays, Orioles and perhaps the Yankees and other teams likely have moved ahead of the Dodgers in terms of their chances to win the services of the mercurial superstar.
Manny Ramirez still could have one chance to come home. While the Mets have all but decided they will not pursue the slugging savant from Washington Heights, in Upper Manhattan, the Yankees clearly have not ruled out a run at Ramirez.The other obvious possibility for Ramirez would appear to be the Angels, whose owner, Arte Moreno, has said publicly that they may turn to Ramirez if they can't sign Teixeira, their top target. Besides the obvious advantage of adding one of the greatest righthanded hitters of alltime, if the Angels sign Manny, they'd be tweaking the crosstown Dodgers. The same could be said if the Yankees sign Ramirez. Only they'd be tweaking the Red Sox.
There are those suggesting the Yankees are only in the running for Teixeira to either monitor the rival Red Sox or drive up the price for the switch-hitting slugger. But while it's true the Yankees don't appear as eager to sign Teixeira as the Angels and Red Sox, they do appear willing to sign him at the right price. After already signing CC Sabathia and A.J. Burnett for $243.5 million combined, the Yankees appear disinclined to offer $200 million for Teixeira, which is what it may take to get him.
He seeks a deal for at least five years, and while that seems like a tall order for the 36-year-old star, even after hitting .396 with 17 home runs and 53 RBIs in 53 games in Los Angeles, four years could be a possibility.The Dodgers, who have multiple infield needs (shortstop and third base) and could use a starting pitcher as well, remain interested in Ramirez and can resume negotiating with him if they choose to do so.
He is also a strong fallback option for two teams that are pursuing star free agent first baseman Mark Teixeira -- the Angels and Yankees. As a matter of fact, if the Yankees aren't able to convince CC Sabathia to come to New York, the Yankees may pursue both Ramirez and Teixeira.
Yankees co-owner Hank Steinbrenner is said by people close to him to want Manny Ramirez in pinstripes. Unlike his father, who dreaded dreadlocks, Steinbrenner the junior is said by a Yankees person "not to give a (hoot) about his hair.'' . . . the Yankees are mulling a run at Ramirez. The Dodgers have been pursuing Ramirez, and if the Angels miss out on Teixeira, they might join the Manny fray as well.
Teixeira, though, has said he intends to try to do a deal by Christmas, which means Manny's market should take off thereafter.At least two potential losers in the five-team Teixeira Sweepstakes are likely to pursue Ramirez (Yankees and Angels), and perhaps a third (Nationals) would, too. The incumbent Dodgers remain interested. All of which should cheer Manny's spirit if he's just a little more patient.
Manny Ramirez, OF. The Dodgers remain the favorite to keep Ramirez, but the rival Giants loom as a major threat. L.A. wants to keep it to two years but eventually gave in on a third year for Rafael Furcal, and will probably have to do the same with the man who saved the franchise last season. All along, San Francisco has said it might take a stab at one of the "big three'' (and the other two, Sabathia and Teixeira, are gone already), so it stands to reason that they're in for Ramirez, the perfect antidote for their moribund offense. The Angels say they're out, but he'll still be tempting for them as well. Then there's always that so-called mystery team to contend with.
The Giants have entered the bidding for free-agent superstar Manny Ramirez, SI.com has confirmed.KPIX-TV reported Friday that the Giants have made a three-year offer with an option for a fourth year.
The Dodgers remain interested in Ramirez, and a bidding contest between the two great West Coast rivals could loom. The Dodgers originally offered the slugging savant $45 million over two years, but later withdrew that offer. They will have to do better than that to have chance to retain his services.
While the Angels have suggested publicly that they won't be bidding for Ramirez, some baseball people aren't writing them off. There also appears to be one or two other American League teams on the periphery of the bidding. The Yankees, after signing Mark Teixeira to an eight-year, $180-million contract, are not among them.
The Texas Rangers, who are capable of bold moves and would like to replace Milton Bradley's offense, are considering a pursuit of superstar free agent Manny Ramirez.The Rangers have been quiet this winter -- their big move has been signing reliever Derrick Turnbow -- but are looking at a number of ways to improve. Owner Tom Hicks has shown a willingness to make big signings in the past (Alex Rodriguez for $252 million is the prime example), and the Rangers were the one team who showed interest in Ramirez five winters ago when the Red Sox were shopping him (discussing a Ramirez for A-Rod deal at the time). With the Rangers about to lose the free agent Bradley, who was one of the best offensive players in the game last year (.999 OPS) to free agency, their interest in Ramirez has increased.
Ramirez is said to be working out in Pensacola, Fla., a few hours north of where he makes his winter home in Miami -- and patiently (yes, that's the word a friend of his used) waiting for a job. The Dodgers and Giants still look like the most logical landing spots, with L.A. still seen as the favorite. The Angels and Mets are still showing no signs of joining the fray, and Yankees partner Hal Steinbrenner is thought to be against signing Ramirez, so it's still possible it'll come down to a battle of West Coast rivals.One final push from Hall-of-Fame manager Joe Torre could do the trick. Torre just returned from vacation in New Zealand and could certainly stump for Manny. Eventually, the guess here is that the Dodgers get to three years.
While the Dodgers have held to their two-year, $45 million offer for Manny Ramirez, the star slugger is still seeking a deal of at least twice that in length.Word is, Ramirez has told the Dodgers that he wants a deal for four or five years, and it's believed that he's looking to be paid in the range of $25 million a year. Going by those numbers, and assuming Ramirez would take a four-year contract, the sides appear to be at least $55 million apart.
No surprise, this could take a while. One executive whose team is interested in Ramirez said that he believes the Dodgers and Ramirez are no further along than the "fourth inning'' of the negotiations.
The Dodgers and Giants are currently seen as the two most active pursuers of Ramirez. The Dodgers have been viewed as the favorite to land the slugger who helped turn their season around last year, but the Giants are showing signs of serious interest, as well.
1. Manny Ramirez. The Man-child and the Dodgers appear to be in a stalemate, with the team holding at $45 million for two years and Ramirez wanting a deal for four or five years for between $25 million and $30 million per. The Giants, who are in excellent financial position, look like the biggest threat; although at least publicly they're saying they won't go crazy for Manny after diving into the market early. San Francisco already signed Edgar Renteria, Randy Johnson, Bobby Howry and Jerremy Affeldt, a commitment of more than $20 million for 2009, but if they don't get Ramirez the question has to be asked: Wouldn't that $20 million-plus have been better spent on Manny? The Angels and Mets say publicly that they won't go for Manny, while the Yankees already have upgraded their offense immensely with Mark Teixeira. So until further notice the two great West Coast rivals look like the favorites.
Now, if I can just convince Boras that Blyleven is worthy of the Hall of Fame...
***
Correction: Dennis Gilbert was Barry Bonds' agent in 1992, not Scott Boras.