Rich Lederer • Baseball Beat
Patrick Sullivan • Change-Up
Jeremy Greenhouse • Touching Bases
Dave Allen • F/X Visualizations
Sky Andrecheck • Behind the Scoreboard
Marc Hulet • Around the Minors
Al Doyle • Past Times
Retired Uniforms:
Bryan Smith • WTNY
Joe Sheehan • Command Post
Jeff Albert • The Batter's Eye
RSS Feed
Home
*Examining the Past, Present, and Future*
Lineup Card
Recent Entries
» Putting Together a Reality Team
» Historical Hall of Fame Vote Comparisons: 2012
» An All-Christmas Team
» The New-Look Angels
» John Denny: The Forgotten Cy Young Award Winner
» Money Isn't Everything
» What Would It Take to Hit .400 in the 21st Century?
» Halos Heaven
» Brandon McCarthy's Breakout Season
» Link-o-Rama
» Historical Hall of Fame Vote Comparisons: 2012
» An All-Christmas Team
» The New-Look Angels
» John Denny: The Forgotten Cy Young Award Winner
» Money Isn't Everything
» What Would It Take to Hit .400 in the 21st Century?
» Halos Heaven
» Brandon McCarthy's Breakout Season
» Link-o-Rama
Best of Baseball Beat
Abstracts From the Abstracts
1977 Baseball Abstract
1978 Baseball Abstract
1979 Baseball Abstract
1980 Baseball Abstract
1981 Baseball Abstract
1982 Baseball Abstract
1983 Baseball Abstract
1984 Baseball Abstract
1985 Baseball Abstract
1986 Baseball Abstract
1987 Baseball Abstract
1988 Baseball Abstract
1978 Baseball Abstract
1979 Baseball Abstract
1980 Baseball Abstract
1981 Baseball Abstract
1982 Baseball Abstract
1983 Baseball Abstract
1984 Baseball Abstract
1985 Baseball Abstract
1986 Baseball Abstract
1987 Baseball Abstract
1988 Baseball Abstract
Bert Blyleven Series
Meeting Up and Hanging Out with Bert
The Results Are In And...
Aficionado Heavily Invested in Blyleven
Latest on Blyleven's Chances for the HOF
The Internet Zealot Responds
400 Down and 5 to Go...
Bert Be Home By Eleven?
Blyleven's Forgotten Season (1973)
HeyMan, Your Comments Don't Hold Water
The Waiting is the Hardest Part
Another Addition to the Blyleven Series
Search for the Truth
As Dominant as His HOF Contemporaries
Listen, Buster
A Larger Step for Blyleven
Answering the Naysayers (Part Two)
Another Small Step for Blyleven
Q&A: Blyleven on the Twins
The Majority Rules, Right?
It's All Dutch to Some
The Hall of Fame Case for Bert Blyleven
Q&A: Blyleven on Felix Hernandez
Clemens Rocketing Up Charts
Poz: An Interview With a KC Star
A HOF Chat with Tracy Ringolsby
Up Close and Personal
A Peek Into the Mind of a HOF Voter
Answering the Naysayers
It's That Time of the Year (Again)
"If Cooperstown is Calling..."
The Bert Alert
One Small Step for Blyleven...
Only the Lonely
Exclusive Interviews
Lee Sinins
Alex Belth
David Pinto
Will Carroll
Mike Carminati
Aaron Gleeman
Joe Sheehan
Jay Jaffe
Jeff Peek
Tracy Ringolsby
Joe Posnanski
Bill James Part I, II, III
Jon Lalonde
Chuck Tiffany
Dayn Perry
Fay Vincent
Nate Silver
Alex Belth
David Pinto
Will Carroll
Mike Carminati
Aaron Gleeman
Joe Sheehan
Jay Jaffe
Jeff Peek
Tracy Ringolsby
Joe Posnanski
Bill James Part I, II, III
Jon Lalonde
Chuck Tiffany
Dayn Perry
Fay Vincent
Nate Silver
Bullpen
Rich Lederer
The Odd Couple (with Alex Belth)
The MostUnder Over Underrated Player in Baseball (with Brian Gunn)
Three Wise Men (roundtable by Alex Belth)
Infrequently Asked Questions (interview with Matt Welch)
Interview (Orioles Think Tank)
Bernie and the Yanks (Bronx Banter)
Hope and Faith: How the LAA Win the World Series (Baseball Prospectus)
NL West (The Soul of Baseball)
Greatest Living Hitter? (Sports Illustrated)
Roundtable: 2008 HOF Ballot (Armchair GM)
The Most
Three Wise Men (roundtable by Alex Belth)
Infrequently Asked Questions (interview with Matt Welch)
Interview (Orioles Think Tank)
Bernie and the Yanks (Bronx Banter)
Hope and Faith: How the LAA Win the World Series (Baseball Prospectus)
NL West (The Soul of Baseball)
Greatest Living Hitter? (Sports Illustrated)
Roundtable: 2008 HOF Ballot (Armchair GM)
Patrick Sullivan
Designated Hitters
David Bromberg (Q&A: John Denny)
Mark Armour (H. Killebrew and Versatility)
Joe Lederer (Soundtrack of a Prospect)
David Bromberg (Clemente's Autograph)
David Bromberg (Woody Fryman)
D. Baumstein (WAR Against Age: Pitchers)
Doug Baumstein (The WAR Against Age)
Doug Baumstein (A Lifetime on the Road)
John Fraser (Pick Six)
Mark Armour (How to Score More Runs?)
Bill Parker (What Opening Day Tells Us)
Stan Opdyke (Pat Rispole)
Chris Jaffe (Evaluating Baseball's Mgrs)
Stan Opdyke (Baseball Radio in NYC, 1953)
A. Nathan (Performance of Baseball Bats)
Michael Weddell (Edgar Martinez/HOF)
Jon Weisman (100 Things Dodgers Fans...)
Stan Opdyke (Connie Mack and Vin Scully)
Eric Walker (Evaluating Run Production)
Brent Mayne (The Intangibles of Catching)
Chris Moore (Best Fastballs in Baseball)
Dave Baldwin (The Batter’s Brain)
Shawn Haviland (Ivy League to MLB)
Larry Granillo (Walking Off)
Rob Iracane (Solo HR Won't Break You)
Tommy Bennett (Charm of AM Radio)
Harry Pavlidis (Johan Santana's Fast Start)
John Walsh (WAR and Remembrance)
Eric Walker (Precisely Inaccurate)
Bob Timmermann (As They See 'Em)
Geoff Young (Unicycles and Delusions)
Baseball Analysis at Tufts (Groundballers)
Baseball Analysis at Tufts (GB Out Rates)
G. Rybarczyk ('09 Hit Tracker Projections)
Joe Lederer (Curt Schilling/HoF)
Conor Gallagher (Hall of Fallacies)
Chris Green (Jim Rice, HoF, the Numbers)
Shawn Hoffman (Baseball's Bear Mkt?)
Paul Anthony (Manny Syndrome)
Ross Roley (World Series Odds)
B. Timmermann (Catcher's Interference)
R.J. Anderson (Waiting the Hardest Part)
Maury Brown (Cubs, MLB, and Cuban...)
Myron Logan (Dee-Fense, Dee-Fense)
Craig Calcaterra (Frivolity, Part I, Part II)
Chad Finn (Ode to Baseball Cards)
David Cameron (Mariners Foibles)
Chris Dial (Chipper Jones)
Pat Lederer (Memory Lane)
David Appelman (Clutch Pitching)
Bob Rittner (DH)
Jonathan Mayo (Roger Clemens)
Lisa Winston (My Son-in-Law...)
Russ McQueen (The Yellow Hammer)
Bob Rittner (I'm OK, You're OK)
Mark Armour (In Defense of the HOF)
Pat Jordan (Friends)
Dan Levitt (Analysis of Terry Ryan)
Doug Baumstein (Trading Econ 101)
Ross Roley (Runner's Reluctance II)
Ross Roley (Runner's Reluctance I)
Mark Armour (No-Longer Lovable Sox)
Bruce Regal (Stealthy and Wise)
Brian Gunn (Roid Monster)
Current/McEvoy (Value of the SB)
John Rickert (Sinister Thefts)
Nate Silver (Sabermetrics)
David Vincent (Home Run Production)
Joe P. Sheehan (Enhanced Gameday II)
Mark Armour (An Ode to Sport)
David Gassko (All-Time Worm Burners)
Joe P. Sheehan (Enhanced Gameday)
John Walsh (When Titans Clash)
Fox/Williams (Quantifying Coaches II)
Fox/Williams (Quantifying Coaches I)
Jacob Luft (Bull Durham Rant)
Chad Finn (Strat-O-Matic)
Lisa Winston (Rotisserie Baseball)
Dave Studeman (Baseball Stats)
Steve Treder (Roger Craig)
Marc Normandin (Jeff Bagwell)
D. Appelman (Expanding Strike Zone)
Jeff Sackmann (Worst MiL Defenders)
Jeff Sackmann (Best MiL Defenders)
Maxwell Kates (Van Lingle Mungo)
David Appelman (Pitch Location)
Kent Bonham (Danny Ray Herrera)
Glenn Stout (Two Baseball Poems)
Bruce Regal (The Challenge Round)
Mark Lamster (Barry & Ty)
Geoff Young (NL West)
Tom Lederer (The Ryan Express)
Brian Erts (Great Leap Forward)
David Pinto (Parity and the N.L.)
Jacob Luft (Fathers and Daughters)
Jamey Newberg (Pete's Sake)
Jeff Albert (A. Jones Swing Analysis)
Jeff Albert (A-Rod Swing Analysis)
Keith Law (Death, Taxes, and Waivers)
Peter Abraham (Tales of Torre Tales)
Larry Borowsky (Let 'er Rip II)
Dan Levitt (Empirical Analysis of Bunting)
Jonah Keri (If I Met Warren Cromartie...)
Bob Klapisch (War Stories)
Bob Timmermann (John F. Kennedy HS)
Kent Bonham (Aluminum Adjustments)
Al Doyle (More Than Superstars)
Ross Roley (Instant Replay)
David Vincent (Barry Bonds Homers)
Chad Finn (Our Favorite Obscurities)
Bill Deane (1979 NL MVP)
Mark Armour (Rise/Fall of Artificial Turf)
Jeff Angus (Wally Moon Camp)
David Berri (Money and Baseball)
Larry Borowsky (Baseball w/o the #s)
Derek Zumsteg (The Irrational Market)
David Regan (Free Agent Contracts)
Peter Schmuck (Steroids and the HOF)
David Appelman (Pitchers, Pitch by Pitch)
Dan Fox (Swinging, Taking, Fouling, Etc)
Patrick Sullivan (Study of NYY CF/BOS LF)
Will Leitch (Baseball Journalism)
Jeff Sullivan (Pitcher Release Points)
Steve Treder ('69-'70 Giants)
Maury Brown (Charlie Finley)
John Brattain (Bob Johnson)
Bob Klapisch (The Case for Bert Blyleven)
Jeff Peek (Pride and Prejudice)
Dayn Perry (Bert and Warren)
Rob Neyer (If Don Sutton Was Great...)
Lisa Winston (Minor League Memories)
Alex Belth (Otis Redding Was Right)
David Cameron (Long Live the King)
Jeff Angus (Baserunning Study)
Bert Blyleven (Baseball Playoffs)
Boyd Nation (Not a Prospect List)
James Click (Batters-Baserunners Study)
Jeff Shaw (Why I Love Baseball)
David Gassko (BIP/BFP Fielding Study)
Jay Jaffe (Milwaukee Sausage Race)
Jamey Newberg (Remember When)
Bob Klapisch (Press Box to the Mound)
Dan Levitt (Predictive Value of BB)
David Vincent (Official Scorer)
Jon Weisman (Rick Monday)
Larry Borowsky (Let 'er Rip)
Will Carroll (Fictional Short Story)
Bob Timmermann (Japanese Baseball)
Cyril Morong (Best Pitching Seasons)
Sean Forman (Monte Carlo Win-Loss)
Brian Gunn (My Little Blue Book)
Joe Lederer (My Dad and Baseball)
Bill Deane (Bob Gibson, 1968)
Mark Armour (1977 Yankees)
Darren Viola (Retrosheet)
David Pinto (RFK)
Dayn Perry (Brave Heart)
Matt Welch (Dave Hansen)
Kevin Kernan (Jack McKeon)
Tom Lederer (Dodgers Road Trip)
Steve Lombardi (Slider)
Studes (Picturing Baseball)
Mike Carminati (Luck of the Drawl)
Eric Neel (Vin Scully)
J.C. Bradbury (Leo Mazzone)
John Sickels (Bill James)
Search Baseball Analysts
Archives
By Category:
Around the Majors Content Only
Around the Minors Content Only
Baseball Beat Content Only
Baseball Beat/Change-Up Content Only
Baseball Beat/WTNY Content Only
Behind the Scoreboard Content Only
Change-Up Content Only
Change-Up/Around the Majors Content Only
Command Post Content Only
Crunching the Numbers Content Only
Designated Hitter Content Only
F/X Visualizations Content Only
Past Times Content Only
Saber Talk Content Only
The Batter's Eye Content Only
Touching Bases Content Only
Weekend Blog Content Only
WTNY Content Only
By Month:
February 2012
January 2012
December 2011
October 2011
September 2011
August 2011
July 2011
June 2011
May 2011
April 2011
March 2011
February 2011
January 2011
December 2010
November 2010
October 2010
September 2010
August 2010
July 2010
June 2010
May 2010
April 2010
March 2010
February 2010
January 2010
December 2009
November 2009
October 2009
September 2009
August 2009
July 2009
June 2009
May 2009
April 2009
March 2009
February 2009
January 2009
December 2008
November 2008
October 2008
September 2008
August 2008
July 2008
June 2008
May 2008
April 2008
March 2008
February 2008
January 2008
December 2007
November 2007
October 2007
September 2007
August 2007
July 2007
June 2007
May 2007
April 2007
March 2007
February 2007
January 2007
December 2006
November 2006
October 2006
September 2006
August 2006
July 2006
June 2006
May 2006
April 2006
March 2006
February 2006
January 2006
December 2005
November 2005
October 2005
September 2005
August 2005
July 2005
June 2005
May 2005
April 2005
March 2005
February 2005
January 2005
December 2004
November 2004
October 2004
September 2004
August 2004
July 2004
June 2004
May 2004
April 2004
March 2004
February 2004
January 2004
December 2003
November 2003
October 2003
September 2003
August 2003
July 2003
June 2003
Reference
Organizational Stats
Arizona Diamondbacks Bat / Pitch
Atlanta Braves Bat / Pitch
Baltimore Orioles Bat / Pitch
Boston Red Sox Bat / Pitch
Chicago Cubs Bat / Pitch
Chicago White Sox Bat / Pitch
Cincinnati Reds Bat / Pitch
Cleveland Indians Bat / Pitch
Colorado Rockies Bat / Pitch
Detroit Tigers Bat / Pitch
Florida Marlins Bat / Pitch
Houston Astros Bat / Pitch
Kansas City Royals Bat / Pitch
Los Angeles Angels Bat / Pitch
Los Angeles Dodgers Bat / Pitch
Milwaukee Brewers Bat / Pitch
Minnesota Twins Bat / Pitch
New York Mets Bat / Pitch
New York Yankees Bat / Pitch
Oakland Athletics Bat / Pitch
Philadelphia Phillies Bat / Pitch
Pittsburgh Pirates Bat / Pitch
St. Louis Cardinals Bat / Pitch
San Diego Padres Bat / Pitch
San Francisco Giants Bat / Pitch
Seattle Mariners Bat / Pitch
Tampa Bay Devil Rays Bat / Pitch
Texas Rangers Bat / Pitch
Toronto Blue Jays Bat / Pitch
Washington Nationals Bat / Pitch
All-Star Links
Official Websites
News and Notes
Baseball News Blog
Baseball Newstand
ESPN Baseball
Fox Sports Baseball
Pro Sports Daily
Roto World
The Roto Times
USA Today Baseball
Baseball Newstand
ESPN Baseball
Fox Sports Baseball
Pro Sports Daily
Roto World
The Roto Times
USA Today Baseball
Reference and Analysis
Baseball Almanac
Baseball America
Baseball Archive
Baseball Contracts
Baseball Cube
Baseball Graphs
Baseball Library
Baseball Musings Player Database
Baseball Page
Baseball Primer
Baseball Prospectus
Baseball Reference
Baseball Statistics
Baseball Truth
Boxscore Central
Diamond Mind Baseball
Doug's Stats
FanGraphs
Fast Balls (pitchfx catalog)
Hardball Dollars
Hardball Times
Hit Tracker
Retrosheet
Rotobase/Rotoblog
Stat Corner
STATS
Tango on Baseball
Yahoo Sports MLB
Web Gems
Bill James Primer
Sabermetric Manifesto (Grabiner)
Pitching and Defense (McCracken)
Pitching and Defense (Tippett)
Transactions Primer (Neyer)
Baseball Stats (Batter's Box)
Prospect Report (Cameron)
Pitcher Workloads (Sheehan)
Goodbye to Old Baseball Ideas (Rickey)
Sabermetric Manifesto (Grabiner)
Pitching and Defense (McCracken)
Pitching and Defense (Tippett)
Transactions Primer (Neyer)
Baseball Stats (Batter's Box)
Prospect Report (Cameron)
Pitcher Workloads (Sheehan)
Goodbye to Old Baseball Ideas (Rickey)
Columnists
Baseball Blogs
Around the Majors
Athletics Nation
Baseball Crank
Baseball Musings
Baseball-Reference Blog
Batter's Box
Big League Stew
Bronx Banter
Catfish Stew
Cub Town
Dan Agonistes
Dodger Thoughts
DRays Bay
Ducksnorts
Futility Infielder
Halos Heaven
Inside the Rockies
It Might Be Dangerous
Knuckle Curve
LoHud Yankees Blog
Lookout Landing
Management by Baseball
Metaforian
Metsgeek
Mike's Baseball Rants
Only Baseball Matters
Redbird Nation
Red Reporter
Sabernomics (Braves)
Seth Speaks
ShysterBall
6-4-2 (Angels/Dodgers)
The Book
TheCubdom
The Cutting Edge
The House That Dewey Built
The View From The Bleachers
Tiger Blog
U.S.S. Mariner
Viva El Birdos
Where's Kernan
Minor Leagues
Arizona Fall League
BA Player Finder
Cal Leaguers
Jamey Newberg
JDM's Scoresheet Baseball
Minor League Baseball
Minor League Park Factors
Minor League Splits
No Pepper
Sickels' Minor League Ball
Warm October Nights
BA Player Finder
Cal Leaguers
Jamey Newberg
JDM's Scoresheet Baseball
Minor League Baseball
Minor League Park Factors
Minor League Splits
No Pepper
Sickels' Minor League Ball
Warm October Nights
Amateur
Boyd's World (College)
Cape Cod Baseball League
College Baseball Blog
College Baseball Insider
Collegiate Baseball Newspaper
College Splits
College Splits Blog
Dirtbags Baseball (Long Beach State)
NCAA Baseball
NCBWA
Team One Baseball (High School)
Texas A&M & Baseball
Cape Cod Baseball League
College Baseball Blog
College Baseball Insider
Collegiate Baseball Newspaper
College Splits
College Splits Blog
Dirtbags Baseball (Long Beach State)
NCAA Baseball
NCBWA
Team One Baseball (High School)
Texas A&M & Baseball
Historical
Cuban Baseball
House of David
Jim "Mudcat" Grant's Web Page
Negro League Baseball Players Assoc
Negro Leagues Baseball Museum
1919 Black Sox
Pacific Coast League
Philadelphia Athletics Historical Society
Shoeless Joe Jackson Society
SABR-L Archives
Walter O'Malley
House of David
Jim "Mudcat" Grant's Web Page
Negro League Baseball Players Assoc
Negro Leagues Baseball Museum
1919 Black Sox
Pacific Coast League
Philadelphia Athletics Historical Society
Shoeless Joe Jackson Society
SABR-L Archives
Walter O'Malley
Miscellaneous
Forums
Credits
Ticket Center
Tickets to Baseball -
Premium Red Sox Tickets - Tickets to Marlins Games - Cardinals Game Tickets - NY Yankee Tickets - Tickets Oakland Athletics - Dallas Cowboys Tickets - Arizona Cardinals Tickets - Tickets Seattle Seahawks - Buffalo Bills Tickets Online - Tickets to Dolphins Football
Buy Boston Red Sox tickets,
Philadelphia Phillies tix,
NY Yankees tickets,
NY Mets tickets, and
MLB All Star game tickets at ABC tickets
Not sure where to find the best online sportsbooks? Start your search with PlayersJet.
Get deals at SportsMemorabilia.com on baseball apparel, including Phillies jerseys and more for adults and children.
Shop the largest selection baseball equipment on sale at Sports Unlimited. Check out tons of baseball gloves, youth baseball gloves and catchers gear from Rawlings, Wilson, Nike & Under Armour.
2011 Draft Order
Courtesy of Baseball America
First-Round:
 1. Pirates (57-105)
 2. Mariners (61-101)
 3. Diamondbacks (65-97)
 4. Orioles (66-96)
 5. Royals (67-95)
 6. Nationals (69-93)
 7. Diamondbacks (for B. Loux)
 8. Indians (69-93)
 9. Cubs (75-87)
10. Padres (for Karsten Whitson)
11. Astros (76-86)
12. Brewers (77-85)
13. Mets (79-83)
14. Marlins (80-82)
15. Brewers (for Dylan Covey)
16. Dodgers (80-82)
17. Angels (80-82)
18. Athletics (81-81)
19. Red Sox (from DET for Martinez)
20. Rockies (83-79)
21. Blue Jays (85-77)
22. Cardinals (86-76)
23. Nationals (from CWS for Dunn)
24. Rays (from BOS for Crawford)
25. Padres (90-72)
26. Red Sox (from TEX for Beltre)
27. Reds (91-71)
28. Braves (91-71)
29. Giants (92-70)
30. Twins (94-68)
31. Rays (from NYY for Soriano)
32. Rays (96-66)
33. Rangers (from PHI for Lee)
Supplemental First Round:
34. Nationals (Dunn)
35. Blue Jays (Downs)
36. Red Sox (Martinez)
37. Rangers (Lee)
38. Rays (Crawford)
39. Phillies (Werth)
40. Red Sox (Beltre)
41. Rays (Soriano)
42. Rays (Balfour)
43. Diamondbacks (LaRoche)
44. Mets (Feliciano)
45. Rockies (Dotel)
46. Blue Jays (Buck)
47. White Sox (Putz)
48. Padres (Garland)
49. Giants (Uribe)
50. Twins (Hudson)
51. Yankees (Vazquez)
52. Rays (Benoit)
53. Blue Jays (Olivo)
54. Padres (Torrealba)
55. Twins (Crain)
56. Rays (Choate)
57. Blue Jays (Gregg)
58. Padres (Correia)
59. Rays (Hawpe)
| Baseball Beat | August 31, 2009 |
Greinke Brings Back Memories of Blyleven's Forgotten Season in 1973
In his Monday Mendozas, Rob Neyer weighs in on Zack Greinke and the American League Cy Young Award on the heels of the 25-year-old righthander's back-to-back 15-strikeout and one-hit games last week.
• After yet another gem from Zack Greinke, Joe Posnanski tweeted thusly:"Greinke now leads the AL in ERA, ERA+, shutouts, complete games, WHIP, HRs/9 and second in strikeouts and Ks/BB. This isn't that hard."
I'm guessing that Joe is referring to the Cy Young Award, as in, "It isn't that hard to give the award for the best pitcher in the league to the best pitcher in the league." Except we've seen them give it to lots of guys who weren't the best pitcher in the league. Joe shouldn't tweet to us; he should e-mail all his fellow BBWAA voters.
[snip]
What I really want to know is this: Take those eight metrics that Joe mentioned: ERA, ERA+, shutouts, complete games, WHIP, home runs per nine innings, strikeouts, and strikeout-to-walk ratio. Actually, let's strip ERA+ and WHIP from the discussion because nobody was paying attention a few years ago ... Take the other six. How many pitchers have finished first or second in all six of them but failed to win a Cy Young Award? (I don't have any idea, but hope somebody can tell me.)
Well, Rob, while perhaps not quite Greinkesque, Bert Blyleven finished first in K/BB and SHO, second in ERA and SO, third in CG, and fourth in HR/9 in 1973, yet finished SEVENTH in the CYA voting. Blyleven was also first in ERA+ and second in WHIP. Despite a body of work that was similar to Greinke's this year, only one writer placed Blyleven on his ballot that season. Yes, you read that right. Only one writer voted for the guy who may have been "the best pitcher in the league." And that writer listed him third.
You see, on the same stats that are now being discussed to highlight Greinke's pitching prowess this season, Blyleven should have finished first in the CYA balloting in 1973.
Here is how Blyleven compared to the five starting pitchers who placed higher than him in the voting that season (John Hiller, a reliever, finished fourth):
| Palmer | Ryan | Hunter | Wood | Coburn | Blyleven | |
|---|---|---|---|---|---|---|
| ERA | 1st | 4th | >10th | >10th | 8th | 2nd |
| ERA+ | 2nd | 6th | >10th | >10th | 10th | 1st |
| SHO | 3rd | 4th | >10th | 4th | 4th | 1st |
| CG | 7th | 2nd | >10th | 6th | 5th | 3rd |
| WHIP | 4th | 8th | 3rd | >10th | 7th | 2nd |
| HR/9 | 5th | 6th | >10th | 10th | 9th | 4th |
| SO | 10th | 1st | >10th | 8th | >10th | 2nd |
| K/BB | >10th | 6th | >10th | 7th | >10th | 1st |
This comparison isn't meant to take anything away from Greinke, who has had a fantastic season. Instead, it just goes to show what a great year Blyleven had in 1973. But he never got his due back then (nor in several other campaigns), and the failure on the part of the writers to properly acknowledge Bert's accomplishments during his playing days has continued to haunt him a dozen years into his Hall of Fame candidacy.
The writers only have three years to go to finally get it right.
| Baseball Beat | August 31, 2009 |
Team of the Decade?
Tomorrow not only marks the last month of the current season but the final month of the decade (except, of course, for the postseason in October).
As we wind down the first ten years of the 21st century, which clubs have the best shot of being crowned the "Team of the Decade?" While looking at anything in terms of decades is heavily influenced by the start and stop dates, it can still be a fun exercise nonetheless.
Although there are, at most, only a handful of candidates that can lay claim to the Team of the Decade, there is no clear-cut winner at this time. Interestingly, six World Series champions during the decade of 2000-2009 are in line to make the playoffs this season. As a result, there are five teams that could win a second World Series title and a sixth team that could win its third world championship.
If the Red Sox (2004 and 2007) win a third World Series title this October, then there will be no debate as to the Team of the Decade. However, if the New York Yankees (2000) or St. Louis Cardinals (2006) win the championship this year, then it would be difficult not to anoint the Yanks or Cards as the Team of the Decade.
A case could possibly be made on behalf of the Anaheim/Los Angeles Angels (2002) should the current AL West leader capture its second World Series title of the decade. At best, the Angels' margin of victory would be ever so slim over the Red Sox if the Halos were to win it all this year.
Although the Philadelphia Phillies (2008) and Chicago White Sox (2005) could win a second championship this decade, it would be impossible for either club to leapfrog Boston for this honor as neither team would have as many wins or playoff appearances as the Red Sox.
Let's take a look at the pertinent facts involved in designating the Team of the Decade. We'll start off ranking clubs by wins (2009 totals through Sunday, August 30).
| Num | TEAM | 2009 | 2008 | 2007 | 2006 | 2005 | 2004 | 2003 | 2002 | 2001 | 2000 | TOTAL |
|---|---|---|---|---|---|---|---|---|---|---|---|---|
| 1 | NYY | 82 | 89 | 94 | 97 | 95 | 101 | 101 | 103 | 95 | 87 | 944 |
| 2 | BOS | 76 | 95 | 96 | 86 | 95 | 98 | 95 | 93 | 82 | 85 | 901 |
| 3 | STL | 77 | 86 | 78 | 83 | 100 | 105 | 85 | 97 | 93 | 95 | 899 |
| 4 | LAA | 77 | 100 | 94 | 89 | 95 | 92 | 78 | 99 | 75 | 82 | 881 |
| 5 | ATL | 68 | 72 | 84 | 79 | 90 | 96 | 101 | 101 | 88 | 95 | 874 |
| 6 | OAK | 57 | 75 | 76 | 93 | 88 | 91 | 96 | 103 | 102 | 91 | 872 |
| 7 | LAD | 78 | 84 | 82 | 88 | 71 | 93 | 85 | 92 | 86 | 86 | 845 |
| 8 | CWS | 64 | 89 | 72 | 90 | 99 | 83 | 86 | 81 | 83 | 95 | 842 |
| 9 | MIN | 65 | 88 | 79 | 96 | 83 | 91 | 90 | 94 | 85 | 69 | 840 |
| 10 | SF | 72 | 72 | 71 | 76 | 75 | 91 | 100 | 95 | 90 | 97 | 839 |
| 11 | PHI | 75 | 92 | 89 | 85 | 88 | 86 | 86 | 80 | 86 | 65 | 832 |
| 12 | SEA | 68 | 61 | 88 | 78 | 69 | 63 | 93 | 93 | 116 | 91 | 820 |
| 13 | HOU | 62 | 86 | 73 | 82 | 89 | 92 | 87 | 84 | 93 | 72 | 820 |
| 14 | CLE | 58 | 81 | 97 | 78 | 93 | 80 | 68 | 74 | 91 | 90 | 810 |
| 15 | NYM | 59 | 89 | 88 | 97 | 83 | 71 | 66 | 75 | 82 | 94 | 804 |
| 16 | ARI | 59 | 82 | 90 | 76 | 77 | 51 | 84 | 98 | 92 | 85 | 794 |
| 17 | FLA | 68 | 84 | 71 | 78 | 83 | 83 | 91 | 79 | 76 | 79 | 792 |
| 18 | CHC | 65 | 97 | 85 | 66 | 79 | 89 | 88 | 67 | 88 | 65 | 789 |
| 19 | TOR | 58 | 86 | 83 | 87 | 80 | 67 | 86 | 78 | 80 | 83 | 788 |
| 20 | TEX | 72 | 79 | 75 | 80 | 79 | 89 | 71 | 72 | 73 | 71 | 761 |
| 21 | COL | 72 | 74 | 90 | 76 | 67 | 68 | 74 | 73 | 73 | 82 | 749 |
| 22 | SD | 56 | 63 | 89 | 88 | 82 | 87 | 63 | 66 | 79 | 76 | 749 |
| 23 | CIN | 56 | 74 | 72 | 80 | 73 | 76 | 69 | 78 | 66 | 85 | 729 |
| 24 | MIL | 64 | 90 | 83 | 75 | 81 | 67 | 68 | 56 | 68 | 73 | 725 |
| 25 | DET | 69 | 74 | 88 | 95 | 71 | 72 | 43 | 55 | 66 | 79 | 712 |
| 26 | WAS | 46 | 59 | 73 | 71 | 81 | 67 | 83 | 83 | 68 | 67 | 698 |
| 27 | BAL | 54 | 68 | 69 | 70 | 74 | 78 | 71 | 67 | 63 | 74 | 688 |
| 28 | TB | 70 | 97 | 66 | 61 | 67 | 70 | 63 | 55 | 62 | 69 | 680 |
| 29 | PIT | 53 | 67 | 68 | 67 | 67 | 72 | 75 | 72 | 62 | 69 | 672 |
| 30 | KC | 50 | 75 | 69 | 62 | 56 | 58 | 83 | 62 | 65 | 77 | 657 |
As shown, the Yankees lead by a fairly sizable margin over their division rivals. The gap works out to an average of more than four wins per season. In addition, the Bronx Bombers are the only team with three 100-win seasons thus far and the lone club projected to reach triple digits in victories in 2009.
The Cardinals, Atlanta Braves, and Oakland A's have each had two 100-win seasons this decade. Each of the top six clubs have had five 90-win seasons. It's easy for fans with short memories to forget the Braves and A's but take a look at how successful they were from 2000 through 2005 (ATL) or 2006 (OAK).
The San Francisco Giants are the only other team to win 90 games in a single season five times. Of note, the Giants performed their feat five years in a row (2000-2004) but have not won more than 76 since then (although the club is on pace to win 89 this year).
For what it's worth, the Seattle Mariners started the decade on fire, winning at least 90 games in each of the first four years (with a MLB decade-high of 116 in 2001).
At the other end of the spectrum, check out the Kansas City Royals, Pittsburgh Pirates, and Baltimore Orioles. All three teams are fighting for the dubious honor of the "Worst Team of the Decade." None of these clubs have made the postseason and only the Royals have had a winning season (2003) during the opening decade of the century.
Next, we'll take a close look at the World Series, pennant, and division champs, as well as the wild card winners year-by-year.
| 2009 | 2008 | 2007 | 2006 | 2005 | 2004 | 2003 | 2002 | 2001 | 2000 | |
|---|---|---|---|---|---|---|---|---|---|---|
| WS CHAMP | PHI | BOS | STL | CWS | BOS | FLA | LAA | ARI | NYY | |
| LOSER | TB | COL | DET | HOU | STL | NYY | SF | NYY | NYM | |
| AL EAST | TB | BOS | NYY | NYY | NYY | NYY | NYY | NYY | NYY | |
| AL CENT | CWS | CLE | MIN | CWS | MIN | MIN | MIN | CLE | CWS | |
| AL WEST | LAA | LAA | OAK | LAA | LAA | OAK | OAK | SEA | OAK | |
| AL WILD | BOS | NYY | DET | BOS | BOS | BOS | LAA | OAK | SEA | |
| NL EAST | PHI | PHI | NYM | ATL | ATL | ATL | ATL | ATL | ATL | |
| NL CENT | CHC | CHC | STL | STL | STL | CHC | STL | HOU | STL | |
| NL WEST | LAD | ARI | SD | SD | LAD | SF | ARI | ARI | SF | |
| NL WILD | MIL | COL | LAD | HOU | HOU | FLA | SF | STL | NYM |
As discussed in the opening, the Red Sox are the only team to have captured two World Series titles thus far. The Yankees, Angels, White Sox, Cardinals, and Phillies (and possibly the Florida Marlins if they qualify for the postseason this year) could win a second championship as well.
NYY (3), BOS and STL (2 each) are the only clubs to appear in more than one World Series this decade. The Red Sox are 2-for-2 while the Yankees and Cardinals have each lost at least one World Series.
The Yankees have won seven division titles, the Braves have six, the Cardinals five, and the Angels, A's, and the Minnesota Twins four each. Boston's four wild cards rank first this decade.
All in all, the Yankees lead the majors with eight postseason appearances during the first nine years of the century. New York is followed by the Cardinals and Braves (6 each) and the Red Sox, Angels, and A's (5 each).
Here is a summary of the qualifications of the leading candidates to become the Team of the Decade.
If Los Angeles wins it all this year, the case for the Angels will be as follows:
- 2 World Series championships
- 2 pennants
- 3 LCS appearances
- 5 Division titles (including 2009)
If St. Louis wins it all this year, the case for the Cardinals will be:
- 2 World Series championships
- 3 pennants
- 6 LCS appearances
- 6 Division titles (including 2009)
- 2 World Series championships
- 4 pennants
- 5 LCS appearances
- 8 Division titles (including 2009)
- 3 World Series championships
- 3 pennants
- 5 LCS appearances
- 1 Division title
- 5 Wild Cards (including 2009)
Thanks to Brian Gunn for providing the inspiration to this piece.
| Change-Up | August 29, 2009 |
A Wednesday Night at Wrigley
 When I learned I would be arriving in Chicago on business earlier than originally planned Wednesday night, I decided to call the Cubs box office to pick up the best available single I could buy for that evening's game against the Washington Nationals. While my support for the Boston Red Sox will never waver, my wife comes from a long line of Cubs fans and I must admit that their devotion to the North Siders has rubbed off over the years. I like the Cubs. I like Wrigley Field. I like baseball. I managed a seat in the fifth row of section 115 (pictured terribly on the right).
When I arrived at the park about 30 minutes or so before the first pitch, a few things struck me. First, there was a nonstop procession of promotions; honorary batboys and batgirls and I swear to you there were four separate "first pitches". Interestingly it was Phillips Exeter grad Sam Fuld who somehow pulled promotion duty that evening. I couldn't tell if it was simply Sam's turn or if they just tell the 5'7" kid who went to Exeter and Stanford to go and make nice with the community. Whatever it was, Fuld was doing just about everything but preparing to play an actual baseball game leading up to the first pitch. Of course, he also wasn't in the lineup that night.
The other thing I noticed was a peculiar, unspoken game of one-upmanship in which Cubs fans try and evidence their love of the team by donning a $22 tee-shirt with some of the club's lesser known players' names on the back; the less heralded, the better. Ryan Theriot? I saw at least 25. Koyie Hill? You bet. Ryan Dempster? Everywhere. Tom Gorzelanny? Now on sale. I did not see one Milton Bradley tee shirt.
The clear fan favorite of the Chicago Cubs is Derrek Lee. The Cubs started to become what they are now - a veritable power brand in MLB - beginning in the 1998 season if you ask me. You could point to any number of players that will live on in peoples' memories as most representing this era of Cubs success (four playoff appearances in 11 seasons), but as time goes on and with steroid allegations tarnishing images as they seem to do, it just may be Lee that stands taller than the rest. Sure there's Sosa and Prior and Wood and Aramis and Zambrano, but Lee's steadiness, professionalism and off-the-charts awesome 2005 season position him a bit differently.
Maybe you're a Frank Chance kind of guy/gal but Lee has a fine argument as the best first baseman ever to wear a Cubs uniform. Looking back, it's a credit to my father-in-law's respect for his daughter's independence that he let me have her hand in marriage; in the Spring of 2004 I did after all argue to him that Hee Seop Choi would be better than Lee after they were traded for one another. I was adamant, too.
My scorecard pencil eraser saw work immediately. I had Nyjer Morgan leading off and playing center field, right where he was the previous night, right where he had been for the 48 other games he had played for the Washington Nationals in 2009. Willie Harris would take his position that night, however, as Morgan would miss the game with reported flu-like symptoms and then later be placed on the DL for the remainder of the year with a fractured hand. You can imagine my disappointment.
I love Fangraphs and think it's data is indispensable. But I am not one of these fans that takes their value lists at face. I am a skeptic, though would defer to it ahead of my own instinct most of the time if I had to make a call on a certain player. So back to Morgan. According to Fangraphs, he ranks 14th in total value this season amongst all Major League position players; better than Mark Teixeira, better than Troy Tulowitzki. I find this surprising but I do not necessarily doubt it. That's why I was so eager to see Morgan, a player whose value is so tied to his defense. What kind of jump does he get? I wanted to see how quickly and easily he could track down a surefire gap shot. But it wasn't to be.
The game itself was clean for seven innings or so. The Cubs managed two runs against Livan Hernandez and then another off of Jason Bergmann. Bradley had all three RBI for the Cubs through seven innings, two of which came after a long home run he pulled to right field off of Hernandez. As he made his way back to the Cubs dugout after crossing the plate, he opened and closed his hand repeatedly, the way one might if they were mocking someone for talking too much. He clearly has no use for the Chicago media or even the fans. As David Cameron notes, Bradley has not provided great value for the Cubs but he also has not been nearly as disastrous as, say, Alfonso Soriano.
Hernandez struck out the first two batters he faced and looked for all of Wrigley Field like he might have something special in him that night. Of course you would never know it from the radar gun. The velocity on at least ten of his pitches that I saw did not eclipse 66 miles per hour. But when his night was done he had given up just seven baserunners and two runs in six innings. He struck out six. For his part, Rich Harden was both dazzling and infuriating, struggling with command but blowing hitters away with his pure stuff. He pitched every bit as well as Hernandez, a back-handed compliment of sorts for a pitcher of Harden's ability ("hey, I went pitch for pitch with Livan Hernandez tonight, guys!").
Just as I was eager to witness Morgan's defensive prowess, I couldn't help but notice Adam Dunn's fielding ineptitude. It's something to behold. To lead off the eighth inning, Kosuke Fukudome hit a sharp ground ball no more than four feet to Dunn's right between the second baseman and where Dunn was playing, first base. He never moved. Later in the inning Dunn misplayed a Jeff Baker grounder that was charitably ruled a hit. The Cubs broke the game open, Dunn did not commit an error but he definitely cost his team two outs that at least 25 other Major League first baseman would have had no trouble at all handling. It was exhibit A for the inadequacy of traditional defensive statistics (errors, fielding percentage).
The Cubs would score six in the eighth, the Nats two in the ninth and the game would end up a 9-4 win for the Cubbies. Wrigley's energy was a bit zapped by the previous night's drubbing to the lowly Nationals and the overall disappointment that has characterized the 2009 season for Chicago. The lack of energy only served to make my personal experience all the more pure and somehow, timeless; it was August Major League Baseball between two teams without a chance this year featuring no shortage of intriguing players. I was at a beautiful, historic park in a world-class city. I had an Old Style, a hot dog, met some nice people, kept score. There were empty seats.
I love taking in a game with a friend as much as the next guy but there was something about this meaningless game in August, alone, away from my hometown that made me feel closer to the game than I had been in a long time. I'm recharged. The dog days are behind us.
Now bring on the stretch run.
| F/X Visualizations | August 28, 2009 |
The Interaction of Speed and Location on Fastball Success
One thing I have been interested in is how pitch location and speed interact. Are there pitch locations where it is especially important for a fastball to be fast (up in the zone) and others where a slow fastball does just as well as a fast one (the outside edge)? We have some assumptions going in, but I wanted to see what the data have to say. I am going to restrict my attention here to four-seam fastballs.
We know about fastball success by speed. Josh Kalk showed the faster the better for fastballs, not too surprising. And Max Marchi gave us the success of a fastball by location. For horizontal location you get a 'W' shaped graph. That is pitches outside the zone and down the middle of the plate result in higher run outcomes (the outer branches and middle of the 'W'), while pitches on the edge of the zone result in lower run outcomes.
To see how these two factors interacted I plotted fastball success by horizontal location for three groups of four-seam fastballs: all fastballs, those over 95 mph and those under 87.5 mph. The result below is just for those pitched to RHBs, so the inside is negative numbers and outside is positive numbers. The error bars are the shaded bands. The run value is the change in run expectancy so negative is better for the pitcher.
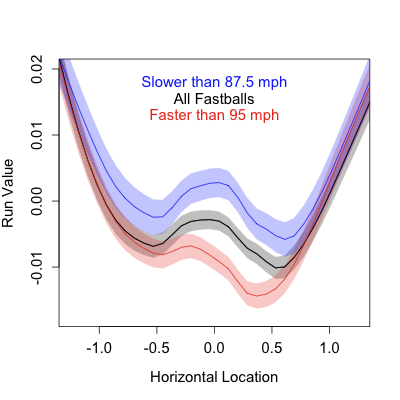
Outside of the zone there is no difference between the three groups. So a batter's ability to lay off a fastball inside or outside the zone is, seemingly, unaffected by the pitch speed.
The difference is pitches over the plate. With the largest difference in the middle of the plate. The slower the pitch the more pronounced the 'W', so the more penalty for hitting the fat of the plate. Pitches on the edges of the zone are fairly close, slow and average fastballs do almost as well as fast ones.
Let's look at the same pattern for vertical location. I normalized the zone so that each batter had the average top and bottom of the zone, which are indicated. I also flipped the graph so that the dependent variable (pitch height) is along the vertical axis.
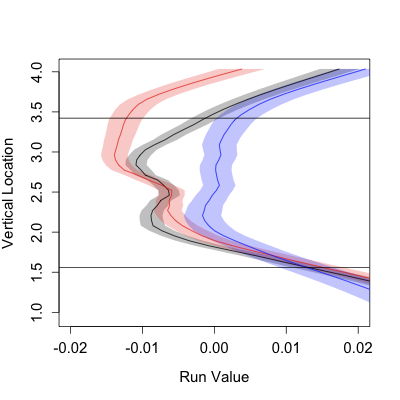
Here pitch speed can cover up an inability to hit the zone, but just above the strike zone. Fast fastballs above the zone do much better than slow or average fastballs. This difference between fast and average is maintained through the top third of the zone, and between fast and slow through all but the bottom fifth of the zone. For fastballs low in the zone there is no difference based on pitch speed.
Generally we do see some interesting interactions of fastball speed and location on fastball success. A faster fastball will not save someone who cannot get the ball in the zone, but fastball speed gives a pitcher a lot of leeway to hit the fat part of the plate and pitch up in the zone.
| Designated Hitter | August 27, 2009 |
Walking Off
“...in the Retrosheet era.”
There's no denying the immense drama that surrounds the walk-off home run. From Bobby Thomson in 1951 to Bill Mazeroski in '60, Kirk Gibson in '89, Joe Carter in '93, Big Papi in 2004 and more, the walk-off home run has been inspiring writers and baseball fans alike for decades. It's even helped get certain players elected to the Hall of Fame.
Thanks to SABR, we know that the current leaders in career walk-off home runs are some of the all-time greats: Frank Robinson, Mickey Mantle, Jimmie Foxx, Stan Musial, and Babe Ruth, all with 12 career walk-offs. It's a formidable group and, unlike the Thomsons and Mazeroskis above, there's not a single surprising name on that list.
But the home run is not the only way to earn a walk-off victory. For our purposes, we’ll use the most liberal definition of a walk-off victory (WoV), which is "a run-scoring event in the bottom half of the last inning of the game that gives the home team a winning margin." This means that any event that causes a run (or runs) to cross the plate can be considered a "walk-off". Base hits, ground-rule doubles, bases loaded walks, steals of home, sacrifice flies, passed balls, wild pitches, errors, balks, and even interference can all lead to a WoV.
I thought it'd be interesting, then, to do a study of these non-home run walk-off events. When you start looking at the data, you find that there are a lot of questions that can be asked: if Ruth, Mantle, Robinson, et al are the leaders for home runs, who are the leaders for the other categories? Is it a certain type of hitter? And what kind of situation leads to the most WoV's? Are there any seasons where the WoV was abnormally frequent?
And once you start poking around with those questions, more come flooding out: who has given up the most WoV's? What pitcher-batter combo has teamed up for the most WoV's in history? In that same vein, what batter-baserunner combo has teamed up to score the most WoV-runs? Does the list change if we only consider the baserunner who scored the winning run? And who is the baserunner who has scored the most winning runs in WoV's? What about non-winning runs?
As you can see, there is plenty to answer about walk-off victories if we just look at the data – and some of it is bound to be interesting. So, using the Retrosheet play-by-play data from 1954-2008, this is what I've found. I'll break the discussion into Batters, Pitchers, and Baserunners to keep it manageable. And if there's something about the data that I didn't include or that I haven't considered, please let me know.
The Basics
But first, some general information about WoV’s.
In the Retrosheet era, there have been 9,887 games ending in a walk-off fashion. The top five walk-off events in that time are so:
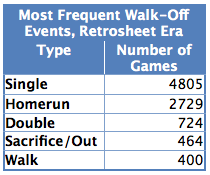
Error, wild pitch, fielder’s choice, and triple are the only other walk-off categories that occurred more than 100 times. Excluding the nearly 2,800 games won by walk-off home runs, the teams with the most walk-off victories (and defeats) are as follows:
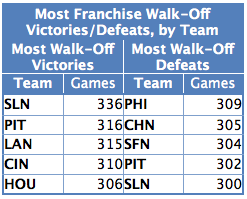
Again, this data only spans the Retrosheet era. It’s still surprising to see the Astros so high on career victories, though, considering how many other teams had a seven-year head start.
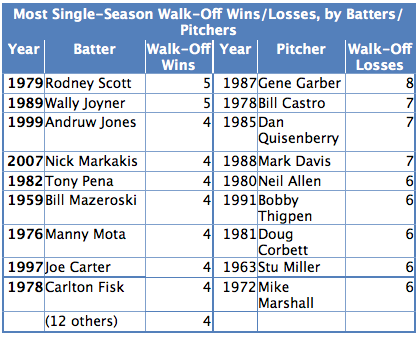
Finally, before we get too deep into the details of the batter and pitcher data, it seems like this is a good place to list the single-season leaders for walk-offs, for both pitchers and hitters. As with most everything else, this list excludes walk-off home runs:
The Batters
Looking at the remaining 7,100 non-home run walk-off events, the vast majority were officially scored as singles (4,805 walk-off singles). Many are more complicated than a mere base-hit (one-, two-, and even three-base errors, etc) but, for our purposes, they will be counted as a single.
We also find plenty of non-batting events in the data: stolen bases, balks, wild pitches, and passed balls are all there in the data. If we remove those from consideration for now - so that we don't credit, say, Cliff Floyd with a walk-off hit when John Rocker balks in the winning run - then the leaderboard for most career walk-off victories, non-home run variety looks like this (and, yes, we do count HBP, BB, errors, and other events that the batter initiated in this list):
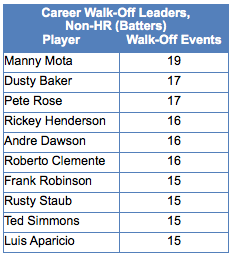
There are quite a few unsurprising names on that list, Hall of Famers known for their run producing ability. But there are also a number of very surprising names. Manny Mota is number one? Dusty Baker tied with Pete Rose for number two? Rusty Staub? Ted Simmons?
A couple of interesting things to note: nearly half of Mota's non-home run WoV's came as a pinch hitter (he also has one walk-off HR to his credit). That's nine times he was called in from the bench in a game-changing role in which he came through to win the game. Talk about your go-to guy off the bench. Also, Frank Robinson appears in the top 10 on this list, with 15 non-home run WoV's (including one sacrifice), which is very impressive in itself. However, he also sits atop the walk-off home run leaderboard with 12. Combining the two, he sits all alone at the top of the WoV leaderboard, with 27 homers and non-homers alike. Yet another reason to love the career of baseball's most underrated superstar.
Breaking those down even further, here are the walk-off leaders in each of the more standard offensive categories:
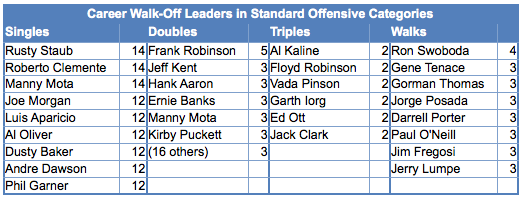
And the less-than-standard offensive categories:
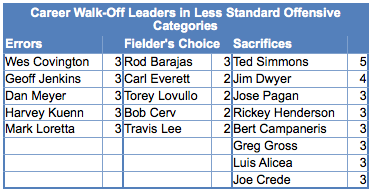
It should be noted that there are no players with more than one walk-off HBP. And please also note Frank Robinson atop the walk-off doubles list. That's 17 career walk-off extra base hits. He's the walk-off king.
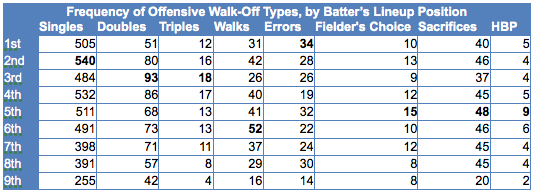
But what about the inning/outs situation? When are WoV's most likely to happen? The table below shows the frequency of non-home run WoV's in the 9th through 14th innings, broken down again by the number of outs.
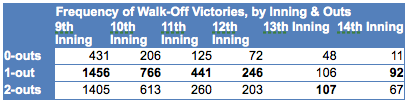
And, finally, who is most likely to get that WoV? Is it the high-average/high-OBP guys in the leadoff spot or the sluggers in the middle of the lineup, or does it even matter? With Manny Mota, Pete Rose, Andre Dawson and Frank Robinson all atop the leaderboard, it's hard to say.
The Pitchers
The "walk-off hit" has a very different meaning when you flip it around and start talking about the man on the mound. Whereas the batter and his teammates are thrilled by the moment - the journey from tension and worry to joy and exuberance is as quick as the flight of the ball - the pitcher and his teammates are devastated, walking off the field with heads hung down. As a pitcher, that is the one situation that you do not want to be in: the guy giving up the lead completely and for good, with no chance to recipricate.
Being the all-time leader in this category, then, is one of the more dubious honors in baseball. Who do we find on the leaderboard?
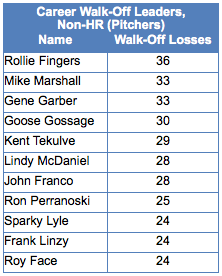
Similar to the leaderboard for hitters, this includes all events a pitcher might be considered responsible for, including wild pitches and HBPs. Passed balls and errors are excluded. We also continue to exclude home runs from the discussion.
Seeing Hall of Famers Rollie Fingers and Goose Gossage on the list shouldn't be too much of a surprise, considering the number of the games that they closed out. Frank Linzy and Ron Perranoski are the biggest surprises, as they only finished 342 and 458 games, respectively. After them, it's Mike Marshall who finished the fewest games in his career, with 549.
The fact of the matter is, if you keep putting the same guys out time and again in the ninth inning (and later) of tight ballgames, they're inevitably going to lose some games. It's almost amazing that, of Rollie's 709 games finished, he only gave up the walk-off in 36 of them (49 if you include home runs).
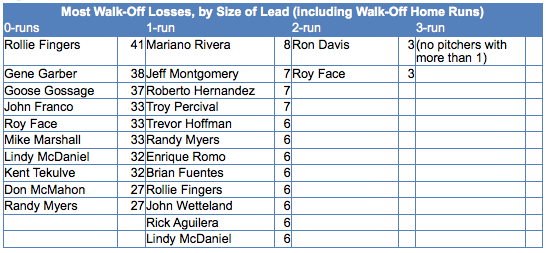
Not all walk-off losses (WoL) are the same, though. In the table below, the data is broken down by the size of the lead that was blown.
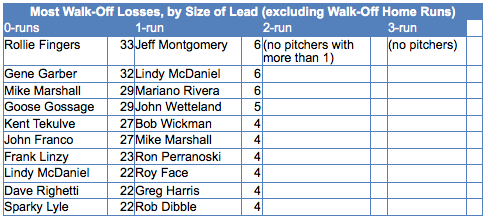
And, in the interest of thoroughness, the same list, but with walk-off home runs included, is provided below:
Finally, the question needs to be asked, what batter-pitcher matchup has ended in the most walk-offs?
Maybe not surprisingly, we don't have to go too far back to find the answer: between Sept 12, 2004, and Sept 1, 2005, Atlanta's Andruw Jones earned the walk-off victory in extra innings from Montreal's/Washington's Luis Ayala three separate times. Here are the three games (I had to include HRs in this search to find a unique candidate):
- Sept 12, 2004: Montreal @ Atlanta, 8-8, bottom 12, no outs, runner on first - RBI Double
- July 26, 2005: Washington @ Atlanta, 2-2, bottom 10, 2 outs, bases loaded - four pitch walk
- Sept 1, 2005: Washington @ Atlanta, 7-7, bottom 10, 0 outs, bases empty - solo home run
No other batter-pitcher matchup ended in a walkoff more than twice.
The Baserunners
One thing about walk-off's is that we remember them for the batter. The runner who earned his way onto the basepath and actually scores the run is easily ignored. For example, when we think back to Game 7 of the 2001 World Series, it's not Jay Bell that we remember for scoring the winning run, it's Luis Gonzalez.
But in the long history of the Major Leagues, it seems certain that there are some players who found themselves in these situations over and over again. At some point, you have to start thinking that they may have some actual skill at it. The leaders for most walk-off runs scored (and most walk-off winning runs scored) are as follows (excluding batter-runners scored via home runs):
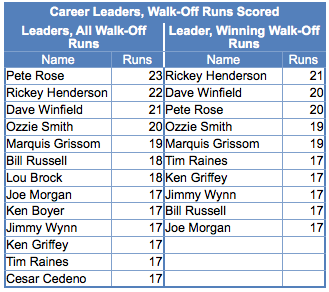
Now there's a list that shows some greatness. Nothing but Hall of Famers and quality run scorers. It makes perfect sense that they would be on base for so many WoV's.
Eyeballing the list, it seems that it’s the top of the order guys – the #1 and #2 hitters like Rickey and Rose – who cross the plate the most. And while this makes intuitive sense, it seems worth checking. The list, excluding batter-runners scoring themselves via home runs, is below:
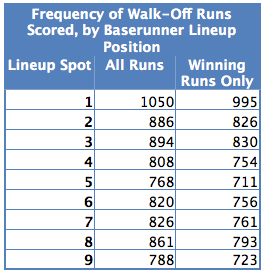
Okay, so no surprise there. But where do the winning runs come from, though? From what base?
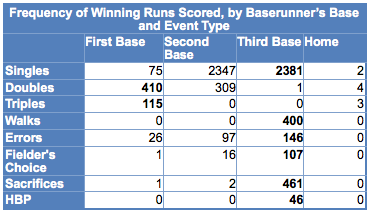
It should be obvious that, across all WoV's, the winning run scores from third more often than any other base. But does this carry across all walk-off types, though? The table below shows the frequency in which the winning run scored from each base for the major offensive categories. If the game is tied, the first runner to cross home plate is considered the 'winning run'; if down by 1, it's the second runner to score, and so on.
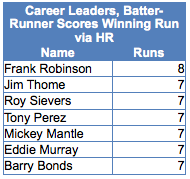
And just for kicks, here's a list of players who scored the most winning runs by driving themselves in via the home run. I know that we're not really focusing on the walk-off home runs in this post, but it seems worth exploring for a minute. It's good to see Frank Robinson at the top of the list again.
And finally, as with the pitchers, the question has to be asked, what is the most prolific walk-off batter-baserunner combo, and does it change if we look only at the winning runs? Excluding walk-off home runs, the list looks like this:
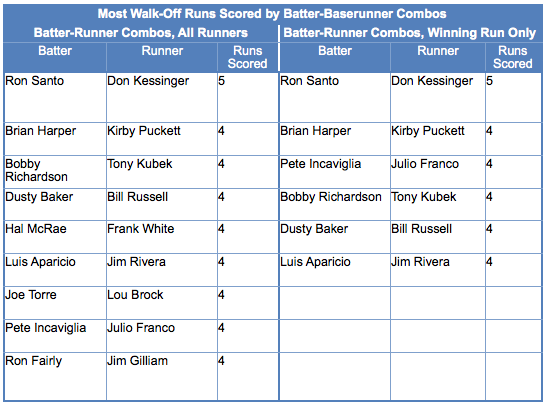
The most surprising thing about those lists is how none of the top walk-off run-scorers show up. It's probably a product of player movement, but it's hard to say for sure. Don Kessinger and Kirby Puckett are the only players on the list who were also driven in three different times by an additional player. Pete Rose and Rickey Henderson, while never being driven in by the same guy four times or more, do have two different teammates who they matched up with three times each.
(Oh, and I’d talk about the stolen base leaders right here, but, sadly, they aren’t all that interesting. Of the 22 walk-off steals, no player has done it more than once. George Brett, Pete Rose, Rod Carew, and Eddie Murray are the biggest names on the list, with no Rickey Henderson or Tim Raines to be found. A few are recorded as steals of home, but many are also due to errors. In short, it’s a mish-mash.)
Conclusion
Well, that’s about all I can manage to squeeze into this post without delving into utter minutiae. (How often has a game been won with a walk-off single by the number 7 hitter with a runner on second with one out in the 10th and the home team down by one run? Who scored the most winning runs from first base in 1973?) There seems to be an unending amount of information to be found in the walk-off listings. I just hope I’ve been able to share the interesting facts.
In the end, though, I don’t think there’s a typical walk-off scenario to be found. The hitters at the plate, the baserunners who score the winning runs, and the pitchers who are responsible for the loss are all sufficiently varied in their notoriety/stats/skills that it really does seem to be “the luck of the draw.”
If I did have to describe the “typical” walk-off victory – with the caveats above – it would be this: it’s a tie-game in the bottom of the ninth and the top of the order is coming up. The leadoff hitter (or #2 hitter) gets on base and is moved into scoring position, where he is driven in by either a base hit or home run from the middle-of-the-order power guys. It helps to have all-star-or-better quality players batting in either of those lineup positions.
I’m guessing you probably could’ve guessed that. Still, it’s always nice to have the data to back it up. Now, the next time you see your team get that walk-off hit, you can say that you saw it coming.
Larry Granillo lives in Milwaukee and writes the blog Wezen-Ball.com, where he uses some do-it-yourself statistical analysis and various contemporary accounts (including newspapers and magazines) to look at the game of baseball, both past and present - and, whenever possible, at where the two meet.
| Change-Up | August 26, 2009 |
Billy Wagner & Post Tommy John Pitching
A deal finalized yesterday between the Mets and Red Sox gives Boston another live arm while raising questions about Billy Wagner's health and more broadly, how to handle a pitcher post-Tommy John Surgery. With respect to his chances for success this season and beyond, it seems Wagner is fortunate to be a relief pitcher.
David Young at SI.com pointed out as much in his recent piece focusing on Tim Hudson's chances for making a successful return to the Big Leagues.
Perhaps an argument in favor of going to the bullpen is the high-profile closers and relievers that have been able to perform well at the major-league level post-TJS. Danys Baez, Rod Beck, Manny Delcarmen, Octavio Dotel, Frank Francisco, Eric Gagne, Tom Gordon, Hong-Chih Kuo (twice), Jose Mesa, Rafael Soriano and Bob Wickman were all able to pitch competitively after receiving TJS.
There can be no questioning Wagner's record of success. He is a relief pitcher of historic stature, the career leader both in K/9 and K/BB for relief pitchers with at least 600 career innings. In two Big League innings for the Mets in 2009, he struck out four, walked one and did not allow a hit. It's unclear what role he will fill for Boston but their once dominant bullpen has stumbled a bit of late. Takashi Saito, Hideki Okajima and Jonathan Papelbon have remained steady, but Ramon Ramirez, Daniel Bard and Manny Delcarmen have looked shaky. Adding Wagner to the mix can only help.
With Wagner's health of central concern to Boston and the American League Wild Card race, I sought out some professional perspective on Wagner, how the Sox should handle him and what he will need to do in order to sustain success. Craig Friedman is Director of Methodology at Athletes' Performance and works with Cactus League clubs preparing MLB pitchers for a long season during Spring Training. Here is what he had to share:
Billy Wagner’s acquisition by the Red Sox brings up the lingering question of Tommy John surgery—can pitchers fully recover after surgery, and if so, how can the Sox (or any team) best set up the pitcher for long-term success?First, here is some insight on why surgery is needed in the first place: pitching velocity should be the summation of forces coming up the kinetic chain. From the ground through foot, legs, hips, torso, shoulders, elbow, hand , and finally to ball. If there is an issue with this kinetic linking as in faulty pitching technique where the hips are leaving the shoulders behind, increased stress is placed through the shoulder and elbow.
To help players recovering from Tommy John, there are both tactical considerations and physical ones:
Tactical considerations- watching pitch count over multiple games- one game of an elevated pitch count isn’t an issue if it is considered in the next games the player is in. Pitching volume should be manipulated throughout the season to make sure a pitcher is not being over-taxed. Under-recovery is also an issue that could create a sub-optimal environment in the human system- lack of sleep, and poor soft tissue quality, and poor conditioning could all lead to issues where the athlete is not as prepared as they could be the next time they take the mound.
Physical considerations- again related to kinetic linking- if there is a mobility, stability, or soft tissue issue anywhere in the body, force is not transferred efficiently through the body. These “energy leaks” force the athlete to compensate in order to make up the loss somewhere else in the chain. For example, if a pitcher has poor hip stability, energy is lost and not passed up the chain through the torso and increased stress is placed on the shoulder and elbow. It could even be as simple as having an issue with your big toe not engaging with the ground properly
So, there you have it; don't overuse him or under-use him, get him to bed early, keep him in shape and keep an eye on his "kinetic linking". Do all of that and the Red Sox may have the Billy Wagner of old, slamming the door late in games down the stretch.
==========
As Director of Methodology for Athletes' Performance, Craig Friedman designs and implements performance training systems for professional athletes of all sports as well as elite youth through college athletes. He also continues to specialize in Major League Baseball Spring Training preparation at the Arizona facility and served as a Performance Specialist for the German National Soccer Team during their run to a 3rd place finish at the 2006 World Cup in Germany. He is also involved with numerous developmental initiatives integrating performance training and technology for both Athletes' Performance and Core Performance as a leader of the Performance Innovation Team at AP.
Craig received both his Master of Science and Bachelor of Science degrees from the University of Tennessee, Knoxville, where he worked with the Women's Athletic Training Department. He gained additional experience as a graduate assistant at the University of Arizona as the Assistant Football Athletic Trainer, where he was responsible for the acute care, assessment, and rehabilitation of injured players before shifting his emphasis toward performance training.
| Behind the Scoreboard | August 24, 2009 |
The Best Team (A Reasonable Amount Of) Money Can Buy
We're entering the dog days of the baseball season and, with about a month and a half to go, I thought it would be a good idea to look back on the free agent class of 2009. An old adage claims that you can't build a team around free agency alone. And, while this is pretty accurate, there are of course, ways to dramatically improve a team's fortunes through free agent pickups. The problem of course is that free agents cost dramatically more than players in their first six years, so to building a great team out of free agents alone is fairly difficult unless your team happens to be in the American League and hail from New York.
But, with outstanding foresight, is it possible to build a pennant contender entirely out of free agents for only the league average payroll of about $80 million dollars? In this article, I'll take a crack at that, and along the way, take a look at the best bargains of 2009.
Building a Ballclub
I'll start my theoretical team full of replacement level players, which I'll assume, as Fangraphs does, will play at a level equivalent to a .300 winning percentage. To evaluate a potential free-agent's contribution thus far to my team, I'll simply look at the Wins Above Replacement (WAR) as calculated by Fangraphs. Since I am defining all of my other players as replacement level, I can simply add the free-agent's WAR to my team's expected win totals to see how their addition would impact the club. After 120 games, we would expect our replacement-level team to have a 36-84 record, but with good free agent signings, we can increase our win total.
There are about 700 plate appearances at each position over a full season, and since we've so far played about 3/4ths of a season, we have about 525 PA's to allocate at each position if we so choose. I'll also assume that each player could have been signed for the same amount of money that he actually signed for before the 2009 season.
Infield
Starting at catcher, we'd like to sign David Ross (1.3 WAR in 122 PA) for $1.5 million and Gregg Zaun (1.4 WAR in 227 PA) for $1.5 million. Our replacement level catcher worth 0 WAR will take over the duties for the remaining 176 PA's.
At first base, the pickings are slim. Of course, Teixeira is out there, but we don't want to break the bank. The best we can do on the cheap is to sign Wes Helms (0.8 WAR in 173 PA's) for $1 million. Our replacement level first baseman can take over the rest of the first base position's PA's.
At second, the obvious free agent choice is Felipe Lopez, who currently is tearing it up with Milwaukee for the total of $3.5 million - pricier than our other selections, but well worth it at 3.1 WAR over 511 PA's.
At third base, our theoretical "20-20 hindsight" team will go even pricier to sign Casey Blake away from the Dodgers. At $5.8 million he's not found in the bargain bin, but has provided 3.1 WAR over 474 PA's so far this year.
Our pick at shortstop is Juan Uribe, who has been decent, but not great for the Giants this year with 1.2 WAR over 278 PA's. However, he can be had for just $1 million.
Rounding out the infield is jack of all trades, Craig Counsell, who in 378 PA's can fill out the missing PA's at shortstop, third, second. He actually goes slightly over the allotted PA's, so we'll proportionately scale back his 2.2 WAR to just 1.8 WAR. He's been a bargain for just $1 million.
Though the infield, and at catcher, we've spent a total of just $15.3 million, but so far have a total of 13.1 WAR, bringing our win total up from 36 to 49 and bringing the WPCT up to .408.
Outfield
In the outfield, we'd like to emulate Angels' GM Tony Reagins, and sign both Bobby Abreu and Juan Rivera. Right fielder Abreu can be had for just $5 million and gives us 2.7 WAR in 501 PA's, while Rivera signs for $4.25 million but is the MVP of our team, adding 3.3 WAR in 421 PA's. In centerfield we'll sign Scott Podsednik for $500,000, providing us with 1.2 WAR in 431 PA's. At DH, we can make our biggest free agent buy yet, signing Raul Ibanez, who is having a career year in Philadelphia for $10 million. He provides 3.1 WAR over 413 PA's.
That rounds out the offense. Adding up the WAR, we've raised the team record to 59-61 - not bad on just $35 million worth of free agent hitters. In fact, had we not signed Ibanez, we could have still been competitive on a Marlins-esque $25 million - the difference being that our club came together entirely through free agency.
Pitching
Moving on to the pitchers, one would think we could power our way to the playoffs with $45 million to shore up a replacement-level pitching staff. Starting off, we can sign Dodgers' starter, Randy Wolf, for a fairly pricey $7 million. However, he's been good this year, adding 2.7 WAR to the team. We can also add Mike Hampton - he hasn't been great, but he's worthwhile at 0.8 WAR for $2 million. Rounding out the rotation is Brad Penny at 2.1 WAR for $5 million and Carl Pavano at 2.5 WAR and about $6.5 million (including performance bonuses he is likely to earn).
The Team
At this point, we've got a pretty good team (67-53) for just $55.5 million. We've already plucked the lowest hanging fruit, and to squeeze more wins will take substantially more cash. At this point, the best return on a full $80 million may be signing the dominant Sabathia and paying his enormous contract of $23 million for a return of 4.2 WAR. That's the highest WAR on the team but he's by far the worst deal at over $5.5 million per win. Out of cash, the bullpen is left to fend for itself with replacement players - there were no good bargains out there anyway. However, the Sabathia signing brings the team to an outstanding record of 71-49, with a playoff bound winning percentage of .591, good for 4th best in the majors for only $78.6 million dollars. Below, you can see the "All-Bargain" team as a whole and their contracts and values:
Caveats
Looking at the team, a few things jump out at me. One is the relative ease in which we were able to find cost-effective position players contrasted with the difficulty in finding cost-effective pitchers, particularly relievers. It would seem as though this would either show an inefficiency in the free-agent market or a problem in the calculation or definition of Fangraph's WAR values. After all, WAR should be equal to the player's marginal win value to a team regardless of position. Without doing an in-depth examination, I can't be sure what's going on or if it was just a fluke in this particular 2009 season.
Another potential issue is the calculation of WAR for pitchers. According to their WAR, Brad Penny and Carl Pavano were good bargains and quite valuable to their teams this year. However, with ERA's of 5.61 and 5.20 respectively, these players have been widely seen as busts in Boston and Cleveland this year. In the case of Penny, he's actually being removed from Boston's rotation. Fangraphs uses Fielding Independent Pitching (FIP) as the basis for their calculations and indeed both Penny and Pavano have good peripheral statistics - but the fact is that they gave up a lot of runs this year. A lot of that may be due to bad luck, but nonetheless, that is part of their performance, so I'm not quite convinced that the Fangraph's WAR based on FIP is completely the right statistic to use here. This has been debated before and you can check it out the debate here.
Conclusion
These issues aside, it is interesting to see how well you can build a team with 20-20 hindsight. The moral of the story is, yes, you can build a playoff bound team entirely built through free-agency. However, it's really hard. Even with the enormous advantage of knowing how a player would perform in advance, we were still only able to become the 4th best team in baseball after spending the league average in payroll. Not to mention that most, if not all of these players are playing over their heads (that's why they were such good bargains), and thus I would expect the performance of the team to drop precipitously during the month of September. Nevertheless, creating the team has been a fun exercise for the dog days of August.
| Baseball Beat | August 24, 2009 |
Some Like It Hot
There were two trades during the past ten months that involved three of the hottest hitters in professional baseball.
November 10, 2008: Oakland Athletics traded Carlos Gonzalez, Huston Street, and Greg Smith to the Colorado Rockies for Matt Holliday.
July 24, 2009: Oakland Athletics traded Matt Holliday and cash considerations to the St. Louis Cardinals for Brett Wallace, Clay Mortensen, and Shane Peterson.
Netting Holliday out of the equation, the A's exchanged Gonzalez, Street, and Smith for Wallace, Mortensen, and Peterson. While Street has been a superb reliever for most of the five years he has spent in the big leagues, Gonzalez and Wallace were the keys to these two trades.
As it turns out, Holliday, Gonzalez, and Wallace have been tearing up their respective leagues. Since the All-Star break, Gonzalez and Holliday rank first and third in the majors in OPS.
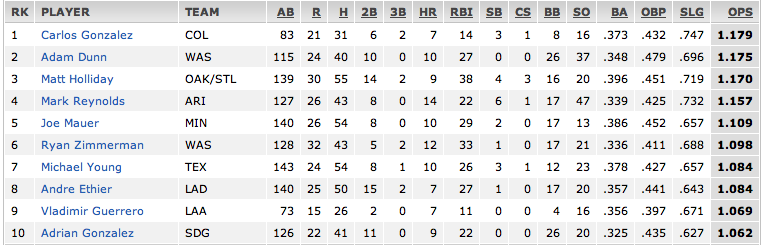
Meanwhile, Wallace was ranked No. 1 on Baseball America's Prospect Hot List for the week ending August 20.
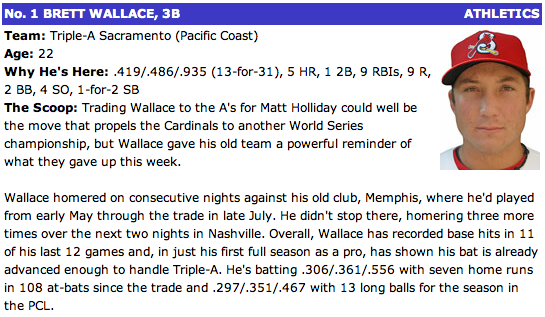
Holliday's story is well known by most baseball fans. A three-time All-Star and Silver Slugger, he has a career line of .318/.388/.546. The 29-year-old left fielder will be a free agent at the end of this season and will be seeking at least a four-year contract for well over $50 million in total.
Gonzalez and Wallace, on the other hand, are not household names. At least not yet.
Signed by the Arizona Diamondbacks as an amateur free agent in August 2002 and traded to Oakland (along with Brett Anderson, Chris Carter, Aaron Cunningham, Dana Eveland, and Greg Smith) for Dan Haren in December 2007, Gonzalez had a disappointing rookie year with the A's in 2008. He hit .242/.273/.361 and struck out 81 times in 316 plate appearances. The lefthanded-hitting outfielder struggled against southpaws (.188/.207/.247) more than anything else. The 2005 Midwest League MVP showed glimpses of power with 22 doubles in only half a season's work.
The Rockies acquired Gonzalez during the off-season in the hope that a change in home ballparks from pitcher-friendly McAfee Coliseum in Oakland to hitter-friendly Coors Field in Colorado would allow him to fulfill his vast potential. He began the year at Triple-A Colorado Springs and earned a promotion to the parent club after putting up a .339/.418/.630 line in April and May. However, Gonzalez failed to hit after being recalled in early June but his torrid second half has helped him elevate his overall rate stats to .287/.356/.539 in 191 plate appearances.
| AB | R | H | 2B | 3B | HR | RBI | BB | HBP | SO | SB | CS | AVG | OBP | SLG | OPS | |
|---|---|---|---|---|---|---|---|---|---|---|---|---|---|---|---|---|
| Pre All-Star | 84 | 11 | 17 | 4 | 2 | 1 | 5 | 9 | 0 | 25 | 5 | 0 | .202 | .280 | .333 | .613 |
| Post All-Star | 83 | 21 | 31 | 6 | 2 | 7 | 14 | 8 | 2 | 16 | 3 | 1 | .373 | .432 | .747 | 1.179 |
Selected by the Cardinals out of Arizona State University in the first round (13th overall) of the June 2008 First-Year Player Draft, Wallace hit a combined .337/.427/.530 at two levels in the minors last year. He had a higher AVG, OBP, and SLG in Double-A than Low-A, albeit in a much smaller sample size (57 plate appearances vs. 177). He opened 2009 at Double-A Springfield (.281/.403/.438) and was promoted to Triple-A Memphis (.293/.346/.423) in May. Following the trade between St. Louis and Oakland, the lefthanded-hitting Wallace was assigned to Triple-A Sacramento where he has hit .292/.348/.517 over the past month.
Wallace is more valuable to an American League team like the A's where he can play first base or DH than the Cardinals where he was blocked by Albert Pujols at 1B and forced to succeed at the hot corner, a position that isn't ideally suited for a 6-1, 245-pound body. Although Baseball America and MiLB.com list him at 6-2, 205, Baseball-Reference.com has him at 6-1, 245, the same as his college profile at Arizona State. I'm not sure about the loss of that inch, but there is no question about the added weight. In fact, Wallace admitted to weighing 245 in an interview last January. He is very thick through the middle, including massive thighs as evidenced by these videos.
Nonetheless, the youngster (he turns 23 on Wednesday) can flat out hit. He was a two-time Pac-10 Triple Crown winner and Player of the Year in 2007 and 2008. A former UCLA player told me that Wallace was the toughest hitter the Bruins faced in his four-year career, a span that included Dustin Pedroia, Jacoby Ellsbury, and Jed Lowrie (boy, the Red Sox sure love those Pac-10 guys), as well as Yonder Alonso in a non-conference series that I actually witnessed at Jackie Robinson Stadium in Westwood a few years ago.
Interestingly, Wallace, who prepped at Justin-Siena HS in Napa, California, listed the Oakland A's as his favorite team and Eric Chavez as his favorite player when he was at ASU. If Wallace doesn't get the call in September when the MLB rosters are expanded, he will surely get the opportunity to play for his favorite team and perhaps replace his favorite player at third base next spring. Depending on how quickly Chris Carter (.335/.434/.570 at Double-A Midland) develops, Wallace could also earn the starting job at first base or as the designated hitter. One way or the other, look for him to make an impact in Oakland next season.
For the record, Holliday, Gonzalez, and Wallace have run into some difficulties the past week. Holliday is just 6-for-33 in his last nine games, including 3-for-19 since fouling a pitch off his leg a week ago today. Gonzalez missed Sunday's game after suffering a puncture wound to his left hand. He is hopeful of returning to the lineup during Colorado's three-game series with the Los Angeles Dodgers on Tuesday through Thursday. Wallace cooled off considerably this past weekend, going 2-for-12 with no extra-base hits and a strikeout in each of the three games.
Some like it hot. Or not.
| F/X Visualizations | August 21, 2009 |
Do Batters Swing Too Often in a Full Count?
A while ago iamawesomer wrote an interesting piece about the game theory of swinging at 3-2 pitches, and MGL often talks about how he thinks batters swing too often in a full count. The idea intrigued me and I wanted to examine it.
First off a little background, batters tend to swing more as they get more strikes. This makes sense, with no strikes they can be selective and wait for their pitch. But with two strikes letting a strike go by ends the at bat. Similarly batters tend to swing less when they have three balls compared to fewer. Again this is a good strategy. The benefit of going from 3 to 4 balls is more than going from 0 to 1 balls. So taking a pitch, that could be a ball or a strike, is better with three balls than with fewer.
It seems like this trend of breaks down when the count is full. Consider the two counts 2-2 and 3-2. In both counts the penalty for taking a strike is the same--a strikeout--but the benefit from taking a ball is greater at 3-2. Taking a ball at 3-2 results in a walk, while taking a ball at 2-2 just brings the count full. If a pitch is right on the border of a strike/ball a batter has more incentive to take that pitch at 3-2 than 2-2. But that is not what they do. Batters swing at more pitches at 3-2, the trend is true for pitches in the zone and pitches out of the zone. Also if you look at pitches in a given location batters swing at that pitch more often at 3-2 than 2-2. So batters are either swinging too often at 3-2 or too rarely at 2-2 or both. For this post I am going to look at the full count.
I am going to restrict my attention to RHB/RHP. I think the results would be similar in other cases, but I have not checked. Here is the swing rate by pitch location at 3-2.
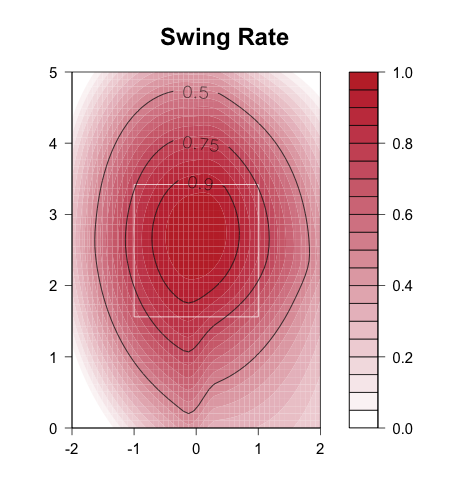
In other at-bats batters swing at pitches inside more often than outside, but this preference breaks down when the count is full. Overall this is a huge area over which batters swing.
I took the run value by location of 3-2 pitches swung at (swinging strikeouts, fouled off and balls in play) and subtracted the run value of a 3-2 pitch taken (walks and called strikeouts). That value I plotted in colors with red negative (penalty for swinging) and blue positive (better to swing). On top I plotted the 50%, 75% and 90% swing contours.
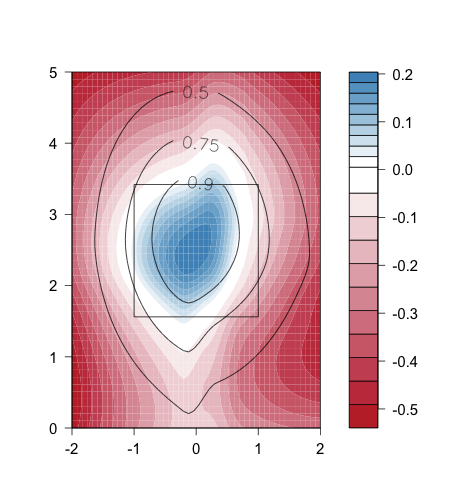
The white is the break even. The average batters, if he knew the exact locatoin a pitch would end up and preformed optimally, would swing at pitches inside that white band and take outside.
In the blue region batters swing over 75% and for most of it over 90% of the time. So batters do a good job of swinging at pitches they need to. In the red region just outside the break even batters swing between 75 and 50% of the time. So they swing at a large number of pitches they should take, they do not do a good job of taking pitches they should take.
Generally a batter would want to swing inside the blue and always take inside the red. It is not possible to do this perfectly, the batter does not know where the ball will end up when he swings. Most likely if he tried to be more selective and take more balls (those in the red area), then he would also end up taking some additional strikes (those in the blue). Right now it looks like batters are too swing-happy, they should be more selective, and give up some called third strikes in exchange for more walks.
| Designated Hitter | August 20, 2009 |
Solo Homers Will Not Break Your Back
A good deal of words have been written decrying the increased home run numbers thanks to the unfortunate placement of outfield walls in the new Yankee Stadium. In their efforts to faithfully reproduce the exact dimensions from the old park across the street, the Yankees nailed the distance from home plate in almost all of the right places. Right field corner, left field corner, straight-away centerfield, and the halfway marks between. However, they failed to take into account a nifty new scoreboard that covers part of the wall in right field and, unfortunately, causes the wall to lose its gentle curve. In effect, a good deal of the right field wall is about nine feet too close to home plate. What you have, in effect, is a straight wall in right field that simply begs left-handed hitters like Johnny Damon to deposit an easy homer above its shallow border. But really, is this really part of some sort of dastardly plan by the Yankees to grab advantage over their foes? I think not.
To date, there have been a whopping 185 home runs hit at New Yankee Stadium, already 15% more tater tots than were hit at the old place last season. But while 50% of the homers last year were hit with no runners on base, that figure has risen to 65% in the new place. On average over the past few years in the MLB, about 58% of home runs are of the solo variety. Is there something about the new park that decreases scoring overall even as homers fly out at a record rate? To wit: New Yankee Stadium is only seventh in the league for scoring; last year, the old place was ninth. Scoring is up only 0.5 runs per game between the old park and the new park. If the Yankees and their opponents keep up their current pace of slamming homers, the new place will end up with 240 homers hit, a full 50% more than last year, or about one extra homer per game.
Those two increases don't seem to mesh well. If the Yanks and their opponents are hitting an extra home run per game but scoring is only up half a run per game, where is that extra run going? Obviously, the huge percentage of solo home runs is providing solace to opposing pitchers who have been victims of the short dimensions in right field. Take Indians starter Anthony Reyes. On April 17th, the Indians lost to the Yankees by one measly run, 6-5, despite Reyes and two relievers allowing five homers to the Yanks. But, all five homers were solo shots, which kept the Indians alive in the game (they only had one home run in the game, a solo shot).
So what explains the high percentage of solo home runs in the New Yankee Stadium? One explanation is almost so obvious that I missed it at first: when a guy who hits in front of you hits a home run, he is unclogging the bases of those pesky baserunners. That leaves you, the batter, with an empty canvas on which to paint your own home run. Sorry, but that will only be one RBI for you, sir. In fact, Johnny Damon and Mark Teixeira have accomplished the back-to-back trick six times already this year, a franchise record. They've done it three times at home and the rest of the team has done it four more times, plus one occurrence of back-to-back-to-back home runs. That's nine home runs that must be solo shots because the gentleman ahead did the hitter a favor and cleared the bases.
Not that allowing all these solo home runs is going to get any pitcher off the hook, but if scoring is only up by half a run per game, then at least any wary pitcher nervous about giving up the farm when visiting Yankee Stadium can relax. You might give up a bunch of home runs, but if you're smart, you'll wait until the bases are empty.
==========
Rob Iracane co-edits Walkoff Walk, a thoughtful blog dedicated to baseball and the human condition. He and Kris Liakos have been active for over 18 months and their biggest claim to fame is posting a video of a shrimp running on a treadmill backed by "Yakety Sax" whenever an MLB team wins on a Walkoff Walk.
| Change-Up | August 19, 2009 |
Your One Stop American League Round-Up
In the throes of the dog days of August, it's easy to lose sight of the importance of the baseball games being played night-to-night. In baseball there's the season's beginning, the excitement around the trade deadline and the September pennant races that seem to garner the most attention. But these are interesting times in Major League Baseball, and I thought it might be useful to stop and take stock of where we are at the moment. We'll start with the American Legaue.
In the AL East, the New York Yankees seem to be on cruise control, bashing their way to their first division crown since 2006. Their team OPS+ is 116 and with only one regular OPS'ing under .800, this is the finest edition of the Yankees in a number of years. They are getting hot at the right time, too, having gone 24-8 since the All-Star Break. Of the top-22 in OPS since the break, five are Yankees. One through nine, it's easily baseball's scariest lineup.
Elsewhere in the division, the Boston Red Sox are tied with the Texas Rangers for the American League Wild Card lead but it's been a tough slog for Boston of late. Just 13-17 since the All-Star Break, it's hard to envision these Red Sox qualifying for post-season play without really catching fire. Fear not, Sox fans. Paul Byrd goes tonight in Pawtucket. Help is on the way!
Three games back of the Red Sox and Rangers in the AL Wild Card race are the Tampa Bay Rays. The Rays field four legitimate MVP vote-getters every night, have a great front end of the rotation and an overachieving bullpen. And yet, they can't seem to string wins together consistently. Should they miss the playoffs this season, you can point to four players. Scott Kazmir and his 6.61 ERA is one, and here are the three others:
          AVG   OBP   SLG
Upton    .240  .316  .370
Burrell  .224  .326  .388
Navarro  .220  .252  .336
In the Central, the Detroit Tigers are three games clear of the Chicago White Sox. Detroit has added Jarrod Washburn and now Aubrey Huff, and despite a negative run differential for the month, are 10-7 in August. They don't really hit much, though, and while Justin Verlander continues to dazzle, Edwin Jackson has yielded a .896 OPS since the All-Star Break. If Washburn and Jackson struggle and the offense limps to the finish line, this division is there for the taking should Chicago or even Minnesota step up.
Kenny Williams has grown tired of his team's underachieving ways but don't blame 22 year-old rookie third baseman, Gordon Becham. He's been Chicago's best player of late, hitting .322/.415/.517 since the Break. The problem with the White Sox has been that Jermaine Dye and Paul Konerko are doing what old people do, slowing down. Meanwhile for 40% of their games Chicago pretends Jose Contreras and Freddy Garcia are still Major League starters. Get healthy, Mr. Peavy.
For Minnesota's part, their catcher's having a pretty good season, huh? I don't really feel compelled to jump into the absurd Joe Mauer vs. Mark Teixeira MVP debate, but a few things I have read especially resonated with me. There is this article from Dayn Perry at Fox Sports which reminds the BBWAA of the voting criteria, and that their job is not to award the hardware to "the player with the most RBI or most home runs or dirtiest uniform on a team bound for the playoffs."
There was also this tweet (hate that word but it is what it is) from Ken Tremendous, formerly of Fire Joe Morgan fame and writer for NBC's The Office and Parks and Recreation.
Joe Mauer is hitting .383/.448/.653/1.101. He has a 10.6 WARP3, and it's mid-August. If he doesn't win the MVP, I quit America.
But maybe David Cameron has it right over at FanGraphs. I tend to feel the same way these days about the Hall of Fame vote. In a piece he titles "Why Do We Care?". he writes...
If they want to think that Teixeira was the most important player to his team in the league this year, that’s fine. Most of us probably disagree, and we’re under no obligation to report that as any kind of factual statement. I’ll be telling people that Mauer was the most valuable player in the American League for 2009, and I’ve got a mountain of information to back it up. How other people view the definition of the word value has no real world impact on me.
As for Minnesota's team hopes, they sit 6.5 games back. Switch out Matt Tolbert, Alexi Casilla and anyone else who has manned second base for the Twins for Robinson Cano and the Twins are in the thick of a division race and there is no question at all about whether the guy putting up the best season ever for a catcher should capture a long overdue first MVP award. Also of note in the AL Central, Billy Butler is raking to the tune of a .331/.393/.589 line in the second half for the Kansas City Royals.
Out west we have witnessed quite a role reversal in 2009. The Texas Rangers lead baseball in Runs Saved Above Average while the Los Angeles Angels lead the Big Leagues in runs per game and batting average. Seven Angels regulars are OPS'ing over .800 on the season while the two that are not, Howie Kendrick and Erick Aybar have posted a .986 and .878 mark respectively in the second half. I wonder if Mike Scioscia has reconsidered some of his philosophies regarding how runs are plated.
The Rangers improved run prevention can be attributed in large part to their defense. Led by Elvis Andrus, Texas is second in the American League in Defensive Efficiency Rating. Texas has a tough road the rest of the way, with seven remaining against the Angels, six against the Rays and three against New York. Their last seven games of the season will be away from Arlington. They look strong - they might even be the favorites for the Wild Card - but let's see them close. It's been a while.
==========
I'll be back next Wednesday with a similar look at the National League.
| Behind the Scoreboard | August 18, 2009 |
Strasburg, The Nats, and Game Theory
Last night, the big news around the baseball world was the Nationals coming to an agreement with Stephen Strasburg, the most touted college pitcher in perhaps the history of the draft. For those still waking up, Strasburg signed a foul-year deal worth $15.1 million, making him the richest draftee ever, but falling far short of the $50 million figure agent Scott Boras tossed around at the time of the draft.
Last night's 11th hour dealings were an interesting study in game theory, with super-agent Scott Boras, matching wits with Nationals owner Ted Lerner, team president Stan Kasten, and GM Mike Rizzo. Oh yeah, and Stephen Strasburg himself also had a say in the process. The baseball world watched intently last night because while both parties had a lot to gain from making a deal, both had much more to lose by not signing. Strasburg had a powerful incentive to sign, because if he did not, he would have to sit a year, risking injury or regression, just to be back in the same situation a year later. The Nationals of course, had an incentive not to let a can't miss prospect that the franchise so desperately needs to slip through their fingertips.
In fact, both sides were likely miles apart on the value of the contract....but not in the way you might think. For the Nationals, the value of the wins Strasburg will produce may be $30-$40 million dollars, at least as valued by the WSJ and Biz of Baseball. If they pay more than that theoretical "break-even" dollar amount, that means they could get those wins more cheaply elsewhere. If they pay less, they'll be getting a bargain.
Strasburg also had a break-even point, except his was determined by the amount of money he could likely get the following year, if he decided to sit out the season. Of course this has to factor in any depreciation that might occur, due to injury and the decreased leverage he'll have the following year if he decides to sit. When factoring the uncertainty and the risk, plus the fact that the young man wants to play big league baseball, a guess for his break-even point would probably be somewhere around $11 million. Anything more than that would be gravy, while anything less and he would be hurting himself by signing rather than holding out and re-entering the draft next year.
Graphing the intersection of these two (admittedly hypothetical) value curves, we see that the both sides should have been willing to do a deal valued anywhere between $11-$35 million. While the lines intersect where each side gets an equal gain from the deal at about $23 million, any deal struck within that range should have be acceptable. So why did the negotiations come down to 11:59 last night? Well, each wanted to get the best deal of course. When the possible value acceptable deals ranges so widely, it's hard to come to an agreement - after all there is big difference between $11 million and $35 million, and while both sides would theoretically gain with a deal anywhere in that range, neither side wants to be seen as chumps.
Of course, using those break-even points, the final deal, at $15.1 million, was far more advantageous to the Nationals than Strasburg. Why? For one, I mentioned that the Nationals would be getting a bargain at anything less than a $35 million dollar deal. But, in the MLB draft, teams are accustomed to getting big bargains. That is why having high draft picks is a good thing - the draft is a place where you can sign valuable players for less than you could elsewhere. If teams paid market value according to their projected Wins Above Replacement, there would be no advantage to having high draft picks or even drafting many players at all.
Second, the deal does not occur in a vacuum. The Nationals are aware that their negotiations with Strasburg will affect how other players negotiate with them in the future. If the Nats broke down and gave Strasburg a $30 million deal, this might be worthwhile in the short-term, but they would also raise the expectations for every other high profile player they picked in the future (including a likely Bryce Harper selection next year, which will almost assuredly entail the same type of negotiations as this year's drama with Strasburg). When this is factored in, the true break-even point for the Nationals is lowered considerably.
Strasburg, on the other hand does not have this same kind of recurring scenario. At most, Strasburg will be back at the bargaining table with the Nats one or two more times, and those will be under completely different pretenses since he will by then be eligible for either arbitration or free agency. As a result, Strasburg's break-even point isn't changed much by the possibility of future deals (Boras, on the other hand does have an incentive to draw a hard-line and raise the break-even point since he will be back at the same bargaining table many times - however, as the player, Strasburg has the final say).
Third, the way the negotiations are structured gives the Nationals an advantage. With a firm deadline imposed by MLB, the parties must come to an agreement by a specific time. Since it is the team that offers the player the contract, and not the other way around, this gives teams the final leverage to push the value of the contract towards the player's break-even point. For instance, the team can tender a "final offer" to the player before the deadline and refuse to entertain other scenarios. With the clocking ticking and the offer on the table, it is Strasburg, not the Nationals, who must decide in the final moments whether or not the deal is satisfactory. And, if that deal is worth more than Strasburg's break-even point, he'll sign it. The Nationals, knowing this, can offer a deal worth slightly higher than his break-even point, and he should still sign.
Of course, if there is no deal on the table, and the team is still listening and cowing to Boras' demands at 11:55, the Nats lose a lot of their leverage. In fact, under the game-theory principle of eliminating options, it might have been a good idea for the Nats brass to take a mid-August jaunt to a remote, unreachable island in the Pacific, or an expedition to cellphone-towerless Antarctica. By giving Boras a contract, saying "take it or leave it, see you later" and truly being unreachable at the deadline, the Nationals would eliminate the possibility of extending a higher offer, thus putting the onus on Boras and Strasburg to accept the the Nats offer or go without.
As it turns out, the Nationals didn't have to go to the South Pole or the Moon to sign Strasburg to a very reasonable deal. Considering that virtually every scout projects him as a future #1 starter and someone who can immediately step into a major league rotation and produce, the Nationals came away with a bargain. If Strasburg's value was truly $35 million, the Nationals just saved $20 million over the price they would have had to pay for getting those wins elsewhere. Here in DC, having watched the Nationals bungle move after move, I was pleasantly surprised that Washington seemed to handle the negotiations very well, signing the new face of the franchise with 77 seconds to spare, and putting them in good position to sign Bryce Harper to a similar deal the following year.
Now that the anticipation of the deal is over, the anticipation of Strasburg's first major league start begins....
| F/X Visualizations | August 14, 2009 |
One of the Game's Stranger Hitters
One of the things that I, and I assume most of us, love about baseball are its peculiarities and oddities. The historical oddities, like when was the last time a pitcher gave up two triples in the first inning of his first major league start. Strange park dimensions like the Green Monster. And players who succeed in atypical manners. One such player is Pablo Sandoval.
He seemingly takes a horrible approach at the plate, swinging at tons of pitches out of the zone, but he is a very productive hitter. He is not particularly fast or hit that many line drives, but he has sustained a high BABIP over his major league and minor league career. He has two great nicknames. In this post I want to highlight what makes Sandoval such a stranger hitter.
The most remarkable fact is that he swings at almost 45% of pitches out of the strike zone, second only by his teammate Bengie Molina. I wanted to show just how extreme this is. So below I have his 50% swing contour compared to the average hitter. What I mean by this is a plotted all the pitches he swung at and took. Then I had the computer draw a smooth line so that pitches inside the line are more likely to be swung at and those outside are more likely to be taken. I discuss the methodology more specifically in the comments section of this post. Sandoval is a switch hitter so I broke it up for his at-bats as a lefty and righty. Sandoval is in orange and the average hitter is in gray.
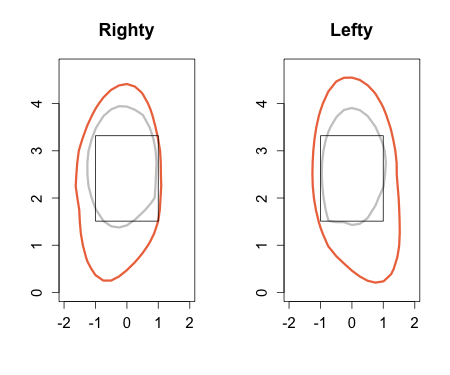
There is a drastic difference between his and the average. Remember that the images are the catcher's perspective so as a RHB he stands to the left of the zone and as a LHB to the right. So it seems he is particularly fond of the low and inside pitches. The only place where he is close to league average is away when batting as a righty, he lays off those pitches. But everywhere else he swing zone is much larger than the average batter. It looks like he swings at more pitches batting lefty than righty.
He can get away with this because, somehow, he can make contact while swinging at these pitches far out of the zone. He makes contact on out of zone swings 76% of the time, solidly above league average of 62% for out of zone swings. And not only can he just make contact he makes good contact out of the zone. Check out the location of his extra base hits.
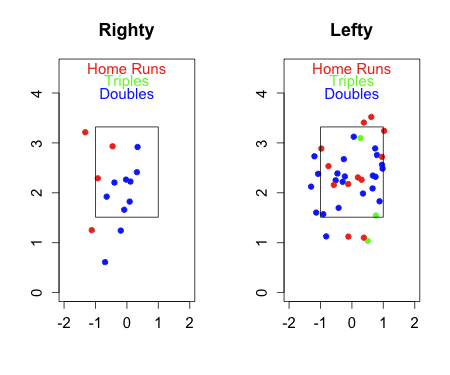
If you compare that to my HR heat-chart and the locations of other specific hitters HRs you will see this is a very strange pattern. He is hitting lots of HRs out of the zone, below the zone, above it and in from it. Batting lefty he has a large number of doubles off pitches off the zone away, opposite field doubles I would guess. Sandoval is leading the league in out-of-zone HRs and out-of-zone extra base hits. Not surprising, I guess since he swings at some many pitches out of the zone. It all shows that he can swing at pitches way out of the zone regularly, and not only make contact, but make very solid contact.
A batter's job is to score runs, to do that you need some combination of hitting for power and not making outs. Sandoval goes about that in one of the stranger ways possible. He hits for power even when swinging at pitches way out of the zone. He can avoid outs because he rarely strikes out, he has good contact skills even when swinging at pitches way out of the zone, and it seems he can sustain a high BABIP. All of this in some one who just celebrated his 23rd birthday. San Francisco fans, and baseball fans, have lots more of Sandoval's strange ways to enjoy.
| Around the Minors | August 13, 2009 |
The 2009 Draft Deadline Looms
About a month ago we took a look at which 2009 first round draft picks had come to terms with their new organizations. Not a whole lot has changed since then, but there have been a few more signings. With just four days to go, though, that is sure to change in a hurry. As it stands, Bobby Borchering (Arizona) and Donavan Tate (San Diego) are both rumored to be close to agreeing to contracts. The majority of the national coverage will no doubt center around first overall pick Stephen Strasburg and whether or not he'll be able to come to an agreement with Washington.
Let's see who has already signed in the first round and how they're doing with less than a month to go in the minor-league season. The players who have signed since our last update have been underlined. Signing bonuses have also been added for everyone in the first round.
4. Pittsburgh: Tony Sanchez | Catcher | Boston College [$2.5 million]
Sanchez has yet to slow down despite playing in low-A ball. The 21-year-old catcher has a line of .347/.460/.574 with four homers in 101 at-bats. He also has a nice walk rate of 12.9 BB% and a respectable strikeout rate at 19.8 K%.
5. Baltimore: Matt Hobgood | RHP | California high school [$2.422 million]
Hobgood has made four short starts in rookie ball and has a 6.75 ERA (but 3.33 FIP) in eight innings. He's struggled with his control by walking five batters, but he also has seven Ks.
7. Atlanta: Mike Minor | LHP | Vanderbilt [$2.42 million]
Minor recently signed and has yet to make a professional appearance.
10. Washington: Drew Storen | RHP | Stanford [$1.6 million]
Storen was the quickest signee, agreeing to a contract on draft day. He's already pitched well at two levels (low-A, high-A) and he just made his first appearance in double-A. Storen worked a perfect inning and he could be in Washington in September.
17. Arizona: A.J. Pollock | Outfielder | Notre Dame [$1.4 million]
His numbers aren't flashy, but Pollock has been holding his own in low-A ball. He currently sports a line of .267/.306/.404 with three homers and five steals in 161 at-bats. Pollock could stand to be a little more patient at the plate (4.7 BB%).
20. Toronto: Chad Jenkins | RHP | Kennesaw State [$1.35 million]
Jenkins just came to terms with Toronto yesterday (Wednesday) so he has yet to make a pro appearance.
21. Houston: Jiovanni Mier | Shortstop | California high school [$1.358 million]
Mier is arguable having the nicest pro debut so far of any of the first rounders. He is currently hitting .298/.405/.476 with three homers and eight steals in 124 at-bats. He is showing advanced patience at the plate with a walk rate of 13.3 BB%. His strikeout rate is a little high at 22.6 K%.
23. Chicago AL: Jared Mitchell | Outfielder | Louisiana State [$1.2 million]
Mitchell spent a little time on the disabled list after signing but he's been hitting well since being activated. Mitchell currently has a line of .277/.440/.415 in 65 low-A at-bats. He's stolen four bases in seven attempts and has a walk rate of 22.6 BB%. Unfortunately, that comes with a strikeout rate of 33.8 K%.
24. Los Angeles AL: Randal Grichuk | Outfielder | Texas high school [$1.242 million]
Grichuk, like Mier, is having a nice pro debut with a line of .324/.359/.500 in 182 rookie at-bats. Unfortunately, his walk rate is just 3.7 BB% and his BABIP is a highly-unsustainable .442. He's stolen six bases in nine attempts and has 21 extra base hits, including 12 doubles and seven triples.
25. Los Angeles AL: Mike Trout | Outfielder | New Jersey high school [$1.215 million]
Trout is also producing an outstanding line at .369/.424/.541 with 10 steals in 111 at-bats. His BABIP, though, is also out-of-this-world at .460. He has a better handle on the strike zone than his teammate Grichuk, with a walk rate of 9.8 BB% and a strikeout rate of 20.7 K%.
26. Milwaukee: Eric Arnett | RHP | Indiana [$1.197 million]
Arnett's superficial numbers are not very good (0-3 record, 5.09 ERA) but he's allowed just 14 hits in 17.2 innings of work and has a FIP of 3.60. The biggest red flag for this right-hander is the walk rate at 7.13 BB/9.
28. Boston: Reymond Fuentes | Outfielder | Puerto Rico high school [$1.134 million]
Fuentes is yet another early prep pick who is having success in rookie ball. The athletic outfielder is currently hitting .301/.351/.379 in 103 at-bats. He also has nine steals in 14 attempts. His strikeout rate is respectable at 16.5 K%, but he could stand to take a few more walks (6.4 BB%).
31. Chicago NL: Brett Jackson | Outfielder | California [$972,000]
Considered a stretch for where he was selected in the draft, Jackson has hit well in three minor league stops. He is currently in low-A where he's hitting .328/.418/.586 with four homers and six steals in 58 at-bats. His walk rate (9.4 BB% at low-A) has dropped with each promotion, but so has his strikeout rate (20.7 K%).
32. Colorado: Tim Wheeler | Outfielder | Sacramento State [$900,000]
Wheeler has spent his entire time in short-season ball since signing. The outfielder has a line of .270/.335/.362 with two homers and six steals (nine attempts) in 185 at-bats. He has a walk rate of 8.9 BB% and a strikeout rate of 20.0 K%.
In the supplemental first round, 13 of the 17 selections have officially come to terms. High school catcher Steven Baron was the first player taken in the round. Also signing were Rex Brothers (Colorado), Matt Davidson (Arizona), Aaron Miller (Los Angeles NL), Josh Phegley (Chicago AL), Tyler Skaggs (Los Angeles AL), Chris Owings (Arizona), Garrett Richards (Los Angeles AL), Mike Belfiore (Arizona), Matt Bashore (Minnesota), Kyle Heckathorn (Milwaukee), Tyler Kehrer (Los Angeles AL), and Victor Black (Pittsburgh).
4th round: Pittsburgh, Zach Dodson | LHP | Texas HS [$600,000]
5th round: Milwaukee, D'Vontrey Richardson | OF | Florida State [$400,000]
6th round: Pittsburgh, Zack Von Rosenberg | RHP | Louisiana HS [$1.2 million]
6th round: San Francisco, Matt Graham | RHP | Texas HS [$500,000]
6th round: Philadelphia, Steven Inch | RHP | Alberta HS [$300,000
6th round: Chicago NL, Brooke Raley | LHP | Texas A&M [$750,000]
7th round: Pittsburgh, Trent Stevenson | RHP | Arizona HS [$350,000]
7th round: Baltimore, Aaron Wirsch | LHP | California HS [$200,000]
8th round: Pittsburgh, Colton Cain | LHP | Texas HS [$1.125 million]
8th round: Philadelphia, Jonathan Singleton | 1B | California HS [$200,000]
9th round: Baltimore, Ryan Berry | RHP | Rice [$417,600]
10th round: Cincinnati, Tucker Barnhart | C | Indiana HS [$250,000]
10th round: Boston, Brandon Jacobs | OF | Georgia HS [$750,000]
11th round: Boston, Jason Thompson | SS | Tennessee HS [$300,000]
13th round: Arizona, Patrick Schuster | LHP | Florida HS [$450,000]
14th round: Kansas City, Crawford Simmons | LHP | Georgia HS [$450,000]
Tick-tock, goes the clock. Tick-tock. The draft deadline will soon be here (Thank goodness).
| Change-Up | August 12, 2009 |
Shortstops Still Standing Out
There is a shortstop playing for one of the Florida teams this season batting .336/.391/.541, heating up at the right time and overall posting one of the better offensive years by a player at his position in recent memory. Yes, Hanley Ramirez (.351/.413/.556) is having another banner year but the first sentence here applies to Tampa Bay Rays shortstop, Jason Bartlett.
The players manning Tampa Bay's middle infield represent two of this year's biggest surprises in Bartlett and Ben Zobrist. Coming into this season, Bartlett was a career .276/.337/.362 hitter more renowned for his clubhouse presence (2008 team MVP!!) and glove than for his contributions with the bat. Now he's OPS'ing over .900. And really, how much playing time would Zobrist even have seen if Akinori Iwamura did not go down?
But I want to focus on shortstops for the purposes of this article. I wrote at the beginning of the 2007 season how 2006 was just the sixth ever season in which four or more shortstops eclipsed the 120 OPS+ mark. For all of the talk of how A-Rod, Nomar, Jeter and Tejada represented the peak for shortstop productivity by posting banner season after banner season around the turn of the century, that era seems never to have gone away.
Since 1985, there have been 103 seasons of 110 OPS+ batting by MLB shortstops playing at least 90 games (a convenient cutoff given Bartlett's DL stint this year). 42 of those seasons occurred between 1985 and 1998, the first 14 of the 25 years I analyzed. From 1999 through 2009, in those eleven years there have been 61 shortstops eclipse the 110 OPS+ mark in a given season.
While their simultaneous emergence captivated baseball fans everywhere, Alex Rodriguez would eventually move to third base, Nomar Garciaparra would fall off badly and Derek Jeter began producing unspectacular but steady seasons. When Miguel Tejada regressed significantly in 2007 after three great seasons in Baltimore, it seemed the age of the high-producing offensive shortstop may have come to a close.
But now there is a new crop of shortstops, young and old, toiling in smaller markets and to much less fanfare than did Nomar and Jeter and A-Rod during their shortstop heyday. In fact, 2009 may well be the best season in baseball history for shortstop productivity. Sticking with the metric mentioned earlier, players posting 110 OPS+ and higher, only 2002 matches this season in terms of the amount of players besting the mark. In both years, seven shortstops accomplished the feat.
2002
            AVG   OBP   SLG   OPS+
A-Rod      .308  .392  .623   158
Tejada     .308  .354  .508   128
Nomar      .310  .352  .528   127
Hernandez  .288  .356  .478   120
Cora       .291  .371  .434   119
Renteria   .305  .364  .439   113
Jeter      .297  .373  .421   111
2009
            AVG   OBP   SLG   OPS+
HanRam     .351  .413  .556   154
Bartlett   .336  .391  .541   139
Tulo       .275  .360  .535   126
Jeter      .318  .387  .452   121
Escobar    .307  .374  .464   120
Scutaro    .295  .386  .441   118
Tejada     .323  .350  .463   115
A quick glance at both lists makes it pretty easy to explain why the 2009 group gets so much less publicity. The first group was still considered part of a revolutionary time in baseball, and it didn't hurt that they were largely either in huge baseball markets or playing for the best teams in the game. A-Rod, Nomar and Jeter were referred to as the Holy Trinity, Tejada came on later but grabbed headlines for the great Oakland A's teams of the turn of the century. Edgar Renteria played for St. Louis at the time, a great market with a large and attentive fanbase.
This season's group is a different story. Ramirez and Bartlett's teams have combined to draw less than the Yankees this year. Speaking of the Yankees, it seems like for once Jeter might be overlooked! Newcomers Mark Teixeira, C.C. Sabathia and A.J. Burnett are grabbing headlines as the Yankees cruise to their best season in a few years. Troy Tulowitzki is in Denver, Yunel Escobar in Atlanta, Miggy is now in Houston and the excitement directed towards Marco Scutaro at the beginning of the season seems to have faded with the hopes of the Blue Jays.
We are still in the middle of a golden era of shortstop productivity, perhaps even at the peak of it. If the Marlins and Rays make a big push and qualify for the post-season, it will have to be thanks in large part to their respective shortstops. If that happens, then maybe this crop of slugging glove-men will get their due.
| Behind the Scoreboard | August 11, 2009 |
How Best to Measure a Team's True Talent
One of the first sabermetric principles that many people learn about is how a team's winning percentage can be predicted by the number of runs scored and allowed. This Pythagorean winning percentage takes the following form: WPCT= RS^1.81/(RS^1.81 + RA^1.81). It was introduced by Bill James and is purported to detect whether a team is underperforming or playing over their heads and is billed as a better guide of a team's true talent. This concept has reached so far into the mainstream that it is even included in the MLB.com standings.
Furthermore, sabermetricians can dig deeper into a team's performance, and estimate the amount of runs that a team is expected to score or allow, based on the components of hits, walks, and outs tallied by a team or its opponents. Applying these run values to the Pythagorean winning percentage method can supposedly provide an even better guide to a team's true talent level, since even more of the variability is removed from the equation. Talking to some sabermetricians leaves the impression that W-L record should be thrown out all together and only these deeper metrics should be examined.
Hail Pythagoras?
But while some claim that the Pythagorean winning percentage or its counterparts are a better guide to a team's ability, is this actually so? This concept has been studied before, but here I take another look at it. Which one of these three metrics (WPCT, Pythagorean WPCT, and component Pythagorean WPCT) is best and is there some way to combine all three metrics to get the the best possible estimator of a team's ability?
Using retrosheet data going back to 1960, I obtained the statistics to calculate WPCT, Pythagorean WPCT, and component Pythagorean WPCT (based upon Bill James' Runs Created). I then randomly selected 25% of each team's games and calculated these metrics from these games only. From these 40 or so games, I attempted to predict the team's actual WPCT in the remaining games that were not sampled. How did each of these metrics fare?
Fitting a Model
First, using teams' regular WPCT from the sample 25% of games, we can fit a simple model to predict the teams' WPCT in the other 75% of games. To increase the power of our dataset, we can randomly draw many such 25% samples and average the outcomes. I drew 100 such random samples and ran the results. When doing so, we get the following formula:
Remaining WPCT = .363*(Current WPCT) + .319.
The RMSE of this estimate of WPCT is .0659, meaning that the winning percentage for the remaining games has a fairly wide range of outcomes - no surprise to any baseball fan. Also no surprise is the fact that the teams' WPCT over 25% of its games is regressed to .500 fairly strongly. A team playing .650 baseball over 40 games has an expected true winning percentage of just .555. The RMSE underscores the uncertainty - a 95% confidence interval has the team's true WPCT somewhere between .424 and .686.
But, does this improve at all when using the Pythagorean formula for estimating WPCT from runs scored and runs allowed? The formula for this is following:
Remaining WPCT = .440*(Pythagorean WPCT) + .280.
In this case, the teams' WPCT regresses less strongly - a team with a .650 Pythagorean WPCT has an expected true WPCT of .566 rather than .555. The accuracy is improved, but the RMSE is still .0648, only slightly better than using regular WPCT.
How about for the Component Pythagorean WPCT using Runs Created? The formula is nearly the same as that for the regular Pythagorean WPCT. It performs the best of the three methods, with a RMSE of .0643, though again, the increase in accuracy is small.
So from the above, we see that with 40 games of information, all three methods have similar accuracy, though the Runs Created Pythagorean formula fares best, and real WPCT fares the worst.
Combining All Three Metrics
How about when all three measures are used to try to predict WPCT? Putting all three measures in the model, we get the following formula:
Remaining WPCT = .103*(Current WPCT) + .094*(Pythag WPCT) + .268*(RC WPCT) + .268.
When comparing the three types of estimated WPCT's, real WPCT gets about 20% of the weight, another 20% goes to the Pythagorean WPCT, and the final 60% of the weight goes to the Runs Created Pythagorean formula. Of course, this is all regressed back to the mean as well, so that a team with a .650 WPCT in each of the three metrics would be expected to have a true WPCT of .570. The RMSE of this estimate is of course lower than each of the three measures separately, but is still high at .0638. This compared to .0659 for using WPCT alone.
What can we take from this information? We see that indeed the sabermetricians are right - a team's performance broken down into runs created components is a better gauge of a team's true talent level than just looking at a team's winning percentage alone. However, using all three metrics provides the best estimate of a team's true talent.
Much Ado?
But is all of this worth it? The increase in accuracy when looking at all three metrics is very small. Taking the expected random variability out of the RMSE, using the formula Variability in the Prediction of True Talent = RMSE^2 - Variability of WPCT by Chance, we see that the standard error of our prediction of true talent is .0450 when using the full model, while the standard error is .0479 when using WPCT alone.
This means that a 95% confidence interval around .500 would be (.410,.590) for the full model, while it would be (.404,.596) when using WPCT alone. Is this increase in accuracy really worth all of the trouble? You can make your own judgment, but I think it's fair to say that looking at a team's Pythagorean WPCT or component Runs Created WPCT doesn't necessarily tell you a whole lot more than looking at WPCT alone.
Extensions of the Model
Of course, this discussion has so far only concerned the case where the team has played just 25% of its games. What happens when the result of more of the season is known? Below is a table of model results, showing the coefficients for each metric after 25%, 50%, and 75% of the season is known respectively.
As you can see from the results above, the weights given to each metric remain relatively stable no matter how many games have been played. The WPCT estimated from Runs Created remains the metric with the most weight in the full formula, while the Pythagorean WPCT and real WPCT are about equal in importance. As we approach the 3/4ths mark of the season, we can see that when trying to assess a team based on its performance thus far, about 50% of our estimate should come from the Runs Created measure, and about 25% should be from the team's real WPCT and the team's Pythagorean WPCT respectively. The formula is as follows:
Remaining WPCT = .173*(Current WPCT) + .194*(Pythag WPCT) + .365*(RC WPCT) + .135.
This is slightly more accurate than using WPCT alone, decreasing the SE of the true talent estimate from .0399 under WPCT alone to .0365 by using the full model.
Conclusion
As I said earlier, this increase in accuracy is quite small, so this entire debate may be a matter of much ado about nothing. Someone simply looking at W-L records is apt to have nearly as good of an idea of a team's true talent as someone calculating complicated formulas. Nevertheless, it comes as no surprise that using all three measurements gives a better result than using any one of the metrics.
While the Pythagorean method may be a more accurate measure of a team's true value, it hardly makes the a team's true WPCT obsolete. Simply knowing the components that go into winning a game cannot replace the knowledge of a team's actual record. Things such as bullpen usage, managerial strategy, and player motivation are not modeled in the Pythagorean method. The results of these models show that these factors cannot be ignored and thus, a team's actual W-L record is still relevant.
| Baseball Beat | August 10, 2009 |
This Week in Baseball
In honor of This Week In Baseball, the longest running sports anthology show in the history of television, we bring you news and highlights from around Major League Baseball.
Our "TWIB Notes" begin with the just concluded series between the Boston Red Sox and New York Yankees. Whereas Boston swept New York in three games at home in April, two on the road in May, and three at home in June, the Yankees got the broom out this time and took four straight from the Red Sox at Coors Field Yankee Stadium (also known as Yankee Stadium III).
The Yankees outscored their division rivals 25-8 en route to the four-game sweep. The victories included a 13-6 pounding in the opener, two shutouts (including a 15-inning, five-hour-and-33-minutes marathon on Friday night), and a come-from-behind 5-2 win on ESPN's Sunday Night Baseball in the finale.
New York (69-42), which has now won seven in a row, has opened up a 6.5 game lead over Boston (62-48), losers of six straight, in the American League East. With six more head-to-head games on the schedule, the division is far from settled. The Red Sox play 29 of their final 52 games at Fenway Park (where the club is 35-17), while the Yankees are slated to play 26 of their remaining 51 games on the road (30-25).
Boston, however, is no sure thing for the postseason as it is tied with Texas for the Wild Card berth (with Tampa Bay only 1.5 games back). The Rangers took two out of three from the Angels over the weekend and are now just 3.5 games behind in the AL West.
With a pair of home runs, Alex Rodriguez passed Harmon Killebrew into ninth place on the all-time list with 574. He has gone deep more often than any other righthanded hitter in the history of the AL.
Speaking of long balls, Mark Reynolds has slugged eight HR in the past nine games (including four consecutive) and is now tied for the MLB lead with Albert Pujols at 36. The Diamondbacks third baseman also ranks second in the NL in SLG (.613), third in OPS (.990), fourth in RBI (80), fifth in R (75), and eighth in SB (20).
Since the All-Star break, Reynolds has put up a rate line of .407/.480/.895. Over the course of the season, he has hit equally well at home (.289/.381/.598) and on the road (.290/.372/.628). Other than Mark's MLB-leading number of strikeouts (151, which is on pace to break the single-season record he set last year), there is little to find fault in his numbers. Sure, some people will point to his .371 BABIP as being unsustainable, but do these skeptics realize that he has hit .358 on balls in play throughout his career? Let's just say he's making it work with lots of whiffs.
While on the subject of home runs and strikeouts, Adam Dunn deserves recognition for reaching 30 HR for the sixth consecutive year. He is on pace to hit 44 in 2009, which would mark the sixth straight season of slugging 40 or more. Babe Ruth holds the record with seven (1926-1932).
Adam's team is far from done as Washington (40-72) has won eight games in a row. As such, we can no longer assume that the Nationals will have the first pick in next year's draft, at least not with Pittsburgh (45-66) on an eight-game losing streak and Kansas City (43-68, including 3-9 in its last dozen contests) and Baltimore (46-65, 2-8 in the last ten) stumbling down the stretch as well.
Depending on whether Washington comes to terms with Stephen Strasburg before the signing deadline a week from today, the Nats may wind up with the first two picks in the 2010 draft (No. 1 for having the worst record and the second overall choice as compensation for not signing Strasburg). In the meantime, the clock is ticking as more than half of the first-round draftees have not signed with their new clubs as yet. Look for discussions to pick up this week but don't hold your breath waiting for many announcements prior to the deadline at 12:01 a.m. on August 18.
Question for the Day
Do you believe Strasburg will sign with the Nationals? If so, how much do you think he will get?
Scott Boras is allegedly asking for $50 million while the Nationals reportedly are trying to keep the amount closer to the all-time record of $10.5M that Mark Prior received in 2001.
| Baseball Beat | August 09, 2009 |
Talking Baseball Stats
I was a guest of Brendan Wiese and Nick Barrale of The Benchwarmers on KFNS 590 The Fan. I also appeared on their St. Louis late night sports talk show in June and July.
We discussed counting stats with an emphasis on the pros and cons of RBI. I mentioned the importance of context, opportunities, and outs.
We should be counting the number of outs. There aren't very many people out there who know who's leading the league in outs or who's leading the league in the fewest outs created. We always count things — hits, doubles, triples, home runs — but we really should be counting how often a player makes an out because a team only has 27 outs; that's the currency of baseball and giving up an out is very costly to a team. I wish we all paid more attention not only to the positive side of counting stats but the negative side as well.
I was also asked about whether players such as Derek Jeter are "clutch" (which is one of my least favorite subjects) and OPS as it relates to positions. The final ten minutes were focused on pitching stats, including strikeouts, walks, and home runs (and groundball rates). Due to the location of the radio station as well as Dave Allen's insightful piece on Friday, we examined Joel Pineiro in depth and the difference between pitching to contact and missing bats.
I like guys who strike batters out because then you don't need any defensive players behind you. But, that said, a pitcher like Joel Pineiro can succeed if he throws strikes, which he throws strikes better than anybody else in baseball this year — he's walking fewer batters than anyone else — and if he also keeps the ball on the ground. He's keeping the ball on the ground about as well as anybody else in baseball this year. Both his walk and groundball rates are career bests right now and that's why he's doing so well this year. But his margin of error is really pretty small. If Pineiro doesn't have his pinpoint control and he gets that ball up a little bit, he's going to be more apt to give up home runs, which he hasn't been giving up at all this year. I believe he's only given up three home runs all season, which is just incredible. But, in years past, for example, he has walked more batters and given up more home runs. So, if he is a little bit off, he's going to get hit because he doesn't throw pitches that miss bats.
While Wiese enjoys and appreciates advanced metrics, his sidekick is a non-believer. After we exchanged thank yous at the end of the segment, Barrale concluded with the following diatribe.
I still say you get a better idea how a guy plays and how a team plays by just watching them. You don't need all these statistical numbers. The only reason why they have them is because people can't see the games and so they try to come up with their own conclusions by just adding and subtracting and dividing and multiplying numbers.
Whatever.
The audio file can be accessed through The Daily Rewind this weekend or by clicking on the play button directly below.
Check it out.
| F/X Visualizations | August 07, 2009 |
Regression and Pineiro
Recently there has been some discussion about estimating a player’s true talent level. The idea is that a player's true talent, and how we should expect him to perform going forward, is not the player’s current level of production. Rather it is a weighted average of his current year and past production (with more recent production weighted more heavily) and then this average is regressed to league average, with the amount of regression depending on how many plate appearances (for batters) or batters faced (for pitchers) or inning played (for fielders). The details of how to do the weighting and to which population’s mean you regress are important and discussed at the Book Blog and THT.
I wanted to look at an example of a player whose current year production is far out of line from a long career of established production. Joel Pineiro leads all starters in ground ball rate, at 60.4% ground balls per ball in play. Since 2002 his GB rate ranged between 44% and 48%. In addition, Pineiro leads all starters league in BB per batter faced at 2.6%, again far out of his previous range of 5.4% to 8.5%. This is a rather huge shift in his numbers.
Here are his five pitches.
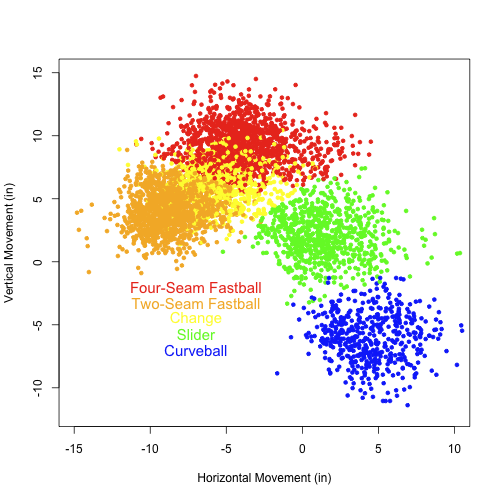
The movement on these pitches is fairly standard. It is important to note his two-seam fastball ‘sinks’ compared to his four-seam fastball. Here is the breakdown of his pitch usage over the past three years, those covered by PITCHf/x.
+--------------------+------+------+------+
|                    | 2007 | 2008 | 2009 |
+--------------------+------+------+------+
| Four-Seam Fastball | 0.54 | 0.36 | 0.11 |
| Two-Seam Fastball  | 0.03 | 0.23 | 0.60 |
| Slider             | 0.16 | 0.20 | 0.11 |
| Curve              | 0.16 | 0.09 | 0.09 |
| Changeup           | 0.11 | 0.12 | 0.09 |
+--------------------+------+------+------+
His two-seam fastball is hit on ground just under 68% of the time it is put in play, so his increased usage of that explains the jump in grounders. He gets his fastballs in the zone about 54% of the time while his breaking and off speed pitches are in the zone under 50% of the time (47% for his change, 42% for his curve and 49% for his slider). Finally batters swing at and make more contact with his fastballs than his off-speed and breaking pitches. As a result he has many fewer walks and strikeouts (he has struck out just 10% of batters the lowest rate in his career).
I think this is an interesting example in which the PITCHf/x data partially explains a recent abrupt change in numbers. Obviously we do not expect Pineiro to continue to walk under 3% of batters faced and get over 60% of his balls in play on the ground. An estimate of true talent and expectation going forward must include some weighting of past performance and regression to the mean. But I think the PITCHf/x data, just like scouting data, can be used to adjust the weighting, maybe weight this year even more heavily if we expect him to use this pitch break down going forward, or regress to different pool, one with this breakdown of pitches, to get a better estimate of his true talent going forward.
| F/X Visualizations | August 06, 2009 |
Strikeouts and Ground Balls
The main tenet of defense independent pitching theory is that pitchers can only control strikeouts, walks and the types of batted balls (grounders, fly balls, line drives, pop ups) they give up. Under such a theory the best pitchers are those who give up few walks, line drives (likely to be hits), and fly balls (likely to be HRs), while getting lost of strikeouts, pop ups (almost always outs) and ground balls (rarely extra base hits). In this short post I want to consider the relationship between strikeouts and ground balls. The holy grail of pitchers is the one who can get tons of strikeouts and ground balls, while giving up few walks. Why is this combination so rare?
In black below is the relationship between whiffs (misses per swings) and the vertical location of a four-seam fastball. Also on the graph in blue is the relationship between ground ball per ball in play and vertical location. The graph is a little hard to understand because vertical location is the independent variable so it is along the horizontal axis, and there are two dependent variables displayed at the same time. The red lines indicate the average top and bottom of the strike zone.
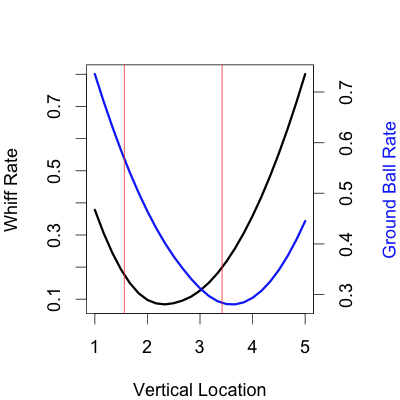
The overwhelming trend within the strike zone is for whiff rate to increase with vertical location and for ground ball rate to decrease with vertical location. This is why it is rare to find an extreme ground ball pitcher who also gets a lot of strikeouts. The one exception here is the bottom of half foot of the strike zone where ground ball rate is very high and whiff rate has bottomed out and starts to rise again. If a pitcher could regularity locate in that bottom half foot, he could get whiffs and grounders, but as I noted last Friday it is important to consider just how accurately a pitcher can locate his pitches. Most likely few pitchers could regularity hit that spot.
| Change-Up | August 04, 2009 |
Conventional Wisdom Had the Night Off
A quick one today because I was up way too late last night watching the Red Sox lose to the Tampa Bay Rays in 13 innings, but here is some of what happened last night around Major League Baseball:
Lest anyone question baseball's awesomeness, I would point you to the evening of August 4th, 2009. Baseball is fun and unpredictable, and I think it's safe to say that we are in for one hell of a stretch run over these last two months.
| Behind the Scoreboard | August 04, 2009 |
Staying Alive: Who Has the Advantage After Fouling Off Multiple 3-2 Pitches
You've probably heard your local announcer say it at one time or another after a hitter has fouled off pitch after pitch on a 3-2 count: As the at-bat is extended the pitcher has to show more of his arsenal, and the advantage shifts to the hitter. In this week's article, the last in a series which has analyzed baseball by the count, I check in to see if this is true, or if it's simply one of baseball's old wives tales.
While obviously the hitter helps himself by fouling off pitches to stay alive rather than striking out, it's unclear if a hitter really gains by extending the at-bat, or if he just puts himself back in the same position on the pitch before. I remember watching a Cubs-Dodgers game in 2004 when Alex Cora battled through an 18-pitch, 13-minute at-bat to eventually hit a home run off Matt Clement. Did Cora gain an advantage by fouling off so many pitches, or was he just as likely to hit that home run on the first 3-2 pitch of the at-bat? Or on the other hand, was his home run even more unlikely due to the mental and physical drain or fouling off so many pitches?
Who Has the Advantage?
While there aren't many data points on 18-pitch at bats, I used 2007 retrosheet data to take a look at this question (removing intentional walks and at-bats with bunt attempts, pitchouts, etc). Focusing just on the number of foul balls with a 3-2 count, I looked to see whether hitters who fouled off a lot of pitches really did fare better than those who resolved the at-bat soon after it reached 3-2. The table below shows how hitters fared after various numbers of 3-2 foul balls.
The result shows that there is some truth to the old wives tale, but does not back it up whole-heartedly. At-bats that resolved after the count first reached 3-2, made up the majority of the data. These batters hit .225 with a .465 OBP and a .373 SLG average. This was virtually identical to the numbers hitters put up when the count resolved on after one foul ball. The numbers there were .229/.461/.384.
However, we start to see the myth become reality after two foul balls. When the at-bat is resolved after two fouls, we see a dramatic increase in all three key measures, with the numbers measuring .260/.496/.432. With over 2500 PA's in the sample, this was a statistically significant difference from 3-2 at-bats that resolved earlier. The standard error of BAV and OBP is approximately 10 points. When the at-bat gets to this point, it appears that the batter does indeed gain an advantage as conventional baseball wisdom would suggest.
However, these numbers decrease again after 3 fouls, and after the 4 or more foul balls, they decrease sharply, with batters putting up a .201/.414/.312 line. In this case, only 599 plate appearances contributed to the data, so the standard error is fairly high at 20 points, making the difference from the average 3-2 count BAV not quite significant. The differences in OBP and SLG however, are significant, showing that not only does the batter not gain from a long at-bat, in fact, it is the pitcher who earns the advantage.
At this point you may be wondering if perhaps there was some sort of selection bias. Perhaps good hitters simply don't foul off pitch after pitch, so this is the reason that we see the difference results. As a matter of fact, this isn't the case. The chart below shows virtually identical overall batting averages for the hitters in each of the situations.
0 Foul Balls: .269
1 Foul Balls: .270
2 Foul Balls: .271
3 Foul Balls: .270
4+ Foul Balls: .271
If there were selection bias, we would expect there to be a different quality of hitter in each situation. Since we don't see this, we can be reasonably confident in the above results. Conventional baseball wisdom is right: Fouling off pitches does favor the hitter - but only to a point. Four or more fouls sees the pitcher re-take the advantage for the remainder of the count.
Why?
The results are basically that after two foul balls, the batter does indeed gain the advantage, but after four or more fouls, the pitcher has the edge. However, why this is the case is unclear. The pitcher "showing all of his pitches" argument could be a factor in why the hitter has the advantage after two foul balls. However, why would that advantage decrease after four fouls? Perhaps this is simply an indication that the batter is struggling against a pitcher and not getting good swings against him. Rather than being the cause of decreased plate performance, it may instead be a sign of decreased ability to get a hit. Since there are no randomized experimental trials in baseball, it's difficult to tell.
Thinking back to the Cora at-bat, I wonder if this result is not unexpected. Part of the reason his at-bat was so incredible was the fact that it went on so long, but part of it was the fact that, after all of it, he actually hit a homerun. If batters really gained the advantage during a long count, then we would not have been surprised to see a home run, or at least a hit, after so many foul balls. Instead, people were calling it an amazing and incredible plate appearance. Had Cora struck out, we likely would not have heard much about the amazing pitching performance by Clement to get a strikeout after so many of his good pitches were fouled off - in fact it feels as though the strikeout would be more expected.
This intuitive expectation is backed up by the data. The batter gains an advantage up to a point, but after four fouls or more, it's clear he is just staying alive and is more likely struggling against the pitcher rather than building an advantage. The probability of a making an out is increased and his walks and power and decreased dramatically.
| Baseball Beat | August 03, 2009 |
Analyzing the Last of the Deadline Deals
In a transaction that wasn't consummated until minutes before the trading deadline at 4 p.m. ET last Friday, the San Diego Padres sent Jake Peavy to the Chicago White Sox for Clayton Richard, Aaron Poreda, Dexter Carter, and Adam Russell.
Although the trade wasn't popular with the San Diego media, I actually understand this deal more from the perspective of the Padres than the White Sox for three reasons:
1. The Friars are rebuilding for the future and trying to load up on good, young arms that can help the club in 2010 and beyond.
2. At $52 million over the next three seasons, Peavy's contract ($15M in 2010, $16M in 2011, $17M in 2012, and a $22M club option in 2013 with a $4M buyout) was a liability for an ownership short on cash.
3. Peavy is currently on the disabled list with a strained tendon in his right ankle and not expected back until late August. The unanimous 2007 National League Cy Young Award winner threw a 50-pitch bullpen on Sunday but will need a few more such sessions and a couple of minor league starts before joining Mark Buehrle, John Danks, Gavin Floyd, and Jose Contreras in the White Sox rotation for the final five weeks or so.
Peavy is a fantastic pitcher when healthy but, like an overpriced stock, may not be a good value at this point. He is clearly worth more to a team like the White Sox than the Padres.
In the meantime, the 6-foot-5, 240-pound Richard has begun to pay dividends for his new team, allowing one run on two hits over 5 2/3 innings in his NL debut on Saturday. The former University of Michigan backup quarterback should benefit from a change in leagues and home ballparks. The soon-to-be 26-year-old lefthander throws a low-90s fastball with sinking action plus a slider and change, and figures to be a mainstay in San Diego's rotation for the next several years.
Poreda, however, was the key to this deal. A first-round draft pick out of the University of San Francisco in 2007, the 6-6, 240-pound southpaw is a hard-throwing, groundball-inducing machine. He won't turn 23 until October yet has succeeded at every level, including 10 games and 11 innings in relief for the White Sox earlier this season. Poreda has started 48 of his 52 games in the minors and will be given a long look at one of the five spots in the rotation next spring.
The most intriguing pitcher in the group may be Carter, a 6-6, 22-year-old righthander who leads the minors in strikeouts with 143 in 118 innings (10.9 K/9). A project coming out of Old Dominion as a 13th-round draftee in 2008, Carter has whiffed 232 batters in 176 2/3 IP thus far in the low minors. According to Paul DePodesta, his fastball "runs anywhere between 87 and 93 mph" and Baseball America credits him with "a swing-and-miss curveball." He is being brought along slowly and is unlikely to reach Petco Park until 2012.
Russell, 26, was converted into a reliever in 2008. At 6-8 with a mid-90s heater, he is another tall, hard-throwing pitcher. His secondary pitches and command aren't particularly special although his curveball "rates as a plus pitch at times" in the words of Baseball America. He reported to Triple-A Portland and could be brought up to the bigs for a look-see in September when the rosters are expanded.
The Padres have now made two trades during the past month that have landed them seven young power arms, including four that had pitched in the majors prior to their arrival in San Diego. In addition to Richard, Poreda, Carter, and Russell, San Diego added Sean Gallagher, Ryan Webb, and Craig Italiano in a July 5 deal that sent outfielder Scott Hairston to the Oakland A's. Although Gallagher was the PTBNL in that 3-for-1 trade, he is just 23 years old and has already pitched parts of three seasons in the majors. The righthander has a terrific minor-league record (39-17, 2.73 ERA, 8.9 K/9, 0.5 HR/9) but needs to improve his command and makeup to reach his potential.
In Peavy, the White Sox get an eight-year veteran who is only 28 years old. General manager Kenny Williams pursued him in May but was unable to convince Peavy to waive the no-trade provision in his contract. The righthander could be a difference maker down the stretch if he can get his legs back in shape and regain his arm strength. However, let's not forget that Peavy (whose career ERA is a full run lower at home than on the road) will be going from the NL to the AL and from a pitcher's park (Petco Park) to a hitter's park (U.S. Cellular Field). Think Matt Holliday when he went from the Colorado Rockies and Coors Field to the Oakland A's and McAfee Coliseum.
While it may take two or three years before the Padres are competing for division titles and wild card berths again, management is focused on building an organization with more athleticism, depth, and sustainability than before. With the foregoing in mind, look for the Padres to sign high school draft picks Donavan Tate, Everett Williams, and Keyvius Sampson in the next two weeks and possibly move Adrian Gonzalez, Heath Bell, and Chris Young during the off-season or next summer if the price is right. Fans will need to be as patient as the ownership and front office, but the change in direction is likely to pay off in due time.
(For more on the Padres, be sure to check out Geoff Young's Ducksnorts as well as Friar Forecast and Another Padres Blog. South Side Sox is our favorite White Sox blog.)