Rich Lederer • Baseball Beat
Patrick Sullivan • Change-Up
Jeremy Greenhouse • Touching Bases
Dave Allen • F/X Visualizations
Sky Andrecheck • Behind the Scoreboard
Marc Hulet • Around the Minors
Al Doyle • Past Times
Retired Uniforms:
Bryan Smith • WTNY
Joe Sheehan • Command Post
Jeff Albert • The Batter's Eye
RSS Feed
Home
*Examining the Past, Present, and Future*
Lineup Card
Recent Entries
» Putting Together a Reality Team
» Historical Hall of Fame Vote Comparisons: 2012
» An All-Christmas Team
» The New-Look Angels
» John Denny: The Forgotten Cy Young Award Winner
» Money Isn't Everything
» What Would It Take to Hit .400 in the 21st Century?
» Halos Heaven
» Brandon McCarthy's Breakout Season
» Link-o-Rama
» Historical Hall of Fame Vote Comparisons: 2012
» An All-Christmas Team
» The New-Look Angels
» John Denny: The Forgotten Cy Young Award Winner
» Money Isn't Everything
» What Would It Take to Hit .400 in the 21st Century?
» Halos Heaven
» Brandon McCarthy's Breakout Season
» Link-o-Rama
Best of Baseball Beat
Abstracts From the Abstracts
1977 Baseball Abstract
1978 Baseball Abstract
1979 Baseball Abstract
1980 Baseball Abstract
1981 Baseball Abstract
1982 Baseball Abstract
1983 Baseball Abstract
1984 Baseball Abstract
1985 Baseball Abstract
1986 Baseball Abstract
1987 Baseball Abstract
1988 Baseball Abstract
1978 Baseball Abstract
1979 Baseball Abstract
1980 Baseball Abstract
1981 Baseball Abstract
1982 Baseball Abstract
1983 Baseball Abstract
1984 Baseball Abstract
1985 Baseball Abstract
1986 Baseball Abstract
1987 Baseball Abstract
1988 Baseball Abstract
Bert Blyleven Series
Meeting Up and Hanging Out with Bert
The Results Are In And...
Aficionado Heavily Invested in Blyleven
Latest on Blyleven's Chances for the HOF
The Internet Zealot Responds
400 Down and 5 to Go...
Bert Be Home By Eleven?
Blyleven's Forgotten Season (1973)
HeyMan, Your Comments Don't Hold Water
The Waiting is the Hardest Part
Another Addition to the Blyleven Series
Search for the Truth
As Dominant as His HOF Contemporaries
Listen, Buster
A Larger Step for Blyleven
Answering the Naysayers (Part Two)
Another Small Step for Blyleven
Q&A: Blyleven on the Twins
The Majority Rules, Right?
It's All Dutch to Some
The Hall of Fame Case for Bert Blyleven
Q&A: Blyleven on Felix Hernandez
Clemens Rocketing Up Charts
Poz: An Interview With a KC Star
A HOF Chat with Tracy Ringolsby
Up Close and Personal
A Peek Into the Mind of a HOF Voter
Answering the Naysayers
It's That Time of the Year (Again)
"If Cooperstown is Calling..."
The Bert Alert
One Small Step for Blyleven...
Only the Lonely
Exclusive Interviews
Lee Sinins
Alex Belth
David Pinto
Will Carroll
Mike Carminati
Aaron Gleeman
Joe Sheehan
Jay Jaffe
Jeff Peek
Tracy Ringolsby
Joe Posnanski
Bill James Part I, II, III
Jon Lalonde
Chuck Tiffany
Dayn Perry
Fay Vincent
Nate Silver
Alex Belth
David Pinto
Will Carroll
Mike Carminati
Aaron Gleeman
Joe Sheehan
Jay Jaffe
Jeff Peek
Tracy Ringolsby
Joe Posnanski
Bill James Part I, II, III
Jon Lalonde
Chuck Tiffany
Dayn Perry
Fay Vincent
Nate Silver
Bullpen
Rich Lederer
The Odd Couple (with Alex Belth)
The MostUnder Over Underrated Player in Baseball (with Brian Gunn)
Three Wise Men (roundtable by Alex Belth)
Infrequently Asked Questions (interview with Matt Welch)
Interview (Orioles Think Tank)
Bernie and the Yanks (Bronx Banter)
Hope and Faith: How the LAA Win the World Series (Baseball Prospectus)
NL West (The Soul of Baseball)
Greatest Living Hitter? (Sports Illustrated)
Roundtable: 2008 HOF Ballot (Armchair GM)
The Most
Three Wise Men (roundtable by Alex Belth)
Infrequently Asked Questions (interview with Matt Welch)
Interview (Orioles Think Tank)
Bernie and the Yanks (Bronx Banter)
Hope and Faith: How the LAA Win the World Series (Baseball Prospectus)
NL West (The Soul of Baseball)
Greatest Living Hitter? (Sports Illustrated)
Roundtable: 2008 HOF Ballot (Armchair GM)
Patrick Sullivan
Designated Hitters
David Bromberg (Q&A: John Denny)
Mark Armour (H. Killebrew and Versatility)
Joe Lederer (Soundtrack of a Prospect)
David Bromberg (Clemente's Autograph)
David Bromberg (Woody Fryman)
D. Baumstein (WAR Against Age: Pitchers)
Doug Baumstein (The WAR Against Age)
Doug Baumstein (A Lifetime on the Road)
John Fraser (Pick Six)
Mark Armour (How to Score More Runs?)
Bill Parker (What Opening Day Tells Us)
Stan Opdyke (Pat Rispole)
Chris Jaffe (Evaluating Baseball's Mgrs)
Stan Opdyke (Baseball Radio in NYC, 1953)
A. Nathan (Performance of Baseball Bats)
Michael Weddell (Edgar Martinez/HOF)
Jon Weisman (100 Things Dodgers Fans...)
Stan Opdyke (Connie Mack and Vin Scully)
Eric Walker (Evaluating Run Production)
Brent Mayne (The Intangibles of Catching)
Chris Moore (Best Fastballs in Baseball)
Dave Baldwin (The Batter’s Brain)
Shawn Haviland (Ivy League to MLB)
Larry Granillo (Walking Off)
Rob Iracane (Solo HR Won't Break You)
Tommy Bennett (Charm of AM Radio)
Harry Pavlidis (Johan Santana's Fast Start)
John Walsh (WAR and Remembrance)
Eric Walker (Precisely Inaccurate)
Bob Timmermann (As They See 'Em)
Geoff Young (Unicycles and Delusions)
Baseball Analysis at Tufts (Groundballers)
Baseball Analysis at Tufts (GB Out Rates)
G. Rybarczyk ('09 Hit Tracker Projections)
Joe Lederer (Curt Schilling/HoF)
Conor Gallagher (Hall of Fallacies)
Chris Green (Jim Rice, HoF, the Numbers)
Shawn Hoffman (Baseball's Bear Mkt?)
Paul Anthony (Manny Syndrome)
Ross Roley (World Series Odds)
B. Timmermann (Catcher's Interference)
R.J. Anderson (Waiting the Hardest Part)
Maury Brown (Cubs, MLB, and Cuban...)
Myron Logan (Dee-Fense, Dee-Fense)
Craig Calcaterra (Frivolity, Part I, Part II)
Chad Finn (Ode to Baseball Cards)
David Cameron (Mariners Foibles)
Chris Dial (Chipper Jones)
Pat Lederer (Memory Lane)
David Appelman (Clutch Pitching)
Bob Rittner (DH)
Jonathan Mayo (Roger Clemens)
Lisa Winston (My Son-in-Law...)
Russ McQueen (The Yellow Hammer)
Bob Rittner (I'm OK, You're OK)
Mark Armour (In Defense of the HOF)
Pat Jordan (Friends)
Dan Levitt (Analysis of Terry Ryan)
Doug Baumstein (Trading Econ 101)
Ross Roley (Runner's Reluctance II)
Ross Roley (Runner's Reluctance I)
Mark Armour (No-Longer Lovable Sox)
Bruce Regal (Stealthy and Wise)
Brian Gunn (Roid Monster)
Current/McEvoy (Value of the SB)
John Rickert (Sinister Thefts)
Nate Silver (Sabermetrics)
David Vincent (Home Run Production)
Joe P. Sheehan (Enhanced Gameday II)
Mark Armour (An Ode to Sport)
David Gassko (All-Time Worm Burners)
Joe P. Sheehan (Enhanced Gameday)
John Walsh (When Titans Clash)
Fox/Williams (Quantifying Coaches II)
Fox/Williams (Quantifying Coaches I)
Jacob Luft (Bull Durham Rant)
Chad Finn (Strat-O-Matic)
Lisa Winston (Rotisserie Baseball)
Dave Studeman (Baseball Stats)
Steve Treder (Roger Craig)
Marc Normandin (Jeff Bagwell)
D. Appelman (Expanding Strike Zone)
Jeff Sackmann (Worst MiL Defenders)
Jeff Sackmann (Best MiL Defenders)
Maxwell Kates (Van Lingle Mungo)
David Appelman (Pitch Location)
Kent Bonham (Danny Ray Herrera)
Glenn Stout (Two Baseball Poems)
Bruce Regal (The Challenge Round)
Mark Lamster (Barry & Ty)
Geoff Young (NL West)
Tom Lederer (The Ryan Express)
Brian Erts (Great Leap Forward)
David Pinto (Parity and the N.L.)
Jacob Luft (Fathers and Daughters)
Jamey Newberg (Pete's Sake)
Jeff Albert (A. Jones Swing Analysis)
Jeff Albert (A-Rod Swing Analysis)
Keith Law (Death, Taxes, and Waivers)
Peter Abraham (Tales of Torre Tales)
Larry Borowsky (Let 'er Rip II)
Dan Levitt (Empirical Analysis of Bunting)
Jonah Keri (If I Met Warren Cromartie...)
Bob Klapisch (War Stories)
Bob Timmermann (John F. Kennedy HS)
Kent Bonham (Aluminum Adjustments)
Al Doyle (More Than Superstars)
Ross Roley (Instant Replay)
David Vincent (Barry Bonds Homers)
Chad Finn (Our Favorite Obscurities)
Bill Deane (1979 NL MVP)
Mark Armour (Rise/Fall of Artificial Turf)
Jeff Angus (Wally Moon Camp)
David Berri (Money and Baseball)
Larry Borowsky (Baseball w/o the #s)
Derek Zumsteg (The Irrational Market)
David Regan (Free Agent Contracts)
Peter Schmuck (Steroids and the HOF)
David Appelman (Pitchers, Pitch by Pitch)
Dan Fox (Swinging, Taking, Fouling, Etc)
Patrick Sullivan (Study of NYY CF/BOS LF)
Will Leitch (Baseball Journalism)
Jeff Sullivan (Pitcher Release Points)
Steve Treder ('69-'70 Giants)
Maury Brown (Charlie Finley)
John Brattain (Bob Johnson)
Bob Klapisch (The Case for Bert Blyleven)
Jeff Peek (Pride and Prejudice)
Dayn Perry (Bert and Warren)
Rob Neyer (If Don Sutton Was Great...)
Lisa Winston (Minor League Memories)
Alex Belth (Otis Redding Was Right)
David Cameron (Long Live the King)
Jeff Angus (Baserunning Study)
Bert Blyleven (Baseball Playoffs)
Boyd Nation (Not a Prospect List)
James Click (Batters-Baserunners Study)
Jeff Shaw (Why I Love Baseball)
David Gassko (BIP/BFP Fielding Study)
Jay Jaffe (Milwaukee Sausage Race)
Jamey Newberg (Remember When)
Bob Klapisch (Press Box to the Mound)
Dan Levitt (Predictive Value of BB)
David Vincent (Official Scorer)
Jon Weisman (Rick Monday)
Larry Borowsky (Let 'er Rip)
Will Carroll (Fictional Short Story)
Bob Timmermann (Japanese Baseball)
Cyril Morong (Best Pitching Seasons)
Sean Forman (Monte Carlo Win-Loss)
Brian Gunn (My Little Blue Book)
Joe Lederer (My Dad and Baseball)
Bill Deane (Bob Gibson, 1968)
Mark Armour (1977 Yankees)
Darren Viola (Retrosheet)
David Pinto (RFK)
Dayn Perry (Brave Heart)
Matt Welch (Dave Hansen)
Kevin Kernan (Jack McKeon)
Tom Lederer (Dodgers Road Trip)
Steve Lombardi (Slider)
Studes (Picturing Baseball)
Mike Carminati (Luck of the Drawl)
Eric Neel (Vin Scully)
J.C. Bradbury (Leo Mazzone)
John Sickels (Bill James)
Search Baseball Analysts
Archives
By Category:
Around the Majors Content Only
Around the Minors Content Only
Baseball Beat Content Only
Baseball Beat/Change-Up Content Only
Baseball Beat/WTNY Content Only
Behind the Scoreboard Content Only
Change-Up Content Only
Change-Up/Around the Majors Content Only
Command Post Content Only
Crunching the Numbers Content Only
Designated Hitter Content Only
F/X Visualizations Content Only
Past Times Content Only
Saber Talk Content Only
The Batter's Eye Content Only
Touching Bases Content Only
Weekend Blog Content Only
WTNY Content Only
By Month:
February 2012
January 2012
December 2011
October 2011
September 2011
August 2011
July 2011
June 2011
May 2011
April 2011
March 2011
February 2011
January 2011
December 2010
November 2010
October 2010
September 2010
August 2010
July 2010
June 2010
May 2010
April 2010
March 2010
February 2010
January 2010
December 2009
November 2009
October 2009
September 2009
August 2009
July 2009
June 2009
May 2009
April 2009
March 2009
February 2009
January 2009
December 2008
November 2008
October 2008
September 2008
August 2008
July 2008
June 2008
May 2008
April 2008
March 2008
February 2008
January 2008
December 2007
November 2007
October 2007
September 2007
August 2007
July 2007
June 2007
May 2007
April 2007
March 2007
February 2007
January 2007
December 2006
November 2006
October 2006
September 2006
August 2006
July 2006
June 2006
May 2006
April 2006
March 2006
February 2006
January 2006
December 2005
November 2005
October 2005
September 2005
August 2005
July 2005
June 2005
May 2005
April 2005
March 2005
February 2005
January 2005
December 2004
November 2004
October 2004
September 2004
August 2004
July 2004
June 2004
May 2004
April 2004
March 2004
February 2004
January 2004
December 2003
November 2003
October 2003
September 2003
August 2003
July 2003
June 2003
Reference
Organizational Stats
Arizona Diamondbacks Bat / Pitch
Atlanta Braves Bat / Pitch
Baltimore Orioles Bat / Pitch
Boston Red Sox Bat / Pitch
Chicago Cubs Bat / Pitch
Chicago White Sox Bat / Pitch
Cincinnati Reds Bat / Pitch
Cleveland Indians Bat / Pitch
Colorado Rockies Bat / Pitch
Detroit Tigers Bat / Pitch
Florida Marlins Bat / Pitch
Houston Astros Bat / Pitch
Kansas City Royals Bat / Pitch
Los Angeles Angels Bat / Pitch
Los Angeles Dodgers Bat / Pitch
Milwaukee Brewers Bat / Pitch
Minnesota Twins Bat / Pitch
New York Mets Bat / Pitch
New York Yankees Bat / Pitch
Oakland Athletics Bat / Pitch
Philadelphia Phillies Bat / Pitch
Pittsburgh Pirates Bat / Pitch
St. Louis Cardinals Bat / Pitch
San Diego Padres Bat / Pitch
San Francisco Giants Bat / Pitch
Seattle Mariners Bat / Pitch
Tampa Bay Devil Rays Bat / Pitch
Texas Rangers Bat / Pitch
Toronto Blue Jays Bat / Pitch
Washington Nationals Bat / Pitch
All-Star Links
Official Websites
News and Notes
Baseball News Blog
Baseball Newstand
ESPN Baseball
Fox Sports Baseball
Pro Sports Daily
Roto World
The Roto Times
USA Today Baseball
Baseball Newstand
ESPN Baseball
Fox Sports Baseball
Pro Sports Daily
Roto World
The Roto Times
USA Today Baseball
Reference and Analysis
Baseball Almanac
Baseball America
Baseball Archive
Baseball Contracts
Baseball Cube
Baseball Graphs
Baseball Library
Baseball Musings Player Database
Baseball Page
Baseball Primer
Baseball Prospectus
Baseball Reference
Baseball Statistics
Baseball Truth
Boxscore Central
Diamond Mind Baseball
Doug's Stats
FanGraphs
Fast Balls (pitchfx catalog)
Hardball Dollars
Hardball Times
Hit Tracker
Retrosheet
Rotobase/Rotoblog
Stat Corner
STATS
Tango on Baseball
Yahoo Sports MLB
Web Gems
Bill James Primer
Sabermetric Manifesto (Grabiner)
Pitching and Defense (McCracken)
Pitching and Defense (Tippett)
Transactions Primer (Neyer)
Baseball Stats (Batter's Box)
Prospect Report (Cameron)
Pitcher Workloads (Sheehan)
Goodbye to Old Baseball Ideas (Rickey)
Sabermetric Manifesto (Grabiner)
Pitching and Defense (McCracken)
Pitching and Defense (Tippett)
Transactions Primer (Neyer)
Baseball Stats (Batter's Box)
Prospect Report (Cameron)
Pitcher Workloads (Sheehan)
Goodbye to Old Baseball Ideas (Rickey)
Columnists
Baseball Blogs
Around the Majors
Athletics Nation
Baseball Crank
Baseball Musings
Baseball-Reference Blog
Batter's Box
Big League Stew
Bronx Banter
Catfish Stew
Cub Town
Dan Agonistes
Dodger Thoughts
DRays Bay
Ducksnorts
Futility Infielder
Halos Heaven
Inside the Rockies
It Might Be Dangerous
Knuckle Curve
LoHud Yankees Blog
Lookout Landing
Management by Baseball
Metaforian
Metsgeek
Mike's Baseball Rants
Only Baseball Matters
Redbird Nation
Red Reporter
Sabernomics (Braves)
Seth Speaks
ShysterBall
6-4-2 (Angels/Dodgers)
The Book
TheCubdom
The Cutting Edge
The House That Dewey Built
The View From The Bleachers
Tiger Blog
U.S.S. Mariner
Viva El Birdos
Where's Kernan
Minor Leagues
Arizona Fall League
BA Player Finder
Cal Leaguers
Jamey Newberg
JDM's Scoresheet Baseball
Minor League Baseball
Minor League Park Factors
Minor League Splits
No Pepper
Sickels' Minor League Ball
Warm October Nights
BA Player Finder
Cal Leaguers
Jamey Newberg
JDM's Scoresheet Baseball
Minor League Baseball
Minor League Park Factors
Minor League Splits
No Pepper
Sickels' Minor League Ball
Warm October Nights
Amateur
Boyd's World (College)
Cape Cod Baseball League
College Baseball Blog
College Baseball Insider
Collegiate Baseball Newspaper
College Splits
College Splits Blog
Dirtbags Baseball (Long Beach State)
NCAA Baseball
NCBWA
Team One Baseball (High School)
Texas A&M & Baseball
Cape Cod Baseball League
College Baseball Blog
College Baseball Insider
Collegiate Baseball Newspaper
College Splits
College Splits Blog
Dirtbags Baseball (Long Beach State)
NCAA Baseball
NCBWA
Team One Baseball (High School)
Texas A&M & Baseball
Historical
Cuban Baseball
House of David
Jim "Mudcat" Grant's Web Page
Negro League Baseball Players Assoc
Negro Leagues Baseball Museum
1919 Black Sox
Pacific Coast League
Philadelphia Athletics Historical Society
Shoeless Joe Jackson Society
SABR-L Archives
Walter O'Malley
House of David
Jim "Mudcat" Grant's Web Page
Negro League Baseball Players Assoc
Negro Leagues Baseball Museum
1919 Black Sox
Pacific Coast League
Philadelphia Athletics Historical Society
Shoeless Joe Jackson Society
SABR-L Archives
Walter O'Malley
Miscellaneous
Forums
Credits
Ticket Center
Tickets to Baseball -
Premium Red Sox Tickets - Tickets to Marlins Games - Cardinals Game Tickets - NY Yankee Tickets - Tickets Oakland Athletics - Dallas Cowboys Tickets - Arizona Cardinals Tickets - Tickets Seattle Seahawks - Buffalo Bills Tickets Online - Tickets to Dolphins Football
Buy Boston Red Sox tickets,
Philadelphia Phillies tix,
NY Yankees tickets,
NY Mets tickets, and
MLB All Star game tickets at ABC tickets
Not sure where to find the best online sportsbooks? Start your search with PlayersJet.
Get deals at SportsMemorabilia.com on baseball apparel, including Phillies jerseys and more for adults and children.
Shop the largest selection baseball equipment on sale at Sports Unlimited. Check out tons of baseball gloves, youth baseball gloves and catchers gear from Rawlings, Wilson, Nike & Under Armour.
2011 Draft Order
Courtesy of Baseball America
First-Round:
 1. Pirates (57-105)
 2. Mariners (61-101)
 3. Diamondbacks (65-97)
 4. Orioles (66-96)
 5. Royals (67-95)
 6. Nationals (69-93)
 7. Diamondbacks (for B. Loux)
 8. Indians (69-93)
 9. Cubs (75-87)
10. Padres (for Karsten Whitson)
11. Astros (76-86)
12. Brewers (77-85)
13. Mets (79-83)
14. Marlins (80-82)
15. Brewers (for Dylan Covey)
16. Dodgers (80-82)
17. Angels (80-82)
18. Athletics (81-81)
19. Red Sox (from DET for Martinez)
20. Rockies (83-79)
21. Blue Jays (85-77)
22. Cardinals (86-76)
23. Nationals (from CWS for Dunn)
24. Rays (from BOS for Crawford)
25. Padres (90-72)
26. Red Sox (from TEX for Beltre)
27. Reds (91-71)
28. Braves (91-71)
29. Giants (92-70)
30. Twins (94-68)
31. Rays (from NYY for Soriano)
32. Rays (96-66)
33. Rangers (from PHI for Lee)
Supplemental First Round:
34. Nationals (Dunn)
35. Blue Jays (Downs)
36. Red Sox (Martinez)
37. Rangers (Lee)
38. Rays (Crawford)
39. Phillies (Werth)
40. Red Sox (Beltre)
41. Rays (Soriano)
42. Rays (Balfour)
43. Diamondbacks (LaRoche)
44. Mets (Feliciano)
45. Rockies (Dotel)
46. Blue Jays (Buck)
47. White Sox (Putz)
48. Padres (Garland)
49. Giants (Uribe)
50. Twins (Hudson)
51. Yankees (Vazquez)
52. Rays (Benoit)
53. Blue Jays (Olivo)
54. Padres (Torrealba)
55. Twins (Crain)
56. Rays (Choate)
57. Blue Jays (Gregg)
58. Padres (Correia)
59. Rays (Hawpe)
| Change-Up | August 31, 2010 |
Everybody Try & Relax
This article is cross-posted at Red Sox Beacon, a site I started with Baseball Prospectus writer Marc Normandin. We're not sure where it will go but for now it's just a repository for a handful of us to jot down our thoughts on the Boston Red Sox. I will still be contributing here at least every Wednesday, and occasionally on weekends as well.
=========
Fresh off a series loss in St. Pete and with their playoff chances inching from slim towards none, there is a new narrative taking hold here in Boston . It's difficult to follow but the best I can boil it down to is "The Red Sox knew this was a ‘bridge year’ all along and are not going for it.” Those who hold this belief - ostensibly at least - point to the lack of deal-making at the deadline and to Theo Epstein's terribly misunderstood "bridge year" remark before the beginning of the year. That the team continues to rely on the likes of Daniel Nava and Darnell McDonald to claw back into the most competitive division in baseball means the front office is content to let the season slip away, or so it goes. Some examples:
At any point, to blame it all on the injuries is rather elementary and downright blind.
Fenway Park has gone from among the most fashionable places to be seen to just another ballpark, and the timing could not be worse for a Red Sox administration that might have been planning for another lean year.Seriously, might not that be, above all else, the reason the Sox put in a claim for Johnny Damon? The Sox lack star power. The Sox lack appeal.
Joe Haggerty’s Twitter feed, August 28th
Hawpe is just an example. The main point is that the #redsox lack of movement toward any players = not going for it
Chris Gasper, who basically took to Boston.com to throw a temper tantrum yesterday
Last night's defeat at Tropicana Field and the series weren't just lost over the weekend. They were lost in the last month, when fatal flaws went unfixed by the front office. While teams like the San Diego Padres (Ryan Ludwick and Miguel Tejada) and Minnesota Twins (Matt Capps and Brian Fuentes) have addressed needs, the Sox have preferred to stand pat and apply internal patches. The Padres and Twins look playoff-bound, the Sox do not.
Actions speak louder than words. Francona's actions tell the tale of a team that waited for reinforcements from its front office that never came.
Dan Shaughnessy in today’s Boston Globe
It’s not like they didn’t warn us. Remember Theo’s comments in December about the “bridge period’’? He said that’s not what he really meant, but it was a moment of truth. The reality is the Sox figured they were in for a soft season.
A number of reactions come to mind as I read mainstream writing along these lines, but the first is to spell out exactly what the Red Sox have been through this year. Let's start with the obvious. Dustin Pedroia and Kevin Youkilis, conservatively, are two of the 20 best position players in baseball. They’re probably two of the 15 best and possibly both top-10. Combined, they’ve missed 85 games in 2010. Imagine if the Brewers were without Prince Fielder and Ryan Braun, the Rays without Carl Crawford and Evan Longoria, or the Yankees without Robinson Cano and Mark Teixeira. You could stop right there and forgive the Red Sox for merely being a .565 team playing in baseball’s (sports’?) toughest division.
Of course the story of Boston’s misfortune runs much deeper. Jacoby Ellsbury, an established 3-win player entering his 26-year old season, has played in just 18 games. Victor Martinez, one of the best catchers in all of baseball, has missed 33 games. Since health is a skill, it’s hard to get too upset about Mike Cameron’s plight in 2010, but nonetheless the fringe Hall of Fame candidate who was coming off consecutive 4+ win seasons according to Fangraphs, has not been healthy all year long. At 37, some durability issues could be expected, but Cameron has managed just 180 largely ineffective plate appearances.
On the performance side, key Sox players have struggled. Josh Beckett has been terrible in his limited action this year. John Lackey has not pitched nearly as well as he is capable. J.D. Drew has managed a couple of hot streaks but he has not been able to piece together a typical Drew offensive season despite remaining healthy as his teammates fall all around him.
The Red Sox have endured as much adversity as any team in baseball. Just a few of the items mentioned above breaking their way and Boston’s in the thick of this race. This was a bridge year in the sense that Boston needed to ink some veterans to short contracts in order to remain a top-flight team while they waited for their youngsters to develop. Marco Scutaro, Cameron and Beltre all fall into this camp, but how do any of those signings indicate that Boston's front office thought they would have a soft year? They would probably be baseball’s best team with any luck at all in 2010. I look at the 2003, 2004 and 2007 clubs and I don't know - I think this may have been the very best Red Sox roster of the Theo Epstein era. This team was designed to compete and all year long, it has.
But that first point – that the Red Sox intended to try to win the World Series all along - is only partially responsive to the complaints circling the Boston airwaves and filling the broadsheets. The notion that they’re not “going for it” by failing to make trades is preposterous on its face. Whom would you like to have seen the Red Sox acquire?
If only the Red Sox had managed to get Brad Hawpe, then at least they’d be making a go of it. Had the Red Sox traded for bats like Ludwick or Tejada, then at least we’d know they were serious. Their bullpen has been so bad. How could they NOT add Matt Capps or Brian Fuentes. And for goodness sake, things have become so dour down in the baseball ops offices, the marketing folks are now calling the shots. How else to explain the attempt to acquire Johnny Damon?
It’s hard for me to unravel the logic of these complaints but for our purposes, let’s consider the Los Angeles Dodgers. On July 31st, they sat 5.5 games out of a playoff spot, just like the Red Sox. Ned Colletti was aggressive, acquiring Ted Lilly, Ryan Theriot and Octavio Dotel at the deadline for a number of promising pieces in the Dodgers farm system and a couple of established Big Leaguers. For the short-term, the moves have worked out really nicely. Theriot has managed a 109 OPS+ as a Dodger, and Lilly is 5-1 since arriving on the west coast. Dotel has been spotty at times, but he’s only tossed 11 innings.
So the Dodgers made moves and were rewarded with very good productivity from their new acquisitions. Meanwhile, the Red Sox did virtually nothing at the deadline. After looking at potential moves – say Scott Downs for Casey Kelly as an example – the Red Sox decided that the market just wasn’t shaping up the way it would need to in order to compel them to deal. A month later, LA’s playoff odds have dwindled to 4% while the Red Sox chances are also slim, but still two times that of the Dodgers. Making trades for the short-term guarantees nothing.
But even when the Red Sox gave it an honest shot with the Johnny Damon waiver claim, they were not insulated from this line of attack. Damon chose not to join the club, but you can’t say the Red Sox have not been active. But folks like Mazz claim that the Damon attempt was driven by the business side of things, since, you know, the Red Sox aren't really going for it. I’m still waiting for any actual reporting on the subject. It’s speculation, and flies in the face of how the Red Sox have operated under John Henry's ownership group. Baseball Ops has total autonomy once made aware of their budget.
Boston is on pace to win 92 games in 2010. This despite as bad a non-New York Mets injury season as I can recall. Oh, those poor 2009 New York Mets. After winning 89 games in 2008, they had high hopes last year. Like the Red Sox, they got crushed by the injury bug, losing Jose Reyes, Carlos Beltran and Johan Santana among others. Unlike the Red Sox, they won 70 games.
I understand that you have to fill space in newspapers but the simple explanation for the 2010 Boston Red Sox is “shit happens.” It’s unsatisfying, but it’s the truth. They had a plan, assembled a great roster and on any number of fronts they’ve run into just awful luck. 92 wins might cut it in any other division in baseball, but in the AL East it means you might not qualify for the playoffs. And as a result, while Kevin Youkilis looks on in a splint and Dustin Pedroia gets set for surgery, an entitled, spoiled, silly media gets to spend the final month of the season grasping at straws assigning ex post facto blame as to why the Red Sox didn’t win a handful more games.
| Baseball Beat | August 30, 2010 |
A Good Story (Even If It May Not Be True)
Let me preface today's post by stating that I love a good baseball story as much as the next fan. But I've developed a pretty good b.s. detector over the past 50-plus years. I can usually separate the fiction from the facts. My antennae tend to go up when I hear a former player recall an incident from long ago.
On Friday, August 27, the Cincinnati Reds were hosting the Chicago Cubs. I was watching the game via MLB Extra Innings. I'm not sure why I even had the game on other than to keep tallies on Joey Votto, who is on my fantasy baseball team.
With the Reds beating the Cubs 6-1 in the bottom of the sixth and Thomas Diamond facing Ramon Hernandez, play-by-play announcer Thom Brennaman asks color analyst Jeff Brantley a question out of the blue. "Cowboy, do you remember the first home you gave up as a major league pitcher? Do you remember who hit it? Do you remember the year?"
Brantley laughs, "Oh, yeah," but doesn't answer quickly. Brennaman interjects, "Let's start off with the easy part: the year." Brantley says, "The year was '88." Brennaman responds, "You're one for one." He offers Brantley a hint by saying "the guy at the time was playing for the Montreal Expos." Brantley guesses Delino DeShields. Brennaman gives him a hard time and basically hands him the answer by telling Brantley it was a slugging first baseman. Brantley asks, "Andres Galarraga?" Brennaman then chimes in, "You got it."
That discussion was all fine and dandy. No reason to question the truth here. I figured Brennaman or a staff member looked up that piece of trivia before the game. The good stuff immediately followed when Brantley proceeded to spin a tale about another home run he allowed.
Brantley: The one that I remember the most was the home run by Eddie Murray and the reason I remember it the most is because I had thrown him a split-finger on the first pitch and he swung and missed it by a mile. I mean, he looked like a clown, and I thought this guy was, like, really good.
Brennaman: (Laughing) He was pretty good.
Brantley: Yeah, and I'm thinking to myself, 'This guy just missed my pitch by a mile.' Terry Kennedy, our catcher at the time, came to the mound and he said, 'Don't throw him that pitch again.' I said, 'Why not?' I said, 'He just missed it by a mile.' He goes, 'He's going to be sitting on it.' So I threw him a bunch of fastballs and he kept fouling them off, fouling them off. Kennedy kept calling fastball. I was like, 'Forget that. This guy's not gonna hit another split-finger.' I threw it and he hit it in the upper deck in Candlestick. The upper deck.
Brennaman: That's a long home run.
Brantley: Oh my gosh.
Brennaman: Was that in '88 as well?
Brantley: No, that was in '89. I learned that one. But I learned a very valuable lesson that day.
Here is the two-and-a-half-minute clip of the foregoing conversation:
As it turns out, the valuable lesson Brantley learned that day wasn't about telling the truth. Instead, I presume he never threw Murray another split-finger again. Maybe. You see, while Brantley gave up a home run to Murray at Candlestick Park in 1989, he didn't get Steady Eddie to look like a clown by swinging and missing a split finger. Nor did Terry Kennedy come out to the mound and tell Brantley not to throw that pitch again.
How do I know, you ask? Well, thanks to Retrosheet and Baseball-Reference.com, we can look up exactly what took place on that Saturday afternoon. A fact-finding mission moments after Brantley finished his tall tale detailed the real story. It's not quite as interesting as the one Brantley told.
Brantley indeed got ahead in the count. However, the first pitch wasn't a split-finger that Murray missed by a mile. Rather, it was a *called* strike. It's pretty tough to look like a clown when you don't even swing at the pitch. But, hey, it makes for a nice story 21 years later.
Murray fouled off the second pitch. Score one for Brantley. That said, Brantley didn't throw him "a bunch of fastballs," nor did Murray keep "fouling them off, fouling them off." Heck, Brantley only threw him three pitches. A called strike, a foul ball, and the offering that Murray presumably hit into the upper deck. Murray did slug a home run. That's not being questioned. And, for all I know, he may have hit one of Brantley's split-finger pitches. And it may have landed in the upper deck. Who knows at this point?
Just a matter of not recounting the type and number of pitches? Well, not really. Terry Kennedy didn't even play that day. Kirt Manwaring started and played the entire game at catcher. As a result, there is no way that Kennedy "came out to the mound" and told Brantley not to throw that split-finger again. If the truth be told, it was this bit of information that led me to question what happened. Look, why in the world would Kennedy (or Manwaring, for that matter) take a trip to the mound to tell his pitcher not to throw the same pitch that the batter had just swung and missed by a mile while looking like a clown? It doesn't make sense. In other words, it didn't pass the "smell test."
I don't know if anybody else caught this gaffe. More than anything, it reminds me just how valuable it is to access old box scores, as well as play-by-play and pitch summaries. Thank you, Retrosheet. Thank you, Baseball-Reference.com.
And thank you, Jeff Brantley. Nothing like some good ol' Cowboy folklore.
| Change-Up | August 25, 2010 |
Aging Players - Bargains for 2011?
Back in January, before the start of the season but after much of the hot stove dust had settled, Dave Cameron wrote about how aging players represented a new inefficiency in the market. Consider the deals players like Ricky Romero, Brian McCann, Ervin Santana, Robinson Cano and Dustin Pedroia have signed, and it’s evident that many teams are looking to sign their key players pre-arbitration. Standout players like C.C. Sabathia, Mark Teixeira and Johan Santana entering their free agent years for the first time are paid lucratively too, of course. But Cameron notes that older players who may have already played out one big contract are too easily overlooked.
Teams have become cautious with the contracts they give to aging players, not wanting to get burned paying too much to a guy who may end up not having anything left in the tank, but I feel like we’re passing the point of caution and shifting towards a market failure. If a guy is a good player at 35, you should not expect him to be useless at 36. Yes, you regress his projection for aging, but players who go from good-to-terrible in a single season are the exception, not the rule.
Aubrey Huff, a 33-year old with “old guy” skills, hit .241/.310/.384 last season. This season, he’s been one of the best players in baseball, hitting .301/.394/.534 in one of the worst hitting environments in baseball. Huff had earned the entire $3 million the Giants paid him for the 2010 year with April and May’s output alone. The Twins continue to enjoy a monster season from Jim Thome, who’s earning just $1.5 million for the 2010 campaign.
Incidentally, both players will once again be free agents for the 2011 season, and so too will a number of other aging players who still likely have productivity left in them. Some will flop badly of course, but isn’t that the nature of the free agent market more generally? There may be more risk associated with older players, but it seems exceedingly “priced in” as compared to younger guys on the market.
We’ll leave the pitchers aside for the moment, and just take a look at some of the position players that will be hitting the market. We’re not talking Jayson Werth and Carl Crawford here, the guys that are likely to break the bank and project as shoo-in productive Big Leaguers for years to come. No, we’re talking guys like Thome and Huff, players who may or may not be worth a flier. And we’ll also include the likes of Adrian Beltre and Derek Jeter. They may not come cheaply, but the risk/reward still may skew in the team’s favor nonetheless. I will list their 3-year (2008-2010) B-Ref WAR totals, along with their age.
| Player | Age for 2011 Season | 2008-2010 B-Ref WAR |
|---|---|---|
| Lance Berkman | 35 | 10.8 |
| Derek Jeter | 37 | 10.5 |
| Manny Ramirez | 39 | 10.3 |
| Johnny Damon | 37 | 10.2 |
| Adrian Beltre | 32 | 9.4 |
| Aubrey Huff | 34 | 6.9 |
| Paul Konerko | 35 | 6.5 |
| Victor Martinez | 32 | 6.0 |
| Jim Thome | 40 | 5.1 |
| Mark Ellis | 34 | 5.1 |
| Brandon Inge | 34 | 4.6 |
| David Ortiz | 35 | 4.1 |
| Magglio Ordonez | 37 | 4.1 |
| Vladimir Guerrero | 36 | 3.9 |
| Alex Gonzalez | 34 | 3.9 |
| Hideki Matsui | 37 | 3.8 |
| Pat Burrell | 34 | 2.4 |
| Adam LaRoche | 31 | 1.5 |
Some of these players will make for excellent values, some will be overpaid, but it’s likely that a number of these guys will make a huge difference for their teams in the coming years. The challenge for GM’s is to figure out how to allocate resources to aging players. Do the Yankees have to go all in for Jeter? What’s Scott Boras going to get for Beltre? Can Thome do it again next year? What does Berkman have left? Manny would make for a productive DH, no?
Says here that teams brave enough to play in this market, on average, will see more ROI than elsewhere.
| Touching Bases | August 24, 2010 |
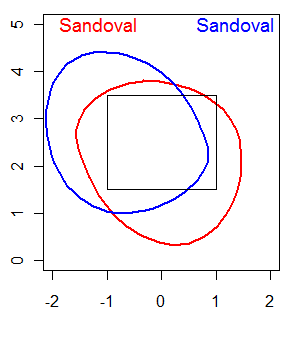
Contrasting Swing Zones
One of my favorite players in baseball is a gritty corner outfielder who plays for my hometown team, and although fans derided him as a backup during the off-season, he's proven the doubters wrong so far by playing in 116 games in spite of his lack of power and ridiculed style of hitting. I decided to compare him to Brett Gardner.
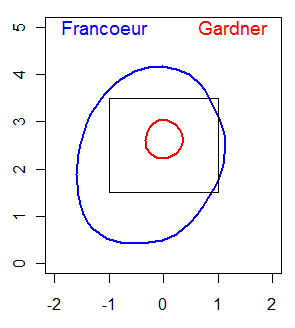
What you see above are the players with the highest swing rate in the league (60.9%) and the lowest (31.1%). The contour lines indicate the area inside which each batter is 50% likely to swing at a pitch. This means that a pitch that might hit Jeff Francoeur's knee, and he's as likely to swing at it as a pitch right down the pipe to Gardner.
These graphs are all from the catcher's point of view, and the handedness of the batter is indicated by which side his name is on.
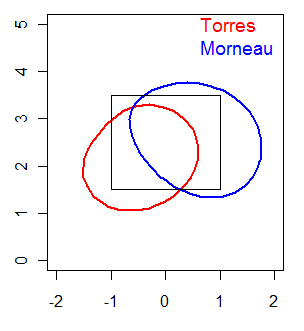
Finding players who have the biggest and smallest swing zones is the easy part. What about inside/outside? For interesting left-handed hitters, that's Andres Torres and Justin Morneau who differ most sharply.
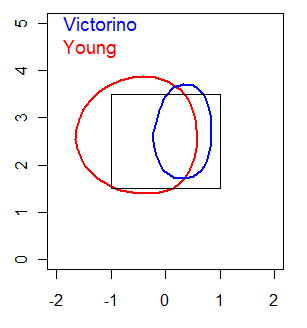
As for righties, Michael Young and Shane Victorino are notable. Victorino, like Torres, is a switch-hitter, but I only included pitches when they were batting from the relevant side of the plate.
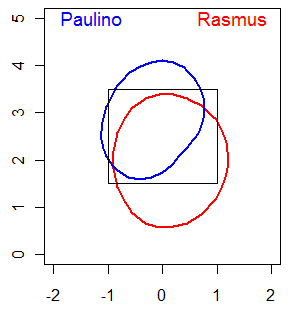
I was surprised to learn that Colby Rasmus extends his 50-50 swing zone a foot below the strike zone. Ronny Paulino hits from the opposite batter's box which makes his zone appear shifted, but it's actually very similar to that of Rasmus, but shifted a foot up.
And the only player to compare to Pablo Sandoval is himself.
| Baseball Beat | August 23, 2010 |
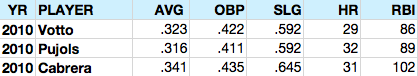
A Trio in Line for Triple Crown
I went to the Reds-Dodgers game yesterday afternoon and watched Joey Votto walk and score a run in the first inning, slug a solo home run in the sixth, and line a two-run single in the ninth as Cincinnati beat Los Angeles 5-2 to stay atop the NL Central by 3 1/2 games.
Votto is leading the National League in batting average (.323), on-base percentage (.422), and slugging average (.592). He also ranks third in HR (29) and second in RBI (86) and has an outside chance to become the first Triple Crown winner since 1967 when Carl Yastrzemski turned the trick for the Boston Red Sox.
For the most part, only Albert Pujols, who is in the hunt for the Triple Crown himself, stands in Votto's way. Pujols ranks first in the NL in HR (32) and RBI (89), fourth in AVG (.316), and second in OBP (.411) and SLG (.592). He has never led the league in RBI despite reaching 120 or more in six of his nine campaigns and never having fewer than 103. Albert has ranked first in HR, AVG, and OBP once each and SLG three times.
Over in the American League, Miguel Cabrera is second in AVG (.341), and first in OBP (.435) and SLG (.645). He also leads the league in RBI (102) and is in second place in HR (31). While it would appear that Miggy could win the AL Triple Crown, it must be noted that he trails Jose Bautista by seven home runs. If the latter returns to earth or gets hurt or traded to an NL club, then perhaps Cabrera would have a shot at winning the Triple Crown. Otherwise, he might have to settle with capturing the Triple Crown of rate stats. Joe Mauer (.365/.444/.587) accomplished the latter feat last year, joining Barry Bonds (2002 and 2004) and Todd Helton (2000) as the fourth player to do so in the past ten years.
While it is unlikely that either Votto or Pujols *and* Cabrera will win the Triple Crown this year, there is a reasonable chance that one or two of these first basemen could win the Triple Crown of rate stats. If either Votto, Pujols, or Cabrera had a monster finish and won the traditional and rate stats Triple Crown, he would become only the ninth player to produce this double since 1900. (Tip O'Neill — no, not this one — was the first in 1887.)
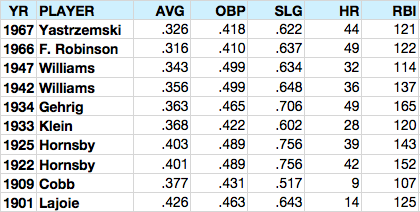
Ted Williams and Rogers Hornsby — perhaps the greatest left- and right-handed hitters, respectively, in the history of the game — won the traditional and rate stats Triple Crown in the same season twice each.
Only three Triple Crown winners failed to lead their leagues in OBP or SLG. As it turns out, the culprit was OBP every time. In 1956, Mickey Mantle had the misfortune of playing in the same league at the same time as Williams and fell short in OBP (.464 to .479). In 1937, Joe Medwick finished fourth in OBP, trailing leader Dolph Camilli (.446), Johnny Mize (.427), and Gabby Hartnett (.424). In 1933, Jimmie Foxx was edged in OBP by Mickey Cochrane (.459). (In 1878, Paul Hines led the NL in AVG, HR, RBI, and SLG while placing fifth in OBP.)
While all the hitters who won the traditional and rate stats Triple Crown in the same season are in the Hall of Fame, only three were named Most Valuable Player in that year: Yaz, Robby, and Hornsby (1925). Williams lost the MVP to Joe DiMaggio in 1947 and Joe Gordon in 1942. Gehrig succumbed to Cochrane in 1934 and Klein to Carl Hubbell in 1933. There was no NL MVP in 1922 and no award winners in 1909 and 1901. Mantle, Medwick, and Foxx, the other three Triple Crown winners, all won their league MVPs.
Only Yastrzemski, Robinson, and Mantle won Triple Crowns and played for a pennant-winning team. All three were named MVPs that season.
Meanwhile, Votto or Pujols could become the first NL Triple Crown winner since Medwick in 1937. As noted above, Cabrera could become the first AL Triple Crown winner since Yaz in 1967. Votto or Pujols could win the Triple Crown on a team that just might win the NLCS. If so, history would suggest that whoever pulls it off would be a lock to win the NL MVP this year. Cabrera, on the other hand, will be fighting history, as well as a number of other worthy candidates, including Robinson Cano and Josh Hamilton, both of whom are enjoying career years and playing for division-leading teams.
Note: Rob Neyer points out that Omar Infante could pose a problem for Votto (or Pujols) in batting average. It is my belief that Infante will cool down the stretch owing to a combination of reverting toward his career average, playing every day, and the toll of the long season for a utility player who hasn't appeared in 100 games in a single season since 2005. Nonetheless, it adds an interesting wrinkle to the NL Triple Crown this year.
Update: Dan Szymborski of The Baseball Think Factory quantifies the likelihood of Votto, Pujols, and Cabrera winning the Triple Crown with Albert given a 16.7% chance, Miggy 1.8%, and Joey 0.8%. Insider subscription required. I might be inclined to take the better than 100:1 odds on Votto.
| Touching Bases | August 19, 2010 |
On Count-Based Linear Weights
Ever since the work of Joe P. Sheehan, pitch-by-pitch run values have been a staple of PITCHf/x analysis. More recently, Bloomberg analysts Craig Glaser and Pat Andriola really got me thinking about what these values might mean.
We all know that Cliff Lee's walk rate is otherworldly. But last week, Jeff Sullivan wrote, "Of the 201 pitchers in baseball with at least 50 innings pitched, Lee's three-ball count rate is lower than 67 individual walk rates." That is an awesome piece of information. Let's say you have a pitcher who somehow manages a walk rate identical to Lee's, and we can say he has the same strikeout and home run rates too. But what if we knew that this pitcher had, say, twice as many three-ball counts as Lee. They may have been of equal value, but surely Lee projects better going forward.
FanGraphs has a whole assortment of what they call plate discipline stats. In essence, these stats are trying to separate the process from the results. A pitcher has a high strikeout rate. Does he throw a lot of strikes or does he induce out-of-zone swings? A batter has a high strikeout rate. Does he never swing or does he never make contact?*
*To those who do such things, please don't use contact rate to predict strikeout rate.
Here's where count-based linear weights come into play. Everything that happened before the result of a plate appearance can be summed up best by the count. A pitcher who walks nobody has better process if he never even goes to three-ball counts, like Cliff Lee.
Using Retrosheet data since 2002, I found the expected run value of the final pitch of every plate appearance, excluding intentional walks. So if a player homers on the first pitch of an at-bat, that goes down as 0 runs toward his count-based linear weights. In turn, a pitcher will have a worse score if he walks a batter on a 3-0 count than a 3-2 count. Here are the values straight from Joe's article. Harry Pavlidis and others have used updated values.
Count  Runs/PA
3&0    0.207
3&1    0.137
2&0    0.097
3&2    0.062
2&1    0.035
1&0    0.034
0&0    0.000
1&1   -0.016
2&2   -0.037
0&1   -0.043
1&2   -0.083
0&2   -0.104
Barry Bonds and Curt Schilling stand unparalleled in getting into quality counts. Angel Berroa and Kirk Rueter not so much. Players who get into good counts but have bad results more often than not are burned by BABIP.
As for the top and bottom performers of 2009, here are the hitters:
| Player | PAs | Total lwts | Count lwts |
|---|---|---|---|
| Chipper Jones | 577 | 9.5 | 11.1 |
| Lance Berkman | 546 | 24.6 | 8.7 |
| Albert Pujols | 665 | 59.0 | 8.6 |
| Adrian Gonzalez | 657 | 35.8 | 8.2 |
| Nick Swisher | 655 | 15.6 | 7.7 |
| Ivan Rodriguez | 447 | -20.8 | -10.9 |
| Jose Lopez | 642 | -5.8 | -10.9 |
| David Eckstein | 553 | -16.4 | -10.9 |
| Miguel Olivo | 414 | -1.8 | -11.1 |
| Clint Barmes | 607 | -10.9 | -16.1 |
And the pitchers:
| Player | PAs | xFIP | Count lwts |
|---|---|---|---|
| Cliff Lee | 1103 | 3.69 | -20.9 |
| Roy Halladay | 962 | 3.05 | -20.8 |
| Justin Verlander | 968 | 3.26 | -19.6 |
| Johan Santana | 689 | 4.13 | -16.6 |
| Cole Hamels | 885 | 3.69 | -16.1 |
| Kyle Davies | 532 | 5.12 | 4.8 |
| Doug Davis | 871 | 4.68 | 5.1 |
| Joe Saunders | 837 | 4.8 | 5.2 |
| Trevor Cahill | 764 | 4.92 | 5.2 |
| Zach Miner | 405 | 4.86 | 6.1 |
After spending some time with the data, I've unfortunately yet to find much predictive power in the metric, beyond what we can get out of normal peripheral stats. Nevertheless, I think there's value to a count-based linear weight as a DIPS-type metric for pitchers.
| Change-Up | August 18, 2010 |
Designating a DH in 2011
Identifying who the best baseball position players are is delicate business for executives trying to field the best team possible. You have to figure out what kind of offensive performer the guy is, and then what sort of glove he has, and then what it all means. You would never want David Ortiz playing outfield for your club, and you would never want Mark Kotsay to be your Designated Hitter. They’re equally preposterous.
The problem is that Kotsay actually does start at Designated Hitter for the Chicago White Sox. Year after year teams squander the opportunity that the DH presents – the chance to increase your odds of getting real productivity by removing defense from the evaluation picture. Whether it’s Jose Vidro, Rondell White, Scott Hatteberg, Carl Everett or even someone like Marlon Anderson in Game 2 of the 2004 World Series, every year there are wholly unqualified players filling the DH slot for teams. I still remember watching incredulously when I saw that Anderson would start at DH for St. Louis in that game.
Fortunately for teams lacking punch at the DH spot, there is an intriguing crop of aging 1B/DH types set to hit the free agent market after the 2010 season. And since only four American League teams have managed a team OPS north of .800 at the position, you’d better believe their services will be in demand. Seattle DH’s have “hit” .182/.260/.303 in 2010.
Joe Pawlikowski took a look back at the 2010 Free Agent DH class last week at Fangraphs, and now I’d like to look forward at the guys who will come available for the 2011 season.
===========
There are other sticks out there too like Hideki Matsui and Lyle Overbay but the list above represents all the viable DH options for teams looking to fill the slot in 2011. Short of these guys, teams would be best served putting their best AAA hitter in there and seeing how he performs. Whatever you do, just say no to the Mark Kotsays of the world at DH.
| Designated Hitter | August 17, 2010 |
The WAR Against Age – The Pitchers
In my last article, I examined at what ages the forty greatest hitters* of all time, as measured by Wins Above Replacement (“WAR”), had their five best seasons to learn about aging patterns and how certain individual players fared. Here, I take a look at forty top pitchers and their best seasons. Because pitcher usage has changed dramatically over time, I eliminated all pitchers who played the bulk of their careers before World War II.
I don’t think that Walter Johnson’s typical workload of 350+ innings in his best seasons or Cy Young’s 400+ innings in his best seasons is particularly enlightening for purposes of today’s game because modern players are unlikely ever to pitch like that again. That is to say nothing of Old Hoss Radbourne’s 19.8 WAR season in 1884, in which he pitched 678 innings and went 59-12. (Considering his ERA-plus was 207 that year, and he pitched about 2/3 of his team’s innings, I think his WAR (he had 20.3 when you factor in hitting), although the highest single season number of all time, seems a bit low). In any event, after taking out the old-time pitchers, the top-40 post-World War II pitchers takes you down to number 67 of all time, Dave Stieb.
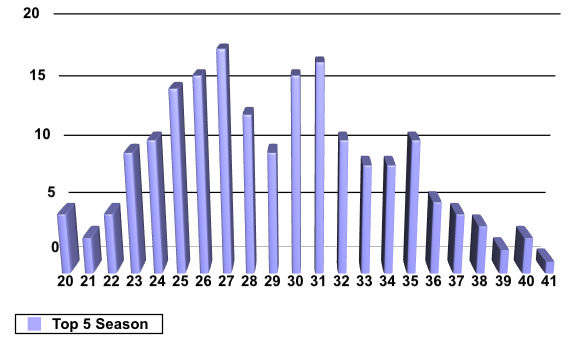
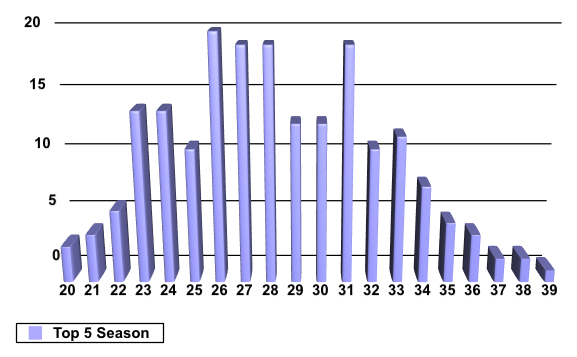
I plotted on the bar graph below the top 5 pitching seasons measured by WAR (I did not factor in WAR for hitting) for the 40 top-rated post-war pitchers (200 data points in all). For comparison sake, I have also included the chart for hitters from my last article, adjusted so that the pitchers and hitters are set out in the same scale.
Top 40 WAR (Post-World War II) Pitchers:
Top 40 WAR Hitters:
The Pitchers vs. the Hitters
The first thing that jumps out from looking at these graphs is that pitchers seem to spread out their peak seasons far more than hitters. Although great hitters and pitchers start putting up peak seasons at age 20, the pitchers are far more likely to have a peak performance late in their careers. Just three hitters had one of their best seasons at age 38 or later (one was Barry Bonds at 39, one was Ted Williams who had his fifth best season and one was Cap Anson), and none at age 40, whereas the pitchers had 10 such seasons starting at 38 (5% of the sample) and four at 40 or 41, by which time all great hitters had tailed off. Similarly, the peak for pitchers is far less prominent than for hitters. For the hitters, 103 of the best seasons, more than half the sample, were between ages 26 and 31. For the pitchers, by contrast, at the same ages (which is also the six year span with the highest number of peak years) there are just 88 of the 200 seasons recorded. The median age for a pitcher’s top season was 29, a year later than for the hitters. Another interesting observation is that aggregately both the hitters (at 29 and 30) and pitchers (at 28 and 29) showed a decrease in peak years before spiking again. In my last article, I had chalked up this anomaly as merely a sample size issue, but now I wonder if there is something more at play. Perhaps players need an adjustment period to cope with diminishing physical skills.
The Individual Performances
One of the things that makes an exercise like this interesting is to look at the individuals who make up the sample and examine some of their performances. On the old side, it is not shocking that Phil Niekro and Ryan put up great age 40 seasons. John Smoltz, had the other age 40 season on the chart, which I found surprising. Warren Spahn’s age 41 season ends the chart. (Incidentally, at a baseball card show when I was 13, Spahn taught me how to throw a knuckleball. He claimed he threw one once in his career, popping up Ted Kluszewski. He also recounted how kids at Ebbets field threw sandwiches at the visiting pitchers in the bullpen, and he and his teammates would collect them and, occasionally, eat them).
Smoltz, for his part, was the pitcher with the biggest range among his top 5 seasons, producing them from ages 24 to 40. Other pitchers with a greater than ten year span for their best five seasons include Roger Clemens (23-34), Spahn (26-41), Bert Blyleven (20-33), Nolan Ryan (26-40), Steve Carlton (24-37), Mike Mussina (23-34), Rick Reuschel (24-36) (one of the most surprising things I saw was that Reuschel has the 30th highest WAR for pitchers all time, ensconced between Tom Glavine and Bob Feller, two no-doubt Hall of Famers (or future Hall of Famers)), Jim Bunning (25-35), Tommy John (25-36), Jerry Koosman (25-36), David Cone (25-36), Chuck Finley (26-37) and Frank Tanana (20-30).
On the young side of the spectrum, the eight age 20-21 seasons on the chart belong to six pitchers, Blyleven, Feller, Don Drysdale, Dennis Eckersley, Tanana and Bret Saberhagen. Blyleven, 13th all time in pitchers’ WAR (making it very hard to deny his Hall of Fame credentials, but Rich speaks far more eloquently on that subject than I do), turned in four of his top-5 season at 20, 22, 23 and 24 (with his fourth best season at 33). Perhaps his underwhelming won-lost records for those early years (16-15, 20-17, 17-17, 15-10, respectively), coupled with a long career thereafter of being very good has caused him to be underrated in the popular (sportswriters’?)
consciousness.
Feller, another young peak performer, suffers no such lack of recognition among baseball’s cognoscenti, and for good reason. Rapid Robert’s best five seasons were at 20, 21, 22, 27 and 28. Of course, he missed all of his age 23-25 seasons, and most of his age 26 season, to World War II, creating an equally compelling “what might have been” discussion as the one for Ted Williams. Another “what might have been” could easily be created for Frank Tanana, who put up four of his top 5 seasons between 20 and 23, including three 7+ WAR seasons from 21-23. To put that in perspective, among the last ten Cy Young award winners (Lincecum twice, Peavy, Webb, Carpenter, Grienke, Lee, Santana, Sabathia, and Colon) they have just four 7+ WAR seasons aggregately in their careers (Grienke, Lee and Santana twice). Had Tanana not blown out his arm, he may have been among the all time greats. That he was able to reinvent himself into an effective junk-baller is a credit to him.
On the other end of the spectrum, late peaking pitchers include knuckleballer Phil Niekro (his top five were between age 35 and 40), fireballer Randy Johnson (31, 33, 35, 37 and 38), spitballer Gaylord Perry (between 30 and 35) and sinker baller Kevin Brown (31-35). Smoltz had three of his best seasons at 38-40, but his other two top seasons were at 24 and 29.
Brown was also one of the models of consistency with a definitive peak, putting up his best five seasons in a row. Robin Roberts (23-27) was also on that list. Greg Maddux (26-31), Sandy Koufax (25-30) and Hal Newhouser (23-28) each put up their best six seasons in a row.
Conclusion
When viewed aggregately, pitchers, like hitters, apparently age in predictable ways, with peak years likely to take place between 26 and 31. On deeper inspection, however, it is clear that pitchers are less predictable. A 37 or 38 year old pitcher, or even older, has a reasonable possibility of turning in a personal peak year, whereas a hitter is not likely to do so. Indeed, each of the five oldest peak years for hitters have extenuating circumstances (Bonds (37 and 39) because of presumed steroid use, Williams (38) because service in World War II almost certainly cost him a top season when he was younger, and Cap Anson (37 and 38) because he played in the equivalent of baseball’s pre-historic times, where talent was almost certainly not as uniformly recognized and spread out among the leagues. If those players’ late career seasons are discounted, no top hitter would have had a peak season after 36. By contrast, the top 40 post-war pitchers put up 15 (7.5%) of their top seasons at 37 or older. Nor is it clear that a single type of pitcher is destined for late-career success, as pitchers such as Phil Niekro, Spahn, Randy Johnson, Carlton, Ryan, Smoltz, Koosman, Cone, John, Finley and Reuschel each put up one of their best five seasons at 36 or older.
If anything, the late success of pitchers seems to show what baseball fans already understand, that pitching effectiveness is not the result of merely being able to throw hard (no doubt each of these pitchers could throw harder when they were younger). Rather, factors such as an improved or learned pitch, better control, or even better discipline and thought processes on the mound no doubt contributed to many pitchers’ late career resurgences. Another conclusion that should be apparent is that next year’s prized free agent, Cliff Lee, who will be entering his age 32 season, is not nearly as assured of regressing from his incredible current peak as a 32 year-old hitter would be. No doubt, many GM’s are willing to bet that he can produce excellent seasons in his mid-30’s, just as some
great pitchers have done before.
* Note that I intentionally omitted Albert Pujols from that analysis, as it is by no means clear that he may not still have one of his five best seasons in the remainder of his career. In posting that article, the footnote on that subject apparently became embedded.
Doug Baumstein is an attorney and Mets fan living in New York.
| Baseball Beat | August 16, 2010 |
Chipper Jones and Jeff Bagwell: Two Peas in a Pod
Aside from their difference in positions, the careers of Chipper Jones and Jeff Bagwell have been almost identical. The National League rivals each won a Most Valuable Player Award and produced statistics that are almost indistinguishable from one another.
While Bagwell and Frank Thomas may have been separated at birth — both players were born on the same day (May 27, 1968), played first base, arrived in the majors within a year, won the MVP Award in 1994 (Bags in the NL, the Big Hurt in the AL), and produced career totals that were more alike than not — the similarities between Bags and Chipper are nearly as astonishing.
Jones and Bagwell have both been in the news recently. Chipper underwent surgery for a torn ACL this past week, and Bags was named the hitting coach for the Houston Astros last month. The offseason should be an interesting time for these superstars. Speculation will surround whether Jones can fully recover from his knee injury and return in time for the 2011 season, while Bagwell will be on the Hall of Fame ballot for the first time.
Meanwhile, let's take a look at how closely Jones' and Bagwell's career counting and rate stats line up:
![]()
It's pretty difficult to separate the two, no? I don't think you can really make a strong case for one and not the other based on the counting or rate stats. Given that Jones has played in 111 more games with 223 additional plate appearances, perhaps we can agree that Bagwell edges Jones by the slimmest of margins on the offensive side of the ledger by virtue of his .003 and .004 advantages in OBP and SLG, respectively, as well as his favorable ballpark-adjusted OPS (aka OPS+).
Bagwell was actually a better defensive player at his position (1B) than Jones was at his (3B). However, Jones played the more difficult corner infield spot and the difference in positional scarcity is estimated to be worth about 140 runs according to Sean Smith of BaseballProjection.com, whose work on Wins Above Replacement (WAR) has become the industry standard.
Based on WAR — which factors hitting, baserunning, fielding, and position — the difference between Bagwell (79.9) and Jones (80.0) works out to 0.1 win. One-tenth of one win over the course of their 15- and 16-year careers. They rank 56th and 57th all time in WAR among all players and 36th and 37th among non-pitchers.
As far as peak value goes, the nod goes to Bagwell, who produced three seasons (8.9, 8.3, and 8.1) that exceeded Jones' best (7.9). On the other hand, Bagwell had two seasons that were worse than anything Jones has put up to date.*
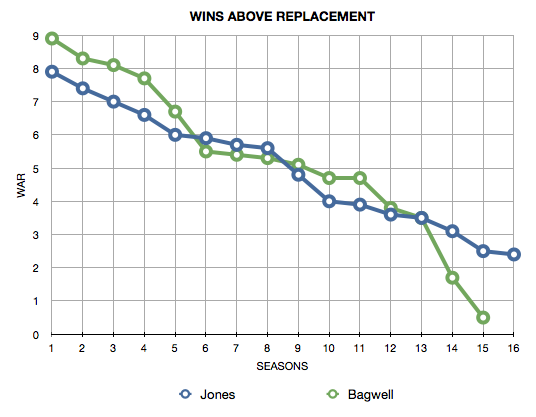
* I'm skeptical of the -19 Total Zone assigned to Bagwell's fielding in 2003, which is the primary reason for his abnormally low 1.7 WAR total that season. His basic stats (games, innings, putouts, assists, errors, double plays) are not all that different than 2002 and 2004. Moreover, his Ultimate Zone Rating per 150 games (UZR/150) was 4.1, which is almost exactly halfway between his 2002 (3.1) and 2004 (5.0) marks. The net effect of this potential glitch is that it reduces Bagwell's value by about two wins in 2003 and, by extension, two wins for his career.
The bottom line is that Jones and Bagwell are two of the greatest players of the past two decades. One can make a case that both rank among the top five players at their position since 1900 (with only Mike Schmidt, Eddie Mathews, George Brett, and Wade Boggs possibly exceeding Jones at 3B and Lou Gehrig, Jimmie Foxx, and Albert Pujols outdoing Bagwell at 1B). As a result, Jones and Bagwell should be slam-dunk, first-ballot Hall of Famers. Here's hoping that Bagwell gets his due when the results are announced in January and Jones follows up five years after his retirement, which may or may not be in 2010.
| Touching Bases | August 13, 2010 |
Prince or Hall vs. Paul?
Paul Maholm was recently named the most underhyped player in baseball. Perusing his opposing batter history on Baseball Reference, I could see why some would think he was underhyped. Prince Fielder has a .071/.152/.071 line against Maholm in 46 career plate appearances. On the other hand, Bill Hall, sporting a .581/.639/1.032 clip in 36 PAs, probably doesn't really see what all the fuss is about. So who would you rather have against Paul Maholm?
Going by The Book, first we look at career numbers to get the largest possible sample. Better yet, we can look at a projection system, which distills those career numbers, adjusts them for age and weighs them by season. ZiPS projects Fielder at a .401 wOBA and Hall at a .302 wOBA. Fielder is a superstar while Hall is a utility man. We've got that out of the way. So how to explain the Maholm divide?
The Book says to next look at platoon splits. Fittingly, Hall and Fielder have identical .348 wOBAs against southpaws. Furthermore, Maholm has a massive career platoon difference of 100 points in wOBA. That closes the gap, and that's about as far as The Book goes. To get the rest of the way there, I thought PITCHf/x might come in handy, so using movement, velocity, and location as my inputs against LHPs, I tried to predict their success against Maholm's offerings.
Maholm throws both his two-seam and four-seam fastballs around 88-90 miles per hour, and throws them on just over half of his pitches. His two-seamer has better movement in my opinion, and has certainly achieved better results, yet interestingly, he throws it less often to same-handed hitters. I'm not sure this is a wise move overall—he might be handicapped by wanting to throw his two-seamer only to his arm side—but against Prince Fielder, his choice of fastball has certainly paid off. I grabbed 1,000 fastballs against Fielder from LHPs and plotted Fielder's success (RV100) by pitch movement. I also added lines to indicate the average movement of Maholm's two fastballs.
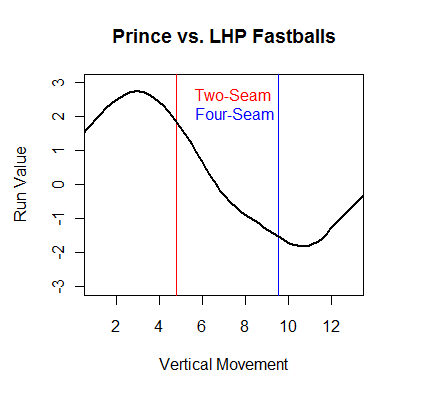
Fielder is above average on risers but below average on sinkers. Movement is not the only reason that Maholm's four-seam fastball stifles Fielder. The location of Maholm's four-seamers also coincides with Fielder's weakness
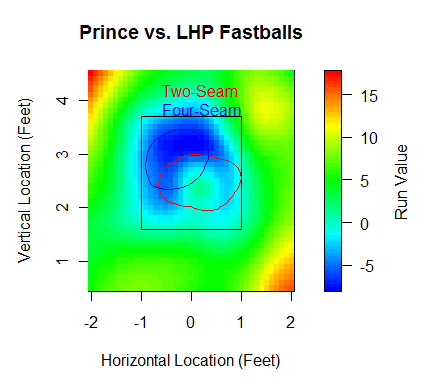
In fact, Fielder has swung at 23 Maholm four-seamers. All but five he has either fouled off or swung through. As for the five he put into play, all of them were grounders, and only one was a single. Two were double plays. So to sum up, Maholm uses his four-seam fastball a lot facing lefties, and it just so happens that said fastball matches up perfectly against Fielder.
Furthermore, Maholm's slider, his best pitch, is death on Fielder, and LHBs in general. However, Maholm only uses his slider 7% of the time against righties. Instead, he takes the changeup out of his pocket and also uses the curve a bit more. But his changeup isn't as good a pitch as his slider, even when accounting for the platoon differential. And against Hall, Maholm's choice of off-speed pitches is asking for trouble.
Maholm's changeup comes in at 83, his slider at 80, and his curve at 73, and they follow the PITCHf/x spectrum of movement. His changeup is in the top-right quadrant, dropping the least out of his off-speed pitches and moving the most toward his arm side. His slider is right near the origin, with average values of 0 inches in horizontal and vertical movement. And his curveball is diametrically opposed opposed from his changeup, as it breaks down and in towards righties. Conventional wisdom and PITCHf/x analysis both say that the slider has the largest platoon split of all off-speed pitches, so perhaps Maholm is right to scrap it against righties. But Hall apparently isn't a normal righty. Against off-speed pitches, here is how he does based on horizontal and vertical movement:
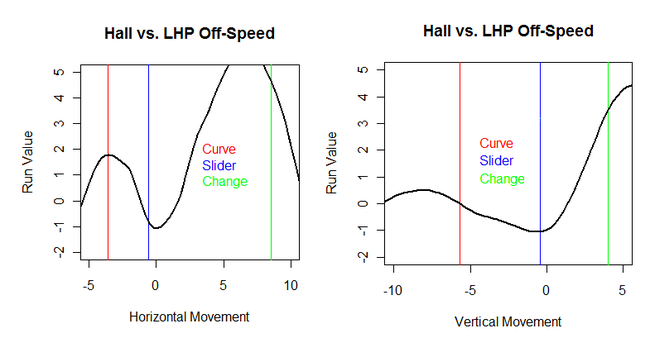
The troughs in both charts appear in the areas where Maholm throws his slider. This means that sliders might be the best pitch to throw Hall. There's room inside to throw the slider, and he's also willing to chase them in the dirt when LHPs try to backfoot him. But Hall destroys offspeed pitches left out in the zone.
Hall has been thrown twelve curves from Maholm. He swung at three of them, connecting for two singles and a double. He was also hit by one of them, and most of the rest went for balls. Hall's put four changeups into play, good for a groundout, a single, a double, and a home run. Again, most of the rest were balls.
Prince Fielder is soon to sign a contract worth over $100 million, while Bill Hall might be out of baseball in a year. Yet in certain contexts, Hall might be the better player. Given both batter's substantial platoon split, and more importantly the large platoon split of Paul Maholm, you could project Fielder and Hall to hit Maholm equally. And digging deeper, it is evident that Maholm's strengths match Fielder's weaknesses and Maholm's weaknesses match Hall's strengths. The case can be legitimately made that Bill Hall projects to be a better hitter than Prince Fielder against Paul Maholm.
| Touching Bases | August 12, 2010 |
WAR and the Rule 5 Draft
The Rule 5 Draft dates back over a century, and Retrosheet has a fair chunk of Rule 5 data. The Rule 5 draft as we know it began somewhere around 1965, so I took all drafted players since then and their WAR in the following years. As it turns out, the Rule 5 Draft is a market for more-or-less freely-available replacement-level talent.
Most years, 80-90% of one-time Rule 5 picks either don't play or accumulate 0 WAR. That means that in the first year after being drafted, 35% don't play, while 55% occupy a Major League roster and play at replacement level. Five years removed, 70% of Rule 5 picks aren't playing, but at least most of those who do are competent Major Leaguers.
Many Rule 5 picks don't play for the team that drafted them. For example, Bobby Bonilla was a Pirate before he was taken by the White Sox, but he was traded back to Pittsburgh before he became Bobby Bonilla. Johan Santana was drafted by the Marlins, but that was only in a pre-arranged swap of picks with the Twins. And Josh Hamilton played only a year for the Reds, yet that in turn was only because the Reds were able to buy him from the Cubs, who had selected him in the Rule 5 Draft.
Only 14 players have amassed 2 WAR the year after they were taken. Doug Corbett picked up a whopping 5.9 WAR. Ted Abernathy, 10 years into his Major League career, was somehow a Rule 5 pick, and he quickly had the best year of his career at 5.6 WAR, finishing 20th in MVP voting. After that, the familiar faces of Joakim Soria, Dan Uggla, and Josh Hamilton made the most immediate impacts. 14 players have been drafted twice, and Shane Victorino is the most successful.
The Twins have been the best drafters, and that doesn't even count their trade for Santana. Minnesota was the team that got that value out of Corbett, and the Twins also sapped all the talent out of Shane Mack after selecting him in December of 1989, which you can see from the table below.
| Year | Age | Tm | Lg | PA | WAR | Salary |
|---|---|---|---|---|---|---|
| 1987 | 23 | SDP | NL | 267 | -0.2 | $62,500 |
| 1988 | 24 | SDP | NL | 140 | 0.7 | $73,500 |
| 1990 | 26 | MIN | AL | 353 | 2.5 | $105,000 |
| 1991 | 27 | MIN | AL | 489 | 4.9 | $270,000 |
| 1992 | 28 | MIN | AL | 692 | 6.0 | $1,075,000 |
| 1993 | 29 | MIN | AL | 553 | 1.1 | $3,050,000 |
| 1994 | 30 | MIN | AL | 347 | 4.0 | $3,250,000 |
| 1997 | 33 | BOS | AL | 146 | 0.7 | $1,850,000 |
| 1998 | 34 | OAK | AL | 2 | -0.1 | $450,000 |
| 1998 | 34 | KCR | AL | 229 | 0.2 |
The Pirates have seemingly been pillaged by the Rule 5 draft, but again, they were able to reclaim Bonilla, which offsets some of their losses. The real question is, why didn't the Pirates protect Bonilla in the first place? They took another hit when they let Bip Roberts go. The Pirates had drafted Roberts twice, and were able to sign him when they used their first-round pick on him the second time, but he was plucked clean by the Padres, and went on to develop into a nice player. The Diamondbacks, in their short time, have only had a handful of players taken from them, but those include Dan Uggla and Luis Ayala.
The Giants and Red Sox have made about 20 Rule 5 picks each, and have had 0 pan out as players, unless you want to count Javier Lopez. I don't. In fact, many teams have gotten no return from the Rule 5.
Evaluating a Rule 5 pick is in parts straightforward. The drafted player will make the league minimum salary. $50,000 per selection is $50,000. The tricky part is how much value to place on losing the flexibility of a 40-man roster spot. Most Rule 5 picks never become more than replacement level, especially not in that first year when they're guaranteed a roster spot. I'd say that five players a year are, or become, better than replacement level, while 15 picks are made per year. So if a team covets a player, using a Rule 5 pick on him can be worth the while, but 10 picks in, teams are just as well off passing on their selections, which they often do. I don't see any hidden value in the Rule 5 Draft. I struggle to even see the purpose of this outdated draft model. A boring draft makes for boring analysis.
| Baseball Beat | August 11, 2010 |
Scouting Reports from the 2010 Area Code Games
The 24th annual Area Code Games were held at Blair Field during the past week. The summer showcase has been one of the premier national events for high school baseball prospects since it was moved to Long Beach in 1994. The wood bat tournament consists of eight teams and over 200 players invited from around the country, the vast majority of which will be offered major college scholarships and/or drafted in June 2011 or 2012 as the case may be for about 10 percent of the participants.
 Unlike many showcase events, the players don't pay to play. Instead, several hundred professional scouts, scores of college coaches, and dozens of agents are charged a fee for attending these games. One of the scouts in attendance (Scott Boras) is also the father of a prospect (Trent Boras, who preps at JSerra Catholic High School in San Juan Capistrano, CA). There was an even more famous father-son combo with Wayne and Trevor Gretzky (Oaks Christian, Westlake Village, CA) prominent in the stands and on the field, respectively.
In addition, there were six sons of former MLB players and a brother of an active big-league pitcher: Alec Bankhead (Greensboro, NC), son of Scott; Brandon Bonilla (IMG Academy, Bradenton, FL), son of Bobby; Shawon Dunston Jr. (Valley Christian, San Jose, CA), son of the father by the same name; Brett Geren (San Ramon Valley, Danville, CA), son of current A’s manager Bob; C.J. McElroy (Clear Creek, League City, TX), son of Chuck; Drew Stankiewicz (Gilbert, AZ), son of Andy; and Joe Ross (Bishop O'Dowd, Oakland, CA), brother of A's pitcher Tyson.
The tournament featured eight teams: Milwaukee Brewers (California) sported Blue and White entries, Texas Rangers (Texas and Louisiana), Chicago White Sox (Midwest), Washington Nationals (Pacific Northwest), Oakland Athletics (Southeast), New York Yankees (Northeast), and the Cincinnati Reds (Southwest and Rocky Mountains). As noted, the geography of the big-league clubs and their Area Code teams don't necessarily match. Nonetheless, the players wore the colors of their MLB teams with "Area Code" in script across the front of all jerseys.
Each team played five games over six days (Thursday, August 5-Tuesday, August 10) with most contests scheduled for seven innings and a few for nine.
Day One (Thursday, August 5)
In the opening game on Thursday, Henry Owens (Edison, Huntington Beach, CA) of the Milwaukee Brewers (Blue) pitched the first two innings and struck out six of the seven batters faced. He walked the other one. The lefthander threw 31 pitches, 21 for strikes. He was throwing 87-89 mph. At 6-foot-7 and 195 pounds (with size 17 shoes), his fastball plays up a bit due to the fact that he throws on a downhill plane. Moreover, his body offers lots of projection although a scout I spoke to noted that Owens' velocity is down a couple of ticks from his sophomore season in 2009. Nonetheless, he may be the most highly regarded prep pitcher in the country and could be drafted in the top half of the first round next June.
A member of the USA Baseball 18U National Team, Owens has had a busy summer. He was 3-0 with a 2.33 ERA in five appearances and four starts, whiffing 31 batters and walking nine in 19.1 innings. He was also named to the Aflac All American Baseball Classic, which will be held on Sunday, August 15 at 5 p.m. PDT in PETCO Park. The game will feature the nation’s top 38 high school players heading into their senior year.
Baseball America offered the following report in its Aflac Classic player capsules:
Scouts love Owens' frame, which has plenty of room to fill out, and he adds to the package by showing a good arsenal—and all from the left side. His fastball sits 88-91 mph from the left side, and he also works with a sharp, two-plane curveball and mixes in a changeup.
Area Code and Aflac teammates Travis Harrison (Tustin, CA) and Christian Lopes (Edison, Huntington Beach, CA) each went 2-for-4. Harrison is a 6-2, 220-pound outfielder with big-time power, as evidenced by the 504-foot home run he jacked at the Power Showcase in January, breaking Bryce Harper's record from the previous year by two feet. Lopes, a 6-0, 185-pound shortstop, has been well known in prospect circles for several years. He and his younger brother Timmy Lopes (class of 2012) transferred from Valencia to Edison last January, joining Owens and Eric Snyder, who has committed to UCLA. All four players are on the same team in the Area Code Games, too. Their high school club promises to be one of the best in the nation next year.
In the second game, Owens' 18U teammate Derek “Bubba” Starling (Edgerton, Gardner, KN) led the Chicago White Sox to a victory, pitching two innings (2-1-1-1-1-2) and knocking in the first run with a ground-rule double that the left fielder lost in the sun and bounced near the warning track and over the outfield wall that measures 348 feet down the lines, 387 to the power alleys, and 400 to center. His fastball sat in the high 80s and touched 90. The righthander has reportedly thrown in the low 90s but hasn't pitched much this summer. He hit .339/.474/.532 with three HR and 16 BB and 12 SO in 78 PA and tossed 4.1 scoreless innings with 7 SO and only 1 BB for Team USA last month. The tall and lanky Starling (6-5, 195) is an outstanding two-sport athlete who has verbally committed to play baseball and quarterback at Nebraska. The five-tool player ran a 6.56 in the 60-yard dash, tied for the fifth-fastest time in the SPARQ testing on the first day of the Area Code Games. I like the Matt Holliday (who was also one of the top high school QB in the country) comp that New York Yankees Director of Scouting Damon Oppenheimer made to ESPN Rise, a part owner and sponsor of the event.
White Sox center fielder Charles Tilson (New Trier, Winnetka, IL) showed off his athleticism on Thursday by running the fourth-fastest 60 (6.54) and stealing three bases that evening. On Saturday, a scout sitting in my row clocked the lefthanded-hitting center fielder at 3.98 while an area supervisor in front of me had him at 4.0 exactly on an infield single that didn't even draw a throw. So as not to be labeled a one-trick pony, Tilson opened Sunday's game by slugging the first home run of the tournament. It was an impressive blast to right field into a slight breeze coming off the ocean. He singled and stole two more bases later in the game and threw out a runner at third to top it all off.
Teammate Johnny Eierman (Warsaw, MO) is another speedster who had the second-fastest time in the 60 at 6.41. The 6-foot-1 shortstop and quarterback is coming off a junior year in which he was an all-state selection in baseball and football. The LSU commit slugged three home runs during batting practice on Thursday but struck out in five of six plate appearances after going 2-for-3 with a triple in the first game. While Eierman doesn't lack for load or bat speed, he may need to alter his swing plane in order to make more contact at the next level.
Nicholas Burdi (Downers Grove, IL) threw three innings in relief, striking out five without allowing a walk. The 6-5, 215-pound righthander was dialing his fastball up to 90-91 while flashing a hard slider at 84-85 and a changeup with good arm action at 81-82.
Lefty Cody Kukuk (Lawrence, KS) and righty Michael Fulmer (Deer Creek, Edmond, OK) both touched 90 on the radar guns in the later innings.
The opposing starting pitcher for the Washington Nationals, Dylan Davis (Redmond, WA), threw 92-94 in his only inning of work. His heater was the fastest of the evening. It appeared as if he only threw one other pitch, a short slider that Baseball America tabs at 83-84. The smallish righthander, generously listed at 6-0, 200 pounds, gave up two runs (one earned) on Thursday but bounced back to toss two scoreless innings on Sunday. An Aflac selection, Davis has committed to Oregon State.
Cole Wiper (Newport, Bellevue, WA) topped out at 91 with his fastball, 83-85 with what a scout told me was a cutter, and a 78 mph curve he left up in the zone that was pulled for a triple down the right-field line. He has thrown three innings overall, struggling with his control on Sunday when he walked three of the seven batters faced.
Porter Clayton (Bonneville, Idaho Falls, ID), a southpaw with a pronounced leg kick, struck out three batters around a hit and walk in his only inning of work. He was 88-89 with a good breaking ball. Kevin Moriarty (Shorewood, WA) K'd five out of six batters, showing excellent command of an 84-87 mph fastball and a slow curve.
Spencer O'Neil (Southridge, Kennewick, WA) stood out in the pre-game infield, displaying a strong, accurate arm in right field with all four throws to third base and home arriving on a clothes line with no hops. However, O'Neil, one of three returning players from the 2009 Area Code Games, has taken the collar at the plate, going 0-for-10 in the tournament.
Day Two (Friday, August 6)
Jordan Ramsey (North Davidson, Lexington, NC), Chris McCue (Ardrey Kell, Charlotte, NC), and John Hayman (Ware County, Waycross, GA) of the Oakland Athletics threw a combined, seven-inning shutout over Washington, which was forced to play the last game the previous evening and the first contest the following morning. McCue, an undersized righthander who has committed to North Carolina, had the most impressive arsenal of the trio, with an 89-92 mph fastball and a solid-average curveball and changeup.
Alex Blandino (St. Francis, Mountain View, CA) went 3-for-3 in the opener but competed for playing time throughout the tournament with several middle infielders on Oakland despite a solid swing that produced six hits in 10 trips to the plate.
Washington's Tyler Gonzales (Madison, San Antonio, TX), class of 2012, struck out the side in his lone inning of work. Teammate Dylan LaVelle (Lake Stevens, WA), another junior-to-be, hammered a triple that one-hopped the wall in center field to lead off the game for the Nats. Although LaVelle made a couple of errors at shortstop during the tournament, he was involved in three double plays and appears to have the glove, footwork, and arm to handle the position. His keystone partner, Erik Forgione (W.F. West, Chehalis, WA), was equally adept defensively, making at least one highlight reel play at second. He also doubled to right center on Saturday, one of the few hard hit balls that day.
Michael Conforto (Redmond, WA), who is playing in his second Area Code Games, stroked two hits. A lefthanded-hitting right fielder, Conforto has a powerful swing and a strong arm. Before knowing that TrackMan had measured his max exit speed at a tournament-best 105, I had written down "plus bat speed" next to his name on my roster. Keep an eye on this 6-0, 200-pounder with good bloodlines. His mother won two gold medals in synchronized swimming in the 1984 Summer Olympics in Los Angeles and added a silver in the 1988 Games in Seoul, while his father played linebacker at Penn State for Coach Paterno in the 1970s.
In the game between the New York Yankees and Texas Rangers, Bryan Brickhouse (Woodlands, TX), a 6-2, 190-pound righthander, was throwing 92-94 mph gas in the first inning, striking out the side around one walk. He allowed another free pass in the second as well as a single and triple off the bat of Rio Ruiz (Bishop Amat, La Puente, CA), a third baseman and pitcher from the class of 2012, who knocked in two runs and closed out the final inning for the Yankees, lighting up the radar guns with a low-90s fastball.
Fernelys Sanchez (Washington, Bronx, NY), another junior-to-be, ran the best 60 (6.35) on Thursday and stole two bases. Matt Dean (The Colony, TX), an Aflac selection, had a tough time at the plate, going 0-for-4 with two strikeouts. He was 3-for-17 with no XBH or BB and five SO for the tournament. The 6-foot-3, 190-pound third baseman is a two-sport athlete who has committed to Texas to play baseball but is expected to be a high draft pick next June. Teammate Daniel Mengden (Westside, Houston, TX) will also be at the Aflac game next week.
In the final game of the day, Robert Stephenson (Alhambra, Martinez, CA) led the Brewers White to a 6-1 victory over the Reds. The 6-2, 185-pound righthander struck out six batters without allowing a walk or run in three innings. The Aflac All-American was popping his fastball in the low 90s in one of the more impressive outings of the day. Teammate Billy Flamion (Central Catholic, Modesto, CA) was the offensive star of the game, banging out two hits (including a double) and stealing a base. The 6-1, 195-pound, high-energy outfielder went 5-for-17 for the tournament and his big, powerful swing will be on display next Sunday in the Aflac game.
On the other side of the diamond, Blake Swihart (Cleveland, Rio Rancho, NM), a 6-1, 175-pound switch-hitting catcher, had two hits and drew rave reviews from many talent evaluators for his offensive and defensive prowess. He is another Aflac selection who hit a team-leading .448 AVG (26-for-58) and .845 SLG (6 2B, 1 3B, and 5 HR) for the USA 18U club. He has also committed to play for the Texas Longhorns. Swihart caught Bonilla, a lefthanded pitcher whose line (2-3-3-3-3-4) left a lot to be desired. However, the University of Southern California commit, who works out of the stretch, flashed good stuff with a fastball that sat in the upper 80s and reached 90 as well as a curve that showed some promise. Interestingly, he walked Dunston, a lefthanded-hitting, fleet-footed outfielder, on four pitches. The latter drew four free passes in 19 plate appearances while stealing two bases and scoring five runs, including a jaw dropper from second base on a dropped third strike and throw to first.
Day Three (Saturday, August 7)
With all of the teams having played at least once heading into the weekend, the biggest names were generally covered in the recap of the first two days. Nonetheless, there were new pitchers who stood out and a few hitters who jumped to the forefront such as Aaron Brown (Chatsworth, CA), who went 4-for-4 in the morning game on his way to a tourney-leading eight hits in 15 at-bats. The L/L outfielder-pitcher has excellent bat and foot speed and flashed a strong arm on Monday when he struck out five batters over just two innings. Milwaukee White teammate Tyler Goeddel (St. Francis, Mountain View, CA), a 6-4, 170-pound third baseman, jacked a stand-up triple into the gap in right center, showing both power and speed on the same play. He has also displayed a great approach at the plate, drawing seven walks while striking out just once. Desmond Henry (Centennial, Compton, CA) sparkled in the 60-yard dash on Thursday with the third-fastest time of 6.47 before transferring his athleticism to the baseball field on Saturday with two doubles. He went 5-for-13 with two BB and two SO overall.
Lots of radar guns went up in the second game when Jerrick Suiter (Valparaiso, IN), a 6-3, 210-pound righthander with a smooth delivery, entered the contest in the fifth. He worked two innings on Saturday and came back and tossed two more on Monday. The three-sport star allowed only one hit, one walk, and no runs while punching out seven of the 14 batters faced in his two outings. Suiter coupled an 88-92 mph fastball with a 73-74 plus curveball. Patrick Hope (Broken Arrow, OK), a 6-3, 185-pound righthander, was 90-91 with a 72-73 hammer curve that was without question the best breaking ball I saw all week. Fellow righty teammate Clayton Blackburn (Santa Fe, Edmond, OK) was 89-90 with a sweeping breaking ball.
In the third game, Lucas Giolito (Harvard-Westlake, North Hollywood, CA), class of 2012, just turned 16 in July, yet matched the best fastball of the tournament by consistently hitting 91-93 and touching 94 on at least one occasion according to the scoreboard display facing the press box. (Note: TrackMan registered his average fastball velocity at 95.8, or 3-4 mph faster than the consensus of the dozens of handheld Stalker Sport radar guns employed by scouts. TrackMan may measure the velocity at the pitcher's release point whereas radar guns and PITCHf/x estimate velocity at about 50 feet from home plate. There may be an additional explanation as well, which I would enjoy receiving from any expert in this area. In the meantime, the TrackMan leaders can be viewed here.) Giolito was wild with his entire repetoire of pitches (which included a 76-80 mph slurve and what appeared to be either a hard change or a two-seamer with more than decent arm-side run). With additional experience, the 6-5, 215-pound righthander may be able to improve upon his command, which was lacking on Saturday as evidenced by the 24 balls against 23 strikes and four free passes in only two innings. If so, he projects to go early in the 2012 draft.
Teammate Adam McCreary (Bonita, La Verne, CA) entered the game in the sixth inning and was announced as Henry Owens due to the lefty's handedness, similar number (38 vs. 36) and size (6-8 vs. 6-7). The PA announcer corrected his mistake, noting the "even taller" McCreary, who pitched a scoreless inning by exhibiting a mid-80s fastball, a 78 mph slider, a 72 mph curve, a 75 mph change, and a good pickoff move to first base. The combination of his polish and projection makes him an intriguing prospect.
Three Yankees pitchers combined for 17 strikeouts in the nightcap with Aflac All-Star Tyler Beede (Lawrence Academy, Groton, MA) and Karl Keglovitz (Nazareth, PA) leading the way with six each. John Magliozzi (Dexter, Brookline, MA), another Aflac selection, chipped in with five Ks. The Florida commit worked in the low 90s. Keith Law, whom I chatted with in between games on Saturday, noted that Magliozzi might be more suited for a relief role due to his arm slot. I agree and believe his lack of height (5'11") may also work against him at the professional level although I overheard one scout liken him to Tim Hudson. Beede (3-2-0-0-0-6) exhibited outstanding command of a low-90s fastball and solid secondary pitches. The 6-4, 200-pound righthander has committed to Vanderbilt.
Day Four (Sunday, August 8)
The two early games were low-scoring affairs with Phillip Evans (La Costa Canyon, Carlsbad, CA) the only player to produce two hits in the opener. He plays hard but is not the best-bodied or most toolsy athlete in the tournament. However, he did make an over-the-shoulder catch that turned heads earlier in the week.
Although he gave up two runs, righthander Mathew Troupe (Chaminade, West Hills, CA) fanned seven batters without allowing a walk in three innings. The Oregon State commit, who is now up to 6-1, 185 pounds, consistently pounded the strike zone (41 strikes and 14 balls) and may turn out to be an effective, if unspectacular pitcher.
In the third game, the White Sox's Mason Snyder (Marquette, Ottawa, IL) followed Tilson's aforementioned dinger with a double high off the 348-foot mark on the left-field wall. Dylan Delso (Broken Arrow, OK) went 2-for-2 en route to a 6-for-9 tourney with three BB and no SO. He topped all hitters in the Triple Crown of rate stats, putting up a line of .667/.750/1.000. Kyle Shaw and Ty Hensley (both from Santa Fe, Edmond, OK) touched 90 but generally worked in the mid- to high-80s. Kevin Comer (Seneca, Tabernacle, NJ) of the Yankees was the most impressive pitcher of the game as he whiffed nine in four innings while allowing only one hit, one walk, and one run. The righty's fastball sat at 87-89 and peaked at 90 but it was his secondary pitches that caught my eye, including a 76-78 mph slider with good tilt, a changeup with fade, and a two-seamer with tailing action that he used primarily against LHB.
In the finale, Elliot Richoux (The Woodlands, TX), a lefthanded-hitting first baseman, bombed a double off the top of the wall in right field (although it should be noted that the pitch was an 80-mph "fastball" from someone who will most likely stick at his more natural first base position). McElroy picked up a couple hits en route to a 4-for-7 tourney with two stolen bases. The righthanded lead-off hitter and a bunt single and ran a 4.39 to first base on a broken bat groundout to the second baseman. Nick Williams (Ball, Galveston, TX), a 6-2, 185-pound outfielder, deserves mention for recording the best SPARQ test results on Thursday despite being a member of the 2012 class. Only 16, his baseball skills are still a bit raw but his athleticism coupled with his tall, projectable body suggest he could be one of the top players in the Area Code Games next summer.
Zac Freeman (Lowndes, Valdosta, GA) was, for me, the most impressive player on Oakland's squad. He went 3-for-10 with a double and a triple plus three walks and made an outstanding diving catch going to his left in shallow center field. Disregarding his poor pitching performance on Monday, the only criticism is perhaps an overly aggressive swing that led to six whiffs in 13 plate appearances.
Parker French (Dripping Springs, TX), a big righthander, started for Texas and pitched two shutout innings with four Ks. He was popping the catcher's glove with a 90-93 mph fastball and threw several 76-78 slurves, as well as at least one plus changeup. Hayman was 90-91 but lacked consistent command in his second appearance and Darren Whatley (Bibb County, Centerville, AL) was 88-90 with his four-seamer and generally 85 with his two-seamer.
Day Five (Monday, August 9)
I didn't make it out to Blair Field on Monday in what was the final full-day schedule of the six-day tournament. The primary attraction was the all-California matchup between the Milwaukee Brewers Blue and White teams. Of note, all of the players on the Blue side are from Southern California while the majority of the players on the White are from Northern California. As it turns out, the Blue beat the White, 5-1.
Owens made his second start of the Area Code Games, hurling two hitless, scoreless innings while striking out and walking two. With four innings of no-hit, no-run ball and eight Ks, Owens was probably the star of the showcase event. Assuming good health, the sky is the limit for this special talent.
Aflac All-American Daniel Camarena (Cathedral Catholic, San Diego, CA) knocked in the first run for the Blue with a long double to straightaway center. The 6-2, 200-pound L/L is a two-way threat who has committed to University of San Diego. Baseball America sees him as a "high average, low strikeout, gap-to-gap, line drive hitter." Teammate Austin Hedges (JSerra, San Juan Capistrano, CA), also an Aflac selection, had two hits and was 4-for-10 overall. He is an outstanding defensive catcher with a strong arm that was obvious to anyone paying attention before and during the games. Flamion just missed jacking a home run down the RF line for the White, a blast that TrackMan recorded at 385 feet or what would have been the longest hit of the tournament had it gone fair.
The Brewers White team played back-to-back games, coming off a 10-1 win over the A's before facing their Blue rivals. Dante Flores (St. John Bosco, Bellflower, CA), Blake Grant-Parks (Yuba City, CA), and Kevin Kramer (Turlock, CA) each contributed two hits in the victory. The 5-10, 160-pound Flores (5-for-10 with three 2B, two BB, and only one SO) is a highly skilled SS/2B, a local favorite who is likely to honor his commitment to USC.
Cincinnati's Kavin Keyes (Alta, Sandy, UT), a switch-hitting infielder, led the offense, going 2-for-3 with a double and finishing the tourney with a .500 AVG (7-for-14). Stankiewicz, meanwhile, sparked the defense with two web gems at second base. The switch hitter has committed to Cal State Fullerton. The Nats' Clint Coulter (Union, Camas, WA) and Austin Diemer (Rocklin, CA), a late add to Washington's roster, produced all five of their team's hits in 2-0 victory over the Yankees. Seven pitchers threw one inning each with only Blake Snell (Shorewood, Shoreline, MA) striking out two.
Day Six (Tuesday, August 10)
On the final day of the Area Code Games, the manager of the A's let McCue stretch out his arm by throwing 69 pitches over the first four innings (4-4-1-1-1-4). He led all pitchers with six innings of work.
Cameron Gallagher (Manheim Township, Lancaster, PA), an Aflac All-American catcher, went 2-for-3 with a double, raising his overall average to .273 with three hits in 11 AB. The 6-3, 215-pounder has committed to East Carolina.
Although hope and change has been a popular phrase the past two years, it's really Hope and his curveball. The Chicago righthander threw two scoreless innings, once again using his put-away breaking ball to strike out five batters to give him a total of eight in just four frames. Kukuk, Fulmer, lefty Brett Lilek (Marian Catholic, Chicago Heights, IL), and Shaw followed Hope to the mound, combining to pitch six innings while allowing just one hit two walks, and one run. Lilek struck out the side in the seventh. It was a bit of redemption for the junior-to-be as he allowed three runs (two earned) in his only other outing of the tourney. Eierman was the offensive star, going 3-for-4 and lifting him into the top ten for H, AVG, SLG, and RBI.
In the final game of the tournament, McCreary started for the Milwaukee Blue club and threw two innings but failed to punch out anyone in his two appearances. Giolito gave up five hits, two walks, and seven runs in 1.2 IP, showing once again that he is far from a finished product. Camarena tripled and scored two runs. At the other end of the spectrum, Max Homick (Rancho Bernando, San Diego, CA), projected by Baseball America to go in the first round in 2011 in a mock draft back in March, had a forgettable tournament, failing to get a hit in 11 AB while striking out four times. His highlight was throwing out a runner at home from left field. Keyes and Brett Harrison (Green Valley, Henderson, NV) had two hits each for the victorious Reds. The latter went 5-for-11 with four BB, one HBP, and three SO in 16 PA overall.
The following players were the most notable in my judgment:
Top 5 Hitters
Top 5 Pitchers
For those of you who are interested in following high school prospects, be sure to tune in to the 2010 Aflac All-American Baseball Classic on Sunday, August 15 at 5 p.m. PDT. The game will be broadcast live nationally by Fox Sports Net.
| F/X Visualizations | August 09, 2010 |
SABR 40's New Technologies in Baseball Panel
Edit: Alan has uploaded PDFs of our talks for download here.
This past weekend I had the pleasure of attending the SABR 40 in Atlanta. I had never been to a SABR meeting before, but was invited to be on the New Technologies in Baseball panel by Alan Nathan. It was a great opportunity to talk with and hear the ideas of the other panel members: Alan; Rand Pendleton of Sportvision; Rob Ristango of Trackman; and Josh Kalk, former THT writer and current Baseball Operations Analyst for the Tampa Bay Rays. It was also cool to meet or reconnect with some people I had usually know only over the internet, Cory Schwartz, Dave Studeman, Cyril Morong, Sean Forman, Eric Van, and the great Rob Neyer.
I thought it would be interesting to give a quick recap of the New Technologies in Baseball Panel. Rand led off and gave a quick history of Sportvision (they started in 1998 and their first big thing was putting the 1st and ten line on NFL broadcasts). He then gave the history of the pitchf/x and hitf/x systems, which have been written about before and I will not rehash here. But then he talked a little bit about Sportvision's new product fieldf/x.
Most of us got our first preview of fieldf/x in last year's NYT article and then at last year's pitchf/x summit. Rand said the system is being tested right now in AT&T park in San Francisco. Like the pitchf/x system fieldf/x uses two cameras, but these cameras have higher resolution than the pitchf/x ones and are framed on the entire field rather than just the pitcher-catcher area. The aim is to track everything on the field: fielders, runners, the ball in play, throws. That is a very exciting prospect and the video from it that Rand showed was very cool. We will know more about the fieldf/x system in a couple weeks at this year's pitchf/x summit.
Next was Rob Ristango who talked about Trackman, that is a doppler-radar system that also tracks the pitch and ball in play. The system was originally designed for golf, where it is widely used, but is now being used in baseball, cricket, and soccer. The system has one radar, high and behind home plate. Rob said that the system is installed and running in a number of MLB parks, when pressed for a specific number by a questioner he responded that the number is greater than one but less than thirty.
Trackman, which measures the location of the ball 48,000 times every second, directly measures the spin of the ball, rather than back calculating it form the trajectory like the pitchf/x system. Based on this Rob showed some very cool data already collected by the Trackman system. For example, curveballs with a higher spin rate had a greater swing and miss rate than those with a smaller spin rate. He also showed that the lower the vertical release angle on a curve out of a pitcher's hand the higher the swing and miss rate. Rob explained that since curves are slower and have more drop coming to the plate than other pitches pitchers have to release them at a higher angle else they end up in the dirt. But if the angle is too high batters can easily tell the pitch is a curve. So the lower the release angle, though still higher than the release on a fastball, the better the deception and higher the swinging strike rate.
Finally Rob said that although the Trackman data is not pubically available if you would like to contact them about your ideas of the data you can get in touch with Josh Orenstein who heads the Trackman Insights Lab (jko@trackman.dk).
I was next and I discussed some of my results on the success of a pitch based on its location in the strike zone. Readers here have surely seen this before and I will not bore you with a rehashing of that.
Next up was Josh Kalk. Josh, a former physics teacher, gave a great prop-based talk on the red dot that appears on sliders. As background he played some audio from an interview Reggie Jackson did on NPR's Fresh Air. On the clip Jackson talked about how good hitters have to be able recognize different pitches, and specifically mentioned the red dot seen on a slider.
To talk about how the red dot happens Josh showed how different pitches spin. Josh had a baseball with a dowel drilled in it. Josh held the dowel out so it was parallel to the lines of seats of the audience. He twisted the dowel back towards himself and told them to picture the ball coming towards them. This was pure backspin, the type of spin you would find on a four-seam fastball and that causes the pitch to drop less than expected due to gravity as it travels to the plate — a rising fastball. Then he twisted the dowel in the other direction, towards the audience. This was pure front spin: the type of spin that causes a pitch to drop more than expected due to gravity, and is found curveball.
Then Josh held the dowel perpendicular to the audience, holding the dowel with the ball out in front of him towards the audience. Again he told the audience to think of the ball coming towards them and he twisted the dowel clockwise (from the audience's perspective). He told the audience this clockwise spin had a rifling effect, this spin will not cause the pitch to 'move' off its initial trajectory and will actually work to keep the pitch on this initial trajectory (like the rifling action of a bullet out of a rifle). The gyroball has this type of spin, and in pitchf/x parlance would have close to 0 pfx_x and 0 pfx_z. Sliders — which tend to have small pfx_x and pfx_z values — have a spin very close to, though not exactly, this rifling spin. Now picture if a seam is facing the batter while the pitch spins this way. Part of the seam will always be right in the middle of the ball as it rifles towards the batter. This will cause a red dot to appear. Because of the way pitchers hold the ball when they throw a slider there will tend to be a seam facing the batter.
To demonstrate this phenomenon Josh had another prop, a ball affixed to the end of a power drill. When Josh fired up the drill the ball spun around and the red dot appeared. Josh slowly panned the drill around so that all members of the audience could get a chance to see it. Unfortunately the ball was not perfectly attached, and part way through the demonstration the ball went flying off, nearly hitting Alan and bouncing under the table were we sat. Some real excitement! Even with the technical difficulties, and maybe because of them, Josh gave quite an informative and entertaining talk.
Alan was up last and gave four examples of new technology in baseball. The first two involved Marinao Rivera, showing his incredible bimodal pitch distribution, which I have talked about here, and then showing how the trajectory on Rivera's cutter gives it the illusion of having late break. Alan then showed, using hitf/x data, how BABIP and HR rate vary by launch angle and exit speed. BABIP peaked at 11 degrees while HRs at 30 degrees. This demonstrated the tradeoff between hitting for average, high-BABIP line drives, and hitting for power, high-HR fly balls. Finally Alan showed how he used hitf/x and Hit Tracker combined to reconstruct the full trajectories of HRs from 2009. With the complete trajectory he could compare how far the HRs actually went to how far they would have a vacuum. He used this quantity to measure the effect environment (wind, temperature, elevation) on fly balls in each park. This was work Alan had presented at the 2009 pitchf/x summit.
All in all it was a great time and very cool to see the work that Sportvision and Trackman are doing to develop new ball-tracking technologies and the work that others (people like Alan, Josh and me) are doing to analyze that data.
| Touching Bases | August 05, 2010 |
Does Pedigree Matter?
Ben Zobrist was a sixth-round pick who had done nothing special in the first three years of his Major League career, but then put up one of the best seasons in baseball in 2009. Ryan Zimmerman, the fourth overall pick of the 2005 draft, put all the pieces together and became one of the best players in baseball in 2009. We perceive them differently mainly because Zimmerman is a much better player, but the point I'd like to make is that their original draft status--their pedigree--also factors into how we think of these guys. Should it affect our projections going forward?
Projections are hard. Instead, I broke players into three groups depending on whether they surpassed their previous year's WAR, fell short of their previous year, or they didn't play at all. Data courtesy of baseballprojection.com. And using Retrosheet, I broke players' pedigrees into five grades. Top 10 draft picks, rest of the first round, second-third rounds, third-tenth rounds, and anything after that.
As you can see below, from the first year in the Majors to the second, first-round draft picks (the As and Bs) have a much higher improvement rate than lesser prospects.
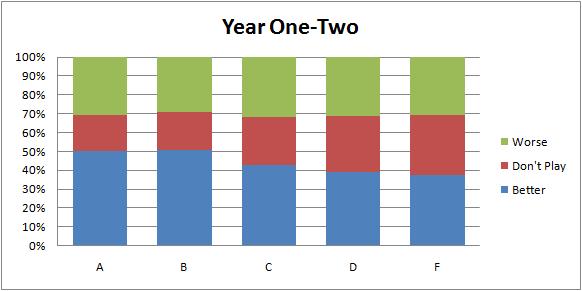
There are a lot of things going on here. First of all, The better prospects are younger, and are therefore more likely to improve. Also, The better prospects are given more leeway to fail, so there is a much lower percentage who do not play in the subsequent year. And yes, I think that at this point, they are probably better players than their counterparts, production being equal.
How about year two to year three?
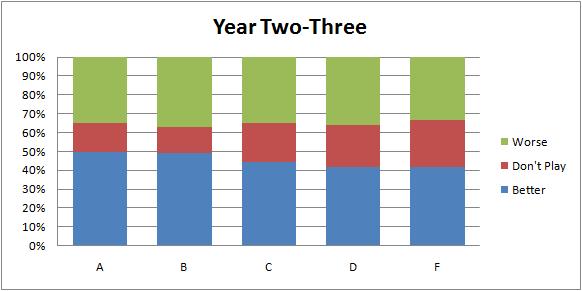
More of the same. Higher pedigree players are still improving at a higher rate.
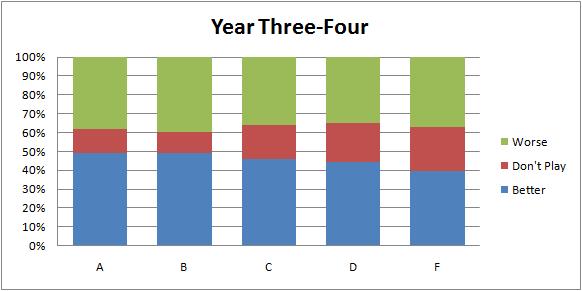
This effect is starting to appear consistent. Let's keep going.
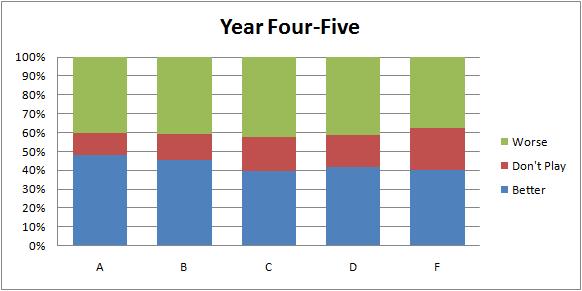
We need until the fifth year to see pedigree becoming negligible.
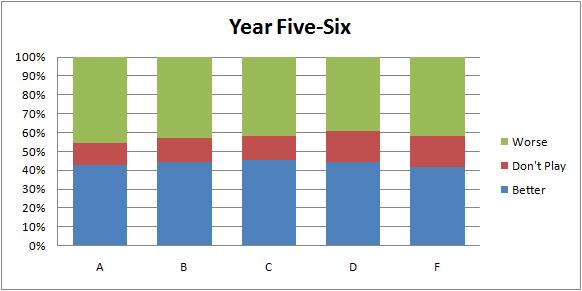
Controlling for the quality of the player by creating a projection is necessary to make any conclusions. Nevertheless, I think the matter warrants further consideration. Projection systems are sometimes built to use data as far back as college, but I haven't heard of any that include draft position, really the only prospect grading system for which there is a large volume of discrete data. A draft pick provides a snapshot of what up to 30 MLB teams all with presumably independent and sophisticated thought processes thought of a single player at a single time. That picture fades, but even when a player makes the Majors, it's still part of his history.
| Change-Up | August 04, 2010 |
The Surprising Toronto Blue Jays
![]() Last year about this time, on July 29th to be exact, I wrote a piece here at Baseball Analysts wondering how close the Baltimore Orioles were to competing in the AL East. They were 13 games under .500 at the time with a solid young core and a fast-rising crop of top prospects. Since then, the O’s are 54-114. Well it’s that time of year again and as a loyal Red Sox fan it’s my obligation to give another AL East team, the Toronto Blue Jays, that same treatment.
Last year about this time, on July 29th to be exact, I wrote a piece here at Baseball Analysts wondering how close the Baltimore Orioles were to competing in the AL East. They were 13 games under .500 at the time with a solid young core and a fast-rising crop of top prospects. Since then, the O’s are 54-114. Well it’s that time of year again and as a loyal Red Sox fan it’s my obligation to give another AL East team, the Toronto Blue Jays, that same treatment.
No, but seriously, the Blue Jays are good. They won their 8th game in 11 tries last night, including two straight in the Bronx against the New York Yankees. Against baseball’s best lineup, Blue Jays starters Brandon Morrow and Ricky Romero struck out a combined 13 Yanks in 14.1 innings, walking just 3 along the way. Romero tossed a complete game 2-hitter last night. For more on Morrow, check out Rich Lederer’s piece from Monday. The Blue Jays trail the Yankees by 9 games in the loss column for the Wild Card, and the Red Sox, who are in contention according to many, sit just 3 games ahead of the Jays in the loss column.
Coming into this season, without the services of Roy Halladay, things were supposed to be bleak north of the border. There seemed to be a consensus that the Jays would be the new Orioles, AL East doormats, while the Orioles would turn into the team the Jays have been for so long: the club that needed to just get the hell out of the AL East. Instead, both teams have held steady in their “rightful” 4th and 5th place in baseball’s toughest division. Looking around the Jays organization, there’s plenty to be excited about. The offense is pounding the ball, the pitching is young and promising, there’s lots of money coming off the books this year, prospects are on the way and the early returns on General Manager Alex Anthopoulos are terrific.
Let’s start with the offense. The Jays rank 26th in Major League Baseball in batting average, but rank 9th in the Majors in runs scored. Their free-swinging ways can cost them at times but on the whole, they’ve made it work thanks to a couple of big bats. Incredibly, Jose Bautista leads Major League Baseball with 33 home runs, 6 bombs clear of Joey Votto of the Cincinnati Reds. Vernon Wells, who hit .265/.317/.426 in 1,792 plate appearances from 2007 to 2009, has bounced back in a big way, slugging .534 this season with 22 round-trippers. He may not quite be earning that hefty contract, but this level of production for a couple of more seasons from Wells will ease the pain of one of the worst contracts in recent memory. Other highlights include the catching combo of John Buck and Jose Molina, one of the most effective backstop duos of 2010.
What’s most incredible about the Jays offense is its productivity despite lackluster seasons from Aaron Hill and Adam Lind. In 2009, his 27-year old season, Hill hit .286/.330/.499 and was one of the most productive second basemen in the game. Lind, just 25 last year, hit .305/.370/.562. This year Hill is “hitting” .213/.289/.395 while Lind has “contributed” a .219/.278/.379 line. Both are in their prime, both were productive last year, and both have been awful. As I think about what Hill and Lind’s catastrophic under-performance means for the longer-term hopes of the organization, I don’t worry too much. They both have track records and are young enough to straighten things out.
The overall run prevention has been just middle of the pack, but that’s due in large part to a mediocre defensive unit. The team’s FIP and xFIP ranks third and fourth respectively in the American League. Morrow’s peripheral statistics have been superb, while Romero has shown flashes of brilliance in just his second Major League season. Two more cost-controlled starters, Brett Cecil and Shaun Marcum, have turned in solid campaigns as well. This is a good young rotation, and one that figures to remain together for a few years:
              Age      AL xFIP Ranking
Romero        25             7
Marcum        28            10
Cecil         25            31
Morrow        23            12
The future is bright for Toronto’s starting pitching staff. For depth, they have arms like Kyle Drabek, Zach Stewart and Brad Mills on the way, and they could always dip into the free agent market for a 5th starter while they wait for their prospects to develop.
Speaking of the future, General Manager Alex Anthopoulos seems to be tending to it nicely. His swap of Alex Gonzalez and prospects for 26-year old Yunel Escobar was nothing short of a masterstroke. Sure Escobar had some problems in Atlanta, but he’s productive both offensively and defensively and cost-controlled. Anthopoulos parlayed a stopgap option like Gonzalez into his shortstop through 2013. The Jays GM will have some money to work with this off-season, too, as the team’s 2nd, 3rd and 4th highest paid players will all come off the books (assuming he does not offer arbitration to the inconsistent Edwin Encarnacion).
As it stands, the Jays will need to add depth at the corner infield positions and also determine if J.P. Arencibia is close enough to assume catching duties, as Buck will be a free agent after this season. Toronto does have a $1 million club option should they wish to retain Jose Molina.
But the core is in place. With continued development from the starting pitching, bounce back from Lind and Hill and a few more shrewd moves from Anthopoulos, the Jays could sneak into the AL East mix sooner than many think.
| Touching Bases | August 03, 2010 |
| Touching Bases | August 03, 2010 |
Velocity and Height
Although tall pitchers have the advantages of long arms and long strides, there is a larger player universe of shorter pitchers, so shorter pitchers compensate with other attributes. Therefore, one would expect there to be little correlation between height and fastball velocity for Major Leaguers. I took the top 10% fastest pitches for each pitcher 2008-2009, and found little relationship between velocity and height.
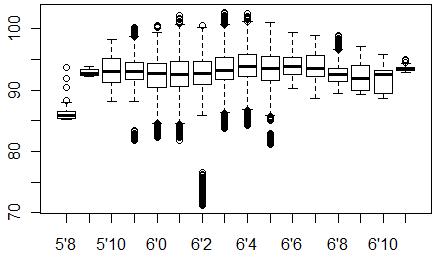
Clearly, that's Wakefield who is the only pitcher unable to reach 80 MPH. Only pitchers between 6 feet and 6'6" have hit 100, which I suppose is interesting.
The inherent advantages of being tall are masked by looking at things this way. Still, I thought that I would be able to find some sort of height benefit by looking beyond raw velocity. I was wrong.
My idea was to look at the difference between the velocity normally estimated at the 50-foot mark by PITCHf/x cameras and the velocity estimated at home plate. Hypothetically, I thought, tall pitchers should release the ball closer to home plate than shorter pitchers, and therefore there should be a smaller difference between the starting and ending velocity of such a pitch. The data didn't back that up, and the more I think about it, the less the hypothesis makes sense.
I tried to fit a model using height, velocity, release point, and spin to predict the drop in velocity from start to finish. Kei Igawa lost the least velocity, and Igawa's been known in his brief time for an extremely long stride, while Shaun Marcum lost the most velocity, and I was able to find some research showing he had a short stride. Yet I think the list is mostly random.
If two objects, acted upon by different forces, are traveling at the same velocity at any given point with the same atmospherics, then the original point of impetus shouldn't really make a difference in their rate of deceleration. So unless a pitcher is releasing the ball within 50 feet, I think the initial velocity is the only PITCHf/x recording one needs, and height doesn't matter with this type of data.
Be sure to check out Eric Seidman's work on perceived velocity.
| Baseball Beat | August 02, 2010 |
Tonight is the First Day of the Rest of Morrow's (Potentially Great) Life
Brandon Morrow of the Toronto Blue Jays is scheduled to face the New York Yankees tonight in the first of a three-game series. The 26-year-old righthander, who is coming off two consecutive victories over the lowly Baltimore Orioles, will find the going more difficult on the road this evening against the team with the best record in the majors. That said, while it is only one game, I wouldn't bet against him.
Although Morrow's back of the baseball card stats (7-6, 4.62 ERA) are rather pedestrian, there are signs that the fifth overall pick in the 2006 draft could be on the verge of becoming one of the elite starters in the game. Call it hyperbole if you'd like but digging deeper into the stats indicates that Morrow has the makings of a top-shelf pitcher. Let me count the ways:
1. Throws gas. Morrow's fastball has averaged 93.7 mph this year, ranking eighth among all qualified starters and ahead of hard throwers such as Francisco Liriano, Mat Latos, CC Sabathia, Jon Lester, Matt Garza, Tommy Hanson, A.J. Burnett, and Max Scherzer.
2. Possesses a wicked slider. He has the 15th-highest run value and the 12th-best per 100 pitches.
3. Exceptional strikeout rate. He leads the majors with a 9.96 strikeouts per nine innings.
4. Stingy home run rate. At 0.64 HR/9, he ranks 27th among 106 qualified starters.
5. Superb advanced metrics. He is 21st in SIERA and tied for 22nd in Fielding Independent Pitching ERA. He also ranks sixth in BP's Stuff, "a rough indicator of the pitcher's overall dominance, based on normalized strikeout rates, walk rates, home run rates, runs allowed, and innings per game." He trails five of the best pitchers in the game: Francisco Liriano, Jered Weaver, Jon Lester, Josh Johnson, and Cliff Lee.
6. Swinging strikes. Morrow (11.0%) is sixth among all qualified starters in the percentage of swinging strikes. Only the aforementioned Liriano (12.6%), Johnson (11.8%), Weaver (11.2%), plus Cole Hamels (11.7%) and Tim Lincecum (11.2%) have induced higher percentages.
So what's holding Morrow back? He has the second-highest BB/9 (4.22), the sixth-highest BABIP (.343), and the 17th-lowest LOB% (68.4%). While the walk rate is clearly his own doing, the BABIP and LOB% may be a combination of poor defense, a lack of bullpen support, and being on the wrong side of the luck factor this season. The good news is that Morrow's propensity of allowing free passes has been diminishing throughout the season. He allowed four or more walks in five of his first ten starts but has only given up a similar number in just one of his last ten outings, a stretch in which he has surrendered two or fewer bases on balls seven times.
With respect to tonight's game, Morrow is 1-0 with a 2.84 ERA in four career starts against New York. He has faced the Yankees twice in the past two months, completing 13 innings while allowing 13 hits, two walks, six runs, and punching out 15 batters.
If you get the chance, you might want to tune in. If nothing else, it will put you one step ahead of Jack Zduriencik, the Seattle GM who traded Morrow last December for Brandon League and Johermyn Chavez. The latter, who was ranked by Baseball America as Toronto's 21st-best prospect, holds the key to the deal for the Mariners as a one-for-one transaction involving the two Brandons would have been highly advantageous in favor of the Blue Jays. Signed as a 16-year old out of Venezuela, Chavez, 21, is hitting .314/.383/.586 at High Desert, a notoriously hitter-friendly ballpark in the California League. A corner outfielder with limited range, Chavez will have to hit his way to the big leagues.
Meanwhile, Toronto doesn't need to wait until tomorrow for its payoff as the now-ready Morrow is only hours away from facing the Yankees once again and a few more supporters from being recognized as one of the better starting pitchers in the league.