Rich Lederer • Baseball Beat
Patrick Sullivan • Change-Up
Jeremy Greenhouse • Touching Bases
Dave Allen • F/X Visualizations
Sky Andrecheck • Behind the Scoreboard
Marc Hulet • Around the Minors
Al Doyle • Past Times
Retired Uniforms:
Bryan Smith • WTNY
Joe Sheehan • Command Post
Jeff Albert • The Batter's Eye
RSS Feed
Home
*Examining the Past, Present, and Future*
Lineup Card
Recent Entries
» Putting Together a Reality Team
» Historical Hall of Fame Vote Comparisons: 2012
» An All-Christmas Team
» The New-Look Angels
» John Denny: The Forgotten Cy Young Award Winner
» Money Isn't Everything
» What Would It Take to Hit .400 in the 21st Century?
» Halos Heaven
» Brandon McCarthy's Breakout Season
» Link-o-Rama
» Historical Hall of Fame Vote Comparisons: 2012
» An All-Christmas Team
» The New-Look Angels
» John Denny: The Forgotten Cy Young Award Winner
» Money Isn't Everything
» What Would It Take to Hit .400 in the 21st Century?
» Halos Heaven
» Brandon McCarthy's Breakout Season
» Link-o-Rama
Best of Baseball Beat
Abstracts From the Abstracts
1977 Baseball Abstract
1978 Baseball Abstract
1979 Baseball Abstract
1980 Baseball Abstract
1981 Baseball Abstract
1982 Baseball Abstract
1983 Baseball Abstract
1984 Baseball Abstract
1985 Baseball Abstract
1986 Baseball Abstract
1987 Baseball Abstract
1988 Baseball Abstract
1978 Baseball Abstract
1979 Baseball Abstract
1980 Baseball Abstract
1981 Baseball Abstract
1982 Baseball Abstract
1983 Baseball Abstract
1984 Baseball Abstract
1985 Baseball Abstract
1986 Baseball Abstract
1987 Baseball Abstract
1988 Baseball Abstract
Bert Blyleven Series
Meeting Up and Hanging Out with Bert
The Results Are In And...
Aficionado Heavily Invested in Blyleven
Latest on Blyleven's Chances for the HOF
The Internet Zealot Responds
400 Down and 5 to Go...
Bert Be Home By Eleven?
Blyleven's Forgotten Season (1973)
HeyMan, Your Comments Don't Hold Water
The Waiting is the Hardest Part
Another Addition to the Blyleven Series
Search for the Truth
As Dominant as His HOF Contemporaries
Listen, Buster
A Larger Step for Blyleven
Answering the Naysayers (Part Two)
Another Small Step for Blyleven
Q&A: Blyleven on the Twins
The Majority Rules, Right?
It's All Dutch to Some
The Hall of Fame Case for Bert Blyleven
Q&A: Blyleven on Felix Hernandez
Clemens Rocketing Up Charts
Poz: An Interview With a KC Star
A HOF Chat with Tracy Ringolsby
Up Close and Personal
A Peek Into the Mind of a HOF Voter
Answering the Naysayers
It's That Time of the Year (Again)
"If Cooperstown is Calling..."
The Bert Alert
One Small Step for Blyleven...
Only the Lonely
Exclusive Interviews
Lee Sinins
Alex Belth
David Pinto
Will Carroll
Mike Carminati
Aaron Gleeman
Joe Sheehan
Jay Jaffe
Jeff Peek
Tracy Ringolsby
Joe Posnanski
Bill James Part I, II, III
Jon Lalonde
Chuck Tiffany
Dayn Perry
Fay Vincent
Nate Silver
Alex Belth
David Pinto
Will Carroll
Mike Carminati
Aaron Gleeman
Joe Sheehan
Jay Jaffe
Jeff Peek
Tracy Ringolsby
Joe Posnanski
Bill James Part I, II, III
Jon Lalonde
Chuck Tiffany
Dayn Perry
Fay Vincent
Nate Silver
Bullpen
Rich Lederer
The Odd Couple (with Alex Belth)
The MostUnder Over Underrated Player in Baseball (with Brian Gunn)
Three Wise Men (roundtable by Alex Belth)
Infrequently Asked Questions (interview with Matt Welch)
Interview (Orioles Think Tank)
Bernie and the Yanks (Bronx Banter)
Hope and Faith: How the LAA Win the World Series (Baseball Prospectus)
NL West (The Soul of Baseball)
Greatest Living Hitter? (Sports Illustrated)
Roundtable: 2008 HOF Ballot (Armchair GM)
The Most
Three Wise Men (roundtable by Alex Belth)
Infrequently Asked Questions (interview with Matt Welch)
Interview (Orioles Think Tank)
Bernie and the Yanks (Bronx Banter)
Hope and Faith: How the LAA Win the World Series (Baseball Prospectus)
NL West (The Soul of Baseball)
Greatest Living Hitter? (Sports Illustrated)
Roundtable: 2008 HOF Ballot (Armchair GM)
Patrick Sullivan
Designated Hitters
David Bromberg (Q&A: John Denny)
Mark Armour (H. Killebrew and Versatility)
Joe Lederer (Soundtrack of a Prospect)
David Bromberg (Clemente's Autograph)
David Bromberg (Woody Fryman)
D. Baumstein (WAR Against Age: Pitchers)
Doug Baumstein (The WAR Against Age)
Doug Baumstein (A Lifetime on the Road)
John Fraser (Pick Six)
Mark Armour (How to Score More Runs?)
Bill Parker (What Opening Day Tells Us)
Stan Opdyke (Pat Rispole)
Chris Jaffe (Evaluating Baseball's Mgrs)
Stan Opdyke (Baseball Radio in NYC, 1953)
A. Nathan (Performance of Baseball Bats)
Michael Weddell (Edgar Martinez/HOF)
Jon Weisman (100 Things Dodgers Fans...)
Stan Opdyke (Connie Mack and Vin Scully)
Eric Walker (Evaluating Run Production)
Brent Mayne (The Intangibles of Catching)
Chris Moore (Best Fastballs in Baseball)
Dave Baldwin (The Batter’s Brain)
Shawn Haviland (Ivy League to MLB)
Larry Granillo (Walking Off)
Rob Iracane (Solo HR Won't Break You)
Tommy Bennett (Charm of AM Radio)
Harry Pavlidis (Johan Santana's Fast Start)
John Walsh (WAR and Remembrance)
Eric Walker (Precisely Inaccurate)
Bob Timmermann (As They See 'Em)
Geoff Young (Unicycles and Delusions)
Baseball Analysis at Tufts (Groundballers)
Baseball Analysis at Tufts (GB Out Rates)
G. Rybarczyk ('09 Hit Tracker Projections)
Joe Lederer (Curt Schilling/HoF)
Conor Gallagher (Hall of Fallacies)
Chris Green (Jim Rice, HoF, the Numbers)
Shawn Hoffman (Baseball's Bear Mkt?)
Paul Anthony (Manny Syndrome)
Ross Roley (World Series Odds)
B. Timmermann (Catcher's Interference)
R.J. Anderson (Waiting the Hardest Part)
Maury Brown (Cubs, MLB, and Cuban...)
Myron Logan (Dee-Fense, Dee-Fense)
Craig Calcaterra (Frivolity, Part I, Part II)
Chad Finn (Ode to Baseball Cards)
David Cameron (Mariners Foibles)
Chris Dial (Chipper Jones)
Pat Lederer (Memory Lane)
David Appelman (Clutch Pitching)
Bob Rittner (DH)
Jonathan Mayo (Roger Clemens)
Lisa Winston (My Son-in-Law...)
Russ McQueen (The Yellow Hammer)
Bob Rittner (I'm OK, You're OK)
Mark Armour (In Defense of the HOF)
Pat Jordan (Friends)
Dan Levitt (Analysis of Terry Ryan)
Doug Baumstein (Trading Econ 101)
Ross Roley (Runner's Reluctance II)
Ross Roley (Runner's Reluctance I)
Mark Armour (No-Longer Lovable Sox)
Bruce Regal (Stealthy and Wise)
Brian Gunn (Roid Monster)
Current/McEvoy (Value of the SB)
John Rickert (Sinister Thefts)
Nate Silver (Sabermetrics)
David Vincent (Home Run Production)
Joe P. Sheehan (Enhanced Gameday II)
Mark Armour (An Ode to Sport)
David Gassko (All-Time Worm Burners)
Joe P. Sheehan (Enhanced Gameday)
John Walsh (When Titans Clash)
Fox/Williams (Quantifying Coaches II)
Fox/Williams (Quantifying Coaches I)
Jacob Luft (Bull Durham Rant)
Chad Finn (Strat-O-Matic)
Lisa Winston (Rotisserie Baseball)
Dave Studeman (Baseball Stats)
Steve Treder (Roger Craig)
Marc Normandin (Jeff Bagwell)
D. Appelman (Expanding Strike Zone)
Jeff Sackmann (Worst MiL Defenders)
Jeff Sackmann (Best MiL Defenders)
Maxwell Kates (Van Lingle Mungo)
David Appelman (Pitch Location)
Kent Bonham (Danny Ray Herrera)
Glenn Stout (Two Baseball Poems)
Bruce Regal (The Challenge Round)
Mark Lamster (Barry & Ty)
Geoff Young (NL West)
Tom Lederer (The Ryan Express)
Brian Erts (Great Leap Forward)
David Pinto (Parity and the N.L.)
Jacob Luft (Fathers and Daughters)
Jamey Newberg (Pete's Sake)
Jeff Albert (A. Jones Swing Analysis)
Jeff Albert (A-Rod Swing Analysis)
Keith Law (Death, Taxes, and Waivers)
Peter Abraham (Tales of Torre Tales)
Larry Borowsky (Let 'er Rip II)
Dan Levitt (Empirical Analysis of Bunting)
Jonah Keri (If I Met Warren Cromartie...)
Bob Klapisch (War Stories)
Bob Timmermann (John F. Kennedy HS)
Kent Bonham (Aluminum Adjustments)
Al Doyle (More Than Superstars)
Ross Roley (Instant Replay)
David Vincent (Barry Bonds Homers)
Chad Finn (Our Favorite Obscurities)
Bill Deane (1979 NL MVP)
Mark Armour (Rise/Fall of Artificial Turf)
Jeff Angus (Wally Moon Camp)
David Berri (Money and Baseball)
Larry Borowsky (Baseball w/o the #s)
Derek Zumsteg (The Irrational Market)
David Regan (Free Agent Contracts)
Peter Schmuck (Steroids and the HOF)
David Appelman (Pitchers, Pitch by Pitch)
Dan Fox (Swinging, Taking, Fouling, Etc)
Patrick Sullivan (Study of NYY CF/BOS LF)
Will Leitch (Baseball Journalism)
Jeff Sullivan (Pitcher Release Points)
Steve Treder ('69-'70 Giants)
Maury Brown (Charlie Finley)
John Brattain (Bob Johnson)
Bob Klapisch (The Case for Bert Blyleven)
Jeff Peek (Pride and Prejudice)
Dayn Perry (Bert and Warren)
Rob Neyer (If Don Sutton Was Great...)
Lisa Winston (Minor League Memories)
Alex Belth (Otis Redding Was Right)
David Cameron (Long Live the King)
Jeff Angus (Baserunning Study)
Bert Blyleven (Baseball Playoffs)
Boyd Nation (Not a Prospect List)
James Click (Batters-Baserunners Study)
Jeff Shaw (Why I Love Baseball)
David Gassko (BIP/BFP Fielding Study)
Jay Jaffe (Milwaukee Sausage Race)
Jamey Newberg (Remember When)
Bob Klapisch (Press Box to the Mound)
Dan Levitt (Predictive Value of BB)
David Vincent (Official Scorer)
Jon Weisman (Rick Monday)
Larry Borowsky (Let 'er Rip)
Will Carroll (Fictional Short Story)
Bob Timmermann (Japanese Baseball)
Cyril Morong (Best Pitching Seasons)
Sean Forman (Monte Carlo Win-Loss)
Brian Gunn (My Little Blue Book)
Joe Lederer (My Dad and Baseball)
Bill Deane (Bob Gibson, 1968)
Mark Armour (1977 Yankees)
Darren Viola (Retrosheet)
David Pinto (RFK)
Dayn Perry (Brave Heart)
Matt Welch (Dave Hansen)
Kevin Kernan (Jack McKeon)
Tom Lederer (Dodgers Road Trip)
Steve Lombardi (Slider)
Studes (Picturing Baseball)
Mike Carminati (Luck of the Drawl)
Eric Neel (Vin Scully)
J.C. Bradbury (Leo Mazzone)
John Sickels (Bill James)
Search Baseball Analysts
Archives
By Category:
Around the Majors Content Only
Around the Minors Content Only
Baseball Beat Content Only
Baseball Beat/Change-Up Content Only
Baseball Beat/WTNY Content Only
Behind the Scoreboard Content Only
Change-Up Content Only
Change-Up/Around the Majors Content Only
Command Post Content Only
Crunching the Numbers Content Only
Designated Hitter Content Only
F/X Visualizations Content Only
Past Times Content Only
Saber Talk Content Only
The Batter's Eye Content Only
Touching Bases Content Only
Weekend Blog Content Only
WTNY Content Only
By Month:
February 2012
January 2012
December 2011
October 2011
September 2011
August 2011
July 2011
June 2011
May 2011
April 2011
March 2011
February 2011
January 2011
December 2010
November 2010
October 2010
September 2010
August 2010
July 2010
June 2010
May 2010
April 2010
March 2010
February 2010
January 2010
December 2009
November 2009
October 2009
September 2009
August 2009
July 2009
June 2009
May 2009
April 2009
March 2009
February 2009
January 2009
December 2008
November 2008
October 2008
September 2008
August 2008
July 2008
June 2008
May 2008
April 2008
March 2008
February 2008
January 2008
December 2007
November 2007
October 2007
September 2007
August 2007
July 2007
June 2007
May 2007
April 2007
March 2007
February 2007
January 2007
December 2006
November 2006
October 2006
September 2006
August 2006
July 2006
June 2006
May 2006
April 2006
March 2006
February 2006
January 2006
December 2005
November 2005
October 2005
September 2005
August 2005
July 2005
June 2005
May 2005
April 2005
March 2005
February 2005
January 2005
December 2004
November 2004
October 2004
September 2004
August 2004
July 2004
June 2004
May 2004
April 2004
March 2004
February 2004
January 2004
December 2003
November 2003
October 2003
September 2003
August 2003
July 2003
June 2003
Reference
Organizational Stats
Arizona Diamondbacks Bat / Pitch
Atlanta Braves Bat / Pitch
Baltimore Orioles Bat / Pitch
Boston Red Sox Bat / Pitch
Chicago Cubs Bat / Pitch
Chicago White Sox Bat / Pitch
Cincinnati Reds Bat / Pitch
Cleveland Indians Bat / Pitch
Colorado Rockies Bat / Pitch
Detroit Tigers Bat / Pitch
Florida Marlins Bat / Pitch
Houston Astros Bat / Pitch
Kansas City Royals Bat / Pitch
Los Angeles Angels Bat / Pitch
Los Angeles Dodgers Bat / Pitch
Milwaukee Brewers Bat / Pitch
Minnesota Twins Bat / Pitch
New York Mets Bat / Pitch
New York Yankees Bat / Pitch
Oakland Athletics Bat / Pitch
Philadelphia Phillies Bat / Pitch
Pittsburgh Pirates Bat / Pitch
St. Louis Cardinals Bat / Pitch
San Diego Padres Bat / Pitch
San Francisco Giants Bat / Pitch
Seattle Mariners Bat / Pitch
Tampa Bay Devil Rays Bat / Pitch
Texas Rangers Bat / Pitch
Toronto Blue Jays Bat / Pitch
Washington Nationals Bat / Pitch
All-Star Links
Official Websites
News and Notes
Baseball News Blog
Baseball Newstand
ESPN Baseball
Fox Sports Baseball
Pro Sports Daily
Roto World
The Roto Times
USA Today Baseball
Baseball Newstand
ESPN Baseball
Fox Sports Baseball
Pro Sports Daily
Roto World
The Roto Times
USA Today Baseball
Reference and Analysis
Baseball Almanac
Baseball America
Baseball Archive
Baseball Contracts
Baseball Cube
Baseball Graphs
Baseball Library
Baseball Musings Player Database
Baseball Page
Baseball Primer
Baseball Prospectus
Baseball Reference
Baseball Statistics
Baseball Truth
Boxscore Central
Diamond Mind Baseball
Doug's Stats
FanGraphs
Fast Balls (pitchfx catalog)
Hardball Dollars
Hardball Times
Hit Tracker
Retrosheet
Rotobase/Rotoblog
Stat Corner
STATS
Tango on Baseball
Yahoo Sports MLB
Web Gems
Bill James Primer
Sabermetric Manifesto (Grabiner)
Pitching and Defense (McCracken)
Pitching and Defense (Tippett)
Transactions Primer (Neyer)
Baseball Stats (Batter's Box)
Prospect Report (Cameron)
Pitcher Workloads (Sheehan)
Goodbye to Old Baseball Ideas (Rickey)
Sabermetric Manifesto (Grabiner)
Pitching and Defense (McCracken)
Pitching and Defense (Tippett)
Transactions Primer (Neyer)
Baseball Stats (Batter's Box)
Prospect Report (Cameron)
Pitcher Workloads (Sheehan)
Goodbye to Old Baseball Ideas (Rickey)
Columnists
Baseball Blogs
Around the Majors
Athletics Nation
Baseball Crank
Baseball Musings
Baseball-Reference Blog
Batter's Box
Big League Stew
Bronx Banter
Catfish Stew
Cub Town
Dan Agonistes
Dodger Thoughts
DRays Bay
Ducksnorts
Futility Infielder
Halos Heaven
Inside the Rockies
It Might Be Dangerous
Knuckle Curve
LoHud Yankees Blog
Lookout Landing
Management by Baseball
Metaforian
Metsgeek
Mike's Baseball Rants
Only Baseball Matters
Redbird Nation
Red Reporter
Sabernomics (Braves)
Seth Speaks
ShysterBall
6-4-2 (Angels/Dodgers)
The Book
TheCubdom
The Cutting Edge
The House That Dewey Built
The View From The Bleachers
Tiger Blog
U.S.S. Mariner
Viva El Birdos
Where's Kernan
Minor Leagues
Arizona Fall League
BA Player Finder
Cal Leaguers
Jamey Newberg
JDM's Scoresheet Baseball
Minor League Baseball
Minor League Park Factors
Minor League Splits
No Pepper
Sickels' Minor League Ball
Warm October Nights
BA Player Finder
Cal Leaguers
Jamey Newberg
JDM's Scoresheet Baseball
Minor League Baseball
Minor League Park Factors
Minor League Splits
No Pepper
Sickels' Minor League Ball
Warm October Nights
Amateur
Boyd's World (College)
Cape Cod Baseball League
College Baseball Blog
College Baseball Insider
Collegiate Baseball Newspaper
College Splits
College Splits Blog
Dirtbags Baseball (Long Beach State)
NCAA Baseball
NCBWA
Team One Baseball (High School)
Texas A&M & Baseball
Cape Cod Baseball League
College Baseball Blog
College Baseball Insider
Collegiate Baseball Newspaper
College Splits
College Splits Blog
Dirtbags Baseball (Long Beach State)
NCAA Baseball
NCBWA
Team One Baseball (High School)
Texas A&M & Baseball
Historical
Cuban Baseball
House of David
Jim "Mudcat" Grant's Web Page
Negro League Baseball Players Assoc
Negro Leagues Baseball Museum
1919 Black Sox
Pacific Coast League
Philadelphia Athletics Historical Society
Shoeless Joe Jackson Society
SABR-L Archives
Walter O'Malley
House of David
Jim "Mudcat" Grant's Web Page
Negro League Baseball Players Assoc
Negro Leagues Baseball Museum
1919 Black Sox
Pacific Coast League
Philadelphia Athletics Historical Society
Shoeless Joe Jackson Society
SABR-L Archives
Walter O'Malley
Miscellaneous
Forums
Credits
Ticket Center
Tickets to Baseball -
Premium Red Sox Tickets - Tickets to Marlins Games - Cardinals Game Tickets - NY Yankee Tickets - Tickets Oakland Athletics - Dallas Cowboys Tickets - Arizona Cardinals Tickets - Tickets Seattle Seahawks - Buffalo Bills Tickets Online - Tickets to Dolphins Football
Buy Boston Red Sox tickets,
Philadelphia Phillies tix,
NY Yankees tickets,
NY Mets tickets, and
MLB All Star game tickets at ABC tickets
Not sure where to find the best online sportsbooks? Start your search with PlayersJet.
Get deals at SportsMemorabilia.com on baseball apparel, including Phillies jerseys and more for adults and children.
Shop the largest selection baseball equipment on sale at Sports Unlimited. Check out tons of baseball gloves, youth baseball gloves and catchers gear from Rawlings, Wilson, Nike & Under Armour.
2011 Draft Order
Courtesy of Baseball America
First-Round:
 1. Pirates (57-105)
 2. Mariners (61-101)
 3. Diamondbacks (65-97)
 4. Orioles (66-96)
 5. Royals (67-95)
 6. Nationals (69-93)
 7. Diamondbacks (for B. Loux)
 8. Indians (69-93)
 9. Cubs (75-87)
10. Padres (for Karsten Whitson)
11. Astros (76-86)
12. Brewers (77-85)
13. Mets (79-83)
14. Marlins (80-82)
15. Brewers (for Dylan Covey)
16. Dodgers (80-82)
17. Angels (80-82)
18. Athletics (81-81)
19. Red Sox (from DET for Martinez)
20. Rockies (83-79)
21. Blue Jays (85-77)
22. Cardinals (86-76)
23. Nationals (from CWS for Dunn)
24. Rays (from BOS for Crawford)
25. Padres (90-72)
26. Red Sox (from TEX for Beltre)
27. Reds (91-71)
28. Braves (91-71)
29. Giants (92-70)
30. Twins (94-68)
31. Rays (from NYY for Soriano)
32. Rays (96-66)
33. Rangers (from PHI for Lee)
Supplemental First Round:
34. Nationals (Dunn)
35. Blue Jays (Downs)
36. Red Sox (Martinez)
37. Rangers (Lee)
38. Rays (Crawford)
39. Phillies (Werth)
40. Red Sox (Beltre)
41. Rays (Soriano)
42. Rays (Balfour)
43. Diamondbacks (LaRoche)
44. Mets (Feliciano)
45. Rockies (Dotel)
46. Blue Jays (Buck)
47. White Sox (Putz)
48. Padres (Garland)
49. Giants (Uribe)
50. Twins (Hudson)
51. Yankees (Vazquez)
52. Rays (Benoit)
53. Blue Jays (Olivo)
54. Padres (Torrealba)
55. Twins (Crain)
56. Rays (Choate)
57. Blue Jays (Gregg)
58. Padres (Correia)
59. Rays (Hawpe)
| Designated Hitter | July 30, 2010 |
The WAR Against Age
In this article I examine at what ages baseball’s very best hitters had their best seasons as measured by wins above replacement (“WAR”). I looked at the top 40 position players in career WAR and plotted their top 5 seasons against their age during that season. Thus, with 200 data points in all, I created the below chart plotting a player’s personal top 5 season against his age. 
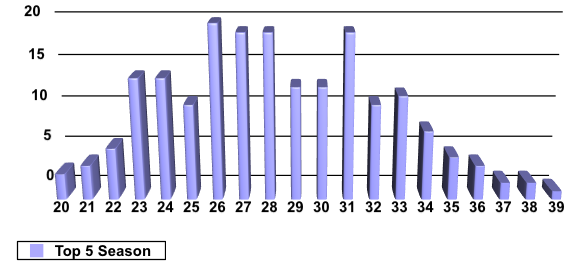
Obviously, looking just at the numbers is not that enlightening, so I also noted some of the more interesting results as they pertain to individual players. For example, the three 20-year old seasons that were among the personal top 5’s of the players on the list belonged to Mel Ott, Al Kaline, and Alex Rodriguez. I, for one, would not have guessed that one of A-Rod’s best seasons was his first complete season. The four 21-year old seasons that make the list belong to Rickey Henderson, Eddie Matthews, Jimmie Foxx and Ken Griffey Jr.
On the other end of the spectrum, the 39 year-old season belongs to Barry Bonds, who likely found his fountain of youth in a syringe. The two age 38 seasons on the list almost certainly had nothing to do with chemical enhancement, as they belong to Cap Anson and Ted Williams. Anson, as it turns out, was not only a great old-time player (even if less than a great human being), but was one of the greatest old players, turning in his best five seasons at 29, 34, 36, 37 and 38. Williams, for his part, of the top 40 hitters, had the biggest age gap among his top 5 seasons, turning in one at 38 and one at 23. That, however, is likely more a function of geopolitics than playing ability, as Williams turned in an 11.0 and 11.3 WAR season at the age of 23 and 22 in 1942 and 1941 and an 11.8 and 10.3 WAR season during his age 27 and 28 seasons in 1946 and 1947. Although, had he played and not fought in World War II there is no guarantee he would have exceeded the 9.9 WAR season he had at 38 years-old (10 WAR seasons are few and far between), had he had one such season during the three years between 1943 and 1945, the 15 year difference among his top 5 seasons would not have existed. Other top players who turned in at least two of their top 5 seasons more than ten years apart include Barry Bonds (age 28 to 39), Tris Speaker (24-35), Al Kaline (20-32), Carl Yastrzemski (23-33), Joe DiMaggio (22-33), Rickey Henderson (21-31), A-Rod (20-31), Eddie Matthews (21-31) and Chipper Jones (24-36).
A number of players put together their 5 best seasons in a row, showing a true peak and incredible consistency. Those players include Hank Aaron (25-29) (I always thought of him as someone who had his best years late, but he actually peaked on the young side), Honus Wagner (31-35) (a renowned older superstar), Joe Morgan (28-32), Wade Boggs (27-31) (I would not have guessed that he was a top 40 WAR hitter, and he was actually number 27, ahead of George Brett (number 30) who I consider the better player), Charlie Gehringer (30-34) and Rod Carew (27-31). A few others put up their best 5 seasons in a six year span, including Roger Connor (27-32), Roberto Clemente (31-36) and Jeff Bagwell (26-31). I find Clemente’s late surge especially interesting. I have always believed that, to the casual fan, Clemente was one of the most overrated players ever. He died after his age 37 season, shortly after the most productive stretch of his career, possibly increasing the halo effect surrounding his untimely and tragic death, and potentially creating a stronger impression of his playing abilities than might otherwise have been deserved had he gone through a typical decline phase.
I also looked at some players outside of the top 40 to see if there were any interesting patterns. Craig Biggio showed a consistent peak, turning in his top 6 WAR years from 28-33. Jim Edmonds showed a late peak, turning in his top five years from 31-35. Paul Molitor’s top five seasons also showed a late peak at the ages of 34, 35 and 36, although his age 25 and 30 seasons also constitute his top 5.
Conclusion
When I started this exercise (and I did look at a lot more stars from the so-called steroid era, even if they were not in the top 40), I expected to see that modern stars, as a result of advances in training, exercise, medicine and performance enhancing drugs would turn in the best “old” seasons. Other than Barry Bonds’ anomalous age 39 season, the evidence seemed to point the other way, as players such as Honus Wagner, Cap Anson and Roberto Clemente all showed later peaks than typical current-day star players. Also, I was surprised that 7 (or roughly one in six) of the superstars who I looked at turned in one of their top 5 seasons at age 20 or 21. While it is not surprising that superstars break in early, it is surprising that many had among their best seasons before they legally could buy a beer in today’s world (although Jimmy Foxx didn’t seem to have a problem in procuring a beer in his time).
I also performed a quick review of post-World War II pitchers. Although I did not find anything all that surprising, pitchers seemed to show a far greater dispersal in value at different ages. Time permitting, I will take a look at that data and prepare a similar study, and see if pitchers age differently than hitters or whether their peak seasons generally occur during their late 20’s.
Doug Baumstein is an attorney and Mets fan living in New York.
| Touching Bases | July 29, 2010 |
The Bridge to Mariano
Once upon a time, there was a man named Jeff. A man named Jeff and a man named Joe. Well, maybe you already know how the story begins.
The Great Mariano Rivera, the Hammer of God, had been banished to the bullpen, a failed starter. But John Wetteland welcomed him with open arms.
“You hand the ball to Buck,” Wetteland explained. “And Buck hands the ball to me.”
“Thank God for that,” said Mo.
But on October 8, 1995, Game 5 of the ALCS, Mariano handed the ball to Buck, and Buck handed it to Jack McDowell.
A man named Jeff. Jeffrey Allan Nelson had an idea. And a man with an idea is a powerful thing. Nelson was sitting in the Mariners bullpen during this, the first night of the Yankees Dynasty. Instead of celebrating his team’s victory, Nelson lost himself in thought. If only Wetteland had followed Mariano. What if bullpen roles were rigidly defined? No way would the Yankees give up runs! Bullpen roles so defined that the Yankees can forfeit wins by adhering to meaningless statistics used only in rotisserie leagues, arbitration cases and in deciding the Rolaids Relief Man Award!! Mmm, Rolaids.
Within a month, Joe Torre replaced Showalter as Yankees manager. Another month, and Nelson was shipped to the Bronx. The rest, as they say, was history, as they say.
In 1996, Nelson pitched in a team-leading 73 games, Rivera became the best reliever in baseball, and the Yankees won their first World Series in 18 years. And Wetteland won his Rolaids Relief Man Award.
But Wetteland left New York, and here’s where the story gets interesting.
Jeff pitched his plan to Joe.
Step 1: Assemble the best group of position players and starting pitchers in baseball so that the bullpen doesn’t really matter.
Step 2: Install Rivera as closer, ensuring a dominant bullpen.
Step 3: Build a fucking bridge.
And so it was. Joe Torre commissioned the building of a bridge. The Bridge to Mariano. Jeff was the architect, but he recruited his childhood friend Mike Stanton to help him build. Together, alternating shifts, they built the bridge. And what a bridge it was. It had aqueducts and arches and triangles and suspensions and all that stuff that makes bridges not spectacularly collapse. Quieter than the Bridge on the River Kwai. More flip than the Flipper Bridge. It was the most important bridge in the history of bridges. From 1997-2000, Stanton pitched to a 4.17 ERA and Nelson pitched to a 3.08. Their pitching was fine, and not much was made of it at the time. But what a bridge! How can you blame them for being pedestrian relievers when they were so busy building a fucking bridge?!?
Alas, in 2000, Jeff was passed over from the All-Star team by Joe, and upon leaving the Yankees, Nelson bitterly decreed, “Tear down this bridge.” Mariano was left bridgeless.
“Thank God for that,” said Mo.
The Yankees Dynasty crumbled with the departure of Nelson. Who could have known that the guy pitching 70-80 slightly leveraged innings per year could have been so influential? But as it turned out, Jeff was more than baseball. Jeff had pioneered, engineered and maintained the Bridge to Mariano. And Jeff left the bridge in ruins.
Upon Jeff’s departure, trolls could be seen patrolling the remains of the Bridge to Mariano. Yes, the trolls were the only ones who had realized the importance of the bridge. To the trolls, Jeff had been more than a decent relief pitcher. Old Nellie had also been blessed with the ability to try to pick a runner off first when there was already a runner on third! The gall! The ingenuity! There was once a dream that was the Yankees Dynasty, the trolls thought. And we fear that it will not survive the offseason. The trolls sought the bridge’s resurrection.
The Yankees acquired better relievers in those later years, having led the Majors in WPA in the decade since, but nary a relief man could pay the troll toll. Not a Flash, not a Proctor, not even the Rules Joba could recreate the Bridge to Mariano. For Farnsworth’s fastball flew forever straight. The eighth inning! And the dulcet melodies of the rotation beckoned Hughes. The eighth inning! Who can be the bridge to Mariano? The eighth inning!!
Years from now, when the Yankees struggle to find Mariano’s successor; most fans will miss the Greatest Closer of All-Time. But let this serve as a reminder; the trolls were right. Bullpen is principal to victory, yet Rivera was never key to the bullpen. It was always the Bridge to Mariano.
So we march on, analysts against the trolls, traversing an endless bridge to nowhere.
| Change-Up | July 28, 2010 |
The Fascinating Case of Rickie Weeks
Say you’re a Major League Baseball General Manager and your long-term planning shows an opening at second base in 2012. The farm system looks bare at the position and nobody currently on the big club looks like a candidate for the job that season. The plan would be to make some calls to feel out the trade market and parallel track an approach focused on the free agent market.
A look at the 2012 free agent class shows that Rickie Weeks would have to be high on your list of acquisition targets, but now comes the hard part. How do you budget for Weeks? What will the market bear for a player of Weeks’s skill and performance history?
Rickie Weeks, to date, has underachieved. Coming into the 2010 campaign, the second overall pick in the 2003 Amateur Draft had hit .247/.351/.415 for his career. He’s struggled with the glove, his bat has been inconsistent and he can’t seem to stay on the field. Weeks has never played more than 130 games in a season.
Still, he has shown flashes. He hit .251/.422/.481 in the second half of 2007, his 24-year old season. The enormous difference between his on-base percentage and his batting average suggested Weeks might be a special player, a middle infielder with superb pitch recognition skills and excellent power. From August 1st through the end of the 2007 season, Weeks hit .273/.442/.553.
Now a darling breakout candidate, a kid on the cusp of superstardom, the incredible finish to the 2007 campaign would not carry over. 41 games into the 2008 season Weeks was hitting .184/.317/.329. With a low batting average that was unlikely to remain suppressed for a full season, Weeks once again finished strong, hitting .261/.373/.448 over final two months of the 2008 season.
So now Weeks was entering his 26-year old campaign. He had amassed a good amount of Major League service time and even if he was inconsistent, he had played at a high enough level for extended stretches that there was still plenty of hope that Weeks could fulfill his promise. Perhaps his biggest drawback early in his career, his erratic fielding had even begun to stabilize in 2008. 2009 would be his year.
Unfortunately, 2009 would be anything but Weeks’s year. He would tear the tendon sheath in his left wrist on May 18th in the midst of his best season to date. For the first time in his career he was off to a good start, hitting .272/.340/.517. Now a wrist injury would call into question how he might ever bounce back.
A player has a few opportunities to make a lot of money in Major League Baseball. A draft pick as high as Weeks receives a hefty signing bonus. A player can start off his career with enough promise to compel their employer to buy out arbitration years and maybe a free agent season or two. Sticking at second base, think Robinson Cano or Dustin Pedroia for these sorts of contracts. Players can also make a lot of money on a year-to-year basis in arbitration. And finally, guys can hit it big on the unrestricted free agent market. For Weeks, the wrist injury that took out his 2009 season also eliminated any hopes he may have had for a big contract or multiple lucrative arb years before he became a free agent. His window was closing.
Understandably given the nature of his injury, Weeks started slowly this season. On May 23rd, he was hitting .246/.338/.374. Since then, he’s been one of the very best players in baseball. Weeks is hitting .307/.407/.589 over his last 58 games while playing a decent enough second base. He homered for the third consecutive game last night. Already he has been worth 4 Wins Above Replacement (according to Fangraphs), a higher total than any other full season of his career and remember, he has been strong finisher his whole career. At 27, Weeks seems to be putting it all together.
This brings me back to the beginning of the piece. What do you make of Rickie Weeks if you need to look to the free agent market for a second baseman in 2012? He might be a top-10 player in all of baseball, he might tank, his fielding may regress to the point where he must be moved off of second as he ages, the wrist injury could pop back up in some form or another. You get the picture. Right now, he is probably the most difficult player in baseball to project.
For his part, Weeks has eight months of baseball that will in all likelihood set up the rest of his life. If he performs, he will earn tens of millions of dollars well into his 30’s. If he doesn’t, he will likely play out lesser contracts for (relatively) short money.
From a baseball analyst’s perspective, when you take into account the factors that go into projecting future performance, there is no greater enigma right now than Weeks. And from a human perspective, for anyone trying to earn as much as possible in their respective fields, how can you not relate to a guy who has faced this much adversity and is now pushing for his chance to fulfill all that promise and strike it rich? Weeks has a small window to show what he can do. Meanwhile, teams around the league have to decide what sort of commitment they’re willing to make to a player who would come with no shortage or risk or reward.
| Touching Bases | July 26, 2010 |
Working Hard or Working Fast?
"The wrong way, but faster." Max Power
I could point to a dozen articles discussing the varying shapes and sizes of the strike zone, but when my friend Don asked whether umpires really change their zone depending on the score, I drew a blank. Factors such as the identity of the pitcher and the ball-strike count influence an umpire's process, but only so that he can do the job to the best of his ability. Yet for some reason, it's been casually accepted by some that umpires might be so unprofessional that they call a larger strike zone in a blowout to quicken the pace of the game.
Fortunately, this assertion is not backed up by any evidence, as umpires appear to call consistent zones depending on the score. Below, I plot the 25%, 50%, and 75% contour lines for called strikes based on four different score differentials. The zones are jumbled and mostly indistinguishable, so, on the whole, umpires do not call to the score.
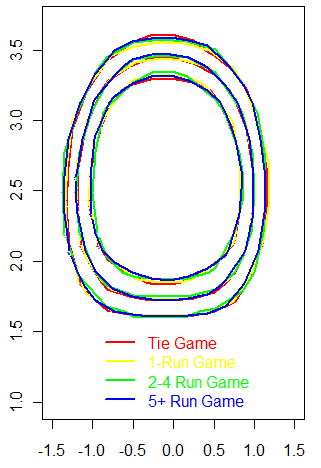
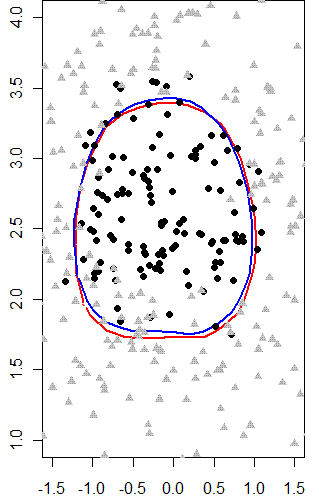
Perhaps there are some umpires who regularly schedule early dinner reservations, but the only ump I'm willing to openly critique is the only umpire who invites such criticism: Joe West.
I graphed West's strike zone at the point where he is equally as likely to call a strike as he is a ball. I also dug up the two Red Sox vs. Yankees games that West umpired, and plotted those ball/strike calls. West, you may remember, publicly denounced the length of these games. However, I found no evidence of bias. If anything, West has squeezed batters in Sox/Yanks games and batters in blowout games (blue line).
Umps aren't alone in being accused of unprofessionalism. Weeks ago, Patrick Sullivan* questioned the commonly-held wisdom that players try to get out of the ballpark ASAP during getaway games. It's hard to believe that batter would swing at bad pitches just because they're playing in the final game of a series, but that's what I checked for.
*You can follow Sully on Twitter, if only to observe him incessantly hound the insufferable Boston media. For example, "Shaughnessy on May 9: 'Beltre is emerging as an Edgar Renteria or Rasheed Wallace, take your pick.'"
| Getaway | Rest of Series | |
|---|---|---|
| Time | 2:56:27 | 2:55:15 |
| Day Game | 68% | 14% |
| Innings | 9.20 | 9.16 |
| Runs | 4.54 | 4.67 |
| Hits | 8.94 | 9.03 |
| Errors | 0.60 | 0.60 |
| P/PA | 3.83 | 3.81 |
You'd be hard-pressed to find statistical evidence that umpires and players sacrifice quality for expediency.
| Baseball Beat | July 23, 2010 |
An EvenLee Match for the Texas Lefty?
Cliff Lee pitched another great game last night. He has rightfully received a lot of accolades for his pitching prowess this year and was the prize target when the Seattle Mariners were auctioning him off to the highest bidders earlier this month.
Let's face it, Lee is having a pretty good season, no?
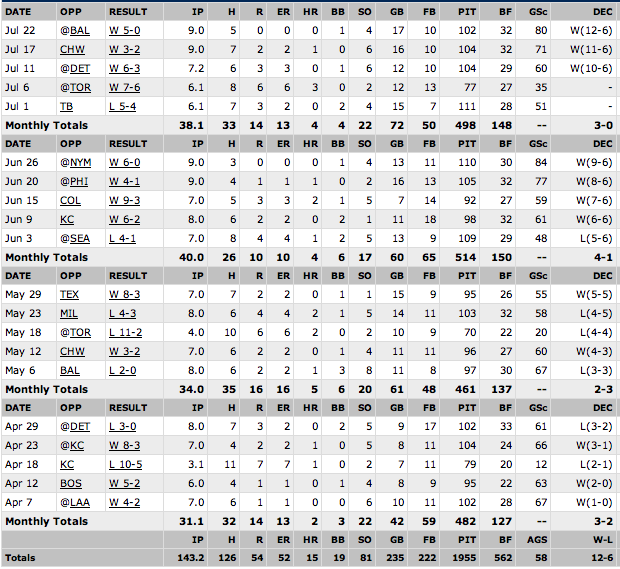
Oops, that game log actually belongs to Carl Pavano. Yes, the pitcher no Yankees fan likes. Boston fans adore him because New Yorkers don't, as well as the fact that he brought them Pedro Martinez in a trade with the Montreal Expos in November 1997. I'm sure the Minnesota faithful is appreciative, too. You see, the 34-year-old righthander is 12-6 with a 3.26 ERA this year. After last night's victory, he has now won his last seven decisions, including four complete games and two shutouts.
Pavano leads the American League in shutouts (2) and ranks second in wins (12), complete games (5), BB/9 (1.19), and WHIP (1.01); third in innings (143.2); fifth in K/BB (4.26); 11th in W-L % (.667); and 12th in ERA (3.26).
How is Pavano putting up such heady stats? In a nutshell, there are two major reasons for his success.
1. Pavano ranks first in the AL in O-Swing% (the percentage of pitches a batter swings at outside the strike zone) at 36.1%. The league average is 28.8%.
2. Pavano ranks second in F-Strike% (first pitch strike percentage) at 68.3%. The league average is 58.8%.
The comparison to Lee is appropriate in that the 2008 AL Cy Young Award winner is fourth in O-Swing% (33.7%) and first in F-Strike% (70.2%).
The bottom line is that pitchers who get ahead in the count, widen the strike zone, and get batters to swing at their pitches are usually successful. In addition to Pavano and Lee, there are three pitchers who also rank in the top 10 in MLB in both of these categories: Scott Baker (35.3%, 65.4%), Dan Haren (36.3%, 66.9%), and Phil Hughes (33.6%, 65.7%). Roy Halladay (32.0%, 67.9%) and Ricky Nolasco (32.7%, 64.8%) are among the top 15 in O-Swing% and F-Strike%.
I would take those seven pitchers on my team. Don't be misled by Baker's 5.15 ERA. His Fielding Independent Pitching ERA is 4.00. The difference between his ERA and FIP is 1.15, which is the fourth-highest in the majors. Only Brandon Morrow (1.40), Francisco Liriano (1.36), and Justin Masterson (1.27) have bigger deltas. Unlike Baker (whose success is based on his strong K and BB rates), the latter three are benefiting from their low HR/9 rates with Liriano at a league-leading 0.15 (2 HR in 122 IP).
As it relates to Pavano, his .255 BABIP and 74.4% LOB are significantly better than his career averages of .306 and 69.9%, respectively, which may suggest that he could be prone for reversion to the mean over the balance of the season. However, I am not nearly as pessimistic as ZIPS (Szymborski Projection System), which forecasts Pavano to go 3-5 with a 4.88 ERA from here on out.
With outstanding control and three plus pitches (fastball, slider, and changeup) in terms of run value, Pavano should continue to have his way with hitters, albeit at a pace perhaps closer to his FIP (3.85) or xFIP (3.88) than his ERA (3.26). Working on a one-year deal for $7 million, the 12-year veteran has been a bargain for the Minnesota Twins.
A free agent at the end of the year, don't be surprised if Pavano signs a new contract that pays him more per season than the one he inked with the Yankees (4/$39.95M) in December 2004. Just don't look for him to return to the Big Apple unless, of course, it's to face the Bronx Bombers in the postseason in October.
[Thanks to ESPN for the game log and Fangraphs for the stats and rankings.]
| Change-Up | July 22, 2010 |
Fun with Wins Above Replacement - National League Edition
Yesterday I wrote about some of the surprises that a B-Ref Play Index search for individual teams’ all-time single season WAR leaders turns up, and limited it to the American League. Today, let’s look at the National League. Because I referenced some bad MVP decisions in yesterday’s piece, I want to make clear that I am not advocating that the MVP simply be handed to the player with the highest WAR (though you could come up with a worse system). It’s simply a solid representation of a player’s contribution and when you dig in, it can turn up some unexpected items.
As you might imagine, Hank Aaron is all over the top of the Braves list but the third best season in Braves history belongs to Darrell Evans. He hit .281/.403/.556 in 1973, good for a 9.0 WAR year, easily the very best year of his long career. The best position-player season of the last 20 years for the Braves was Marcus Giles’s 2003. I would have thought Chipper Jones.
Ron Santo Hall-of-Fame supporters looking to rile themselves up should check out the Cubs list. Santo is mixed right in there with Ernie Banks and a few others and in fact, from 1964 to 1969, no National Leaguer amassed a greater WAR total. Right behind Santo on THAT list are Willie Mays, Aaron and Roberto Clemente.
The first, second, third, fourth and fifth best seasons in Cincinnati Reds history belong to Joe Morgan. Do you get the sense that people don't quite appreciate what a great player he was? I know I expected him to be up there, but the five best seasons in the history of a franchise with no shortage of history and success like the Reds? It's incredible. Morgan bears some responsibility for a legacy that could be so much more due to his broadcasting style and occasional unfortunate commentary, but he really does seem unfairly underrated nonetheless. He's on the short short list of the very best players of all time.
He's long been a favorite of this site, but Jimmy Wynn claims 3 of the top 20 seasons in Astros history. It would be hard to identify a player whose reputation as a player is more hampered by context. He played home games in the Astrodome during a brutal pitcher's era and was a high-OBP/low-AVG type. He finished his career with just a .250 batting average but a 128 OPS+.
Adrian Beltre's 2004 is the second best season in Dodgers history. The rest of the list includes names you'd expect except for number seven. There's that guy again! It's Wynn, who hit .271/.387/.497 for the 1974 Dodgers.
Four of the ten best Mets seasons took place between 1996 and 1998, and the names blew my mind. I guess John Olerud's doesn't - he was an excellent player and his 1998 is tied for the best Mets season. Who's he tied with? Yup, Bernard Gilkey, who hit .317/.393/.562 for the 1996 Mets. Edgardo Alfonso's 1997 and Lance Johnson's 1996 rank 7th and 9th respectively. Alfonso's 2000 ranks 10th.
So Chase Utley's been pretty good, right? He's one of the best players of the last bunch of years, the very best player in fact during one of the most successful stretches in Philadelphia Phillies history. Well Mike Schmidt had NINE seasons better than Utley's second best. Ryan Howard's best season ranks 52nd in Phils history ($125 million LOL).
I have never heard of Sixto Lezcano, but apparently he had the 4th best season in Padres history. For any reader who feels inclined, I would love to learn more about Sixto if you could share memories in the comments section.
Rogers Hornsby, Stan Musial, Albert Pujols, Hornsby, Musial Pujols...check out the St. Louis Cardinals list and you get a real appreciation for the standing that Pujols already has in the game's history.
| Change-Up | July 21, 2010 |
Fun with Wins Above Replacement - American League Edition
I can’t imagine many readers of this site don’t know about Baseball-Reference’s Play Index, but in case not, know that it represents one of the great joys of being a baseball fan for those interested in mining baseball's past and present. The recent addition of Sean Smith’s historical WAR data has only made the Play Index that much more enjoyable. In a recent guest post I wrote at Wezen-Ball on Red Sox Hall of Famer Fred Lynn, I searched for the greatest individual seasons by Red Sox and sorted by WAR. The results were surprising, and so I decided to play with it some more. What follows are some of the more surprising items that caught my eye. I will follow up with a National League piece tomorrow.
Let’s stick with the Red Sox for starters. In 1995, they won the American League East and first baseman Mo Vaughn won the American League Most Valuable Player award. While it may not rival 1987’s George Bell over Alan Trammell sham, it was an awful choice. Albert Belle was much better than Vaughn and among stat-friendly types the 1995 vote goes down as one of the worst in recent memory. It’s hard to see how anyone could have believed Vaughn was better than Belle, Edgar Martinez or even Tim Salmon that season.
But that’s old news. What caught my eye as I sorted through the greatest individual Red Sox seasons of all time (as determined by WAR), was that another Red Sox, one of Vaughn’s teammates, appeared to have had a much stronger MVP case than Vaughn, too. John Valentin’s 8.5 WAR season, the strike-shortened season of 1995 no less, stands today as one of the finest years a Red Sox player has ever posted and wouldn’t you know it, the highest total in the AL for that year.
Valentin hit .298/.399/.533 while playing a very good shortstop for Boston that season. I want to be careful not to ascribe too much value to WAR since Valentin derived so much of his value that season from his fielding, an area of the game more easily quantified today than ever before but still inexact nonetheless. Still, you could imagine my surprise when Valentin’s name appeared so high on the list of all-time great Red Sox seasons, and atop the American League for 1995.
Perhaps the most surprising team list of all is the Angels. Here are the top individual seasons in Angels history:
               Season  WAR
Jim Fregosi     1964   8.1
Darin Erstad    2000   7.7
Jim Fregosi     1970   7.7
Troy Glaus      2000   7.6
V. Guerrero     2004   7.4
Nothing against Fregosi or Erstad but for a proud franchise like the Angels with a particularly strong recent history of success, one would just think that names with more zing than Fregosi or Erstad might sit atop their best ever list.
The Yankees’ list is just absurd. When purists or others criticize a stat like WAR, I like to urge them to check out some of the results and see if it aligns with their impressions of who the best players are. I realize this post is about surprises, but the Yankees’ list is surprising in its ridiculous predictability. The top 25 seasons ever recorded by Yankees is an exclusive list of just six players: Babe Ruth, Mickey Mantle, Lou Gehrig, Rickey Henderson, Alex Rodriguez and Joe DiMaggio. It’s almost as if WAR might be a reasonably accurate measure of a player’s value!
Speaking of Henderson, did you know that Jason Giambi has the 4th best season in A’s history, trailing only Eddie Collins and Jimmie Foxx, and better than any season Rickey notched in an Athletics uniform? Or that Reggie Jackson’s 9.7 WAR season in 1969 was the 3rd best A’s season in the last 50 years (trailing only Giambi and Rickey) and also the very best of his career? I hadn’t realized Reggie’s best year came so early on in his career. Go check the A’s list out for yourself! There’s a lot there.
To give you a sense for just how futile Seattle Mariners baseball was before the arrival of Edgar Martinez and Ken Griffey Jr., only one of their top-42 seasons by WAR pre-dates the duo’s arrival. Alvin Davis’s 5.6 WAR season in 1984 ranks as the 23rd best season by a position player in Mariners history, and is the only season to appear in the top-42 before 1990.
Ben Zobrist holds the Rays all-time single season WAR record, with his 7.1 figure in 2009. Amusingly for this Red Sox fan, Julio Lugo appears on the Rays top-10 list. Chalk it up to their short history, sure, but there were also some mighty lean years down in St. Pete.
Finally, to tie it all together, we get to the Blue Jays. There are many players and seasons on their list before you get to 1987 MVP winner Bell. Among others, some of the least distinguished you’ll find include Lloyd Moseby, Devon White, Marco Scutaro and Aaron Hill. They may not be baseball royalty, but they all had better seasons than the 1987 American League MVP winner!
I urge everyone to check out the Play Index, and specifically to play around with the WAR lists. It’s simultaneously fun, shocking and enlightening, and will only enhance your enjoyment and appreciation of baseball’s best and most memorable players and seasons.
| Touching Bases | July 20, 2010 |
How Does Time on the DL Affect Fastball Velocity?
Rotobase's injury database contains disabled list data dating back to 2002. Incidentally, that is as far back as FanGraphs carries Baseball Info Solutions' velocity data. So my question is, how long does it take a pitcher to get back up to speed?
First, I've plotted the number of days a player spends on the DL against the difference in velocity between the month he was put on the DL and the month he returns.
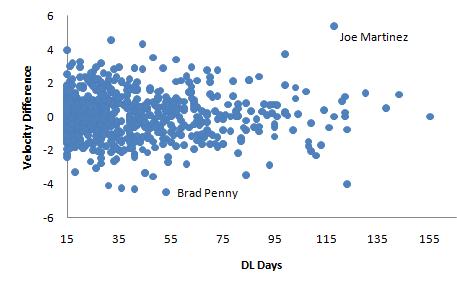
Joe Martinez, returning from three hairline fractures caused by a line drive off his skull, displayed the biggest jump in velocity, as you can see in the 2009 section of this graph.. And Brad Penny in 2008, who was plagued with tendinitis in his right shoulder, took the biggest hit of any pitcher, as demonstrated here.
To the point, there's no correlation between the two variables. That's not to say that the severity of an injury has no bearing on fastball velocity-it most certainly does. It means that the sampling biases in this study may overwhelm the effects of an injury. No pitcher will return to Major League Baseball if his injury is too debilitating. The pool of players who do return from injury is strongly biased towards those players who were not cripplingly injured. Even so, perhaps pitchers continue to show effects after they return from the DL to the Majors. Below, I present a table showing the average difference in fastball velocity between the month he hit the DL and all subsequent months after coming off.
| Return Month | Velocity Difference |
|---|---|
| First | 0.02 |
| Second | 0.07 |
| Third | 0.23 |
| Fourth | 0.41 |
Velocity increases the further removed a pitcher is from the DL. Players are continually recovering. Still, velocity is generally higher in months after hitting the DL than the immediate month before. What about if we look at the month before that. If a player was on the DL from June 1 to June 30, then how did he throw in April as compared to July?
| Return Month | Velocity Difference |
|---|---|
| First | -0.20 |
| Second | -0.12 |
| Third | 0.07 |
| Fourth | 0.12 |
Not surprisingly, this shows that pitchers exhibit symptoms of injury (diminished velocity) in the immediate month prior to hitting the DL more so than in the preceding months.
This effect was exacerbated when I looked at pitchers recovering from Tommy John surgery. Because recovery from Tommy John takes over a full year, this was the only time that I used data from different seasons for a single pitcher, but I still identified over 50 cases where a pitcher recovered from TJ.
| Return Month | Before (1) Difference | Before (2) Difference |
|---|---|---|
| First | -0.12 | -0.51 |
| Second | 0.08 | -0.29 |
| Third | 0.41 | -0.02 |
| Fourth | 0.26 | -0.15 |
Tommy John alumni pick up velocity the longer they are allowed to stay in the Majors. But most of them do not find the velocity they had in the months before the surgery.
Back to the original 826 players who made the trip to and from the DL in a single year. The injury database is set up in such a way that there are many binary variables indicating whether the injury was to this body part or that, so what else to do but run a linear regression? Nothing was statistically significant, but upper arm injuries seem to exhibit the greatest negative effect on velocity.
Methodological Details:
FanGraphs provides monthly velocity splits, so, for every pitcher who hit the DL, I found all the months they pitched before coming off the DL and all the months they pitched after going on the DL. So if a pitcher's stint was from June 15-July 15, I used his June month as before (1) and his July month as return (1). May and August would therefore be before (2) and return (2), respectively. If a pitcher was on the DL from June 5-June 25, then I excluded June, and used May and July as the before and after months. I adjusted each pitcher's fastball velocity reading by the month and by his team. More pitchers go on the DL in April than come off it, which could have skewed results, as seasonal temperature effects could throw off velocity by a full MPH. So the two Chicago teams and the Indians were bumped up nearly a percent in fastball velocity in April, while the Angels in July were knocked down a bit, for example.
Again, thanks to Rotobase and FanGraphs.
| Touching Bases | July 15, 2010 |
Stuff of the Futures
One of my favorite qualities of the incredibly rich PITCHf/x data is that it allows one to analyze a small sample and draw some substantial conclusions about a pitcher. Harry Pavlidis has been publishing his Arms of the Week series for some time, and he's already taken a look at the southpaws of the Futures Game. Twenty-four pitchers unveiled their stuff to a world-wide audience on Sunday, and here's what I got.
When I say that conclusions are there for the drawing, I mean that with a guy like Tanner Scheppers, whose fastball reads 98 miles per hour, we can comfortably say that he could fit right in with the Rangers' bullpen. The Rangers, to their credit, want Scheppers to start, but he's got the classic power fastball you see from late-inning dynamos like Jonathan Broxton, Brian Wilson, and Daniel Bard. Scheppers flashed a breaking pitch twice, which was very solid. As a starter, he profiles as A.J. Burnett 2.0.
Scheppers was the most impressive, whereas Jeremy Hellickson was the most important. Hellickson is breathing down the neck of Wade Davis, and his performance did little to quell the fears of the Rays' fifth starter. Reportedly a pitcher who sits 91-93, Hellickson was able to work at 93-94 with average movement on his fastball. He probably was dialing it up a bit for his brief stint in the limelight. There have been reports that he's been tinkering with a two-seam fastball, and he might have thrown a couple, but I'd say it's his weakest pitch, unless it is used exclusively to same-handed batters. His breaking pitches were fine (he throws two types of curves), he didn't show his cutter, and I try to stay away from analyzing the effectiveness of changeups based on velocity and movement (his was an 84-MPH straight change).
The next-best prospect who pitched was Julio Teheran. He showcased his 96-MPH four-seam fastball, which should be a plus pitch. His breaking stuff is advanced enough that it's easy to see why he would be dominating the low levels of the minors. I'd guess his perfect-world comp would be Josh Beckett.
Henderson Alvarez of the Blue Jays is currently starting, and impressing, in High-A, but to me he profiles more as a right-handed reliever. His best pitch appears to be a sweeping low-80s slider, and his hard fastball runs away from RHBs, so unless his changeup develops into something, Alvarez looks like a sinker/slider guy out of the pen.
Simon Castro has a good enough slider, but his fastball lacked luster. A 91-MPH tailing fastball will get hit in the Majors, so he'll need to cut down on his walk rate. He pitches with very little separation between his fastball and his change.
The Rays' Alexander Torres displayed some strong stuff, but he obviously has trouble commanding it, with a career Minor League walk rate above five per nine. His boring fastball ran 94-95 and he threw one breaking pitch with serious life. Unfortunately, it sailed a foot high. Very similar pitcher to Gio Gonzalez for me.
Trystan Magnuson's best pitch is a cut fastball that comes in at 88, moving across the plate. He also throws a split-finger fastball at 88. And his actual fastball is only a bit harder at 92-93, which makes for a unique repertoire. I don't know how much success it'll have.
What exactly is Anthony Slama the future of? He's 26 years old and he strikes guys out in relief. Fastball, slider, change. He'll destroy righties, but I don't think he'll ever be a closer/setup guy due to his projected massive platoon split.
Jordan Lyles' off-speed stuff has developed past his limited fastball. His changeup dives away from lefties, his slider can neutralize righties, and his curve will most definitely play. But it's telling that in a game where he had to throw a total of 15 pitches, only six of them were fastballs. They say pitching backwards can work in the N.L. Central, though.
Bryan Morris threw exactly one pitch, and oh what a pitch it was. 93.3 miles per hour. Bad movement. 0.38 StuffRV/100. Thanks for coming.
I like Mike Minor. Renowned as a collegiate, command, polished, you might as well say crafty, lefty, he came out with a surprisingly strong fastball. 93 with life. He threw changeups as his other offering, neglecting to toss in a breaking ball.
Stolmy Pimentel's pitch of note is his curve. Thrown at only 72 miles per hour, it moves nearly a foot across the plate, but doesn't drop much at all. Bronson Arroyo has a curveball like that in his arsenal, but not many others do.
Zach Britton threw only fastballs and sliders, but both of those pitches are more than big league ready. He has a hard, heavy sinker that will give lefties nightmares, can add some velocity with his four-seamer, and he boasts a true slider. You just don't see a left-handed pitcher with that biting slider and power fastball too often, and when you do, he can dominate. I think Britton's a stud, and the strikeouts will come.
Shelby Miller's got a live arm, and if you didn't know about his 95-MPH rising fastball, now you do.
Hector Noesi has been terrific this year, with a 6.35 strikeout-to-walk ratio in the minors. One of many Yankees between A and AA dominating the competition. His stuff, highlighted by a 93-MPH heater, does profile as a back-end guy, but that doesn't mean his impeccable command can't pull him to the front end.
Philippe Valiquette might have been throwing two types of fastballs. He might not have been. Tune in next time to find out. Why was this guy pitching in this game? Bleh.
Jeurys Familia dialed it up to 98. I'm very surprised to see that he's a starter in the minors, considering. At 20 years old, he can afford to throw one off-speed pitch out of a dozen offerings. Lots of time to work on that secondary stuff and that command. For now, that velo will do.
Zach Wheeler, a 2009 draft pick, throws hard, and he threw a single changeup with extreme movement. Very good changeup. He didn't get a chance to use his curve, which he called his out pitch last year.
Christian Friedrich threw three fastballs, and that was it. It was a rising fastball, and you never know how that will play in Coors.
Eduardo Sanchez also threw nothing but fastballs. A couple ticks harder than Friedrich, but he doesn't have the advantage of being left-handed. The most interesting note about Sanchez is that he was born a week apart from me. Therefore, I will pretend to be his distant cousin in order to obtain free access to Redbirds games. He will gain more from our relationship than I ever could.
| Baseball Beat | July 14, 2010 |
Home Run Derby
The Home Run Derby is a made-for-TV event, one that can be enjoyed from your couch at home as much or more than almost any seat in the stadium. Nonetheless, when you get the opportunity to take two out-of-town nephews to your home ballpark to witness the festivities in person, you jump at the chance. After all, life is about relationships and shared experiences create more memories than flying solo at home.
My older brother and I took our younger brother's sons (Casey and Troy) to the Home Run Derby on Monday. Forty years ago, Tom's high school baseball team won the California Interscholastic Federation Southern Section 4-A (highest division) championship at what was then known as Anaheim Stadium. A lefthander, Tom (far left) was the winning pitcher in the final game. He was also First Team All-CIF with a 10-0 record and an ERA of 1.53. For perspective, Fred Lynn (El Monte High School) was on the second team. In the preliminary game that same evening, George Brett and Scott McGregor of El Segundo HS lost to Lompoc 8-5.
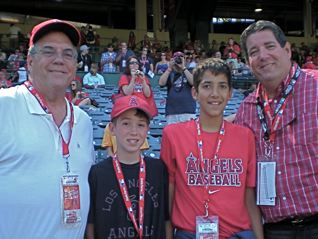
I snapped a photo of David Ortiz (bottom right) slamming one of his 32 home runs. Note the ball leaving the bat. Not bad on a less than high-speed camera without much of a telephoto lens from the field boxes well down the left-field line. Big Papi beat Hanley Ramirez, 11-5, in the final round. In his fourth appearance in the derby, Ortiz jacked the third-most number of homers in the event's history, trailing only Bobby Abreu (41 in 2005) and Josh Hamilton (35, 2008). Unfortunately, nobody "Hit It Here" (bottom left), a sign placed more than 500 feet from home plate, and won $1,000,000.
My favorite photo of the evening was a rather simple one but it captured the imaginations of a 15-year-old boy watching the flight of a long home run. Accompanied by their parents, Troy and Casey returned to Angel Stadium for the All-Star Game the following evening and Heath Bell tossed the latter a ball during batting practice.
Casey, 10, threw out the first ball at a Cubs-Padres spring training game in March. He made the PONY League (Mustang Division) All-Star Team in Phoenix.
Photographs and memories.
| Touching Bases | July 13, 2010 |
Testing Outfield Arms
Over at The Hardball Times, John Walsh used to write one of my favorite pieces of the year; a ranking of the game's best outfield arms. Walsh would find every outfielder's "kill" and "hold" rates in five distinct situations. Walsh has taken a hiatus from the exercise this year, so I'd like to pick up on the research, adding Gameday's hit location data to the mix.
Walsh has already covered 2008, yet I've chosen to use both 2008 and 2009 data in my study. The hit location coordinates provided by Gameday make it difficult to decipher the exact distance of a ball to the outfield. But the batted ball angle relative to home plate can be calculated. Fortunately, Walsh outlined two parameters in which distance is more or less immaterial, and only the angle matters.
1. Single with runner on first base (second base unoccupied).
2. Single with runner on second base.
All singles land somewhere in front of the outfielder. And it turns out, the success of the base runner depends little on whether the outfield single was a grounder, a line drive, or a fly ball.
Excluding all two-out plays, I found the rates at which base runners advanced or were thrown out attempting to advance, depending on the batted ball angle.
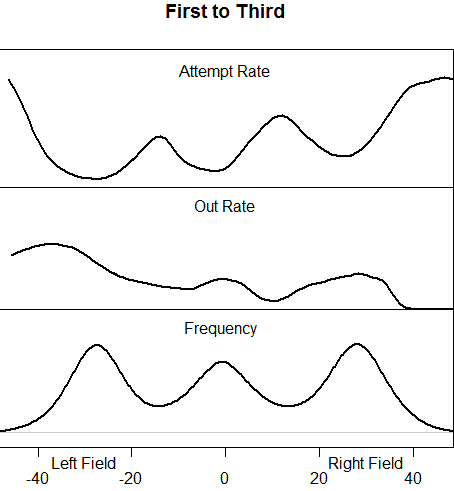
On singles directly at the left fielder, base runners attempt to advance first to third only 5% of the time. Right at the center fielder, base runners risk it 15% of the time, and 25% of the time on balls to the right fielder. 40% in the left-center gap and 60% in the right-center gap. These figures coincide with how often balls are hit to each location, meaning that outfielders align themselves sensibly. What doesn't make sense is that runners are thrown out trying to advance on balls to center as often as they're thrown out trying to advance on balls to right. Sure, right fielders have better arms than center fielders, but center fielders are closer to third base and get to the ball faster. I don't know what the numbers should look like if base runners advanced optimally, but I do know that the rate at which runners attempt to advance should be directly proportionate to the the rate at which runners are thrown out attempting to advance.
That theorem holds when base runners on second try to score on singles.
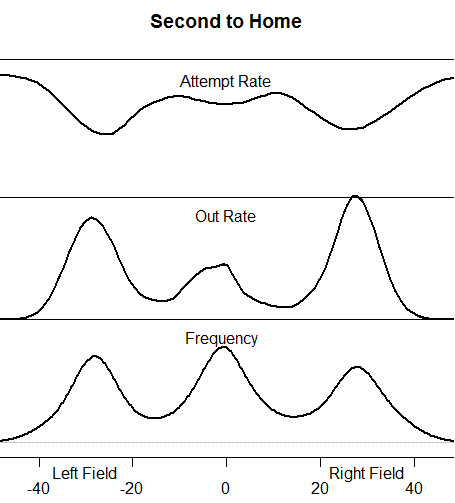
Singles targeted at corner outfielders are 50-50 plays for the third-base coach/base runner, and that risk/reward proposition can fluctuate depending on the number of outs, the upcoming batter, the current pitcher, and all that stuff. Center fielders, who are positioned farther from the plate and have to circumvent the pitcher's mound with their throws, are tested at a 75% rate. There is a higher frequency of singles to center, specifically of the ground ball variety, with a man on second than with a man on first due to the infield alignment.
I compared the expected rates to what actually happened to evaluate base runners and outfield arms. So if a runner advanced first to third on a ball right at the right fielder, they would both accumulate .75 extra bases and -.05 extra outs.
Here are my top five and bottom five base runners at advancing on singles.
| Name | Extra Bases | Extra Outs |
|---|---|---|
| Chone Figgins | 23.1 | -2.4 |
| Erick Aybar | 15.7 | -0.5 |
| Troy Tulowitzki | 12.0 | -1.3 |
| Ian Kinsler | 11.0 | -1.4 |
| Matt Kemp | 10.1 | -1.6 |
| Carlos Lee | -10.0 | 1.4 |
| Brian McCann | -14.0 | 0.5 |
| Bengie Molina | -13.5 | 0.7 |
| Jorge Posada | -4.1 | 4.4 |
| Prince Fielder | -12.6 | 2.4 |
The Angels are a very aggressive base running team, which pays off with guys like Figgins and Aybar. Matt Kemp's fielding and base running production have taken significant, almost shocking, hits this year. Jorge Posada is the worst base runner I've ever seen, and he's probably one of the worst of all-time. Considering his defense, which has never drawn positive reviews either, his Hall of Fame case will be very interesting.
To evaluate outfield arms, I included a regressed version of these base running scores.
| Name | Extra Bases | Extra Outs |
|---|---|---|
| Hunter Pence | -11.3 | 8.3 |
| Michael Bourn | -1.1 | 6.3 |
| Jeff Francoeur | -1.2 | 5.8 |
| Jayson Werth | -11.0 | 3.4 |
| Adam Jones | -17.6 | 1.2 |
| Jason Bay | 6.7 | -2.9 |
| Jermaine Dye | 10.3 | -2.3 |
| Shin-Soo Choo | 11.9 | -2.1 |
| Brad Hawpe | 13.5 | -2.5 |
| Brian Giles | 11.4 | -3.3 |
Baseball Reference actually carries these stats. Hunter Pence, a right fielder, was tried 100 times on singles with a man on second. He held the runner at third 40 times, leaving 60 tries for him to nail the runner. He succeeded on ten, which is quite an impressive rate. All three of the Phillies outfielders have been successful holding the running game. Bourn was also an above average base runner, and Ichiro, renowned for his arm and base running, was merely good in each. Shin-Soo Choo is the biggest surprise I found, as I've heard that he has "80" arm strength before.
And the rest:
| Baseball Beat | July 12, 2010 |
Yesterday and the Futures
I spent the weekend before the All-Star Game attending two baseball games. On Saturday, Jon Weisman hosted Dave Cameron, his brother Jeremy, Bryan Smith, and me at Dodger Stadium for the Dodgers-Cubs game. On Sunday, my son Joe and I met up with Dave and Bryan at the All-Star Futures Game at Angel Stadium. We skipped the All-Star Legends & Celebrity Softball Game yesterday evening, choosing to eat dinner at Roy's Hawaiian Fusion Cuisine, one of many restaurants at the Shops at Anaheim GardenWalk. All of us enjoyed our fish but there was a Trout that made an even greater impression earlier in the day.
The United States beat the World team, 9-1, in the 12th annual Futures Game. It was the most lopsided score on record, outdoing the World's 7-0 whitewashing in the inaugural game in Boston in 1999. The contest was a mismatch from the moment the 25-man rosters, selected by Major League Baseball Scouting Bureau, MLB.com, Baseball America, and the 30 clubs, were released late last month. The current format, pitting the U.S. vs. the World, has run its useful course and many, including Bryan, would like to change the competition to the American League vs. the National League.
While Hank Conger (Angels, Salt Lake, Triple-A), a first-round draft pick out of Huntington Beach High School (Orange County, CA) in 2006 who Joe referred to as a switch-hitting Mike Napoli, slugged a three-run home run in the fifth inning to earn Most Valuable Player honors, future teammate Mike Trout stole the show in the eyes of the scouts yesterday afternoon. Trout, who won't turn 19 until next month, was not only the youngest player on the field but the most impressive. The 25th overall pick in the 2009 draft, who put on a display before the game in batting practice when he jacked a ball off the center field wall on his first swing and proceeded to launch several more over the fence, hit the ball hard all four times to the plate, resulting in two infield errors, an infield single, and a double that highlighted his speed and hustle. The slowest fastball he faced was 93 and his line-drive double was on a 98-mph heater thrown by 6-foot-3 righthander Jeurys Familia (Mets, St. Lucie, High Class A).
Trout entered the game in the bottom of the first inning as a pinch runner for über prospect Domonic Brown (Phillies, Lehigh Valley, Triple-A), who reached base on an infield single, advanced to second on one of four hits by Eric Hosmer (Royals, Wilmington, High Class A), and took third on a wild pitch by losing pitcher Simon Castro (Padres, San Antonio, Double-A). Brown (.326/.391/.608 with 19 HR in 330 combined plate appearances at "AA" and "AAA"), who felt tightness in his right hamstring when running down the first-base line and was nearly picked off first and second, left the game for "precautionary" measures and expects to play when minor league action resumes on Thursday.
Interestingly, Brown and Trout were ranked 1 and 2 in Baseball America's Top 25 Midseason Prospects last week.
1. Domonic Brown, of, Phillies (Triple-A Lehigh Valley): The power has come through as the Phillies predicted, as Brown has started to fill out at age 22 and surpassed his career home runs total in his first 65 games at Double-A Reading. Then he went out and hit four in his first 13 games after a promotion to Triple-A Lehigh Valley. He ranks 10th in the minors in OPS, and he's doing it with big tools at upper levels. His still-raw defensive skills (his defensive tools are fine) are his only major flaw.2. Mike Trout, of, Angels (Low Class A Cedar Rapids): Trout hasn't done much wrong. He ranked first in the minors in runs (74), second in batting (.362) and stolen bases (42), was tied for fourth in on-base percentage (.447) and ranks first in scouts' enthusiasm. Trout hasn't committed an error, plays hard and seems to be thriving rather than shrinking from the grind.
Brown (6-5, 200) and Trout (6-1, 217) have different body types. The lanky Brown reminds me of Darryl Strawberry while the thick Trout has drawn comparisons to NFL linebacker Brian Urlacher for his aggressiveness and physicality. Amazingly, Trout has legitimate 80 speed (on the 20-80 scale) and was clocked at 3.9 to first on his infield single, a time that Keith Law tweeted was the "fastest I've ever gotten from a right handed hitter." His plus-plus speed was also evident in center field as he recorded five putouts, including a nice running catch.
I first saw Trout in the 2008 Area Code Games, highlighting his name in yellow in my program. He generated the second highest SPARQ Rating at the event, with a 83.07 (3.64 30-yard dash, 4.47 shuttle, 60-foot power ball toss and 33.5 vertical jump). I was pleased when the Angels selected him in the draft last year as the club was in need of outfielders and athleticism. Although Trout, who was promoted to High Class A Rancho Cucamonga in the California League over the weekend, has not played above Low Class A yet, there has been talk that the teenager could reach the majors next year.
Trout has a big supporter in Angels manager Mike Scioscia:
He's not like one of these real gazelle center fielder types. This guy's a strong kid. He runs hard. He runs heavy, and he can fly. He drives the ball well to right field. He's got the makeup; he's focused. He's just a player with as much upside as any player that has put on the uniform.
Given Torii Hunter's presence in center field, there is no need to rush Trout. However, rest assured that the Angels will call him up to the big leagues when he is ready, perhaps moving Hunter to right field and Bobby Abreu to left field or designated hitter to make room for the youngster if indeed he returns to Angel Stadium sometime next year.
It's just too bad the Angels still don't have Tim Salmon to play alongside Trout.
| Change-Up | July 08, 2010 |
Daisuke Matsuzaka & Relative Value on the Free Agent Market
Let’s get a few things out of the way. Daisuke Matsuzaka’s value as a starting pitcher for the Boston Red Sox has not been commensurate with the $103 million they doled out to acquire the player. Also, just like many other Red Sox fans who feel frustrated watching Daisuke perform, his pitching can drive me nuts at times, too. He works slowly and walks way too many batters. In his final four seasons for the Seibu Lions, Matsuzaka averaged 2.3 walks issued per nine innings. For the Red Sox, his 162-game average BB/9 has jumped to 4.3. Combine the walks, his inefficiency and his unreliability from a health standpoint and it’s all just very maddening.
With all that said, I was taken aback yesterday morning when I read this Nick Cafardo headline from The Boston Globe. In a piece about Matsuzaka and another frustrating outing in St. Petersburg Monday night, the following headline appeared:
You wonder when it’ll start to pay off
This headline very much reflects conventional wisdom here in Boston. At my doctor's office yesterday, the nurse asked me "what are we gonna do about Daisuke?" I think we've reached a point where public perception on Daisuke is now far too negative. For perspective, I would like to look at his acquisition from a different angle.
The aim of this entry is not to defend the Matsuzaka signing like I did with J.D. Drew during the off-season. J.D. Drew is a terrific baseball player, one any team would be lucky to have. He is not overpaid at all, not by one cent. In fact, his signing has been one of the better free agent deals over the last five seasons or so. The aim of this entry is to showcase the sort of value teams are likely to receive when they turn to the free agent market. From this lens, compared to other free agent starting pitchers, Matsuzaka may not be the best signing of Theo Epstein’s time as Red Sox General Manager, but it’s important to keep in mind that the Japanese right-hander has also been a key contributor to some excellent Red Sox teams.
Since the 2006-2007 off-season, when Matsuzaka signed with the Red Sox, there have been 33 contracts handed out to starting pitchers whose total value met or exceeded $10 million. Of those 33, 9 have contributed no value at all, or even negative value. Jason Schmidt, Adam Eaton, Kei Igawa, Mark Mulder, Woody Williams, Oliver Perez, Aroldis Chapman, Randy Wolf and Jason Marquis (in his deal signed prior to this season) all have either added nothing to the Big League club or in some cases, actually altogether detracted from their teams’ winning efforts irrespective of money. That’s $254 million total doled out to pitchers who have just killed their teams or in Chapman’s case, not yet had a chance to contribute.
That leaves another 24 contracts for pitchers who have contributed to their teams’ winning efforts. Presented below are those 24, sorted by Millions of dollars spent per Win Above Replacement (thanks Fangraphs).
| Num | Player | Yr Signed | Total Contract Value | AAV | Total Contract WAR | WAR/season | $ per Win |
|---|---|---|---|---|---|---|---|
| 1 | Joel Pineiro | 2009-2010 | $16.00 | $8.00 | 1.8 | 3.60 | 2.22 |
| 2 | Mike Mussina | 2006-2007 | $23.00 | $11.50 | 8.2 | 4.10 | 2.80 |
| 3 | Greg Maddux | 2006-2007 | $10.00 | $10.00 | 3.5 | 3.50 | 2.86 |
| 4 | Jason Marquis | 2006-2007 | $21.00 | $7.00 | 7.3 | 2.43 | 2.88 |
| 5 | Ted Lilly | 2006-2007 | $40.00 | $10.00 | 10.9 | 3.11 | 3.22 |
| 6 | Andy Pettitte | 2009-2010 | $11.75 | $11.75 | 1.7 | 3.40 | 3.46 |
| 7 | Ryan Dempster | 2008-2009 | $52.00 | $13.00 | 5.5 | 3.67 | 3.54 |
| 8 | Andy Pettitte | 2006-2007 | $16.00 | $16.00 | 4.5 | 4.50 | 3.56 |
| 9 | Gil Meche | 2006-2007 | $55.00 | $11.00 | 10.7 | 3.06 | 3.59 |
| 10 | Andy Pettitte | 2007-2008 | $16.00 | $16.00 | 4.4 | 4.40 | 3.64 |
| 11 | C.C. Sabathia | 2008-2009 | $161.00 | $23.00 | 8.2 | 5.47 | 4.20 |
| 12 | Kenshin Kawakami | 2008-2009 | $23.00 | $7.67 | 2.7 | 1.80 | 4.26 |
| 13 | John Lackey | 2009-2010 | $82.50 | $16.50 | 1.6 | 3.20 | 5.16 |
| 14 | Derek Lowe | 2008-2009 | $60.00 | $15.00 | 4.1 | 2.73 | 5.49 |
| 15 | A.J. Burnett | 2008-2009 | $82.50 | $16.50 | 3.9 | 2.60 | 6.35 |
| 16 | Daisuke Matsuzaka | 2006-2007 | $103.00 | $17.00 | 8.9 | 2.54 | 6.69 |
| 17 | Jamie Moyer | 2008-2009 | $13.00 | $6.50 | 1.3 | 0.87 | 7.47 |
| 18 | Vicente Padilla | 2006-2007 | $33.75 | $11.25 | 4.5 | 1.50 | 7.50 |
| 19 | Tom Glavine | 2006-2007 | $10.50 | $10.50 | 1.3 | 1.30 | 8.08 |
| 20 | Carlos Silva | 2007-2008 | $48.00 | $12.00 | 3.5 | 1.40 | 8.57 |
| 21 | Barry Zito | 2006-2007 | $126.00 | $18.00 | 7.0 | 2.00 | 9.00 |
| 22 | Ben Sheets | 2009-2010 | $10.00 | $10.00 | 0.5 | 1.00 | 10.00 |
| 23 | Orlando Hernandez | 2006-2007 | $12.00 | $6.00 | 0.9 | 0.45 | 13.33 |
| 24 | Jeff Suppan | 2006-2007 | $42.00 | $10.50 | 1.5 | 0.43 | 24.42 |
As you can see, Matsuzaka is far from a bargain. But at the same time, he's in the same neighborhood as players like John Lackey and A.J. Burnett, and that's WITH his lost season of 2009. Of those 33 contracts I alluded to earlier, Matsuzaka ranks 18th in terms of dollars spent per Win Above Replacement. That's not great value, but it is just about the median.
This brings me back to the Cafardo headline. "You wonder when it will start to pay off." I look at that and think to myself that IT IS paying off. Maybe it has not been an optimal allocation of resources, maybe Matsuzaka has not lived up to expectations, but he has had two very good seasons, one lost to injury and is on pace to have another decent year. That's not a terrible return.
The purpose of the free agent market is for teams to round out personnel where their farm systems could not supply the talent needed. By its nature, the free agent market offers less value than players in their cost-controlled years. The beauty of this is that so long as the Red Sox draft well and get ridiculous value from the likes of Jon Lester, Dustin Pedroia and Kevin Youkilis, they can afford to overspend on Matsuzaka. And this principle doesn't just apply to big market teams. Derek Lowe hasn't exactly supplied great value for Atlanta, but they sit in first place. Other expensive "under-performers" like Aaron Harang, Carlos Guillen and Rich Harden suit up for teams atop their respective divisions. Free agent "misses" come with the territory.
Two of the more maligned players in my time following the Boston Red Sox closely, J.D. Drew and Daisuke Matsuzaka, both joined the team prior to the 2007 season. They will cost the Red Sox a combined $173 million when it is all said and done. Since their arrival, thanks in part to their considerable contributions, Boston is 99 games over .500, has won a World Series, lost in Game 7 of the 2008 ALCS and has qualified for the post-season in three consecutive years. Matsuzaka will probably never be the pitcher Boston fans hoped he would be, but Matsuzaka has also contributed greatly to some of the most successful Red Sox teams in franchise history. In this light, since all we root for is the Red Sox to win, maybe the nibbling, the DL stints, the posting fee and the big contract have been worth it after all?
| Touching Bases | July 07, 2010 |
Stolen Bases and PITCHf/x
I tend to think that pitchers have more control over the running game than catchers. Catchers control their "POP" times, while the pitcher controls his time to the plate, pickoff move, pitch location, and pitch type. The last two factors are probably the least significant in determining the success of a stolen base attempt, but they're the most quantifiable thanks to PITCHf/x.
Below is the success rate of stolen base attempts from 2008-2009 based on the pitch location.
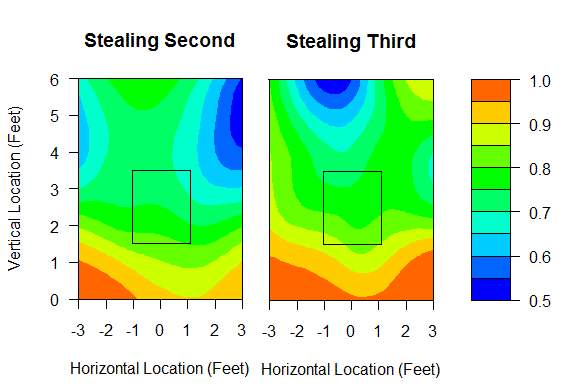
The trendline is clear. The catcher has no chance at throwing out a baserunner on anything that's less than a foot off the ground. Balls at the belt and up give the catcher a 70% chance at throwing out the runner, and pitches (pitch outs) in either batter's box really level the playing field.
Looking at these charts, I don't see why there aren't more lefty-throwing catchers. SB success rates are even at 76% regardless of the batter handedness, so throwing through the batter doesn't pose much of a problem. In fact, a pitch has to be located a foot off the plate for the batter's handedness to have a 10% difference on SB%. And, again, most of that is just due to pitch outs being thrown in the opposing batter's box.
Speaking of pitch outs, base runners were safe only 45% of the time on pitches classified as 'PO' by Gameday stringers. And considering the 70-75% success rate on regular fastballs, a couple tenths of a run are gained by pitching out when the runner is on the move. However, the data I'm using show that runners were in fact running during only 15-20% of all pitch outs. Furthermore, The difference between a pitch out and a regular fastball in terms of pitch type linear weights is at least a tenth of a run. Therefore, as currently employed, pitch outs would have to nab runners about 90% of the time to break even. I've always believed that the pitch out (and hit-and-run) have been over-utilized tactics, and I'm waiting to see some data refute that.
Jorge Posada and Mike Napoli, who both struggle throwing out runners anyway, call for a very high rate of pitch outs. Backups Jeff Mathis and Jose Molina, who are far from defensively challenged, also call for their share of pitch outs, so those calls are likely coming from the bench. Humberto Quintero and the lethally armed Lou Marson never call for pitch outs.
There are several reasons to throw more fastballs with a man on first than with the bases empty; there's a chance for the double play, incentive to avoid the passed ball, and, of course, to control the running game. John Baker and Joe Mauer both caught about 60% fastballs with nobody on, but 70% with a man on first. Along that same line, here's a snippet of the leader board for pitchers who throw more fastballs with a man on than with the bases empty.
| Rank: Pitcher | Bases Empty | Man On First | Team |
|---|---|---|---|
| 1: Anibal Sanchez | 53.20% | 71.30% | Marlins |
| 2: Sean West | 59.08% | 76.69% | Marlins |
| 3: Josh Johnson | 61.83% | 79.05% | Marlins |
| 4: Boof Bonser | 53.72% | 70.38% | Twins |
| 5: Matt Guerrier | 52.94% | 69.35% | Twins |
| 6: Chris Volstad | 62.31% | 78.64% | Marlins |
| 8: Leo Nunez | 53.67% | 66.89% | Marlins |
| 9: Burke Badenhop | 65.83% | 78.80% | Marlins |
| 11: Scott Baker | 59.56% | 71.87% | Twins |
| 12: Mark Buehrle | 69.74% | 81.39% | White Sox |
| 13: Andrew Miller | 66.02% | 77.34% | Marlins |
| 14: Nick Blackburn | 53.02% | 64.23% | Twins |
I don't know if it's Mauer and Baker, or if these organizations stress this strategy, or pure coincidence, but it's something. I included Mark Buehrle on the list because the man is, or he surely should be, legendary at fielding his position.
Of note, Gerald Laird, a terrific thrower, received fewer fastballs with a man on first than otherwise. Bartolo Colon and Trevor Hoffman shied away from their fastballs with a man on.
As for the other pitch types, base runners are successful 80-85% of the time running on off-speed pitches. Interestingly, on SB attempts of third, the lowest success rate has come on the knuckleball. Tim Wakefield must do a better job holding runners on second than he does on first. From the following, you can see that due to Wakefield, it appears that diminished velocity deters steals of third.
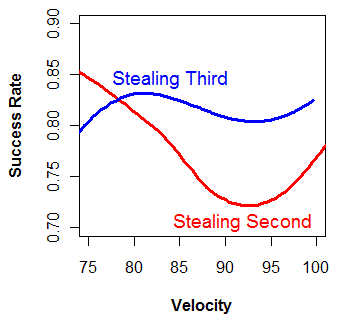
Combining velocity and location in a regression doesn't accomplish as much as I was hoping in terms of sorting out what catchers have had more or less difficult opportunities to gun down runners. Every catcher, save two, was expected to throw out 74-79% of base runners based on these factors alone. Only Wakefield's personal catchers Kevin Cash and George Kottaras have been forced to throw on especially difficult pitches. And they still have better numbers than Jason Varitek and Victor Martinez.
| Change-Up | July 03, 2010 |
Miguel Cabrera & Historical Perspective
R.J. Anderson, in a piece at Fangraphs, sets the stage nicely:
The 2009 season ended poorly for Miguel Cabrera. An arrest and the Tigers’ collapse coincided with the worst month of his season which wasn’t all that poor by anyone else’s standards. The dialect associated with the 27 year old was unkind and the offseason carried with it rumors of a potential trade for budgetary concerns. Those passed and as such Cabrera has spent the 2010 season changing the language like Babylon.
Cabrera is back and producing like he never has before. His .337/.412/.628 line would easily be a career best, which is saying something given the career we're talking about. Since 1960, only 12 players amassed more plate appearances through their age-26 season than Cabrera. Of those with at least 4,000 PA's through their age 27 season, here is how Cabrera ranks in OPS+.
| Rk | Player | OPS+ | PA | From | To | Age | G | HR | GDP | SB | CS | BA | OBP | SLG | OPS | Tm |
|---|---|---|---|---|---|---|---|---|---|---|---|---|---|---|---|---|
| 1 | Albert Pujols | 167 | 4741 | 2001 | 2007 | 21-27 | 1091 | 282 | 141 | 38 | 23 | .332 | .420 | .620 | 1.040 | STL |
| 2 | Ken Griffey | 150 | 5262 | 1989 | 1997 | 19-27 | 1214 | 294 | 87 | 123 | 48 | .302 | .381 | .562 | .943 | SEA |
| 3 | Barry Bonds | 147 | 4255 | 1986 | 1992 | 21-27 | 1010 | 176 | 45 | 251 | 72 | .275 | .380 | .503 | .883 | PIT |
| 4 | Alex Rodriguez | 144 | 5687 | 1994 | 2003 | 18-27 | 1275 | 345 | 110 | 177 | 46 | .308 | .382 | .581 | .963 | SEA-TEX |
| 5 | Miguel Cabrera | 143 | 4766 | 2003 | 2010 | 20-27 | 1115 | 229 | 136 | 26 | 16 | .313 | .385 | .548 | .933 | FLA-DET |
Cabrera is off to as good a start as all but a handful of the very best hitters over the last 50 years. And now, at 27-years old, it appears he could be coming into his own as a truly elite power hitter. Not once has Cabrera finished in the top-5 in his league in slugging percentage. In 2010, despite playing home games at spacious Comerica Park, Cabrera leads the American League with a .630 figure.
Working in Cabrera's favor is the historical trend that hitters tend to tack on power around the age of 27. Below I present the average of the ten best slugging seasons by 24, 27, 30 and 33-year olds from 1990 through 2009:
Age     SLG
24     .588
27     .628
30     .634
33     .618
Some might say that the era in question, 1990 through 2009, could be skewed by the influence steroids played. Have players always been able to tack on power into their 30's? Well here is the same table, this time for 1970 through 1989.
Age     SLG
24     .550
27     .591
30     .582
33     .549
In both eras, elite sluggers were able to establish and maintain peak power levels at the age of 27. From 1990 through 2009, hitters were able to extend the period out another three years to their 33-year old season, while in the earlier timeframe power leveled back off to the levels seen prior to the 27 season. Depending on how you choose to interpret the data above, it would appear Cabrera has anywhere from three to six top-notch power hitting seasons ahead of him. More succinctly, the power spike could well be here to stay.
There are no guarantees, of course. Albert Pujols had his best two slugging seasons in his age 26 and 23 seasons respectively. Alex Rodriguez notched his best number at the age of 31. But something seems to be happening with Cabrera, and if history is any guide, it's quite possible that one of the more impressive young sluggers of all time is about to get even better. Even though Miggy's problems were mostly off-the-field at the end of 2009, the power spike is a welcome development for Tigers fans, who only months ago seemed to be questioning whether Cabrera was the sort of cornerstone player they wanted for their team. He's answering those questions emphatically in 2010.
| F/X Visualizations | July 02, 2010 |
Musing on Pitch Type Platoon Splits
The platoon splits on different pitch types are well documented: John Walsh calculated them in the 2008 THT Annual, I did in these pages, and recently Max Marchi broke down the pitch types into finer buckets and showed the splits for each bucket. Here I am interested in understanding, at least in a qualitative sense, why different pitch types have different platoon splits. In no way is this going to be a complete explanation, but an attempt at a first step. Here I am going to focus on the slider, a pitch with a large platoon split (much better against same-handed batters), and the changeup, a pitch with no platoon split (does roughly the same against same- and opposite-handed batters).
Since almost all pitchers pitch off of the fastball I think it is best to compare both pitches against the fastball. Here is a chart I made for the 2009 THT Annual showing the approximate movement of the different pitch types for right-handed pitchers.
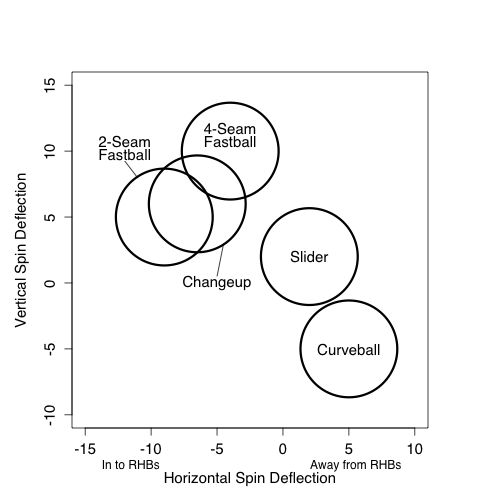
Using the four-seam fastball as a guide you can see that a slider in comparison moves down and away from same-handed batters (in to opposite-handed batters). The changeup moves moves down and in to same-handed batters (away from opposite-handed batters). I think this is part of the reason platoon split for the two pitches.
If a pitcher can release his fastball and slider with roughly the same initial trajectory and locate his fastball around the middle of the zone the difference in movement will put his slider down and away to a same-handed batter and down-and-in to an opposite handed batter. If he does the same with his changeup the pitch will end up down and away to the opposite-handed batter and down and in to the same-handed batter. All else being equal a down-and-away pitch is much better than a down-and-in pitch. Looking back at my run value by location maps down and away is the best place to pitch, while down and in is, other than the heart of the strike zone, the worse place to be in within the zone.
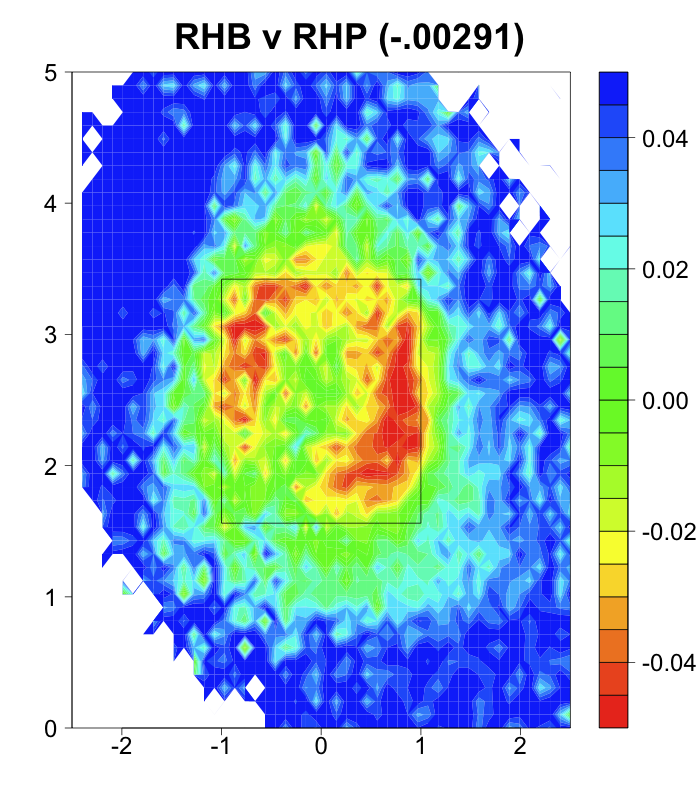
So when a pitcher repeats his motion well with his pitches, starts his pitches on roughly the same trajectory and locates his fastball in the zone the movement relative to fastball movement will take a changeup into a good spot against opposite-handed batters and a poor spot against same-handed batters and vice versa for a slider. This, I think, is a big reason for the platoon splits, or lack thereof, for the two pitch types.
Another source for the platoon split is the different vantage points a batter has against same- and opposite-handed pitchers. A same-handed batter most likely doesn't get as good a view of the pitch as it is released. Mike Fast takes this into account very well by showing pitch trajectories from the view point of the batter (Scroll a little more than half way down this post to see).
Josh Kalk theorized that minimizing the difference between a slider and a fastball along the beginning of their trajectories might be a key to a slider's effectiveness. I thought it would be cool to check that out from a same-handed versus opposite-handed batter's perspective. My physics chops are not the equal of Mike Fast's so I sort of fudged the perspective projection.
From RHB's perspective:
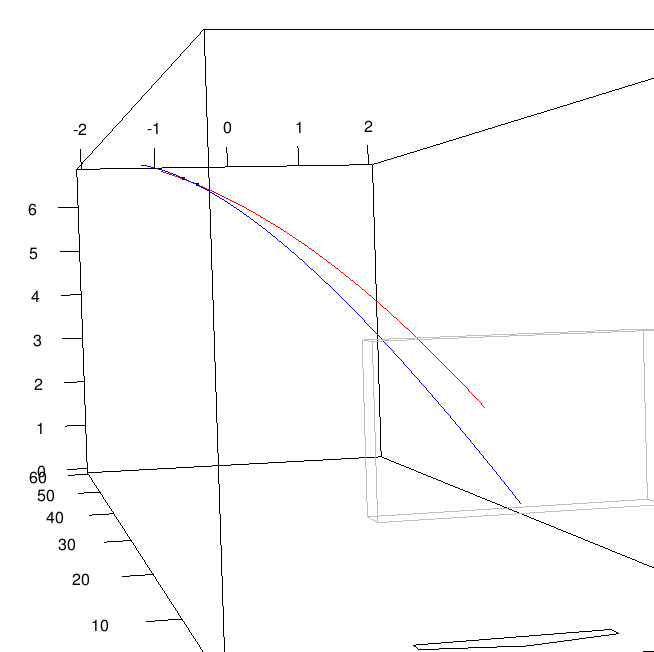
From LHB's perspective:
These are a subsequent fastball (red) and slider (blue) from Brad Lidge, a prototypical fastball-slider pitcher. The black dots indicate the pitch location 0.075 seconds into the pitch's trajectory, approximately when a batter must decided to swing or not. To the right-handed batter the two trajectories are almost identical up to that point. The fastball is slightly farther along but it is very close. For the left-handed batter the two pitches appear much farther apart. My perspectives are not perfect, but I think this could indicate another possible reason for sliders' large platoon split.
| Touching Bases | July 01, 2010 |
Strike Zone Sizes Crouching Batters
We consider the strike zone a static area, although, in reality, it is a moving target. "As the batter is prepared to swing at a pitched ball," an umpire has to guess the height of the batter's letters and his knees. This moment is imprecise, yet PITCHf/x analysts must try to capture the top and bottom of the strike zone to get the most out of the PITCHf/x data.
As I see it, there are several ways to either directly observe or infer the parameters of the strike zone. One is to follow the work of John Walsh, Dan Fox, Ike Hall, Josh Kalk, Dan Turkenkopf, Mike Fast, Jeff Zimmerman, Ike Hall, and others, who all find the probability of a pitch being called a strike at any given location. It is helpful to know the edges of the zone without such rigorous analysis as these, as they necessitate large volumes of data. Instead, we know the plate is 17 inches wide. That serves just fine for the width of the zone. And we hope that we know the batter's height. Unlike weight, which varies year to year and is sometimes a touchy subject for athletes, height is consistent throughout a player's playing career, and should be fairly accurate. In some Pedroian cases, we'll hear that the guy is even smaller than listed. That's not the a big problem, though. The issue with using height, and height alone, is that batters have different stances. Fortunately, there are stringers at every game who mark what they believe to represent the top and bottom of the strike zone are for each batter. By linking the Retrosheet and Gameday databases, I found each batter's height and average top and bottom strike zone values.
Mike Fast has looked into the subject before, and I'm borrowing ideas from him, as well as an image from him below. The other guy whose data has proven useful to me in this study is actually the "Batting Stance Guy." BSG claims to offer "the least marketable skill in America," though, for me, it's quite useful.
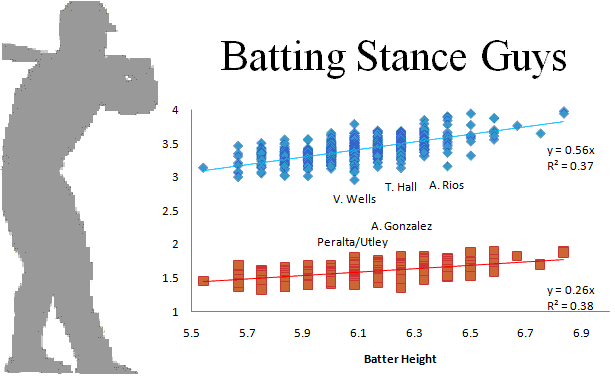
You can estimate the top point of a batter's strike zone as 56% of his height, and the bottom as 26%. But I think we can do better. I took 130,000 pitches vs. RHBs that crossed over the heart of the plate, spanning a foot in width. Using the top and bottom strike zone values provided for each pitch, the average top and bottom strike zone values for each batter, the batter's height, and finally a regressed version using the 2nd and 3rd categories, I found the percent of pitches that agree with the umpire's ball/strike call.
| Stringer SZ | Average SZ | Height | Regress'd | |
|---|---|---|---|---|
| High | 85.08% | 88.03% | 89.92% | 89.99% |
| Strike | 85.46% | 85.78% | 85.83% | 85.95% |
| Low | 95.60% | 97.28% | 97.66% | 97.67% |
It would appear that height is the best predictor, but certainly the values inputted by the stringers can add some value. Yet there are still outliers.
Toby Hall is one of the crouchiest players in baseball, and Batting Stance Guy demonstrates as much in this video. He also stresses the bent knees of Vernon Wells and Albert Pujols, whose crouches I can envision, but unfortunately they can't be fully captured in a regression. And Alex Rios has a big crouch, which was even commented on by Christina Kahrl in a past BP Annual. She wrote, "Alex Rios' stance reminds me of Von Hayes--spread low, slightly knock-kneed, and will he, like Hayes, always just be that slightly less than expected but still-good player," to which I say, bite your tongue, Christina Kahrl. Von Hayes is an icon.
Most of the batters who have higher strike zones than their height would indicate are pitchers. Many pitchers stand at the plate stiff as a board. As for position players, BSG accentuates the straight front leg in Adrian Gonzalez's stance. Jhonny Peralta's stance is unique, too. And Chase Utley also has an upright stance, which is somewhat notable, but more importantly, Batting Stance Guy also does an impression of the Von Hayes crouch in the linked Phillies video, and any time you have the opportunity to reference Von Hayes, it's a no brainer.