Rich Lederer • Baseball Beat
Patrick Sullivan • Change-Up
Jeremy Greenhouse • Touching Bases
Dave Allen • F/X Visualizations
Sky Andrecheck • Behind the Scoreboard
Marc Hulet • Around the Minors
Al Doyle • Past Times
Retired Uniforms:
Bryan Smith • WTNY
Joe Sheehan • Command Post
Jeff Albert • The Batter's Eye
RSS Feed
Home
*Examining the Past, Present, and Future*
Lineup Card
Recent Entries
» Putting Together a Reality Team
» Historical Hall of Fame Vote Comparisons: 2012
» An All-Christmas Team
» The New-Look Angels
» John Denny: The Forgotten Cy Young Award Winner
» Money Isn't Everything
» What Would It Take to Hit .400 in the 21st Century?
» Halos Heaven
» Brandon McCarthy's Breakout Season
» Link-o-Rama
» Historical Hall of Fame Vote Comparisons: 2012
» An All-Christmas Team
» The New-Look Angels
» John Denny: The Forgotten Cy Young Award Winner
» Money Isn't Everything
» What Would It Take to Hit .400 in the 21st Century?
» Halos Heaven
» Brandon McCarthy's Breakout Season
» Link-o-Rama
Best of Baseball Beat
Abstracts From the Abstracts
1977 Baseball Abstract
1978 Baseball Abstract
1979 Baseball Abstract
1980 Baseball Abstract
1981 Baseball Abstract
1982 Baseball Abstract
1983 Baseball Abstract
1984 Baseball Abstract
1985 Baseball Abstract
1986 Baseball Abstract
1987 Baseball Abstract
1988 Baseball Abstract
1978 Baseball Abstract
1979 Baseball Abstract
1980 Baseball Abstract
1981 Baseball Abstract
1982 Baseball Abstract
1983 Baseball Abstract
1984 Baseball Abstract
1985 Baseball Abstract
1986 Baseball Abstract
1987 Baseball Abstract
1988 Baseball Abstract
Bert Blyleven Series
Meeting Up and Hanging Out with Bert
The Results Are In And...
Aficionado Heavily Invested in Blyleven
Latest on Blyleven's Chances for the HOF
The Internet Zealot Responds
400 Down and 5 to Go...
Bert Be Home By Eleven?
Blyleven's Forgotten Season (1973)
HeyMan, Your Comments Don't Hold Water
The Waiting is the Hardest Part
Another Addition to the Blyleven Series
Search for the Truth
As Dominant as His HOF Contemporaries
Listen, Buster
A Larger Step for Blyleven
Answering the Naysayers (Part Two)
Another Small Step for Blyleven
Q&A: Blyleven on the Twins
The Majority Rules, Right?
It's All Dutch to Some
The Hall of Fame Case for Bert Blyleven
Q&A: Blyleven on Felix Hernandez
Clemens Rocketing Up Charts
Poz: An Interview With a KC Star
A HOF Chat with Tracy Ringolsby
Up Close and Personal
A Peek Into the Mind of a HOF Voter
Answering the Naysayers
It's That Time of the Year (Again)
"If Cooperstown is Calling..."
The Bert Alert
One Small Step for Blyleven...
Only the Lonely
Exclusive Interviews
Lee Sinins
Alex Belth
David Pinto
Will Carroll
Mike Carminati
Aaron Gleeman
Joe Sheehan
Jay Jaffe
Jeff Peek
Tracy Ringolsby
Joe Posnanski
Bill James Part I, II, III
Jon Lalonde
Chuck Tiffany
Dayn Perry
Fay Vincent
Nate Silver
Alex Belth
David Pinto
Will Carroll
Mike Carminati
Aaron Gleeman
Joe Sheehan
Jay Jaffe
Jeff Peek
Tracy Ringolsby
Joe Posnanski
Bill James Part I, II, III
Jon Lalonde
Chuck Tiffany
Dayn Perry
Fay Vincent
Nate Silver
Bullpen
Rich Lederer
The Odd Couple (with Alex Belth)
The MostUnder Over Underrated Player in Baseball (with Brian Gunn)
Three Wise Men (roundtable by Alex Belth)
Infrequently Asked Questions (interview with Matt Welch)
Interview (Orioles Think Tank)
Bernie and the Yanks (Bronx Banter)
Hope and Faith: How the LAA Win the World Series (Baseball Prospectus)
NL West (The Soul of Baseball)
Greatest Living Hitter? (Sports Illustrated)
Roundtable: 2008 HOF Ballot (Armchair GM)
The Most
Three Wise Men (roundtable by Alex Belth)
Infrequently Asked Questions (interview with Matt Welch)
Interview (Orioles Think Tank)
Bernie and the Yanks (Bronx Banter)
Hope and Faith: How the LAA Win the World Series (Baseball Prospectus)
NL West (The Soul of Baseball)
Greatest Living Hitter? (Sports Illustrated)
Roundtable: 2008 HOF Ballot (Armchair GM)
Patrick Sullivan
Designated Hitters
David Bromberg (Q&A: John Denny)
Mark Armour (H. Killebrew and Versatility)
Joe Lederer (Soundtrack of a Prospect)
David Bromberg (Clemente's Autograph)
David Bromberg (Woody Fryman)
D. Baumstein (WAR Against Age: Pitchers)
Doug Baumstein (The WAR Against Age)
Doug Baumstein (A Lifetime on the Road)
John Fraser (Pick Six)
Mark Armour (How to Score More Runs?)
Bill Parker (What Opening Day Tells Us)
Stan Opdyke (Pat Rispole)
Chris Jaffe (Evaluating Baseball's Mgrs)
Stan Opdyke (Baseball Radio in NYC, 1953)
A. Nathan (Performance of Baseball Bats)
Michael Weddell (Edgar Martinez/HOF)
Jon Weisman (100 Things Dodgers Fans...)
Stan Opdyke (Connie Mack and Vin Scully)
Eric Walker (Evaluating Run Production)
Brent Mayne (The Intangibles of Catching)
Chris Moore (Best Fastballs in Baseball)
Dave Baldwin (The Batter’s Brain)
Shawn Haviland (Ivy League to MLB)
Larry Granillo (Walking Off)
Rob Iracane (Solo HR Won't Break You)
Tommy Bennett (Charm of AM Radio)
Harry Pavlidis (Johan Santana's Fast Start)
John Walsh (WAR and Remembrance)
Eric Walker (Precisely Inaccurate)
Bob Timmermann (As They See 'Em)
Geoff Young (Unicycles and Delusions)
Baseball Analysis at Tufts (Groundballers)
Baseball Analysis at Tufts (GB Out Rates)
G. Rybarczyk ('09 Hit Tracker Projections)
Joe Lederer (Curt Schilling/HoF)
Conor Gallagher (Hall of Fallacies)
Chris Green (Jim Rice, HoF, the Numbers)
Shawn Hoffman (Baseball's Bear Mkt?)
Paul Anthony (Manny Syndrome)
Ross Roley (World Series Odds)
B. Timmermann (Catcher's Interference)
R.J. Anderson (Waiting the Hardest Part)
Maury Brown (Cubs, MLB, and Cuban...)
Myron Logan (Dee-Fense, Dee-Fense)
Craig Calcaterra (Frivolity, Part I, Part II)
Chad Finn (Ode to Baseball Cards)
David Cameron (Mariners Foibles)
Chris Dial (Chipper Jones)
Pat Lederer (Memory Lane)
David Appelman (Clutch Pitching)
Bob Rittner (DH)
Jonathan Mayo (Roger Clemens)
Lisa Winston (My Son-in-Law...)
Russ McQueen (The Yellow Hammer)
Bob Rittner (I'm OK, You're OK)
Mark Armour (In Defense of the HOF)
Pat Jordan (Friends)
Dan Levitt (Analysis of Terry Ryan)
Doug Baumstein (Trading Econ 101)
Ross Roley (Runner's Reluctance II)
Ross Roley (Runner's Reluctance I)
Mark Armour (No-Longer Lovable Sox)
Bruce Regal (Stealthy and Wise)
Brian Gunn (Roid Monster)
Current/McEvoy (Value of the SB)
John Rickert (Sinister Thefts)
Nate Silver (Sabermetrics)
David Vincent (Home Run Production)
Joe P. Sheehan (Enhanced Gameday II)
Mark Armour (An Ode to Sport)
David Gassko (All-Time Worm Burners)
Joe P. Sheehan (Enhanced Gameday)
John Walsh (When Titans Clash)
Fox/Williams (Quantifying Coaches II)
Fox/Williams (Quantifying Coaches I)
Jacob Luft (Bull Durham Rant)
Chad Finn (Strat-O-Matic)
Lisa Winston (Rotisserie Baseball)
Dave Studeman (Baseball Stats)
Steve Treder (Roger Craig)
Marc Normandin (Jeff Bagwell)
D. Appelman (Expanding Strike Zone)
Jeff Sackmann (Worst MiL Defenders)
Jeff Sackmann (Best MiL Defenders)
Maxwell Kates (Van Lingle Mungo)
David Appelman (Pitch Location)
Kent Bonham (Danny Ray Herrera)
Glenn Stout (Two Baseball Poems)
Bruce Regal (The Challenge Round)
Mark Lamster (Barry & Ty)
Geoff Young (NL West)
Tom Lederer (The Ryan Express)
Brian Erts (Great Leap Forward)
David Pinto (Parity and the N.L.)
Jacob Luft (Fathers and Daughters)
Jamey Newberg (Pete's Sake)
Jeff Albert (A. Jones Swing Analysis)
Jeff Albert (A-Rod Swing Analysis)
Keith Law (Death, Taxes, and Waivers)
Peter Abraham (Tales of Torre Tales)
Larry Borowsky (Let 'er Rip II)
Dan Levitt (Empirical Analysis of Bunting)
Jonah Keri (If I Met Warren Cromartie...)
Bob Klapisch (War Stories)
Bob Timmermann (John F. Kennedy HS)
Kent Bonham (Aluminum Adjustments)
Al Doyle (More Than Superstars)
Ross Roley (Instant Replay)
David Vincent (Barry Bonds Homers)
Chad Finn (Our Favorite Obscurities)
Bill Deane (1979 NL MVP)
Mark Armour (Rise/Fall of Artificial Turf)
Jeff Angus (Wally Moon Camp)
David Berri (Money and Baseball)
Larry Borowsky (Baseball w/o the #s)
Derek Zumsteg (The Irrational Market)
David Regan (Free Agent Contracts)
Peter Schmuck (Steroids and the HOF)
David Appelman (Pitchers, Pitch by Pitch)
Dan Fox (Swinging, Taking, Fouling, Etc)
Patrick Sullivan (Study of NYY CF/BOS LF)
Will Leitch (Baseball Journalism)
Jeff Sullivan (Pitcher Release Points)
Steve Treder ('69-'70 Giants)
Maury Brown (Charlie Finley)
John Brattain (Bob Johnson)
Bob Klapisch (The Case for Bert Blyleven)
Jeff Peek (Pride and Prejudice)
Dayn Perry (Bert and Warren)
Rob Neyer (If Don Sutton Was Great...)
Lisa Winston (Minor League Memories)
Alex Belth (Otis Redding Was Right)
David Cameron (Long Live the King)
Jeff Angus (Baserunning Study)
Bert Blyleven (Baseball Playoffs)
Boyd Nation (Not a Prospect List)
James Click (Batters-Baserunners Study)
Jeff Shaw (Why I Love Baseball)
David Gassko (BIP/BFP Fielding Study)
Jay Jaffe (Milwaukee Sausage Race)
Jamey Newberg (Remember When)
Bob Klapisch (Press Box to the Mound)
Dan Levitt (Predictive Value of BB)
David Vincent (Official Scorer)
Jon Weisman (Rick Monday)
Larry Borowsky (Let 'er Rip)
Will Carroll (Fictional Short Story)
Bob Timmermann (Japanese Baseball)
Cyril Morong (Best Pitching Seasons)
Sean Forman (Monte Carlo Win-Loss)
Brian Gunn (My Little Blue Book)
Joe Lederer (My Dad and Baseball)
Bill Deane (Bob Gibson, 1968)
Mark Armour (1977 Yankees)
Darren Viola (Retrosheet)
David Pinto (RFK)
Dayn Perry (Brave Heart)
Matt Welch (Dave Hansen)
Kevin Kernan (Jack McKeon)
Tom Lederer (Dodgers Road Trip)
Steve Lombardi (Slider)
Studes (Picturing Baseball)
Mike Carminati (Luck of the Drawl)
Eric Neel (Vin Scully)
J.C. Bradbury (Leo Mazzone)
John Sickels (Bill James)
Search Baseball Analysts
Archives
By Category:
Around the Majors Content Only
Around the Minors Content Only
Baseball Beat Content Only
Baseball Beat/Change-Up Content Only
Baseball Beat/WTNY Content Only
Behind the Scoreboard Content Only
Change-Up Content Only
Change-Up/Around the Majors Content Only
Command Post Content Only
Crunching the Numbers Content Only
Designated Hitter Content Only
F/X Visualizations Content Only
Past Times Content Only
Saber Talk Content Only
The Batter's Eye Content Only
Touching Bases Content Only
Weekend Blog Content Only
WTNY Content Only
By Month:
February 2012
January 2012
December 2011
October 2011
September 2011
August 2011
July 2011
June 2011
May 2011
April 2011
March 2011
February 2011
January 2011
December 2010
November 2010
October 2010
September 2010
August 2010
July 2010
June 2010
May 2010
April 2010
March 2010
February 2010
January 2010
December 2009
November 2009
October 2009
September 2009
August 2009
July 2009
June 2009
May 2009
April 2009
March 2009
February 2009
January 2009
December 2008
November 2008
October 2008
September 2008
August 2008
July 2008
June 2008
May 2008
April 2008
March 2008
February 2008
January 2008
December 2007
November 2007
October 2007
September 2007
August 2007
July 2007
June 2007
May 2007
April 2007
March 2007
February 2007
January 2007
December 2006
November 2006
October 2006
September 2006
August 2006
July 2006
June 2006
May 2006
April 2006
March 2006
February 2006
January 2006
December 2005
November 2005
October 2005
September 2005
August 2005
July 2005
June 2005
May 2005
April 2005
March 2005
February 2005
January 2005
December 2004
November 2004
October 2004
September 2004
August 2004
July 2004
June 2004
May 2004
April 2004
March 2004
February 2004
January 2004
December 2003
November 2003
October 2003
September 2003
August 2003
July 2003
June 2003
Reference
Organizational Stats
Arizona Diamondbacks Bat / Pitch
Atlanta Braves Bat / Pitch
Baltimore Orioles Bat / Pitch
Boston Red Sox Bat / Pitch
Chicago Cubs Bat / Pitch
Chicago White Sox Bat / Pitch
Cincinnati Reds Bat / Pitch
Cleveland Indians Bat / Pitch
Colorado Rockies Bat / Pitch
Detroit Tigers Bat / Pitch
Florida Marlins Bat / Pitch
Houston Astros Bat / Pitch
Kansas City Royals Bat / Pitch
Los Angeles Angels Bat / Pitch
Los Angeles Dodgers Bat / Pitch
Milwaukee Brewers Bat / Pitch
Minnesota Twins Bat / Pitch
New York Mets Bat / Pitch
New York Yankees Bat / Pitch
Oakland Athletics Bat / Pitch
Philadelphia Phillies Bat / Pitch
Pittsburgh Pirates Bat / Pitch
St. Louis Cardinals Bat / Pitch
San Diego Padres Bat / Pitch
San Francisco Giants Bat / Pitch
Seattle Mariners Bat / Pitch
Tampa Bay Devil Rays Bat / Pitch
Texas Rangers Bat / Pitch
Toronto Blue Jays Bat / Pitch
Washington Nationals Bat / Pitch
All-Star Links
Official Websites
News and Notes
Baseball News Blog
Baseball Newstand
ESPN Baseball
Fox Sports Baseball
Pro Sports Daily
Roto World
The Roto Times
USA Today Baseball
Baseball Newstand
ESPN Baseball
Fox Sports Baseball
Pro Sports Daily
Roto World
The Roto Times
USA Today Baseball
Reference and Analysis
Baseball Almanac
Baseball America
Baseball Archive
Baseball Contracts
Baseball Cube
Baseball Graphs
Baseball Library
Baseball Musings Player Database
Baseball Page
Baseball Primer
Baseball Prospectus
Baseball Reference
Baseball Statistics
Baseball Truth
Boxscore Central
Diamond Mind Baseball
Doug's Stats
FanGraphs
Fast Balls (pitchfx catalog)
Hardball Dollars
Hardball Times
Hit Tracker
Retrosheet
Rotobase/Rotoblog
Stat Corner
STATS
Tango on Baseball
Yahoo Sports MLB
Web Gems
Bill James Primer
Sabermetric Manifesto (Grabiner)
Pitching and Defense (McCracken)
Pitching and Defense (Tippett)
Transactions Primer (Neyer)
Baseball Stats (Batter's Box)
Prospect Report (Cameron)
Pitcher Workloads (Sheehan)
Goodbye to Old Baseball Ideas (Rickey)
Sabermetric Manifesto (Grabiner)
Pitching and Defense (McCracken)
Pitching and Defense (Tippett)
Transactions Primer (Neyer)
Baseball Stats (Batter's Box)
Prospect Report (Cameron)
Pitcher Workloads (Sheehan)
Goodbye to Old Baseball Ideas (Rickey)
Columnists
Baseball Blogs
Around the Majors
Athletics Nation
Baseball Crank
Baseball Musings
Baseball-Reference Blog
Batter's Box
Big League Stew
Bronx Banter
Catfish Stew
Cub Town
Dan Agonistes
Dodger Thoughts
DRays Bay
Ducksnorts
Futility Infielder
Halos Heaven
Inside the Rockies
It Might Be Dangerous
Knuckle Curve
LoHud Yankees Blog
Lookout Landing
Management by Baseball
Metaforian
Metsgeek
Mike's Baseball Rants
Only Baseball Matters
Redbird Nation
Red Reporter
Sabernomics (Braves)
Seth Speaks
ShysterBall
6-4-2 (Angels/Dodgers)
The Book
TheCubdom
The Cutting Edge
The House That Dewey Built
The View From The Bleachers
Tiger Blog
U.S.S. Mariner
Viva El Birdos
Where's Kernan
Minor Leagues
Arizona Fall League
BA Player Finder
Cal Leaguers
Jamey Newberg
JDM's Scoresheet Baseball
Minor League Baseball
Minor League Park Factors
Minor League Splits
No Pepper
Sickels' Minor League Ball
Warm October Nights
BA Player Finder
Cal Leaguers
Jamey Newberg
JDM's Scoresheet Baseball
Minor League Baseball
Minor League Park Factors
Minor League Splits
No Pepper
Sickels' Minor League Ball
Warm October Nights
Amateur
Boyd's World (College)
Cape Cod Baseball League
College Baseball Blog
College Baseball Insider
Collegiate Baseball Newspaper
College Splits
College Splits Blog
Dirtbags Baseball (Long Beach State)
NCAA Baseball
NCBWA
Team One Baseball (High School)
Texas A&M & Baseball
Cape Cod Baseball League
College Baseball Blog
College Baseball Insider
Collegiate Baseball Newspaper
College Splits
College Splits Blog
Dirtbags Baseball (Long Beach State)
NCAA Baseball
NCBWA
Team One Baseball (High School)
Texas A&M & Baseball
Historical
Cuban Baseball
House of David
Jim "Mudcat" Grant's Web Page
Negro League Baseball Players Assoc
Negro Leagues Baseball Museum
1919 Black Sox
Pacific Coast League
Philadelphia Athletics Historical Society
Shoeless Joe Jackson Society
SABR-L Archives
Walter O'Malley
House of David
Jim "Mudcat" Grant's Web Page
Negro League Baseball Players Assoc
Negro Leagues Baseball Museum
1919 Black Sox
Pacific Coast League
Philadelphia Athletics Historical Society
Shoeless Joe Jackson Society
SABR-L Archives
Walter O'Malley
Miscellaneous
Forums
Credits
Ticket Center
Tickets to Baseball -
Premium Red Sox Tickets - Tickets to Marlins Games - Cardinals Game Tickets - NY Yankee Tickets - Tickets Oakland Athletics - Dallas Cowboys Tickets - Arizona Cardinals Tickets - Tickets Seattle Seahawks - Buffalo Bills Tickets Online - Tickets to Dolphins Football
Buy Boston Red Sox tickets,
Philadelphia Phillies tix,
NY Yankees tickets,
NY Mets tickets, and
MLB All Star game tickets at ABC tickets
Not sure where to find the best online sportsbooks? Start your search with PlayersJet.
Get deals at SportsMemorabilia.com on baseball apparel, including Phillies jerseys and more for adults and children.
Shop the largest selection baseball equipment on sale at Sports Unlimited. Check out tons of baseball gloves, youth baseball gloves and catchers gear from Rawlings, Wilson, Nike & Under Armour.
2011 Draft Order
Courtesy of Baseball America
First-Round:
 1. Pirates (57-105)
 2. Mariners (61-101)
 3. Diamondbacks (65-97)
 4. Orioles (66-96)
 5. Royals (67-95)
 6. Nationals (69-93)
 7. Diamondbacks (for B. Loux)
 8. Indians (69-93)
 9. Cubs (75-87)
10. Padres (for Karsten Whitson)
11. Astros (76-86)
12. Brewers (77-85)
13. Mets (79-83)
14. Marlins (80-82)
15. Brewers (for Dylan Covey)
16. Dodgers (80-82)
17. Angels (80-82)
18. Athletics (81-81)
19. Red Sox (from DET for Martinez)
20. Rockies (83-79)
21. Blue Jays (85-77)
22. Cardinals (86-76)
23. Nationals (from CWS for Dunn)
24. Rays (from BOS for Crawford)
25. Padres (90-72)
26. Red Sox (from TEX for Beltre)
27. Reds (91-71)
28. Braves (91-71)
29. Giants (92-70)
30. Twins (94-68)
31. Rays (from NYY for Soriano)
32. Rays (96-66)
33. Rangers (from PHI for Lee)
Supplemental First Round:
34. Nationals (Dunn)
35. Blue Jays (Downs)
36. Red Sox (Martinez)
37. Rangers (Lee)
38. Rays (Crawford)
39. Phillies (Werth)
40. Red Sox (Beltre)
41. Rays (Soriano)
42. Rays (Balfour)
43. Diamondbacks (LaRoche)
44. Mets (Feliciano)
45. Rockies (Dotel)
46. Blue Jays (Buck)
47. White Sox (Putz)
48. Padres (Garland)
49. Giants (Uribe)
50. Twins (Hudson)
51. Yankees (Vazquez)
52. Rays (Benoit)
53. Blue Jays (Olivo)
54. Padres (Torrealba)
55. Twins (Crain)
56. Rays (Choate)
57. Blue Jays (Gregg)
58. Padres (Correia)
59. Rays (Hawpe)
| Touching Bases | March 31, 2009 |
Can Albert Pujols Win the Triple Crown?
“My guess is that we will see another Triple Crown winner in the next ten years. The historical trend lines are heading in that direction. That doesn’t necessarily mean anything, as, as I said, the historical trend lines may be simply a result of a random clustering of talent. It’s difficult, and it hasn’t happened for a long time, but it has not become impossible for some player to win the Triple Crown.” Bill James—June 6, 2008
Albert Pujols has a serious shot at winning the first Triple Crown since Frank Robinson and Carl Yastrzemski did so back in the 60s. It's been over 70 years since a National Leaguer led the league in home runs, batting average, and runs batted in. The only time Pujols has led the league in any triple crown category was when he boasted a .359 batting average back in 2003. He’s finished second in every category at least once. But this year might be different.
This year, Pujols might have a fully healthy elbow. This year, Chipper Jones might not threaten .400. This year, Ryan Howard might not pound 50 home runs. According to Joe Posnanski, you just have to have The Power to Believe. This is the year of Pujols.
Here's how Pujols has stacked up thus far in his career. This table shows Pujols' marks followed by the league leader's in parentheses.
+-------+-------------------+-----------+----------------+-------+-------------------+
| Year  |   Batting Average | Home Runs | Runs Batted In | Games | Plate Appearances |
+-------+-------------------+-----------+----------------+-------+-------------------+
| 2008  |     .357  (.364)  |  37  (48) |  116  (146)    |  148  |       641         |
| 2007  |     .327  (.340)  |  32  (50) |  103  (137)    |  158  |       679         |
| 2006  |     .331  (.344)  |  49  (58) |  137  (149)    |  143  |       634         |
| 2005  |     .330  (.335)  |  41  (51) |  117  (128)    |  161  |       700         |
| 2004  |     .331  (.362)  |  46  (48) |  123  (131)    |  154  |       692         |
| 2003  |     .359  (.359)  |  43  (47) |  124  (141)    |  157  |       685         |
| 2002  |     .314  (.370)  |  34  (49) |  127  (128)    |  157  |       675         |
| 2001  |     .329  (.350)  |  37  (73) |  130  (160)    |  161  |       676         |
+-------+-------------------+-----------+----------------+-------+-------------------+
Let’s break it down by category. I've looked at six projection systems—Bill James, CHONE, Marcel, Oliver, PECOTA, and ZiPS—to give us an idea of what to expect.
Batting Average
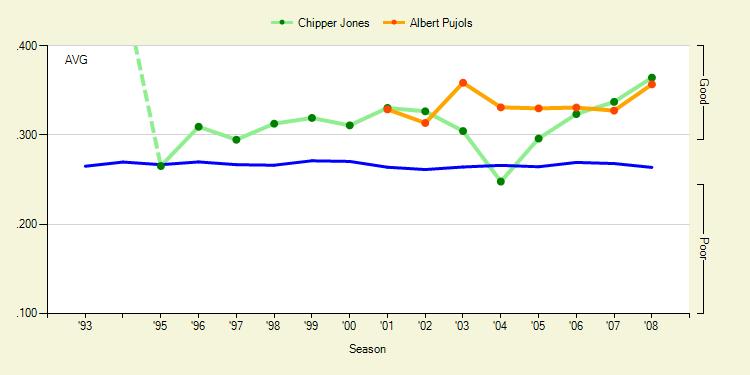
Last year, Chipper Jones'.364 average narrowly edged Pujols’.357 average for the batting title. This year, every projection system shows Pujols consistently hitting between .327 and .339. Chipper has a much wider range. CHONE and PECOTA, currently the two most trusted systems out there, completely disagree on Chipper. CHONE puts him at .310 while PECOTA shows Jones posting a .341 average to edge out Pujols. Jones’ true talent level with regards to batting average was the subject of much discussion here, here, and here. It's tough to say who has the edge between the two.
Pujols and Chipper both excel in their plate discipline skills. Last year they had the lowest first-strike percentage of all National League batters to qualify for the batting title. They rarely see pitches inside the strike zone, and neither is prone to swing at pitches in general. In fact, Pujols and Chipper both walked more than they struck out. Pujols has achieved this feat seven straight years. When shooting for a high batting average, the importance of not striking out is, of course, that one has a greater chance at getting a hit if the ball is put into play.
Chipper and Pujols also excel at earning surefire hits by putting the ball out of play and over the fence. Low strikeout and high homerun totals give players a good chance at having a high average. The rest is dependent on BABIP. The factors that go into BABIP, according to an article by Peter Bendix and Chris Dutton, boil down to pitch recognition, speed, the ability to make solid contact, and the ability to spread the ball to all fields. Pujols hits a lot of line drives (20% career), and has incredible power (22.7% HR/FB, 84 XBH/year). He rarely swings, but when he does swing, he makes contact 90% of the time, which is above average and exceptional for someone who swings so hard. However, Pujols doesn’t spray the ball particularly well and isn’t too fast down the line. (He’s not slow, though. Fans gave him 46 out of 100 on speed, he’s an average to good baserunner, and he has a great glove.) Overall, xBABIP says that Pujols has gotten very lucky with BABIP lately, but nevertheless, Pujols' best shot at any of the categories is in batting average, where he and Jones are almost in a class by themselves.
Other batting average contenders: David Wright and Hanley Ramirez project to hit better than .300 almost across the board. Their problem is that they strike out too much, having both eclipsed the century mark last year. Garrett Atkins. Milton Bradley. Matt Kemp, if his .376 career BABIP is sustainable. Chase Utley. Jose Reyes. Brian McCann. Manny Ramirez has a hitter's haven in Los Angeles. Pablo Sandoval is my sleeper.
Home Runs
Ryan Howard is going to be Pujols’ biggest challenger in home runs and runs batted in. Howard, unfortunately, simply is more one dimensional than Pujols. There are no average specialists like Ichiro is in the AL, but Howard is the National League specialist in hitting the ball a long ways. A third of his fly balls clear the fence. Howard has hit 48, 47, and 58 long-balls over the last three years. Not a single projection system has Pujols hitting greater than 41 homers. Meanwhile, not a single projection system has Howard hitting fewer than 40. But there is hope.
Looking at their skillsets, Pujols may actually be the better homerun hitter, but is simply in worse circumstances. If we can establish that he has a higher talent level when it comes to homers, I say we can at least give him a legitimate shot to take the category.
Howard’s home park is hugely beneficial to his power output. Statcorner’s park factors show a crazy 116 HR/FB park factor for Philly and an equally ridiculous 87 HR/FB for St. Louis. (That’s Petco level. I had no idea.) Greg Rybarczyk used his Hit Tracker system to come up with a new method for calculating home run park factors. Howard is 15% more likely to hit homers in Citizen Bank Park to any field except for straight away center, where Pujols would have an edge.
Howard’s average homer traveled 400 feet last year and the speed off bat was 104 MPH. But Pujols demonstrated more raw power, as he hit his average homer went 406 feet and 106 MPH off the bat. Furthermore, Howard's power figures seem to be declining, as his distance and speed figures are trending downward. Pujols shows more consistent power, averaging distance and speed off bat figures of 406, 412, 407, and 106, 109, and 110 in past years.
Here's the placement of their home runs from last year. Pujols' home runs and Busch's outfield walls are in red, Howard's home runs and Citizen Bank's outfield walls are in blue.
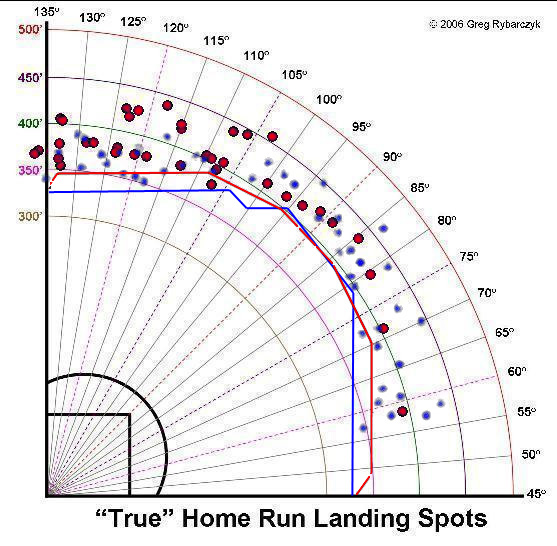
See that 20 foot discrepancy between Busch's left field wall and Citizen Bank Park's? It looks like Howard got three or four extra homers in that area, and there's little doubt in my mind that Pujols hit some fly balls out there that went for mere doubles.
Other home run contenders: Adam Dunn won the "golden sledgehammer" with an average of 419 feet and 109 MPH. Fortunately for Pujols, he's now playing in Nationals Park. Four straight seasons of exactly forty homers will likely come to an end. Ryan Braun and Prince Fielder are The Brewers Young Duo That Needs A Nickname. They're 24-25 years old and Fielder's already logged a 50 home run season while Braun's getting there. Joey Votto. Lance Berkman. Adrian Gonzalez was just profiled by Marc Normandin on Baseball Prospectus using Hit Tracker data, and it's crazy to think what he'd be hitting if he were still in Texas. Manny Ramirez. Alfonso Soriano. Chris Young is my sleeper, and who knows what Justin Upton is capable of?
Runs Batted In
Ryan Howard is out in front of the RBI race, but we all know how team-dependent those are. Last year, Chase Utley made up 32 of Howard's 146 RBI, but if Utley is dinged up, his decline, coinciding with Howard’s decline, would severely impact Howard's RBI potential. PECOTA, in fact, shows Pujols driving in more runs than Howard.
Last year, Pujols batted 3rd behind Aaron Miles and Skip Schumaker, who did well getting on base in front of him. Schumaker should bat leadoff this year, which is a plus, since he's OBPed around .360 the last couple of years and upped that to .370 last year when he was the leadoff man. Hopefully Ryan Ludwick bats second, which would give the Cardinals' top two batters higher OBPs than the Phillies top two of Jimmy Rollins and Shane Victorino. Pujols batted third most of last year, but it looks like Tony La Russa will switch Pujols to cleanup and insert Ryan Ankiel into the three hole. The trio of Schumaker, Ludwick, and Ankiel ought to set the table nicely for Pujols, at least better than did Miles, Schumaker, and Cesar Izturis, who La Russa batted ninth most of last season season in place of the pitcher.
Of note, Howard had fewer extra base hits than Pujols, despite all the homers. The lack of doubles is a large part of the reason why Howard is overrated. Howard had 146 RBI to Pujols’ 116. They both earned just over half their RBI on homers, but Howard was able to earn twice as many RBI on singles, while hitting thirty fewer singles. This suggests Howard had men in scoring position more often than Pujols did. Indeed, Howard had 50 more plate appearances with runners in scoring position. Perhaps that evens out this year.
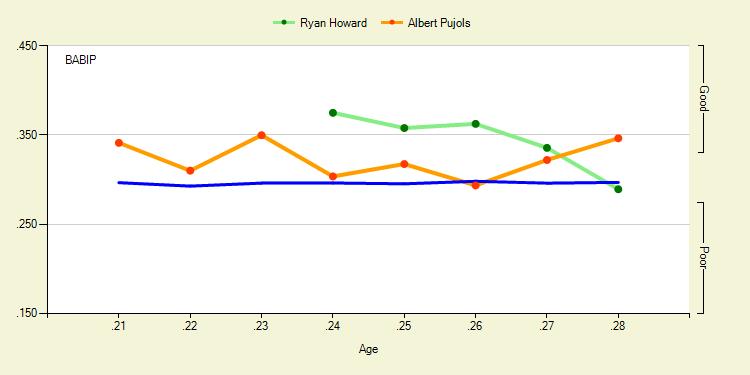
Pujols has been getting intentionally walked more and more, and last year was given a free pass twice as often as Howard. That doesn't bode well for Pujols, considering all those walks come during RBI chances. Furthermore, Howard’s BABIP with RISP was .383 compared to an overall .285 BABIP. This is likely explained by the infield shift, as Rich Lederer noted last year. On the other hand, Pujols faced terrible luck in RBI situations, suffering a BABIP with RISP 50 points below his season total. Check out this graph from fangraphs, and first off notice the age. Ryan Howard is older than Albert Pujols! Again, I had no idea.
If Howard can't collect hits within the field of play, and continues his strikeout percentage trend, he'll simply be relying on his homers for RBI. I've already shown that that faucet of production might run drier for Howard than it has in previous years. Howard has a strikeout percentage three times that of Pujols, and when they swing, Howard swings and misses three times more often too. Howard's skills are in decline. I’m going to say there’s a chance for Pujols to out ribeye Howard.
Other RBI contenders: David Wright, Carlos Beltran, and Carlos Delgado. The top of the Mets' lineup is really dangerous. Lance Berkman. Manny Ramirez. Joey Votto. Aramis Ramirez. Braun and Fielder. Garrett Atkins. Andre Ethier is my sleeper. The top of the Dodgers lineup is awesome too, and Ethier slugged .510 last year. If Adrian Gonzalez were to get traded, he could compete, but the Padres aren't scoring many runs this year.
In my opinion, Pujols is the best hitter for average, best hitter for power, and best hitter at driving in runs in the National League. The problem is that the pieces around him have yet to fall perfectly into place. His park, his lineup, and other Triple Crown category contenders have not been kind to him. I won’t predict that Pujols wins the Triple Crown, if only for the fact that no matter how overwhelming a favorite is in any category, the field is generally a better play thanks to random variance. But if Pujols does pull it off, don't tell me I didn't warn you.
| F/X Visualizations | March 30, 2009 |
Deconstructing the Non-Fastball Run Maps
In this post I continue, and finish, my series deconstructing the pitch specific run value maps that I first presented here. In the first entry I broke down the different events that contributed to the run value maps for fastballs, here I will do the same for the remaining three pitches I looked at: curveballs, changups and sliders.
Recall, from the fastball post, the methodology I use:
The run value of a pitch is determined by the outcome of four events.
- If the batter swings at the pitch or not.
- If no to 1, whether the taken pitch is called a ball or a strike.
- If yes to 1, whether the batter makes contact.
- If yes to 3, the run value of that contact.
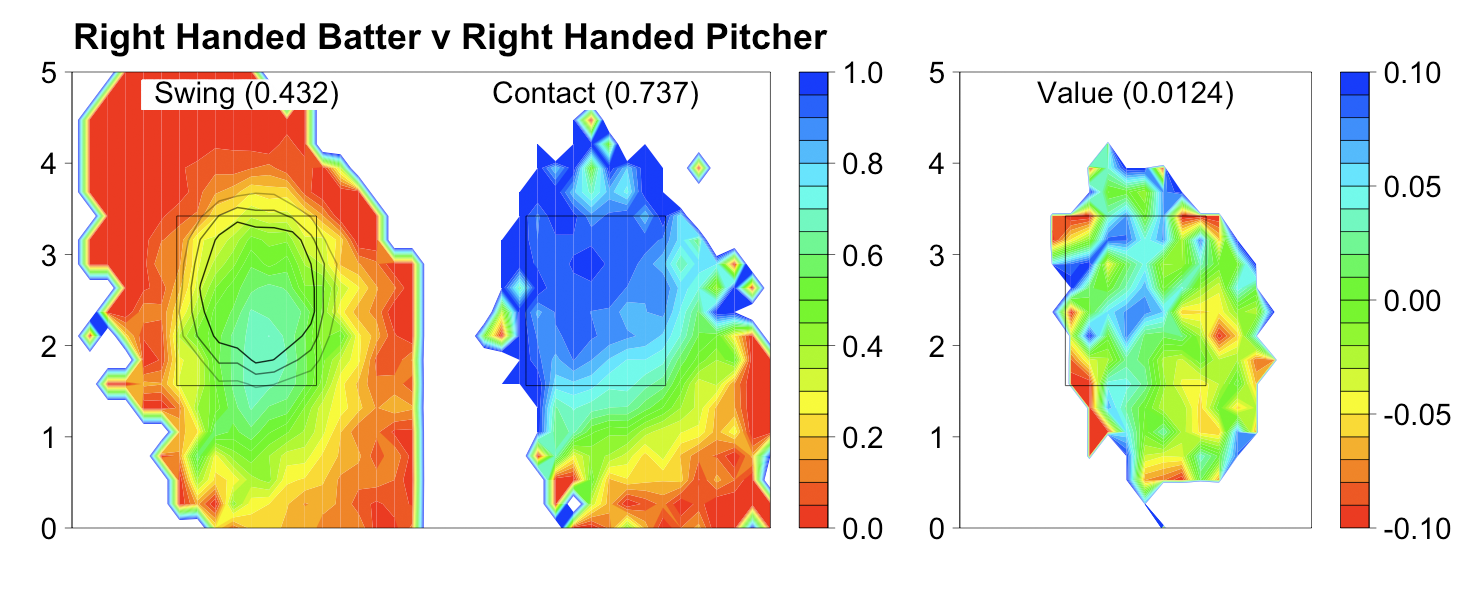
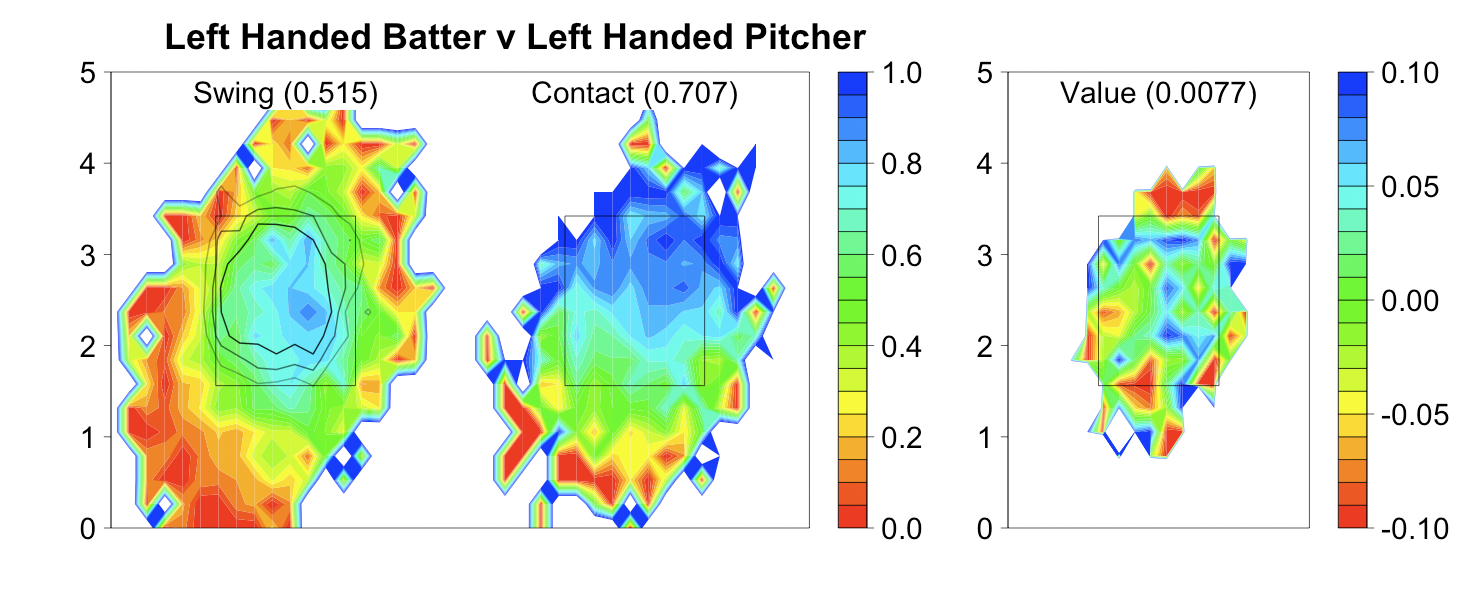
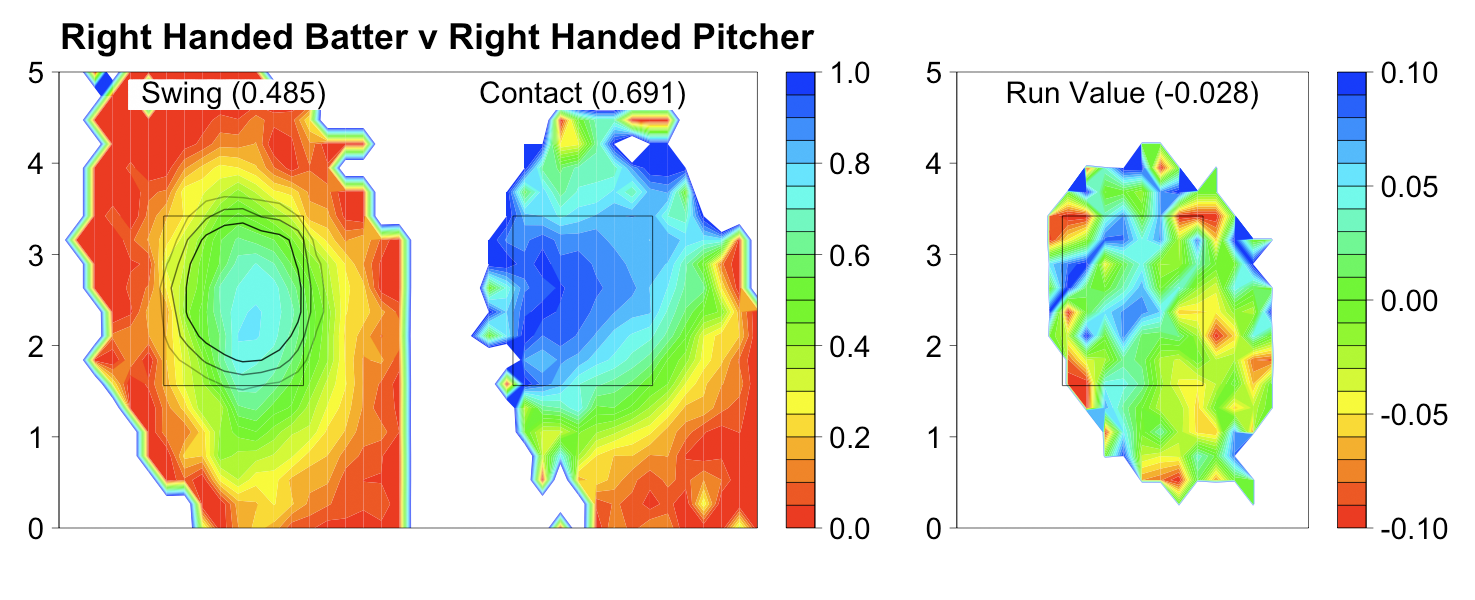
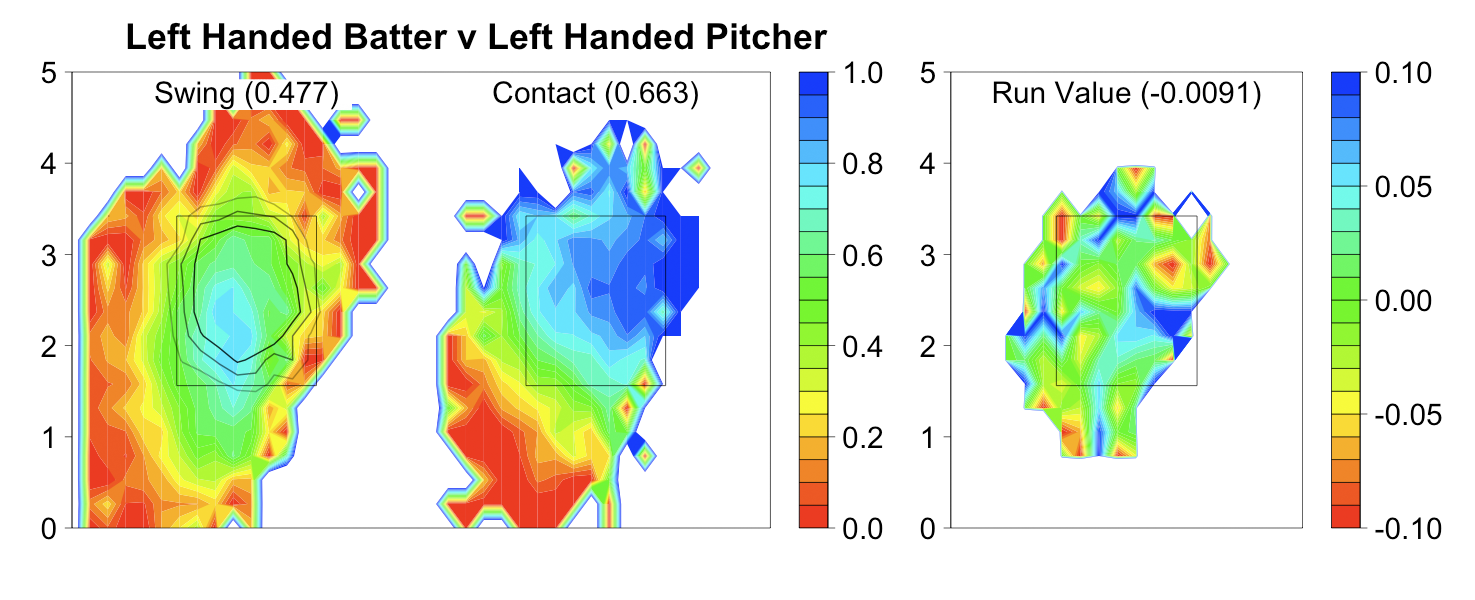
Below I present a series of three images for each handedness combination that show how the outcomes of these four events vary by location for fastballs. Reading left to right:
At the top of each image is the average value over all locations.
- The first image addresses events 1 and 2. The heat map is the swing percentage by location to address 1. On top of that are three contour lines where 75%, 50% and 25% of taken pitches were called strikes to address 2. So if a batter took a pitch inside the smallest circle it was called a strike over 75% of the time. If he took a pitch in doughnut between the smallest and middle circles it was called a strike between 75% and 50% of the time, and so on.
- The second image addresses 3 showing the contact percentage of pitches swung at.
- The final image addresses 4 showing the run value of a contacted pitch (including foul balls).
Since there are fewer curveballs, changeups and sliders than fastballs I smoothed and regressed the data more to make the images below. Thus they are not as finely resolved as the fastball images, but, I think, still convey the patterns well.
For each pitch I first present the original run value map. Recall the number at the top of each image is the percentage of time that pitch type is thrown in those at-bats.

Curveballs are thrown roughly equally in the different handedness combinations and have a large area of negative to zero run valued pitches below the strike zone.
Batters swing less at curveballs than fastballs, and the swing map is much less coincident with the strike zone for curveballs than fastballs. So batters are taking more curveballs for strikes and swinging at more curveballs out of the zone compared to fastballs. In addition, batters whiff more against curveballs than fastballs. But when they do make contact the run value is positive compared to negative run-valued contact versus fastballs.
Batters tend to swing more at curveballs down and slightly away, but make contact at a higher rate and better contact at curveballs up and in. Most likely this is a result of the down and away break of curveballs. Pitches that do break (or break a lot) end up down and away, and batters miss them or make poor contact. Pitches that don't break (or not enough) end up up and in, and batters rarely miss and make good contact.
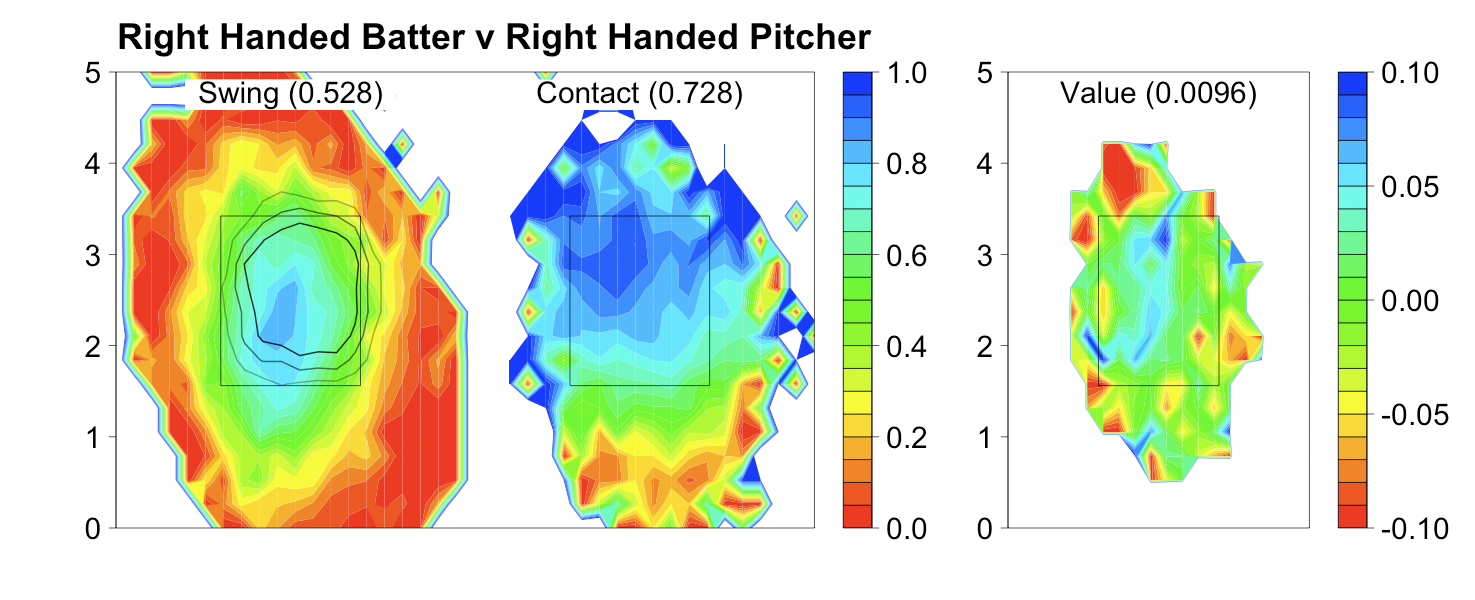
Another interesting aspect of these images is how the strike zone is called for curveballs. The top, bottom and away edges are called in the same manner as fastballs are to RHBs, but the inside edge seems different. Recall that fastballs were called correctly along the inside edge, but curveballs are called considerable away (the 25% strike contour is inside the rule book edge). So umpires are calling inside fastballs strikes against RHBs, but not inside curveballs. I am not sure if this is a statistically significant difference, but I will look at that in a future post.
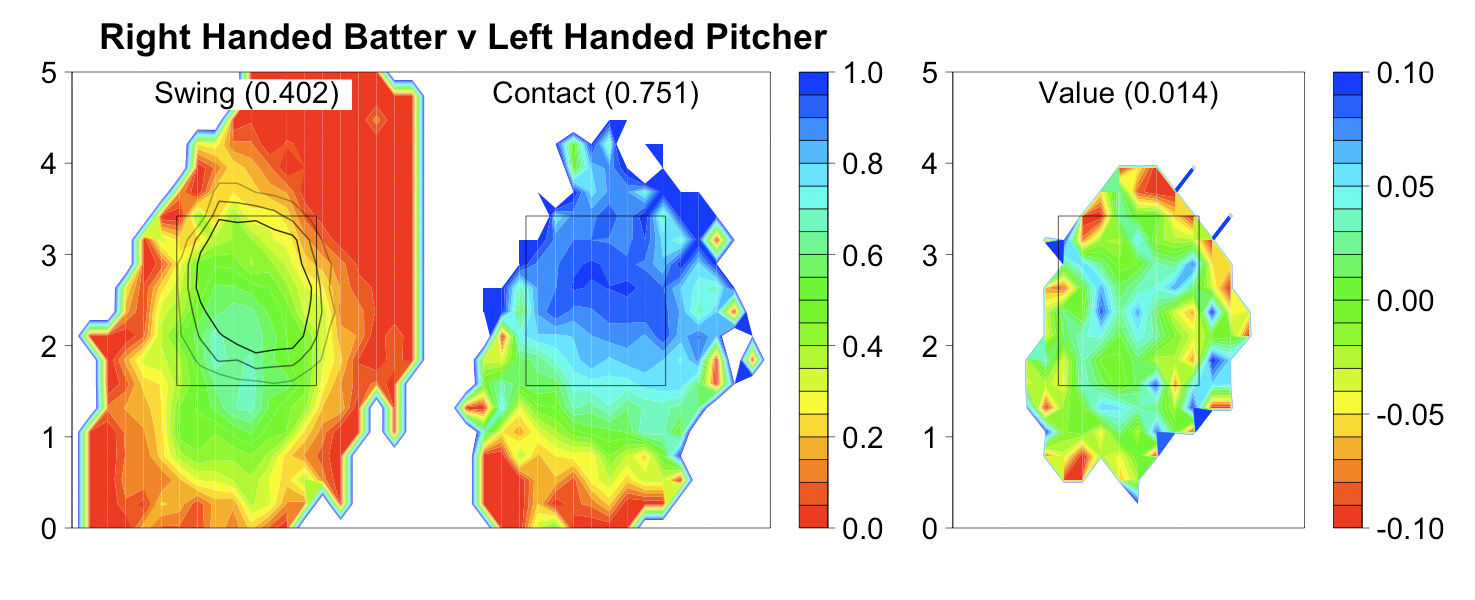
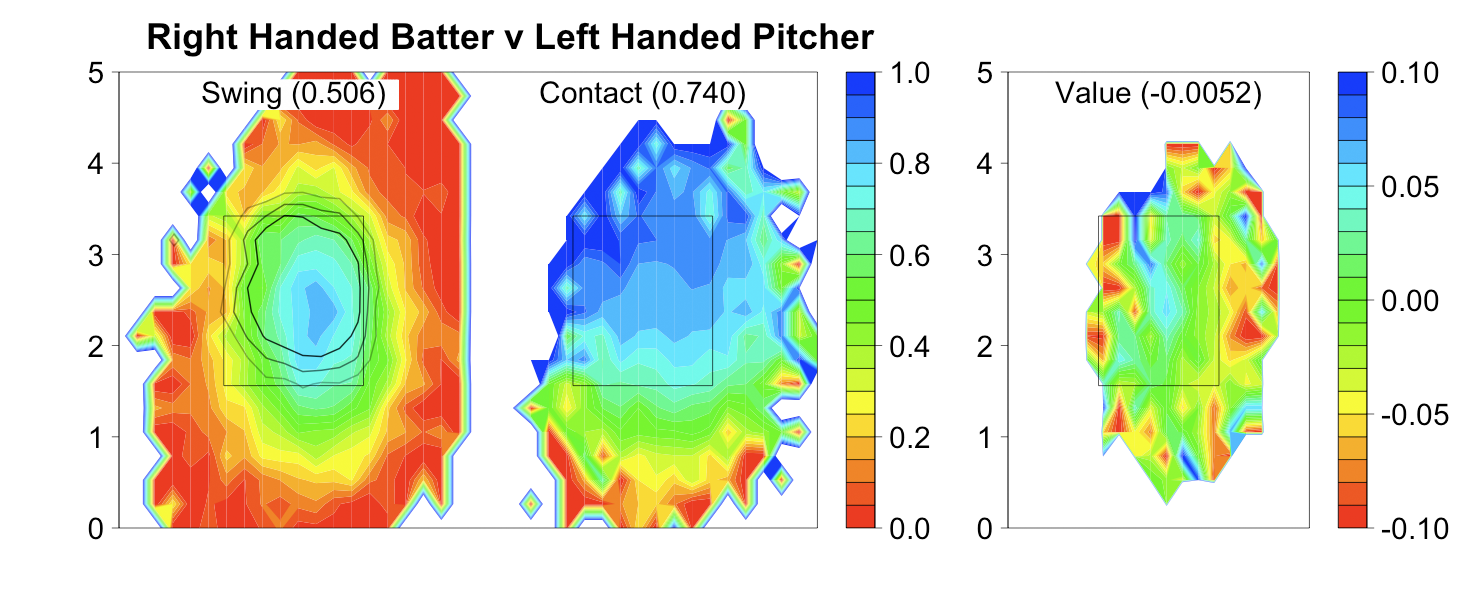
As expected RHBs make more and better contact against curveballs from LHPs than curveballs from RHPs. The orientation of the contact percentage gradient has shifted and is now high up and away to low down and in. This is a result of LHPs' curveballs breaking in to RHBs.
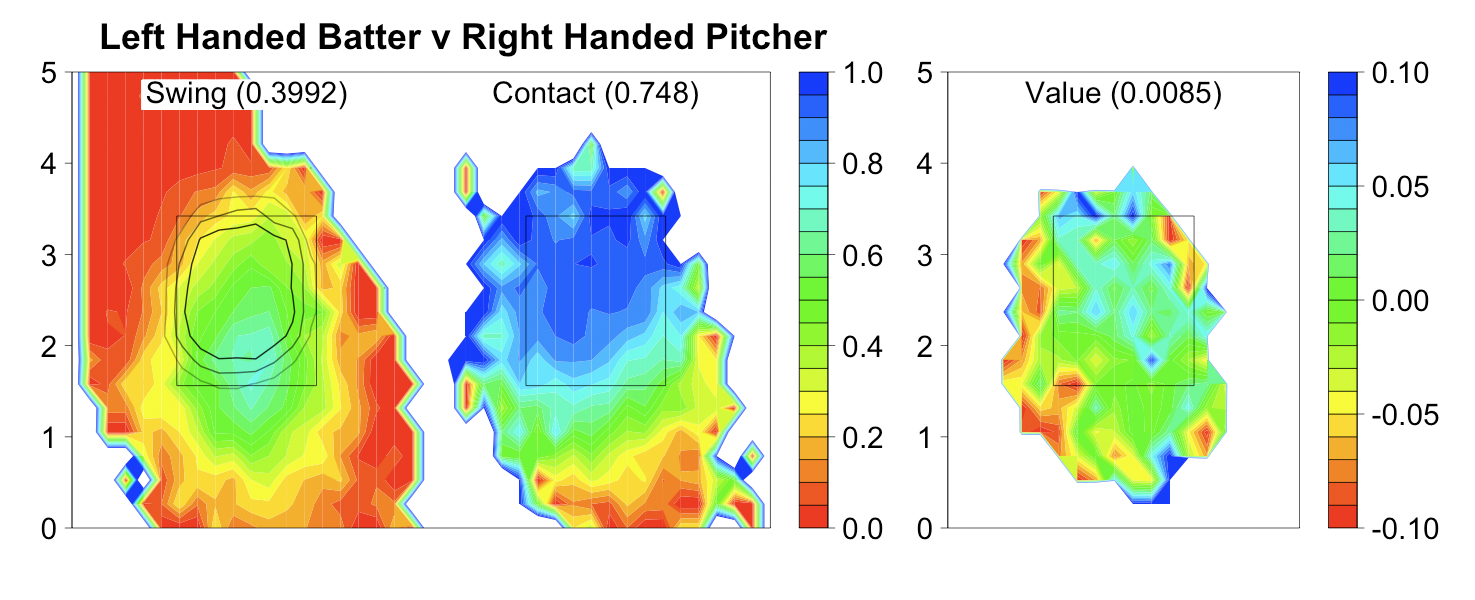
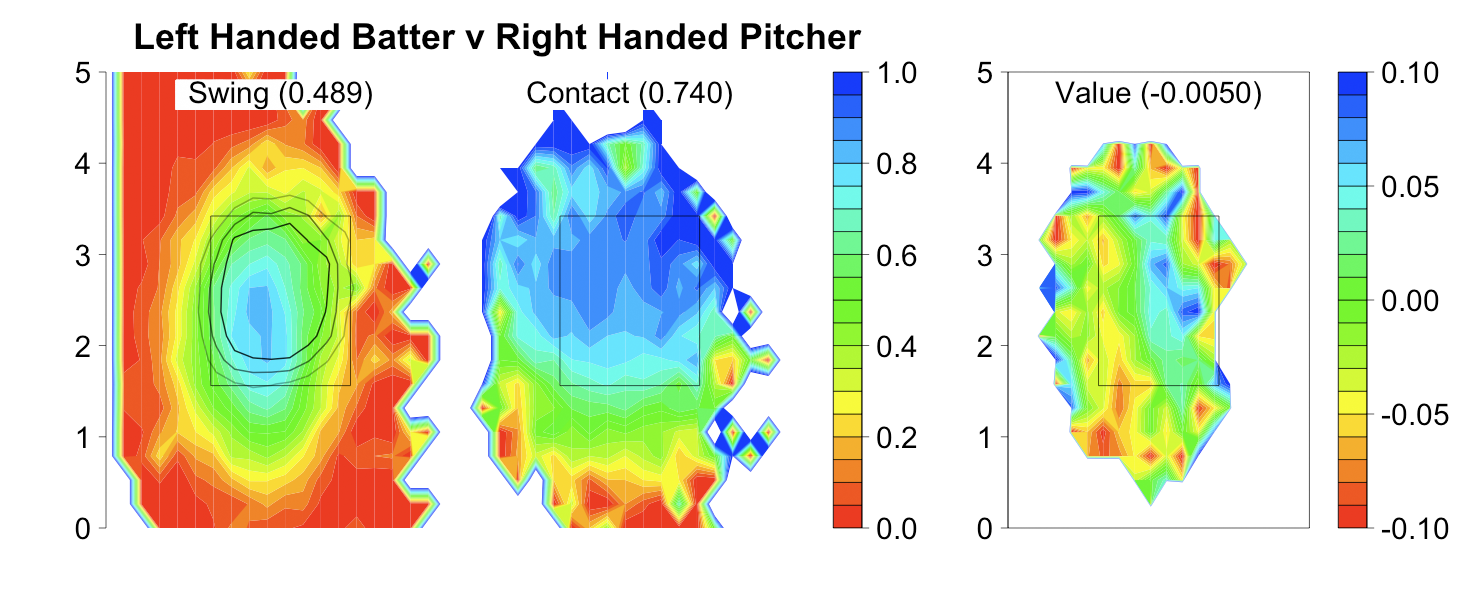
The swing percentage and contact rates are similar to RHBvLHP, but the run value of contacted pitch is, strangely, much lower. The orientation of the contact percentage gradient is the same as the one we saw in RHBvRHP.
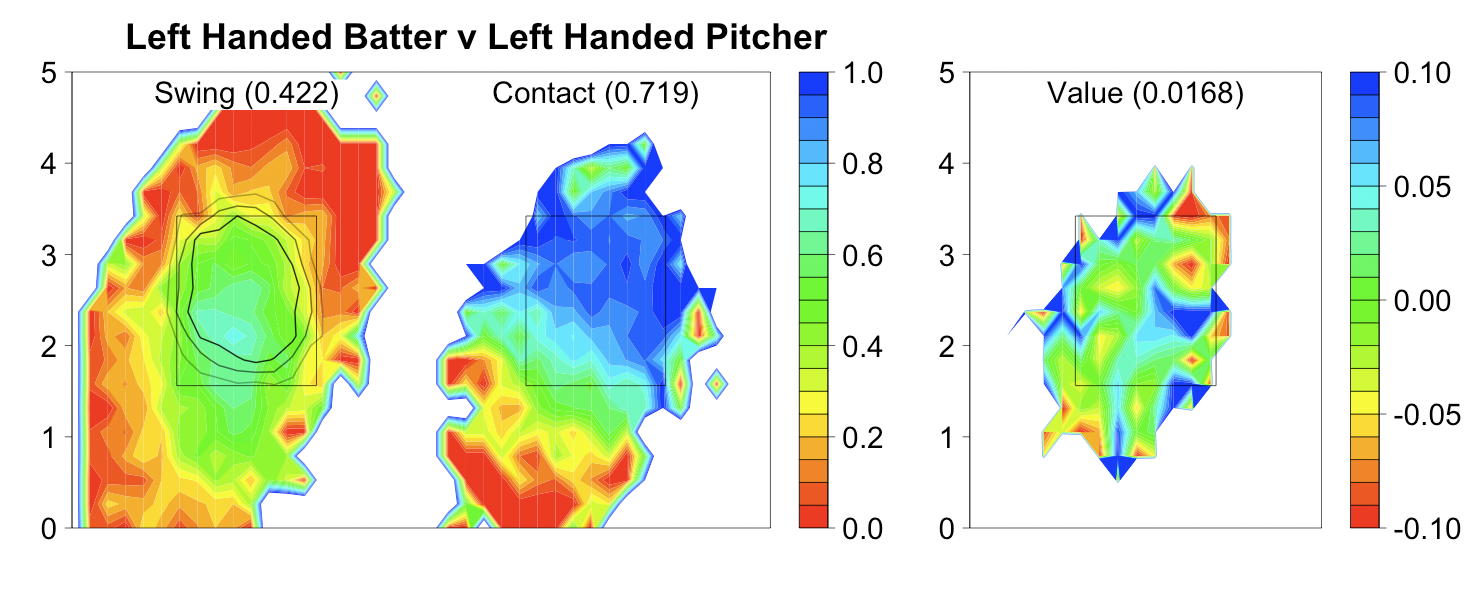
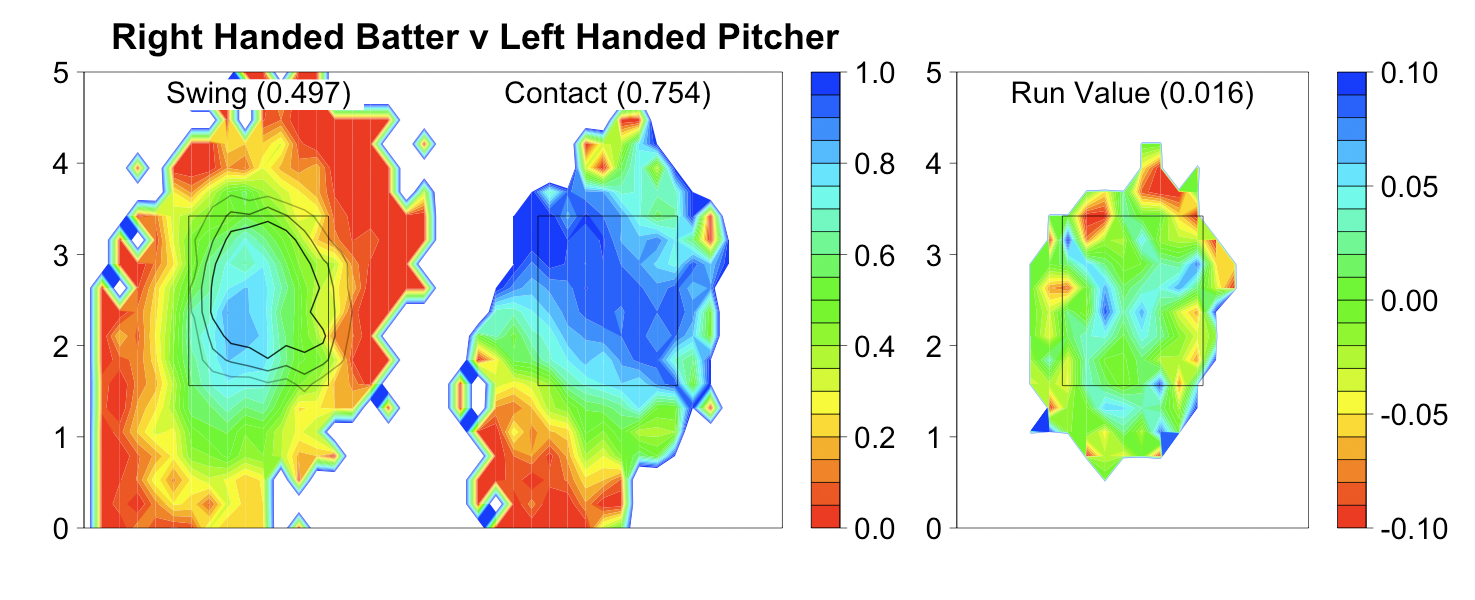
Like for fastballs lefties facing lefties have the lowest contact rate by a large margin. But surprisingly the run value of contacted pitches is highest here, which was not the case for fastballs.
The orientation of the contact percentage gradient here looks like that seen in RHBvLHP not like the one seen in LHBvRHP. With fastballs the contact percentage and run value location patterns were determine by the hitters (RHBvRHP was more similar to RHBvLHP than to LHBvRHP) but with curveballs it is the pitchers handedness that determines the pattern (RHBvRHP is more similar to LHBvRHP than to RHBvLHP). It seems that the break of the pitch (determined by the handedness of the pitcher) is more important in determining these patterns than the inside/outside preference of the batter, which drove the fastball patterns.
Now we turn our attention to changeups. Here are the overall run value maps.

Changeups are thrown mostly in at-bats when the pitcher and batter have opposite handedness. So I will only present and comment on those images. But you can see the rightie/rightie one here and leftie/leftie one here.
Batters swing at changeups more than either fastballs or curveballs, and the swing percentage map is more coincident with the strike zone contours for changeups than for fastballs and curveballs. Meaning batters take fewer changeups for strikes and swing at fewer changeups out of the zone than for the previous pitch types. The highest swing percentage is slightly away and down, rather than up and in for fastballs.
Although batters swing at a lot of changeups and swing at the right pitches (in terms of the strike zone), they whiff on changeups at a relatively high rate. The highest contact rate and run value of contact are both up and in. Contacted pitches have a very slightly negative run value.
The strike zone to RHBs is called away on both the inside and outside edges and high on both the bottom and top edges. To lefties it is called away just on the outside edge and high just on the bottom edge. Again I am not sure these are statistically significant differences.
Finally, looking at sliders, here are the overall run value maps.

Sliders are thrown mostly in at-bats when the pitcher and batter have same handedness. So I will only present and comment on those images. But you can see the other ones here and here.
In same handed at-bats sliders are just nasty pitches. Batters swing at sliders slightly more often than fastballs (less than changeups and more than curves). But they are swinging at the wrong pitches, as the swing percentage map is considerably off from the strike zone (almost as bad as with curveballs). The whiff rate on sliders is enormous, considerably higher than any other pitch type. There is only a small part of the zone middle-in with a contact rate of over 85%. And then, even when batters make contact, the result has a negative run value.
.
Wrapping Up
We are now in a position to make some broad statements about what make the different pitch types successful.- Fastballs: With the exception of those directly above the strike zone, batters tend to swing at fastballs in the zone and take those out. They also whiff on fastballs at the lowest rate of any pitch. But contacted fastballs have very negative run values, the lowest of all pitches.
- Curveballs: Batters routinely take curveballs in the strike zone and swing at a high rate at curveballs below the strike zone. They whiff at a moderate rate. But when they make contact the run value is positive and higher than for all other pitches.
- Changeups: Batters tend to swing at changeups in the zone and take those out of the zone. But batters whiff against changeups at a moderate rate and contacted changeups have slightly negative run values.
- Sliders seem to have the best aspects of each pitch: the swing rate map is only slightly more coincident with the strike zone than that for curveballs, the whiff rate is higher than any other pitch, and contacted sliders have a negative run value (although not as low as contacted fastballs).
Below I present the overall run value per pitch separated by pitch type in a chart and figure. In the figure I indicate the standard errors.
 Run value per pitch
+------------+------------+------------+------------+------------+
| B/P hand   |  Fastballs | Curveballs |  Changeups |    Sliders |
+------------+------------+------------+------------+------------+
| RHB/RHP    |    -0.0032 |    -0.0009 |     0.0014 |    -0.0057 |
| RHB/LHP    |     0.0030 |     0.0031 |     0.0011 |     0.0056 |
| LHB/RHP    |     0.0034 |    -0.0008 |     0.0012 |     0.0013 |
| LHB/LHP    |    -0.0035 |     0.0005 |     0.0003 |    -0.0092 |
+------------+------------+------------+------------+------------+
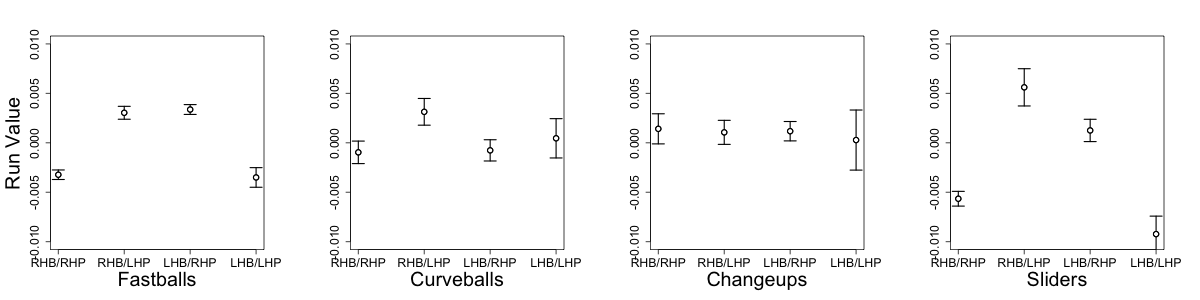
Fastballs and sliders show a statistically significant platoon split: there is a significantly lower run value outcome when the pitcher and batter have same handedness than when they have different. This makes sense with usage patterns for sliders, which are pitched more in at-bats when the batter and pitcher have the same handedness. You can also see here just how nasty sliders are to same handed batters, significantly lower than any other pitch.
Curveballs are interesting, there is no significant platoon split and there is a trend (although not significant) for curveballs from LHPs to have higher run value outcomes than curveballs from RHPs. This is strange as lefties throw curveballs more often than righties.
Changeups show no statistically significant platoon split. Which, again, is in line with what we expect based on their usage pattern. They are mostly thrown in opposite handed at-bats when fastballs or sliders would have a relatively higher run value.
This analysis has some serious limitations. I am using the MLB pitch classifications, which are far from perfect. There has been some work on developing better classification algorithms and I hope to incorporate one such algorithm in my future analysis. The pitches in this analysis are averaged over all pitch speeds and breaks, which is a major limitation. Just recently Dan Turkenkopf looked at how pitch speed impacted at-bat outcomes, and it would be interesting to see how pitch speed affects at-bat outcomes for each pitch type separately. Finally I average over all pitch counts. My next post will begin to address this last concern.
| Behind the Scoreboard | March 28, 2009 |
Championship Leverage Index: How Meaningful Is This Game?
Opening day is right around the corner and soon your favorite team will be taking the diamond for its very first game. Hope springs eternal and the beauty of opening day is that every team starts at 0-0. As the season wears on, the games either become more or less meaningful depending on the standings. As a Cubs fan growing up in the 80's and 90's, I remember many a year when opening day was the most meaningful game of the year, with the rest of the season a slow march into irrelevance. In a lucky few years, the games took on more importance as the year progressed as the Cubs fought for contention. It's easy to tell which games are big and which games are meaningless, but this article attempts to put a quantitative number on the relative meaning of each game of the season.
Tom Tango's Leverage Index is a great tool for measuring the impact of a particular in-game situation. A Leverage Index of greater than 1.0 indicates the at-bat is more meaningful than an average play, and an LI of less than 1.0 indicates the at-bat is less meaningful, with LI's ranging from nearly 0 up to more than 5.
Taking this to the next level, we can create the same type of metric, except instead of producing it at a game level, we can produce it at a season level, with a value of 1.0 indicating an average regular season game's impact on a team's chances of winning the World Series. LI's larger than 1.0 will indicate the game has additional meaning, and LI's less than 1.0 indicate the game is less meaningful than an average regular season game. Dave Studeman touched on this subject at Hardball Times, but his index and mine, which I'll call "Championship Leverage Index" give quite different results.
Each team's Champ LI for a particular game is calculated by first getting the current probability of winning the World Series. Then we calculate this probability again, this time assuming that the team wins the game. The difference between the two is then found and this difference is the potential impact of the game. Tango's regular Leverage Index has to deal with multiple potential events, and thus has to calculate the standard deviation of the impact of winning depending on several outcomes, however in this case, because there are only two potential events in a game (win or loss), taking the difference in probability between the pre-game and post-game is sufficient.
For instance, in 2008, after 81 games, the Cubs probability of winning the World Series was 10.22% (81.8% to make the playoffs). A win in the 82nd game would up the probability of winning to 10.54% (84.3% to make the playoffs). This difference of 0.32% is the basis of the calculation of Champ LI. The difference is then indexed to the increase championship win probability of an average regular season game.
This average game, is also, not coincidentally, the same as opening day. Because nobody knows what the rest of the season will hold, the opening day game is, by definition, the average regular season game - depending on what happens sometimes it will be much less meaningful than other games, and sometimes much more. This increase in championship probability due to winning this average game is 0.28% (the increase in probability of making the playoffs is 2.25%). Using the example from above, 0.32/0.28 gives a Champ LI of 1.14, meaning the 82nd game (played with a 49-32 record and a four game lead over the Cardinals) was slightly more meaningful to the Cubs championship hopes than the average regular season game.
As you can imagine, the work that goes into this requires a lot of simulation. With simulations come assumptions, and here I assumed that all teams were of equal strength. This assumption is certainly not true, but it's acceptable because actual team strength is largely unknown, especially early in the season, and there is a nice symmetry to placing teams on equal footing. This is analogous to Tango's leverage index assuming opposing teams are of equal strength within an individual game. My current simulation also does not take into account the schedule of the teams, though that would be possible, changing the results very slightly.
Below are a few graphs to illustrate the Championship Leverage Index. First, are simply three graphs of each NL team's chance of making the playoffs in 2008 (to get the probability of winning the World Series, simply divide by 8).
Now let's look at the same graphs for each team's Champ LI. How much do the standings affect the importance of each game? As I mentioned before, each of the teams start opening day with an LI of 1.0.
To illustrate the Championship Leverage Index, let's focus in on the NL Central, which has a variety of teams that illustrate various scenarios nicely.
There are several interesting things to point out. As you'd expect, right off the bat, the teams that start poorly see their Champ LI decrease, while teams that do well see their games grow in importance. By late season, those teams that were out of the race, Pittsburgh and Cincinnati, had a Champ LI of essentially zero.
Similarly, the Champ LI also decreases dramatically when a team becomes too far ahead. After the Cubs 100th game, with a 1 game division lead and a two-game lead in the wild card, the Cubs games had a Champ LI of 1.70. But after they went on a tear and built up a 5 game lead three weeks later, their games' importance dropped dramatically, with the Cubs' Champ LI reduced to only 0.50. Because the playoffs seemed so likely, their games took on less importance. A few weeks later, coasting with a large lead, their Champ LI was reduced to essentially zero because the playoffs were assured.
We also see that the Champ LI of teams who remain in contention (but not too far ahead), grows as the season goes on. Furthermore, as long as a team is in contention, the game's meaning doesn't change much whether the team's prospects for the playoffs are on the high side or the low side. By the 125th game, the Cardinals and Brewers were both in contention, but had vastly different probabilities for the postseason (Brewers at 65% and the Cardinals at about 30%), however their Champ LI was about the same at around 2.0.
Another finding is, not surprisingly, all things being equal, late season games mean more. Eleven games into the season the Astros were struggling at 3-8, their playoff probability had dropped to 11%, and their Champ LI was down to 0.65, far less than an average game. However, fast forward to game #147 and the Astros, three games out of the wild card, had a playoff probability that was also about 11%. However, now the Champ LI was at 1.67, far more than an average game and certainly far more than their mid-April games when they had the same probability of making the playoffs. All things being equal, September games mean more than April games.
Furthermore, as the season draws to a close, if a team is still fighting for a playoff spot, their Champ LI grows exponentially. The Brewers' Champ LI was so high by the last games of the season (when they were fighting for a wild card spot with the Mets and Phillies), that their Champ LI is off the chart. By the last game of the season, which they went into tied with New York, their Champ LI was 11.1, meaning that the final game was 11 times more important than the average game (this is the maximum Champ LI for a regular season game, unless Milwaukee and New York had been playing each other, in which case the Champ LI would have doubled to 22.2).
Of course, the Champ LI applies in the postseason as well. You can see from the following chart below, the Championship Leverage Index of each possible postseason game, depending on the status of the series.
As you can see, every postseason game takes on vastly more importance than an average regular season game. The maximum Champ LI is of course, the 7th game of the World Series, with the game taking on 178 times as much meaning as an average regular season game.
Like Tango's individual game Leverage Index, the Championship Leverage Index doesn't exactly tell you anything new, but just quantifies a game's importance into a useful number. It can be useful in analyzing players' performance in "big games" as well as looking at things like attendance or TV ratings. It's also fun just to realize in quantitative terms exactly how much each game matters.
Another handy feature is that to figure out the importance of an individual at-bat within an individual game, you can simply multiply Tango's Leverage Index with the Championship Leverage Index. For instance, can you name the most important at-bat of the season last year?
It was Game 7 of the ALCS (Champ LI of 88.9) when JD Drew came to bat with the bases loaded, two outs, in the bottom of the 8th inning of a 3-1 game (game Leverage Index of 5.19). The total Championship Leverage Index of the at-bat is 461.4 (5.19 x 88.9), meaning that the at-bat was 461.4 times more important than an average regular season at-bat.
As Sox fans recall, Drew struck out, ending the inning. In one at-bat as big as some players entire seasons, he blew it. So what proportion of a championship did Drew lose by striking out? For that you'll have to wait until next week, when I introduce Championship Leverage Index's sister stat, Championship Win Probability Added.
| Change-Up | March 27, 2009 |
If You Read Just One Jon Heyman Column, Make it This One
I am going to take a stab, FJM style, at tackling what really is the quintessential Jon Heyman piece. It combines two elements that are featured in so much of his work; his disdain for (some) numbers and his continued, shameless PR work for Scott Boras Corp.
You might recall his commentary from the MLB Network studios the day the Hall of Fame results were announced. From Rich Lederer's January 13 piece.
"I never thought [Bert Blyleven] was a Hall of Famer when he was playing, and I saw him play his entire career.""[His popularity] is based on a lot of younger people on the Internet who never saw him play."
"It's not about stats...it's about impact."
You might also recall Rich's trip through the Heyman/SBC archives.
While Boras is no fool, Heyman is a tool for the Scott Boras Corporation. Boras knows how to game the system to get the best deals for his clients and will gladly use Heyman as long as the latter plays along or until the market realizes what is going on. As it stands now, it's almost as if Heyman, who is no stranger to the Boras suites during the winter meetings, is on the SBC payroll.
Anyway, Heyman is back today with a scatterbrained defense of Curt Schilling's Hall case, as well as more gratuitous Manny Ramirez praise.
Let's have a look (Heyman's writing in bold).
---------
Curt Schilling has to be in the Hall of Fame.
No, he doesn’t. If you think he belongs in the Hall of Fame, then that’s a different matter. Just make your case.
I write that without any hesitation, reservation or research. I don't need to look at his stats. I know what he's done.
Oh, never mind. You’re not interested in making the case. Because if you were, you would need to look at his stats. It would allow you to assess how he performed throughout his career.
The Hall of Fame should be about impact, not statistics. Numbers are nice, but they don't necessarily make the player.
"Impact, not statistics." And how exactly do you suggest we measure “impact”?
For instance, in 2001, Curt Schilling threw over 256 innings, struck out 293 batters, walked just 39 and had a 2.98 ERA. He threw another 48 innings in the post-season, giving up six earned runs, striking out 56 and walking six.
Some might say that those statistics offer a good indication of Schilling’s “impact” for that season.
Some Hall of Fame cases are being built on a pile of numbers now, and I can see how in rare cases a player's career can be re-evaluated by dissecting the latest data.
Ooooh. A not-so thinly veiled reference aimed at Rich over his Blyleven case. Well played, Heyman. Here’s Rich “dissecting the latest data" as it relates to Blyleven:
5th all time in strikeouts, 8th all time in shutouts, 19th in wins.
Pretty cutting edge stuff.
But in general, I think that's a funny way to get into Cooperstown. Conversely, Schilling is maybe the perfect example of a pitcher who had great impact but whose career regular-year numbers are merely excellent but not among the all-time best.
Yes, evaluating a player’s performance sure is a peculiar thing.
The Hall of Fame should be for players who did great things, staged big moments and affected things the way Schilling did.
Stats measure all of these things.
Like him or hate (and I can't say I fall into the former category there, as I consider him a cyber and in-person annoyance), Schilling had a tremendous impact on most games he pitched, and on the game itself. He was a star who pitched his team into four World Series, and to three titles. In 2001 and 2004 in particular, it was his pitching that made the difference.
1) It’s not in any way relevant to Schilling’s Hall case how you feel about him, Jon. No need for the caveats.
2) Most pitchers impact games they pitch. Mark Hendrickson impacts games he pitches. Stats help to measure what kind of impact.
I ran into Schilling's former Phillies teammate Dave Hollins the day Schilling announced his retirement, and after one of us joked about whether Schilling would follow through on his announcement or stage some dramatic comeback, Hollins offered the long-held view of Schilling, but in a nicer way. "You love to have him on your side every fifth day,'' Hollins said.
Former Phillies GM Ed Wade expressed a variation of that statement (only said much harsher) many years ago. It went something along the lines of, "He was a horse once every five days and a horse's ass the other four days.''
More character references. Terrific.
Although I never spent four consecutive days with Schilling, I don't doubt that. He always came off as a guy who thought he was an expert in everything simply because he had more pitching talent than just about anyone else. He still blows hard on his 38Pitches, a Web site I religiously avoid.
I don't particularly like Curt Schilling. I generally don't agree with his politics, I do think he is something of a grand-stander and I think he is perpetually conscious of his image in a way that puts me off. But he's a thoughtful guy, and I appreciate that a Big League player takes the time to write as much as does and directly engage fans of the game. Heyman thinks he's a blowhard because he is bypassing him and talking directly to us. He is threatened.
But anyway, here’s something I encourage everyone to do. Go read some of 38Pitches. Then read some of Heyman’s work. You can then judge for yourself who’s the blowhard.
Anyway, Schilling still gets credit for that fifth day, not demerits for the other four. Schilling was often great on that fifth day, and he was almost always great when it mattered most.
It takes a big man to look past those four days he never once had to spend with Schilling and evaluate him on his pitching. Or his impact. Or his moments...or however it is Jon Heyman evaluates baseball players.
There are people who believe that he played the famed "bloody sock'' game for all it was worth, that he purposely made it look good, or at least did nothing to stem the flow of blood. I wouldn't put much past Schilling, but I am convinced that he was hurt, and that he was bleeding, and that he should get credit for pitching heroically that day, for beating the Yankees and the jinx, and for helping the Red Sox win the World Series for the first time in 86 years
The bloody sock has nothing to do with how Curt Schilling performed.
He called a championship for Boston -- saying that was his intention the moment the Diamondbacks traded him there -- then he delivered. That's almost Namath-like. Joe Namath's career football numbers aren't so perfect, either, and nobody doubted his Hall of Fame qualifications.
Round and round we go. Joe Namath was probably not a Canton-worthy performer but he guaranteed a victory while playing in America's biggest media market so he became a big star. The media made him that. When it came time to vote him for the Hall, many of the same media members, Hall voters, referenced the guarantee in building his case.
So here you have Heyman citing a football player's Super Bowl guarantee, famous only because the media made it such, in helping to build his case for Schilling. It's all very, very stupid.
Championships are what it's all about…
I don’t know. Ty Cobb, Barry Bonds, Ted Williams and Willie McCovey were all pretty good.
…and Schilling played as great a role in winning championships as just about any player of his generation except Mariano Rivera.
Manny Ramirez, David Ortiz, Derek Jeter, Bernie Williams, Andy Pettitte, David Cone and Roberto Alomar might disagree.
That Schilling won "only'' 216 games shouldn't be counted against him. That he had "only'' maybe seven or eight great seasons shouldn't either. If it's about numbers, it shouldn't only be about total numbers. He had three 300-strikeout seasons, three 20-win seasons. He struck 3,116 batters while only walking 711.
He had all-time stuff. And as much as I hate to admit this, he had all-time heart. He was 10-2 with a 2.23 ERA in the postseason. He and Randy Johnson were the two biggest keys to the Diamondbacks winning the thrilling 2001 World Series, and he and Manny Ramirez were the keys to the Red Sox winning the historic 2004 Series.
This is my favorite part about these columns - the part where the writer rails against statistics, only to then cite statistics just paragraphs later.
So anyway, now we’re talking statistics. Which is it, Jon?
It's safe to say Schilling is about the last person I'd want to spend any appreciable time with. But if I had a game on the line I had to win, and if Sandy Koufax wasn't available that day, I'd give John Smoltz or Schilling the ball.
Oh, Schilling is the last person you’d want to spend time with? I think I know who the first is…might it be Manny Ramirez’s agent?
There is plenty of offensive firepower in the San Francisco Giants clubhouse. Or there was on the day I visited. Willie Mays was sitting at a table in the clubhouse, Willie McCovey was resting in the dugout, and Will Clark was chatting with current players. The Giants' starting pitching looks so good, it's truly a shame they don't have at least one active player anywhere near as good as any of those guys in their prime.
Among active players, Manny Ramirez would have made a nice addition to the Giants. He could have replicated the years of Barry Bonds, with comparable productivity, less controversy and more good cheer.
No, Manny Ramirez could not have replicated the years of Barry Bonds. And good grief, Jon. Please give us a break. With Stephen Strasburg looming, we don't even get to wait until next off-season for you to start shilling for Boras again.
Let us enjoy the start of the baseball season in peace.
| Designated Hitter | March 26, 2009 |
As They See 'Em: A Fan's Travels in the Land of Umpires
Back in 1988, in an attempt to make a little extra money during graduate school at UC Berkeley, I tried out to be an umpire for intramural softball. We were given a brief instruction on what to do and a mock game was set up as a tryout.
I was working first base and there was a grounder hit to the second baseman. I tried to remember where I was supposed to stand (about 15 feet behind the bag at a 45 degree angle to either side depending upon whether or not the throw was coming from the left or right side of the infield). The ball was hit... somewhere... and I ran to stand in position. Except I stood near the pitcher in the middle of the play. And then I tripped over my own feet and fell over. I found other part-time employment.
 Bruce Weber, a New York Times reporter, had a bit more success when he visited the Jim Evans Umpire School back in 2005 and he ended up writing an interesting book about the lives of umpires, both minor and major leaguers, in his As They See 'Em: A Fan's Travels in the Land of Umpires (Simon and Schuster, $26).
Starting with the bizarre world of umpire school (one student's employer told him "they have a school for that?"), where prospective umpires are put through drill after drill to get them to see a game as an umpire does, instead of as a fan. Weber also has some interesting stories about how umpires are drilled in how to argue with managers and players, and even more importantly, how to take off their mask without having their cap fall off. The latter is extremely important it turns out, although if more umpires start using the hockey style masks, that arcane art may disappear.
Like players, umpires are taught where to position themselves and how to anticipate plays. The most common time you will see an umpire out of position is when a player does something completely unexpected, such as throwing to the wrong base. After all, if the player shouldn't throw to a certain place, why should they be in position to cover a situation caused by a player's mental error.
As Weber points out, umpires are part of baseball that has no constituency that likes it. Players and managers don't like umpires, and umpires like to call players "rats." Front offices don't like umpires. Even the Commissioner's Office, which employs umpires, really doesn't like them. Former Commissioner Fay Vincent says that teams view umpires like they were bases, just pieces of equipment that you have to have to play the game.
One of the hardest things Weber faced in writing his book was getting people to talk to him. Players and managers generally didn't want to speak to him because they feared payback from umpires. Even Earl Weaver, long out of the game, wouldn't speak to Weber about umpires. Umpires didn't want to speak too much out of turn because they feared for their job security.
Umpires who graduate at the top of their classes at one of the two umpire schools (Harry Wendlestedt operates the other one), are given jobs in Rookie or Short-season A leagues as parts of two-man crews who drive hundreds of miles between cities and stay in motels that often appear as if they have hourly rates. MLB views minor league umpiring as "seasonal work" so the pay is low, sometimes around $800 per month. It's a job you have to love somewhat because most people could make better wages at McDonald's.
For the privileged few who make it to the majors (there are 68 full-time MLB umpires), the job becomes even more tense. Every call is scrutinized and there is nothing positive that an umpire can do. They can only screw up.
Since an MLB umpire's job is so coveted, Weber could only get a few umpires to speak to him on the record and even some were not entirely forthcoming. The disastrous mass resignation plan of 1999 has left deep wounds among the corps of umpires. Interestingly, Weber points out that even though umpires were no longer separated by league at the time, the battle lines in that dispute split along AL-NL lines, with the AL umpires (who long felt that they were below the NL in the pecking order) taking the opportunity to assert leadership in a new union.
I found the best parts of the book when Weber goes into some detail about the mechanics of umpiring. It's one part of baseball that few people seem to care about, unless they think an umpire screwed up. Then people are experts on the matter.
For example, when there is a bunt play going on and the defense puts on "the wheel" play, watch the umpires. They don't move. They have to watch the bases. But if there is a ball hit down the left- or rightfield lines, the umpires will wheel around, while the infielders will generally stay by their bases to make a play on a runner or the batter-runner. (If you want to be an umpire, learn to say "batter-runner," "ball-strike indicator," and don't let anyone call you "Blue.") Umpires also have responsibilities to make sure that all the runners touch their bases and it's a subtle skill that they pick up over time.
Weber also gets umpires to explain how pitchers like Greg Maddux and Tom Glavine get seemingly wider strike zones than other pitchers. Briefly, it's because those pitchers have such good control that they can keep placing the ball further and further on the corner of the strike zone. And then they are able to work inside and outside the edge until the outside edge of the strike zone gets wider because of the umpire's perception of where the pitches go. Maddux and Glavine in a sense have earned bigger strike zones because of their skill, and not just because of their reputation.
One thing that did surprise me is how open umpires were to technological improvements in the game. Replay review of home runs was welcomed because the umpires know how difficult some parks were for making those calls. It's likely that in 2009, umpires will err on the side of calling a ball in play rather than a home run because it is simpler to remedy that call with replay rather than the other way around.
The final chapter of the book includes interviews with umpires who have made some of the most controversial calls in recent history: Larry Barnett (who didn't call interference on Ed Armbrister in the 1975 World Series, despite Carlton Fisk's protestations), Doug Eddings (of the 2005 ALCS call involving A.J. Pierzynski and Josh Paul and the dropped third strike), Richie Garcia (of Jeffrey Maier fame), Tim McClelland (who was the umpire for the George Brett Pine Tar Game and The Did Matt Holliday Touch The Plate Game), and Don Denkinger (1985 World Series Game 6, bottom of the 9th).
Each umpire gets a chance to explain what they did and didn't see or what they did or didn't do. Denkinger freely admits blowing the call on Jorge Orta, but explains how it came about. But that will likely not satisfy Cardinals fans. Some of them still want blood 24 years after the fact.
Weber wants fans to have a greater appreciation for the work that umpires do. The umpires are far from a perfect lot. They are profane. They are sexist (the few female umpires who have been in the minors were treated horribly). They aren't there to make the fans or players happy. They are at games to keep them under control. It's a job that not many people have the ability or temperament for. But those that do it, do care about doing their jobs well. Nevertheless, I predict plenty more complaining about umpires this year from just about everybody. It's one of baseball's constants.
From the benches, bleak with people, there went up a muffled roar,
Like the beating of the storm waves on a worn and distant shore.
"Kill him! Kill the umpire!" shouted someone in the stands,
And it's likely they'd have killed him had not Casey raised his hand.
- From "Casey at the Bat" by Ernest Lawrence Thayer, 1888
Bob Timmermann, formerly of The Griddle, is a senior librarian for the Los Angeles Public Library and runs One Through Forty-Two or Forty-Three.
| Designated Hitter | March 25, 2009 |
A Long Time Ago In A Galaxy Far Away. . .
[Editor's note: John Brattain, a writer for The Hardball Times, Baseball Digest Daily, and his own blog Ground Rule Trouble, and a sincere friend of Baseball Analysts, passed away on Monday due to complications from heart surgery. John, who is survived by his wife Kelly and two daughters, was 43 years old. Known as "The Bones McCoy of THT" at the Baseball Think Factory, his signature line was "Best Regards, John." In sympathy and as a tribute to John and his family, we present his guest column — a terrific piece about Robert Lee "Indian Bob" Johnson — from December 22, 2005. Best Regards, John. - Your Pals at Baseball Analysts.]
One of the great oddities in baseball is how we perceive players. If a player does one or two things spectacularly well, he ultimately ends up being better regarded than players who do a lot of things well. Of recent vintage was 1998 and 1999 when home run behemoths Mark McGwire and Sammy Sosa got all the ink over players like Barry Bonds and Ken Griffey Jr. Earlier in the decade in Canada RBI man Joe Carter had a higher profile than Larry Walker. Or, if you wish to go back to the 1970's and 1980's, you'll find more casual fans have heard of Dave Kingman over Dwight Evans.
For that matter, don't you find it odd that Tim Salmon never went to an All-Star Game? Not one.
Bill James said in his book Whatever Happened To The Hall of Fame--The Politics Of Glory that players who do one or two things well tend to be overrated while those who do a lot of things well tend to be underrated.
Today we're going to talk about an historically underrated player. He didn't have one ability that defined him but didn't have a single hole in his game: he could hit, hit with power, run, field and throw. Baseball-Reference has tests that involve Black Ink and Gray Ink. Black Ink describes how often a player led the league in some statistical category; Gray Ink describes how many times he finished top ten in the league. This player has two points of black ink but 161 points of gray ink.
In other words, he was never the best, but consistently among the best.
We're talking about Robert Lee "Indian Bob" Johnson.
Johnson was born in Oklahoma in 1906, and his family soon moved to Tacoma, Washington. He left home in 1922 at age 15 and began his baseball career with the Los Angeles Fire Department team. Because Johnson was part Cherokee, he was subjected to the nickname "Indian Bob," just as other players of Native American ancestry had similar epithets foisted upon them in this era.
Johnson was soon playing semi-professional ball. When his brother, Roy Johnson, became a professional, he felt buoyed. He said, "When Roy became a regular with San Francisco in 1927 I knew I could make the grade in fast company. I had played ball with Roy and felt I was as good as he was."
However, Johnson failed trials with San Francisco, Hollywood, and Los Angeles. He did not play professionally until Wichita of the Western League signed him in 1929. Johnson played in 145 games at two levels and batted .262 with 21 HR while slugging .503. After again hitting 21 HR (in just over 500 AB) the following season in Portland, he went to spring training with the Philadelphia A's but didn't make the roster due to his inability to hit the curveball. Over the next two seasons in the minors, Johnson batted a combined .334 with 51 HR while slugging .567 and showing both patience at the plate and a powerful throwing arm in the outfield.
Opportunity knocked in 1933 as Connie Mack sold off veteran Al Simmons to the White Sox leaving Johnson and Lou Finney to battle for the leftfield job in spring training. Johnson won the job and had an excellent freshman season at age 27...
 AVG/ OBP/ SLG  Runs 2B 3B HR RBI OPS  RCAA
.290/.387/.505  103  44  4 21  93  134   37
...and was generally considered the league's finest rookie.
Johnson would quickly prove that 1934 was no fluke. On June 16th, the A's and White Sox played a twin bill. After losing the opener 9-7, the A's come back to win game two 7-6. Johnson went 6-for-6 with two home runs (both off Whit Wyatt), a double, and three singles. Four days later, he hit his 20th round tripper of the season against the Browns giving him the league lead (he finish fourth). He also enjoyed a 26-game hitting streak. After two fine seasons, Johnson was beginning to get recognition as he was named the starting left fielder of the American League All Star team in 1935. Johnson also finished fourth in the loop in home runs for the third time in his first three seasons and enjoyed his first 100 run/100 RBI season (he had topped 100 runs in both 1933 and 1934).
Despite turning 30 in 1936, Johnson kept right on raking and showed a little extra speed on the base paths, hitting a career high 14 triples. In both 1936 and 1937, he ripped 25 HR driving in 100 runs despite not getting 500 AB in '37; of interest, on August 29 he again victimized the White Sox in a doubleheader as the A's set a new AL record in the opener of a twin bill by scoring 12 runs in the opening frame, six of which were driven in by Johnson. After four years in the majors, other aspects of Johnson were becoming known around the league. Johnson was a bit of a practical joker, and it was in 1937 when Yankees' HOF second baseman Tony Lazzeri pulled a prank on him, knowing he would probably appreciate the joke.
Lazzeri doctored a ball over the course of two weeks by pounding it with a bat, soaking it in soapy water, and rubbing it extensively with dirt and finally coating it with white shoe polish to make it look like new. Bill James described it as a ball that was "as dead as Abe Lincoln." It was so heavy and lifeless that it would plop down harmlessly once struck with a bat.
Lazzeri sprang his joke on September 29 long after the Yanks had clinched the pennant. During an inning in which Johnson was due to bat, he ran out to second base with the gag ball in his pocket. When Johnson stepped into the batter's box, he trotted out to the mound and switched balls with Yankee southpaw Kemp Wicker. Wicker grooved Lazzeri's "mushball" down the pipe and Johnson took a mighty cut and hit it on the screws. However, rather than hitting a prodigious moonshot, the ball plopped harmlessly foul behind the plate while a perplexed Johnson stood there wondering just what the hell happened while the other players and the crowd burst into laughter.
Johnson continued to get better as he aged as he put together his best two seasons at 32 and 33, topping 110 runs/RBI both years while batting at least .300/.400/.500. On June 12, 1938, Johnson was a one-man wrecking crew against the St. Louis Browns, hitting three bombs (and a single) and driving in all eight runs.
1938 and 1939
 AVG/ OBP/ SLG  Runs  2B 3B HR RBI OPS  RCAA
.325/.422/.553  229   57 18 53 127  146   95
Johnson was also developing the reputation of being an athletic fielder. He lead the AL in assists twice (in The New Bill James Historical Baseball Abstract, the best outfield arm of the 1940's is said to be either Johnson or Dom DiMaggio and he was also 4th all-time in outfield assists per 1000 innings) and also filled in occasionally at second and third base (poorly it should be added). He was named to the AL All-Star team both years.
Johnson finally began to show the effects of age during his age 34 and 35 seasons and started to lose some bat speed. Connie Mack even felt the need to give his star slugger time off from covering the expansive left field pasture at Shibe Park, playing him 28 games at first base in 1941. He still had power and a sharp batting eye and remained a potent RBI man, topping 100 RBI in both 1940 and 1941--the latter his seventh straight season over the century mark.
Johnson's power started to wane in 1942 as he suffered through his worst season statistically to that point in time, failing to hit 20 HR or 90 RBI for the first time in his career. However, part of this was attributable to the fall of offense across the board due largely to players enlisting in the military for WWII. His OBP and SLG marks were still good for top 10 finishes in the Junior Circuit and good for fifth in MVP voting. After continually clashing with Mack over pay, the manager finally said goodbye, sending him to the Washington Senators for third sacker Bob Estalella and Jimmy Pofahl. Baseball Almanac notes that this was the only time in baseball history where a player who led his team in RBI for seven straight years was traded.
Johnson lasted one year with the Senators where age and huge Griffith Stadium all but neutered his power as he slugged a career low .400, and for the first and only time in his career he failed to hit at least 10 home runs (7). He was sold to the Boston Red Sox by Griffith who later regretted the move. The diluted war-time talent in the majors coupled with Fenway Park's hospitable climate for right-handed hitters allowed Johnson to finish out his major league career in style. In a season which either spoke highly of Johnson's ability at age 38 or spoke poorly of the level of war-time talent left in the majors by 1944--*cough* Browns win the pennant...Browns win the pennant *cough*--Johnson enjoyed his finest statistical season (including hitting for the cycle on July 6):
 AVG/ OBP/ SLG  Runs  2B 3B HR RBI OPS  RCAA
.324/.431/.528   106  40  8 17 106  174   61
Still, a lot of other fine players also played through the war years including HOFers Paul Waner, Chuck Klein, and Joe Medwick and didn't play as well as Johnson. Further, he was able to play 142 games in left field and enjoyed his first season on a team .500 or better since his rookie year as the Red Sox finished 77-77. For his efforts he was named to his seventh All Star team and finished 10th in MVP voting. As World War Two dragged on to 1945, Johnson was able to enjoy one last moment in the major league sun. He played 140 games in left field and provided the Red Sox with 82 runs created (AL left fielders averaged 67 RC in 1945), which earned him his eighth and final All Star nod. With the war over, Johnson pushing 40, and the return of Ted Williams, the Red Sox and Johnson parted company and he continued his career with the Milwaukee Brewers in the American Association.
Despite his advanced athletic age, Johnson managed to hit .270 with 13 HR and a .456 SLG in 94 games. He moved on to Seattle of the Pacific Coast League for the next two years, batting .292 with 35 doubles, 12 HR and a .441 SLG in 487 AB. Johnson, now 44, went home to play for and manage the Tacoma Tigers in the Western International League where he wielded a potent bat, hitting .326 with 13 doubles, five homers and a .463 SLG in 218 AB. He didn't play in 1950 but resurfaced briefly in Tijuana the following year at age 46. Johnson batted .217 in 21 games, then hung up his spikes for good.
So how do we measure Johnson's career? He probably missed being a Hall of Famer by a whisker. Johnson was hurt perceptually due to playing on second-division teams never reaching the World Series or even coming particularly close to one. He was also overshadowed by all-time great outfielders like Joe DiMaggio and Williams. Further, he finished his career during the second World War. Also working against him was his consistently high level of play; his OPS never going higher than 174 or dropping below 125 and always provided above-average offense for his position. He never had an eye-popping, jaw-dropping season that nets players MVP awards. He is also perceived by many to be the equivalent of the Phillies fine outfielder of the 1940's and 1950's, Del Ennis.
In short, he was invisible.
However, when we examine his record, he fits right in with four contemporary outfielders who are in the Hall of Fame and three of whom--like Johnson--finished their careers during WWII: Earl Averill, Klein, Medwick, and Paul Waner.
Player              AVG   OBP   SLG Runs   HR  RBI  OPS  RCAA*
Bob Johnson        .296  .393  .506 1239  288 1283   138  413
Earl Averill       .318  .395  .533 1224  238 1164   133  391
Chuck Klein        .320  .379  .543 1168  300 1201   137  409
Paul Waner         .333  .404  .473 1190  139  957   134  588**
Joe Medwick        .324  .362  .505 1198  205 1383   134  368
Del Ennis          .284  .340  .472  985  288 1284   117  145
* Runs Created Above Average is a counting stat
**Waner's career length is the longest of the six players
As mentioned, a lot of folks dismiss Johnson's achievements because of a superficial statistical similarity to Del Ennis. I threw Ennis in here to show that he's not at all comparable to the above group. His HR/RBI totals are similar but he's last in AVG/OBP/SLG, runs, OPS and RCAA. The difference between Johnson and Ennis' respective levels are about the same as Rusty Greer (120 OPS /149 RCAA) and Chipper Jones (141 OPS /429 RCAA); nobody suggests that Greer and Jones are similar as hitters. In the chart above, we can see how close Johnson's level of play was to Hall of Fame quality. His eight All Star selections reflects the high regard contemporaries viewed Johnson. After Al Simmons was sold to the White Sox, Johnson all but became the Athletics offense. During his ten years with the A's, the team created 7612 runs. Johnson was responsible for 1162 (15.26%). The roster over that ten years were -420 RCAA while Johnson had 317 RCAA.
Although never topping statistical lists, Johnson was consistently among the leaders. From the period 1930-50, Johnson was tied for second in doubles (396), eighth in triples (95), third in home runs (288), third in runs (1239), second in RBI (1283), sixth in OBP (.393), sixth in SLG (.506), and fifth in OPS (.899). Here are the top ten finishers in RCAA (totals accumulated before 1930 and after 1950 are not counted):
1.    Ted Williams                908
2.    Joe DiMaggio                695
3.    Babe Ruth                   460
4.    Bob Johnson                 413
5.    Charlie Keller              394
6.    Earl Averill                356
7.    Tommy Henrich               274
8.    Jeff Heath                  261
9.    Al Simmons                  250
10.   Roy Cullenbine              215
Johnson's RCAA is 73rd all time. When you consider that, along with being a fine fielder with a terrific throwing arm, you begin to appreciate the complete package that was Robert Lee "Indian Bob" Johnson. Truly an All Star in the fullest sense of the word and an unappreciated talent. When you look back at some of the superb players to grace the diamond in the 1930's and 1940's, don't forget about the man that patrolled left field at Shibe Park for a decade.
John Brattain writes for The Hardball Times and his work has been featured at About.com, MLBtalk, Yankees.com, Replacement Level Yankee Weblog, TOTK.com, Bootleg Sports, and Baseball Prospectus.
[Additional reader comments and retorts at Baseball Primer.]
| Touching Bases | March 24, 2009 |
Fun With Hit Tracker: Home Runs Over Time
All home runs are not created equal. Over the course of a six-month season, things are bound to change. Players wear down or maybe some heat up. In the past, we've been able to find player trends by analyzing first-half and second-half splits or maybe even game logs. But now with new data sources, we can try to find out how or why players produce different outcomes over a season. Are they lucky? Do their skills improve? Do they fatigue?
Josh Kalk used pitch f/x data to show how pitchers fatigue during starts and he unveiled wear pattern charts for specific pitchers to show how some fatigue over the course of a season.
Another great new data source that has not received the same attention as pitch f/x is Hit Tracker. Developed by Greg Rybarczyk, Hit Tracker tracks every physical aspect of the home run. So how did the distance of home runs vary over the course of the 2008 season?
"True Distance" measures how far the ball actually traveled, or how far the ball would have traveled had it landed uninterrupted. I know, if only we could project how far Mickey Mantle’s and Ted Williams' legendary shots traveled. Well, Hit Tracker can. Here and here you go.
The chart seems to show that home run distances trend upward until early August and then fall slightly. It also appears that we can say with confidence that over the course of a week, the mean home run distance will be right around 390-400 feet. The first data points on the chart are a bit whacky, since the March average was 399 feet per home run, but then the first three days of April averaged 390-foot homers per day. Hence, the five-day rolling average is somehow much lower than the same month's average. But the main observation is that from April until July, there is a rather distinct increase in home run distance—around five feet per dinger. So what causes the change? Perhaps players need some time to get into their groove, or perhaps the environment becomes progressively more conducive to home runs. But how do we measure that? Did I mention that Hit Tracker also records the two most important components a batter can control? It captures where and exactly how hard the ball is hit. With the upcoming advent of hit f/x, we might get this data for all types of batted balls. The launch angle is measured in horizontal and vertical degrees from the point of contact three feet above home plate, while the speed off bat is measured in miles per hour. I chose to use the speed off bat as a measure for the player’s skill over time. I believe that a hitter's objective when he is at bat is to hit the ball as hard as possible. Here are the results:
Well, that appears to directly contradict what we saw in the first chart. Players seem to start off hot in the opening weeks of the season, but then by late May the average speed off bat flattens out at around 104 MPH until playoff time when there is a pretty decent rise. It would make sense that the select few who are able to hit homers in October do so with more power than the average hitter.
If it’s not the hitter who controls the change home runs, then it must be the hitter’s environment. Fortunately, Hit Tracker also records atmospheric effects such as temperature, wind, and altitude. Altitude should theoretically remain constant over time, as stadiums don't traditionally switch locations. But wind and temperature flow with the seasons. Since both factors can negatively impact the distance a ball travels, I plotted the absolute average impact as well as the actual average.
The impact due to temperature is defined as “the distance gained or lost due to the impact of the ambient temperature, in feet, as compared to a 'standard' temperature of 70 degrees." Temperature, along with the Speed Off Bat appear to largely explain the opening chart which showed the average true distance of home runs over the course of 2008. I’m not a physicist, but I figure a change in one mile per hour is equivalent to about 1.5 feet per second, and the average home run stays in the air around 3-5 seconds. So if the speed off bat decreases half a mile per hour in the early months, then the batter is responsible for about a three-foot decrease in distance. Yet the average true distance of home runs increases from about 395 in April to 398 feet in July. While the batter might cause at most a five-foot dip as the season progresses, the temperature appears to rise from a minimum average of -5 feet to a high of 5, which would explain the rise in distance. I’m also not a meteorologist, but the symmetry makes sense to me as the temperature rises in the spring, then peaks around the June 21 solstice, maintaining that point through the dog days of August, until the temperature declines going into the Fall classic. Not exactly shocking results.
Putting it all together with the standard distance, which controls for atmospheric effects and simply measures how far the ball would have been hit in neutral conditions:
Looks pretty even throughout the season, with the exception that distance possibly curls up at the start and end points. This could all be contributed to small sample size, but the fact that better players make the playoffs may have something to do with it, but do better players also start out hot? I'll be sure to keep note of it over the next few weeks.
Here's a chart of the three year's worth of data. Out of about 15,400 homers, Hit Tracker was missing data on less than 300 of them. The table should be read as the mean of each category, followed by standard deviation in parentheses.
Month     Amount True Distance Speed Off Bat Wind Effect Temp Effect Standard Distance
March     26     399.8 (25.3)  105.6 (5.7)   5.4 (17.5)  -4.0 (2.4)  396.7 (33.5)
April     2214   395.6 (24.7)  106.1 (5.2)   1.7 (13.2)  -2.5 (4.3)  393.8 (27.1)
May       2522   396.0 (25.3)  105.6 (5.2)   1.8 (11.7)  -0.2 (3.7)  392.1 (26.2)
June      2545   396.6 (25.5)  105.1 (4.9)   2.0 (10.6)   2.0 (3.4)  390.0 (25.8)
July      2446   397.9 (26.1)  105.3 (5.0)   2.3 (11.0)   3.3 (3.2)  390.4 (25.3)
August    2641   397.0 (24.8)  105.9 (5.0)   1.4 (9.7)    2.7 (3.6)  392.7 (26.6)
September 2508   398.0 (26.1)  105.9 (5.2)   1.5 (10.0)   0.9 (3.1)  392.7 (26.6)
October   242    393.8 (24.8)  105.8 (5.1)   3.0 (10.6)  -2.0 (3.4)  391.2 (26.7)
I wanted to do a mini-case study applying changes in home runs over time, and the clear choice for any such study is Ryan Howard. He gives us a nice sample to work with and such a large part of his value is built on home runs. He’s been on a clear decline since his age 26 season, so we can see whether there have been changes in his home runs year by year. Plus, if you look at his day-by-day graph on fangraphs, he’s been a rather remarkable second-half hitter.
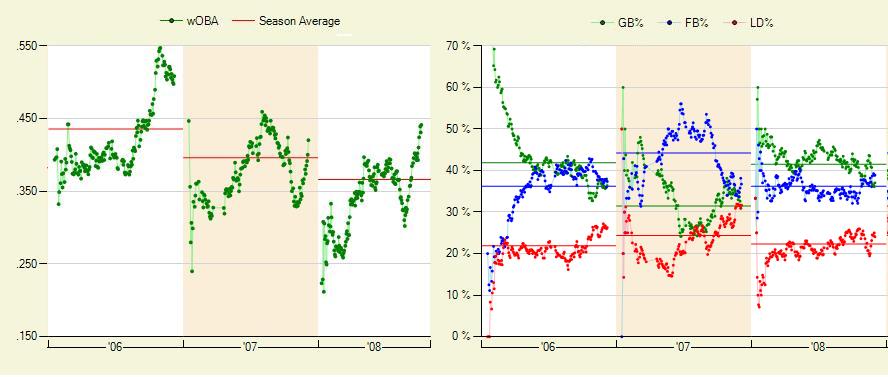
Over his career, he's held a 168 point difference in OPS between the first and second halves of the season. I'm not predicting that he'll continue the trend this year—I'm just pointing out that the trend has existed.
Howard also intrigues me since I believe he might be the best opposite field power hitter of all-time. But that’s a subject I’ll tackle another time hopefully. Again I decided to forego the launch angles and stick to the effects of speed off bat, temperature, wind, and distance. Presented without much commentary:
It's evident that he's been hitting the ball with less force in recent years. I also like that you can easily see trend lines with positive slopes each year, confirming him as a late bloomer.
Wind impact appears to be random, but you can almost make out those parabolic curves in temperature impact. A power hitter might be prone to mid-summer surges thanks to those extra five to ten feet in fly ball distance from less dense air.
Not much notable. He averaged 403 feet in 2006, 406 feet in 2007, and 398 feet in 2008. Here's his table. It includes his home runs from 2006-2008 but is missing three from 2007. It should be read category mean followed by standard deviation.
Month     Amount True Distance Speed Off Bat Wind Effect Temp Effect Standard Distance
April        13   414.2 (27.3)  109.1 (5.1)   5.3 (12.5)  -3.0 (4.3)   408.3 (28.9)
May          29   394.9 (29.1)  105.7 (5.5)   3.4 (9.7)    0.5 (4.4)   390.1 (33.0)
June         24   410.7 (32.9)  105.1 (5.2)   3.2 (11.4)   3.3 (2.8)   402.5 (30.9)
July         28   398.1 (27.7)  107.7 (6.0)   2.8 (7.9)    3.0 (2.9)   391.2 (29.0)
August       26   404.8 (30.8)  108.0 (6.9)  -3.6 (13.2)   4.3 (3.0)   403.2 (35.0)
September    30   400.2 (22.9)  106.4 (4.6)   1.0 (6.9)    2.1 (2.8)   396.8 (24.8)
October      4    390.5 (25.0)  104.5 (6.5)   3.7 (4.5)   -2.5 (6.3)   389.3 (32.2)
All data was obtained from Hittrackeronline.com. Interested parties may contact webmaster@hittrackeronline.com
| F/X Visualizations | March 23, 2009 |
Deconstructing the Fastball Run Value Map
In a previous post I presented a map showing the run value of a fastball based on its location. In this post I will examine that map in more depth. Consider the two locations, A and B, in the figure below.
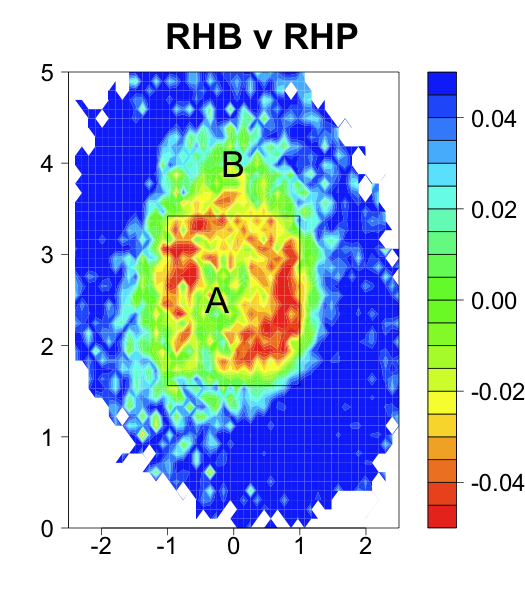
These locations have about the same run value, just below 0, but for different reasons. Taken pitches at location A are called strikes while taken pitches at location B are balls. In order for the two locations to have the same run value pitches swung at in location A must have, on average, higher run value outcomes than pitches swung at in B. Not brain-surgery so far, swinging at fastballs down the middle is better than swinging at fastballs a foot above the strike zone. We could try to intuitively guess at explaining the rest of the above pattern in a similar manner, but why try when we have the data to properly explain it. I will present that data in this post.
The run value of a pitch is determined by the outcome of four events.
- If the batter swings at the pitch or not.
- If no to 1, whether the taken pitch is called a ball or a strike.
- If yes to 1, whether the batter makes contact.
- If yes to 3, the run value of that contact.
Below I present a series of three images for each handedness combination that show how the outcomes of these four events vary by location for fastballs. Reading left to right:
- The first image addresses events 1 and 2. The heat map is the swing percentage by location to address 1. On top of that are three contour lines where 75%, 50% and 25% of taken pitches were called strikes to address 2. So if a batter took a pitch inside the smallest circle it was called a strike over 75% of the time. If he took a pitch in doughnut between the smallest and middle circles it was called a strike between 75% and 50% of the time, and so on.
- The second image addresses 3 showing the contact percentage of pitches swung at.
- The final image addresses 4 showing the run value of a contacted pitch (including foul balls).
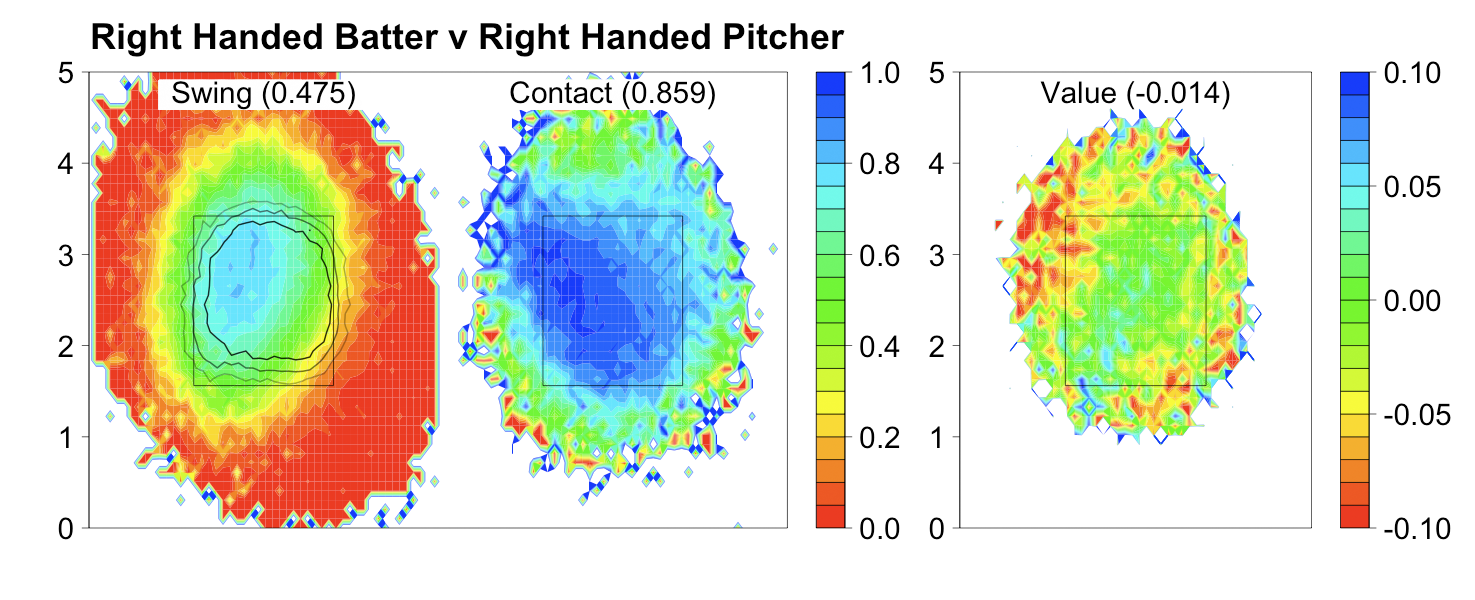
There is a lot going on in this series of images, and they might be intimidating at first. My suggestion is to focus on the leftmost image, spend sometime looking at it and once you understand it move on to the next. Do the same with the middle before moving on to the rightmost one.
With these images we can better explain the pattern in the overall fastball run value map. Consider location B in the first graph, the area of slightly negative run valued fastballs above the strike zone. Batters swing at pitches in this location over 50% of the time, make contact only around 70% of the time and the result of that contact is negatively valued. So the swung at pitches will have a quite low negative run value. The taken pitches are almost all called balls (this location is outside the largest strike contour) which have a very high positive run value. The result is the slightly negative value we see in the first image. Similar explanations can be made for any part of the run value map.
The region of highest swing percentage overlaps with the regions of highest contact percentage and run value of contacted pitches, and the 75% called strike contour, but is not entirely coincident with any of these. This means that hitters are not making entirely optimal swing decisions based on their ability to make contact, the value of that contact or how the strike zone is called.1
Contact percentage and run value of contacted pitches both reach their maximum slightly down and in from the center of the zone. But the overall regions of high contact percentage and run value of contacted pitches are not exactly the same. The region of high contact percentage is a diagonal swath from the top-in corner of the zone to the middle of the bottom of the zone. The region of high run value of contacted pitches is a diagonal swath from the bottom-in corner of the zone to the middle of the top of the zone.
Another interesting result is how the called strike zone compares to the rulebook strike zone. The inside and the top of the zone are called fairly well (the 50% contour runs along the rulebook zone on these edges), but the outside edge is shifted away a couple inches (the 75% contour runs along the rulebook zone's outside edge) and the bottom of the zone is shifted significantly up (the 25% contour is ABOVE the bottom edge). In addition, the strike zone is rounded rather than rectangular. These results are not new. John Walsh, David Pinto and Jonathan Hale have each shown all or some of these before, but it is nice to see that my analysis reproduces their results.
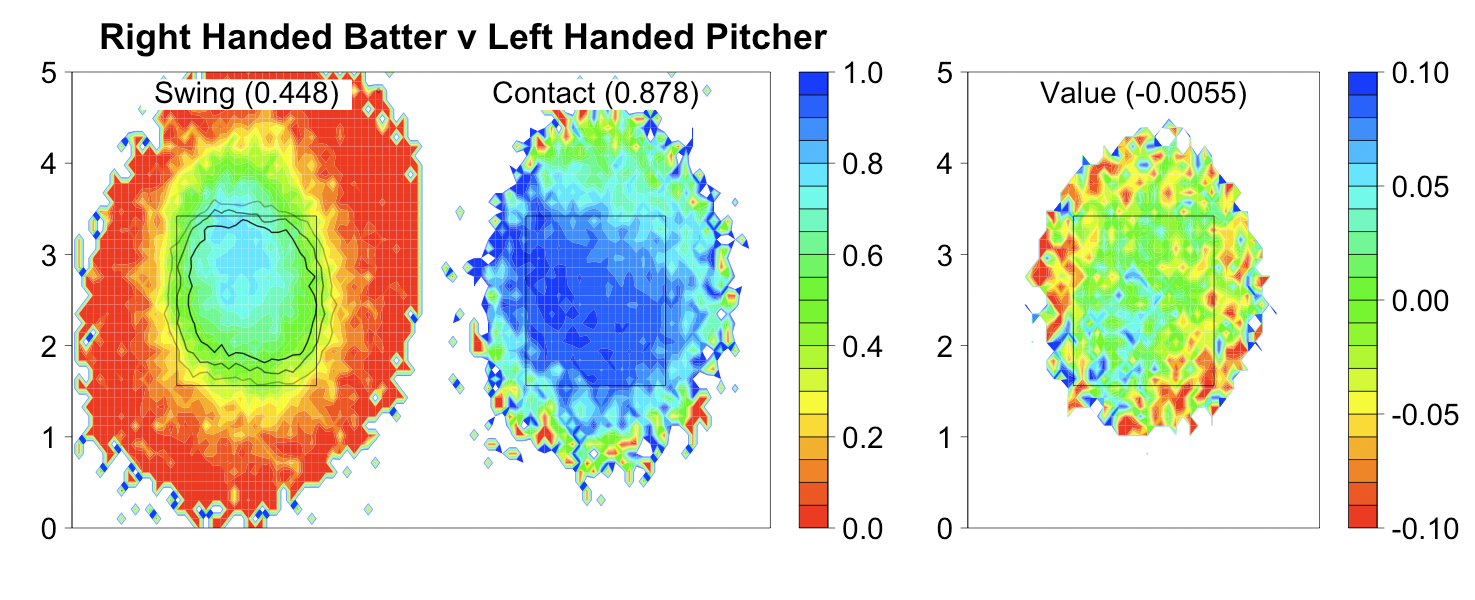
For the most part these are quite similar to the righty/righty images. One interesting thing we can address with these images is why RHBs do better against LHPs than RHPs. First, compare the location of the highest swing percentage relative to the strike contours in the RHB vs LHP and RHB vs RHP images. In the RHB vs LHP it is much more coincident along the horizontal axis, although it is still too high along the vertical axis . That means RHBs are swinging at more pitches in the called strike zone and taking more pitches outside the called strike zone against lefties than righties, which begins to explain their success. In addition, RHBs have a higher contact percentage and higher run value on contacted pitches versus LHPs compared to RHPs. So righties are better at each component of the at-bat against LHPs than RHPs.
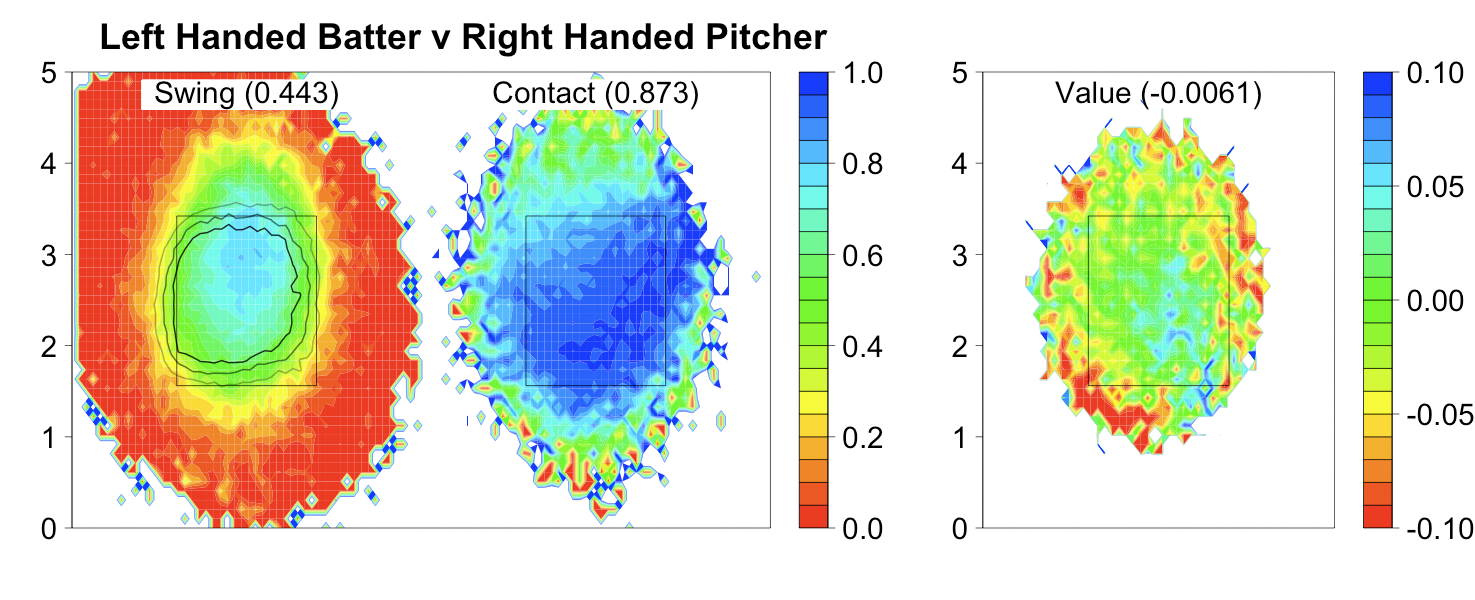
These are almost mirror images of RHB vs LHP above and the overall averages are very close. It is interesting to see how the strike zone is called differently to LHBs. The top is called well and the bottom is called very high just like to RHBs. The outside edge is shifted away as it is to RHBs, but that shift is larger with the 75% contour extending outside of the rulebook zone. The inside of the zone is also shifted outside a couple inches (the 25% contour runs along the rulebook edge), which was not the case to RHBs. Walsh and Pinto also observed these results.
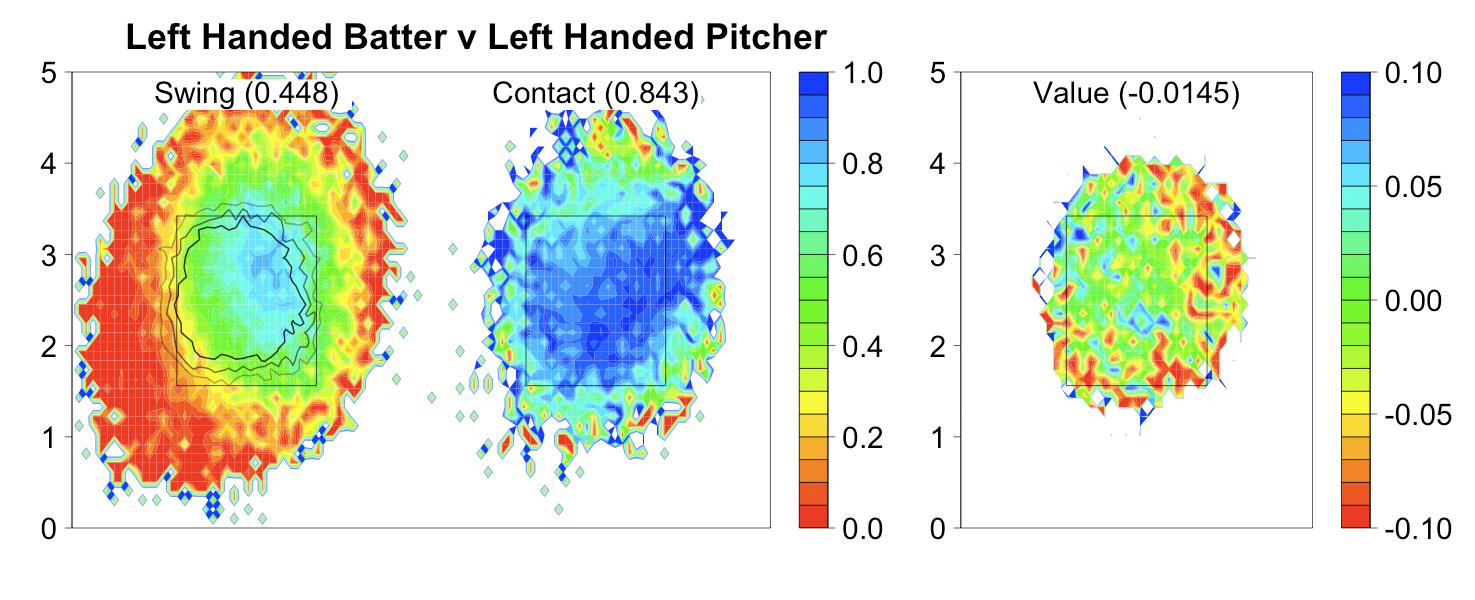
While LHBs' success against RHPs is very similar to RHBs' success against LHPs, LHBs fare much worse against LHPs than RHBs do against RHPs. Lefties swing at even more pitches outside the called zone, take more pitches inside the zone and make less and poorer contact against LHPs than RHBs do against RHPs.
Overall I was very surprised to see that in every case the average run value of a contacted fastball is negative. This is probably because I included foul balls in this group, but it is still surprising.
With these images one can understand the fastball run value maps in this post. Now if you go back, look at these maps and see something surprising, you can use the images presented here to understand what is going.
In future posts I will present similar images for the other pitch types.
1. Brian Cartwright made the following comment in this post:
One idea I never followed thru on is first identify hr% by location (and pitch type and count), as you have done here, then for each hitter (his favorite zones and pitches to go deep) then finally see how well each player recognizes the mashable pitches - what are the swing% for batters when they see a pitch in the best hitting zone? My opinion is that Barry Bonds and Brain Giles hit a high pct of homers because of superior pitch recognition, and putting the bat on the ball when they swung, not because of hitting the ball an extra-ordinary distance.This suggests an interesting way of evaluating batters: how well does their swing percentage map coincide with their home run rate map, contact percentage map or run value of contacted pitches map. It would be interesting to see if Giles' region of highest swing percentage is more inline with his region of highest run value than the average hitter, presented above.
| Behind the Scoreboard | March 21, 2009 |
What Will Make the WBC a Real Classic?
[Editor's note: Sky Andrecheck is the latest addition to the Baseball Analysts team. He is a statistician for a research company in Washington D.C. Originally from Chicago, Sky, who holds bachelors and masters degrees from the University of Illinois, has been cursed as a Cubs fan. He thinks the 101st year will be the charm.]
In a few days, the World Baseball Classic, the locust of the baseball world, goes back into the ground and allows the real season to begin - until then I'm here to analyze the Classic, how it's fared in its first two incarnations, and what it should look like when it re-emerges in 2013.
I'm not so much here to analyze it from a player or team standpoint, but from the point of view of a fan or commissioner. Certain aspects of the games have been grand successes - the thrilling game in Canada against the US, a packed Tokyo Dome for Japan vs. Korea, and Latin American fans cheering on the home team in Hiram Bithorn Stadium. Others images have been that of failure - half empty houses and blowout games shortened by mercy rule.
It's clear that MLB wants to attract as many eyeballs as possible with this Classic and at times has had trouble doing so, so to diagnose with problems the WBC we'll have to start with a clear-eyed analysis of WBC's attendance or lack thereof.
As of this writing, 75 WBC games have been played. We can start by classifying the games into 5 groups ranging from excellent attendance to simply terrible. This is trickier than it sounds due to the fact that the games were played in widely varying sized stadiums, but the games were roughly categorized into the following groups:
Now having the games classified into groups, we can perform an ordinal logistic regression to analyze what's driving the dramatic differences in attendance. Data from the 3 semifinal and finals games were excluded because they were sold out likely because of this very reason.
What I found was the following:
A summary of the chances of excellent or good attendance success can be seen in this chart below.
For completeness, I also re-ran the model with the venue as a covariate. While this somewhat overfits the model, it's useful to see which venues were the most and least successful. The following list shows LA as the best and Miami as the worst (by far) of the 9 venues for the WBC.
1. LA
2. Tokyo
3. Mexico City
4. San Juan
5. San Diego
6. Toronto
7. Orlando
8. Arizona
9. Miami
So, what can be done with this data to doctor up the tournament and it's lacking attendance and interest? While there was an improvement in 2009, only 36% of the games had excellent or good attendance - surely not the numbers MLB hoped for when they conceived of the WBC.
Currently the WBC is a tournament style affair with the winners advancing on to subsequent rounds. However, as we've just shown, attendance to the WBC isn't driven by building drama as the tournament gets deeper, but rather it's driven by specific match-ups played in specific locations regardless of whether the game is a must win or an opening round matchup. The WBC doesn't have the cache to sell fans simply on the fact that they are getting to see a late-round WBC matchup - but fans will come out to see specific match-ups (usually involving their own team), especially if they know they are coming more than one or two days in advance.
The prescription? More home games, more host countries, less terrible teams, and a set schedule hand-picked by the WBC to appeal to the fans. The WBC could do well to pare down the field to 10 teams rather than 16. Perhaps 8 of the teams, the US, Dominican, Puerto Rico, Venezuela, Japan, Korea, Mexico, and Cuba would be permanent members, with the other 8 playing for two spots into the tournament in an off year. In my example, I have Canada and Panama as the other two teams to get the tournament to 10.
But how can we get more home games and more appealing match-ups without ruining the integrity of the competition or running teams ragged going from country to country? MLB consists of a regular season and a postseason and I see no reason why that can't be the case in the WBC as well. The advantage of a "regular season," I propose a six-game long affair, is that the WBC can pick the match-ups and locations well in advance, maximizing the fan appeal and giving fans enough time to figure out which tickets they want to buy.
My example schedule, as seen below, has each team playing in three different locations and a total of 8 host countries, up from just 5 in 2009. The schedule has a home team in 60% of the games and features a lot of the match-ups that fans would love to buy tickets for: DR @ PR, Korea @ Japan, USA @ Venezuela, USA @ Cuba, Venezuela @ DR, Cuba @ PR, Japan @ USA to name a few. In 2006, the WBC passed by without a marquee US vs. Latin America matchup - now we get these juicy games guaranteed and locked in with enough time to build excitement and ticket sales around the games. Some of the best match-ups are scheduled for back-to-back games, increasing the intensity of the rivalries while having the added scheduling effect of increasing the percentage of home games without running the teams ragged flying from place to place.
The final round, which would advance the top 4 teams from the regular season, would proceed as it did in 2006 and 2009 - a format that worked fairly well given the sold-out nature of the games.
One of the chief drawbacks of the format is that the strength of schedule may not be the same for all teams. However, the WBC is already de facto setting the competitive balance and likely match-ups with its pool selection, so this is probably no worse. What's better is that this format should cut down the number of repetitive contests (the US may play Venezuela five times before 2009 is over).
Another criticism may be that some later games may have little championship significance. However, this was the case in 2006 and the 2009 "pool championship" games also took on little significance with no attendance drop-off. As we've seen above, it's the matchup, not the significance of the games that have the biggest effect on attendance.
The main advantage of course, is a slate of games far more appealing that those played in either 2006 or 2009. Plugging the projected schedule into the logistic regression model, we see that now approximately 57% of the games will have "good" attendance and 38% of the games will have "excellent" attendance, up from the 36% and 17% respectively in 2009.
The new format, while not perfect of course, is an improvement over the current structure. With more home games, more home cities, and more exciting match-ups, the attendance will grow and the reputation of the WBC will grow in accordance. This new format would play to the tournament's strengths, showcasing intriguing match-ups and international fans eager to root on their country, rather than trying to pretend the games are of grand significance simply because it's the World Baseball Classic.
| Change-Up | March 20, 2009 |
AL Central Preview (Featuring Joe Posnanski)
Joe Posnanski is the best and most prolific sports writer in the country. Quality and quantity. Rate stats and counting stats. He's No. 1 in both. A long-time, award-winning columnist for the Kansas City Star, Poz has branched out and now also writes for Sports Illustrated (including last week's cover story on Albert Pujols) and operates one of the must-read baseball blogs. He has a book, The Machine: A Hot Team, a Legendary Season, and a Heart-stopping World Series-The Story of the 1975 Cincinnati Reds, that is scheduled to be released on August 18th. We are honored that Joe took the time out of his busy schedule to participate in our AL Central preview.
Jeremy Greenhouse, kicking ass and taking names here at Baseball Analysts since he started a few weeks back, joins Poz and me from Davis Square.
We have the NL East, AL East and NL Central behind us. Let me recap how we do this.
For hitters we take five available projection systems at Fangraphs. I know I have mentioned this before but Fangraphs is seriously awesome. Without it, you might think Carlos Gomez was a lousy player. Anyway, we average all five of these projection systems to give you a sense for how the number crunchers see the players performing this season.
For pitchers, pretty much the same thing. We go with the four projection systems readily available on the Fangraphs player pages. We go with depth charts from ESPN.com. Some of the players penciled in below will not be starting, and some might not even break camp. But we figured this was a pretty good way to keep things consistent.
OK, here goes....
Catcher
                   AVG   OBP   SLG
Pierzynski, A.    .272  .311  .410
Mauer, J.         .315  .401  .451
Shoppach, K.      .250  .324  .462
Olivo, M.         .247  .277  .418
Laird, G.         .257  .312  .394
Poz: In my opinion, Joe Mauer was the MVP in 2006 and again in 2008, though he really didn't get much support either time. I suspect this is the year Victor Martinez makes the transition to first base; I do like Kelly Shoppach quite a lot. I didn't get why the Royals spent money on Miguel Olivo and John Buck, who are basically the same guy. I will say, though, that Olivo is faster than you would think: 7-for-7 in stolen bases last year.
Jeremy: Mauer really needs to get some MVP love. He logged the most innings behind the plate of his career last year and put up a .413 OBP. And color me skeptical on Shoppach. If he were to have become the player 2008 indicated he was, he probably would have before he was 28.
Sully: I've written about this before but someday writers will evaluate Mauer's Hall case and knock him because he didn't win an MVP (or maybe only won one).
First Base
                   AVG   OBP   SLG
Konerko, P.       .264  .353  .473
Morneau, J.       .288  .357  .501
Martinez, V.      .292  .365  .448
Jacobs, M.        .263  .315  .489
Cabrera, M.       .310  .380  .553
Poz: Justin Morneau seems to me the Jim Rice of our generation – good batting averages, lots of RBIs, big fear factor, an MVP candidate every year. I know Victor Martinez is not much of a catcher, but he just doesn't thrill me offensively as a first baseman. I've written at length about Mike Jacobs' weaknesses, but if he bangs 30 homers he would help the Royals. Miguel Cabrera is the best hitter in the division, in my opinion.
Jeremy: Isn’t it weird that Miguel Cabrera led the AL in homers last year with 37? Jacobs doesn’t belong on the field against left-handed pitching, but using him in a platoon could make for a dangerous combination. The problem is that the right-handed hitting Ryan Shealy has shown a rather strong reverse platoon split in his career, and even if Billy Butler could handle playing the field, the Royals would be left without a DH. Still, anything ought to be better than Ross Gload.
Sully: Cabrera is a pretty crummy fielding first baseman but he makes Jacobs look like Keith Hernandez over there.
Second Base
                   AVG   OBP   SLG
Getz, C.          .271  .334  .386
Casilla, A.       .265  .326  .349
Cabrera, A.       .270  .342  .395
Callaspo, A.      .279  .336  .378
Polanco, P.       .306  .352  .412
Poz: Been watching the Royals second-base “battle” closely, of course, and have been intrigued with the idea of Mark Teahen at second. Not as intrigued after watching him play the position. A scout tells me he thinks Placido Polanco wins the batting title this year.
Jeremy: Polanco’s ranked second in the league at making contact on pitches at which he swings each of the last two years, and has also been one of the couple hardest batters to strike out. If he continues to get a bit lucky in the BABIP department, he can definitely compete for a batting title. His .306 career average is top 15 among active players.
Sully: Asdrubal Cabrera is just 23 and already has demonstrated he can produce at the Big League level. Give me the over on his numbers.
Third Base
                   AVG   OBP   SLG
Fields, J.        .249  .324  .441
Crede, J.         .251  .304  .426
DeRosa, M.        .274  .353  .422
Gordon, A.        .264  .346  .446
Inge, B.          .235  .311  .397
Poz: I do think this could be a breakthrough year for Alex Gordon, though I'm not sure what breakthrough year means for him. The Brett comparisons seemed absurd at the time; now they seem destructive. With Brandon Inge and Adam Everett, the Tigers should catch everything on the left side.
Jeremy: If Fields turns into nothing more than a Quad-A player, the Sox will surely regret letting Crede walk. Crede has an excellent glove, and has been solid every year other than 2007. I think we all expected Gordon to break out at some point, but to me it seems like he’s just following a smooth career progression and will hopefully hit his peak in a year or two. I don’t see him showing the same potential as Evan Longoria or Ryan Zimmerman.
Sully: Mark DeRosa has gotten better in each of his 30-33 seasons. I am not sure when it is going to end, but Cleveland's got themselves a nice player.

Shortstop
                   AVG   OBP   SLG
Ramirez, A.       .289  .322  .471
Punto, N.         .251  .321  .333
Peralta, J.       .270  .336  .446
Aviles, M.        .289  .324  .440
Everett, A.       .240  .282  .343
Poz: Alexei Ramirez has lots of obvious flaws, but in many ways he was my favorite player to watch in 2009. I have no idea how much different Everett makes the Tigers, but he's the best defensive shortstop in the game. I'm down on Jhonny Peralta, but I was telling someone that at spring and then watched him hit a 450-foot homer to center, so I could be wrong.
Jeremy: There’s no way Mike Aviles can top last year, right? Ramirez is essentially the polar opposite of Everett. Everett is only four years older, but he’s been in the league since 2001 and has established himself as a light hitter with bat control and as one of the best defensive players in the game. Ramirez stormed upon the scene as a rookie last year, endearing himself to White Sox fans as a free swinger, but not faring too well in the field. He faced the lowest percentage of fastballs of any hitter last year and still swung more often than anyone but Vlad. He’s not likely to handle the transition to short too well. Perhaps an obvious comparison, but I’d move him to the outfield a la Alfonso Soriano. I think Peralta might ultimately belong at third.
Sully: Will Inge and Everett combine for a .300 on-base? I say "no".
Left Field
                   AVG   OBP   SLG
Quentin, C.       .268  .364  .494
Young, D.         .294  .333  .429
Francisco, B.     .269  .329  .430
Guillen, J.       .268  .318  .440
Guillen, C.       .290  .365  .457
Poz: David DeJesus moves from center to left, and he moves from first to third in the lineup. I wonder how he handles all that mentally. One baseball executive told me that Carlos Guillen is absolutely his favorite player in baseball because he will play anywhere, do anything you ask, and he's a pro. I like Guillen too – but that seems an odd “favorite player in baseball” choice.
Jeremy: The trade for Carlos Quentin was a great move last year, while Delmon Young and Jose Guillen were terrible acquisitions, and that’s not really hindsight. Most people’s verdicts on those moves were similar at the time those moves were made. Francisco might just be a place-holder for prospect Matt LaPorta. Once LaPorta comes up, Francisco could be relegated to being his caddy.
Sully: Carlos Guillen is my favorite converted shortstop playing left field in the AL Central.
Center Field
                   AVG   OBP   SLG
Wise, D.          .252  .303  .424
Gomez, C.         .279  .305  .368
Sizemore, G.      .279  .376  .496
Crisp, C.         .270  .331  .392
Granderson, C.    .280  .354  .488
Poz: The Grady Sizemore vs. Curtis Granderson argument is probably the most compelling and fun question in the division. Sizemore hits lefties better and walks a touch more which gives him a slight lead, but Curtis Granderson is probably MY favorite player in baseball, and not just because he's my Facebook friend.
Jeremy: Ground will be covered. Coco Crisp and Gomez are all glove no bat, but what gloves they are. Sizemore’s and Granderson’s careers to date have practically mirrored each other. Granderson is coming off an uncharacteristically poor year in the field, according to the advanced metrics. Sizemore is somehow heading into just his age 26 season and is my choice for MVP.
Sully: Gomez is so darn good with the glove that he does not need to develop quite as much as one might think in order to push Sizemore and Granderson. I would love to see what a .300/.325/.400 Gomez looks like in terms of value.
Right Field
                   AVG   OBP   SLG
Dye, J.           .273  .334  .500
Span, D.          .278  .350  .387
Choo, S.          .283  .363  .457
DeJesus, D.       .283  .355  .417
Ordonez, M.       .310  .372  .494
Poz: I remain in awe of Magglio Ordonez's comeback. He and Mike Sweeney seemed to be virtually identical hitters for a while there; but Magglio has had a great second act. I'm no Jose Guillen fan, but I do admit to getting great enjoyment out of watching him uncork throws. His arm is preposterously strong and preposterously erratic which provides many fun moments.
Jeremy: Denard Span was phenomenal once he earned his starting job in July. Shin-Soo Choo has been receiving his share of hype, and rightfully so after a .309/.397/.549 campaign. I could see Span and Choo supplanting Jermaine Dye and Ordonez as the class of the division as age takes its appropriate course.
Sully: I was a year early on Choo last season but I am eager to see what he can do in 2009. He's under the radar, but the type of guy that could tip the balance of power in the division if he replicates his production from last season.
Designated Hitter
                   AVG   OBP   SLG
Thome, J.         .251  .373  .498
Kubel, J.         .273  .335  .461
Hafner, T.        .264  .376  .479
Butler, B.        .287  .348  .443
Sheffield, G.     .246  .345  .422
Poz: I look for Butler to have his breakthrough season, and I look for Travis Hafner to continue his struggles. But, like always, I could be wrong.
Jeremy: Jim Thome seems ageless for a player with “old-player skills.” I’d say he currently ranks behind only Ryan Howard in opposite-field power. I wonder if he makes his way into the Hall of Fame. Gary Sheffield and Hafner appear to be over the hill, but inversely Butler is the first up-and-coming DH we’ve seen in several years.
Sully: Whatever chances you think the Tigers might have this season, it's hard to imagine Sheffield won't sink them. He's terrible now, totally unacceptable as a DH and he can't play in the field. And when Jim Leyland goes to replace him, how do you think he will take that?
Starting Pitching
                 K/9   BB/9   WHIP    ERA
Buehrle, M.     5.38   2.20   1.35   4.25
Danks, J.       7.58   3.05   1.34   4.15
Floyd, G.       6.32   3.40   1.42   4.63
Richard, C.     5.11   2.93   1.47   4.85
Colon, B.       5.99   2.59   1.43   4.85
                 K/9   BB/9   WHIP   ERA
Baker, S.       6.95   2.15   1.28   4.08
Liriano, F.     8.32   3.23   1.30   3.87
Slowey, K.      6.84   1.67   1.20   3.87
Blackburn, N.   4.72   2.01   1.37   4.46
Perkins, G.     5.71   3.16   1.48   4.98
                 K/9   BB/9   WHIP   ERA
Lee, C.         6.58   2.08   1.25   3.76
Carmona, F.     5.44   3.59   1.42   4.15
Sowers, J.      4.81   2.78   1.43   4.68
Pavano, C.      5.35   2.76   1.43   4.82
Reyes, A.       6.46   3.14   1.37   4.45
                 K/9   BB/9   WHIP   ERA
Meche, G.       7.14   3.20   1.37   4.13
Greinke, Z.     7.66   2.60   1.30   4.01
Bannister, B.   5.35   2.86   1.42   4.79
Davies, K.      6.03   3.99   1.56   5.15
Hochevar, L.    5.67   3.27   1.47   5.00
                 K/9   BB/9   WHIP   ERA
Verlander, J.   7.38   3.40   1.33   4.03
Bonderman, J.   7.25   3.09   1.37   4.27
Jackson, E.     6.03   3.89   1.53   4.94
Galarraga, A.   6.46   3.34   1.36   4.37
Miner, A.       5.66   3.70   1.45   4.30
Poz: Everyone seems to be looking for that third starter. I like Kyle Davies a lot to fill that role in Kansas City; dominant in September and has looked great all spring. If he's figured it out, I think Royals could have best 1-3 in the division. Twins have best 1-5. I don't know what to think about the Indians rotation. Cliff Lee figures to come down, and the league may have figured out Fausto Carmona.
Jeremy: I think each team has a solid ace in Lee, Zach Greinke, Justin Verlander, Francisco Liriano, and John Danks. The Twins have the best No. 2 in Kevin Slowey. He boasted the lowest walk rate among starters, and probably has more upside than Gil Meche. Carmona is a wild card. The only differences I see in the pitch f/x data from his great 2007 to his ghastly 2008 were in his use of the change/splitter against righties in 2007, and lack thereof in 2008. But it looks like the velocity, movement, and release point were more or less consistent both years, though fangraphs' data shows his velocity has been on a bit of a downward trend.
Sully: As a whole, I like Minnesota's staff more than most. It's like they have five solid 2-3 guys to run out there with some pretty decent depth in Philip Humber and Craig Breslow to boot. Slowey, Baker and Liriano all have the potential to exceed "solid 2-3" expectations, too.
Bullpen
                 K/9   BB/9   WHIP   ERA
Jenks, B.       7.60   2.80   1.21   3.30
Dotel, O.      10.77   3.79   1.31   4.09
Thornton, M.    9.05   3.57   1.29   3.63
                 K/9   BB/9   WHIP   ERA
Nathan, J.      9.86   2.61   1.07   2.51
Crain, J.       6.71   3.08   1.34   4.00
Mijares, J.     7.08   4.86   1.54   5.08
                 K/9   BB/9   WHIP   ERA
Wood, K.        9.62   3.45   1.23   3.39
Lewis, J.       7.92   3.60   1.36   3.99
Betancourt, R.  8.16   2.48   1.21   3.64
                 K/9   BB/9   WHIP   ERA
Soria, J.       9.16   2.61   1.07   2.57
Farnsworth, K.  8.46   3.82   1.44   4.60
Cruz, J.       10.52   4.59   1.33   3.51
                 K/9   BB/9   WHIP   ERA
Zumaya, J.      8.91   5.13   1.42   3.72
Rodney, F.      9.05   4.92   1.44   4.11
Lyon, B.        5.86   2.52   1.35   3.99
Poz: Lots of strikeouts in that Kansas City bullpen. I'm hoping for Joel Zumaya to make a full return; he's just fun to watch. Lots of pressure on Kerry Wood in Cleveland.
Jeremy: Zumaya still has the fastest pitch on record at 104 miles per hour, and has averaged between 97 and 99 each season. It would be a shame if his arm were to fall off before he managed another full season. Juan Cruz to Joakim Soria might be the best finishing duo today. The Indians look like they have the best overall bullpen.
Sully: Kansas City and Minnesota feature top-heavy bullpens but give me Cleveland's top to bottom.
Bench
Poz: Does bench even matter anymore with teams consistently going with 12 pitchers? Royals have Willie Bloomquist, who will either be a big help off the bench or a huge liability in the lineup. I'm an unabashed Gardy fan, and I love the way he uses the Twins bench.
Jeremy: Michael Cuddyer and Dave Dellucci are capable as fourth outfielders. Gordon Beckham of the Sox can probably be as productive as either Chris Getz or Ramirez up the middle.
Sully: With Delluci and Ryan Garko in the mix, I like the Tribe's depth.
Who are the awards candidates from the AL Central?
Poz: MVP: Sizemore, Granderson, Miguel Cabrera, Joe Mauer, Justin Morneau.
Morneau is always a candidate. I have two Tigers here though I think the Tigers will be lousy. It's a defense mechanism: If the Tigers do surprise, they will be the MVP reasons why.
Cy Young: Lee, Zack Greinke, Soria, Joe Nathan, Verlander.
I have a feeling about Greinke. I don't think Lee will have anything close to the same year, but he deserves to be on the list just for last season. Does Verlander bounce back?
Jeremy: MVP: Sizemore, Mauer
CYA: Lee, Greinke
ROY: Beckham, LaPorta
Sully: You guys covered them right there, I would say.
Any surprises this year?
Poz: I'm torn. Every year I pick the Royals to be my biggest surprise. But it could be the Detroit Tigers. Maybe this is the year that offense unloads.
Jeremy: I don’t think the White Sox will contend again unless Kenny Williams pulls off a few more trades. Maybe this is the year Ozzie Guillen gets the ax. I think Lee repeats as a top starter in the AL, which might go against the grain. He’s really good.
Sully: I think Paul Konerko will have a big bounce-back year. He's only 33 and remember, he hit .291/.372/.540 from 2004-2006. His batting average fell off a cliff in 2007 and in 2008 he battled injuries. This spring he is hitting .378/.417/.689 with four home runs.
Predictions?
Poz:
1. Cleveland Indians
2. Minnesota Twins
3. Kansas City Royals
4. Chicago White Sox
5. Detroit Tigers
I don't think there's much gap at all between 1-5. The Indians, the more I look at them, seem like a very flawed team. The Twins are just the Twins and with Mauer/Morneau/Gardy and a pitching staff that doesn't walk anybody they will probably be there. I have to pick the Royals as a contender – it's part of the job. I think the White Sox and Tigers are both very flawed, but the Sox won the division last year and the Tigers could score a lot of runs. Frankly, I have no idea.
Jeremy:
Cleveland Indians: 87-75
Minnesota Twins: 82-80
Detroit Tigers: 82-80
Kansas City Royals: 75-87
Chicago White Sox: 74-88
But I'll be pulling for the Royals for Joe's sake.
Sully:
1. Minnesota Twins
2. Cleveland Indians
3. Kansas City Royals
4. Detroit Tigers
5. Chicago White Sox
Mauer, Morneau and a consistent run prevention unit lead Minnesota to the division crown.
--------------
Thank you, Jeremy and thanks especially to Joe Posnanski. We will wrap the next two Fridays with the NL and AL West.
| Designated Hitter | March 19, 2009 |
Unicycles and Delusion
One option would be to stay away from the games, to stop caring altogether. Another would be to wallow in the hangover of 99 losses and declare all decisions a disaster before they are even conceived, let alone executed. The more radical among you might prefer simply to enjoy a fine day at the ballpark and the respite it brings from more mundane concerns.
Losing sucks, but it beats going to work.
Enough with the pep talk. What's actually happening with the Padres?
There is a theory, backed by data, that Petco Park significantly benefits pitchers. There is another theory that every theory breaks at some point. Well, maybe; I just made that up. The important point is that the current staff is going to crank every faucet in the house at the same time and see if the pipes hold. But it won't be a one-time test; it'll be a way of life.
If you like offense, you go to Coors Field. If you like pitching, you go to Petco Park. If you can't figure out what the heck you like, try watching the Padres this year. Ask yourself exciting philosophical questions such as, "How bad can a pitcher be and still derive benefits from that ballpark?" Perhaps the environment -- when inhabited by the likes of Cha Seung Baek, Kevin Correia, and Josh Geer -- will collapse. It could be that both Petco Park and the rotation will be annihilated when they collide. I'm not saying it's likely, but you have been warned.
Silk Print Shirts and Bowlers
On the bright side, Jake Peavy and Chris Young are still here for now. Peavy is very outspoken and Young is very tall. If baseball doesn't work out for them, they would make a great comedy team. I have visions of Peavy cracking wise and Young playing the straight man. Maybe they could solve murder cases together and have a boss who can't abide by Peavy's behavior but who can't afford to part with him either. Peavy would wear silk print shirts and Young would don a bowler. Wackiness would ensue, probably over some minute misunderstanding.
Meanwhile, the bullpen is going to get a lot of work. That is thrilling if your name is Chris Britton or Mark Worrell, and you've always wanted to pitch in the big leagues. It is thrilling also if you are a fan. I am obligated here to mention that an old definition of "thrill" is "To perforate by a pointed instrument; to bore; to transfix; to drill."
I didn't say it would be fun. I said it would be thrilling.
Amusingly, and a point that is missed by many, the strength of this team will continue to be the offense. It will be disguised by Petco Park, of course, but Brian Giles will get on base, Adrian Gonzalez will mash, and Chase Headley will have worked through his awkward phase -- at the plate, at least; defense is a different story. Pray for everyone's health when the ball is hit his way. It may not help, but at least you'll feel proactive.
Like a Slow Corey Patterson
Kevin Kouzmanoff puts another theory to the test. Seven men have struck out 130 times or more in a season while drawing 25 walks or fewer (arbitrary points, but you get the idea):
Bo Jackson, 1988, age 25: .246/.287/.472, 25 BB, 146 SO
Cory Snyder, 1989, age 23: .215/.251/.360, 23 BB, 134 SO
Alfonso Soriano, 2002, age 23: .300/.332/.547, 23 BB, 157 SO
Corey Patterson, 2002, age 22: .253/.284/.392, 19 BB, 142 SO
Jeff Francouer, 2006, age 22: .260/.293/.449, 23 BB, 132 SO
Kevin Kouzmanoff, 2008, age 26: .260/.299/.433, 23 BB, 139 SO
Carlos Gomez, 2008, age 22: .258/.296/.360, 25 BB, 142 SO
We can learn two things from this: First, do not name your kid Cor(e)y. Second, it's easier to get away with these things if you have football in your hip pocket as a backup plan. Sorry, did I say hip? My bad.
Oh, you were looking for a useful lesson. Okay, here's one: If you are not Alfonso Soriano, don't attempt this strategy.
The stupid part is I actually think Kouzmanoff can hit. But that's just from watching him; the numbers make my head explode. It's like the tired old saw, "I need that like I need a slow Corey Patterson." And if that isn't a tired old saw, it should be.
Irresistably Immovable
The shenanigans aren't limited to on-field activities either. Matt Vasgersian hopped in his El Camino of the Imagination (with apologies to Carl Sagan and anyone who lives in Missouri) and schlepped off to Jersey to do the MLB Network thing.
Ownership is changing hands as we speak. John Moores, who once rescued San Diego from Roseanne Barr's former boss, is now being rescued by Manny Ramirez's former agent. As they say, the dreams in which I'm dying are the best I've ever had.
Payroll isn't expected to change. Neither is fan cynicism or disinterest. Weather will continue to be numbingly benign, and most of us will have our health. One hundred losses is a possibility, as is a World Championship. Other possibilities include, but are not limited to:
- Completing a triathlon
- Winning the lottery
- Flying to the moon
- Getting trapped in an oil painting
Be ready. Lack of preparation is not an excuse.
Still, I find the irresistible/immovable nature of this year's pitching staff at Petco Park... irresistible. Hey, we all have our perversions -- some are more interesting than others.
I want to see how far a Geer fastball will travel in that ballpark. I want to watch Headley ride around on his unicycle in left field. I want to bask in the glow of my own delusion.
I want to hang out and enjoy the games, no matter how hard anyone tries to kill my buzz with their so-called "reality." Is that so much to ask? Well, is it?
Geoff Young covers the San Diego Padres at Ducksnorts, and is a regular contributor to Baseball Daily Digest and Hardball Times. He has written three books about the Padres, the most recent being the Ducksnorts 2009 Baseball Annual, published in March 2009. Geoff lives in San Diego with his wife and two dogs.
| Touching Bases | March 18, 2009 |
The UZR Era
"The interesting question is why defense is so much more difficult to quantify than offense in all sports. Perhaps defense by its nature involves more interaction between individuals than individual actions, and perhaps the way to get past that is to embrace the concept and measure combinations of players." -- Bill James
Over the offseason, fangraphs unveiled Ultimate Zone Rating, a defensive metric developed by Mitchel Lichtman that measures how efficient a fielder is at turning balls in his area of responsibility into outs. The data, tracked by Baseball Info Solutions, ranges back to 2002 and is converted neatly into a runs saved figure. I’d like to give an overview of some notable teams and players throughout the years UZR has been available. As defense is a team effort, here’s a visual representation of how each team’s outfield has performed during the UZR era. The best outfield defenses, that convert balls in play into outs at a high rate and limit advancement of baserunners with their arms, will be in the top right, while the worst will be in the bottom left.
ARM rating is uncorrelated with an outfielder's range, though the measures are not independent, since the amount of time it takes a fielder to reach the ball affects how he is able to hold baserunners. The value of outfield arms, which is usually not mentioned when evaluating team defense, can add or subtract 20 runs a year, so it’s definitely significant. However, to find an outfield’s true talent when it comes to arms, any figures would probably have to be heavily regressed.
The 2004-2007 Braves consistently had the best outfield in the Majors. With Andruw Jones patrolling center, the Braves were set at the second most influential defensive position on the diamond when it comes to fielding.* Jones was flanked in left by the likes of Ryan Langerhans, Matt Diaz, and Willie Harris, who all had great range. And in right, the Braves trotted out stalwart Jeff Francoeur and his rocket arm. Meanwhile, the Yankees from 2002-2006 consistently fielded the worst outfield in the Majors.
*The traditional defensive spectrum is well-known, but for reference—shortstops and center fielders are expected to make just over 2.5 outs per nine by UZR, followed by second basemen. Right fielders and third baseman come in at two expected outs per nine and left fielders a bit less. The fact that right fielders are expected to make more outs than left fielders goes against traditional baseball knowledge, which I believe states that fielders with more range should play left. Batters tend to hit more fly balls to the opposite field than to the pull field, and righties bat more than lefties, so this makes sense. Perhaps if there's a defensive whiz in right, say Ichiro Suzuki or Jayson Werth, they should switch fields if at the same time there's an albatross in left, say Raul Ibanez, depending on batter handedness and spray-chart information. Finally, first basemen come in at about one expected out per nine, though that of course does not account for throws first basemen handle.*
The Nationals/Expos franchise has put up the best ARM rating in the UZR era. In each of the final three years of their existence, the Expos' outfield led the league in ARM thanks to Vladimir Guerrero, Juan Rivera, Endy Chavez, and Brad Wilkerson. Of course, only Chavez had any range, so their defense as a whole trended around average. The collective outfield arms of the 2003 Detroit Tigers, the worst team ever (?), cost the team 20 runs, one of the worst marks on record. However, that number doesn’t really stand out among that team’s .300 on-base percentage, and 1.37 strikeout-to-walk ratio. What's the opposite of nitpicking?
The Rays' worst-to-first success has been fairly well documented. Their biggest improvement may have been their outfield defense, which saved nearly 70 runs more in 2008 than it did in 2007—the largest improvement by any outfield in the UZR era. B.J. Upton and Carl Crawford's numbers skyrocketed while Eric Hinske and Gabe Gross were great replacements for Delmon Young. and Jonny Gomes. Considering left and right fielders have remained constant for the Rays both years, I wonder to what extent the difference can be attributed to individual improvements from Upton and Crawford, and how much of the success was thanks to the unit meshing together in terms of positioning. The Rays went on to the World Series, where they met the Phillies, who incidentally posted the exact same 74.3 team UZR. The Phillies were aided by their ARM rating of 22.1, the highest single-season mark to date. Pat Burrell was the only bad defender on the team, but his arm almost made made up for what he lacked in range, while Shane Victorino and Jayson Werth are stellar all-around players.
Now let's take a look at the infield.
Though the Rays improved their infield by 50 runs in UZR from 2007-2008, the second biggest year-to-year leap by an infield, they trailed well behind the 2006 Kansas City Royals. In 2005, the Royals infield was 47 runs below average. In 2006, they were 32 runs above average. Nevertheless, the pitching staff still allowed more runs in '06 than in '05! In 2006, KC’s 5.29 FIP was the highest single season mark of any club ridiculous run environments seen in 2000. But their defense did make a marked improvement. The Royals saved over 110 total runs on defense in 2006 compared to 2005, thanks to the additions of Mark Grudzielanek, Doug Mientkiewicz, and Reggie Sanders. The following year, 2007, the Royals 78.5 UZR in was the highest single-season total for any team since 2002. Mark Teahen was terrible in 2005, but he found his footing on both ends of the field in 2006, posting an average UZR and an .874 OPS. Then in 2007, he put together another solid year, losing production with the bat but gaining ground with the glove in his move to right field. Unfortunately, it all fell apart for him last year, and now we’ll see how he does at second base. Also in 2007, Tony Pena actually merited playing time, finishing second in UZR for shortstops behind only Omar Vizquel.
Remember that All-Star studded Rangers infield of Hank Blalock, Michael Young, Alfonso Soriano, and Mark Teixeira? It turns out they gave away a whole lot of their value on defense. In 2005, the Rangers infield had a UZR of -62.4, the worst ever. The 2007 Giants had the best infield on record. In the same vein, the Athletics infield last year had the highest double play run total though it's a matter of only a dozen or so runs. Lastly, The Phillies have had the best infield defense in the last seven years, while the Rangers and Yankees have been worst.
The 2008 Phillies infield defense has been the topic of some discussion. Ryan Howard was so bad that the entire defense shifted to cover him, maximizing the range of Chase Utley, Jimmy Rollins, and Pedro Feliz.. The Phils' infield saved 40 runs last year, an excellent figure, no matter how you slice it. To actually isolate Utley from Howard, it would probably be best to use a "With or Without You" analysis, comparing Utley's performance with Howard on the field against his performance with other first basemen, though the sample would be impossibly small.
I am forever on a quest to find why teams or players are "clutch," and out-perfrom their expectations in high-leverage situations. I constantly correlate variables with fangraphs' clutch score, and I have so far found very weak correlations with strikeout rate and baserunning on offense, meaning teams that run the bases well and rarely strike out for some reason do better in more important situations. Now, with fielding, I found a weak correlation between clutch and double play runs. I suspect some teams are adept at employing relievers who specialize in inducing groundballs at opportune times, and therefore leverage their double play runs. It's also possible that some teams are able to effectively manage the intentional walk to their advantage late in games, setting up the double play.
I think splitting up defenses into infield and outfield units is a comprehensive method for evaluating team defenses, but it's often more interesting to look at individual players, so I'll leave you with the time leaders and laggards in UZR for all seasons from 2002-2008.
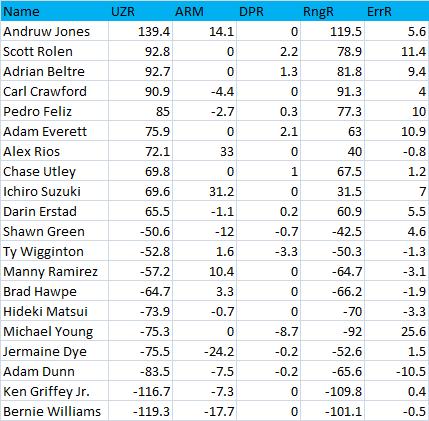
Andruw Jones has by far the highest career UZR. By Sean Smith’s Wins Above Replacement leaderboard, Jones is 77th in WAR, making him a borderline Hall of Fame candidate. Any sort of resurgence would make him a near lock, but it’s currently looking bleak as is.
Arms are an area of study that have belonged to John Walsh, but UZR's ARM metric shows similar results, and confirms many players' reputations. Alex Rios has paced the league in ARM runs, while Ichiro and Francoeur trail slightly. In 2007, Francoeur's arm was the most valuable of any outfielder during the UZR era. On the other end, Juan Pierre's arm has been laughably bad, coming in nearly 20 runs worse than anyone else's over the years.
Jack Wilson was slickest at turning the double play in the UZR era, and he certainly does make it look pretty, if I do say so myself.
Finally, the Yankees. Bernie Williams and Hideki Matsui show up on the bottom ten list, and Derek Jeter, Gary Sheffield, Bobby Abreu, Jason Giambi and Johnny Damon also show up in the bottom 10th percentile, so yeah, the Yankees haven't valued defense highly.
| F/X Visualizations | March 17, 2009 |
Home Run Rate by Pitch Location
So far I have looked at the run value of a pitch based on its location as it passes the batter's plane. Today I am going to take a slightly prosaic break from that and look at everyone's favorite contributor to run value: the home run. Below are maps of HR rate per pitch by pitch location. Again I average over pitch type, count and speed, so there are some obvious limitations to the analysis. The number presented at the top of each figure is the average HR rate per pitch.


These figures confirm a number of assumptions:
- The highest home run rate is slightly in from the center of the strike zone.
- The extreme inside of the strike zone has a higher home run rate than the extreme outside.
- The home run rate is higher above the strike zone than it is below.
- The home run rate location is determined by the handedness of the batter and not the pitcher (the images are more similar going across a row than they are going down a column).
- There is a considerable area down-and-away within the strike zone that has a near-zero home run rate.
- There is a relatively large region in which the HR rate per pitch is over 2.5%, which seems high to me. For pitchers, this reinforces the importance of being able to locate a pitch in a corner of the zone.

Since the batter's handedness is more important than the pitcher's I averaged across the rows above to create just two maps, one for RHBs and one for LHBs. Over the composite map I plotted all the home runs for an individual hitter to see how he compares to his peers. Here are the HRs of everyone's favorite HR hitter, Jack Cust, plotted over the composite LHB map. Cust's home runs are, for the most part, where you expect for a left-handed batter: the highest density slightly in from the center of the zone, none in the down and away corner of the zone and more above the zone than below.

I made such images for a number of last year's top HR hitters and most resemble Cust's with the given player's HRs largely mapping to the regions of high home run rate in the composite map. But a handful of batters had quite different maps. Carlos Quentin's HRs are overwhelmingly away and down in the zone, and a large portion of the inside of the strike zone, where the average right handed batter has a high HR rate, is completely devoid of HRs. Since this is aggregated for all pitch types our insight is limited here. It will be interesting to see if players with HR maps very different from the composite map tend to also have a skewed distribution of which pitch types their HRs come from compared to average.
Here are two other batters I thought were particularly interesting. Alfonso Soriano is almost a caricature of a right-handed batter with his highest HR rate region even more down and in than expected. Carlos Pena, on the other hand, mashes outside pitching and the inside half of the zone has surprisingly few HRs. A possible explanation for this pattern could be that Pena just gets very few inside pitches because pitchers know he is a dangerous HR hitter. This shows one problem with my analysis. I am comparing the composite HR rate to a player's raw HRs not adjusted for the number of pitches a player sees in that region. I should be comparing that player's HR rate to the composite rate. For two reasons I did not do this: (1) I am having a hard time creating rate maps for individual players based on so few HRs and (2) even if I had such a map I cannot think of an effective way to overlay the two rate maps (individual player and composite) as nicely as I can overlay the actual HRs on the composite rate map. But it is something I am going to think about and work on in the future.


Oh and I have to assume the home run in Pena's map around (2,4.5) is a mistake.
| F/X Visualizations | March 16, 2009 |
Run Value by Pitch Type and Location
In my first post, I noted Tango and Lichtman's comment that run value by pitch location analysis was limited when averaged across pitch types and pitch counts. In this post, I will address the first concern by looking at the run value by pitch location of the different pitch types separately (but again averaging across count).
I split the data by handedness of the batter and the pitcher and then split this information into four different pitch types (based on the pitch fx classification). As in the first post, all images are from the catcher's perspective so that a right-handed batter stands to the left of the strike zone and a left-handed batter stands to the right of the strike zone. At the top of each image is the proportion of pitches between the given handedness combination made up of the given pitch type (out of the four pitch types considered). Counting just these four pitch types, 60.9% of pitches from a right-handed pitcher to a right-handed batter are fast balls.

Of the pitches considered, fast balls made up over 60% of pitches in each handedness combination. Thus, the overall run value maps in the first post are largely reflecting the run values for fast balls. But there are some small differences:
- In the overall maps, there was no region inside the strike zone with the deep blue >.04 run value. But, for fast balls, a bottom corner in each image has >.04 run value. I wonder if fast balls in this region of the strike zone are less likely to be called as strikes than other pitches.
- The region of negative to neutral run valued pitches directly above the center of the zone is even more pronounced for fastballs. The region of deep red <-.04 run valued pitches above the top of the strike zone is larger than the corresponding region in the overall map.
- The region of negative to neutral run valued pitches below the zone is much smaller than in the overall map and extends below just one side of the zone. The side to which it extends is determined by the pitcher's handedness not the batter's. In the overall map, this region extended below the entire strike zone not just one side.
- Fast balls are thrown in roughly the same proportion in all handedness combinations.
Changeups are overwhelmingly thrown when the pitcher is of the opposite handedness of the batter. Additionally, the few times when changeups are thrown when the pitcher and batter have the same handedness may be a highly non-random sample: pitchers with outstanding changeups and good pitcher's counts (this is just speculation). Because of this and the small data size we should not read too much into the same-handedness changeup maps.
- In opposite handedness at-bats the changeup has a large region of negative to neutral run valued pitches low and away extending far outside the strike zone.
Curves are thrown in relatively constant proportion in all handedness combinations, expect for leftie/leftie where they are thrown a little bit more.
- Compared to overall, the negative to neutral region for curves is much larger extending down and away predominately.
- With fewer curves thrown, it is hard to get as good resolution, but it seems that compared to other pitches there is less discernible structure within the strike zone (i.e. there are not as clear large regions of very low run value separated by large regions of larger run value).
Sliders are thrown more when the batter and pitcher have the same handedness (the opposite of changeups), thus the same caveats apply to reading too much into the opposite-handedness maps.
- A very large region of negative to neutral pitches extends below and away out of the strike zone.
- Sliders up and in have a higher run value compared to overall pitches up and in.
These separated by pitch type maps allow us to make some additional insights into the overall maps in the first post. The negative to neutral region above the strike zone is mostly the result of fastballs, while the negative to neutral region below the strike zone is mostly the result of non-fastball pitches. Within the strike zone, most pitches have the same overall structure with the center of the zone and down and in having the highest run value, although the pattern is not quite as apparent with curveballs.
| F/X Visualizations | March 16, 2009 |
Run Value by Pitch Location
[Editor's note: Dave Allen has agreed to join Baseball Analysts. He is a graduate student whose research involves analysis of spatial data and spatially explicit modeling. He also loves baseball. Dave will combine these two interests in the F/X Visualizations series.]
A lot of interesting new sabremeteric work has become possible over the past two years with the availability of the pitch fx data. In this new blog entry, I will continue this analysis and present the results in a simple, yet hopefully effective, visual manner.
This first post builds on work that Joe Sheehan did a year ago looking at the run value of each pitch based on its location. He placed each pitch into one of 25 bins and calculated the average run value in each bin. In the post he suggested that it would be interesting to get rid of the bins and take a continuous approach. A year later, it seems no one has accomplished that so I thought it would be a good way to launch my work.
Using the first table in this post, I assigned a run value to every pitch in the pitch fx database, not just pitches that ended an at-bat, and then averaged the run value of all the pitches in each location. I split the data up by handedness of the pitcher and batter. The number in parentheses is the average run value for all pitches regardless of location. The images are from the catcher's perspective so that a right-handed batter stands to the left of the strike zone and a left-handed batter stands to the right of the strike zone.

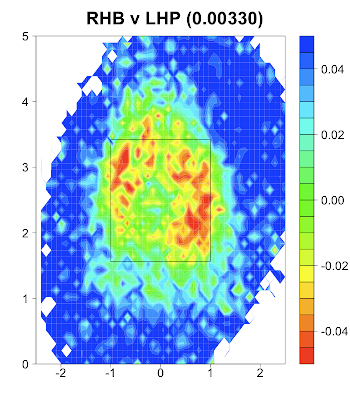

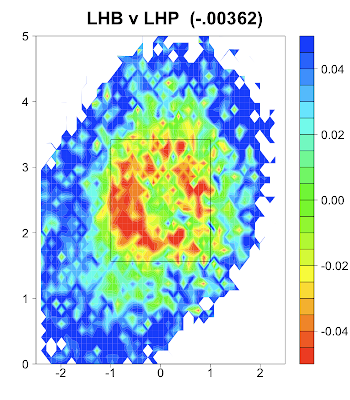
This method reproduces some of Sheehan's results:
- Pitches outside the strike zone have a higher run value than those inside the strike zone.
- Pitches down the middle of the zone have the highest run value of pitches in the strike zone.
- Inside pitches have higher run values than outside pitches.
- Pitches down and in have higher run values than those that are up and in.
This continuous approach also gives some additional insights beyond Sheehan's:
- Of outside pitches, those high in the zone have a slightly higher run value than those down in the zone. This is interesting as it seems hitters prefer inside pitches down in the zone and outside pitches up in the zone.
- The area of negative to zero to just slightly positive run value pitches (the red, yellow and green colored area) extends well beyond the defined strike zone.
- This zone of negative to zero valued pitches extends far above the strike zone peaking at x=0 over a foot above the top of the strike zone.
Tango and Lichtman made some important comments on the limitations of Sheehan's original work without splitting the data by swing/taken or pitch type. These critiques apply equally, if not more so, here because I did not split the data by count as Sheehan did.
I hope to address these points in future posts. For example, I assume the peak of negative to zero valued pitches a foot above the center of the zone is mostly the result of 'high heat' fastballs in pitcher's counts. By analyzing the run value of pitch locations for just fast balls in specific counts, I will be able to confirm or deny this assumption.
| Change-Up | March 13, 2009 |
NL Central Preview
With the AL and NL East behind us, we now turn our attention to the NL Central. Here's a reminder of how we are breaking this down.
Here’s the deal. For hitters we take PECOTA and the four projection systems on Fangraphs. Fangraphs, by the way, is awesome. They are doing terrific, differentiated, value-add work and if you are a regular reader of Baseball Prospectus and/or The Hardball Times, you should add Fangraphs to your favorites as well. Anyway, we average all five of these projection systems to give you a sense for how the number crunchers see the players performing this season.For pitchers, in the interest of keeping things simple and consistent, we go with the three projection systems readily available on the Fangraphs player pages. No PECOTA because the data presentation was not as compatible with the numbers we wanted to display.
We went with depth charts from ESPN.com. Some of the players penciled in below will not be starting, and some might not break camp. But we figured this was a pretty good way to go. As we draw closer to Opening Day with the other divisions, we will look to implement as accurate of an indication as possible with regard to who figures to start at each position.
We are changing three things this time.
1) Fangraphs has added Dan Szymborski's ZiPS projections, so we replace PECOTA with ZiPS. We are now simply averaging all available projections on the Fangraphs player pages.
2) We couldn't nail down a member of the mainstream media for this edition, so today you have staffers Rich Lederer, Jeremy Greenhouse and myself.
3) I took out W-L projections for starting pitchers because I do not think they are all that useful.
Without further ado...
Catcher
                 AVG   OBP   SLG
Soto, G.        .285  .361  .486
Kendall, J.     .259  .333  .330
Quintero, H.    .249  .291  .356
Molina, Y.      .271  .327  .375
Hernandez, R.   .261  .324  .419
Doumit, R.      .288  .345  .471
Jeremy: Ryan Doumit and Geovany Soto can both mash, but Doumit has problems staying on the field. Soto could be the one to put up the first 30 homerun season from a catcher in five years.
Rich: You got it, Jeremy. Soto is the class of this division but Doumit made lots of noise last year and is no longer flying under the radar.
Sully: Looks like Houston needs Pudge.
First Base
                 AVG   OBP   SLG
Lee, D.         .290  .369  .477
Fielder, P.     .281  .375  .539
Berkman, L.     .292  .398  .528
Pujols, A.      .330  .430  .612
Votto, J.       .289  .363  .496
LaRoche, Ad.    .269  .341  .482
Rich: The NL Central is rich in first basemen, including the best in the biz. If you can avoid drooling, just click on this link and enjoy.
Jeremy: Albert Pujols is the best player in baseball, and last year Lance Berkman was right up there with him. But I wouldn’t be surprised to see Joey Votto overtake Berkman this year. Votto was the second best rookie in the NL behind Soto, and is now entering a peak age 25-26 season. He was also one of three Reds to finish in the top five along with Jay Bruce, and, of course, Edinson Volquez.
Sully: I don't know, Jeremy. I still would have to take Berkman. There really isn't a bad player in the bunch here, though.
Second Base
                 AVG   OBP   SLG
Miles, A.       .285  .329  .367
Weeks, R.       .251  .359  .420
Matsui, K.      .272  .328  .397
Schumaker, S.   .290  .344  .397
Phillips, B.    .267  .317  .439
Sanchez, F.     .289  .329  .405
Jeremy: Yikes. Brandon Phillips is the only above average second baseman in this group. He’s a superb fielder and may be in line for some positive regression after a rather unlucky average on balls in play. Rickie Weeks is an enigma. He has as much potential as anyone, but he has confounded the scouts, and his stats are just as confusing. Last year among batters who qualified for the batting title, his .345 average on groundballs was best and .527 average on line drives in the league. I don’t know what to make of him.
Rich: I would reluctantly go with Phillips here. While he may not "believe that on-base percentage stuff," the free swinger is still better than the competition (although not nearly as much as his counting stats would suggest).
Sully: If Mike Fontenot gets more time than Aaron Miles and comes close to replicating his 2008, then the balance of power at second in the NL Central could look a little different.
Third Base
                 AVG   OBP   SLG
Ramirez, A.     .288  .359  .515
Hall, B.        .248  .316  .435
Blum, G.        .242  .299  .377
Barden, B.      .255  .314  .378
Encarnacion, E. .274  .351  .470
LaRoche, An     .241  .331  .384
Jeremy: I really hope Andy LaRoche pans out for the sake of Neal Huntington. Aramis Ramirez is another solid Cubbie. They have a bunch of All-Stars but no superstars.
Rich: This is the year when we find out if LaRoche is any good. He's 25 years old and has been basically handed the starting job despite an absolutely horrible two months in Pittsburgh (.152/.227/.232). Keep your eye on Neil Walker, a former catcher, if LaRoche fails to deliver the goods.
Sully: Ramirez is clearly the class of the NL Central third basemen. A healthy, productive Troy Glaus could change the dynamics at this position.
Shortstop
                 AVG   OBP   SLG
Theriot, R.     .284  .356  .361
Hardy, J.       .275  .335  .459
Tejada, M.      .291  .338  .441
Greene, K.      .249  .301  .426
Gonzalez, A.    .257  .311  .413
Wilson, J.      .272  .319  .376
Jeremy: J.J. Hardy is a really nice player—perhaps the best on the Brewers. I’m most interested in seeing how Khalil Greene does this year outside of Petco. Greene couldn’t do a thing right last year, but if he reverts back to 2007 form, he could be a really nice pickup for the Cards. Per Hit Tracker Online, Greene’s average standard distance on homeruns over the last three years been 382.9, 402.7, and 385.8 respectively. Was 2007 an anomaly?
Rich: Not a lot to pick from here but Greene could be the sleeper. He has spent virtually his entire career playing home games at Petco Park but will call Busch Stadium III home this year. His OPS has been 22 percent higher on the road (.802) than at home (.658). If healthy, Greene could hit 20-25 home runs and his team-dependent stats will benefit by being surrounded by a better lineup in St. Louis than San Diego.
Sully: Quietly, Ryan Theriot had an excellent 2008. If he's the worst player in the lineup, it's in all likelihood going to be on a good team.
Left Field
                 AVG   OBP   SLG
Soriano, A.     .277  .333  .518
Braun, R.       .299  .352  .579
Lee, C.         .293  .350  .515
Rasmus, C.      .244  .325  .412
Hopper, N.      .288  .338  .355
Morgan, N.      .277  .330  .362
Jeremy: Alfonso Soriano and Ryan Braun are actually somewhat similar players. They started out as atrocious infielders but gained a great amount of value when they moved to left. They’re both power/speed threats. And out of all left-fielders, they ranked 2nd and 3rd in swing rate on pitches outside the strike zone, behind the hacktastic Delmon Young.
Rich: Kudos to the Brewers for moving Braun off the hot corner last year. He went from being the worst-fielding third baseman in the majors to a decent left fielder with the potential of becoming a plus defensive player due to his athleticism.
Sully: It's the "have's" and the "have not's" for left field in the NL Central. Half the division trots an excellent left fielder out there everyday and half the division will in all likelihood be giving back runs to their opposition in left.
Center Field
                 AVG   OBP   SLG
Johnson, R.     .279  .343  .401
Cameron, M.     .243  .330  .442
Bourn, M.       .248  .314  .336
Ankiel, R.      .260  .322  .492
Taveras, W.     .271  .325  .332
McLouth, N.     .268  .345  .460
Jeremy: The Cardinals have some great upside in each of their outfielders. Colby Rasmus is a top-five prospect, Rick Ankiel has some of the best raw power and one of the best arms in the game, and Ryan Ludwick just demonstrated how awesome he can be if all the pieces fall into place. Of course, it’s doubtful all three of them pan out this year.
Rich: Little-known fact: Ankiel hit .270/.343/.537 with 20 HR in the first half last season. He then suffered an abdominal injury in late July and hit .169/.286/.308 over the next 28 games before being shut down for the remainder of the season in early September.
Sully: I am interested to see how Nate McLouth backs up his breakout 2008. If he can post a .200 (or greater) ISO for the third straight season, he will have another superstar campaign.
Right Field
                 AVG   OBP   SLG
Bradley, M.     .291  .392  .502
Hart, C.        .279  .329  .482
Pence, H.       .287  .339  .493
Ludwick, R.     .275  .347  .517
Bruce, J.       .280  .335  .507
Moss, B.        .263  .327  .434
Rich: Can Milton Bradley stay healthy for a full season? He hasn't played 100 games in the field since 2004. The guy can flat out hit (over .300/.400/.500 in each of the past two years) and, depending on playing time, will either will be an MVP candidate or a bust.
Jeremy: “Well, you can get a healthy guy to go out there and play 162 games, but he won’t do what I did in 120.” – Bradley
Sully: Nicely done, Jeremy.
Starting Pitching
                 K/9   BB/9   WHIP    ERA
Zambrano, C.    7.17   3.89   1.34   3.83
Harden, R.     10.86   3.63   1.15   2.88
Dempster, R.    7.30   3.60   1.31   3.93
Lilly. T.       7.86   3.10   1.28   4.06
Marshall, S.    6.56   3.37   1.37   4.36
                 K/9   BB/9   WHIP    ERA
Gallardo, Y.    8.66   3.46   1.29   3.70
Bush, D.        6.13   2.20   1.27   4.27
Suppan, J.      5.00   3.27   1.52   4.98
Looper, B.      5.09   2.53   1.36   4.44
Parra, M.       7.71   3.86   1.46   4.30
                 K/9   BB/9   WHIP    ERA
Oswalt, R.      6.93   2.16   1.25   3.66
Rodriguez, W.   7.54   3.32   1.39   4.35
Hampton, M.     4.84   3.45   1.50   4.90
Moehler, B.     5.20   2.54   1.45   4.88
Backe, B.       6.29   4.12   1.59   5.47
                 K/9   BB/9   WHIP    ERA
Wainwright, A.  6.34   2.71   1.30   3.73
Pineiro, J.     5.21   2.68   1.45   4.94
Carpenter, C.   6.91   2.41   1.23   3.60
Lohse, K.       5.71   2.58   1.37   4.34
Wellemeyer, T.  6.56   3.73   1.39   4.21
                 K/9   BB/9   WHIP    ERA
Harang, A.      7.79   2.38   1.29   4.20
Volquez, E.     8.94   4.22   1.36   3.85
Arroyo, B.      6.88   2.89   1.37   4.43
Cueto, J.       8.24   3.17   1.34   4.50
Owings, M.      7.04   3.29   1.38   4.61
                 K/9   BB/9   WHIP    ERA
Maholm, P.      6.03   2.98   1.39   4.35
Duke, Z.        4.58   2.45   1.50   4.89
Snell, I.       7.63   3.83   1.50   4.71
Gorzelanny, T.  6.38   3.96   1.46   4.51
Karstens, J.    5.64   2.81   1.40   4.62
Jeremy: The Cubs are on their way to leading the Majors in strikeouts for the ninth straight year, but the Reds might be able to match them K for K. Last year the Reds front four put up an 8.09 K/9 rate while the Cubs managed a 7.91 K/9 rate. Also, Carlos Zambrano and Micah Owings will have an interesting silver slugger race. The skill of hitting for pitchers is entirely undervalued.
Rich: While the Cubs rotation will get most of the attention, it says here that the Reds starting five will be every bit as good after adjusting for ballpark effects (unless Harden is healthy all year).
Sully: Just as compelling as the Cubs/Reds comparison is for best rotation in the division is the 'Stros/Bucs battle for the worst. Boy, do those two rotations look bad?
Bullpen
                 K/9   BB/9   WHIP    ERA
Marmol, C.     10.66   4.43   1.22   3.16
Samardzija, J.  6.37   4.24   1.49   4.57
Gregg, K.       8.06   3.95   1.33   3.81
                 K/9   BB/9   WHIP    ERA
Hoffman, T.     7.76   2.49   1.21   3.71
Villanueva, C.  7.92   3.05   1.29   4.00
Riske, D.       7.28   4.19   1.43   4.21
                 K/9   BB/9   WHIP    ERA
Valverde, J.   10.54   3.34   1.21   3.49
Brocail, D.     6.77   3.13   1.34   4.00
Geary, G.       6.02   3.12   1.34   3.81
                 K/9   BB/9   WHIP    ERA
Motte, J.       8.89   3.37   1.29   3.70
Franklin, R.    5.45   2.93   1.37   4.21
Perez, C.       9.40   5.17   1.42   3.99
                 K/9   BB/9   WHIP    ERA
Crodero, F.     9.93   3.92   1.32   3.55
Weathers, D.    6.09   3.80   1.43   4.18
Bray, B.        9.23   3.72   1.39   4.02
                 K/9   BB/9   WHIP    ERA
Capps, M.       7.03   1.69   1.12   3.33
Grabow, J.      7.65   3.98   1.40   4.09
Yates, T.       8.00   4.66   1.51   4.50
Jeremy: Who’s going to close in St. Louis? Chris Perez and Jason Motte both have similar profiles and it’s always an experience to see how Tony La Russa manages his pen.
Rich: There are some live arms in this division, headed by Carlos Marmol, who has struck out 210 batters while allowing only 81 hits in 156.2 IP over the past two seasons. No, that is not a misprint or a typo. The 26-year-old righthander steps into the closer role for the Cubs with the departure of Kerry Wood. Veteran Kevin Gregg is waiting in the wings if it turns out Marmol is more comfortable pitching the eighth rather than the ninth inning.
Sully: Look at that projected walk rate for Perez! Motte has got to start the year as the Closer in St. Louis.
Bench
Rich: Did anybody outside Cincinnati notice that Chris Dickerson hit .304/.413/.608 last year? He hit home runs, walked, and stole bases. Oh... and he turns 27 in April.
Sully: With Kosuke Fukudome and Miles/Fontenot, I like the Cubs depth.
Who are the awards candidates from the NL Central?
Jeremy:
ROY: Edinson Volquez (Actually, Rasmus.)
CYA: Rich Harden, with requisite disclaimers
MVP: Albert Pujols
Rich: Good one on the Rookie of the Year, Jeremy.
MVP: Let's get real now.
CYA: Harden, but only if he can throw 200 innings for the first time in his career. The only other pitcher I could see winning this award would be Volquez.
ROY: It won't be an Astro. How's that?
Any surprises this year?
Jeremy: I think the Reds and Astros will switch places in the standings.
Rich: The Reds play .500 ball for the first time since Bill Clinton's presidency.
Sully: I am with you guys on the Reds. All they need is a little bounce back from Aaron Harang and Bronson Arroyo along with anticipated developmental strides from their youngsters.
Predictions?
Jeremy:
Cubs: 95-67
Brewers: 86-76
Reds: 83-79
Cardinals: 81-81
Astros: 73-89
Pirates: 66-96
Rich: Chicago wins it in a run, run, runaway. Call it ten games. According to Baseball Prospectus, the Cubs have the easiest-rated schedule in the majors. Milwaukee, St. Louis, and Cincinnati will battle it out for second place. The winner may have an outside shot at a wild card berth although I would be surprised if any of these three teams wins more games than either the Mets or Phillies. Houston barely escapes the cellar, dropping at least a dozen games in the standings year over year. Pittsburgh finishes last for what will be the last time in the next five years.
Sully: I am with you, Rich. I think the Cubs will win their division by a greater margin than any other division winner in 2009.
========
Thanks, guys! AL Central next Friday...
| Change-Up | March 11, 2009 |
Fort Myers 2009
As I mentioned in last week's AL East preview, I spent last weekend in Fort Myers with my buddy Erik. We flew out of JFK last Thursday night and went to the Marlins-Sox game at City of Palms Park on Friday. We also attended the Sox-Rays game in Port Charlotte on Saturday.
Erik and I have been great friends for about 18 years or so. We come from neighboring suburbs of Boston and played basketball and baseball on our respective town teams against each other for a few years before enrolling in The Roxbury Latin School for seventh grade in the fall of 1992. We were then teammates, on every school baseball, basketball and football team we played on for six years. Erik went on to Williams College and played both baseball and football. I went to Penn to try and play baseball but was cut after the fall season my freshman year. Doug Glanville or Mark DeRosa I was not.
We stayed with my cousin Jared. Jared is the Red Sox Coordinator of Professional Scouting and of all the more senior members of the Sox front office, works most closely with former Royals GM Allard Baird. He was kind enough to let us stay with him, to get us great seats for both games and to let us hang around for the weekend with many of his baseball operations colleagues.
Needless to say, Erik and I had a blast. What follows is a series of photos we snapped, with some commentary where I feel like offering it.
==========
Jed Lowrie getting loose before the game.
----------
Josh Beckett started the game for the Sox.
----------
This was a cool match-up to watch. Beckett against the Marlins uber-prospect, Michael Stanton. Stanton is enormous. He could have played baseball and football at USC but instead chose to sign with the Marlins and as an 18-year old in the South Atlantic League, hit .293/.381/.611 (39 home runs) in 2008. Baseball America recently ranked Stanton the number 16 prospect in baseball.
Also, while we moved around a bit, these were our seats for the game. Pretty good.
---------
A few shots of the Marlins on-deck circle with Cameron Maybin warming up and another with Cody Ross walking up to the plate. If the Marlins are to make any noise this season, they will need these two to produce.
----------
This is Adam Mills. I was pumped when I found out Mills would be throwing, since I interviewed and profiled him on this site before the 2007 draft. He struck out two in two perfect innings of work.
----------
A view of City of Palms Park from the right field pavilion.
----------
We liked this guy's jersey.
----------
While Jared was in college, he worked for the Brewster Whitecaps of the Cape Cod League. Taylor Tankersley, then at Alabama, was on his team. Here he is warming up in the visitors' bullpen.
----------
We already talked about the #16 prospect in baseball according to Baseball America. Here is #17, first baseman Lars Anderson.
----------
This is Zach Daeges, a minor league left fielder who hit a line shot for a two-run home run off of Chris Volstad. He's 25 and a fringe prospect but he's a career .314/.415/.504 professional hitter who has not had an on-base below .400 since his freshman year at Creighton.
----------
Erik and I, then Jared and I standing in left field.
----------
After the game, Bill James hung around behind the plate. We had met before at breakfast last spring when Rich and his son Joe came to Boston for a game. He was nice enough to engage in a conversation about the makeup of the Sox team and pose for this picture with me.
----------
This is the view from our seats for the Sox-Rays game on Saturday.
----------
Jacoby Ellsbury getting set to lead off the game.
----------
James Shields was a pleasure to watch from this vantage point. He throws a heavy fastball and his change-up looks unhittable.
----------
Grant Balfour looked pretty good too. All of the scouts' radar guns came out when he took to the hill.
----------
Four friends taking in the game from a center field pavilion high-top table.
----------
Like many other things in Florida, I didn't quite know what to make of this sign.
==========
Spring Training is a great take for any baseball fan. Even though the WBC depleted some of the talent we were able to see on the field, the chance to be up close and personal with so many in and around the game is something that just wouldn't happen once the regular season starts.
We had so much fun last weekend that we've already decided to pencil in a Red Sox Spring Training trip for each year we can possibly do it.
| Touching Bases | March 10, 2009 |
Baserunning and Leverage
Let’s set the scene.
2004 ALCS. Yankees vs. Red Sox. Game 4. Red Sox down a run, Dave Roberts on first, ninth inning, no outs.
Dave Roberts advanced on a stolen base to 2B.
2007 National League one-game playoff. Padres vs. Rockies. 13th inning tie game, Matt Holliday on third, no outs.
Jamey Carroll hit a sacrifice fly to right (Liner). Matt Holliday scored.
That’s how it looks in the box score, but those two baserunning plays might be the two most momentous swings in baseball over the last five years.
Baserunning statistics are rarely looked at, yet the difference between the best and worst individual baserunners is about 20 runs, or two wins. Pretty significant. Players like Holliday, Carlos Beltran and Ichiro Suzuki, and other efficient baserunners become underrated when this skill isn't accounted for. So is baserunning an underrated commodity in the grand scheme of things?
There are several advanced metrics for baserunning, but my choice for this analysis is Bill James Online’s “net gain,” which takes into account “basestealing, avoidance of the double play, and success at taking the extra base while avoiding being thrown out.” I tend to think of four bases as equivalent to about one run, though I could be off base there. Here's the relationship between runs scored and net bases. Each dot represents a team's single season total over the time span 2002-2008.
The r-squared between runs and net bases is .17, so it’s pretty clear that the least important part out of the four facets of the game—hitting, pitching, baserunning, and defense—is baserunning. The difference between the best and worst baserunning teams in the majors is around 50 runs. That can be compared to 125 run swings in fielding, and between 200-300 run differences in pitching and hitting, depending on the year.
As demonstrated by "The Steal" and "The Sac Fly," mentioned at the beginning of this article, baserunning can at times be the make or break factor in any given game. Tom Tango developed, and statistically quantified, the concept of a leverage index to provide context to any game state. Baserunning, defense, hitting, and pitching can all be leveraged, be it through pinch-runners, pinch-hitters, defensive substitutions, or relief pitchers. I’d like to look at whether good baserunning teams also perform better in high-leverage situations. So, using one of my favorite statistics in fangraphs “clutch” score and one of my favorite types of visual presentations in google’s motion chart, I compared a team’s baserunning to its ability to come through when it matters most. Here's a year-by-year graphic of all 14 American League teams' baserunning metrics plotted against their clutch score.
And now the National League:
The correlation coefficient between net baserunning and clutch score is .12, which isn’t significant, but it’s not zero. Furthermore, going from first to third or scoring from first has a bit of a stronger correlation than avoiding the double play and stealing bases. Strikeout percentage has an inverse relationship of similar strength to baserunning, so there are a couple variables that might weakly relate to how well teams can come through when it matters most.
The average American League team is seven bases a year better than National League teams. I still don’t know what a National League style of play means other than inferior baseball. The Phillies have been the best baserunning team over the time frame, but they have been rather unclutch. The Angels rank sixth in baserunning, right behind the Yankees ironically enough, and the Halos have been twice as clutch as any team in the time period. Meanwhile, the Ozzieball White Sox and Bowdenball Nationals lagged in basferunning, while they put up neutral clutch scores.
How about a leaderboard of the most and least clutch teams since 2002?
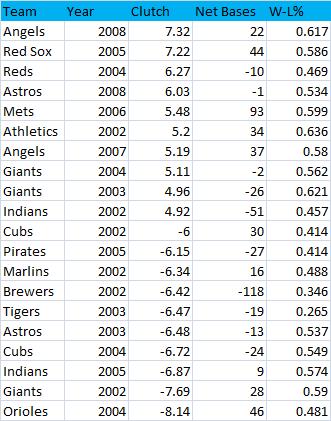
I find the bottom five teams on this list interesting. Well, the Tigers .265 winning percentage is interesting too. But the Astros, Cubs, Indians, and Giants were all quality teams that won in spite of bad luck, unlike the Angels and Red Sox at the top who won because of it. Anyway, it looks like the clutch teams are better baserunners, but barely.
People sometimes try to explain the difference between a team’s Pythagorean winning percentage and their true winning percentage by the strength of that team's bullpen, baserunning, and "smallball" in general. But however a team creates or prevents runs, it is accounted for in the Pythagorean record. Then again, in many situations these aspects of the game are leveraged. So I decided to look at the difference between a team’s winning percentage and its Pythagorean winning percentage and winning percentage in one-run games. The results indicated that overall baserunning can’t explain how a team fares in close games at all, despite Dusty Baker's claim that "you gotta have some speed to win close ball games."
I attempted to break the data down further by looking at pinch-runners and performance in different situations, but unfortunately the only data readily available were stolen base and caught stealing scores.
- The Athletics last year had the two most steals from substitute players of any team since 2002, thanks to pinch-runner extraordinaire Rajai Davis. Davis had 42 plate appearances as a sub, picking up 11 singles and one walk, but he pinch-ran so often that he had more stolen base attempts than times he reached first base. Oddly, Davis was a better hitter than basestealer as a sub on the A’s, as he hit to a tune of .341/.357/.561, while he was successful in just 11 of 16 theft attempts. It didn’t really matter for the A’s, who showed unremarkable splits in clutch situations. However, I wouldn't dismiss the idea of keeping a 25th-man on the roster as a specialist pinch runner.
- The Phillies, the best baserunning team in the league each of the last two years, have topped the league in contributions from substitutions on the bases as well. Their sub-baserunners have put up 28 steals compared to a single caught stealing, while in the ninth inning the entire team has recorded 31 steals to one caught. But again, it seemingly makes no difference in the team’s record in tight games.
- The incredibly unclutch Indians of 2005 were 3 for 11 stealing bases in situations with a leverage index above 1.5, and it probably did take them out of a game or two.
The sample sizes in these situations are small, so it’s hard to make conclusions using this data. But I think that the small sample size is a decent conclusion. While baserunning might be under-appreciated in today's game in a macro sense, it might be over-valued in explaining how an individual game is won and lost. Teams can leverage their baserunning to add a few runs over the course of a season, if that. Teams hold constant true-talent levels for baserunning, and it doesn't appear that the better clubs are able to achieve greater success by leveraging the ability at opportune times. Over 162 games, the difference between a team's offensive performance in high-leverage situations relative to their normal run production levels can't be explained by their baserunning.
| Baseball Beat | March 09, 2009 |
The Case of Michael Young and Line Drive Rates
Courtesy of The Hardball Times, the table below details the top 20 line-drive rates over the past five seasons. Do you notice any repeaters? There are only two players who qualified more than once: David Wright twice (2005 and 2008) and Michael Young FOUR times (2004-2007).
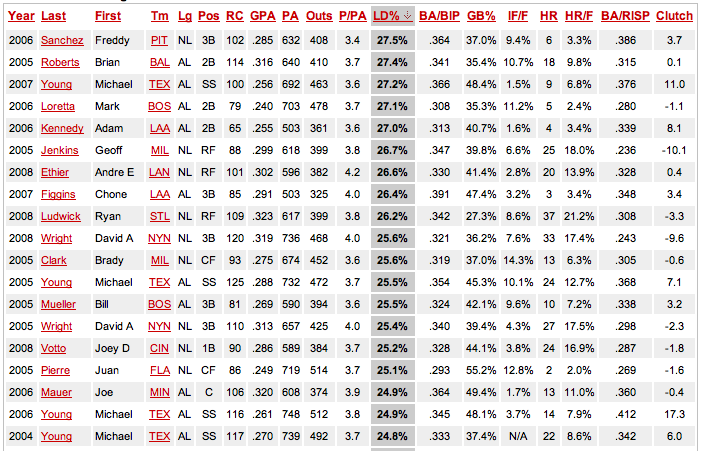
Does this data say more about Young's proclivity in hitting liners, his home ballpark, or the bias of scorekeepers? A combination of the three? Or perhaps something else?
This table captures a number of career years. Freddy Sanchez hit .344 with an OPS of .851 in 2006 vs. career averages of .300 and .753. Brian Roberts hit .314/.903 in 2005 vs. .284/.771. Geoff Jenkins hit .292/.888 in 2005 vs. .275/.834. Chone Figgins hit .330/.825 in 2007 vs. .290/.743. Ryan Ludwick hit .299/.966 in 2008 vs. .273/.857. Brady Clark hit .306/.798 in 2005 vs. .277/.744. Joe Mauer hit .347/.936 in 2006 vs. .317/.856.
Other than Juan Pierre, all of these players had BA/BIP over .300 with a mean of .340. Young, for what it's worth, owns three of the top four BA/RISP (among this sample size), including the only one greater than .400.
Of note, Young is the only Texas player included in the above list, which suggests LD% has more to do with the hitter than the effects of the ballpark or scorekeeper. However, it should be noted that Mark Teixeira had a 28.2% LD rate in 2003. In addition, Hank Blalock (2005), Milton Bradley (2008), and Ian Kinsler (2008) had rates that fell just outside the top 20. As such, I think it is fair to say that ballparks influence LD rates.
According to Baseball Analysts contributor Jeremy Greenhouse, there have been about 50 Rangers with at least 100 plate appearances since 2005 and the average line-drive rate (sans Young) was 20.5% vs. 19.9% league wide. Furthermore, in a study at Fangraphs, Brian Cartwright determined that "a batter is 18% more likely to have a batted ball coded as a LD" in Arlington . . . "while in Minneapolis, it's 20% less likely."
As Tangotiger wrote in response to Brian's work, "A 'line drive' is not necessarily a line drive. If hitters are showing as hitting 20% fewer line drives in the Metrodome than away from the Metrodome, we don't know if it's because the Metrodome depresses LD rates, or if it's because the scorer in Minnesota is depressing it. Since it makes a huge difference when looking at LD and FB rates, then you need some sort of park factor to normalize the data . . . Taking a guess, I have to believe this is a scorer issue. A line drive is really a batted ball that leaves the bat at a certain angle, at a certain velocity. I don't see how those things would affect whether a ball is a LD, FB, or GB, regardless of the park you are in. I can see how the scorer can be influenced by the positioning of the fielder (and worse, if the fielder caught the ball or not), and try to assign a batted ball code."
The thread attached to Tango's comments is fascinating and includes posts by Colin Wyers, Mike Fast, MGL, Greg Rybarczyk, Dave Studeman, and David Gassko. It is worth reading if you're into advanced batted ball studies. As studes points out, "From my work in the 2006 THT Annual, there was a greater standard error in line drive rates per park than in GB or Outfield Fly rates. Not outrageously higher, but definitely higher." You can also download a PDF of the 2004 THT Annual that includes Robert Dudek’s groundbreaking article on hang time, which is important because, as Tango notes, "how much time it takes for the ball and the fielder to intersect" is what is really important in differentiating between batted balls.
There are a number of questions to ask when it comes to batted balls. What percentage is attributed to the hitter or pitcher, the ballpark, or the scorekeeper? What distinguishes a line drive from a hard-hit groundball or a looping flyball? Is a one hopper that skips past the infield classified as a grounder or a liner? Does the ball have to hit the outfield grass first in order to be coded as a line drive? How high can a ball be hit and still be considered a line drive? Should the outcome have an effect on how a batted ball is coded? Does the outcome have an effect?
Play by play, batted ball, pitch f/x. We know a lot more today than we did just five years ago and we will know a lot more in five years than we know today. Hit f/x is next. Stats are not ridiculous. Only those who ignore (the right) stats are ridiculous.
| Change-Up | March 06, 2009 |
2009 AL East Preview (Featuring Pete Abraham)
I am reporting from Ft. Myers and heading over to City of Palms Park this afternoon, so it only seems fitting that we would have a look at the AL East today. Last week we previewed the NL East.
To recap:
Here’s the deal. For hitters we take PECOTA and the four projection systems on Fangraphs. Fangraphs, by the way, is awesome. They are doing terrific, differentiated, value-add work and if you are a regular reader of Baseball Prospectus and/or The Hardball Times, you should add Fangraphs to your favorites as well. Anyway, we average all five of these projection systems to give you a sense for how the number crunchers see the players performing this season.For pitchers, in the interest of keeping things simple and consistent, we go with the three projection systems readily available on the Fangraphs player pages. No PECOTA because the data presentation was not as compatible with the numbers we wanted to display.
We went with depth charts from ESPN.com. Some of the players penciled in below will not be starting, and some might not break camp. But we figured this was a pretty good way to go. As we draw closer to Opening Day with the other divisions, we will look to implement as accurate of an indication as possible with regard to who figures to start at each position.
Chipping in from Baseball Analysts today with commentary is Marc Hulet, contributor here and also at Fangraphs. We are also very thankful to have Pete Abraham, Yankees beat writer for the The Journal News.
Catcher
                 AVG   OBP   SLG
Navarro, D.     .267  .334  .389
Varitek, J.     .236  .328  .390
Posada, J.      .273  .366  .448
Barajas, R.     .243  .303  .392
Wieters, M.     .298  .382  .499
Pete: I think Jorge Posada will bounce back this year offensively. Throwing was never his strength, so he just needs to be able to keep runners a little honest. I wonder how much we'll see of Matt Wieters. It doesn't make much sense for Baltimore to start his clock yet.
Sully: Wieters in the Minors would be an absolute mockery. After he wins the MVP this season, I fully expect him to fix Healthcare and restore economic prosperity in America.
First Base
                 AVG   OBP   SLG
Pena, C.        .254  .370  .500
Youkilis, K.    .283  .377  .474
Teixeira, M.    .290  .383  .525
Overbay, L.     .265  .343  .419
Huff, A.        .279  .340  .471
Pete: Mark Teixeira will start slow; he always seems to. But will be bounce back in New York? That'll be interesting to watch. I don't think Kevin Youkilis is as good as he was last year. Carlos Pena, either.
Marc: The addition of Teixeira to the AL East obviously has huge implications. It will be interesting to see if Youkilis can repeat his stellar 2008 season, or if he reverts to his still-productive-but-not-a-star former self. I have to disagree with Peter. Offensively, I think Pena will be OK; he's still in his prime and should drive in 100 again.
Sully: Tex is hands down the best in the division and I have to agree with Pete. Youk's slugging jump last year was a blip, and not a new established norm. He's a really nice player, but not a perennial MVP candidate type.
Second Base
                 AVG   OBP   SLG
Iwamura, A.     .270  .346  .389
Pedroia, D.     .307  .368  .456
Cano, R.        .292  .331  .450
Hill, A.        .277  .334  .408
Roberts, B.     .282  .359  .424
Pete: I like Brian Roberts. Not sure I like him for four more years and $40 million. It's too bad Robinson Cano doesn't have the desire to be great that Dustin Pedroia does. The Yankees thought they did the right thing with his deal last year and then it blew up on them. He's a big project for Joe Girardi.
Marc: This position is definitely a strength in the division, with Pedroia, Roberts and Cano. If Aaron Hill is fully recovered from the concussion he suffered last season, you can add his name to that list too. Cano should definitely rebound; he's taken his lumps in the media and has something to prove.
Sully: That four year extension for Roberts was hard to figure for where Baltimore currently stands in the success cycle.
Third Base
                 AVG   OBP   SLG
Longoria, E.    .273  .347  .499
Lowell, M.      .275  .336  .444
Rodriguez, A.   .291  .387  .548
Rolen, S.       .263  .342  .434
Mora, M.        .271  .337  .431
Pete: (ed note: submitted pre-injury) A-Rod loves the drama and will have a huge year. Of course he'll then hit .052 in the playoffs. If he starts slow, however, the fans could really get ugly. They're already mad about the price of tickets. I'll be curious to see how Mike Lowell takes Boston trying to get rid of him all winter.
Marc: The injury to A-Rod changes the dynamics of this position with vague reports on exactly when he'll be back. The Yankees definitely did not have a fallback plan for the position. I'm betting 2009 is the year Mora plays like he's 37 years old.
Sully: Lowell's a pro and will handle the situation accordingly. So long as his fielding does not drop off, he will be a very valuable player once again.
Shortstop
                 AVG   OBP   SLG
Bartlett, J.    .274  .332  .366
Lowrie, J.      .265  .346  .410
Jeter, D.       .299  .367  .419
McDonald, J.    .231  .278  .312
Izturis, C.     .259  .310  .325
Pete: It speaks poorly of the shortstops in this division that Derek Jeter is still the guy you want over any of the rest of them. It's amazing how the Red Sox can't find a decent answer there. I'd like to point out that I once selected John McDonald to an American Legion All-Star team in Connecticut and gave him a Norwich Bulletin t-shirt.
Marc: Cesar Izturis should impress defensively in Baltimore but his offense will be abysmal. If Jed Lowrie wrestles the full-time job away from Lugo in Boston than the club will likely be better off offensively, but I like Lowrie a lot as a super-sub. The position is extremely weak offensively in Toronto with McDonald and Marco Scutaro, who is going to start regressing soon at the age of 33. It's hard to believe Toronto used No. 1 draft picks on college shortstops in 2002 and 2003 and never did end up with a long-term solution at the position.
Sully: With defense factored, will Lowrie be better than Jeter this season?
Left Field
                 AVG   OBP   SLG
Crawford, C.    .291  .334  .433
Bay, J.         .272  .364  .487
Damon, J.       .279  .352  .423
Lind, A.        .281  .330  .458
Pie, F.         .263  .317  .410
Pete: Johnny Damon is actually a pretty good defensive left field (well, not including throws). I think we're going to see some serious regression at the plate, however. His legs are not what they once were.
Marc: Generally speaking, I am really looking forward to watching the young outfield in Baltimore play, with Felix Pie, Adam Jones, and Nick Markakis included. Pie was a steal from Chicago and, if motivated, could be just as good as the other two players. Toronto could have the AL Rookie of the Year with Snider in left, who will share the position (and DH) with Adam Lind, another good, young player.
Sully: Out of Jason Bay and Carl Crawford, I will be interested to see who ends up as the better player at the end of the season according to Fangraphs. Bay has the good stick but can't field, Crawford's offense leaves a bit to be desired but can track anything down in left.
Center Field
                 AVG   OBP   SLG
Upton, B.       .279  .376  .432
Ellsbury, J.    .293  .350  .415
Gardner, B.     .260  .342  .359
Wells, V.       .274  .329  .457
Jones, A.       .274  .324  .420
Pete: Pecota has B.J. Upton not being so special. I can't argue against the math, but I do think what he did in the postseason could vault him forward. You could see him mature every day in October. If Brett Gardner can somehow get a .360 OBP, he'll change the way the Yankees look. But his swing might be too big for that.
Marc: I am a big Jacoby Ellsbury fan. He's going to really step up his game this season. The position in New York is thin... hmm, just like third base. There are a lot of cracks in the roster considering the payroll. Those pitchers better stay healthy. Count me as someone who thinks Upton is going to breakout in a big way this season.
Sully: We have consensus on Upton. I think he goes off in '09.
Right Field
                 AVG   OBP   SLG
Joyce, M.       .247  .324  .448
Drew, J.        .270  .381  .460
Nady, X.        .278  .332  .462
Rios, A.        .285  .338  .459
Markakis, N.    .297  .378  .477
Pete: J.D. Drew showed up hurt, which saves time. I'm surprised Brian Cashman didn't trade Nick Swisher or Xavier Nady. That probably speaks to Hideki Matsui's knees. I'll trust Tampa that Matt Joyce will help them.
Marc: I am not sold on Joyce, and his injury definitely hurts his chances of making the Opening Day roster in Tampa. Can Alex Rios finally breakout offensively (and consistently)? Please?
Sully: I laughed when I saw Pete and Marc's comments because I can't figure out why you hand Joyce a starting gig on a championship aspirant club.
Designated Hitter
                 AVG   OBP   SLG
Burrell, P.     .245  .368  .464
Ortiz, D.       .281  .387  .543
Matsui, H.      .279  .358  .442
Snider, T.      .262  .330  .462
Scott, L.       .261  .343  .477
Pete: Tampa had a lot of good choices and went with Burrell. Bobby Abreu would have been a good fit. I think Hideki Matsui is close to finished. He can barely run. It's also hard to know what to make of David Ortiz given his health in recent years.
Marc: Heath is definitely the big area of concern with the big two: Ortiz and Matsui. Will Aubrey Huff's big season of a year ago continue? I doubt it. It will be interesting to see how Burrell does in the AL with Tampa.
Sully: Give me the under on Papi and the over on Luke Scott.
Starting Pitching
                 W-L    K/9   BB/9   WHIP   ERA
Shields, J.     13-9   7.23   1.89   1.18  3.70
Kazmir, S.      10-8   9.75   3.86   1.30  3.68
Garza, M.       10-9   6.95   3.12   1.32  3.92
Price, D.        3-4   6.82   3.55   1.40  4.35
Sonnanstine, A. 11-9   6.31   1.94   1.26  4.07
                 W-L    K/9   BB/9   WHIP   ERA
Beckett, J.     13-8   8.25   2.32   1.21  3.68
Matsuzaka, D.   12-7   8.35   3.96   1.33  3.75
Lester, J.      11-8   6.85   3.45   1.37  4.00
Wakefield, T.    9-8   5.70   3.23   1.35  4.32
Penny, B.        8-7   5.76   3.27   1.44  4.30
                 W-L    K/9   BB/9   WHIP   ERA
Sabathia, C.    15-9   8.02   2.20   1.19  3.37
Burnett, A.     13-9   8.77   3.45   1.31  3.81
Wang, C.        11-6   4.63   2.79   1.37  3.96
Pettitte, A.    11-10  6.59   2.69   1.41  4.31
Chamberlain, J.  6-3   9.60   3.36   1.24  3.25
                 W-L    K/9   BB/9   WHIP   ERA
Halladay, R.    15-12  6.54   1.76   1.17  3.37
Litsch, J.      10-10  5.40   2.36   1.29  4.07
Purcey, D.       6-7   7.27   3.63   1.40  4.52
Richmond, S.     5-6   6.43   2.89   1.39  4.57
Janssen, C.      3-3   5.82   2.59   1.31  3.85
                 W-L    K/9   BB/9   WHIP   ERA
Guthrie, J.      9-9   5.98   2.97   1.33  4.09
Uehara, K.       ---------------
Waters, M.       6-8   5.51   4.17   1.55  5.12
Hill, R.         6-6   7.68   4.07   1.38  4.25
Liz, R.          6-7   7.34   5.05   1.58  5.30
Pete: The Yankees could be overwhelming and they have Phil Hughes in reserve. Boston took too many chances. Tampa was freakishly healthy last season.
Marc: New York is the beast in the starting pitching department, obviously. I can't see the A.J. Burnett deal working out in the end; he'll start strong and be dominant early, but the history of inconsistencies and injuries is sure to come back and bite. Boston's depth at starting pitcher is impressive.
Sully: Sort of like San Francisco's offense heading into last season, I am nothing short of astounded at how bad Baltimore's pitching looks. Of course San Fran wasn't the historically bad lineup I thought they would be so maybe there is hope for that O's staff.
Relief Pitching
                K/9   BB/9   WHIP    ERA
Percival, T.   7.42   4.06   1.29   3.94
Wheeler, D.    7.81   3.03   1.23   3.63
Balfour, G.   10.82   2.56   1.23   3.12
                K/9   BB/9   WHIP    ERA
Papelbon, J.   9.70   1.99   1.02   2.49
Okajima, H.    8.08   3.08   1.22   3.36
Masterson, J.  7.60   3.76   1.33   3.75
                K/9   BB/9   WHIP    ERA
Rivera, M.     8.33   1.71   1.04   2.67
Marte, D.      8.85   3.87   1.32   3.65
Bruney, B.     8.24   5.21   1.46   4.09
                K/9   BB/9   WHIP    ERA
Ryan, B.       9.09   3.85   1.27   3.45
Downs, S.      7.36   3.47   1.30   3.54
League, B.     6.33   3.48   1.39   4.02
                K/9   BB/9   WHIP    ERA
Sherrill, G    9.17   4.45   1.35   3.76
Ray, C.        7.98   3.54   1.27   3.77
Johnson, J.    6.10   3.62   1.44   4.32
Pete: The Red Sox made some smart moves here. Don't sleep on Brian Bruney of the Yankees. He's not as colorful as Joba Chamberlain but he could be every bit as effective.
Marc: Mariano Rivera is a robot. I am convinced of that; he'll still be dominating the AL East in 15 years. Baltimore will be helped by getting Chris Ray back (Tommy John surgery). The closer role could be a weak spot in Tampa, as well as Toronto - if B.J. Ryan cannot regain some consistency.
Sully: Personally, I think Bruney's walk numbers will plague him. Justin Masterson will be one to watch this year.
Bench
Pete: The Yankees treat the bench like an ashtray in a $100,000 car. It's there but they really don't pay much attention to it.
Marc: New York's bench will be almost non-existent. The Rays club has the best depth on the bench, with the likes of Ben Zobrist, Willy Aybar, Gabe Gross, etc. Toronto should have a lot of versatility. The Kevin Millar addition is growing on me, as long as it doesn't take at-bats away from Adam Lind and Travis Snider.
Sully: Rocco Baldelli, Josh Bard, Julio Lugo....Boston does a nice bench.
Who are the awards candidates from the AL East?
Pete:
MVP: Upton
Cy Young: Matsuzaka
Rookie: Price
Marc: I like Snider as the AL RoY (followed by David Price). C.C. has to be given mention as a Cy Young candidate, as does Halladay - although he'll get forgotten about by a lot of people when Toronto has a terrible season. AL MVP sleeper: Nick Markakis.
Sully: Sabathia for the Cy, Teixeira for MVP, Price for ROY.
Any surprises this year?
Pete: I think the Blue Jays could lose 90 games They have a chance to be dreadful.
Marc: If the Yankees continue to have injury woes, the depth is not there to patch the holes. Even with the starting rotation, I can see them finishing third in the division... but more likely they'll be in second place.
Sully: I am with Pete. Toronto is going to be horrendous.
Predictions?
Pete:
1. Yankees
2. Red Sox
3. Rays
4. Orioles
5. Blue Jays
Marc:
1. Boston
2. New York
3. Tampa
4. Baltimore
5. Toronto
Sully: As I get ready to head over to the Red Sox-Marlins game, is it any surprise that I am with Marc here?
=====
Special thanks to Pete for taking time out of his busy schedule. NL Central is up next week...
| Baseball Beat | March 05, 2009 |
The Strasburg Watch
San Diego State's Stephen Strasburg, who struck out 16 batters and hit 102 on the gun SEVEN times a week ago today, is scheduled to make his third start of the season this afternoon against the University of San Diego at Cunningham Stadium at 2:00 p.m. (PST).
Strasburg (2-0, 1.46) has punched out 27 batters in 12 1/3 innings thus far. His pitching line stands as follows:
  IP   H   R   ER   BB   SO   HR
12.1   8   3    2    3   27    0
The 6-4, 220-pound righthander, who has whiffed 55 percent of the batters faced in his first two outings, made a name for himself last April when he fanned 23 in a one-hit, 1-0 complete-game shutout vs. Utah. He was the only college player named to the Olympic team last summer and threw a one-hitter while striking out 11 over seven innings against Netherlands.
I saw him make his 2009 debut vs. Bethune-Cookman two weeks ago and shared my observations, as well as those from a few scouts I spoke to, in a scouting report published the following day. He K'd 11 batters that afternoon while consistently hitting 96-99 and reportedly touching 100 in the first inning according to a couple of radar guns behind home plate.
The 20-year-old junior followed up that appearance last Thursday night, striking out every hitter in Nevada's starting lineup at least once except first baseman Shaun Kort, who had a single among his three at-bats. Strasburg fanned seven of the first nine batters he faced and struck out the side four times. The 16 K's were the third-highest recorded in Mountain West Conference history. He was named Louisville Slugger National Player of the Week by Collegiate Baseball magazine.
You can check out his mechanics and stuff in a slo-mo video from the game I witnessed. His pitching motion has been criticized by Driveline Mechanics and others due to the so-called inverted W, a la Mark Prior, John Smoltz, Jeremy Bonderman, Anthony Reyes, A.J. Burnett, and Shaun Marcum. All of these pitchers have experienced major arm injuries at some point in their careers. For the sake of both Strasburg and the Washington Nationals, the team with the No. 1 pick in the June draft, let's hope he can avoid such arm troubles because he is one of the most exciting young prospects in the game, be it the amateur or professional level.
Update: Strasburg strikes out 18 over eight innings in a 5-3 victory over the 11th-ranked University of San Diego. Now 3-0 with a 1.77 ERA, Strasburg allowed two runs in the first three innings before settling down and retiring the next 11 batters in a row, including nine strikeouts. He has now whiffed 45 and allowed only four walks in 20.1 IP.
 IP   H   R   ER   BB   SO   HR
8.0   5   2    2    1   18    1
| Change-Up | March 04, 2009 |
The All-Time One-Teamers
We've made it to March and although the baseball season is right around the corner, the story lines still don't get all that interesting. Sure, there are some good previews out there (we will be continuing our own series of them on Friday with the AL East), but for the most part it's this guy or that guy are in the best shape of their life or another Jon Heyman/Scott Boras ventriloquist act on the latest concerning the Manny Ramirez talks. Mercifully, the latter may have come to an end yesterday.
The off-season, a time to discuss and analyze comings, goings, acquisitions, trades, defections and the like, is coming to a close and to celebrate, it seems like as good a time as any to have a look at the very best players to have played their entire careers in just one uniform. We will take a starting eight plus a DH, a right-handed and left-handed starter and a relief pitcher.
Mariano Rivera, Jorge Posada and Derek Jeter seem like good candidates to play their entire careers for the Yanks. Maybe Joe Mauer, the local boy, or the great Albert Pujols of the St. Louis Cardinals will play out their respective careers for one team, too. Perhaps Chipper Jones? But more and more, playing one's entire career for a single organization looks like a thing of the past. That's ok, too. Free agency has made baseball players rich, which strikes me as perfectly appropriate since the baseball players are the reason we watch and love the game. So this is not any sort of moral commentary, just a nod to the best players that never switched teams.
CATCHER: Johnny Bench, Cincinnati Reds
If Yogi Berra had not suited up four times for the 1965 Mets, would he have surpassed Bench here? You tell me:
           G     GC*   OPS+  AVG   OBP   SLG
Berra    2,120  1,699  125  .285  .345  .482
Bench    2,158  1,742  126  .267  .342  .476
* Games played at Catcher
Both are truly all-time greats and I am not sure how you would pick one or the other. It would have to come down to defense and from what I have read and heard, there was nobody better than Bench. Think having a good catcher helps? Both Berra and Bench were centerpieces on two of the great baseball dynasties of all time.
FIRST BASE: Lou Gehrig, New York Yankees
I used to own a lot of baseball history VHS tapes and watch them over and over again growing up. I can't remember if this was in one of those, or perhaps it was on an ESPN classic show about Gehrig or Cal Ripken. Anyway, someone on it says that the consecutive games streak devalues Gehrig's career while serving to inflate Ripken's. I came to believe this as gospel truth when I was 13 or so, and would regurgitate this nugget to anyone that would listen to me.
Well I still believe it to be the case about Gehrig but it is entirely unfair to Ripken. Anyway, did you know that Gehrig hit .340/.447/.632 for his career?!?! .340/.447/.632! The man slugged .765 in 1927! And the guy was an RBI machine despite having Babe Ruth (career .474 on-base) clogging the bases hitting in front of him! I find myself forgetting all of this sometimes, which is why I am always endlessly amused when I head back over to his B-Ref page. It's just unbelievable.
SECOND BASE: Charlie Gehringer, Detroit Tigers
Of note, he gets his strongest push for this slot from fellow Tiger, Sweet Lou Whitaker.
             G     OPS+  AVG   OBP   SLG
Gehringer  2,323   124  .320  .404  .480
Whitaker   2,158   126  .276  .363  .426
Gehringer was inducted into the Hall of Fame in 1949 while Whitaker is in the Bobby Grich & Dwight Evans Criminally Overlooked club.
THIRD BASE: Mike Schmidt, Philadelphia Phillies
George Brett is Schmidt's stiffest competition here, and it's actually a pretty interesting comparison if you want to just start tossing out numbers. They were contemporaries, and Brett played in about 300 more games, had 78 more triples, 257 more doubles, the same amount of RBI and more runs. He had 920 more hits and struck out 975 fewer times.
But here's where baseball gets really simple. Schmidt made outs less frequently, hit for way more power and had a better glove. Therefore, he was pretty clearly the superior player.
SHORTSTOP: Cal Ripken, Baltimore Orioles
Ripken featured the best of both worlds. He had a remarkable peak and also played more games than any shortstop in baseball history. Honus Wagner and Arky Vaughan may have had better peaks and if you want to count Alex Rodriguez as a shortstop, he was probably better, too. But taken together, peak and longevity, Ripken is right there among them as one of the all-time greats.
OUTFIELD (with one as DH):
Stan Musial, St. Louis Cardinals
Mel Ott, New York Giants
Mickey Mantle, New York Yankess
Ted Williams, Boston Red Sox
The numbers speak for themselves here. I am going to line these four up and show your their career stats, just because they're so damn fun to look at.
             G     OPS+  AVG   OBP   SLG
Musial     3,026   159  .331  .417  .559
Ott        2,730   155  .304  .414  .533
Mantle     2,401   172  .298  .421  .557
Williams   2,292   191  .344  .482  .634
STARTING PITCHERS: Walter Johnson, Washington Senators & Warren Spahn, Boston/Milwaukee Braves
This one is not all that close. Steve Carlton might have pushed Spahn but he bounced around towards the end of his career. Christy Mathewson might have done the same if it weren't for that one game he pitched for Cincinnati. He won the game, going all nine while giving up eight earned runs on 15 hits!
Walter Johnson pitched 5,914 innings at a 147 ERA+ clip. Spahn tossed 5,243 frames with a 118 ERA+.
RELIEF PITCHER: Mariano Rivera, New York Yankees
Baseball Reference shows 85 relief pitchers who have tossed 1,000 innings. Of those, Rivera leads with a 199 ERA+. The next best is 146.
==========
Ok, that's my team. If I missed anywhere or you have any other comments relating to guys toiling for their whole career with one squad, please do not hold back.
| Touching Bases | March 03, 2009 |
To What Extent Do Batters Control Pitches?
Ninety percent of the game is half mental, and that Yogiism is most apparent when it comes to the pitcher vs. batter matchup. Every at-bat has a story. Every pitcher has a repertoire of pitches from which to choose and he will use context and game theory when making his decisions. But perhaps the most important factor in determining pitch selection is the type of batter at the plate. So do batters control the type of pitches they see?
Dave Cameron recently got the ball rolling when he noted that that the percentage of fastballs a batter sees is inversely tied to his isolated power. The relationship makes intuitive sense, and the correlation coefficient of -.59 suggests that power is one of the most important determinants in how often a pitcher will challenge someone with a fastball. I decided to test out a whole lot more correlations to see what effects what. To better understand correlations and regressions in baseball, I’d suggest reading this article by John Beamer. The main points: the correlation coefficient is “a statistic representing how closely two variables co-vary; it can vary from -1 (perfect negative correlation) through 0 (no correlation) to 1.” Also, correlation does not imply causation. There will be a significant amount of interaction between the variables. For example, a batter who swings quite often will receive plenty of breaking balls, as those pitches are harder to make contact with. The flip side is that a batter may only swing so much because he sees a lot of curves and can't lay off them.
First, let's take a look at who saw the most fastballs, breaking balls, and off-speed pitches in any season over the last four years.
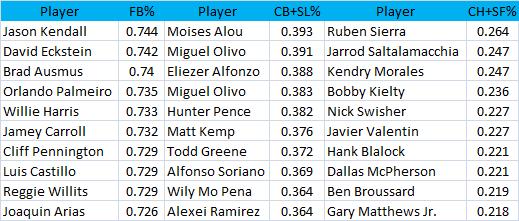
It looks like hitters with no power saw the most fastballs, free swinging power hitters saw the most breaking balls, and I don't see any rhyme or reason to the list of batters who saw a lot of change ups and split fingers.
My first test was to run a correlation four years with ISO and fastball percentage using my sample of about 1700 batters. The correlation coefficient was -.45. My initial guess was that as my sample had a lower minimum plate appearance, those batters with little reputation were being pitched differently than those whom the pitcher knew the book on. Limiting the plate appearance minimum from 100 to 300, and then to 500, I was proven wrong, as limiting the plate appearance minimum to 100, 300, or 500 resulted in correlation coefficients of -.45 as well. The low coefficient of correlation in my data was consistent with most of my results, as running the same statistical tests using plate discipline stats that Dave Appelman ran resulted in smaller coefficients.
Correlating fastball percentage with other traditional statistics confirms a lot of conventional baseball wisdom. The more a batter strikes out, the fewer fastballs and the more breaking balls he receives. There is also a positive relationship between strikeout percentage and fastball velocity. Unfortunately, no pitch type information correlates with batting average on balls in play. I had hoped that pitch type might be a factor in improving BABIP prediction models, but I guess not.
However, certain batted ball statistics do co-vary with pitch type. The stronger a batter’s pull tendency or fly ball tendency, the fewer fastballs he will likely receive over a year. Conversely, groundball hitters face a much higher percentage of fastballs. These types of hit trajectories and vectors are closely intertwined with power output, so this just further shows that pitchers tend to throw more fastballs to hitters who can’t do significant damage to them. This fear factor again comes through in testing how a pitcher will approach the zone against power hitters. There is a positive correlation between the number of wild pitches and passed balls and a batter's power based on stats like homerun per fly ball or ISO.
Plate discipline stats align quite well with pitch type stats. Showing a willingness to swing at pitches results in fewer fastballs, but making contact results in, or is the cause of, many fastballs. Moreover, free swingers face a higher fastball velocity than patient hitters, and contact hitters face a lower fastball velocity than power hitters. So when pitchers do challenge a scary hitter with a fastball, it appears that they dial it up. Or perhaps, only pitchers who can bring the heat will go after power hitters, while those with subpar fastballs simply avoid throwing fastballs altogether in those situations. And is there anything more frustrating than watching a batter swing at a slider in the dirt? There is a correlation between a batter's slider percentage and his swing percentage on pitches outside the strike zone, but the relationship only holds strong for batters who have established reputations in the league as hackers.
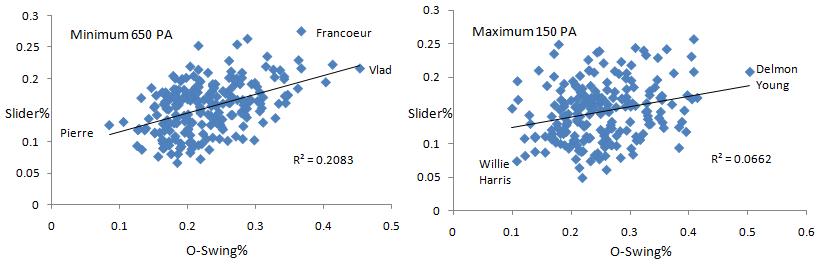
Notice the much lower coefficient of determination for players with between 100 and 150 plate appearances. There is a wider range of talent in this pool of players, but the spread in fastball percentage is also greater, suggesting a pitcher's choices are more random when they have less information on a batter.
Without expecting to find much, I tested the relationships between win probability statistics and pitch types. Though the results were rendered statistically insignificant, they all made sense. Batters who have higher leverage indexes over the course of a year tend to see fewer fastballs and curveballs, but more changeups and sliders. Furthermore, batters who come up with more on the line face increased velocity from each type of pitch. Then I looked at one of my favorite statistics, the clutch score—a measurement of how much better or worse a player does in high leverage situations than he would have done in a context neutral environment. Nothing significant or interesting came up with regards to pitch type, but I like the idea of clutchiness so much that I correlated it with other variables. As reported in Tango's clutch project, fans prefer batters who can put the bat on the ball. Batters who hit for power and strike out a lot do indeed perform slightly worse in the clutch, while those more adept at making contact perform slightly better.
Unfortunately, I didn’t account for any type of platoon situation, which is of course one of the more important things in determining pitch type. Same-handed batters vs. pitchers matchups see more breaking pitches while different-handed batters vs. pitcher matchups see more off-speed pitches in the variety of changeups and splitters. Running a basic test to see how well this theory holds up, I coded lefties as 0 and righties as 1 and correlated the handedness with pitch type. The percentage of sliders seen returned a correlation coefficient of .65, which confirms our suspicions. As righties see many more same-handed pitchers, they get a higher percentage of breaking pitches moving away from them. So even though lefties don't show up when searching for the leaders in slider percentage, that's just because they face a disproportionate number of different-handed pitchers.
Ryan Howard has never been able to hit left-handed pitchers (300 point difference in OPS in his career), and as such, he has received the highest percentage of sliders of any lefty each of the last two years with 200 plate appearances, but it still doesn’t place him in the top 25 either year. On the other side of the spectrum, the correlation between changeups and handedness was -.54. Lefties face different-handed pitchers much more often than same-handed, and therefore receive the changeup much more often than righties. Going a step further, we see that righties receive faster sliders and lefties get faster changeups because right-handed pitchers throw harder than lefties in general. Righties are also more likely to see pitches in the strikezone than lefties.
Lastly, park factors were not accounted for, though they play a large role in determining why pitchers throw certain pitches. As Josh Kalk showed, pitchers are much more likely to throw their fastball/sinker (which are classified as the same pitch by fangraphs) in Coors than in other parks. Matt Holliday, who is much more of a power hitter than a contact hitter would normally receive few fastballs, but playing in Coors, a pitcher’s best option is to bring the heat, as any kind of breaking ball in the thin air might get crushed. Therefore, Holliday has received a well above average amount of fastballs in his career, and it'll be interesting if his hitting approach changes as his pitch type profile changes.
Plugging a bunch of these variables into a multiple regression for fastball percentage yields an r-squared of .5 , meaning that half the variance in how often a batter is thrown a fastball can be explained by the hitter's contact skills, power, and plate discipline. So what I'm interested in is what the rest of the variance can be attributed to. Game state and randomness will certainly affect a pitcher's decision on what he will throw. And pitchers will often simply disregard the batter’s reputation, pitching their own game based on their own strengths. The last possibility is that pitchers are actually using more advanced data in their decisions. You can observe a lot by watching, and if pitchers study batter film or actually learn batter tendencies with the advent of pitch f/x data, it could change the art of the batter vs. pitcher matchup from what it was in Yogi's days.
| Baseball Beat | March 02, 2009 |
MLB Payroll Efficiency, 2006-2008
The Commissioner's Office released the final baseball payrolls for 2008 in late December. Not surprisingly, the New York Yankees spent $75 million more than the next highest team (Boston Red Sox) and $126 million over the average MLB team.
Last year, in an effort to analyze payroll efficiency, I created a graph with payroll on the y-axis and wins on the x-axis. I added a positively sloping trendline and four quadrants to provide a visual aid in determining the most and least efficient teams in terms of payrolls and wins.
Rob Neyer suggested that I plot this same information using multiple seasons, "as that would give us a better idea of the franchises' general competence over a period of years." With the foregoing in mind, I did just that. Thanks to data provided by Maury Brown at the Biz of Baseball, I added up the player payrolls and wins for the previous three seasons and divided them by three to get an average of each.
The two tables below detail the average payrolls and win totals, sorted by the former on the left and the latter on the right. The average payroll works out to $89.86M, which means MLB has spent an average of approximately $2.7 billion in each of the past three years (for a grand total in excess of $8 billion).
Payrolls cover the 40-man rosters and include salaries and prorated shares of signing bonuses, earned incentive bonuses, non-cash compensation, buyouts of unexercised options and cash transactions. In some cases, parts of salaries that are deferred are discounted to reflect present-day values. Luxury taxes are not part of these payroll figures nor are the posting fees for Japanese players.
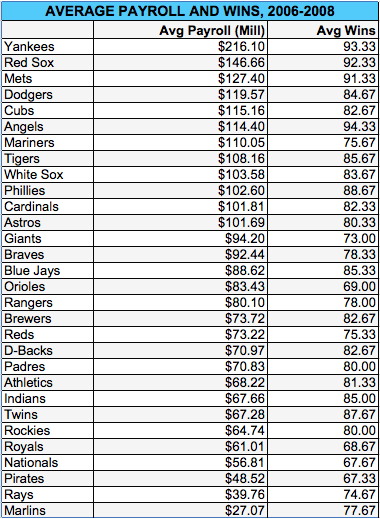
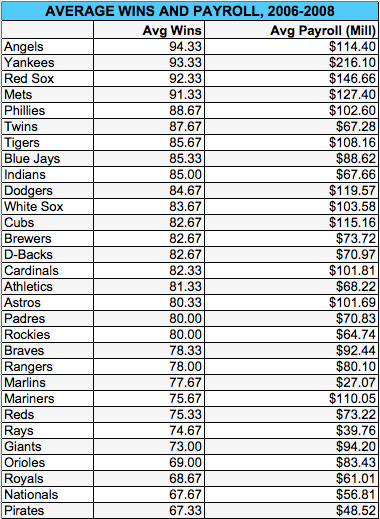
As shown, the Yankees led the majors in payroll over the 2006-2008 seasons, spending $70M more than the Red Sox and $126M over the average team. Nonetheless, the Los Angeles Angels have won more games than any other club during this same period, followed by the Yankees, Red Sox, and Mets. These four franchises were the only ones to average 90 or more victories the past three campaigns. Of note, the Bronx Bombers have spent $100M more per season than the Angels (and $305M over the three years), yet have one less win per campaign to show for their efforts. The inclusion of luxury taxes and posting fees would only widen the gap between the Yankees and the rest of the league.
The information in the tables can be displayed graphically as follows:

Based on this graph, we can once again categorize teams by the trendline and the four quadrants. Starting in the upper-right end of the graph and moving clockwise, the northeast quadrant includes teams that won more games than average with a higher-than-average payroll. The southeast quadrant depicts clubs that won more games than average with a lower-than-average payroll. The southwest quadrant includes teams that won fewer games than average with a below-average payroll. The northwest quadrant lists teams that won fewer games than average with a higher-than-average payroll.
The blue trendline indicates the positive correlation of team payroll and wins. The correlation coefficient works out to 0.64. The coefficient of determination (or R-squared) is 0.41, which means payroll explains 41 percent of a team's win total. A large portion of the balance is determined by the impact of "cost-controlled" players (i.e., minimum or close to minimum in years one through three and roughly 40-60-80 percent of free agent market values in years four through six, respectively) as Dave Studeman, who improved the correlation coefficient to 0.77 and the R-squared to nearly 0.60 for the 2006 season, pointed out in an intelligent piece in The Hardball Times a couple of years ago.
Furthermore, the relationship between payroll and wins is not linear. The difference between the highs and lows of wins (67-94) is much more tightly bunched than payrolls ($27M-$216M), suggesting that marginal wins are significantly more costly than average wins. In other words, going from 70 to 80 wins isn't as important — or costly — as going from 80 to 90 wins. By my count, 68 of the 78 teams that have won at least 90 games during the past 10 years have participated in the postseason. Win 90 and you have about an 87 percent chance of playing beyond the regular season.
Sticking to the graph, teams above the line were less efficient and teams below the line were more efficient in terms of getting the most bang for their buck. While average wins are a reasonable proxy of success, most teams are primarily focused on earning a spot in the playoffs to give them a shot at winning the World Series. Under the "flags fly forever" truism, I'm going to excuse any team that wins it all from the list of so-called inefficient teams. While the Red Sox may pay up for (part of) their success, the truth of the matter is that Boston is the only team that has won two World Series titles during the current decade. In other words, the Red Sox have been more efficient in winning World Championships than any team in baseball, not an insignificant accomplishment for a franchise that calls the AL East its home.
Aside from the Red Sox (and the Cardinals and Phillies, winners of the other two World Series in the past three seasons), which teams were the most and least efficient during the 2006-2008 time frame?
Six clubs have averaged more than 81 wins with payrolls under the league mean of $89.86M. The best of the best was Minnesota (winner of the "doing the most with the least" award), followed by Cleveland, Toronto, Arizona, Milwaukee, and Oakland. All but the Blue Jays made the playoffs once, which probably says as much about Toronto's competition as anything else.
I already cited the Phillies for winning the World Series last season but Philadelphia and the Los Angeles Angels deserve a lot of credit for payroll efficiency as well. The former captured the NL East in 2007 and 2008 and narrowly missed the playoffs in 2006, while the latter took the AL West the past two seasons but lost to the Red Sox in the ALDS both times. The Halos, lest we forget, are one of the eight clubs to have won a World Series title this decade.
Colorado, San Diego, Florida, and Tampa Bay share the award for "doing the best while pinching pennies." The Rockies (2007) and Rays (2008) made it to the World Series, while the Padres were awarded the NL West title in 2006 due to winning the season series vs. the Dodgers, the other team that won 88 games that year, and lost in a play-in game the following season. The Marlins, of course, won the World Series in 2003, the second in just a seven-year span.
The clubs in the northeast quadrant and above the trendline had mixed results. All of these teams won more than their share of games, but they did so at a cost. The Yankees are the biggest outliers by far, spending over $200M above and beyond the Red Sox with no World Series titles and only two postseason wins to show for their huge financial commitment. In fairness to the Yankees, they won a World Championship at the outset of the decade and missed out on the playoffs in 2008 for the first time since the strike-shortened season in 1994. All of the NEQ clubs made it to the playoffs at least once but only the Red Sox and Cardinals won championships.
Moving to the least efficient teams, Seattle wins the award for "doing the least with the most," while San Francisco, Atlanta, and Houston also won less than their fair share of games while sporting higher than average payrolls. In addition, Baltimore, Kansas City, and Washington spent payroll dollars unwisely during the past three years. Pittsburgh, Cincinnati, and Texas all reside on top of the trendline, meaning each team won about as many games as expected given their payrolls.
While relatively simplistic, graphing payrolls and wins — especially over a multi-year period — allows us to evaluate how efficiently ownerships and managements are spending payroll dollars.
Update: The following graph is the same as the one above except that it includes a polynomial rather than linear trendline.

The polynomial trendline improves the R-squared to .49 versus .41 for the linear. In response to a reader's question in the comments section below, I listed the regressions for each and calculated marginal wins are worth approximately $3M using the linear and range from essentially zero at the left end to as much as $7M at the right end (i.e. going from 92 to 93 wins) based on the polynomial. The bottom line is that the polynomial regression does a much better job at capturing marginal payroll and wins than the linear expression.