Rich Lederer • Baseball Beat
Patrick Sullivan • Change-Up
Jeremy Greenhouse • Touching Bases
Dave Allen • F/X Visualizations
Sky Andrecheck • Behind the Scoreboard
Marc Hulet • Around the Minors
Al Doyle • Past Times
Retired Uniforms:
Bryan Smith • WTNY
Joe Sheehan • Command Post
Jeff Albert • The Batter's Eye
RSS Feed
Home
*Examining the Past, Present, and Future*
Lineup Card
Recent Entries
» Putting Together a Reality Team
» Historical Hall of Fame Vote Comparisons: 2012
» An All-Christmas Team
» The New-Look Angels
» John Denny: The Forgotten Cy Young Award Winner
» Money Isn't Everything
» What Would It Take to Hit .400 in the 21st Century?
» Halos Heaven
» Brandon McCarthy's Breakout Season
» Link-o-Rama
» Historical Hall of Fame Vote Comparisons: 2012
» An All-Christmas Team
» The New-Look Angels
» John Denny: The Forgotten Cy Young Award Winner
» Money Isn't Everything
» What Would It Take to Hit .400 in the 21st Century?
» Halos Heaven
» Brandon McCarthy's Breakout Season
» Link-o-Rama
Best of Baseball Beat
Abstracts From the Abstracts
1977 Baseball Abstract
1978 Baseball Abstract
1979 Baseball Abstract
1980 Baseball Abstract
1981 Baseball Abstract
1982 Baseball Abstract
1983 Baseball Abstract
1984 Baseball Abstract
1985 Baseball Abstract
1986 Baseball Abstract
1987 Baseball Abstract
1988 Baseball Abstract
1978 Baseball Abstract
1979 Baseball Abstract
1980 Baseball Abstract
1981 Baseball Abstract
1982 Baseball Abstract
1983 Baseball Abstract
1984 Baseball Abstract
1985 Baseball Abstract
1986 Baseball Abstract
1987 Baseball Abstract
1988 Baseball Abstract
Bert Blyleven Series
Meeting Up and Hanging Out with Bert
The Results Are In And...
Aficionado Heavily Invested in Blyleven
Latest on Blyleven's Chances for the HOF
The Internet Zealot Responds
400 Down and 5 to Go...
Bert Be Home By Eleven?
Blyleven's Forgotten Season (1973)
HeyMan, Your Comments Don't Hold Water
The Waiting is the Hardest Part
Another Addition to the Blyleven Series
Search for the Truth
As Dominant as His HOF Contemporaries
Listen, Buster
A Larger Step for Blyleven
Answering the Naysayers (Part Two)
Another Small Step for Blyleven
Q&A: Blyleven on the Twins
The Majority Rules, Right?
It's All Dutch to Some
The Hall of Fame Case for Bert Blyleven
Q&A: Blyleven on Felix Hernandez
Clemens Rocketing Up Charts
Poz: An Interview With a KC Star
A HOF Chat with Tracy Ringolsby
Up Close and Personal
A Peek Into the Mind of a HOF Voter
Answering the Naysayers
It's That Time of the Year (Again)
"If Cooperstown is Calling..."
The Bert Alert
One Small Step for Blyleven...
Only the Lonely
Exclusive Interviews
Lee Sinins
Alex Belth
David Pinto
Will Carroll
Mike Carminati
Aaron Gleeman
Joe Sheehan
Jay Jaffe
Jeff Peek
Tracy Ringolsby
Joe Posnanski
Bill James Part I, II, III
Jon Lalonde
Chuck Tiffany
Dayn Perry
Fay Vincent
Nate Silver
Alex Belth
David Pinto
Will Carroll
Mike Carminati
Aaron Gleeman
Joe Sheehan
Jay Jaffe
Jeff Peek
Tracy Ringolsby
Joe Posnanski
Bill James Part I, II, III
Jon Lalonde
Chuck Tiffany
Dayn Perry
Fay Vincent
Nate Silver
Bullpen
Rich Lederer
The Odd Couple (with Alex Belth)
The MostUnder Over Underrated Player in Baseball (with Brian Gunn)
Three Wise Men (roundtable by Alex Belth)
Infrequently Asked Questions (interview with Matt Welch)
Interview (Orioles Think Tank)
Bernie and the Yanks (Bronx Banter)
Hope and Faith: How the LAA Win the World Series (Baseball Prospectus)
NL West (The Soul of Baseball)
Greatest Living Hitter? (Sports Illustrated)
Roundtable: 2008 HOF Ballot (Armchair GM)
The Most
Three Wise Men (roundtable by Alex Belth)
Infrequently Asked Questions (interview with Matt Welch)
Interview (Orioles Think Tank)
Bernie and the Yanks (Bronx Banter)
Hope and Faith: How the LAA Win the World Series (Baseball Prospectus)
NL West (The Soul of Baseball)
Greatest Living Hitter? (Sports Illustrated)
Roundtable: 2008 HOF Ballot (Armchair GM)
Patrick Sullivan
Designated Hitters
David Bromberg (Q&A: John Denny)
Mark Armour (H. Killebrew and Versatility)
Joe Lederer (Soundtrack of a Prospect)
David Bromberg (Clemente's Autograph)
David Bromberg (Woody Fryman)
D. Baumstein (WAR Against Age: Pitchers)
Doug Baumstein (The WAR Against Age)
Doug Baumstein (A Lifetime on the Road)
John Fraser (Pick Six)
Mark Armour (How to Score More Runs?)
Bill Parker (What Opening Day Tells Us)
Stan Opdyke (Pat Rispole)
Chris Jaffe (Evaluating Baseball's Mgrs)
Stan Opdyke (Baseball Radio in NYC, 1953)
A. Nathan (Performance of Baseball Bats)
Michael Weddell (Edgar Martinez/HOF)
Jon Weisman (100 Things Dodgers Fans...)
Stan Opdyke (Connie Mack and Vin Scully)
Eric Walker (Evaluating Run Production)
Brent Mayne (The Intangibles of Catching)
Chris Moore (Best Fastballs in Baseball)
Dave Baldwin (The Batter’s Brain)
Shawn Haviland (Ivy League to MLB)
Larry Granillo (Walking Off)
Rob Iracane (Solo HR Won't Break You)
Tommy Bennett (Charm of AM Radio)
Harry Pavlidis (Johan Santana's Fast Start)
John Walsh (WAR and Remembrance)
Eric Walker (Precisely Inaccurate)
Bob Timmermann (As They See 'Em)
Geoff Young (Unicycles and Delusions)
Baseball Analysis at Tufts (Groundballers)
Baseball Analysis at Tufts (GB Out Rates)
G. Rybarczyk ('09 Hit Tracker Projections)
Joe Lederer (Curt Schilling/HoF)
Conor Gallagher (Hall of Fallacies)
Chris Green (Jim Rice, HoF, the Numbers)
Shawn Hoffman (Baseball's Bear Mkt?)
Paul Anthony (Manny Syndrome)
Ross Roley (World Series Odds)
B. Timmermann (Catcher's Interference)
R.J. Anderson (Waiting the Hardest Part)
Maury Brown (Cubs, MLB, and Cuban...)
Myron Logan (Dee-Fense, Dee-Fense)
Craig Calcaterra (Frivolity, Part I, Part II)
Chad Finn (Ode to Baseball Cards)
David Cameron (Mariners Foibles)
Chris Dial (Chipper Jones)
Pat Lederer (Memory Lane)
David Appelman (Clutch Pitching)
Bob Rittner (DH)
Jonathan Mayo (Roger Clemens)
Lisa Winston (My Son-in-Law...)
Russ McQueen (The Yellow Hammer)
Bob Rittner (I'm OK, You're OK)
Mark Armour (In Defense of the HOF)
Pat Jordan (Friends)
Dan Levitt (Analysis of Terry Ryan)
Doug Baumstein (Trading Econ 101)
Ross Roley (Runner's Reluctance II)
Ross Roley (Runner's Reluctance I)
Mark Armour (No-Longer Lovable Sox)
Bruce Regal (Stealthy and Wise)
Brian Gunn (Roid Monster)
Current/McEvoy (Value of the SB)
John Rickert (Sinister Thefts)
Nate Silver (Sabermetrics)
David Vincent (Home Run Production)
Joe P. Sheehan (Enhanced Gameday II)
Mark Armour (An Ode to Sport)
David Gassko (All-Time Worm Burners)
Joe P. Sheehan (Enhanced Gameday)
John Walsh (When Titans Clash)
Fox/Williams (Quantifying Coaches II)
Fox/Williams (Quantifying Coaches I)
Jacob Luft (Bull Durham Rant)
Chad Finn (Strat-O-Matic)
Lisa Winston (Rotisserie Baseball)
Dave Studeman (Baseball Stats)
Steve Treder (Roger Craig)
Marc Normandin (Jeff Bagwell)
D. Appelman (Expanding Strike Zone)
Jeff Sackmann (Worst MiL Defenders)
Jeff Sackmann (Best MiL Defenders)
Maxwell Kates (Van Lingle Mungo)
David Appelman (Pitch Location)
Kent Bonham (Danny Ray Herrera)
Glenn Stout (Two Baseball Poems)
Bruce Regal (The Challenge Round)
Mark Lamster (Barry & Ty)
Geoff Young (NL West)
Tom Lederer (The Ryan Express)
Brian Erts (Great Leap Forward)
David Pinto (Parity and the N.L.)
Jacob Luft (Fathers and Daughters)
Jamey Newberg (Pete's Sake)
Jeff Albert (A. Jones Swing Analysis)
Jeff Albert (A-Rod Swing Analysis)
Keith Law (Death, Taxes, and Waivers)
Peter Abraham (Tales of Torre Tales)
Larry Borowsky (Let 'er Rip II)
Dan Levitt (Empirical Analysis of Bunting)
Jonah Keri (If I Met Warren Cromartie...)
Bob Klapisch (War Stories)
Bob Timmermann (John F. Kennedy HS)
Kent Bonham (Aluminum Adjustments)
Al Doyle (More Than Superstars)
Ross Roley (Instant Replay)
David Vincent (Barry Bonds Homers)
Chad Finn (Our Favorite Obscurities)
Bill Deane (1979 NL MVP)
Mark Armour (Rise/Fall of Artificial Turf)
Jeff Angus (Wally Moon Camp)
David Berri (Money and Baseball)
Larry Borowsky (Baseball w/o the #s)
Derek Zumsteg (The Irrational Market)
David Regan (Free Agent Contracts)
Peter Schmuck (Steroids and the HOF)
David Appelman (Pitchers, Pitch by Pitch)
Dan Fox (Swinging, Taking, Fouling, Etc)
Patrick Sullivan (Study of NYY CF/BOS LF)
Will Leitch (Baseball Journalism)
Jeff Sullivan (Pitcher Release Points)
Steve Treder ('69-'70 Giants)
Maury Brown (Charlie Finley)
John Brattain (Bob Johnson)
Bob Klapisch (The Case for Bert Blyleven)
Jeff Peek (Pride and Prejudice)
Dayn Perry (Bert and Warren)
Rob Neyer (If Don Sutton Was Great...)
Lisa Winston (Minor League Memories)
Alex Belth (Otis Redding Was Right)
David Cameron (Long Live the King)
Jeff Angus (Baserunning Study)
Bert Blyleven (Baseball Playoffs)
Boyd Nation (Not a Prospect List)
James Click (Batters-Baserunners Study)
Jeff Shaw (Why I Love Baseball)
David Gassko (BIP/BFP Fielding Study)
Jay Jaffe (Milwaukee Sausage Race)
Jamey Newberg (Remember When)
Bob Klapisch (Press Box to the Mound)
Dan Levitt (Predictive Value of BB)
David Vincent (Official Scorer)
Jon Weisman (Rick Monday)
Larry Borowsky (Let 'er Rip)
Will Carroll (Fictional Short Story)
Bob Timmermann (Japanese Baseball)
Cyril Morong (Best Pitching Seasons)
Sean Forman (Monte Carlo Win-Loss)
Brian Gunn (My Little Blue Book)
Joe Lederer (My Dad and Baseball)
Bill Deane (Bob Gibson, 1968)
Mark Armour (1977 Yankees)
Darren Viola (Retrosheet)
David Pinto (RFK)
Dayn Perry (Brave Heart)
Matt Welch (Dave Hansen)
Kevin Kernan (Jack McKeon)
Tom Lederer (Dodgers Road Trip)
Steve Lombardi (Slider)
Studes (Picturing Baseball)
Mike Carminati (Luck of the Drawl)
Eric Neel (Vin Scully)
J.C. Bradbury (Leo Mazzone)
John Sickels (Bill James)
Search Baseball Analysts
Archives
By Category:
Around the Majors Content Only
Around the Minors Content Only
Baseball Beat Content Only
Baseball Beat/Change-Up Content Only
Baseball Beat/WTNY Content Only
Behind the Scoreboard Content Only
Change-Up Content Only
Change-Up/Around the Majors Content Only
Command Post Content Only
Crunching the Numbers Content Only
Designated Hitter Content Only
F/X Visualizations Content Only
Past Times Content Only
Saber Talk Content Only
The Batter's Eye Content Only
Touching Bases Content Only
Weekend Blog Content Only
WTNY Content Only
By Month:
February 2012
January 2012
December 2011
October 2011
September 2011
August 2011
July 2011
June 2011
May 2011
April 2011
March 2011
February 2011
January 2011
December 2010
November 2010
October 2010
September 2010
August 2010
July 2010
June 2010
May 2010
April 2010
March 2010
February 2010
January 2010
December 2009
November 2009
October 2009
September 2009
August 2009
July 2009
June 2009
May 2009
April 2009
March 2009
February 2009
January 2009
December 2008
November 2008
October 2008
September 2008
August 2008
July 2008
June 2008
May 2008
April 2008
March 2008
February 2008
January 2008
December 2007
November 2007
October 2007
September 2007
August 2007
July 2007
June 2007
May 2007
April 2007
March 2007
February 2007
January 2007
December 2006
November 2006
October 2006
September 2006
August 2006
July 2006
June 2006
May 2006
April 2006
March 2006
February 2006
January 2006
December 2005
November 2005
October 2005
September 2005
August 2005
July 2005
June 2005
May 2005
April 2005
March 2005
February 2005
January 2005
December 2004
November 2004
October 2004
September 2004
August 2004
July 2004
June 2004
May 2004
April 2004
March 2004
February 2004
January 2004
December 2003
November 2003
October 2003
September 2003
August 2003
July 2003
June 2003
Reference
Organizational Stats
Arizona Diamondbacks Bat / Pitch
Atlanta Braves Bat / Pitch
Baltimore Orioles Bat / Pitch
Boston Red Sox Bat / Pitch
Chicago Cubs Bat / Pitch
Chicago White Sox Bat / Pitch
Cincinnati Reds Bat / Pitch
Cleveland Indians Bat / Pitch
Colorado Rockies Bat / Pitch
Detroit Tigers Bat / Pitch
Florida Marlins Bat / Pitch
Houston Astros Bat / Pitch
Kansas City Royals Bat / Pitch
Los Angeles Angels Bat / Pitch
Los Angeles Dodgers Bat / Pitch
Milwaukee Brewers Bat / Pitch
Minnesota Twins Bat / Pitch
New York Mets Bat / Pitch
New York Yankees Bat / Pitch
Oakland Athletics Bat / Pitch
Philadelphia Phillies Bat / Pitch
Pittsburgh Pirates Bat / Pitch
St. Louis Cardinals Bat / Pitch
San Diego Padres Bat / Pitch
San Francisco Giants Bat / Pitch
Seattle Mariners Bat / Pitch
Tampa Bay Devil Rays Bat / Pitch
Texas Rangers Bat / Pitch
Toronto Blue Jays Bat / Pitch
Washington Nationals Bat / Pitch
All-Star Links
Official Websites
News and Notes
Baseball News Blog
Baseball Newstand
ESPN Baseball
Fox Sports Baseball
Pro Sports Daily
Roto World
The Roto Times
USA Today Baseball
Baseball Newstand
ESPN Baseball
Fox Sports Baseball
Pro Sports Daily
Roto World
The Roto Times
USA Today Baseball
Reference and Analysis
Baseball Almanac
Baseball America
Baseball Archive
Baseball Contracts
Baseball Cube
Baseball Graphs
Baseball Library
Baseball Musings Player Database
Baseball Page
Baseball Primer
Baseball Prospectus
Baseball Reference
Baseball Statistics
Baseball Truth
Boxscore Central
Diamond Mind Baseball
Doug's Stats
FanGraphs
Fast Balls (pitchfx catalog)
Hardball Dollars
Hardball Times
Hit Tracker
Retrosheet
Rotobase/Rotoblog
Stat Corner
STATS
Tango on Baseball
Yahoo Sports MLB
Web Gems
Bill James Primer
Sabermetric Manifesto (Grabiner)
Pitching and Defense (McCracken)
Pitching and Defense (Tippett)
Transactions Primer (Neyer)
Baseball Stats (Batter's Box)
Prospect Report (Cameron)
Pitcher Workloads (Sheehan)
Goodbye to Old Baseball Ideas (Rickey)
Sabermetric Manifesto (Grabiner)
Pitching and Defense (McCracken)
Pitching and Defense (Tippett)
Transactions Primer (Neyer)
Baseball Stats (Batter's Box)
Prospect Report (Cameron)
Pitcher Workloads (Sheehan)
Goodbye to Old Baseball Ideas (Rickey)
Columnists
Baseball Blogs
Around the Majors
Athletics Nation
Baseball Crank
Baseball Musings
Baseball-Reference Blog
Batter's Box
Big League Stew
Bronx Banter
Catfish Stew
Cub Town
Dan Agonistes
Dodger Thoughts
DRays Bay
Ducksnorts
Futility Infielder
Halos Heaven
Inside the Rockies
It Might Be Dangerous
Knuckle Curve
LoHud Yankees Blog
Lookout Landing
Management by Baseball
Metaforian
Metsgeek
Mike's Baseball Rants
Only Baseball Matters
Redbird Nation
Red Reporter
Sabernomics (Braves)
Seth Speaks
ShysterBall
6-4-2 (Angels/Dodgers)
The Book
TheCubdom
The Cutting Edge
The House That Dewey Built
The View From The Bleachers
Tiger Blog
U.S.S. Mariner
Viva El Birdos
Where's Kernan
Minor Leagues
Arizona Fall League
BA Player Finder
Cal Leaguers
Jamey Newberg
JDM's Scoresheet Baseball
Minor League Baseball
Minor League Park Factors
Minor League Splits
No Pepper
Sickels' Minor League Ball
Warm October Nights
BA Player Finder
Cal Leaguers
Jamey Newberg
JDM's Scoresheet Baseball
Minor League Baseball
Minor League Park Factors
Minor League Splits
No Pepper
Sickels' Minor League Ball
Warm October Nights
Amateur
Boyd's World (College)
Cape Cod Baseball League
College Baseball Blog
College Baseball Insider
Collegiate Baseball Newspaper
College Splits
College Splits Blog
Dirtbags Baseball (Long Beach State)
NCAA Baseball
NCBWA
Team One Baseball (High School)
Texas A&M & Baseball
Cape Cod Baseball League
College Baseball Blog
College Baseball Insider
Collegiate Baseball Newspaper
College Splits
College Splits Blog
Dirtbags Baseball (Long Beach State)
NCAA Baseball
NCBWA
Team One Baseball (High School)
Texas A&M & Baseball
Historical
Cuban Baseball
House of David
Jim "Mudcat" Grant's Web Page
Negro League Baseball Players Assoc
Negro Leagues Baseball Museum
1919 Black Sox
Pacific Coast League
Philadelphia Athletics Historical Society
Shoeless Joe Jackson Society
SABR-L Archives
Walter O'Malley
House of David
Jim "Mudcat" Grant's Web Page
Negro League Baseball Players Assoc
Negro Leagues Baseball Museum
1919 Black Sox
Pacific Coast League
Philadelphia Athletics Historical Society
Shoeless Joe Jackson Society
SABR-L Archives
Walter O'Malley
Miscellaneous
Forums
Credits
Ticket Center
Tickets to Baseball -
Premium Red Sox Tickets - Tickets to Marlins Games - Cardinals Game Tickets - NY Yankee Tickets - Tickets Oakland Athletics - Dallas Cowboys Tickets - Arizona Cardinals Tickets - Tickets Seattle Seahawks - Buffalo Bills Tickets Online - Tickets to Dolphins Football
Buy Boston Red Sox tickets,
Philadelphia Phillies tix,
NY Yankees tickets,
NY Mets tickets, and
MLB All Star game tickets at ABC tickets
Not sure where to find the best online sportsbooks? Start your search with PlayersJet.
Get deals at SportsMemorabilia.com on baseball apparel, including Phillies jerseys and more for adults and children.
Shop the largest selection baseball equipment on sale at Sports Unlimited. Check out tons of baseball gloves, youth baseball gloves and catchers gear from Rawlings, Wilson, Nike & Under Armour.
2011 Draft Order
Courtesy of Baseball America
First-Round:
 1. Pirates (57-105)
 2. Mariners (61-101)
 3. Diamondbacks (65-97)
 4. Orioles (66-96)
 5. Royals (67-95)
 6. Nationals (69-93)
 7. Diamondbacks (for B. Loux)
 8. Indians (69-93)
 9. Cubs (75-87)
10. Padres (for Karsten Whitson)
11. Astros (76-86)
12. Brewers (77-85)
13. Mets (79-83)
14. Marlins (80-82)
15. Brewers (for Dylan Covey)
16. Dodgers (80-82)
17. Angels (80-82)
18. Athletics (81-81)
19. Red Sox (from DET for Martinez)
20. Rockies (83-79)
21. Blue Jays (85-77)
22. Cardinals (86-76)
23. Nationals (from CWS for Dunn)
24. Rays (from BOS for Crawford)
25. Padres (90-72)
26. Red Sox (from TEX for Beltre)
27. Reds (91-71)
28. Braves (91-71)
29. Giants (92-70)
30. Twins (94-68)
31. Rays (from NYY for Soriano)
32. Rays (96-66)
33. Rangers (from PHI for Lee)
Supplemental First Round:
34. Nationals (Dunn)
35. Blue Jays (Downs)
36. Red Sox (Martinez)
37. Rangers (Lee)
38. Rays (Crawford)
39. Phillies (Werth)
40. Red Sox (Beltre)
41. Rays (Soriano)
42. Rays (Balfour)
43. Diamondbacks (LaRoche)
44. Mets (Feliciano)
45. Rockies (Dotel)
46. Blue Jays (Buck)
47. White Sox (Putz)
48. Padres (Garland)
49. Giants (Uribe)
50. Twins (Hudson)
51. Yankees (Vazquez)
52. Rays (Benoit)
53. Blue Jays (Olivo)
54. Padres (Torrealba)
55. Twins (Crain)
56. Rays (Choate)
57. Blue Jays (Gregg)
58. Padres (Correia)
59. Rays (Hawpe)
| Touching Bases | September 30, 2009 |
Thoughts from the 2009 New England Symposium on Statistics in Sports
On Saturday, Harvard hosted NESSIS, a gathering of sports statisticians that could be billed as the little brother of the sports analytics conference at MIT, only geekier. I say that as a compliment.
Academia vs. Industry (vs. Internet?)
A couple of the best of both worlds were on display, as two names I've become familiar with, Shane Jensen and Tom Tippett, presented their analysis. Tippett, Director of Baseball Information Services for the Red Sox, presented research on special baseball tactics such as the bunt and stolen base. His findings often dissented with conventional sabermetric wisdom. A base stealer must steal at a clip of at least 70% to be deemed successful? Well, the break-even rate fluctuates wildly based on the game state. With nobody out in a one run game, the break-even rate of stealing second is only 54%. In a two-plus run game, it’s 84%. With regards to the bunt, Tippett found that good bunters should continue to bunt thanks to the possibility of an error or hit, and that in the context where you’re playing for one run, bunting is often sensible depending on the hitter and upcoming batters. It seems to me that the guys who wrote The Book came up with similar conclusions. Of course, the real stuff Tippett does for the Red Sox is proprietary and can hardly be discussed.
Tippett said that the more he studied an issue, the more often he found that managers tended to be right, without even knowing the data. Mike Zarren, a statistician for the Celtics, agreed. Zarren brought up two points of interest. First, he said that the reason it's hard for people within his industry and those from academia to collaborate is that academics are always interested in publishing while teams need to keep their research private. Secondly, Zarren was fond of mentioning the fact that the Celtics led the league in technical fouls last year, and that was before signing Rasheed Wallace. I pray for Tommy Heinsohn’s health.
Meanwhile, Jensen was one of three baseball analysts representing academics from the Wharton School at UPenn who presented their work. In a comparison of fielding metrics, Jensen's SAFE was deemed the most statistically advanced defensive metric publicly available. However, the guys on the Internet who distribute their data for free, in the forms of UZR and PMR, hold their own. Jensen's system also showed that Derek Jeter has been a subpar fielder in the past, so I have to question whether Jensen has an anti-New York bias, whether he's ever watched baseball, and the credentials of the Department of Statistics at the Wharton School.
Talking About Practice?
The topic of team practice was addressed by Gilbert Fellingham, a statistician at Brigham Young University and volleyball enthusiast. Fellingham studied point-by-point volleyball data to see what skills matched up best with results, he determined that, for instance, women’s volleyball teams should spend more time on their transition offense. Of course, there are some skills that are important but are difficult to improve upon, even with countless hours of practice. I’d imagine that every baseball player has a different skill that they should practice, but how can we quantify it? We can quantify player performance and we can detect player weaknesses, but we don't know what areas of weaknesses can be most efficiently improved upon through practice. I have no idea whether there's a uniform practice structure among teams or whether some teams have specific agendas.
The Lesser Sports
Benjamin Alamar of JQAS in researching play-calling in the NFL found that teams under-utilize the pass. When I was watching the Colts play the Cardinals Sunday night, it made my head hurt every time the Colts ran the ball. Keeping the Cardinals’ defense on its toes so that it can’t sit on the pass is important, but that really only matters when there’s a Nash equilibrium (no idea if I'm using that term correctly). What I mean is that if there are more than six people in the box, I really don’t see why the Colts would ever run. Ever. Even if the Cardinals are expecting pass, they still won't be able to defend it since they have x-number of linebackers who can’t do a thing when Peyton Manning airs it out. Alamar said that there’s even a greater chance of a play yielding negative expected points (think run expectancy) on a run than on a pass. The only downside to passing all the time is the risk put on the quarterback through wear to his arm and the threat of the crushing sack.
My favorite presenter may have been Wayne Winston, who provides Mark Cuban with his adjusted plus/minus numbers, which strongly appeal to me. In baseball, plus/minus is also known as WOWY, which I believe is most useful in assessing defensive value, catcher/pitcher batteries, and batter protection. I’ve long known that the statistics presented in an NBA box score are of much less value than those in a baseball box score. The interaction between teammates in basketball can be so subtle that we often don't know what to track. It's difficult to pinpoint why the Timberwolves perform better with Sebastian Telfair on the floor, but apparently they do. Plus/minus confirms in no uncertain terms that playing Ben Wallace in the series against the Cavs was a disaster. It also gives credence to this decade's Kevin Garnett vs. Tim Duncan and Kobe vs. Shaq debates.
Information on NESSIS can be found at its web site here.
| Behind the Scoreboard | September 29, 2009 |
Do Catchers Wear Down in September?
It's getting down to crunch time in the final week of the baseball season. While most of the playoff spots are locked up, this week provides some huge games between the Detroit Tigers and Minnesota Twins, both of whom are looking to win the AL Central crown. The Twins have been carried by potential MVP catcher Joe Mauer and they'll likely need him to produce going into tonight's three game series in Detroit.
But for Mauer and catchers everywhere, it's been a long season and the physical strain of the position has to be taking its toll after 150+ games (though because of injury, Mauer himself has only played in 130). They call the catchers' gear the "tools of ignorance" and no small part of that is due to the pain and fatigue which a catcher goes through during the course of a long season. Surely, due to the grind, everyday catchers' cannot be at the same performance level in September as they were in the spring. At least, that's the conventional wisdom. But is it true, and if so, how large is the effect?
Catchers' Drop In Performance
To take a look at this, I studied all catchers who had caught at least 800 games in the retrosheet era. This narrowed the list down to 97 guys who had long careers and played in many Septembers. I then looked at the OPS of these catchers during their careers as a whole and during the months of September and October and measured the difference.
The average catcher in the group had a career OPS of 718 and a September OPS of 707, representing an 11-point drop, which is some evidence that our hypothesis is true. The drop of 11 points of OPS is not huge, but is it significant? The standard deviation of the difference between the career OPS and September OPS was 4.4 points, meaning that indeed there was a statistically significant drop in production from catchers during the month of September (p-value .005). It would appear that yes, the extra wear and tear on catchers does lead to decreased September performance.
But wait. While we do see a drop in September performance, is this unique to catchers? In fact, from the years 1954 to 2008, hitters hit at an OPS that was 11 points less than their full season OPS. So, while we saw an 11-point drop in catchers' performances, we see exactly the same drop in production from all position players. The conclusion is that while hitting sees a drop in September in general, catchers are no more prone to a drop in performance than any other player (a 95% confidence interval for the September catchers effect is between -10 and + 10 points of OPS). The result is somewhat surprising: catchers are able to withstand the grind of a 162-game schedule just as easily as those playing far less demanding positions.
September Changes
An interesting aside to the question is the way that September offensive performance has gradually been increasing over the past 50 years. The graph below shows the September/full season difference for each year since 1954. As you can see, September OPS was about 20 points lower than the full season OPS in the 50's, but this difference is now close to 'nil. This shift is occurring at about the rate of 0.3 points of OPS per year and a linear model has a p-value of .003, meaning that it is nearly certain that this isn't due to random fluctuation alone. Why this would change is up for debate. One could chalk it up to better conditioning, but of course pitchers are also subject to the rigors of a 162-game schedule and it would seem that they would also improve their conditioning as well, especially considering that teams are far more apt to put their pitchers on pitch counts, presumably helping them stay fresher at the end of the season. I'll let the readers debate this question, but it's an interesting aside to note.
Conclusion
While it seems that September hitting as a whole is improving as time goes on, catchers don't seem to be at any extra disadvantage compared to other position players. The surprising result is that despite playing by far the toughest position on the diamond, they manage to stay fresh throughout the season without any noticeable let-up in performance. As for the Twins, they can rest easy that Mauer will be at his best for this week's series in Detroit. As for the rest of us, it's just another reason to admire the men behind the plate.
| Baseball Beat | September 28, 2009 |
"This Stuff's Harder Than It Looks"
Five years ago, I wrote an article after witnessing via MLB Extra Innings "two of the ten best pitchers in the history of baseball, one of the most underrated pitchers of the past 15 years, the favorite to win this year's American League Cy Young Award, and two of the most highly prized pitching arms in the game." In order, the six pitchers were Roger Clemens, Pedro Martinez, Mike Mussina, Johan Santana, Zack Greinke, and Scott Kazmir.
Greinke was in the midst of his rookie season and Kazmir had been in the majors less than a month. In the comments section, my former partner Bryan Smith asked me, "Well Rich, we know you've now seen Zack and Kazmir pitch this year. You start a team, who do you want? And...let's throw in Ankiel."
I responded as follows:
I can't have all three? Boy, you're no fun.I would rank them as follows:
1. Greinke
2. Kazmir
3. AnkielGreinke is more fully developed than Kazmir and doesn't have Ankiel's past problems (control and elbow surgery) to deal with. He is the most polished of the three by far. However, Zack's stuff doesn't measure up to Kazmir's or Ankiel's. As such, Greinke may not have their upside but he is more of a "sure thing".
Another consideration: Although only 25, Ankiel is four years older than Greinke and 4 1/2 years older than Kazmir.
I followed up my comments by inviting readers to "feel free to jump into the discussion." More than ten writers, analysts, and bloggers ranked Greinke, Kazmir, and Ankiel with a couple mentioning Felix Hernandez, who had yet to make his MLB debut, and Jose Capellan, who had just made his MLB debut. The rankings are well worth reviewing.
Prompted by an email from Jonah Keri, Rob Neyer revisited the post in a Monday Mendozas a year ago August:
• From the Department of Forecasting: From almost four years ago, this discussion of some of the most impressive young starting pitchers of 2004. The general consensus of the commenters, most of whom are among the more highly regarded analysts on the Web, had them ranked in this order:1. Zack Greinke, 2. Rick Ankiel, 3. Scott Kazmir. There was also some love for Jose Capellan, who at this moment is 0-1 with a 13.50 ERA as a starter in the majors. Hey, this stuff's harder than it looks.
At that moment in time, one could have easily argued that Kazmir was the most accomplished of the three and his lack of respect may likely have been what prompted Jonah and Rob to take a second look at our rankings.
A year later, there is no question that the consensus got it right, at least with respect to Greinke. And I'm happy to report that I was among those who ranked Greinke numero uno. In fact, I wouldn't change my order (Greinke, Kazmir, and Ankiel) at all, nor do I think anybody would dispute these rankings with the benefit of hindsight. However, I'm quite certain that a handful of participants would like to have a "do over."
While I got the order right, I missed on Greinke in the sense that I liked him more for his polish than his stuff. As I stated in the body of the article, "He is an artist in the mold of Greg Maddux. The youngster changes speeds, works both sides of the plate, keeps the ball down, and, most importantly, throws strikes." I did not foresee him increasing the average speed of his fastball by nearly five mph in a matter of a few years nor did I envision that his heater would become the most effective in the game. Add Greinke's filthy slider and changeup and his combination of pitches is perhaps the best among all pitchers today.
Kazmir has been pretty exceptional in his own right, fashioning a 3.85 career ERA while striking out 9.3 batters per nine over 865 innings. Meanwhile, Ankiel hasn't pitched since 2004, throwing a grand total of 10 innings since our discussion five years ago.
There are a few reminders here. Pitchers can get better, worse, or injured. Some like to point to the fact that "there's no such thing as a pitching prospect" (or TNSTAAPP for short). That's fine. While overly simplistic, it warns that there's no sure thing more than anything else. Put me in charge and I would change the meaning of TNSTAAPP to stand for: "There's no sure thing as a pitching prospect." In other words, there are pitching prospects out there. There are just no sure things. Greinke included.
For those with short memories, Greinke led the league in losses while posting a 5.80 ERA in 2005, underwent "social anxiety" and nearly quit baseball, spent almost all of 2006 in the minors and the better part of 2007 in the majors as a reliever, and didn't break through until last year. Zack tried the patience of those who saw great things in him, but he has delivered in a big way with one of the greatest single seasons ever.
| F/X Visualizations | September 25, 2009 |
A Last Look at Home Runs
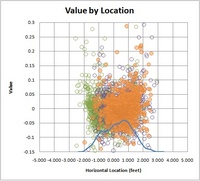
In my last post I looked at how the horizontal location of a pitch hit for a HR related to the angle of that HR in play. I thought the result was aesthetically pleasing and did a good job of showing the strongest trend (most HRs are pulled), but I thought that it may have hidden some other underlying structures or patterns.
So in the short post I want to take a last look at the data in a slightly different way. I broke up the plate into 10 bins and angle of HRs in play into 10 bins. Then counted the number of HRs that went from each of the 10 plate bins into each of the 10 angle of balls in play bins. Here is the result for RHBs.
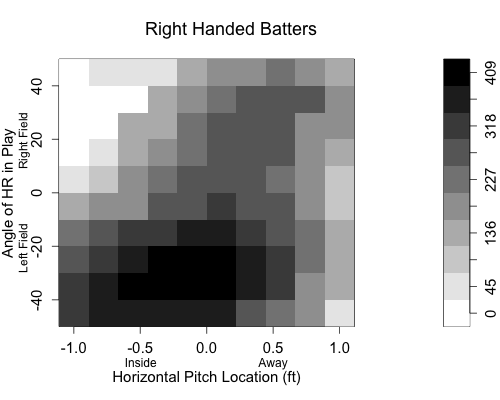
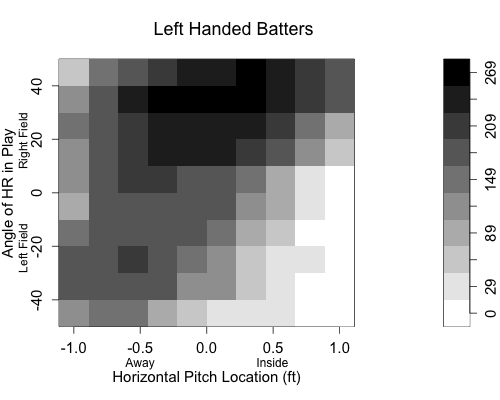
Here you can see that most HRs are hit from pitches middle-in and pulled to left field, just as the previous figure showed. What this shows even better, though, is that the majority of opposite field HRs come on pitches away. In fact inside pitches are very rarely hit for opposite field HRs.
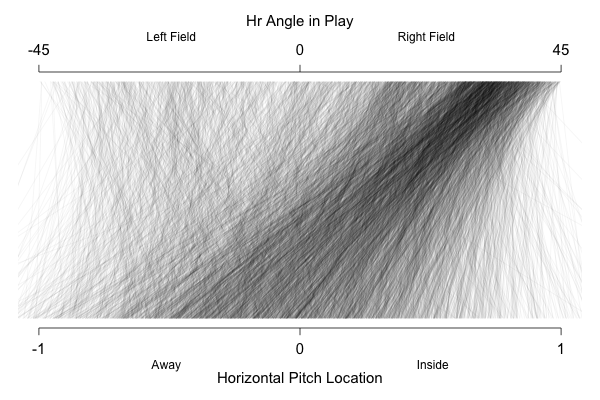
The same overall trend is seen for LHBs
| Touching Bases | September 24, 2009 |
It's Not Whether You Win or Lose, It's Whom You Play
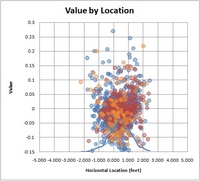
An oft-overlooked piece of information by baseball analysts is strength of schedule at the player and team level. As the regular season winds down and we try to determine who has been the best team in baseball , as well as the Most Valuable Players and Cy Youngs of both leagues, I took a look at quality of opponent to see who has been helped and who has been hurt by the competition.
Giving credit where credit is due, to my knowledge Baseball Prospectus continues to hold the best readily available data on quality of opposition. On BP's adjusted standings page, there is a column for expected runs based on a team's batting line (UEQR) and another column for that same stat, except adjusted for strength of schedule (AEQR).
I plotted the difference between how many runs a team should have scored/allowed with the same number adjusted by strength of schedule. The scale is not very intuitive, so I will explain that teams in the upper-right quadrant have scored more runs and allowed fewer runs due to a relatively easy strength of schedule, while the reverse holds true for teams in the lower-left quadrant.
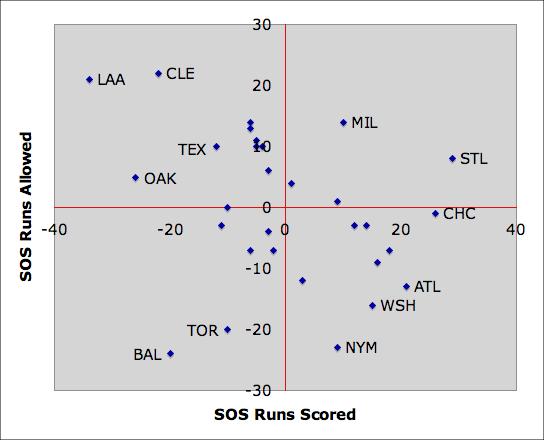
If you look closely, you may noticed that each quadrant is made up of mainly teams from the same division. You see that the AL East may have the highest quality of play, the AL West the best run prevention or worst run scoring, the NL East the best run scoring or worst run prevention, and the NL Central the lowest quality of play.
Given a fair strength of schedule, the Orioles would have been expected to score some 20 runs greater and allow some 20 fewer with a fair strength of schedule. Given this fact, as well as Baltimore's youth, and the concept of regression to the mean, you can already mark me down for the Orioles' over next year. Because of the potency of the Yankees’ lineup, the rest of the AL East actually should have earned better run production marks. Unsurprisingly, the Jays and Orioles have the largest difference between their second-order wins and third-order wins, or in English, they have faced the most skewed schedules in baseball.
Adjusting for luck and schedule, the Indians have carried the strongest offense in their division by a fair margin, and will surely make for a trendy pick, as usual, among analysts in next year's predictions. With my apologies to Rich Lederer, who is probably tired of his Angels’ Pythagorean record being discussed, I have to mention oddities in the Angels’ record. Not only have they managed to outplay their run differential, but according to BP, the Angels’ have gotten lucky in the number of runs they've scored and allowed. The Halos are really the only team in their division that can hit, so their staff is likely not as good as we think. Furthermore, Angels hitters lead the league in BABIP and have been unusually successful with runners on base as compared to their production with the bases empty. However, each team in the AL West plays defense ranging from above average to excellent, so to be fair, the entire division's run-scoring has been depressed by playing each other.
The American League owned a .546 winning percentage in Interleague Play this year, marking the fifth straight year of American League utter superiority. I do wonder whether any National League team would have boasted a winning record playing in the American League East.
To check out individual players' quality of opponent, I moved on to BP's quality of batters and pitchers faced reports. The reports give quality of opposition in terms of the triple-slash-stat line.* I limited my sample to pitchers with at least 300 batters faced and batters with at least 300 plate appearances.
*Instead of GPA and OPS, why haven't we ever used what I believe to be the most sensible combination of OBP and SLG, 1.75 multiplied by OBP and then added to SLG? We could then keep it on that scale, which has a league average of exactly one, as in 1.00. Wouldn't that be a rough measure of offensive production that makes everyone happy, more or less?
The eight pitchers in baseball, and 14 of the top 15, who have faced the highest quality of opposition all hail from the American League East, including Roy Halladay coming in second to David Hernandez. Roy Halladay is awesome. Again, to illustrate the difference in quality of play between the leagues, I will refer to John Smoltz and Brad Penny. The opposing batter's quality of slugging percentages against Smoltz and Penny have gone down 20 and 11 points respectively since the pair left the AL East. Cliff Lee's difference has been a mere seven points in slugging. Todd Wellemeyer has had the easiest go of any pitcher this year.
You may not know of the stat kept at Baseball Reference called platoon percentage, but I feel it is an important piece of information in showing the competition a player has faced. Paul Maholm, whose platoon split I looked at last week, has been unlucky enough to have had the platoon advantage least often among pitchers with at least 100 innings.
The top six pitchers of the year in each league, in my opinion, excluding Lee who split time between leagues and whom I already mentioned:
| First | Last | AVG | OBP | SLG | PTN% |
|---|---|---|---|---|---|
| Roy | Halladay | .268 | .344 | .433 | 0.43 |
| Justin | Verlander | .265 | .338 | .425 | 0.43 |
| Felix | Hernandez | .264 | .337 | .424 | 0.45 |
| Jon | Lester | .262 | .334 | .424 | 0.26 |
| CC | Sabathia | .261 | .333 | .416 | 0.23 |
| Zack | Greinke | .261 | .333 | .420 | 0.53 |
| Adam | Wainwright | .255 | .329 | .403 | 0.54 |
| Javier | Vazquez | .254 | .328 | .403 | 0.49 |
| Dan | Haren | .253 | .328 | .401 | 0.48 |
| Tim | Lincecum | .251 | .329 | .397 | 0.45 |
| Chris | Carpenter | .252 | .325 | .393 | 0.53 |
| Ubaldo | Jimenez | .253 | .323 | .394 | 0.47 |
Chase Headley and Kevin Kouzmanoff, who both might actually be quality Major Leaguers, have had the misfortune of not only playing half their games in Petco, but also facing the most difficult slate of pitchers among hitters. This list may well be flawed, since pitchers who get to throw multiple times against the Padres will have their stats inflated. This might be the reason that Padre hitters appear to have faced quality pitchers. Following this logic, it makes sense that Melky Cabrera and Derek Jeter have faced the pitchers with the aggregate highest opposing OBP and SLG against since these pitchers have been subjected to the Yankees. I'll present the list anyway.
| First | Last | AVG | OBP | SLG | PTN% |
|---|---|---|---|---|---|
| Derek | Jeter | .256 | .338 | .414 | 0.28 |
| Mark | Teixeira | .255 | .335 | .412 | 1.00 |
| Kevin | Youkilis | .254 | .336 | .406 | 0.28 |
| Miguel | Cabrera | .252 | .334 | .400 | 0.27 |
| Ben | Zobrist | .250 | .333 | .396 | 1.00 |
| Joe | Mauer | .249 | .332 | .396 | 0.62 |
| Hanley | Ramirez | .251 | .337 | .399 | 0.26 |
| Chase | Utley | .249 | .336 | .397 | 0.65 |
| Derrek | Lee | .250 | .335 | .400 | 0.18 |
| Albert | Pujols | .247 | .334 | .398 | 0.26 |
| Prince | Fielder | .247 | .336 | .395 | 0.73 |
| Adrian | Gonzalez | .241 | .328 | .388 | 0.62 |
| Change-Up | September 23, 2009 |
Twenty Five
Towards the end of August of this season, as Jon Lester was wrapping up a month in which he would strike out over four times as many batters as he would walk and hold opposing hitters to a .178/.242/.271 line, I thought it might be interesting to see how he was stacking up from an historic perspective thus far in his young career. Let's leave aside his personal story for the moment and take note of the fact that at the age of 25, he has now posted back to back seasons of better than 140 ERA+ pitching while throwing a good amount of innings and backing it up with impressive peripherals. What's more, his strikeout rate has jumped more than 50% in 2009 over 2008 to nearly 10 strikeouts per nine innings, suggesting he may have developed to the point where he will be an elite pitcher for years to come.
But let's stick to the present. I wanted to have a look at how many other players in the last 50 years had pitched as impressively as Lester had in his 24 year-old and 25 year-old Big League seasons. So of course, I ventured over to Baseball Reference's Play Index. Parameters: Since 1959, the best combined 24-25 seasons, minimum 350 innings pitched, as determined by Adjusted ERA+. Admittedly I cherry-picked these parameters because they apply specifically to what I had observed about Lester - that he had been very good in his 24 and 25 seasons. Here is the list this criteria produced:
Player     From-To   ERA+   K/9    K/BB
Appier     '92-'93   173    6.77   2.26
Lincecum   '08-'09   170   10.51   3.48
Santana    '03-'04   166   10.11   4.30
Greinke    '08-'09   155    8.88   4.07
Pedro      '96-'97   154   10.36   3.85
Seaver     '69-'70   152    7.84   2.98
Clemens    '87-'88   148    9.02   3.77
Zito       '02-'03   145    6.40   1.98
Oswalt     '02-'03   145    7.89   3.47
Webb       '03-'04   143    7.78   1.80
McLain     '68-'69   143    6.28   3.55
Lester     '08-'09   143    8.16   2.91
Yes, it’s arbitrary but take a look at that. We are witnessing three of the best 25 year-old pitchers of the last 50 years. In fairness, Tim Lincecum and Zack Greinke are in a league all their own but Lester holds his own, showing up 12th on the list. And with his peripherals as strong as ever but his balls in play luck down a bit, Cole Hamels, another 25 year-old, probably deserves a spot here as well. Had he posted ERA numbers similar to his 2007 and 2008 seasons in 2009, he would be right there.
What’s even more interesting is that when you take a look at the head scratchers, the guys that might make you inclined not to place much stock in such a list, a look at their peripheral numbers accurately predicts which pitchers would continue their greatness and which pitchers might take a step back. Kevin Appier and Barry Zito, for instance, rank at the bottom of the list in K/9 and K/BB. Soon after their 24-25 seasons, Appier and Zito would both settle in as very good pitchers and not the great ones their ERA figures might have suggested they had become. You could place Brandon Webb in that category, too, but his ridiculous 119 walks in 2004 badly skews his numbers. Never again has he even approached that number of bases on balls. Denny McLain’s K/BB numbers were terrific but his K/9 figure did not quite stack up. Either way, injury and off-the-field trouble would derail McLain’s career.
So we have whittled the list down a bit. We’re going to keep Webb for the reasons specified above but eliminate Appier, Zito and McLain. Also, let’s take the following into account; since the All-Star Break 2008, in 43 starts, Lester has posted a 9.2 K/9 and 3.48 K/BB – numbers that push him a lot closer to that Lincecum and Greinke neighborhood than the Appier one. Like Timmy and Zack, Lester’s future looks bright. With our new list, Lester finds himself alongside the no-brainer 2009 AL and NL Cy Young Award winners, Johan Santana, Pedro Martinez, Tom Seaver, Roger Clemens, Roy Oswalt and Webb. Not bad company at all.
The Play Index is great fun for things like this. If you suspect one of your favorite players might be inching up (or down) into select company, have a look. In this case, I learned that baseball is currently showcasing some of the most promising - historically promising - young pitching talent to burst onto the scene simultaneously in years. And that Jon Lester is one heck of a pitcher.
| Behind the Scoreboard | September 22, 2009 |
Can We Measure Clubhouse Chemistry?
This past weekend brought the news that Milton Bradley, the underperforming Chicago Cubs right fielder, was being suspended for the rest of the season. The suspension was brought about by his comments to the Daily Herald newspaper, in which he told reporters he was unhappy in Chicago, and that he was not surprised the Cubs had not won in 100 years due to the aura of negativity which permeates the team.
One can assume that the comments, inflammatory to be sure, but hardly the stuff that usually warrants a 3-week suspension, weren't really the whole story. Bradley, known around the league as one of baseball's biggest troublemakers, has been a clubhouse distraction and has had problems all season long, including a spat with manager Lou Piniella in June when he was kicked out of the clubhouse.
For the Cubs and GM Jim Hendry, the value of Bradley's on-field performance had been eclipsed by his attitude and behavior in the clubhouse. To be sure, part of what went into Hendry's calculus was the fact that Bradley has been a disappointment on the field - it's hard to imagine the Cubs benching him if he were having the kind of year he had in Texas in 2008. And it's that kind of calculation that is the focus of today's article.
The Intangibles
With the sabermetric revolution, one of the great immeasurable things is a player's contribution to the clubhouse. How much extra value does a "good guy" bring more than just your average player and, more importantly, how much of a determinant are those infamous "clubhouse cancers"?
These types of questions are tough to get a handle on with statistics alone. One could attempt to measure the impact on his teammates' performance, but of course, the variability is so high, the confounding variables so numerous, and the impact so small, that there would never be enough power to see any real results. Nevertheless, players' intangible qualities and clubhouse presence are purported have an impact on the teams' behavior.
While we probably can't really measure the actual impact of a player's clubhouse demeanor on his team's W-L record (sorry if that's what you came here looking for), it might be possible to examine of how teams seem to value a player's intangible clubhouse presence based upon their behavior.
A case in point is Milton Bradley. Despite the fact that Bradley is not having a year up to his usual standards, he has still been an average right fielder this year, and has been worth 1.2 Wins Above Replacement. Factor in that Bradley probably has been getting a bit unlucky this year due to the regression effect, and his true on-field value is probably more than that. Yet, the Cubs made the calculation that the 1.2 wins he was gaining on the field were less than what he was losing off the field. Hence, the suspension for the rest of the year.
Going with another Cubs example, Sammy Sosa, who was never a peach even when he was breaking home run records, was similarly ousted due to non-performance related issues. After a stormy but productive 2004 season, the Cubs felt the need to practically give away Sosa the following year. His 2.4 offensive WAR was gone and the Cubs received nearly nothing in return, eating most of his salary as well. While age and swirling steroid fears probably made Sosa's 2005 projection only about half of his 2004 value, he was still likely to be a productive player. Yet the Cubs and their fans were happy with the decision to give away Sammy because they were rid of the "clubhouse cancer".
Shea Hillenbrand comes to mind as well. With a 3-year average WAR of 1.4, he was a decent player for Toronto in 2006, and was hitting over .300 at the time, when he was outright released by the Blue Jays for disrespecting the team and the management. The Jays lost Hillenbrand's 1.4 wins on the field, but presumably, in the Jays' minds, gained back at least 1.4 wins by sending Hillenbrand's attitude packing.
Of course, there is a limit to the quality of skill that a team will jettison. Plenty of reported "clubhouse cancers" have had long, productive careers. Albert Belle comes to mind. So does Barry Bonds. Had these players been lesser talents, they would have likely been gone long ago, but teams don't release MVP-caliber players. In fact, I can't think of even a 3 or 4 WAR all-star caliber player ever having been given away or released largely due to clubhouse attitude. Instead, teams learn to deal with these players, rather than oust them. At most, they'll trade them, usually taking less value than his on-field value would normally merit.
It would appear that at max, a team considers even the jerkiest behavior worth about -1.5 wins over the course of a season. From the examples above, and some intuition, it seems that league average players can be released due to serious "cancerous" behavior, but that above that level, teams would rather deal with the player's attitude than give up his talent.
An interesting question is the distribution of a player's clubhouse impact. This is purely theoretical, but I would imagine that the impact of player's attitude is skewed heavily to the left, so that there are many players with small, but positive impacts, but that it's pretty much impossible for someone to have a very large positive impact. Meanwhile, I would imagine that the distribution skews well into the negative, where a few players can have a large negative impacts on a team. As most people who have been in group situations can tell you, the maximum positive impact that any one person can have on morale and attitude is relatively small compared to the disruption and difficultly caused by a few bad apples. At least, that's my hypothesis. As a result, while 1.5 wins may be the maximum negative win contribution a player can have on a team, the maximum positive clubhouse impact is probably much smaller. My best guess at the distribution of clubhouse attitude would something like the following:
No Replacement Level Jerks
The distribution of course, is just a guess, but let's see if it makes sense in another context by looking at bench players. If the average bench warmer has a WAR of 0.5, it would make sense that there would be no benchwarmers who's attitude would be worth -0.5 WAR. If we use the distribution above, it means that that bench caliber players who are among the 90th percentile of jerkiness would not make the major leagues due to their attitude. Put another way, of the 10% jerkiest players in baseball, none are scrubs.
Does this calculation reflect reality? I've never been inside a major league clubhouse, so it's tough to know. However, relief pitcher Todd Jones seems to agree. According to Jones' article for the Sporting News, there are very few jerks who are bench guys and long relievers and most scrubs are usually good guys. Bad players with bad attitudes are non-existent, but bad players with good attitudes might make the club.
All About Chemistry
So, if we assume that each player has a clubhouse contribution, with the mean centered at zero and a small standard deviation of about 0.2 wins, how much can clubhouse chemistry really affect the team's overall performance? Multiplying the SD by the square root of 25, we see that clubhouse chemistry would have a standard deviation of 1 win, meaning that the team with the worst chemistry in baseball will lose about 2 extra games because of it, while teams with the best chemistry gain about 2 extra wins. At least, that's the best estimate we have from looking at teams' behavior with regard to their personnel decisions.
The true value of chemistry is probably so difficult to determine, that it cannot be ascertained directly. If teams are under or over valuing clubhouse chemistry, then theoretically a team could take advantage by assembling an all-jerk team or an all good-guy team to take advantage of the inefficiency. However, by looking at teams' behavior, we have attempted to estimate at least what clubhouse attitude is currently valued at among major league teams. Is it valued correctly? For that, perhaps an even more subjective view is needed.
| F/X Visualizations | September 22, 2009 |
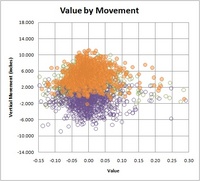
Correction to Last Friday's Post
I made a rather large error in my post last Friday about home runs. The error was in the last two figures that showed the relationship between the horizontal location of a pitch and the horizontal angle in play of the resulting HR. This error led to an incorrect conclusion. Here is what the graph should look like for RHBs.
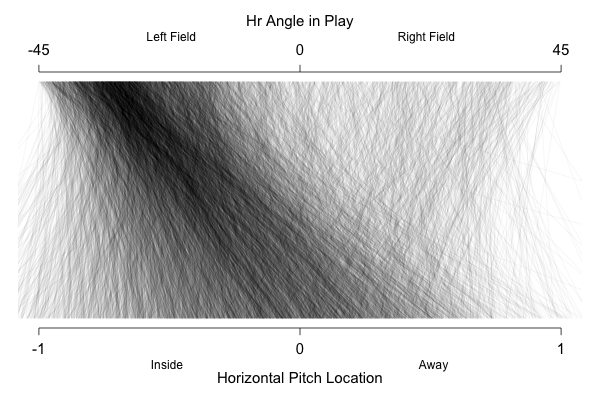
And here for LHBs.
I want to thank Mike Fast who pointed out the problem to me and also apologize to the readership here at Baseball Analysts for this error. I have edited the original post with the correct graphs and text.
| Designated Hitter | September 21, 2009 |
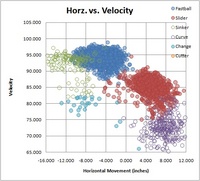
Best Fastballs in Baseball
A few weeks back, Jeremy Greenhouse presented a new method for evaluating who throws best pitches in baseball. Building on work by Dave Allen and John Walsh, the principle is to evaluate pitches based on their outcomes. Jeremy's innovation was to use regression to predict the likelihood of each outcome, given the velocity and movement of each pitch. Previous methods (such as those at FanGraphs, have the problem of giving too much credit to lucky pitchers. If two pitchers throw exactly the same pitch, Bronson Arroyo may get an out, and Chris Carpenter gives up a hit. The outcome-based method would give exactly the same credit to both pitchers.
While Jeremy was working on his analysis, I was working in parallel on a similar method. I've used a kernel density estimator and expectation-maximization algorithm to classify each of the 480,000 pitches throw by right-handed pitchers to right-handed batters between 2007 and 2009, and then estimate the likelihood of relevant outcomes. Some differences, instead of movement and velocity, this analysis includes five parameters: horizontal location, vertical location, velocity, vertical movement, and horizontal movement. Further, we can look at each pitch along each dimension in isolation to give a rough estimate of the importance of each dimension.
Note that although this method is not biased to favor lucky pitchers, it may be biased to punish pitchers with "intangibles." We can build any physically measurable factor into our model, but that won't help us quantify the value of "deception." I fully believe that some pitchers have strange deliveries that throw a batter's timing off, and some are better at sequencing their pitches. This method will undervalue them, because it is essentially evaluating each pitch in isolation. This method will fail to account for pitch selection or sequencing, or any contextual variables. Having a variety of pitches allows a pitcher to set up better pitch sequences, which will make the same fastball more successful. This method can't account for that.
Relative Importance of Components
Once each pitch was evaluated along each of the 5 dimensions, we could look to see how well these values correlated with the overall value of the pitch. This is sort of daft--we have a high powered mathematical algorithm that takes into account high-order statistical dependencies, and then we use a linear regression to evaluate the components. In using the regression for this step, we will lose the ability to look at nonlinearities and interactions, but its a first step. Depending on which pitches we look at (just 4-seamers, or all fastballs), this linear model explains 50 to 90% of the variance.
Regardless of how which pitches we include, the most valuable component is Velocity (with a beta of .592), followed by vertical location and movement (.494, .338 respectively). horizontal location limps in next at .163, and horizontal movement had might as well stayed home, at .070. These numbers change slightly depending on the parameters of the model, and the filters and such, but the general picture remains the same.
Top 20 Fastballs
Here is a list of the top 20 fastballs thrown between 2007 and August 2009, inclusive. Pitches are averaged by pitch type (4-seam fastball, FB; 2-seam fastball, FT; cut fastball, FC), for each pitcher and then ranked by average value. The marginal value of the pitch dimensions are summarized in Control, Velocity and Movement, evaluated by calculating how much value would drop by removing these dimensions. These values are represented as weighted Z scores.
| Rank | Player | Value | Type | Control | Velocity | Movement |
| 1 | Zack Greinke | -0.0313 | FT | 1.13 | 2.68 | 0.90 |
| 2 | Roy Halladay | -0.0304 | FT | 0.73 | 2.19 | 0.72 |
| 3 | Ronald Belisario | -0.0181 | FB | 0.38 | 2.05 | 0.33 |
| 4 | Ubaldo Jimenez | -0.0166 | FB | 0.33 | 2.14 | 0.25 |
| 5 | Jonathan Broxton | -0.0164 | FB | 0.18 | 1.87 | 0.09 |
| 6 | Felix Hernandez | -0.0155 | FB | 0.38 | 1.94 | 0.25 |
| 7 | Roy Halladay | -0.0150 | FC | 0.50 | 0.96 | 0.55 |
| 8 | Heath Bell | -0.0149 | FB | 0.41 | 1.39 | 0.28 |
| 9 | Mariano Rivera | -0.0130 | FC | 0.19 | 1.32 | 0.32 |
| 10 | Bobby Jenks | -0.0123 | FB | 0.31 | 1.15 | 0.07 |
| 11 | Daniel Bard | -0.0122 | FB | 0.13 | 1.42 | -0.01 |
| 12 | Brandon Morrow | -0.0118 | FB | 0.11 | 1.20 | 0.21 |
| 13 | Joel Zumaya | -0.0112 | FB | -0.08 | 1.95 | -0.14 |
| 14 | Vin Mazzaro | -0.0106 | FB | 0.34 | 1.04 | 0.26 |
| 15 | Andrew Bailey | -0.0101 | FC | 0.38 | 0.51 | 0.37 |
| 16 | J.J. Putz | -0.0095 | FB | 0.20 | 0.96 | 0.14 |
| 17 | Joe Nathan | -0.0092 | FB | 0.19 | 0.63 | 0.26 |
| 18 | Freddy Dolsi | -0.0090 | FB | 0.12 | 1.47 | 0.12 |
| 19 | Chris Carpenter | -0.0090 | FB | 0.24 | 1.34 | 0.26 |
| 20 | Kevin Jepsen | -0.0090 | FB | 0.18 | 0.99 | 0.13 |
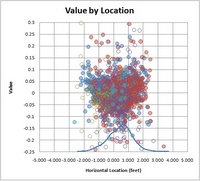
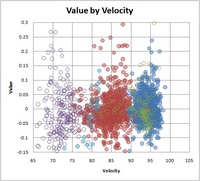
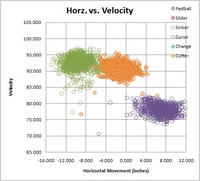
Pitcher Plots
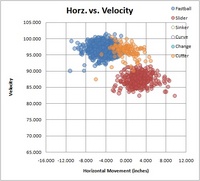
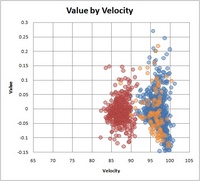
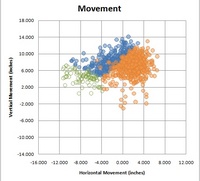
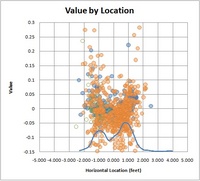
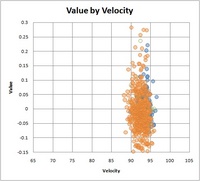
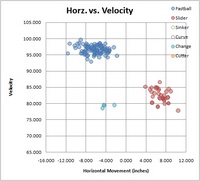
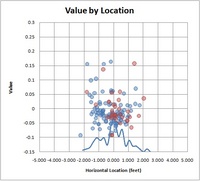
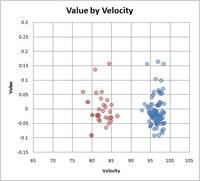
Below, I've plotted the pitch values on a pitch-by-pitch basis for a few pitchers I selected arbitrarily. The first plot shows the movement and the velocity of each pitch, to give a sense of how successful the pitch classification system was. The second and third plots show the expected value of each pitch plotted against its X location and velocity.
#1 Zack Greinke, 2-Seam Fastball
Greinke's two-seam fastball was given the highest rating in both control and movement and velocity. These values reflect how much the value of the pitch decreases when you remove that dimension from the equation. So it is a little misleading, since a better pitch has more to lose if you remove an important dimension. There are many guys who throw harder than Greinke, but there are no pitchers who would suffer more if they suddenly had league-average velocity.
#2 Roy Halladay, 2-Seam Fastball
#7 Roy Halladay, Cutter
My classification system says that Halladay has 3 pitches: the 2-seam fastball, the cutter, the curveball. He probably has a change-up that is being misclassified as well. But however you split it, they are a very good pair of pitches. The value-by-location plot shows pretty good control; he hits the outside half of the plate frequently.
#3 Ronald Belisario 4-Seam Fastball
If you don't know who Ronald Belisario is, you're not alone. His fastball averages 95 mph, and crosses the plate in the zone 56% of the time. He has a 1.92 ERA in 65 innings, though with a somewhat low BABIP. We only have 319 pitches to analyze, so he's likely getting somewhat lucky,
#5 Jonathan Broxton, 4-Seam Fastball
Broxton has a crazy good, totally boring fastball. Its all about velocity. He averages nearly 97 mph, and you can see from the value by velocity graph that he can touch 100, where his value spikes. His vertical movement is good, averaging 10 inches. He also has good command, hitting the strike zone 57% of the time. No bells or whistles here, just heat.
#9 Mariano Rivera, Cutter
If Rivera wasn't included as one of the top fastballs, we'd know something is wrong. Want to see something really beautiful? Check out the histogram at the bottom of the value-by-location plot. That's control.
#11 Daniel Bard, 4-Seam Fastball
Our scouts tell us Bard relies a 96 mph fastball that can reach 101 mph and a 82 mph slider wih bite. He also supposedly has a high 80s cutter, a low 90s sinker, and a change-up. We don't have enough data from Bard to see his full range--he only barely makes the 100 pitch minimum--but we can still get an initial look.
Pitch F/X agrees with the scouts: he has a very consistent 97 mph fastball with 11 inches of vertical movement. He relies heavily on the fastball and slider, but he has also thrown a handful of change-ups. He has not yet thrown a low 90s sinker or high 80s cutter in the majors. The lateral location of his pitches looks bimodal, almost like he's either trying to throw inside, or hit the outside edge. Those inside pitches account for many of his worst pitches. His best pitches were high and outside.
#27 Jonathan Papelbon, 4-Seam Fastball
When he's not dancing, he throws this...
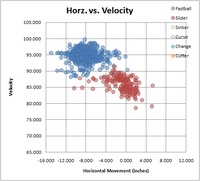
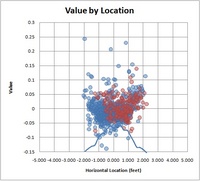
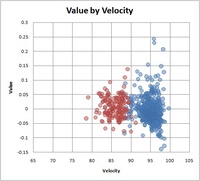
Other Rankings of Note
#22 Adam Russell
#29 Grant Balfour
#30 Josh Beckett
#32 Matt Lindstrom
#43 Frank Francisco
#45 Justin Verlander
#50 Zack Greinke's other fastball
| F/X Visualizations | September 18, 2009 |
Home Runs: Where Did You Come From, Where Are You Going?
Last week I looked at Carlos Pena's HRs, examining the angle in play based on the horizontal location of the pitch. Today I am going to do so for all batters. First off it is important to understand how pitchers pitch differently to RHBs and LHBs. Here is the frequency of fastballs thrown to RHBs and LHBs by horizontal location. I flipped the horizontal location for lefties so the inside of the plate is on the same side of the graph for both groups.
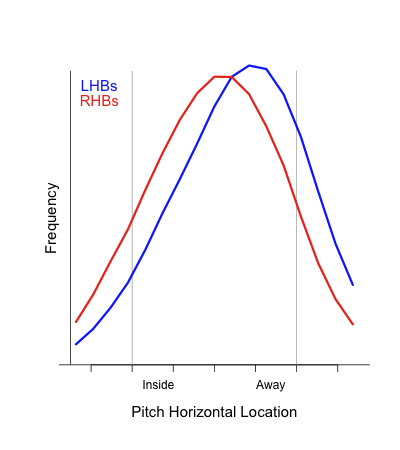
As you can see pitchers throw much further away to lefties than to righties. This is true of both LHPs and RHPs, so it is not an artifact of say opposite handed at-bats tending to be pitched farther away and there being more RHPs. Pitches to RHBs are centered only slightly away of the center of the plate. Strangely the power profile of lefties and righties suggest that pitchers should do the exact opposite.
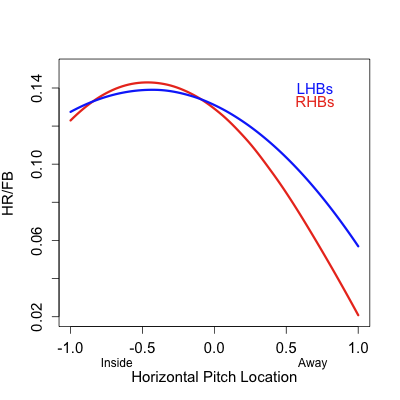
Although both have more power inside, the difference is more pronounced for RHBs that for LHBs. So that RHBs have slightly more power inside than LHBs inside, while LHBs have much more power away than RHBs away.
So we have a situation in which LHBs seen most of their pitches far away in the zone and have relatively good power there, while RHBs see pitches most of their pitches closer to the center of the plate, maybe shifted slightly outside. But their power is much greater middle-in.
This section is a correction of the original version.
The result for RHBs is that most of their HRs come from the middle of the plate, where they see a lot of pitches and still have good power.
The highest density of HRs are on pitches middle-in and most of those are pulled to left field. Even pitches that are slightly away are generally pulled. It is a little hard to see, but most of the opposite field HRs are on away pitches. That is there are few steep lines going from the bottom left of the graph to the top right of the graph.
Now, recall that lefties see mostly outside pitches, and that they have fairly good power on those pitches. The result is that most of their HRs come from pitches away.
You can see the higher density of HRs middle-away compared to the RHBs higher density middle-in. With that exception the image is largely a mirror image of the RHBs image, with most of the HRs pulled to right field. This graph also shows that my conclusion from last week probably wrong, Carlos Pena is really not that extreme in his HRs. I do think that Pena's HRs did come even more away than most lefties, but this does show that Pena is just an exaggerated version of what most average lefties looks like, not a major outlier.
| Designated Hitter | September 17, 2009 |
Unraveling the Batter’s Brain
[Editor's Note: Dave Baldwin is a former MLB pitcher. He pitched for the Washington Senators (1966-1969), Milwaukee Brewers (1970), and Chicago White Sox (1973). His best season was 1967 when he posted an ERA of 1.70 with 12 saves. Dave has been a member of the Society for American Baseball Research since 2002.]
Part of any pitcher’s job is to understand what goes on in the murky, cobwebby recesses of a batter’s head as the ball is hurtling toward the catcher’s mitt. In fact, this is a pitcher’s most formidable task because the wiring of the batter’s brain is a neuronal mishmash, poorly understood even by the best of baseball’s neuroscientists.
But let’s not be too hard on the batter’s poor brain—it is asked to do an incredibly tough job. During the first two-thirds of the pitch’s flight, the batter simultaneously collects information and performs critical calculations with respect to the ball’s trajectory. From these calculations, he predicts where and when the ball will be at the potential point of impact with the bat. When the ball is approximately twenty feet from the ball/bat contact point, a decision is made and the batter commits to taking the pitch or swinging. That decision is absolutely irreversible if the batter is taking, and if the batter is swinging, he can’t change the trajectory of the bat’s sweet spot (although he can still attempt to check the swing by pulling his hands against his body).
So Little Time
A good fastball traveling at, say, 90 miles per hour (mph) takes about four-tenths of a second or 400 milliseconds (msec) to get from pitcher’s hand to the contact point (assuming the pitcher releases the ball about five feet in front of the pitching rubber and contact is made about a foot in front of home plate). The batter’s noggin has about 270 msec or a little more than a quarter of a second to get its ducks in a row and start the swing. But, although the bat has started its journey, the batter’s conscious mind is still unaware that the batter has decided to swing.
How do we know this? In the 1970s, neurophysiologist Benjamin Libet conducted a series of experiments to determine the relationship between the conscious intention to carry out an action and the initial brain activity that must precede the action. He found that the brain lights up about 350 msec before the conscious mind is aware the action is to be taken (Libet, 1985; Libet, et al., 1983). But the batter’s brain has only 270 msec to decide whether and where to swing. If these decisions were to be made by the conscious mind, the ball would be in the catcher’s mitt before the batter could do little more than start moving the bat. In fact, the ball is only 50 msec (about seven feet) away from the contact point when the batter’s conscious mind finally realizes that he is swinging the bat. The batter can do nothing to alter the swing in that final 50 msec. Thus, he is hitting with his unconscious mind.
What we are calling the “conscious mind” is primarily the cerebral cortex. The “unconscious mind” comprises those brain components that collectively produce mental phenomena occurring without the person being aware of them. The ancient, deep-brain region called the limbic system (amygdala, hippocampus, hypothalamus, etc.) is a major part of the unconscious mind. It interacts with the cerebellum, a brain structure responsible for coordinating muscle activity during the batter’s actions. This is the same quick neural circuitry that tries to save a hiker who is the target of a rattlesnake’s strike. A hiker dodging a two and a half-foot strike of a five-foot snake has about 200 msec to come to the conclusion to jump—even less time than is granted the batter, but the hiker’s problem is much simpler, of course.
What the Batter's Brain Must Do
Let’s consider the steps the batter’s brain must take during those critical 270 msec. First, the unconscious apparatus must gather information about the behavior of the ball. If it fails in this initial task, the batter might just as well go up to the plate with a wet noodle instead of a bat.
The batter needs to begin collecting pitch information as soon as possible. To prepare for this “quick read,” the batter’s conscious mind concentrates on an imaginary “box” where he expects the pitcher’s release point to be. Thus, his cerebral cortex is thoroughly occupied and doesn’t hinder the unconscious mind. If he has guessed correctly and the ball is released from that box, he can begin to evaluate the pitch as it leaves the pitcher’s hand. Otherwise, the batter must spend precious milliseconds searching for the ball.
Not only must the batter predict where the ball will be at the instant of bat/ball contact but when the ball will arrive there, as well. To do this, the batter observes the trajectory and calculates the rate at which it is changing in each of the spatial dimensions. The visual parameters used by the batter to accomplish this are the apparent size of the ball’s image (used to estimate distance to the ball), distance of the image off the foveae of the batter’s retinas, and the horizontal angles of the right and left eyes. The time until bat/ball contact is calculated by the ratio of the image's apparent size to the rate of change of this size. These calculations are performed without the batter’s awareness.
During the early stage of the trajectory, the image seems to be coming very nearly directly at the batter’s eyes, but as the ball gets closer to the contact point, the horizontal angles of the eyes expand, and the eyes have increasing difficulty keeping the image on the foveae. In fact, the eyes aren’t able to follow the pitch all the way to the ball/bat contact—the image “outruns” the foveae when the ball is about five feet from the contact point (Bahill & Baldwin, 2004). This doesn’t matter since the batter can do nothing at that point to alter the trajectory of the bat’s sweet spot. During the last five feet of the pitch’s flight, the batter would do just as well if he had his eyes closed.
Note that the ball “appears” to approach the contact point more rapidly in the later stages of its flight, even though the 90 mph pitch actually slows by about eleven and a half mph because of drag force during the flight. The batter’s mind makes adjustments for this phenomenon. To experience this illusion, watch the median stripes on a highway as you travel at a constant speed of 60 mph. A stripe that is quite distant down the highway will seem to creep toward you, while a stripe very near the car will seem to whiz by, even though the car is moving at the same speed relative to the two stripes, of course.
Besides using the visual clues discussed above, the batter might also check out the ball’s spin pattern for indication of pitch behavior. Some batters report seeing a pattern of stripes (and maybe a dot) made by the red seam as it whirls around the axis of the ball; some say they can’t see anything but a gray blur. If a batter’s unconscious mind recognizes the spin of the pitch, it has information about the direction and magnitude of the ball’s spin-induced deflection (Bahill, et al., 2005). The trajectory of any spinning pitch (i.e., one that isn’t a knuckleball) will be deflected by the spin to some extent. Hitting a baseball is a skill of precision—the batter must adjust to even a slight deflection.
I surveyed fifteen former major league position players and found that only eight remember seeing the seam spin pattern. These results might indicate visual differences, or they might stem from variation in the way the pattern is processed and stored in the brain. Coaches generally assume that the ability to see the spin pattern will make for a better hitter, but the success of a batter doesn’t seem to be related to his ability to recall seeing this pattern. Using two Hall of Famers as examples, we note that Frank Robinson has reported he was able to see the seam, but Mike Schmidt has said he was never able to see it (Schmidt, 1994).
Taking Advantage of the Batter's Brain
How can the pitcher benefit from knowing how the batter’s brain works? For many decades pitchers have known how to “set up” the batter for an out pitch. The pitcher does this by using the residual image of the previous pitch to confound the hitter. This works because the image resides somewhere in the unconscious mind, retained in short-term memory. The pitcher sets up the batter by showing him a pitch—say, a high, inside, smoking fastball. The batter can’t help but maintain the memory for some short period—long enough to allow the pitcher, working quickly, to come back with an ever sooooo slooooow curve while smoke is still hanging around in the batter’s cranium. Psychologists call this “visual priming”—an earlier visual stimulus influences response to a later visual stimulus. Knowing how to set up the batter is an important part of knowing how to pitch.
The pitcher can also benefit from a distraction of the batter’s unconscious mind or from giving the cerebral cortex extra information to process, thus interfering with the unconscious operations. I once had a catcher who would, on occasion, toss a handful of dirt on the batter’s shoes just as the pitcher was releasing the ball. He would do this only on a crucial pitch at a crucial point in the game. This made the batter’s unconscious mind spend some milliseconds trying to deal with the surprise.
Another way to accomplish this is to startle the batter with a loud or threatening noise. A few pitchers in baseball history have developed the knack of giving out a resounding grunt just as they released the pitch. And I remember hearing of a catcher who, now and then, would blast the batter with an ear-splitting whistle at an opportune moment. Both of these tricks distracted the batter. The unconsciousness switches from processing visual information to handling the unexpected auditory information. This switch has some real-life practical applications, such as heeding the snorting of a charging rhinoceros.
Several pitchers have had success in giving the batter’s conscious mind plenty of time to make decisions. The “eephus” thrown by Rip Sewell in the 1930s and ‘40s, and Steve Hamilton’s “folly floater” of the ‘60s are prime examples of pitches that worked well in part because they allowed the batter’s clumsy cerebral cortex to get involved. These pitches were lobs that reached a height of twenty feet or more at the apex. Pitches tossed to such a height take more than a second to reach the potential contact point—long enough to give the cerebral cortex plenty of time to get wound around itself, pondering how to slant the swing.
This is a difficult problem because a swing angled with a slight uppercut (usually the most effective angle on a normal pitch) will cut perpendicularly across the path of the descending lob, making timing the swing extremely difficult. The best angle with respect to timing the lob is an acute uppercut, one that will result in a high pop-up if the batter manages to make contact. Anyone who has attempted to fungo line drives has realized that tossing the ball high makes the task very challenging. To avoid this dilemma, experienced fungo hitters, such as Jimmie Reese, would give the ball a very short toss and hit it when it is almost stationary, near its apex.
The batter’s mind usually fails to resolve the swing-angle problem of the lob. Late in his career Steve Hamilton told me that, although he had thrown the folly floater many times, it had resulted in a hit only once—Frank Howard, showing remarkable presence of mind, had tapped the pitch over the first baseman’s head for a looping single.
Researching the Batter's Brain
In this article we’ve seen that batters’ brains carry out very complex operations. Given the importance of the unconscious components of the batter’s mind, perhaps research into how they are affected by various performance enhancers would be appropriate. For example, we have evidence that some scents—those of lemon, peppermint, and cinnamon—have a beneficial affect on the cerebral cortex, resulting in improved performances in mental and physical tests (Zoladz, 2005), but little is known about how these or more powerful performance enhancing chemicals affect the unconscious mind. With advances in technology giving us extremely precise measurements of the pitch, the hitting process, and the concomitant patterns of neural activity, we might be able to learn a great deal about what happens in the batter’s unconscious mind. In the future, the batter’s box might become an indispensable neurophysiological laboratory.
Note: In this article, all times are rounded to the hundredth of a second, and distances are rounded to feet.
References:
Bahill, A.T. and Baldwin, D.G. 2004. “The rising fastball and other perceptual illusions of batters.” In Biomedical Engineering Principles in Sports. G.K. Hung and J.M. Pallis, eds. NY: Kluwer Academic / Plenum. pp. 257-287.
Bahill, A.T., Baldwin, D.G., & Venkateswaran, J. 2005. “Predicting a baseball’s path.” American Scientist, 93(3):218-225.
Libet, B. 1985. “Unconscious cerebral initiative and the role of conscious will in voluntary action.” Behavioral and Brain Sciences, 8:529-566.
Libet, B., Gleason, C. A., Wright, E. W., and Pearl, D. K. 1983. “Time of conscious intention to act in relation to onset of cerebral activity (readiness-potential): The unconscious initiation of a freely voluntary act.” Brain, 106:623-642.
Schmidt, M. and Ellis, R. 1994. The Mike Schmidt Study: Hitting Theory, Skills and Technique. Atlanta: McGriff and Bell Inc.
Zoladz, P.R. and Raudenbush, B. 2005. “Cognitive enhancement through stimulation of the chemical senses.” North American Journal of Psychology, 7:125-140.
Dave Baldwin is a former pitcher, geneticist, and engineer. He is now retired and living in Yachats, Oregon. His memoir is described at http://www.snakejazz.com/.
| Change-Up | September 16, 2009 |
Blowin' Smoke
The Boston Red Sox have not played the Baltimore Orioles or the Toronto Blue Jays over their last four games but during that stretch they have won all four, having outscored their opposition 20-3 in the process. I am not sure what this will do to persuade Tony Massarotti of The Boston Globe that the Red Sox might have a chance in the post-season, but you never know. In a recent blog entry on boston.com titled "A Sox Smokescreen?", Mazz voices concern over Boston's ability to take on the better teams in baseball.
Boston is 24-6 this season against Toronto and Baltimore, which compels Mazz to all but encourage Red Sox fans to pack it in and settle in for football season. This was written last Wednesday, September 9th.
The Orioles have not been the Sox' only punching bag. The Sox are 11-4 against Toronto (another doormat) and went 11-7 against the inferior National League. That leaves the Sox at 46-45 against everyone else. All of this suggests the Sox are far closer to being a mediocre team than they are an elite one.
That last sentence is quite a statement - "the Sox are far closer to being a mediocre team than they are an elite one". For those unfamiliar with his work, Mazz has a history of writing nonsensical, provocative statements of this nature which vacillate between vitriolic and just plain dumb. He and Curt Schilling have famously butted heads in the past, to the point where Mazz threatened not to cover his charity events if Schilling continued to bypass the sports media and engage his fans directly. So who knows, maybe Mazz is doing his "look at me" routine or maybe he really does think the Sox are more mediocre than elite? Either way it reflects poorly on him.
Let's take stock of where the Red Sox are right now. They are 85-58, 5.5 games clear of the Texas Rangers for the AL Wild Card lead. They boast a +126 run differential, better than every team in baseball except for the New York Yankees and Los Angeles Dodgers. They are on pace for 96 wins, they have not had one month where they were under .500, and they have not had one month where they failed to outscore the opposition. They have weathered their share of bumps at times, there have been major swings all season long, but if the Red Sox are not an "elite" team, then I guess I should brush up on my vocab because apparently I don't know what the word "elite" means.
The thing about the Blue Jays and Orioles is that they still play Major League Baseball. In a league where the best teams tend to win 60% of their games and the worst 40%, that qualifier means that they are very much capable of beating the best teams in the league with regularity. They're just like the Red Sox or Yankees, only they win one less game a week or so. That the Red Sox have so dominated Toronto and Baltimore is not a red flag, but rather an indication that they are probably quite good. Or better yet, it's probably not all that significant at all and probably just attributable to small sample; sort of like Boston's poor play against the Texas Rangers this year. And if the Jays and O's are so bad, then sheesh, how bad are the Yankees? They've lost 3 of their last 4 against the AL East "doormats", yielding 30 runs over that span.
The truth of course is that, since it is more difficult to beat good teams, even good teams will have mediocre records against other good teams. This has always been the case. Here is how the last 10 World Series champions have fared against teams that played .500 ball or better.
Year   Team        W - L
2008   Philly      42-44
2007   Boston      44-40
2006   St. Louis   21-26
2005   Chicago     39-33
2004   Boston      40-31
2003   Florida     53-48
2002   Angels      37-40
2001   Arizona     42-43
2000   Yankees     42-43
1999   Yankees     39-26
Total it up and those teams played .509 baseball. In 2009 the Red Sox are 37-34 against teams who have won more games than they have lost, good for a .521 win percentage. When you factor that consideration, it sure makes a statement like this sound stupid, doesn't it? From the same piece linked at the top:
But we're now 138 games into the 162-game marathon, and we still have no evidence that the Sox of late 2009 can compete with the big boys.
Define a "big boy", Mazz. Would a record of 15-7 against the AL East and AL Central division leaders qualify? Might that be some evidence? Like so many other Massarotti "antagonistic for the hell of it" pieces, this one too falls flat.
I had the pleasure of having lunch in Cambridge with Jonah Keri and David Cameron last Saturday. The next day my Baseball Analysts colleague Jeremy Greenhouse accompanied me at Fenway to watch Jon Lester turn in yet another gem against the Tampa Bay Rays. All three are thoughtful, ridiculously intelligent and open to new and different ways of thinking about baseball. Read some of their work, then go back and check out a couple of Mazz pieces and then decide for yourself. Where is the best baseball writing taking place?
| Touching Bases | September 15, 2009 |
How Release Points Affect Platoon Splits
Dave Allen I am not, but I will do my best at an F/X visualizations-style piece. Below is the expected run value of a pitch based on its release point, which is defined as the point where the ball is measured 50 feet away from home plate. The image is from the batter's perspective, so points on the left tend to be thrown by righties and vice-versa.
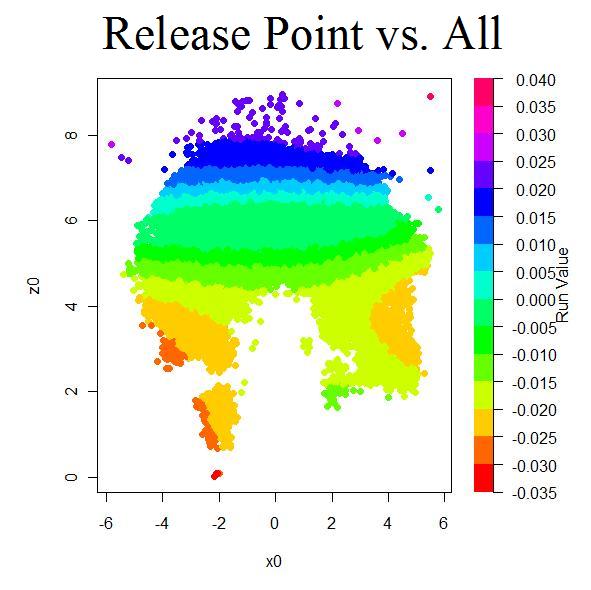
Kind of like a rainbow, kind of like a tie-dyed afro.
Looking at the image, my guess is that the graph says more about the context of the pitches than content. Managers can control when they deploy pitchers of a given arm slot, so in all likelihood, lower release points occur when the pitcher has a platoon advantage over the batter. For example, see that cluster of pitches about a foot off the ground and two feet on the third base side of the rubber? All 1,000 or so were thrown by righty one-out guy extraordinaire Chad Bradford, whose numbers exceed his talent thanks to his manager placing him in situations where he can be expected to succeed. So what I’m saying is that the above graph is more descriptive of batters than it is of pitchers.
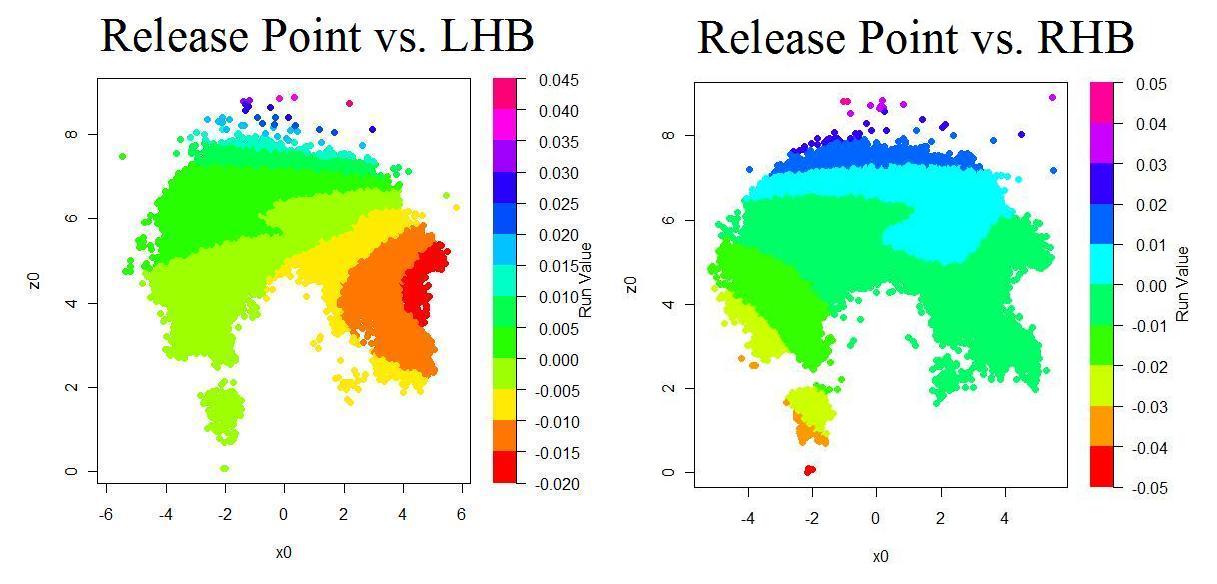
The plots are more or less mirror images. Against same-handed batters, southpaws who stand far to the first-base side of the rubber and sling the ball from a low three-quarter arm slot are expected to shut down the opposition. Release points seem to have a much greater effect against left-handed batters than they do right-handed batters, as you can see in the range of the color map. This is likely why LOOGYs are all the rage, while you rarely hear about ROOGYs other than the aforementioned Bradford.
I decided to try an analysis of individual players with large gaps in their platoon splits. Billy Butler would be one of the American League's elite hitters were pitchers only allowed to throw left-handed.
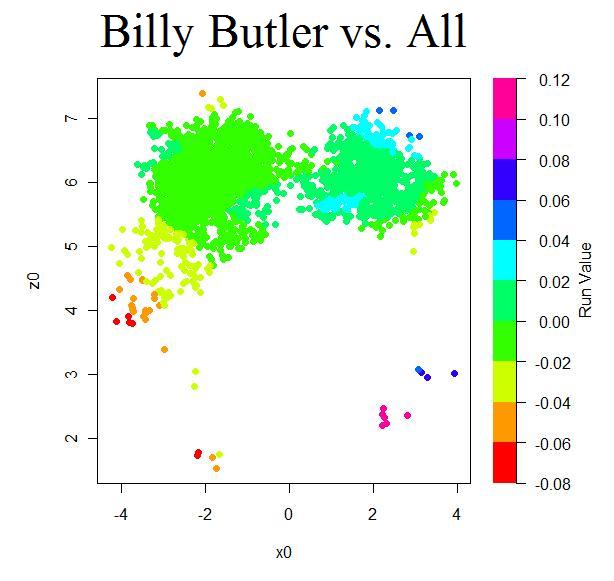
He hits standard righties at a rate of one run below average per 100 pitches, while he hits standard lefties to the tune of a couple runs above average per 100 pitches. However, pitchers with untraditional arm slots are where it gets interesting with Butler. He can't touch righty sindwinders, and he's grounded out weakly three times while facing those several submarine pitches from Bradford. Conversely, he has apparently picked up the ball quite well against lefty sidearmers in the limited time he's had against them. You win a prize if you said small sample size.
For my lefty hitter, I chose Ryan Howard, who might be out of a job playing baseball if all of us could only throw lefty.
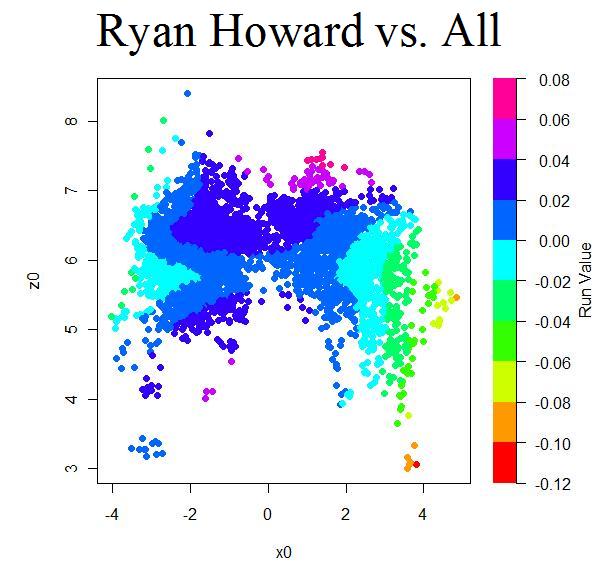
Oddly, Howard not only does poorly against lefties who sling the ball, but also righties who release the ball from the extreme third-base side of the rubber.
Paul Maholm exhibits an interesting split.
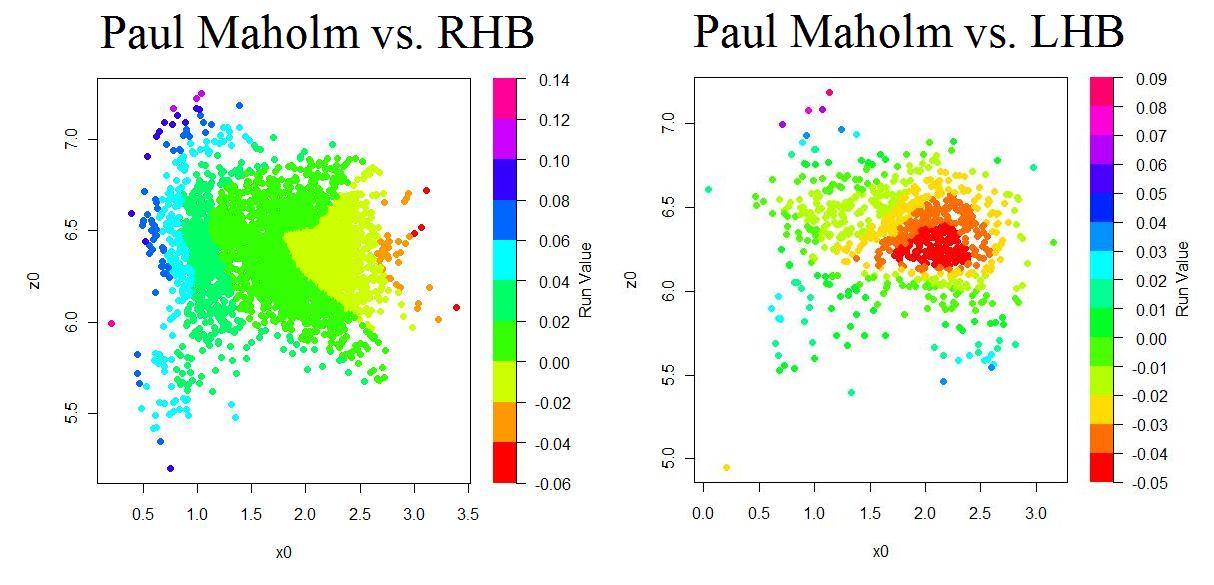
He's much better against lefties in general, but it seems to me that his worst pitches against both sets of batters when he releases the ball from straight on according to the batter's point of view. This is not what we saw the the league average split. It is abnormal that Maholm has performed better against righties when releasing the ball closer to the first-base line.
For such a great starting pitcher in the past, Brandon Webb sure shows a large platoon split. His go-to pitch, the sinker, does happen to be prone to the largest platoon split, on average, of any type of fastball. Keep in mind that the sets of graphs for Maholm and Webb vs. RHB and vs. LHB are set to different scales, so it appears as if they're dramatically altering their release points based on batter handedness, but it's actually just a fault of mine in setting the axes.
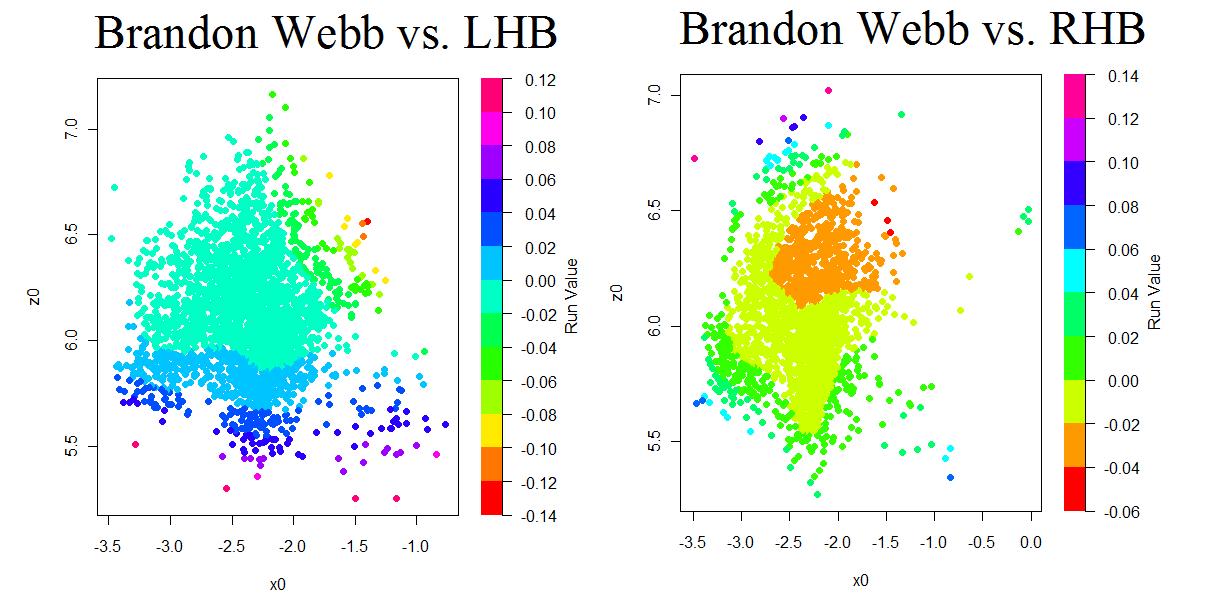
Webb is best when pitching from a higher release point that is closer to his body. Just a hunch, but I'd guess this has to do with the movement on his sinker he gains from a higher arm angle.
| Behind the Scoreboard | September 14, 2009 |
Better Baseball Tiebreakers
Major League Baseball has always been particularly inept when it comes to their tiebreaking rules. Amazingly, for the first few years of the wild card, no rules were in place at all as to what happens when various multi-way ties occur in division and wild card races. To the outside, it seemed that MLB was making up the rules as it went along. Finally in 2003 some rules were codified as to what happens in the event of multi-way ties. Being the end of the baseball season, I found it an appropriate time to discuss baseball's uneven tiebreaking rules. Believe it or not, the current rules for most multi-way ties are quite inequitable and do not give all teams even close to a fair chance at the playoffs. Thankfully no multi-way ties have ever occurred, but were it to happen, baseball's current rules don't allow for the fairest of all possible outcomes. Here I'll walk through various tie scenarios, break down MLB's current rules, and propose better, fairer solutions to many multi-way ties.
Three-Way Tie for Wild Card (or Division)
One of baseball's most common multi-tie scenarios (and I use "common" loosely since it has never occurred) is the three-way tie for a wild card or division title. In this case, three teams are fighting for one playoff spot. You're probably already aware how this works - it's what baseball calls its A/B/C tiebreaker. Team A hosts Team B and the winner of that game hosts Team C. The winner of that game is the champion. In a hypothetical example, the Mets would host the Cubs and the winner of that game would host the Giants.
The Flaw: The solution indeed resolves the issue in just two games, but does so very inequitably. The Mets and Cubs are forced to win two games, while the Giants must win just one. Calculating the probabilities, I've assumed that the home team has a 56% chance of winning each game (bumped up slightly from the usual 54% because of playoff crowds and the increased travel hassle for unexpected tiebreaking games). When we do so for this scenario, the Giants (playing just one game on the road) have a 44% chance to win, while the Cubs (playing one on the road and then one at home) have just a 25% chance to win. A good tiebreaker gives each team an equal chance for victory, and the current tiebreaking rules do a terrible job, giving one team nearly double the advantage over the another. If I am the Cubs, I am going to be very angry with this set-up.
The Solution: While there's no way to remedy inequity this in just two games, I believe it would be worth just one more game to more fairly determine the outcome. In this solution, the champion would have to win two games to advance. In the example, the Giants would host the Cubs and the winner would then go to New York for a potential double-header (or games on back-to-back days if you must). To advance, the Mets would be forced to win both games, while the Cubs or Giants would need just one win in New York to advance. In this scenario, the probabilities are more fairly distributed at 38%-31%-30% instead of the current 44%-31%-25% breakdown. The solution would require only one potential extra game, no extra days, and would require no extra travel by any team. The probability chart below shows the improvement and the flow chart shows how the tiebreaker would work in a graphical form.
Three-Way Tie for the Division and the Wild Card
Another common three-way tie scenario is one in which three teams from one division are tied for both the division and the wild card. In this case, three equal teams are fighting for two playoff spots. I actually haven't come across this codified anywhere, but I presume MLB would again employ the A/B/C tiebreaker albeit in a slightly different form. In the case of a Dodgers-Giants-Rockies tie, LA would host SF and the loser would play the Rockies in Colorado. The winners of each game would go to the playoffs.
The Flaw: In this case, the Rockies are clearly getting the short end of the stick. They are in a must-win situation while LA and SF must win just one of two. Probability-wise, the Rockies have just a 56% chance to advance, with the Dodgers' chance is 75%. This is seriously unfair and is no way to decide the season.
The Solution: The way to fix this is much the same as the scenario above. By extending the tiebreak by just one potential extra game at the same site, we can even the odds. In the improved scenario, the Dodgers host the Giants. The winner advances while the loser goes home to host the Rockies for two games. If the Rockies win just one game, they advance, while the loser of the LA-SF matchup must sweep both games in order to salvage the wild card. This plan, seen below, provides a far more equitable 70%-69%-61% distribution of probabilities rather than the currently unfair 75%-68%-56%. Again, this solution requires just one potential extra game with no extra travel to decide things more fairly.
Two Tied for Division and One Other Tied for the Wild Card
This scenario, in which two teams are tied for the division and also are tied with one other team for a wild card spot, was the doomsday scenario for MLB for the first few years of the wild card era. In a theoretical LA-SF-CHC scenario, MLB would have had LA and SF play for the division title, while the Cubs were gifted the wild card. The theoretical ideal playoff odds should have LA and SF with a 75% chance to make the playoffs, and the Cubs at a 50% chance. However, this resulted in a 56%-44%-100% split instead - a major error. Thankfully, Selig and Co. have corrected this so that the LA-SF loser would play against the Cubs for the wild card.
The Flaw: This new solution is by far a better one, but is not optimal by any means. With the home field advantage determined by head-to-head records, it's possible for one team to gain a far larger advantage than it should. The current tiebreaker could have a LA having the home field in both games, while SF could be on the road in both games. This would lead to LA having an 81% chance to advance, while SF's probability would be just 69%. Other unfair possibilities include having the Cubs with home field against either team, giving them a 56% chance of advancing rather than 50%.
The Solution: This can be fixed easily enough, and unlike the above prescriptions, can be done without any additional games. The solution is simple. If one team has the home field in the first game, they should not have it in the second game, and vice-versa. This leads to a more equitable 75%-75%-49% split, nearly a perfect match to the theoretical ideal probabilities. This scenario can happen under the current rules if the head-to-head matchups fall correctly, but MLB should codify it so that it is always the case. The charts below show the difference in probabilities (with the scenario discussed above as the "current" scenario, though there are other ways the probabilities could fall under current rule as well) as well as the way the improved tiebreak would work.
Four Tied for Wild Card (or Division)
Getting into unlikelier four team scenarios, we also see flaws in the MLB's method. This one is where four teams are tied and fighting for just one playoff spot. According to the MLB rules, "Club"A" shall play Club"B" at the ballpark of Club "A" and Club "C" shall play Club "D" at the ballpark of Club"C". The following day, the winner of these games shall play one game, at the ballpark of Club "A" or Club "B," whichever has won the game between the two."
The Flaw: The MLB solution sounds fine enough, but they again blow it with the home field advantage. Under the MLB rule, in a LA-COL-SF-SD tie, where COL hosts SD and SF hosts LA, if the Rockies and Dodgers win their games, Colorado would host it's second game while the Dodgers would go on the road for the second time in a row. There's no reason why Colorado should have the advantage of getting both home games, while the Dodgers suffer twice on the road. The flaw results in a 31% chance of advancing for Colorado, while the Dodgers' probability is just 19%.
The Solution: Again the solution is as simple as allowing the road team in the first game to play at home for the second game and vice-versa. Of course, if both home teams (or both road teams) win their respective games, then one of them must be at home again, giving them an advantage, but this can hardly be avoided. The improved tiebreaker allows for a 28%-25%-25%-22% split rather than the current 31%-25%-25%-19% probabilities. Since this requires no extra games or travel, this fix is a no-brainer. The probability charts and flow charts are below.
Four Tied for Division and the Wild Card
When four teams are tied for the division and also tied for the wild card, this is the one scenario where MLB gets it right. Since four teams are fighting for two spots, the simplest and best solution is to play two games, with the winners of each advancing. In the NL West scenario, where LA, SF, COL, and SD are tied, the easiest solution is to have LA host COL and SF host SD, where the winners advance.
The Flaw: The system is not perfect, since obviously the home teams in each of the games have the advantage, but this can't be improved without playing many more games (or playing at neutral sites, which would be awful).
The Solution: MLB's solution is a good one that is as fair as can be. Below are the probabilities and the (extremely simple) accompanying chart.
Three Tied for Division and One Additional Team Tied for the Wild Card
Another scenario where MLB's policies are egregious is where three teams are tied for the division lead and one additional team is tied for the wild card. Under current rule, the three teams tied for the division title play an A/B/C tiebreaker (A hosts B and the winner hosts C). Then the two losers play another A/B/C tiebreaker with the wild card team as the third team. In a hypothetical situation, the Dodgers, Giants, and Rockies would play an A/B/C tiebreaker. Then the two losers would play an A/B/C tiebreaker with the Cubs, who had an identical record as the other three teams.
The Flaw: There's nothing terribly wrong with the format, but when MLB does not control for who gets the advantage of being Team C, we can get some skewed probabilities. In the perfect world, the three NL West teams should have a 55.55% chance of advancing, while the Cubs should have a 33.33% chance of advancing. However, depending on who gets lucky or unlucky in being Team A, B, or C, these can be thrown off wildly. For instance, if the Giants get to be Team C (playing just one game on the road) for both A/B/C tiebreakers, then their probability to advance to the playoffs is 69% - far higher than it should be, while if the Rockies are Team B for both A/B/C tiebreakers then their chance to advance is just 43%. This is big disparity for two teams that should have the same chance of advancing.
Furthermore, in another scenario (not reflected in the table), the Rockies could be Team B for both tiebreakers, while the Cubs could be Team C for the second tiebreaker. This would actually give the Cubs a higher probability (44%) of advancing than the Rockies (43%), when in fact the Colorado should have a major advantage over Chicago.
Another oddity is that theoretically SF could advance by going 1-1 (losing as Team C in the first tiebreaker and winning as Team C in the second tiebreaker) while Colorado could be eliminated while going 2-2 (winning and then losing in both the first and second tiebreakers). This would be a very peculiar way to break a tie, since both teams' records would be essentially tied again after the extra-curricular play. I have a feeling the Rockies and their fans wouldn't be too pleased with this outcome.
The Solution: The solution of course is to control for who gets the A/B/C advantage in each round, so that one team cannot benefit by being Team C in both rounds. The improved scenario would work like this: This Giants would host the Rockies in the first tiebreaker. The winner would then host the Dodgers for the NL West title. In the second round, the Dodgers (if they had not won) would get the worst of it as Team B, while the loser of the SF-COL game would become Team C. This ensures that the Dodgers, who got the best draw in round 1, will get the worst draw in round 2. If the Dodgers end up winning the first tiebreaker, the winner of the COL-SF game gets to be Team C, while the loser becomes Team B. Meanwhile the Cubs are constantly fixed at Team A in the second round tiebreaker.
Confused? The chart below probably shows it more clearly than it can be explained in words. Overall the Dodgers, as Team C in the first tiebreaker and Team B in the second tiebreaker have a 58% chance of advancing - close to the ideal 55.6%. The Giants, who were home as Team A in the first tiebreaker, also have a 58% chance of advancing. The Rockies draw the short straw by being the road team in the first game and have a 53% chance of advancing. Meanwhile, the Cubs, fixed as Team A in the second tiebreaker, have a 31% chance of advancing - very close to the ideal 33.3%. Overall, the solution comes very close to matching the ideal probabilities - something that the current MLB rules do not do. This is a must fix.
Two Tied for the Division and Two Additional Teams Tied for the Wild Card
Another possible four team scenario is where two teams are tied for the division and two other teams are tied with them for a potential wild card spot. For example, say LA and Colorado are tied for first in the NL West, while the Cubs and Mets have identical records and are hoping for the wild card. Under current rules, the Rockies and Dodgers will play first. The winner advances while the loser plays an A/B/C tiebreaker with the Cubs and Mets.
The Flaw: This scenario is again fine, except for the fact that the same NL West team can get lucky (or unlucky) in both tiebreakers and gain an unfair advantage regarding their home field and whether they become Team A, B, or C. The theoretical odds should give LA and Colorado a 66.7% chance to advance, while the Cubs and Mets should have a 33.3% chance to advance. However, if LA plays at home in the first tiebreaker and also becomes Team C for the second tiebreaker, their odds increase to 75%. Meanwhile, Colorado, if they are unlucky enough to become Team B in the second tiebreaker, has just a 58% chance to advance. This disparity is unacceptable.
The Solution: Clearly the solution is to make sure that one team does not get the advantage in both tiebreakers. An improved method is to have Colorado host LA just as before. If Colorado wins, LA moves on to the wild card tiebreaker, but since they were on the road before, they get to be Team C in the second tiebreaker. Likewise, if LA wins, the Rockies must be Team B in the wild card tiebreaker, since they had home field the first time. The Mets are fixed as Team A, while the Cubs become either Team B or Team C depending on the outcome of the LA-COL game. The new solution creates a probability breakdown of 69%-67%-33%-31%, which is much better than the potential 75%-57%-38%-28% scenario which is possible under current rule. Below is a chart of potential probabilities and a flow chart of how the improved tiebreaker would work.
Two Teams Tied for Two Different Divisions and the Wild Card
The final four team scenario we'll look at is if two teams are tied for one division, another two teams are tied for another division, and all four teams are tied for the wild card. In a hypothetical example, LA is tied for Colorado in the West and the Cubs and Cardinals are tied for the Central, with all four teams also eligible for the wild card. Under current rule, both divisions will be decided by one-game playoffs with the losers playing for the wild card.
The Flaw: As with the other scenarios, one team can gain a double advantage by being the host of both games, while another team may be forced to go on the road for each game. If Colorado hosted LA, and the Cardinals hosted the Cubs, it's possible that LA would end up going to St. Louis, giving the Cards two home games and LA two road games. All teams should theoretically have the same probability of advancing (75%), so this clearly is unfair to the Dodgers.
The Solution: The scenario above can be rectified by forcing the Cardinals to go to LA rather than vice-versa. Like the other tiebreaking solutions, teams with the advantage in the first tiebreaker should not be given the advantage again where possible. The charts below show the improved solution, where we see more equitable probabilities.
Conclusion
As you can see, there is much room for improvement in MLB's tiebreaking procedures (I haven't explained the probability calculations in detail, but feel free to ask questions in the comments). While at least now they have some procedures in place, they are not the fairest solutions to the ties. Tied races are one of baseball's rarest and most exciting events, and when a three-way or four-way tie inevitably occurs, baseball should make sure it has the procedures down right (I've also developed some 5 and 6 way tiebreaking procedures, but that will be saved for a later post if there's interest). Implementing the procedures just outlined can go a long way towards making things more fair and avoiding controversy in the future.
| F/X Visualizations | September 11, 2009 |
Another Look at Carlos Pena's HRs
Before the season I looked at HR rate by pitch location and noted batters who hit HRs in locations most do not. One batter I profiled was Carlos Pena, as he hits HR predominately on pitches away while most batter hit them on middle-in pitches. Part way through the season he was one of the league leaders in HRs so I did a follow up. Now he is out for the season with two broken fingers, but is still leading the AL in HRs. So I thought it I should check on where the pitches he hit his 39 HRs were in the strike zone.
Here are all of his HRs plotted over the grayscale rate for all LHBs.
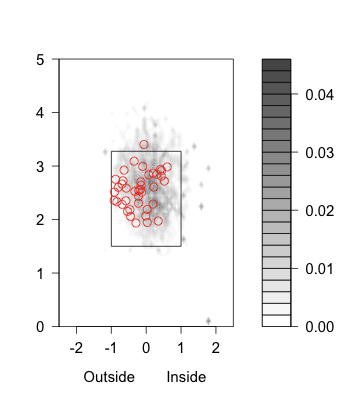
Most of his HRs are the outer half of the plate, with a big number on the outer quarter where most LHBs hit very few. In the middle-in section where most LHBs have the most HRs he has surprisingly few.
I talked in the original post about one problem with this method. I am comparing the rate of HRs hit by the average batter to the actual number for Pena, not his rate. Maybe he has few HRs inside because he gets few pitches there. To get around this below I plot the HR/FB rate for an average lefty and for Pena based the on horizontal location of the pitch.
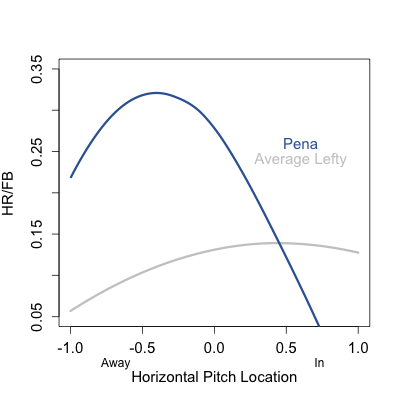
So it does in fact look like Pena gets much more power on the outside of the plate than the average lefty, and actually less than the average lefty on the inside quarter. In my post in the middle of the season Rich asked how he did this. Most batters have more power on pulled balls and pull more inside pitches. So is Pena's outside power from opposite field power or from an ability to pull outside pitches? To examine this I took inspiration from Max's work looking at relationship the between the horizontal location of a pitch and the horizontal angle of the resulting ball in play. In this case I just looked at Pena's HRs. Remember that -45 is the third base line and 45 is the first base line.
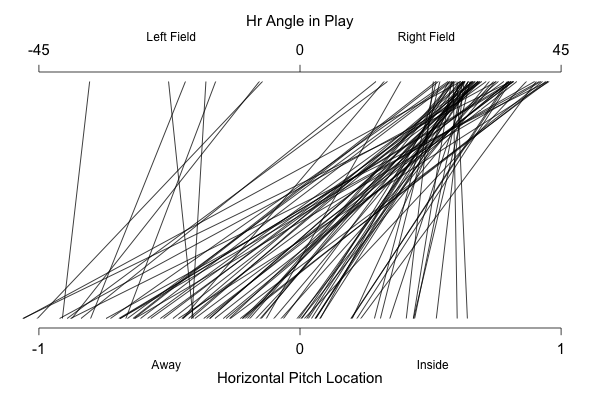
Pena has hit only a handful of opposite field HRs, all from pitches away (I checked those are all on fastballs). But the bulk of his power is from hitting pitches on the outer half and even quarter of the plate to right field. He routinely pulls HRs on pitches on the outer edge of the plate.
Pena is a great story. He kicked around for years before busting out with the Rays two years ago. We will see if the lead he has in HRs in the AL holds up over the next couple weeks.
| Change-Up | September 10, 2009 |
Keys to the Pennant Races & Beyond
To be sure, there are better players than those included below on the rosters of Major League contenders. Mark Teixeira, Kevin Youkilis, Miguel Cabrera, Bobby Abreu, Chase Utley, Albert Pujols, Ubaldo Jimenez, Matt Cain - you know about all of them. What follows is a list of those players (and one unit for that matter) that figure to skew pennant races or the post-season one way or another who haven't factored like they are now all season long. A season is a process, and it is often the best playoff-qualifying team on October 1st that wins the World Series and not the team that has been the best all season long. These players, many not factors at all for their current clubs for much of the season, will impact their teams' chances for better or worse from here on out. In the case of the Dodgers offense, of course they have been "factors" all season long. I include it because it has been such an enigma of late. I include it because it seemed like it could be counted on for much of the year. It's not a specific player like every other entrant, but its performance is just as uncertain and critical as the other players listed.
National League
Bumgarner made his debut for San Francisco last night, an event that should have been met with great anticipation and zeal by Giants fans. In his 19 year-old season (he turned 20 on August 1), Bumgarner is a career 27-5 Minor League pitcher and boasts a 4.65 K/BB ratio. Problem is, the Giants only gave the kid the Big League nod because baseball's best pitcher was scratched with back problems.
Back problems could mean just one start but there is also the possibility that it could be something much worse. Should Tim Lincecum miss an extended period of time, it will be up to Bumgarner to take his turn in the rotation. With a lineup as inept as San Francisco's, a Lincecum gem is more of a necessity than a luxury. The Giants lost 4-3 last night, a respectable run prevention showing by any measure. But the Giants had only yielded as many as four runs in six of Lincecum's previous 20 starts. In other words, a typical Lincecum start last night wins. Lincecum's injury and Bumgarner's adaptability will play critical roles in the National League Wild Card race.
Penny's peripherals have been respectable all season long, and in two starts with the Giants so far he has been terrific. If Penny can maintain his effectiveness, he will give San Francisco one of the more solid one-through-five rotations in baseball, with Lincecum (Bumgarner), Matt Cain, Barry Zito and Jonathan Sanchez filling out the remaining spots.
As Red Sox fans can attest, Penny's mistakes seem to be hit as hard as any pitcher's in baseball. But when he limits the mistakes, or when the competition is less fierce (sorry, but let's be honest), he can definitely take a turn in a championship-aspirant rotation.
The Dodgers offense
Prior to the All-Star Game, even without Manny Ramirez for much of that time, this was an offense firing on all cylinders. Since the All-Star break, things have gone south. An offense that, despite playing home games in one of the more favorable pitcher's parks in baseball, was 2nd in the league in OPS heading into the break has ranked just 9th since then.
             Pre ASB             Post ASB
         AVG   OBP   SLG      AVG   OBP   SLG
Manny   .355  .487  .669     .264  .373  .466
Pierre  .328  .387  .417     .282  .345  .321
Kemp    .320  .384  .495     .308  .333  .538
Blake   .285  .364  .486     .252  .333  .409
Ethier  .250  .338  .475     .333  .410  .612
James Loney and Rafael Furcal never quite found their strokes this season. In Loney's case, help may be on the way in the form of Jim Thome, though the veteran's defensive limitations will preclude him from playing regularly. Thank heavens for Andre Ethier.
To kick off the month, Gonzalez is chasing a .371/.432/.714 August with a .357/.455/.679 September. With apologies to Seth Smith, Tulo and Dexter Fowler, it has been Gonzalez's emergence that have transitioned the Rockies from pesky Wild Card contender to a legitimate World Series-caliber force.
To the Rockies credit, they do not sit tight when they think they have a superior performer hanging around somewhere, whether it be on the dugout, the Minor Leagues or the waiver wire. Ask Garrett Atkins and Ryan Spilborghs. You'd better perform if you want to hang onto your job in Denver.
Rafael Betancourt & Franklin Morales
The Colorado bullpen is rounding into form thanks to these two. After injuries and struggles as a starter relegated Morales to the Minor Leagues after playing such a key role on the 2007 NL Champions, he has come back late in 2009 as a force out of the bullpen. Add Betancourt to the fold, whom the Rox acquired from the Cleveland Indians at the trade deadline, and all of a sudden it appears Colorado has the makings of a shut-down late inning 1-2 punch. In just under 40 combined innings since the All-Star Break for Colorado, the two have combined for 43 strikeouts, 14 walks and just 27 hits.
Look, the Red Sox couldn't wait around to see if Smoltz would turn this corner. They saw his stuff and liked it. They saw his peripherals and took note. If it were April when he made his first start, you can bet they would have kept running him out there through May, through June, etc to see if he would turn the corner he seems to have.
You might have come across this David Cameron piece about Smoltz after the Red Sox designated him. To me it wasn't controversial because of the key point it was making - that Smoltz still appeared to have good innings left in him. It was the ease with which he dismissed the Red Sox evaluative process.
Cardinal fans just picked up a pretty good pitcher for the league minimum, thanks to the continued overestimation of the usefulness of ERA. The sooner people realize that it’s an obsolete pitching statistic, the better off baseball will be.
Indeed. The Red Sox brass could learn a thing or two about how there is more to pitching than ERA. It was this dig that stood out for me; the presumption that Boston's front office - Theo Epstein and Tom Tippett and Bill James - overvalue ERA and worse, hold baseball back as a result. Boston was in the thick of a race and didn't have the luxury of finding out if Smoltz's strong peripherals and his complete ineptitude versus left handed batters would correct itself. With a comfortable lead in its division, St. Louis did have that luxury and has benefited.
Either way, Cameron looks pretty smart these days with Smoltz and Penny performing the way they are, the former with a ridiculous 28 strikeouts against just one walk in four starts with St. Louis.
Speaking of strong K/BB ratios, in four starts with the Phillies, Pedro is now at 27 strikeouts and four walks. He is still getting hit pretty hard at times but it looks as though Philadelphia has found themselves some options when it comes playoff time. Joe Blanton and J.A. Happ have also been great lately, and Cole Hamels and Cliff Lee are, well, Cole Hamels and Cliff Lee. Pedro may yet find himself on the outside looking in when October rolls around, but if he continues to pitch the way he has, Charlie Manuel won't have a choice.
Like Colorado, Philadelphia's bullpen stands to benefit from two late additions. Romero and Myers have returned from injuries and not a moment too soon with Brad Lidge struggling as badly as he has. These two will be worth watching down the stretch as the Phillies try and figure out optimal post-season deployment of their pitching talent. All of a sudden they have remarkable starting pitching depth and if Romero or Myers struggles, it may be worth considering converting one or more of their starters into relievers.
American League
After his second consecutive season spending extended time on the Disabled List, McCarthy returns to the Rangers rotation in the thick of a playoff chase. If not for Akinori Otsuka and Adam Eaton, it's almost as if McCarthy would be best known for occupying the short end of a bad Jon Daniels trade.
But here he is, the #49 prospect on Baseball America's 2005 Top 100 list, and he still has that wiry frame that has served so many other pitchers well. He has won his first two decisions since coming back, but with shaky peripherals in the process. He will need a couple more good starts to stick through September because the player whose rotation slot he took, Dustin Nippert, had been throwing pretty nicely.
Since being recalled from Triple-A Oklahoma City on August 7th, all Borbon has done is hit .329/.397/.486 with 13 steals against just one caught stealing. Marlon Byrd hasn't been so bad either (.287/.328/.486). Now Ron Washington is going to have some decisions to make. Josh Hamilton (.270/.318/.426) and Andruw Jones (.217/.329/.482) are set to return from injury but each game is crucial to the Rangers' hopes. If playing time is to be doled out on a meritocratic basis, Borbon and Byrd should not be sitting much down the stretch.
Since returning to the Big Leagues on the 4th of July, Kendrick is hitting .361/.397/.511. Since the All-Star break, it's .373/.405/.545. Who knows if Kendrick has finally arrived or if this is some sort of short-term blip - my guess is the former for what it's worth - but let's put this in perspective. An excellent fielding second baseman OPS'ing .900+ is more commonly known as an MVP candidate. Or Chase Utley. Or Joe Morgan.
You get the point. On a team with a lot of excellent players, Kendrick might be the Halos' very best at the moment.
I have heard some friends in baseball circles refer to "change of scenery" guys and to be candid, it made little sense to me. The concept is that the player, for whatever reason, is unable to perform up to his ability because of external factors specific to a given team or city. That makes enough sense, that a player's environment can impact their performance, but how could you know that any other environment would suit him better? Well in light of Smoltz, Penny, Julio Lugo, Matt Holliday and now Kazmir, I am becoming more of a believer. The southpaw is flashing a 1.35 ERA in his first 13.1 innings with the Halos.
On a team badly lacking pitching pitching depth, Detroit's World Series road-map consists of little more than two or three shut-down performances from Jackson and Justin Verlander per series, and then figure it out from there. Unfortunately for Tigers fans, Jackson is looking like he may no longer be capable of filling such a role.
      April 7 to June 6    June 7 to Sept 9
          ERA   K/BB          ERA   K/BB
Jackson   2.16  3.26          3.88  1.88
He has still been good, but the Tigers need the dominant Jackson back to make a run in the post-season. Unless their bats get a big boost...
...which brings me to Guillen. Miguel Cabrera is the only Tiger OPS'ing over .800 on the season, a problem for a team with thin starting pitching and a bullpen that can look shaky. But since the All-Star Break Guillen has been terrific, raking at a .276/.374/.530 clip. Magglio Ordonez has come on and the addition of Ryan Raburn has helped, too. It looks like the new road map for the Tigers might be simply to outslug teams. It would have seemed unlikely a few months ago, but their lineup may yet round together.
Clay Buchholz, anyone who can get them to October
Josh Beckett and Jon Lester are known commodities, even if the former has struggled of late. The Red Sox #4 and #5 starters, with Penny and Smoltz long gone, Tim Wakefield's back a major question, Daisuke Matsuzaka's return unclear, Junichi Tazawa struggling and Paul Byrd even in the mix to begin with, could be considered, um, uncertain. Which leaves Buchholz.
He has been inconsistent to date in 2009 but seems like he might - might - have turned a corner. In 21.1 innings in his last three starts he has yielded just 16 baserunners and posted a 4.25 K/BB ratio. If this, or even some loose variant of this, is the Buchholz Boston gets for the rest of the year and they manage to qualify for the post-season, they're contenders.
I won't belabor this one because Rob Neyer already did such a nice job with it. The Yankees are the best team in baseball, but if you could undergo any tinkering at all with their squad, what would you do? In a piece titled "How to make the Yankees perfect" Neyer writes:
Which is where Hughes comes in. Chamberlain is the Yankees' No. 4 starter. Sergio Mitre is the Yankees' No. 5 starter. Which means the Yankees, as things stand now, have only three reliable starters. And again, you need four of them when the leaves are turning in New England.I know, I know ... Phil Hughes has been so good in the bullpen: 1.11 ERA with an overpowering strikeout-to-walk ratio. Make him a starter again and he's not going to post numbers anything like those. But to help the Yankees, he doesn't have to be anywhere near that good; he just has to be measurably better than Chamberlain and Mitre. Particularly if -- and I know this is highly speculative -- Chamberlain regains his dominant stuff upon returning to a relief role.
Perhaps I'm overreacting to Chamberlain's recent struggles, and the Yankees are good enough to win the World Series even without a decent fourth starter. But the other day somebody asked me what could keep the Yankees from winning. I didn't have a good answer, because this is essentially a team without a weakness.
Except one. And with a little creativity, they could probably make it zero.
Will the Yankees shift personnel around this late in the season as Neyer is proposing? It might be the key to them nailing down their first title since 2000.
| Touching Bases | September 09, 2009 |
On That Stuff
Justin Verlander. A.J. Burnett. Ubaldo Jimenez. These are the names that make scouts salivate. Why? One word. Stuff.
Two components determine how nasty a pitcher’s stuff truly is: velocity and movement. We’ve had radar guns to track the league’s hardest throwers for some time (that would be Joel Zumaya, of course) But now, with the help of pitchf/x data and a local regression technique picked up from Dave Allen, we can come pretty close to quantifying a pitcher’s stuff. We can assign every single pitch an expected run value given its physical characteristics—be it velocity, movement, location, release point, or any other data point given by the pitchf/x data. For the purposes of measuring expected run value based on stuff (StuffRV), I used velocity, horizontal movement, and vertical movement as my three independent variables, and restricted my sample to only righties who released the ball from at least five feet off the ground, with a minimum of 1,000 pitches over the last three years. To the leaderboards.
| Name | StuffRV |
|---|---|
| A.J. Burnett | -46 |
| Felix Hernandez | -31 |
| Zack Greinke | -26 |
| Edwin Jackson | -26 |
| Ubaldo Jimenez | -26 |
| Chad Billingsley | -23 |
| Brian Wilson | -22 |
| Brandon Morrow | -21 |
| Roy Halladay | -21 |
| Matt Garza | -20 |
| Dave Bush | 15 |
| Jeff Suppan | 17 |
| Braden Looper | 19 |
| Livan Hernandez | 20 |
| Greg Maddux | 23 |
Really no surprises on this list, which at least gives some validity to this method for evaluating stuff. I probably could have guessed 10 of these names correctly given 20 tries. One pitcher with lightning stuff who often goes overlooked is Gil Meche, who registered twelfth. One pitcher with deplorable stuff who does not go overlooked is Livan Hernandez.
Justin Verlander showed up a bit lower down in the rankings than I would’ve thought, sandwiched between Brett Myers and Jeremy Guthrie, and good for 30th out of 250 pitchers. But actually, Verlander's worse-than-expected ranking just goes to demonstrate that last year's off-putting performance was more than just random fluctuation. His average fastball velocity dipped below 94 miles per hour for the first time in his career last year, which was reflected in the actual run value of his fastball. However, his reputation as a flamethrower is well-deserved. Limiting the sample to only the top quartile of a pitcher’s stuff knocks Ubaldo Jimenez out of the top five in favor of Verlander, who, at his best, might be the league's best. Verlander has a very large difference between his best stuff and his worst stuff. By the numbers, it looks like Scot Shields owns the widest disparity between best and worst stuff. The difference in Verlander's fastball last year, which clocked in at 94 MPH with eight inches of run and ten inches of rise, and his fastball this year, which has the same average movement (to the nearest inch), but has picked up two miles per hour in velocity, is .4 runs per 100 pitches in expected value. The actual difference in Verlander's fastball, according to fangraphs, is even greater than that, at just over a full run per 100 pitches. That uptick in velocity has made a big difference.
How about the best stuff on a per-100-pitch basis?
| Name | StuffRV/100 |
|---|---|
| Brian Wilson | -1.08 |
| Matt Lindstrom | -0.99 |
| Jonathan Broxton | -0.97 |
| Joel Zumaya | -0.96 |
| Brandon Morrow | -0.87 |
| Heath Bell | -0.85 |
| Dennis Sarfate | -0.83 |
| Grant Balfour | -0.78 |
| Mariano Rivera | -0.78 |
| A.J. Burnett | -0.73 |
| Josh Geer | 0.41 |
| Edwar Ramirez | 0.42 |
| Livan Hernandez | 0.48 |
| Greg Maddux | 0.53 |
| Joe Nelson | 0.56 |
Max-effort relievers and a couple of Yankees top the pitch-for-pitch list. Also, Dennis Sarfate has apparently followed the route of Daniel Cabrera—an Oriole with eyebrow-raising stuff who lost his velo and thus, likely his place in the Majors.
Greg Maddux really survived the latter part of his career on his pitching moxie. Even when I restrict the sample to the top 25% of his pitches, he continues to show below-average stuff. Nevertheless, he accumulated five WAR over the last couple years.
Come to think of it, setting a minimum of 1,000 pitches for this analysis might have been a mistake. Given the precision and granularity of the data, this technique could be used to assess a pitcher's stuff given only a handful of pitchers. For example, I had never heard of Carlos Rosa before conducting this analysis, but now, from a sample of just 50 pitches, I can’t stop wondering why he’s not in the Majors. Great stuff. Decent control. The only evident knocks against him are his 2-8 Win-Loss record in AAA and 4.56 ERA. Maybe Dayton Moore knows something I don’t, or perhaps Rosa brought it just for his brief appearance in the Majors, or it’s possible GMDM is undervaluing a young talent who can get Major League hitters out. Actually, all three of these scenarios have probably taken place.
Who has made the most of his stuff? For this ranking, I subtracted the actual run value that each pitcher has been worth from the expected run value based on his stuff.
| Name | StuffRV-RV |
|---|---|
| Roy Halladay | 61 |
| Brandon Webb | 60 |
| Derek Lowe | 54 |
| Dan Haren | 51 |
| Greg Maddux | 46 |
| Jake Peavy | 45 |
| Jonathan Papelbon | 38 |
| Justin Duchscherer | 37 |
| Joakim Soria | 35 |
| Brad Penny | -28 |
| Carlos Silva | -30 |
| Adam Eaton | -32 |
| Bronson Arroyo | -32 |
| Miguel Batista | -36 |
This group consists of pitchers who can succeed without the strikeout. While Webb and Lowe both have heavy sinkers that are able to generate grounders like clockwork, the location of these pitches down in the zone has likely had more to do with their success than the tremendous movement on their pitches.
And at the bottom, there are two types of pitchers. The Batistas and Pennys are granted roster spots because their passable stuff at least gives them upside, but the Eatons and Silvas of the world, who have crummy stuff and can’t even pitch up to their already limited abilities, well, those are the guys to whom you don’t give multi-year deals.
A spreadsheet containing most of the data used in this article.
Pitchf/x data from wantlinux.net via MLBAM. Thanks to Dave Allen and all others who helped me with the code used in this analysis.
| Behind the Scoreboard | September 08, 2009 |
Defense Never Slumps (Or Does It?): Estimating the Variability of Defensive Performance
One of the oldest adages in baseball is that speed and defense never go into slumps. The thinking goes that while hitting and pitching are subject to a lot of variability, fielding and speed remain relatively constant and unaffected by luck and other factors. Due to random chance, a hitter may have a fairly good or fairly poor season simply by luck, all while his true batting skill remains the same. However, it's thought that a fielder's performance will remain steady and be mostly unaffected by chance. However, I'm not convinced that defense is as constant as the old adage states. In this article, I'll try to estimate the inherent variability of a fielder's performance during the course of a season.
When the ball is hit in play towards a fielder, that fielder has a chance to make a play on the ball. Sometimes he'll be able to make a play and record an out, and other times he won't. This uncertainty leads to the variability. For instance, suppose the batter hits a ball up the middle, and the shortstop dives to make a stop and throw to first for the out. The shortstop made a fine play, but if 100 of those exact same balls are hit to the same fielder, he probably does not make that play all 100 times. Maybe he only makes that play 50 times, while on the other 50 balls, he doesn't get quite as good of a jump on the ball, or mis-times his dive, or can't get enough mustard on the throw. Overall, based on his fielding skill, the location of the ball, speed of the batter, etc, he had about a 50% chance to make the play, and in this case he got a little bit lucky in being able to convert that 50% chance to record an out.
Just as with hitting, this luck doesn't necessarily even out over the course of a game, a week, or even a season, and hence, it's possible a player may have a good (or poor) fielding season simply due to luck. But is fielding subject to the same random fluctuations as hitting?
Of course, not every ball in the field is a 50-50 proposition. Many balls are either sure hits or (nearly) sure outs and there is not much room for chance with these balls. Obviously if every ball were a sure hit or sure out, fielding wouldn't be subject to any variation at all. To determine the amount variability associated with fielding, we'll need to know the distribution of out probabilities for a batted ball.
Distribution of Out Probabilities
Many defensive metrics, such as Ultimate Zone Rating (UZR), already estimate the probability of an out on each batted ball by dividing the field into small areas and measuring proportion of plays made in each area. But, while these systems are good for measuring the skill of defenders over the course of a season, these systems aren't designed to get an accurate probability on a single play. While UZR may say that a ball has a 30% chance of becoming an out, the actual probability of an out may be as low as 0% or as high as nearly 100% when factoring the exact location and trajectory of the hit, position of the fielder, skill of the fielder, speed of the runners, etc. Due to these limitations, data from UZR or other systems won't be of use here.
So, how can we get the distribution we are looking for? The best way I could think of was to put on my scouting hat and estimate it with my own eyes. Using MLB.TV's condensed game feature, I picked a random sample of games and looked at 200 balls in play. On each ball, I estimated the probability that an out would be recorded - in other words if the same ball was hit in the exact same spot again, with the same fielder, runners, etc, how often could the fielder turn the play into an out? While my estimates surely won't be perfect, it should get us the rough distribution of probabilities we are looking for.
Overall, in 200 balls in play, 96 balls were nearly sure outs, in which I estimated the probability of an out to be 98% or higher. These were routine flies and grounders which we are all so accustomed to seeing. 35 balls were likely outs, in which I estimated the probability of an out to be between 80%-95%. 22 balls were toss-ups, with a probability of an out estimated between 25%-75%. 13 balls were likely hits, with a probability between 5%-20%. And 34 balls were sure hits, where I estimated an essentially 0% probability of an out being recorded.
A histogram showing this distribution is below:
As you can see from the histogram and the text above, the distribution of out probabilities is bimodal, in that most balls are either certain outs or certain hits, while there are relatively few balls in between. This finding probably matches your intuition.
Calculating the Variation
This type of evaluation gives us a rough distribution of the probability that a batted ball will be turned into an out. From this we can calculate the standard deviation of a player's fielding ability. If the same players were to field the exact same 200 balls over again, according to the probabilities I assigned, we would expect them to record 139.3 outs with a standard error of 3.3 outs. The standard deviation on one ball in play is 3.3/SQRT(200) = 0.23.
What does this mean over the course of a season? Usually there are about 4000 balls hit into play against a team during a year. Using the standard deviation of 0.23 we see that we would expect that the number of outs recorded by the defense would have a standard error of 0.23*SQRT(4000) = 14.5 outs. If we assume that the run value of each hit is .55 (mostly singles, with some doubles) and the run value of each out is -.28, we find that the standard error of the number of runs allowed by the defense over the course of a season is 14.5*(.55+.28) = 12.0 runs.
So, after a lot of math, the bottom line is that the plays made by the defense will vary by give or take about 12 runs simply due to luck, even when the fielders' true skill remains the same throughout the year.
How does this compare to the variability of offense? In contrast, the standard deviation of linear weights batting runs in one plate appearance is about 0.43 runs (compared to a SD of 0.19 runs for fielding). Over the course of a season's worth of 6200 plate appearances, the standard error of the number of runs produced is 34.2 runs. As we can see, this is much larger than the standard error of 12 runs surrounding a team's defensive efforts.
Conclusion
We see that over the course of a season, indeed, the old adage is right in some respects - the amount of luck associated with fielding is much less than the amount of luck associated with batting. However, the standard error of 12 runs is also nothing to sneeze at, and from these calculations we see that lucky fielding can give a team one or two extra wins over the course of a season (and of course the reverse is true for unlucky fielding).
From an individual player's standpoint, the average fielder has about 500 balls in play in his area over the course of the season (of course, this varies by position, and we can adjust accordingly) . Using the numbers above, we see that the average fielder has a standard error of about .23*SQRT(500) = 5.14 outs over the course of a season. This means that he is prone to make about 5 or so more or 5 or so less plays in a season than his true talent would usually call for. This corresponds to a difference of about 4 runs in a season. While this is fairly small, it does show that random variability can play a part in a fielder's performance just as it can for hitters.
Since not all balls are identical, the variability associated with fielding performance is not easily calculated like it is for offensive performance. By doing this calculation, this article hopefully sheds some light on the natural variability we can expect to be associated with fielding. More research can be done by checking to see how the probability distributions (and hence the variability) might differ by position.
| F/X Visualizations | September 04, 2009 |
Break versus Movement
As we all know by know the pitchf/x data is an incredible resource for baseball analysts. For each pitch thrown in a major league game we get scads of data, so much so that it is hard to even know where to begin. And once we have begun it is easy to just go with the flow of analyzing what others have analyzed. At the PITCHf/x summit Alan Nathan noted that one piece of information, the break of a pitch, is rarely looked at in pitchf/x studies.
In my posts when I have examined the movement of pitches I have used the word 'break', but done so incorrectly, using it to describe the movement of a pitch. So I thought it was important to make a post clearing up the difference between the two pitchf/x terms and make a preliminary examination of pitch break
MLB's GameDay calls movement: (images and descriptions from MLB Advanced Media here).
The Pitch-f/x or 'PFX' value is the distance between the location of the actual pitch, and the calculated location of a ball thrown by the pitcher in the same way but with no spin; this is the amount of 'movement' the pitcher applies to the pitch. A faster, straighter pitch like a fastball will have a higher Pitch-F/x value than a slower, breaking ball like a curveball.
As stated this leads to the counterintuitive result that fastballs 'move' more than curveballs. Here is a histogram of the movement of the four main pitch types.
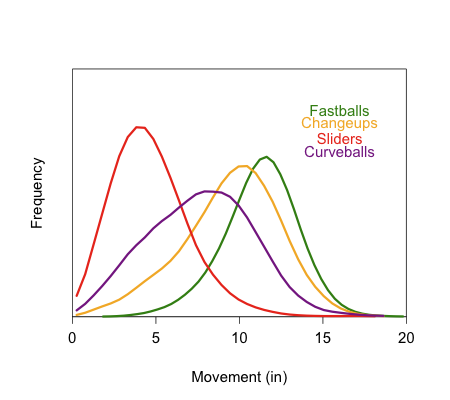
Here his how GameDay defines the break of a pitch.
Break is the greatest distance between the trajectory of the pitch at any point between the release point and the front of home plate, and the straight line path from the release point and the front of home plate. Curve balls and sliders will have larger break value than fastballs. Pitch trajectories shown in blue indicate breaking pitches.
This leads to a more intuitive result that fastballs break the least and curves the most. Here is a histogram of the 'break' in inches of the four major pitch types.
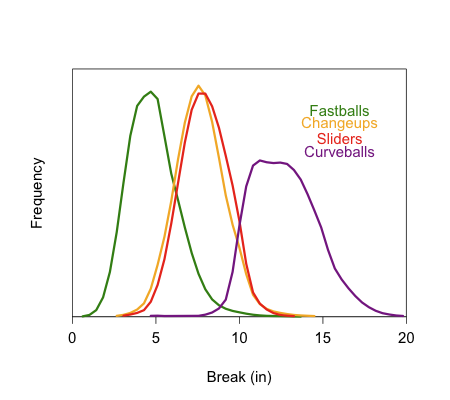
In my posts where I have examined the results of a pitch by its movement I have exclusively used the PFX or movement value, which is often broken up into its vertical, pfx_z, and horizontal, pfx_x, correspondents. These are often used to produce the horizontal versus vertical movement graphs that are show the different pitch types of a given pitcher.
Since break is a more intuitive value I wanted to know if it did as well at predicting the results of a pitch as movement. Here I will just look at curveballs, which I assume is the pitch whose outcome is most impacted by its break.
Here is the run value (again negative is good for the pitcher) of a curveball based on its break, on the left, and movement, on the right. The gray indicates the error.
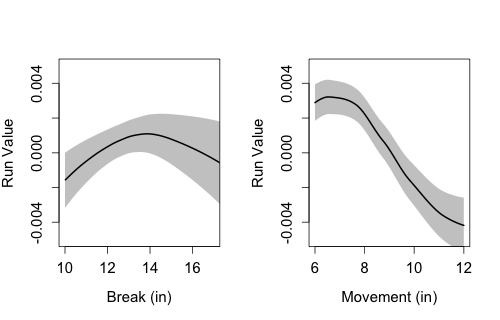
As you can see if you could choose just one piece of information, the break or the movement, of a curve in order to predict its success you would definitely choose movement. The error bars are smaller and non-overlapping. That is if you have a curve with 6 inches of movement it is quite likely to have a different run value than one with, say, 10 inches of movement. On the other hand if you have a pitch with 10 inches of break on average its run value is lower than one with a break of 14, but we are no where near as certain.
It is too bad, the intuitive value is not as good a predictor as the non-intuitive value. Still it is an interesting piece of information, which is currently not often reported or examined.
| Designated Hitter | September 03, 2009 |
Ivy League to MLB: Advanced Metrics and Minor League Baseball
Hello loyal readers of Baseball Analysts. My name is Shawn Haviland and I am a right-handed pitcher in the Oakland A’s organization, currently pitching for the Kane County Cougars in the Midwest League.
Prior to being drafted by Oakland I attended Harvard University, graduating in the spring of 2008. After playing in the Northwest League for the Vancouver Canadians I began blogging about my experiences, starting with my off-season workout regimen and continuing on through the season recapping each start and discussing other parts of the minor league experience. I’ve been reading The Baseball Analysts for a while and really enjoy the work that they do so hopefully I can keep up the high standard that has been set.
I became interested in advanced metrics a few months before this season when I first heard about Batting Average on Balls In Play (BABIP) through my search for answers as to why I was striking out more than a batter per inning but still had a batting average against of over .260. It seemed like every time they put the ball in play it was going to be a hit. From there I was hooked on the “numbers behind the game.” Despite my interest, the “saber metric revolution” hasn’t really made a huge impact on minor league baseball from the standpoint of how pitchers approach the game.
Minor league pitchers focus on only a few statistics: ERA, WHIP and K/BB ratio. Our pitching instructor preaches that if you want to advance to the next level (the only thing that minor league players really care about) you need to have a below league-average ERA, a WHIP below 1.3 and a strikeout-to-walk ratio of at least 3 to 1. Seems easy enough but as I know now I have less control over these statistics than I would like to think.
For example, my season this year has been a tale of two different halves. The first half of the year I was very successful hitting each mark, I was in the top 10 in the league in ERA, had a WHIP below 1.3 and was averaging approximately 8 strikeouts and 2 walks per game. The second half of the year my strikeout-to-walk ratio has stayed around 3 to 1 (7.5 to 2.8) but my ERA and WHIP have shot up, despite the fact that I feel like I have executed my pitches better in the second half of the season than the first half. What happened, you might ask? The answer here seems to be that my BABIP has gone up almost every month all the way up to over .360 in August.
| Month | BABIP | ERA |
|---|---|---|
| April | .303 | 2.35 |
| May | .304 | 3.06 |
| June | .346 | 5.61 |
| July | .327 | 6.46 |
| August | .368 | 4.54 |
(You can check out my full month-by-month splits and other assorted numbers of interest on minor league splits.com.)
I know that BABIP is not the only factor that is affecting my ERA but it certainly is not helping me achieve the organizational goal of having a below league-average ERA. The fact of the matter and the unfortunate thing for anyone victim of high BABIP, is that these stats are not prevalent in minor league clubhouses. Coaches see a rising ERA and think that the pitcher is pitching worse, which may be the opposite of the case.
Now if I handed that last paragraph to the majority of minor league baseball players I probably would be met with a blank stare. However, if I asked minor league pitchers about their ground ball ratio, most would be able to tell you exactly what their ratio is (mine is .89) and how they are trying to improve their ratio by throwing different pitches to force ground balls.
Batted ball type is the area where advanced metrics has broken into minor league baseball. Our roving pitching instructor Gil Patterson constantly says that it is “impossible to hit a ball out of the park if it is on the ground.” During instructional league we talked a lot about if you are able to make the hitter hit the ball on the ground the worst-case scenario, unless they hit the ball directly down the line, it is going to be a single. If you can make a team hit three singles to score a run you are going to be very successful. While BABIP is slightly higher on ground balls than fly balls it is worth the sacrifice because doubles, triples and home runs are what really hurt pitchers and allow for multiple runs to be scored very quickly.
Pitching for ground balls also eliminates the effect of the ballpark you play in. Our High-A team is in Stockton, California, in the hitters’ paradise that is the California League. Every pitcher that I have talked to says, “Pick up a sinker or a cutter in Kane County because you are going to need it in Stockton.” If you turn on the television and watch any major league baseball game the number of pitchers who are throwing predominantly four-seam fastballs is dwindling. Brian Bannister is a perfect example of this, in that he as all but scrapped his four-seam fastball and instead throws a sinker and a cutter.
The majority of teams in the major leagues rely heavily on home runs as a source of run production; and after the high-powered offense era pitchers are finally catching up and realizing that velocity is not the most important factor in success (although it is nice to throw gas) but rather the ability to make the hitter hit the top of the ball truly breeds success. Armed with this information, pitchers, like Bannister, are making adjustments to force the hitters to keep the ball in the yard.
This brings up the argument as to what is more important: pitch type or pitch location. When we have our pitchers' meetings to formulate the game plans against opposing hitters, axioms like, “he can’t hit a curve ball,” or “he has a long swing, so he won’t be able to catch up to a fastball,” are consistently thrown around. I have never liked speaking in absolutes because I don’t think that there is a hitter in pro ball, or college baseball for that matter, who can’t hit a certain pitch. The players who have a hole that blatant were weeded out long ago. However, there are players who cannot hit a well-located fastball or curveball. My point being that every hitter can hit a fastball belt high right down the middle or a hanging curveball so to simply throw a pitch that the hitter “can’t hit” is not enough. As with real estate, pitching is all about location, location, and location. Although I have no statistical proof, I would argue that throwing the “wrong” pitch in a good location is going to lead to a lot more success than throwing the “right” pitch that is poorly located.
Vladimir Guerrero is one of the best fastball hitters in the game today but you will see him weakly hit a well-placed fastball. Hitters have the hard job, they need to recognize what pitch is coming and then hit a round ball with a round bat to a place that is not occupied by a defensive player. As a pitcher, all you have to do is locate your pitch and let the batter hit it at someone. Statistics tell you that more times than not the hitter is going to get himself out.
Thanks for reading. If you have any thoughts or questions, feel free to leave comments below, email me or check out my blog Ivy League to MLB.
| Change-Up | September 02, 2009 |
Along Came Jones
Baseball pundits, purists, analysts and announcers disagree on a wide array of issues relating to the game. DH or no DH? What are the virtues of the sacrifice bunt? Small ball or the three-run homer? But one thing that everyone seems to agree on is that what makes baseball particularly neat is that you never know when you might witness something extraordinary. Maybe it's a perfect game, or a speedster steals home or a nail-biter between division foes ends in an unassisted triple play. When you show up at the park, you never know what you might witness.
One can extrapolate that very same principle over the course of a week, a month or an entire season. You just never know. For instance, Mark Reynolds has 40 home runs. I find that to be absolutely remarkable. The New York Yankees have had five key contributors - Jorge Posada, Derek Jeter, Johnny Damon, Hideki Matsui and Andy Pettitte - all on the wrong side of the age of 35, make marked improvements over their 2008 campaigns. What are the odds? And perhaps most stunningly of all, Garrett Jones, 28 year-old Garrett Jones, Garrett Jones of the 1,038 Minor League plate appearances in 11 seasons at a .258/.312/.450 clip, is hitting .291/.360/.602 for the Pittsburgh Pirates in 2009.
Jones' transaction history (thanks B-Ref) offers a glimpse of what an afterthought he was coming into 2009:
June 2, 1999: Drafted by the Atlanta Braves in the 14th round of the 1999 amateur draft. Player signed June 18, 1999.May 21, 2002: Released by the Atlanta Braves.
May 24, 2002: Signed as a Free Agent with the Minnesota Twins.
November 3, 2008: Granted Free Agency.
December 16, 2008: Signed as a Free Agent with the Pittsburgh Pirates.
And yet, here he is. Let's have a look at how Jones is stacking up in 2009. Let me caveat everything I am about to present by noting that small sample size warnings apply. Jones has played in just 53 games and come to the plate only 228 times in 2009. He may tank before the end of this season. Still, it's fun to have a look. Here is how he ranks among MLB hitters in AB/HR (minimum 200 PA's):
           AB/HR
Pujols     10.9
Pena       11.6
Reynolds   11.8
Jones      12.4
Dunn       12.8
And what about the Major League OPS+ leaders? Again, minimum of 200 plate appearances:
            OPS+
Pujols      190
Mauer       181
Gonzalez    162
Fielder     161
M. Ramirez  157
H. Ramirez  156
Dunn        156
G. Jones    153
Utley       152
Beltran     149
Ok ok, so we know that Jones is right there offensively with the best sluggers in the game for 2009. But is his rookie season, at the age of 28, taking on historic significance? Is there much precedent for the way Jones has performed in 2009? The answer is "no".
Oh sure there was Johnny Schulte in 1927 and Bill Kenworthy in 1914 - I am sure you remember both - but for ballplayers in their rookie campaigns at the age of 27 or later, it does not get much better than Jones in 2009. Have a look for yourself.
It's unlikely that Jones keeps up anything resembling this clip but let's put his rookie campaign in perspective, much the way we would when we witness a cycle, no-hitter or 4-home run game. Maybe they lack big-picture significance but they're significant achievements on their own.
| Behind the Scoreboard | September 01, 2009 |
Waiver Deadline Round-Up
Several teams made deals in the final hours of the trade deadline, giving some teams' rosters a boost in the final month of the season. Teams on the other end of those deals had the opportunity to cut costs and restock their rosters for the future. Today I'll be looking at those deals and reviewing the winners and losers.
D'Backs trade Jon Garland to Dodgers
The Dodgers get a solid starting pitcher in Garland, who has had a fine season - one that's about average for his career. With Arizona he posted a 4.29 ERA while putting up a 4.61 Fielding Independent Pitching (FIP) number. Garland had signed with Arizona for a salary of $6.25 million with a $10 million mutual option in 2010 ($2.5 million buyout if the club declines and $1 million buyout if Garland declines). According to late reports, the Diamondbacks will pick-up the rest of the Garland's salary as well as any buyout money for 2010. In terms of cash the Dodgers have nothing to lose and all Arizona gains from the deal is the player-to-be-named later.
From the Dodgers perspective, it would seem like a good deal. However, with an already strong rotation, Garland will drop into the 5th spot in the rotation, replacing knuckler Charlie Haeger. With Wolf, Billingsley, Kershaw, and Kuroda all more effective than Garland, it's hard to see where he would fit into the post-season roster, especially since the bullpen is equally as stocked. While Garland can help the club by taking the ball every 5th or 6th day (which is it, Joe Torre?), with the Dodgers already having a 99% probability of making the playoffs, this won't really change much.
In actuality, while the pickup of Garland surely won't hurt, it's tough to see how the move really helps the Dodgers a whole lot. The deal, in total, is a bit puzzling, with Arizona receiving little for a player who only marginally helps LA. Garland could have been a big help on a few other clubs such as Texas, Minnesota, or Colorado, where he could have helped the team make the playoffs and been a solid #3 or #4 contributor in the playoffs as well. Since he would have been more valuable in those locations, it would seem these teams would be able to give a little more in return for Garland, making both sides happier than the deal which actually occurred.
White Sox trade Jose Contreras to Rockies
The aforementioned Rockies also needed some pitching help, and got some from the White Sox, with 37-year old Jose Contreras packing his bags for Denver. By traditional metrics, Contreras has had a dismal year, posting a 5.27 ERA and a 5-13 record for Chicago. His tRA and FIP are pretty good however, at 4.37 and 4.12 respectively, indicating that perhaps he has been the victim of some bad luck, bad defense, or both.
For Colorado, it's worth taking a flyer on Contreras especially considering the state of their rotation. Still, Contreras is not the horse he used to be, getting roughed up and removed in the 5th or earlier in five of his last six starts and averaging just 5.4 IP/start on the year. Colorado, may also have been wooed by Contreras' reputation as a "big game pitcher" as the Rockies figure to have plenty of them down the stretch this year. It should be noted however, that many of Contreras' big games came in seasons in which he pitched terrifically during the regular season as well - something he is clearly not doing this year.
In return, Chicago will get Brandon Hynick, a 24-year old right-hander who has pitched pretty well in AAA this year, not a terrible return for a 37-year old pitcher having a bad year on team that is close to falling out of the pennant race.
White Sox trade Jim Thome to Dodgers
As if the Contreras deal wasn't enough, the Jim Thome trade officially waves the white flag for the White Sox, who still had a small, but possible chance to make the playoffs (BP has it a 5.5%). The loss of Thome, who had become a fan favorite in Chicago and is one of baseball's all-time good guys, will be a blow to the Sox and their fans both on and off the field. The mini-fire sale from the Sox is interesting, since only a month ago they were buyers in picking up the big contracts of both Jake Peavy and Alex Rios (neither of which has thus far paid dividends), but an 11-17 August has a way of changing things. The Sox get virtually nothing in return (a 26-year old Class-A player) except savings on an undisclosed amount of Thome's remaining salary. I don't like this move for the Sox - giving up a fan favorite and giving up on the season when you're still just six games out isn't the way to endear fans - especially when the return on such a move is quite small.
Nevertheless, the White Sox' loss is the Dodgers gain as they gain a bona fide masher in Thome, who at age 38 can still hit. GM Ned Colletti has already said Thome won't play first-base, but he'll be dangerous as the Dodgers top pinch-hitter and only left-handed power off the bench. That will come in handy during the playoffs. The trade will also pay off doubly if the Dodgers can reach the World Series where he will almost certainly be the starting DH. Thome is hitting just .249 but has a .372 OBP and 23 homers in just 417 AB's.
For my money, the Dodgers ought to test Thome at first base in any case. Thome had a career UZR per 150 games of -2.4, while James Loney, the Dodgers current first baseman, has a career UZR per 150 games of -2.2. While it's been awhile since Thome has played first regularly, it might be worthwhile to see if he can still perform there. Thome would be an improvement over Loney at the plate which may (or may not according to the Dodger's calculations) offset the defensive loss. Why not try out Thome at first during the relatively meaningless regular season and see how he does?
UPDATE: Here's why not. According to Ned Colletti: "In fact, the night before the deadline he called me. … He just said: 'I just want to be honest with you. I’d love to come. I want to help you guys any way I can. But playing first base is not something I’m going to be able to do — maybe in an emergency situation, perhaps.' "
Giants sign Brad Penny
The final big acquisition Monday night was the signing of Brad Penny by the Giants. The move should be a boost to San Francisco as Penny will step into the #5 spot which was vacated by the Randy Johnson injury. Penny is another guy who has had a poor season by usual standards (7-8, 5.61), but a less terrible FIP (4.49) and tRA (5.21). Penny is clearly not in his old form, but considering the Giants' other options (Ryan Sadowski, Joe Martinez), Penny is a good pick-up, especially considering the move cost them less than $100,000. With a 24% shot at the playoffs according to Baseball Prospectus, every game will be big. While Penny won't likely be much use once the playoffs begin, with luck he can help them get there. For Penny, the signing is an opportunity to revitalize what has been a lost past two years.
With the final moves made, and the postseason rosters set, the GM's and front offices can simply sit back and watch as the teams they have assembled push for the final few playoff spots. Time will only tell how these big four moves will work out.