Rich Lederer • Baseball Beat
Patrick Sullivan • Change-Up
Jeremy Greenhouse • Touching Bases
Dave Allen • F/X Visualizations
Sky Andrecheck • Behind the Scoreboard
Marc Hulet • Around the Minors
Al Doyle • Past Times
Retired Uniforms:
Bryan Smith • WTNY
Joe Sheehan • Command Post
Jeff Albert • The Batter's Eye
RSS Feed
Home
*Examining the Past, Present, and Future*
Lineup Card
Recent Entries
» Putting Together a Reality Team
» Historical Hall of Fame Vote Comparisons: 2012
» An All-Christmas Team
» The New-Look Angels
» John Denny: The Forgotten Cy Young Award Winner
» Money Isn't Everything
» What Would It Take to Hit .400 in the 21st Century?
» Halos Heaven
» Brandon McCarthy's Breakout Season
» Link-o-Rama
» Historical Hall of Fame Vote Comparisons: 2012
» An All-Christmas Team
» The New-Look Angels
» John Denny: The Forgotten Cy Young Award Winner
» Money Isn't Everything
» What Would It Take to Hit .400 in the 21st Century?
» Halos Heaven
» Brandon McCarthy's Breakout Season
» Link-o-Rama
Best of Baseball Beat
Abstracts From the Abstracts
1977 Baseball Abstract
1978 Baseball Abstract
1979 Baseball Abstract
1980 Baseball Abstract
1981 Baseball Abstract
1982 Baseball Abstract
1983 Baseball Abstract
1984 Baseball Abstract
1985 Baseball Abstract
1986 Baseball Abstract
1987 Baseball Abstract
1988 Baseball Abstract
1978 Baseball Abstract
1979 Baseball Abstract
1980 Baseball Abstract
1981 Baseball Abstract
1982 Baseball Abstract
1983 Baseball Abstract
1984 Baseball Abstract
1985 Baseball Abstract
1986 Baseball Abstract
1987 Baseball Abstract
1988 Baseball Abstract
Bert Blyleven Series
Meeting Up and Hanging Out with Bert
The Results Are In And...
Aficionado Heavily Invested in Blyleven
Latest on Blyleven's Chances for the HOF
The Internet Zealot Responds
400 Down and 5 to Go...
Bert Be Home By Eleven?
Blyleven's Forgotten Season (1973)
HeyMan, Your Comments Don't Hold Water
The Waiting is the Hardest Part
Another Addition to the Blyleven Series
Search for the Truth
As Dominant as His HOF Contemporaries
Listen, Buster
A Larger Step for Blyleven
Answering the Naysayers (Part Two)
Another Small Step for Blyleven
Q&A: Blyleven on the Twins
The Majority Rules, Right?
It's All Dutch to Some
The Hall of Fame Case for Bert Blyleven
Q&A: Blyleven on Felix Hernandez
Clemens Rocketing Up Charts
Poz: An Interview With a KC Star
A HOF Chat with Tracy Ringolsby
Up Close and Personal
A Peek Into the Mind of a HOF Voter
Answering the Naysayers
It's That Time of the Year (Again)
"If Cooperstown is Calling..."
The Bert Alert
One Small Step for Blyleven...
Only the Lonely
Exclusive Interviews
Lee Sinins
Alex Belth
David Pinto
Will Carroll
Mike Carminati
Aaron Gleeman
Joe Sheehan
Jay Jaffe
Jeff Peek
Tracy Ringolsby
Joe Posnanski
Bill James Part I, II, III
Jon Lalonde
Chuck Tiffany
Dayn Perry
Fay Vincent
Nate Silver
Alex Belth
David Pinto
Will Carroll
Mike Carminati
Aaron Gleeman
Joe Sheehan
Jay Jaffe
Jeff Peek
Tracy Ringolsby
Joe Posnanski
Bill James Part I, II, III
Jon Lalonde
Chuck Tiffany
Dayn Perry
Fay Vincent
Nate Silver
Bullpen
Rich Lederer
The Odd Couple (with Alex Belth)
The MostUnder Over Underrated Player in Baseball (with Brian Gunn)
Three Wise Men (roundtable by Alex Belth)
Infrequently Asked Questions (interview with Matt Welch)
Interview (Orioles Think Tank)
Bernie and the Yanks (Bronx Banter)
Hope and Faith: How the LAA Win the World Series (Baseball Prospectus)
NL West (The Soul of Baseball)
Greatest Living Hitter? (Sports Illustrated)
Roundtable: 2008 HOF Ballot (Armchair GM)
The Most
Three Wise Men (roundtable by Alex Belth)
Infrequently Asked Questions (interview with Matt Welch)
Interview (Orioles Think Tank)
Bernie and the Yanks (Bronx Banter)
Hope and Faith: How the LAA Win the World Series (Baseball Prospectus)
NL West (The Soul of Baseball)
Greatest Living Hitter? (Sports Illustrated)
Roundtable: 2008 HOF Ballot (Armchair GM)
Patrick Sullivan
Designated Hitters
David Bromberg (Q&A: John Denny)
Mark Armour (H. Killebrew and Versatility)
Joe Lederer (Soundtrack of a Prospect)
David Bromberg (Clemente's Autograph)
David Bromberg (Woody Fryman)
D. Baumstein (WAR Against Age: Pitchers)
Doug Baumstein (The WAR Against Age)
Doug Baumstein (A Lifetime on the Road)
John Fraser (Pick Six)
Mark Armour (How to Score More Runs?)
Bill Parker (What Opening Day Tells Us)
Stan Opdyke (Pat Rispole)
Chris Jaffe (Evaluating Baseball's Mgrs)
Stan Opdyke (Baseball Radio in NYC, 1953)
A. Nathan (Performance of Baseball Bats)
Michael Weddell (Edgar Martinez/HOF)
Jon Weisman (100 Things Dodgers Fans...)
Stan Opdyke (Connie Mack and Vin Scully)
Eric Walker (Evaluating Run Production)
Brent Mayne (The Intangibles of Catching)
Chris Moore (Best Fastballs in Baseball)
Dave Baldwin (The Batter’s Brain)
Shawn Haviland (Ivy League to MLB)
Larry Granillo (Walking Off)
Rob Iracane (Solo HR Won't Break You)
Tommy Bennett (Charm of AM Radio)
Harry Pavlidis (Johan Santana's Fast Start)
John Walsh (WAR and Remembrance)
Eric Walker (Precisely Inaccurate)
Bob Timmermann (As They See 'Em)
Geoff Young (Unicycles and Delusions)
Baseball Analysis at Tufts (Groundballers)
Baseball Analysis at Tufts (GB Out Rates)
G. Rybarczyk ('09 Hit Tracker Projections)
Joe Lederer (Curt Schilling/HoF)
Conor Gallagher (Hall of Fallacies)
Chris Green (Jim Rice, HoF, the Numbers)
Shawn Hoffman (Baseball's Bear Mkt?)
Paul Anthony (Manny Syndrome)
Ross Roley (World Series Odds)
B. Timmermann (Catcher's Interference)
R.J. Anderson (Waiting the Hardest Part)
Maury Brown (Cubs, MLB, and Cuban...)
Myron Logan (Dee-Fense, Dee-Fense)
Craig Calcaterra (Frivolity, Part I, Part II)
Chad Finn (Ode to Baseball Cards)
David Cameron (Mariners Foibles)
Chris Dial (Chipper Jones)
Pat Lederer (Memory Lane)
David Appelman (Clutch Pitching)
Bob Rittner (DH)
Jonathan Mayo (Roger Clemens)
Lisa Winston (My Son-in-Law...)
Russ McQueen (The Yellow Hammer)
Bob Rittner (I'm OK, You're OK)
Mark Armour (In Defense of the HOF)
Pat Jordan (Friends)
Dan Levitt (Analysis of Terry Ryan)
Doug Baumstein (Trading Econ 101)
Ross Roley (Runner's Reluctance II)
Ross Roley (Runner's Reluctance I)
Mark Armour (No-Longer Lovable Sox)
Bruce Regal (Stealthy and Wise)
Brian Gunn (Roid Monster)
Current/McEvoy (Value of the SB)
John Rickert (Sinister Thefts)
Nate Silver (Sabermetrics)
David Vincent (Home Run Production)
Joe P. Sheehan (Enhanced Gameday II)
Mark Armour (An Ode to Sport)
David Gassko (All-Time Worm Burners)
Joe P. Sheehan (Enhanced Gameday)
John Walsh (When Titans Clash)
Fox/Williams (Quantifying Coaches II)
Fox/Williams (Quantifying Coaches I)
Jacob Luft (Bull Durham Rant)
Chad Finn (Strat-O-Matic)
Lisa Winston (Rotisserie Baseball)
Dave Studeman (Baseball Stats)
Steve Treder (Roger Craig)
Marc Normandin (Jeff Bagwell)
D. Appelman (Expanding Strike Zone)
Jeff Sackmann (Worst MiL Defenders)
Jeff Sackmann (Best MiL Defenders)
Maxwell Kates (Van Lingle Mungo)
David Appelman (Pitch Location)
Kent Bonham (Danny Ray Herrera)
Glenn Stout (Two Baseball Poems)
Bruce Regal (The Challenge Round)
Mark Lamster (Barry & Ty)
Geoff Young (NL West)
Tom Lederer (The Ryan Express)
Brian Erts (Great Leap Forward)
David Pinto (Parity and the N.L.)
Jacob Luft (Fathers and Daughters)
Jamey Newberg (Pete's Sake)
Jeff Albert (A. Jones Swing Analysis)
Jeff Albert (A-Rod Swing Analysis)
Keith Law (Death, Taxes, and Waivers)
Peter Abraham (Tales of Torre Tales)
Larry Borowsky (Let 'er Rip II)
Dan Levitt (Empirical Analysis of Bunting)
Jonah Keri (If I Met Warren Cromartie...)
Bob Klapisch (War Stories)
Bob Timmermann (John F. Kennedy HS)
Kent Bonham (Aluminum Adjustments)
Al Doyle (More Than Superstars)
Ross Roley (Instant Replay)
David Vincent (Barry Bonds Homers)
Chad Finn (Our Favorite Obscurities)
Bill Deane (1979 NL MVP)
Mark Armour (Rise/Fall of Artificial Turf)
Jeff Angus (Wally Moon Camp)
David Berri (Money and Baseball)
Larry Borowsky (Baseball w/o the #s)
Derek Zumsteg (The Irrational Market)
David Regan (Free Agent Contracts)
Peter Schmuck (Steroids and the HOF)
David Appelman (Pitchers, Pitch by Pitch)
Dan Fox (Swinging, Taking, Fouling, Etc)
Patrick Sullivan (Study of NYY CF/BOS LF)
Will Leitch (Baseball Journalism)
Jeff Sullivan (Pitcher Release Points)
Steve Treder ('69-'70 Giants)
Maury Brown (Charlie Finley)
John Brattain (Bob Johnson)
Bob Klapisch (The Case for Bert Blyleven)
Jeff Peek (Pride and Prejudice)
Dayn Perry (Bert and Warren)
Rob Neyer (If Don Sutton Was Great...)
Lisa Winston (Minor League Memories)
Alex Belth (Otis Redding Was Right)
David Cameron (Long Live the King)
Jeff Angus (Baserunning Study)
Bert Blyleven (Baseball Playoffs)
Boyd Nation (Not a Prospect List)
James Click (Batters-Baserunners Study)
Jeff Shaw (Why I Love Baseball)
David Gassko (BIP/BFP Fielding Study)
Jay Jaffe (Milwaukee Sausage Race)
Jamey Newberg (Remember When)
Bob Klapisch (Press Box to the Mound)
Dan Levitt (Predictive Value of BB)
David Vincent (Official Scorer)
Jon Weisman (Rick Monday)
Larry Borowsky (Let 'er Rip)
Will Carroll (Fictional Short Story)
Bob Timmermann (Japanese Baseball)
Cyril Morong (Best Pitching Seasons)
Sean Forman (Monte Carlo Win-Loss)
Brian Gunn (My Little Blue Book)
Joe Lederer (My Dad and Baseball)
Bill Deane (Bob Gibson, 1968)
Mark Armour (1977 Yankees)
Darren Viola (Retrosheet)
David Pinto (RFK)
Dayn Perry (Brave Heart)
Matt Welch (Dave Hansen)
Kevin Kernan (Jack McKeon)
Tom Lederer (Dodgers Road Trip)
Steve Lombardi (Slider)
Studes (Picturing Baseball)
Mike Carminati (Luck of the Drawl)
Eric Neel (Vin Scully)
J.C. Bradbury (Leo Mazzone)
John Sickels (Bill James)
Search Baseball Analysts
Archives
By Category:
Around the Majors Content Only
Around the Minors Content Only
Baseball Beat Content Only
Baseball Beat/Change-Up Content Only
Baseball Beat/WTNY Content Only
Behind the Scoreboard Content Only
Change-Up Content Only
Change-Up/Around the Majors Content Only
Command Post Content Only
Crunching the Numbers Content Only
Designated Hitter Content Only
F/X Visualizations Content Only
Past Times Content Only
Saber Talk Content Only
The Batter's Eye Content Only
Touching Bases Content Only
Weekend Blog Content Only
WTNY Content Only
By Month:
February 2012
January 2012
December 2011
October 2011
September 2011
August 2011
July 2011
June 2011
May 2011
April 2011
March 2011
February 2011
January 2011
December 2010
November 2010
October 2010
September 2010
August 2010
July 2010
June 2010
May 2010
April 2010
March 2010
February 2010
January 2010
December 2009
November 2009
October 2009
September 2009
August 2009
July 2009
June 2009
May 2009
April 2009
March 2009
February 2009
January 2009
December 2008
November 2008
October 2008
September 2008
August 2008
July 2008
June 2008
May 2008
April 2008
March 2008
February 2008
January 2008
December 2007
November 2007
October 2007
September 2007
August 2007
July 2007
June 2007
May 2007
April 2007
March 2007
February 2007
January 2007
December 2006
November 2006
October 2006
September 2006
August 2006
July 2006
June 2006
May 2006
April 2006
March 2006
February 2006
January 2006
December 2005
November 2005
October 2005
September 2005
August 2005
July 2005
June 2005
May 2005
April 2005
March 2005
February 2005
January 2005
December 2004
November 2004
October 2004
September 2004
August 2004
July 2004
June 2004
May 2004
April 2004
March 2004
February 2004
January 2004
December 2003
November 2003
October 2003
September 2003
August 2003
July 2003
June 2003
Reference
Organizational Stats
Arizona Diamondbacks Bat / Pitch
Atlanta Braves Bat / Pitch
Baltimore Orioles Bat / Pitch
Boston Red Sox Bat / Pitch
Chicago Cubs Bat / Pitch
Chicago White Sox Bat / Pitch
Cincinnati Reds Bat / Pitch
Cleveland Indians Bat / Pitch
Colorado Rockies Bat / Pitch
Detroit Tigers Bat / Pitch
Florida Marlins Bat / Pitch
Houston Astros Bat / Pitch
Kansas City Royals Bat / Pitch
Los Angeles Angels Bat / Pitch
Los Angeles Dodgers Bat / Pitch
Milwaukee Brewers Bat / Pitch
Minnesota Twins Bat / Pitch
New York Mets Bat / Pitch
New York Yankees Bat / Pitch
Oakland Athletics Bat / Pitch
Philadelphia Phillies Bat / Pitch
Pittsburgh Pirates Bat / Pitch
St. Louis Cardinals Bat / Pitch
San Diego Padres Bat / Pitch
San Francisco Giants Bat / Pitch
Seattle Mariners Bat / Pitch
Tampa Bay Devil Rays Bat / Pitch
Texas Rangers Bat / Pitch
Toronto Blue Jays Bat / Pitch
Washington Nationals Bat / Pitch
All-Star Links
Official Websites
News and Notes
Baseball News Blog
Baseball Newstand
ESPN Baseball
Fox Sports Baseball
Pro Sports Daily
Roto World
The Roto Times
USA Today Baseball
Baseball Newstand
ESPN Baseball
Fox Sports Baseball
Pro Sports Daily
Roto World
The Roto Times
USA Today Baseball
Reference and Analysis
Baseball Almanac
Baseball America
Baseball Archive
Baseball Contracts
Baseball Cube
Baseball Graphs
Baseball Library
Baseball Musings Player Database
Baseball Page
Baseball Primer
Baseball Prospectus
Baseball Reference
Baseball Statistics
Baseball Truth
Boxscore Central
Diamond Mind Baseball
Doug's Stats
FanGraphs
Fast Balls (pitchfx catalog)
Hardball Dollars
Hardball Times
Hit Tracker
Retrosheet
Rotobase/Rotoblog
Stat Corner
STATS
Tango on Baseball
Yahoo Sports MLB
Web Gems
Bill James Primer
Sabermetric Manifesto (Grabiner)
Pitching and Defense (McCracken)
Pitching and Defense (Tippett)
Transactions Primer (Neyer)
Baseball Stats (Batter's Box)
Prospect Report (Cameron)
Pitcher Workloads (Sheehan)
Goodbye to Old Baseball Ideas (Rickey)
Sabermetric Manifesto (Grabiner)
Pitching and Defense (McCracken)
Pitching and Defense (Tippett)
Transactions Primer (Neyer)
Baseball Stats (Batter's Box)
Prospect Report (Cameron)
Pitcher Workloads (Sheehan)
Goodbye to Old Baseball Ideas (Rickey)
Columnists
Baseball Blogs
Around the Majors
Athletics Nation
Baseball Crank
Baseball Musings
Baseball-Reference Blog
Batter's Box
Big League Stew
Bronx Banter
Catfish Stew
Cub Town
Dan Agonistes
Dodger Thoughts
DRays Bay
Ducksnorts
Futility Infielder
Halos Heaven
Inside the Rockies
It Might Be Dangerous
Knuckle Curve
LoHud Yankees Blog
Lookout Landing
Management by Baseball
Metaforian
Metsgeek
Mike's Baseball Rants
Only Baseball Matters
Redbird Nation
Red Reporter
Sabernomics (Braves)
Seth Speaks
ShysterBall
6-4-2 (Angels/Dodgers)
The Book
TheCubdom
The Cutting Edge
The House That Dewey Built
The View From The Bleachers
Tiger Blog
U.S.S. Mariner
Viva El Birdos
Where's Kernan
Minor Leagues
Arizona Fall League
BA Player Finder
Cal Leaguers
Jamey Newberg
JDM's Scoresheet Baseball
Minor League Baseball
Minor League Park Factors
Minor League Splits
No Pepper
Sickels' Minor League Ball
Warm October Nights
BA Player Finder
Cal Leaguers
Jamey Newberg
JDM's Scoresheet Baseball
Minor League Baseball
Minor League Park Factors
Minor League Splits
No Pepper
Sickels' Minor League Ball
Warm October Nights
Amateur
Boyd's World (College)
Cape Cod Baseball League
College Baseball Blog
College Baseball Insider
Collegiate Baseball Newspaper
College Splits
College Splits Blog
Dirtbags Baseball (Long Beach State)
NCAA Baseball
NCBWA
Team One Baseball (High School)
Texas A&M & Baseball
Cape Cod Baseball League
College Baseball Blog
College Baseball Insider
Collegiate Baseball Newspaper
College Splits
College Splits Blog
Dirtbags Baseball (Long Beach State)
NCAA Baseball
NCBWA
Team One Baseball (High School)
Texas A&M & Baseball
Historical
Cuban Baseball
House of David
Jim "Mudcat" Grant's Web Page
Negro League Baseball Players Assoc
Negro Leagues Baseball Museum
1919 Black Sox
Pacific Coast League
Philadelphia Athletics Historical Society
Shoeless Joe Jackson Society
SABR-L Archives
Walter O'Malley
House of David
Jim "Mudcat" Grant's Web Page
Negro League Baseball Players Assoc
Negro Leagues Baseball Museum
1919 Black Sox
Pacific Coast League
Philadelphia Athletics Historical Society
Shoeless Joe Jackson Society
SABR-L Archives
Walter O'Malley
Miscellaneous
Forums
Credits
Ticket Center
Tickets to Baseball -
Premium Red Sox Tickets - Tickets to Marlins Games - Cardinals Game Tickets - NY Yankee Tickets - Tickets Oakland Athletics - Dallas Cowboys Tickets - Arizona Cardinals Tickets - Tickets Seattle Seahawks - Buffalo Bills Tickets Online - Tickets to Dolphins Football
Buy Boston Red Sox tickets,
Philadelphia Phillies tix,
NY Yankees tickets,
NY Mets tickets, and
MLB All Star game tickets at ABC tickets
Not sure where to find the best online sportsbooks? Start your search with PlayersJet.
Get deals at SportsMemorabilia.com on baseball apparel, including Phillies jerseys and more for adults and children.
Shop the largest selection baseball equipment on sale at Sports Unlimited. Check out tons of baseball gloves, youth baseball gloves and catchers gear from Rawlings, Wilson, Nike & Under Armour.
2011 Draft Order
Courtesy of Baseball America
First-Round:
 1. Pirates (57-105)
 2. Mariners (61-101)
 3. Diamondbacks (65-97)
 4. Orioles (66-96)
 5. Royals (67-95)
 6. Nationals (69-93)
 7. Diamondbacks (for B. Loux)
 8. Indians (69-93)
 9. Cubs (75-87)
10. Padres (for Karsten Whitson)
11. Astros (76-86)
12. Brewers (77-85)
13. Mets (79-83)
14. Marlins (80-82)
15. Brewers (for Dylan Covey)
16. Dodgers (80-82)
17. Angels (80-82)
18. Athletics (81-81)
19. Red Sox (from DET for Martinez)
20. Rockies (83-79)
21. Blue Jays (85-77)
22. Cardinals (86-76)
23. Nationals (from CWS for Dunn)
24. Rays (from BOS for Crawford)
25. Padres (90-72)
26. Red Sox (from TEX for Beltre)
27. Reds (91-71)
28. Braves (91-71)
29. Giants (92-70)
30. Twins (94-68)
31. Rays (from NYY for Soriano)
32. Rays (96-66)
33. Rangers (from PHI for Lee)
Supplemental First Round:
34. Nationals (Dunn)
35. Blue Jays (Downs)
36. Red Sox (Martinez)
37. Rangers (Lee)
38. Rays (Crawford)
39. Phillies (Werth)
40. Red Sox (Beltre)
41. Rays (Soriano)
42. Rays (Balfour)
43. Diamondbacks (LaRoche)
44. Mets (Feliciano)
45. Rockies (Dotel)
46. Blue Jays (Buck)
47. White Sox (Putz)
48. Padres (Garland)
49. Giants (Uribe)
50. Twins (Hudson)
51. Yankees (Vazquez)
52. Rays (Benoit)
53. Blue Jays (Olivo)
54. Padres (Torrealba)
55. Twins (Crain)
56. Rays (Choate)
57. Blue Jays (Gregg)
58. Padres (Correia)
59. Rays (Hawpe)
| Command Post | September 28, 2007 |
Scouting Jake Peavy
With the season winding down, and as a bit of foreshadowing for the playoff preview I'm writing next week, I wanted to use my PITCH f/x database to look at Jake Peavy from something like an advance scouting point of view. Peavy, the ace of the Padres staff, has had a great season, highlighted by an unbelievable month of May and currently leads the Majors in ERA and WHIP as well as the National League in strikeouts and wins. I've been dancing around advance scouting in some my articles, by diagraming how a pitch moves or examining what pitchers throw in high leverage situations, but I haven't put it all together in one place yet. While I've never seen an MLB advance scouting report, I think a good place to start is with an examination of what a pitcher throws, when he throws it, and what happens once he throws it. Using this framework, you can identify a pitcher's strengths, weaknesses and tendencies.
Pitch Profile-What does he throw?
Here's a chart of Peavy's pitches, showing the differences between his pitches and their non-spinning equivalents.
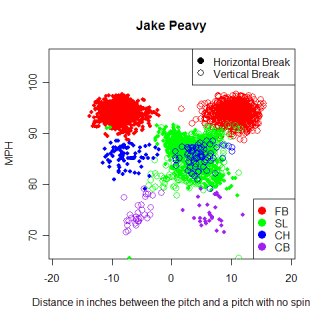
One thing that sticks out in this graph is the large group of sliders and when I looked at Peavy before I was unsure how to handle that group of pitches. If you look close enough, you begin to make out two groups, although overall they appear to be variations on his slider rather than two unique pitches.
Pitch   N     Speed   Pfx    Pfz    BreakX   BreakZ
FB      751   94.2   -8.69   10.68  3.11     3.09
SL      473   86.3    2.39   4.52  -1.25     6.74
CH      79    85.7   -8.10   4.36   2.90     6.81
CB      30    73.8    6.42  -5.57  -2.65     13.80
Peavy's fastball is thrown hard and hitters will see it as having slightly less "drop", relative to an average RHP fastball. The smaller amount of drop gives the illusion of a rising fastball, which is reflected by a higher than average pfz value. His fastball also has more arm-side movement than an average RHP fastball does.
Almost every pitcher throws their fastball the most and will throw their "out" pitch, if they have one, the next most, usually far more than average for that pitch type. Peavy is no exception to this pattern, and 35% of his pitches are sliders, compared to the average for RHP, which is 19%. His slider breaks away from RHH and drops less than an average slider, although in both cases, not by very much. It is thrown at roughly the same speed as his changeup, although they move in opposite horizontal directions. The wide range of possible slider movements makes comparisons against an average slider a little less precise than for fastballs. Sliders are essentially what's left over after fastballs, curveballs and changeups have been identified, the scrapple of pitches, and there is more variation among sliders (and cutters) thrown by different pitchers than any other pitch.
Peavy's changeup has similar movement to his fastball, except it travels 10 MPH slower. He doesn't throw his changeup much (6% of pitches) and his curveball even less (2%).
Situational Pitching-When does he throw it?
If hitters are curious about which pitches to look for, here's a graph showing the frequency that Peavy throws each of his pitches, by inning.
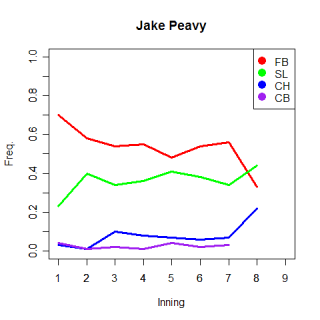
You can really see Peavy's reliance on his fastball and slider from this graph. 70% of Peavy's first inning pitches are fastballs (Avg. RHP throws 60%) and while there are any number of reasons why his first inning fastball percentage is higher than average (he doesn't want hitters to see his slider early in the game, he's trying to make sure he has command of his fastball, he's trying to establish his fasbtball as a pitch) it could just be because he really only throws two pitches. As the game moves along, he throws fewer fastballs and focuses more on his slider, which is consistent with how most pitchers operate. I only have data for 9 pitches of his in the 8th inning, so there probably isn't anything to the fact that only 3 of them are fastballs.
Now look closer at the staggered increases in his changeups and curveballs in the third and fifth innings respectively. These changes mirror the increase in sliders in the second inning. One possibility to explain these changes is that Peavy might not want to show his full arsenal of pitches to hitters early in the game. In the first inning he throws mostly fastballs, then adds his slider to the mix in the second innnig. It looks like he begins throwing his changeup in the third inning and adds his curveball in the fifth. These changes are pretty subtle and might just be artifacts, but if they’re real, it gives hitters another piece of information about what pitches to look for at various stages of the game.
That graph gives an overall pattern for Peavy, but which pitch does he throw when he needs a strikeout? In situations where the win value of a strikeout is the same as the run value of a ball that is put in play, you would expect a pitcher to not worry about getting a strikeout vs. a regular out, while when the value of a strikeout is high, you would expect a pitcher to try for a strikeout. One important thing to note is that I used the run value of a strikeout as opposed to the win value when splitting up situations. Using the win values of strikeouts, which is the correct way to do this, would cause my already small samples to shrink even more, and using the run values ignores the possibility of pitching in a blowout, where a pitcher would want to avoid walks and just get outs, even in situations where a strikeout might normally be needed. There's some error built into these values as a result.
With that disclaimer out of the way, Peavy gives the batter almost even odds on seeing a fastball (54%) and a 37% chance of seeing a slider when the value of a strikeout is the same as a ball-in-play out. However, in situations when the value of a strikeout is greater, Peavy throws more fastballs (61%) and fewer sliders (33%). Because he relies so heavily on two pitches, Peavy throws both of his slider and fastball more than average in each situation, but increasing the percent of fastballs when he needs a strikeout doesn't make sense, given his great slider (although it has worked for Peavy). Another idea to consider is that perhaps his fastball is actually his best strikeout pitch. Which pitch does he get the most swings and misses from? The table below shows the overall frequency that Peavy gets swings and misses from each of his pitches.
Pitch   N     Total     Freq.
SL      82    473       0.17
CB      3     30        0.10
FB      57    751       0.08
CH      4     79        0.05
For each pitch, Peavy generates more swings and misses than average, but it seems that his slider is being underutilized in big situations. There's undoubtedly a game theory element to his pitch selection in pressure spots, and perhaps his slider would lose some of it's effectiveness if he threw it more often, but it would appear that he's making his fastball less effective than it could be by throwing it so much in important situations.
Results-What happens when he throws it?
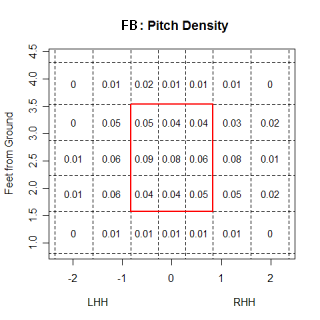
The final frontier when examining a pitcher is what actually happens once he throws a given pitch. The chart below shows where Peavy throws his fastball. Ideally, I would split this chart by batter type, and show where he throws all his pitches to LHH and RHH, as well as how they hit them. However, with so many splits you start running into sample size problems, and there just isn't enough PITCH f/x data to give this the treatment it deserves yet. One thing you can notice from this chart is that Peavy doesn’t throw his fastball low, but challenges hitters with it in the middle of the strikezone. This is counter to conventional wisdom, but again, Peavy has been effective with it.
The next best thing to showing how different hitters fared against different types of pitches is showing how hitters did overall against Peavy.
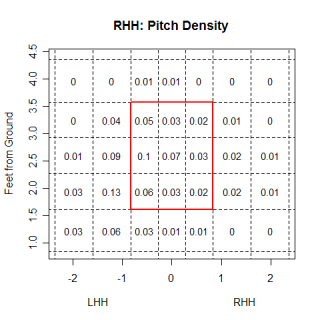
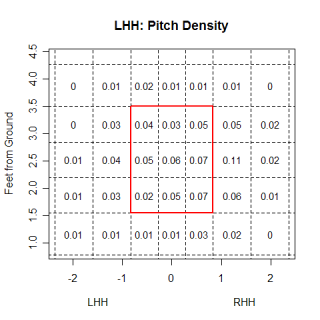
These charts show Peavy’s pattern of pitching to RHH and LHH. One quick thing you can see from the graph is that he works both groups of hitters outside more than inside, with the outer third of the strikezone and right off the plate being his primary targets. There seems to be a little bit evidence that Peavy pitches low in the strikezone, but he still throws a lot of pitches in the middle of the strikezone.
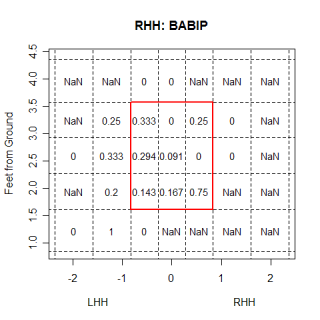
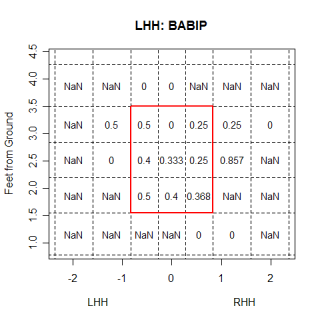
These BABIP graphs for LHH and RHH are probably not very accurate because of the small amount of ball-in-play data, but with a larger sample, they could be valuable for showing hot/cold zones.
Overall
Peavy’s fastball and slider are his two best pitches and he throws them the majority of the time. His slider has a couple different types of movement and could actually be two different pitches, although it looks more like the differences are variations of the same pitch. He also has a changeup and curveball that he throws much less frequently, and which aren’t as good. In pressure situations, it appears that he relies a little more on his fastball than normal, even though his slider creates more swings and misses. In the first inning he throws more fastballs than an average RHP, and throws a lot more fastballs than sliders, relative to how he pitches the rest of the game. He doesn't let the other team see all his pitches in the first inning and introduces his slider in the second inning, his changeup in the third inning and cuvrevball in the fifth inning.
*****************************************************************
I used Josh Kalk's player cards as a second opinion when analyzing pitches for Peavy and as I tried to improve my pitch clustering algorithm. If you've got an afternoon to kill, take a look through them...they're awesome. Josh has done some great work on standardizing the PITCH f/x data from different stadiums and different release points, so his data set is much bigger than mine right now (I'm only at the stage where I can look at pitches from 50 feet), and includes data for the entire season.
| Baseball Beat | September 27, 2007 |
The All-NincompoOPS Team
In the past, I have unveiled my All-OOPs (Overrated Offensive Players) team at the conclusion of the season. It was comprised of players who hit for a higher batting average than the league norm while putting up on-base percentages and slugging averages that were below the means. In other words, if you hit a lot of singles but had little or no power and rarely walked, you were a strong candidate to make the All-OOPs team. If nothing else, it was a fun exercise.
I have decided to retire my All-OOPs efforts in favor of the All-NincompoOPS team. Yes, that's nincompoops while capitalizing the last three letters to highlight the stat behind my latest creation. Nincompoops, in baseball terms, are nothing more than players with the lowest park-adjusted OPS (or OPS+). It's simple. It's straightforward. And, hey, it's kinda fun.
Let's take a look at the biggest nincompoOPS in 2007 (minimum of 300 plate appearances):
PLAYER            TEAM     POS      OPS+      PA        AVG      OBP      SLG      OPS
Adam Kennedy	STL	2B	50	306	.219	.282	.290	.572
Nick Punto	MIN	3B	52	524	.213	.293	.273	.566
Cesar Izturis	TOT	SS	58	325	.255	.301	.315	.616
Josh Barfield	CLE	2B	58	439	.243	.271	.323	.594
Omar Vizquel	SFG	SS	59	568	.243	.301	.308	.609
Gerald Laird	TEX	C	59	439	.223	.276	.340	.616
Tony Pena 	KCR	SS	61	523	.264	.282	.351	.633
John McDonald	TOR	SS	61	344	.254	.280	.339	.619
Ryan Freel        CIN	CF	64	304	.245	.308	.347	.655
Jason Kendall	TOT	C	64	502	.246	.304	.314	.618
Dave Ross         CIN	C	65	341	.205	.268	.404	.672
Bobby Crosby	OAK	SS	65	374	.226	.278	.341	.619
Brad Ausmus	HOU	C	66	392	.235	.317	.325	.642
Ray Durham	SFG	2B	66	519	.218	.297	.345	.642
Marcus Giles	SDP	2B	67	474	.230	.306	.318	.624
Craig Counsell	MIL	3B	67	330	.223	.327	.313	.640
Craig Biggio	HOU	2B	67	541	.250	.281	.378	.659
Emil Brown	KCR	LF	67	386	.259	.303	.349	.652
Michael Barrett	TOT	C	67	362	.242	.279	.372	.651
Craig Monroe	TOT	LF	68	421	.222	.269	.375	.644
Stephen Drew	ARI	SS	68	601	.230	.309	.360	.669
Jay Payton	BAL	LF	68	449	.251	.286	.352	.638
Dioner Navarro	TBD	C	68	418	.228	.287	.359	.646
Jerry Owens	CHW	CF	68	372	.265	.325	.313	.638
Nook Logan	WSN	CF	68	347	.261	.301	.342	.643
Darin Erstad	CHW	CF	69	337	.250	.308	.339	.647
Julio Lugo	BOS	SS	70	614	.240	.297	.355	.652
Wes Helms         PHI	3B	71	305	.249	.300	.372	.672
Felipe Lopez	WSN	SS	71	657	.242	.307	.346	.653
Scott Thorman	ATL	1B	71	300	.221	.261	.402	.663
Jose Lopez	SEA	2B	71	542	.254	.285	.349	.634
Chris Burke	HOU	2B	72	347	.234	.310	.362	.672
Miguel Olivo	FLA	C	73	464	.237	.261	.406	.667
Nelson Cruz	TEX	RF	73	320	.237	.292	.380	.672
Juan Uribe	CHW	SS	74	544	.230	.281	.394	.675
Rich Aurilia	SFG	1B	74	356	.254	.306	.370	.676
Brian Schneider	WSN	C	75	469	.237	.327	.339	.666
Ryan Theriot	CHC	SS	76	578	.273	.333	.356	.689
Ramon Vazquez	TEX	3B	76	337	.233	.305	.377	.682
Juan Pierre	LAD	CF	77	707	.294	.333	.354	.687
Yorvit Torrealba  COL	C	77	421	.259	.327	.376	.703
Rafael Furcal	LAD	SS	77	642	.270	.333	.355	.688
Johnny Estrada	MIL	C	79	464	.278	.296	.403	.699
Ronny Paulino	PIT	C	79	481	.258	.310	.387	.697
Much like Kurt Bevacqua, most of the players on the above list couldn't hit water if they fell out of a boat. If Tommy Lasorda were pitching, he would undoubtedly send these players a limousine to make sure they were in the lineup.
The Official 2007 All-NincompoOPS Team
 C: Gerald Laird
1B: Scott Thorman
2B: Adam Kennedy
SS: Cesar Izturis
3B: Nick Punto
LF: Emil Brown
CF: Ryan Freel
RF: Nelson Cruz
DH: Craig Monroe
Nice pickup by the Cardinals in getting Adam Kennedy. The good news is that he only had 306 plate appearances. Reminds me of the Will Rogers quote, "Just be thankful you're not getting all the government you're paying for."
Kennedy and Nick Punto are unto a club all by themselves. The All-.200s AVG, OBP, and SLG. It's one thing to hit in the .200s but a whole 'nother matter to post sub-.300 OBP and SLG. Josh Barfield joined his fellow infielders in the 6-and-under league for those with less than .600 OPS. There are 6-feet-and-under basketball leagues. Dead people have jokingly been referred to as 6-feet-and-under. Well, Kennedy's, Punto's, and Barfield's careers are all on life support. One more year like this one and their teams will be dialing 911, asking for the paramedics to come and take them away.
I hope none of you took Scott Thorman in your fantasy league. Heck, the guy didn't show anything as a rookie last year and has never been all that great even in the minors. He turned 25 before spring training camp opened, has below-average power for a first baseman, and would rather take the bus than walk.
What about those of you who got sucked into drafting Emil Brown, finally convinced after two decent years that he wasn't as bad as you once thought? Shame on you. Lesson #1 for wannabe GMs: Beware when a player puts up his first good year at the age of 30 (especially when he has a career line of .200/.289/.302 and spent the prior three seasons in the minors). Lesson #2: Don't forget lesson #1.
Moving along . . . Did you know that Bruce Bochy of the San Francisco Giants occasionally made out a starting lineup with all four of his infielders sporting an OPS+ of no better than 80? Yes, Rich Aurilia (74), Ray Durham (66), Omar Vizquel (59) – don't even try to suggest that this guy is a Hall of Famer – and Pedro Feliz (80) comprised the worst infield in baseball this year. What about Ryan Klesko, you ask? Puh-leeze. The 36-year-old "has been" put up an OPS+ of 92. But, boy, can he field and run! And I hear he's a heckuva presence in the clubhouse, too!
So as not to let the Giants have all the fun, let's take a look at the Dodgers. Rafael Furcal and Juan Pierre each produced an OPS+ of 77. Not to worry, Dodger fans. Furcal and Pierre hit 1-2 or 2-1 in the lineup all season and registered 1349 plate appearances between them or more than 22% of the team's total. Add Nomar Garciaparra (80) to the mix and the Dodgers spent about $30 million this year on three players who were dreadful. OK, make it $45 million. I mean, let's not forget Jason Schmidt here. Man, that Ned Colletti can sure pick 'em, huh?
What a bunch of nincompoOPS.
| Baseball Beat | September 25, 2007 |
Flyin' Under the Radar
While others are discussing the division and wild card races during the last week of the season, I thought it would be a welcomed relief to pay tribute to ten players who have been flyin' under the radar screen. None of these pitchers or hitters will receive a single vote for MVP or Cy Young honors, yet all of them have been among the most valuable players on their respective teams while earning at or near the minimum salary.
In alphabetical order, here are the Poor and Not So Famous . . .
Rafael Betancourt, RP, Cleveland Indians
W-L 5-1 | SV 2 | ERA 1.41 | WHIP .76
Age: 32
2007 Salary: $840,000
Acquired: Signed as a Free Agent in January 2003
Betancourt has been one of the most effective relief pitchers in the majors this season, leading all non-starters with 27 Runs Saved Against Average through games of Saturday. As the set-up man for the Cleveland Indians, the 6-foot-2, 200-pound righthander has allowed only 58 baserunners in 76.1 IP while recording (for what it's worth) 29 holds, good for second in the American League.
Throwing almost exclusively fastballs, Betancourt has struck out 75 (or nearly one per inning) and walked only 9 batters (for a K/BB of 8.33). Opponents are "hitting" .183 against him while putting up an OPS of .488. Originally signed by the Boston Red Sox as an amateur free agent in 1993, the fifth-year MLB veteran has inherited 33 baserunners and prevented all but three from scoring. He ranks second in the majors (behind J.J. Putz) in Win Expectation above Replacement (WXRL).
Manuel Corpas, RP, Colorado Rockies
W-L 4-2 | SV 16 | ERA 1.85 | WHIP 1.03
Age: 24
2007 Salary: $382,000
Acquired: Signed 1999 (undrafted free agent from Panama)
Corpas, who spent the entire 2005 season pitching for the Modesto Nuts in the California League (A+), has been nothing short of brilliant working out of the bullpen for the Rockies this season. The 6-foot-3, 170-pound righthander earned his first save on July 7 when he struck out the side to preserve a 6-3 victory over the Philadelphia Phillies. Promoted to the role of closer, Corpas has recorded 15 saves during the second half.
The fastball-slider pitcher throws strikes (2.34 BB/9) and induces about 2.5 groundballs for every flyball allowed. As reflected in his 1.64 ERA at home, his style suits Coors Field well. Corpas has been effective during the stretch run, allowing only one run over his last 12 appearances covering 13.2 innings and one earned run in his last 17 outings and 18.2 IP.
Jack Cust, DH, Oakland Athletics
AVG .261 | OBP .412 | SLG .520 | HR 26 | RBI 82
Age: 28
2007 Salary: $380,100
Acquired: From the San Diego Padres in May 2007
Cust is finally getting his first extensive action in the big leagues ten years after being drafted by the Arizona Diamondbacks with the 30th overall pick of the 1997 amateur draft. Prior to this season, Cust had played in a total of 70 games for Arizona, Colorado, Baltimore, and San Diego. The 6-foot-1, 231-pound lefthanded hitter has been everything his stathead fans have imagined, slugging 26 HR while posting an OBP over .400 and a SLG greater than .500. Over half of his plate appearances (486) have resulted in a walk (100) or strikeout (156). He ranks second in the majors (behind Reggie Willits) in the number of pitches per plate appearance (4.40).
Matt Diaz, LF, Atlanta Braves
AVG .338 | OBP .368 | SLG .504 | HR 12 | RBI 44
Age: 29
2007 Salary: $375,000
Acquired: From the Kansas City Royals in December 2005
Diaz can flat out hit. He is mashing lefthanders to the tune of .360/.385/.586. The one drawback is that the preponderance of Diaz's OBP is made up via his AVG as the aggressive hitter has drawn a base on balls only 4% of the time. A relative unknown, the former Florida State star is far from a one-year fluke as he has now hit .333 with 19 HR in 640 AB and 691 PA over the past two seasons. The 6-foot-1, 205-pound outfielder has cooled of late, going homerless since jacking two against Florida late last month.
Corey Hart, RF, Milwaukee Brewers
AVG .297 | OBP .355 | SLG .533 | HR 22 | RBI 76
Age: 25
2007 Salary: $395,000
Acquired: Drafted in the 11th round of the 2000 amateur draft
Although overshadowed by MVP candidate Prince Fielder and ROY favorite Ryan Braun, Hart is experiencing a breakout season hitting nearly .300 with 22 HR and 23 SB. Playing everyday for the first time in his career, the 6-foot-6, 214-pound outfielder is torching southpaws (.333/.423/.622). He has stepped up his production in September (.350/.402/.638) although it may not be good enough to put Milwaukee into the playoffs next week.
Carlos Marmol, RP, Chicago Cubs
W-L 5-1 | SV 1 | ERA 1.22 | WHIP 1.11
Age: 24
2007 Salary: Minimum
Acquired: Signed July 1999 (undrafted free agent from Dominican Republic)
Check out Marmol's ERA. Yes, that's not a typo. 1.22 it is. It's hard to believe that the second-year righthander spent the first month-and-a-half in the minors. Formerly a starting pitcher, Marmol has pitched exclusively in relief this season. He started strong, working 10 games before allowing his first run. And he is finishing even stronger, hurling 18 consecutive outings covering 22.1 IP without surrendering a run.
The 6-foot-2, 180-pound righthander has struck out 94 batters in only 66.2 IP. His control is still problematic, providing 35 free passes or more than one every two innings. HIs ERA has never reached 2.00 this season and he has pitched well at home (1.53 ERA with a .172 BAA) and on the road (0.86 ERA, .162 BAA). Look for Marmol to play an important role for the Cubs in the postseason.
Peter Moylan, RP, Atlanta Braves
W-L 5-3 | SV 1 | ERA 1.85 | WHIP 1.06
Age: 28
2007 Salary: Minimum
Acquired: Signed as a Free Agent in March 2006
Moylan has been a workhorse for Bobby Cox this season. The 6-foot-2, 200-pound righthander has been asked to pitch 76 games and 87.2 innings. He has put up stellar numbers although his relatively low strikeout rate (6.26 per 9 IP) for a reliever is cause for concern on a go forward basis. Born in Attadale, Australia, Moylan was originally signed by the Minnesota Twins as an amateur free agent in March 1996. He only lasted two years before deciding to return home as a pharmaceutical salesman.
The bespectacled Moylan continued pitching, dropping down to a sidearm motion while adding nearly 10 miles per hour to his fastball. He was a surprise pick for the Australian World Baseball Classic squad and opened eyes when whiffing four Venezuelans, including Bobby Abreu, Marco Scutaro, Ramon Hernandez, and Magglio Ordonez in his only WBC outing. Moylan was subsequently invited by Atlanta to spring training camp prior to the 2006 season and made his debut in the majors last summer.
Cody Ross, CF, Florida Marlins
AVG .335 | OBP .409 | SLG .659 | HR 12 | RBI 35
Age: 26
2007 Salary: $380,000
Acquired: Purchased from the Cincinnati Reds in May 2006
Ross spent part of the 2007 season on the 60-day DL, missing most of May, all of June, and part of July. With increased playing time, Ross has been a monster in September, hitting .389/.411/.796 with 7 2B and 5 HR in 54 AB. For the season, the 5-foot-9, 203-pound sparkplug has slugged 17 2B and 12 HR with an OPS of 1.065. The jury is out, but the center fielder, who bats right and throws left, may finally be finding a home in Florida after various stints with the Tigers, Dodgers, and Reds.
Matt Stairs, LF, Toronto Blue Jays
AVG .292 | OBP .370 | SLG .553 | HR 20 | RBI 61
Age: 39
2007 Salary: $850,000
Acquired: Signed as a Free Agent in December 2006
Stairs is not unknown, having played 1537 games since breaking into the big leagues with Montreal in 1992. But he is a bargain, putting up a .923 OPS for a rather meager salary of $850,000. Stairs has ripped 27 doubles and 20 homers in 342 at-bats this season. To my surprise, he has slugged at least 13 HR for 11 straight seasons and now has 240 over the course of his career.
Jayson Werth, RF, Philadelphia Phillies
AVG .303 | OBP .410 | SLG .455 | HR 7 | RBI 48
Age: 28
2007 Salary: $850,000
Acquired: Signed as a Free Agent in December 2006
Werth is posting career highs in AVG, OBP, and OPS while playing part-time for the Phillies. After missing all of July with a sprained left wrist, Werth was put into the starting lineup upon his return and he responded with a .414/.500/.609 line in August. The 6-foot-4, 210-pounder's performance has slowed considerably in September, and it remains to be seen what the future holds for the former first round draft pick and stepson of Dennis Werth, grandson of Dick Schofield, and nephew of Dick Schofield.
Honorable Mentions: Heath Bell (SD), Brandon Lyon (ARI), Hideki Okajima (BOS), Tony Pena (ARI), and Joakim Soria (KC).
| Command Post | September 21, 2007 |
"Breaking" Away
When the PITCHf/x system debuted last year, the first thing I wanted to know (besides how hard Joel Zumaya actually threw) was exactly how different pitches moved. This was a basic question, and from watching baseball on television and playing it, I had a pretty good idea of how different pitches moved, but my knowledge lacked precision. I know a curveball from a left-handed pitcher breaks down-and-away from a left-handed hitter, but how much does it move? Where do you start measuring,? Where do you finish? How do you separate the downward movement from the away movement? Should you? That curveball ends up low and away, but would you say it broke 5 inches, down-and-away, or 3 inches down and 4 inches away? Which is "better"? Break is a tricky thing to define, let alone measure.
The first attempt to quantify break using PITCHf/x debuted during the 2006 playoffs and compared the actual pitch to a pitch thrown without spin. The system would capture the flight path of a pitch, then create a hypothetical pitch that was thrown with the same initial velocity and release point, but with only gravity and drag acting on it. The difference between where this pitch would have ended up and where the actual pitch ended up was given as the "pfx" of the pitch. There are a couple problems with this definition, the biggest being that nobody knows what a pitch without spin looks like. That isn't to say that it's path can't be calculated, but rather, that nobody has ever seen one, so people don't have a frame of reference for what the values mean. But it was a start. If you went into the XML files, there were two pfx values, one for the x direction and one for the z direction. Graphing these values, either alone or vs. the speed of the pitch remains an excellent method for identifying different pitches. Even if it's unclear how a pitch that ends up 10 inches higher than a non-spinning pitch would have actually moves, other pitches of this type will also have pfx_z's around 10 inches.
The next try at quantifying break arrived this season and is more in line with how people imagine break. This version of break is defined as the greatest distance between the path of the pitch and the straight line path from the release point to home. A 12-to-6 curve will have a large value, while a regular fastball will have a small one. It's confusing to think about this definition, so if you're having trouble understanding it, imagine holding a bow from one of the ends with the other end held away (and slightly down) from you. The end you're holding is the release point, the other end is where the ball crossed home, the string is the straight line path, while the ball would travel along the bow itself. If you rotate the bow around the string at given angle, you get the actual path of the pitch and break as given by PITCHf/x. (Thanks to John Walsh for the bow analogy).
This break value becomes even more valuable (at least to me) when you break it up into x and z components and Dr. Alan Nathan's website has some (more) helpful equations that allow you to calculate break-z and break-x values. To visualize break-z, imagine keeping the endpoints constant and rotating the bow around the string until the bow was above the string and perpendicular to the ground. Break-x is the same thing but the bow is parallel to the ground (don't worry if the bow is to the left or right of the string just yet). The break values are vary similar to the pfx values, except they are in reference to an imaginary straight line, something that is easy to visualize. If the break-z value is 17 inches for a Barry Zito curve, that means it really breaks 17 inches from it's "high point" to where it crosses home. If Mariano Rivera's cutter has a break-x value of -1.3 inches, that means it moves 1.3 inches in on a lefty between it's maximum horizontal deviation and end point . This makes a ton of sense and is much closer to how break is thought of.
Once you understand and are comfortable with the break values, they act pretty much the same as the pfx values, with the benefit of meaning something. Comparing the two Barry Zito graphs below show some of the similarities. The new definition of break in graphed on the left, while the no-spin version is graphed on the right. One thing to note is that because of a convention change, positive break x values (left hand graph) are negative pfx_x values (right hand graph), but the basic pattern of pitches is the same in both cases.
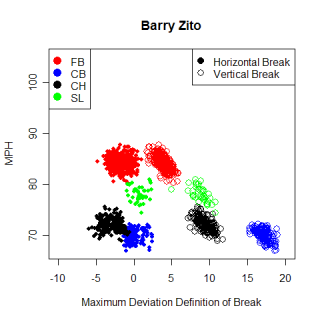
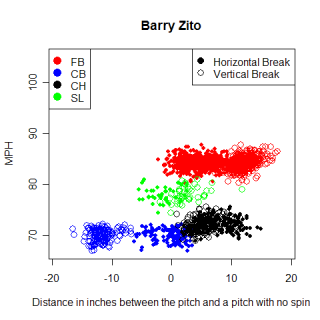
Negative break-x values mean movement away from a RHB, and you can see that Zito's pitches typically move away from a RHB. This type of horizontal movement (toward the arm-side) is what you would expect for a fastball and change-up from any pitcher. Zito's curveball breaks slightly away LHB, which is how curveballs from LHP are "supposed" to break, but the magnitude of Zito's horizontal break is less than normal. The table below shows other similar curveballs from LHP, sorted by their vertical break.
Name          Count    BreakX    BreakZ   MPH
Barry Zito    142      0.15"     17.18"   70.1
Doug Davis    165      2.31"     16.83"   68.0
Ted Lilly     157      1.73"     15.62"   70.8
Sean Marshall 62       2.24"     15.47"   73.2
Rich Hill     202      3.10"     14.93"   73.2
Lenny DiNardo 95       0.78"     14.68"   69.9
Zito's curveball actually has the biggest vertical drop of any pitch thrown this year, and comparing it to the other pitches in the chart, you see that the horizontal break is much lower. Zito has historically fared better when throwing to RHB than LHB (669/730 career OPS ) so maybe his unique curveball is the reason why. It's reasonable to think that because the curveball doesn't move away from LHB as much as normal, they would have an easier time hitting it. The only pitcher with a similar curveball is DiNardo and he too shows a reverse split (792 OPS career vs. RHB/814 OPS vs. LHP). Joe Saunders' curve is the next most similar to DiNardo's, although it has less vertical break and an almost normal horizontal break, but he doesn't have a reverse split. However, once you get past Saunders, no other curveballs have a horizontal break close to Zito or DiNardo's.
On The Book's blog this week, there was a discussion about comparing Mariano Rivera's cutter to other pitches and seeing if pitchers that threw those pitches had a reverse split like Rivera. The only problem with doing this for Rivera is you have a better chance of seeing Bigfoot as finding a pitch similar to his cutter. First of all, the horizontal movement on the pitch is totally unique. No other fastball (from either a lefty or righty) breaks as much to the pitcher's glove side as Rivera's does. The amount of movement he gets is consistent with a slider, but the cutter is thrown faster than an average fastball. A final difference is that it also breaks less vertically than a slider does. The table below shows some of the comparable pitches to Rivera's cutter, based on horizontal movement.
Name            Pitch    BreakX   BreakZ  MPH
Tim Hudson      Cutter  -0.66"    6.67    87.0
Miguel Batista  Cutter  -0.71"    5.27    89.6
Gil Meche       Slider  -0.97"    5.87    87.1
Mariano Rivera  Cutter  -1.30"    4.11    93.0
Buddy Carlyle   Slider  -1.44"    5.41    87.3
John Smoltz     Slider  -1.56"    6.31    87.2
Dustin McGowan  Slider  -1.66"    7.88    87.4
None of these pitches match Rivera's cutter very well and Meche is the only one of these pitchers to have a reverse split for his career. One idea I had as I was looking at Zito and Rivera is that uniqueness in horizontal movement might cause reverse splits. Rivera throws a fastball that breaks horizontally like nobody else's in baseball. Zito's curve is unique not due to it's vertical break (although it is large), but it's lack of horizontal break.
I had two topics I wanted to cover this week and while the second one is important to me, it's probably a little less interesting for other people, but I'm using a new algorithm to categorize pitches. It works better than applying a set of logical rules to each pitch and takes less time to run too.
As far as the nuts and bolts of the system, for each pitcher, the algorithm calculates the distance between each pitch using the their break and velocity. Once it has the distances between each pitch, it combines the two pitches that are closest together, recalculates the distances between that new cluster and the remaining pitches, and combines the next two objects that are closest together. It repeats this process until it reaches a certain level of difference between groups. Once the algorithm has run for an individual pitcher, all of their pitches are assigned to a certain group, and using some of the logical statements from my original filter, as well as other patterns regarding the speed and break of different types of pitches, I can label each group (and all it's members) as a specific pitch type.
Labeling pitches by group membership is better than applying a set of static rules to every individual pitch in the database because it allows me to compare different pitches to the rest of that pitcher's repertoire and not worry about how it compares to a global rule. One problem with my old filter was that I had to find a way to get Jamie Moyer and Josh Beckett's fastballs to both be recognized as fastballs, which wasn't easy given the differences in speed. With the new method, the fastest group for each pitcher is automatically labeled as a fastball...no fuss, no muss. This new algorithm is also more successful at identifying individual pitches at the edges of clusters. These pitches clearly belong with the rest of the cluster, but with the old system, these pitches would occasionally not match the logical rules used for classification and be labeled as unknown pitches.
While some of the kinks are still being worked out of this classification system, I can still generate a list of fastballs (for pitchers who have thrown at least 500 total pitches) and see which ones have the greatest vertical break.
Name            N       BreakX   BreakZ  MPH
Sean Green      300     3.64"    8.49"   89.8
Jesse Litsch    290    -0.59"    7.23"   84.8
Brandon Webb    637     3.71"    7.06"   89.0
Kameron Loe     428     3.14"    6.37"   88.6
Greg Maddux     555     3.56"    6.36"   86.3
Derek Lowe      670     3.93"    6.32"   90.3
Jake Westbrook  462     3.50"    6.28"   90.8
Justin Germano  466     3.38"    5.79"   86.9
Roy Halladay    268     3.51"    5.60"   93.9
Jamey Wright    320     3.02"    5.59"   89.1
Look familiar? Instead of saying Webb's sinker ends up 3 inches higher than a non-spinning pitch, while a 4-seam fastball ends up 6 inches higher (or whatever the numbers were), now you can say that Webb's sinker has a 7 inch downward break.
| Baseball Beat | September 20, 2007 |
...And Down the Stretch They Come!
The famous horse racing call is an appropriate description as Major League Baseball winds down its six-month regular season with four division titles and two wild cards still to be determined. The postseason horses are on the board in the American League but there is a stakes race in the East in which the betting public anxiously awaits the finish while holding onto their exacta tickets.
In the meantime, the tote board is working overtime in the National League as all three claiming races and the wild card are up for grabs. The Mets, Cubs, and Diamondbacks are in front by a length or two but the Phillies, Brewers, and Padres are going to the whip as they try to overtake the lead pony in each of their respective divisions.
AMERICAN LEAGUE EAST
TEAM           W    L    PCT  GB    Comments
Red Sox       90   63  .588   -     Lug
Yankees       88   64  .579   1.5   In the Money
Blue Jays     77   75  .507  12.5   Show
Orioles       64   87  .424  25     Checked
Devil Rays    63   90  .412  27     Untried
Red Sox-Yankees. Yankees-Red Sox. Does it really matter? You bet it does. These rivals are playing for first place, possible home-field advantage, and pride. It looked like Boston in a breeze at the clubhouse turn but a sweep at the hands of Toronto has turned this race into what could amount to a photo finish.
AMERICAN LEAGUE CENTRAL
TEAM           W    L   PCT   GB    Comments
Indians       90   62  .592   -     Handily
Tigers        83   70  .542   7.5   Hung
Twins         75   77  .493  15     Evenly
White Sox     66   86  .434  24     Washy
Royals        65   86  .430  24.5   Scratch
For those of you with blinkers on, the Indians and Angels now possess the best record in the majors. Cleveland effectively put away Detroit during a three-game sweep with C.C. Sabathia, Fausto Carmona, and the bullpen leading the way. With three games in Kansas City on the final weekend, the Tribe may take the opportunity to position its rotation for the ALDS against either the Red Sox or Yankees.
AMERICAN LEAGUE WEST
TEAM           W    L   PCT   GB    Comments
Angels        90   62  .592   -     Lock
Mariners      81   70  .536   8.5   Faltered
A's           74   80  .481  17     Eased
Rangers       70   82  .461  20     Under Wraps
The Angels were tested by the Mariners last month but met the challenge head on with a sweep in Seattle. The placing judges have been reassigned to the AL East as the Halos gallop to the finish line.
NATIONAL LEAGUE EAST
TEAM           W    L   PCT   GB    Comments
Mets          84   67  .556   -     Prep
Phillies      82   70  .539   2.5   Closer
Braves        79   73  .520   5.5   In Hand
Nationals     68   84  .447  16.5   All Out
Marlins       65   87  .428  19.5   Distanced
With 10 of its last 11 games against Washington and Florida (and the other a make-up game at home vs. the Cardinals, who most likely will mail it in), the Mets can thank the stewards for what should be a hand ride over the next one-and-a-half weeks. The Phillies (Fillies?) have a favorable schedule as well, facing the Nationals in seven of their final 10 contests.
NATIONAL LEAGUE CENTRAL
TEAM           W    L   PCT   GB    Comments
Cubs          80   73  .523   -     Blanket Finish
Brewers       78   73  .517   1     Extended
Cardinals     71   80  .470   8     False Favorite
Reds          69   83  .454  10.5   Also Ran
Pirates       66   86  .434  13.5   Steadied
Astros        66   86  .434  13.5   Breakdown
Consider Chicago as the favorite to take the NL Central. The Cubs will not play a playoff-bound team the rest of the regular season while the Brewers will be jockeying for position against the Braves and Padres with the latter running as hard as possible in search of their own postseason berths.
NATIONAL LEAGUE WEST
TEAM           W    L   PCT   GB    Comments
Diamondbacks  86   67  .562   -     Overlay
Padres        84   67  .556    1    Stretch Runner
Rockies       80   72  .526   5.5   Solid Horse
Dodgers       79   73  .520   6.5   Winded
Giants        67   85  .441  18.5   Taken Up
Only the Giants have been mathematically eliminated but the NL West is really a two-horse race between the Diamondbacks and Padres. Both teams are odds-on choices of making the playoffs, either as the division champ or the wild card representative. With six games remaining against Arizona and San Diego, Colorado is still in control of its own destiny and can't be ruled out quite yet.
AMERICAN LEAGUE WILD CARD
TEAM           W    L    PCT  GB    Comments
Yankees       88   64  .579   -     Romp
Tigers        83   70  .542   5.5   Bobble
Mariners      81   70  .536   6.5   Pocket
Either the Yankees or Red Sox will *win* the wild card in the American League. Think of it as a consolation prize for not winning the AL East. And let's not kid ourselves here that it will be anything more than that. Sure, Boston won the World Series as a wild card in 2004 but capturing a title for the first time since 1995 would be the next best thing for the perennial runners-up in the AL East.
NATIONAL LEAGUE WILD CARD
TEAM           W    L    PCT  GB    Comments
Padres        84   67  .556   -     Front Runner
Phillies      82   70  .539   2.5   Place
Rockies       80   72  .526   4.5   Maiden
Dodgers       79   73  .520   5.5   Lunge
Braves        79   73  .520   5.5   Driving
If the Padres don't win the NL West, look for them to take the allowance race. San Diego has won six in a row and has a three-game edge over the Phillies. The Rockies, in order to have a realistic shot at the wild card, will need to sweep the Friars when these two division rivals face each other this weekend. The Dodgers and Braves are all but out of it at this point.
How would you handicap the AL East, NL East, NL Central, NL West, and NL Wild Card? Let's see who can be the best tout.
| Change-Up | September 19, 2007 |
Joe Pepitone & Terry Francona
So there are two baseball-related items on my mind this morning. Coming off of Sunday night's tour-de-force Curb Your Enthusiasm episode in which Larry David's Joe Pepitone game jersey is lost at the dry cleaners and then, um, recovered (read: stolen back) by his houseguest Leon Black, I just had to figure out "why Joe Pepitone?"
Also, Terry Francona absolutely gave the Toronto Blue Jays a win last night. I need to get a few things off my chest on that front.
First Pepitone, however. For starters, like David, Pepitone was born in Brooklyn. He was a New Yorker through and through and when he was signed at the age of 18 by the Yanks in 1958, there was great anticipation in and around New York for his arrival with the Big Club. It came in 1962, but with Mickey Mantle in center field and Moose Skowron manning first base, he was relegated to spot duties and struggled, posting a .239/.255/.442 line.
Still, with his pop and smooth glove the Yanks felt Pepitone was ready for fulltime duties in 1963. They traded Skowron to make room for him, and "Pepi" became the everyday first baseman. With the ability to play both first and center and nice pop, when I read about him I couldn't help but think of Darrin Erstad. Early in his career, Erstad was the better player because he could get on base with regularity. Now, however, Erstad can neither get on base nor hit with any pop, so Pepitone is the better player. Average them out and they net out similarly, although Pepitone gets the slight edge at the plate.
          AVG   OBP   SLG   OPS+
Pepitone .258  .301  .432   105
Erstad   .284  .339  .411   95
Anyway, Pepitone had a pretty nice career and was known for his fiery play on the field and local popularity. Given this it is no surprise that David, who does little to hide his Yankee loyalties on Curb Your Enthusiasm and famously was the voice of George Steinbrenner on Seinfeld, would have incorporated his affinity for Joe Pepitone into an episode.
*********************
Having gotten seven strong innings out of young lefty Jon Lester and clinging to a 2-1 lead last night in Toronto, Terry Francona had a number of options available to him. He chose Eric Gagne, who had pitched well in consecutive outings over the weekend against the Yankees. Take in the following:
* Gagne has a 9.00 ERA as a Red Sox
* Neither Hideki Okajima nor Jonathan Papelbon had appeared in a game since 9/14.
* Manny Delcarmen (2.37 ERA) threw three pitches in the seventh inning.
* After getting the first two outs, Gagne surrendered a walk, a base hit and another walk to load the bases. The tying run was at third, the go-ahead run on second.
I don't need to tell you how this ended, but Gagne remained on the hill, walked a run, and surrendered a two-run double to Russ Adams. The Red Sox lost 4-3.
Terry Francona is an awful bullpen manager, and very well may cost the Red Sox in the post-season.
| Baseball Beat | September 18, 2007 |
When Last Place Meets First
I went to the Tampa Bay Devil Rays @ Los Angeles Angels game last night and was fortunate to sit in the first row behind the home team's dugout. The tickets fell into my lap a few hours before game time. I hightailed it out to the ballpark with a friend and met my older brother and his wife underneath the big Angels' helmet in front of the stadium about 15 minutes before the opening pitch.
The Edwin Jackson-Kelvim Escobar matchup looked like one that would favor the Halos. However, Escobar has been struggling all month and, true to recent form, gave up runs in the first, second, and third innings and was pulled in the fifth inning with the bases loaded and no outs. The big righthander's ERA has leapt from a league-leading 2.68 after beating Toronto on August 16 to 3.46 (9th in the AL). He has gone from a legitimate candidate for the Cy Young Award to a question mark as the Angels ready themselves for the postseason.
Jackson, for his part, allowed 14 (yes, FOURTEEN) hits over 4 2/3 innings. He gave up seven runs (only four earned) and took his 15th loss of the season. The 24-year-old righthander was obviously frustrated in the second inning over a fielding mishap by second baseman Brendan Harris and a close call at first base that went against TB that led to the Angels scoring three runs and overcoming a 2-0 deficit. Jackson could be seen kicking the rubber and shaking his head repeatedly, giving off body language that suggested he was feeling sorry for himself.
For as much talent as Jackson possesses, he is far from a finished product. The one-time highly-prized prospect's fastball was sitting at 92-94 all game and he touched 98 (according to the radar gun at the stadium). Although Jackson ranks fourth in the AL in walks, he was throwing strikes – perhaps too many – and inducing more grounders than flyballs. To the extent that the fireballer had good control, he didn't necessarily have good command. It was a classic example of throwing strikes but not locating one's pitches.
Aside from a lack of command, the rap against Jackson has always been that he lacked quality secondary pitches. Last night, it once again appeared that his breaking ball was far from sharp. He may be better served as a setup man who can come in and throw mid- to high-90s heat for an inning or two without facing anyone more than once. Like so many youngsters, Jackson is one offering and another year or two of experience away from being a stud. But those shortcomings loom large and illustrate the difference between a top-of-the-rotation and a back-of-the-bullpen pitcher.
Bruce Froemming worked the plate. The longest tenured umpire in the history of Major League Baseball in terms of the number of seasons umpired will turn 68 in 10 days. Froemming has umpired over 5000 games and will end his 37-year career when he retires after the season second on the all-time list (behind Hall of Famer Bill Klem). Short and overweight, Froemming positions himself a full step behind the catcher and as far back as any home plate umpire I've ever witnessed. He barely bends at the knees and can't have much of a view back there.
Froemming ejected Joe Maddon in the top of the seventh inning when the Tampa Bay manager moved to the other end of the dugout to give first base ump Mark Wegner an earful after the latter ruled that Jonny Gomes had gone around on a checked swing for strike three. Froemming, who is also the crew chief, took a few steps toward the dugout and waved his right hand as only an umpire can do. Maddon, who had argued vehemently with Wegner in the second inning, raced out onto the field and appeared to be telling the home plate ump to butt out. Froemming, red in the face and perhaps growing tired of a game that took almost four hours to complete, had the final word and Maddon walked away and exited the game for the third time against his former team.
Speaking of manager-umpire clashes, Mike Scioscia climbed up to the top step of the dugout in the fifth inning and yelled at Mike Winters, who thought he had the night off working third base. Scioscia was upset that Jackson wasn't coming to a full stop and wanted Winters to call a balk on the pitcher. Pitching coach Mike Butcher and Scioscia both baited Froemming out to the mound at different times and had words with him as they walked off the field.
It was a long and frustrating night for both the umpires and the Devil Rays, who now possess the worst record in the majors. Tampa Bay fans can be comforted in knowing that the team is likely to add another top prospect next June to go along with former No. 1s Delmon Young and David Price, No. 2 B.J. Upton, and No. 3 Evan Longoria, who could find himself manning the hot corner sometime next season.
Upton showed his athleticism and inexperience on three plays, stealing home in the third inning and overthrowing the plate and third base in separate innings. His latter throw skimmed off the top of dugout and zoomed past my brother and off the shoulder of an elderly woman seated in the third row. Unlike Jackson and Maddon, she stayed in the game, taking one for the team as her hometown Angels outlasted the Devil Rays 10-7.
| Baseball Beat | September 15, 2007 |
Overs and Unders Revisited
Back in April, I posted a Baker's Dozen of over/under lines for player and team events. Even though there are still two weeks to play, the envelopes are all in and the answers can now be revealed. Reader predictions can be found in the comments section of the original article.
Here goes...
Over. Alex Rodriguez slugged his 50th and 51st HR on September 8 vs. the Kansas City Royals. He also hit one the next day and now has 52 on the season. I guess today's question is whether he will finish the year with a hot streak and reach the magical 60 mark. The odds say no. Perhaps it is more realistic to ask if A-Rod can break his single-season high of 57 four baggers back in 2002?
Under. Josh Hamilton recently suffered a strained right hamstring and will not accompany the Reds on the final road trip of the season. The rookie hit 19 HR in 298 AB over 90 games. A pretty remarkable achievement for the Rule 5 draft pick. He mashed RHP to the tune of .314/.391/.637 with 18 of his 19 HR. Impressively, Hamilton only struck out 36 times in 226 AB vs. righties. In order to become more than a platoon player, the former #1 overall pick in the draft will need to hit southpaws better than he did this year when the now 26-year-old put up a line of .222/.296/.292 with 1 HR and 29 SO in 79 AB.
Under (but only by a week). Barry Bonds hit the 756th HR of his career on August 7 vs. Washington. You can buy that ball at auction today for what is being described as a discount price.
Today's questions: Will Bonds reach 800? Either way, will A-Rod eventually pass him?
Under. Sammy Sosa became the fifth player to blast 600 home runs on June 20 against, ironically, his old team, the Chicago Cubs. Sosa hit the first HR of his career vs. Roger Clemens at Fenway Park in 1989 as a member of the Texas Rangers.
Will Sosa, who now has 608 homers, hit his first and last dinger with the Rangers – or will he find a new employer next season and add to his career total?
Over. Tom Glavine won the 300th game of his career on August 5, becoming the 23rd pitcher – and only the fifth lefthander – to accomplish that feat.
There has been a lot of discussion about whether anyone else will ever reach that plateau. Randy Johnson has the most wins among active pitchers with 284. He is 44 years old and will be coming off back surgery next season. If The Big Unit doesn't do it, I don't think anybody is going to get there for a long, long time.
Here is a list of the top 20 active pitchers (and their ages) in career wins:
Roger Clemens (44)      354
Greg Maddux (41)        345
Tom Glavine (41)        303
Randy Johnson (43)      284
Mike Mussina (38)       248
David Wells (44)        238
Jamie Moyer (44)        229
Curt Schilling (40)     215
Kenny Rogers (42)       210
Pedro Martinez (35)     208
John Smoltz (40)        206
Andy Pettitte (35)      199
Tim Wakefield (40)      167
Aaron Sele (37)         148
Bartolo Colon (34)      146
Steve Trachsel (36)     141
Tim Hudson (31)         134
Tom Gordon (39)         133
Livan Hernandez (32)    133
Kevin Millwood (32)     132
Take, for example, Tim Hudson, the youngest pitcher on that list. He would have to win 166 more games. At 15 per season (the number he has averaged over the course of his first nine campaigns), that means Hudson would need to win one more game in 2007 and pitch for 11 more years after that. It's certainly possible. Roger Clemens has won 191 games since the conclusion of his 31-year-old season. Greg Maddux has won 161 and Glavine has picked up 150 victories from age 32 on.
Roy Oswalt (112), Barry Zito (111), Mark Buehrle (106), and Mark Mulder (103) are the only pitchers under the age of 30 with 100 or more wins. Someone like C.C. Sabathia (98) or Johan Santana (93) might give 300 a run but both need to worry about getting to 100 and 200 first. If Randy doesn't win 300, there is a good chance that it will be at least 11 more years before anyone is even remotely close to that hallowed mark – with the distinct possibility that the next one to 300 isn't even in the big leagues now.
Over. Charlie Manuel not only survived Memorial Day but he looks as if he will be back next season. I've even heard analysts on BBTN tout him as a possible Manager of the Year. The Phillies may not have much of a shot at winning the NL East but remain in the thick of things when it comes to the Wild Card.
Over. Felix Hernandez's next start turned out to be May 15. The peripherals are all there but King Felix hasn't quite pitched up to expectations to this point. Count me as someone who would not have guessed that he would have allowed 190 hits in 169.2 IP this season. But, hey, the guy is only 21. He's got plenty of time to figure things out.
Under. Clemens, who began this season sooner than last, beat the Pittsburgh Pirates (nice choice for a debut) 9-3 on June 9. The Rocket threw 108 pitches in that game and has only exceeded that total twice in his subsequent 15 starts (one of which was his next outing). Clemens hasn't thrown more than six innings since July 28 when he unleashed a season-high 114 pitches in a 7-5 loss to the Baltimore Orioles. He is scheduled to start on Sunday night against the Boston Red Sox. If his elbow fails him in that game, it's possible that we could witness the last start of his storied career tomorrow night. Let's hope not.
Under. The San Francisco Giants brought up their top pitching prospect and allowed him to make his MLB debut on May 6 against the Philadelphia Phillies on ESPN's Sunday Night Baseball Game. Cole Hamels got the better of Tim Lincecum, who allowed five hits, five walks, and five runs (four earned) in 4 1/3 innings while striking out five. The hard-throwing 22-year-old and fives were both wild that night. The 10th overall pick in 2006 was the fourth player from his draft class to reach the majors, joining fellow pitchers Andrew Miller, Joe Smith, and Brandon Morrow.
Under. Way under. Phil Hughes made his MLB debut a week after that over/under was posted. The prized pitching prospect lost to A.J. Burnett and the Toronto Blue Jays, 6-0. However, the then 20-year-old bounced back and no-hit the Texas Rangers for 6.1 innings before leaving the game with a severe hamstring injury that shelved him for three months. The righthander has taken a regular turn in the rotation the past month but has not exhibited his pre-injury stuff according to ESPN's Keith Law, who sat behind home plate at one of his recent outings.
Under. But just barely. Max Scherzer signed with the Arizona Diamondbacks within 24 hours of the deadline. The first-round pick in 2006 dominated High-A California League opponents (2-0, 0.53 ERA with a pitching line that reads 17-5-1-1-0-2-30) but struggled a bit when promoted to Double-A Mobile of the Southern League (4-4, 3.91 with a 1.41 WHIP and a K/BB ratio below 2.0).
Under. The season, of course, isn't over but Joe Mauer could go 30-for-50 in the team's final 15 games and not reach the .333 mark. The line seems far fetched now but the 2006 AL batting champ was hitting .364 back then after posting a .347 mark the previous season. Most disturbing is the fact that he hasn't gone yard since July 21, a homerless streak that has now reached 122 AB. As Rob Neyer pointed out, "The Twins have four players -- four! -- with more than five home runs this season."
That's just not a championship quality attack, and there's no help on the way from the minors. The Twins are going to have to buy hitting or trade for it. Or both. They can trade Santana for hitting and use the money they're not paying him on hitting.
It would be unfair to say that Terry Ryan resigned because of the Twins' near-term prospects but suffice it to say that new GM Bill Smith has his work cut out to make Minnesota a contender again. With so little power on the horizon, one has to truly wonder why the Twins drafted Ben Revere with its first pick this year as I have on more than one occasion. Incredulous.
Under. Not even close. I underestimated Washington by a wide margin. The Nats could lose the rest of their games this year and still not reach 100 losses. Silly me. I thought Washington was a lock to lose 100 and would not have been surprised had they lost two out of three. The Nationals are one game ahead of the Florida Marlins in the NL East and six clubs in the majors have worse records. Manager Manny Acta has his team not only exceeding expectations but playing .500 ball at home. Kudos to Acta, GM Jim Bowden, and all the players for making me look bad.
| Command Post | September 13, 2007 |
The Other Side of the Pitch
The majority of analysis performed on the PITCH f/x data has been from the perspective of the pitcher. This makes sense, as it is really interesting to see how a certain pitch from a specific pitcher moves and how it is put into play. It's much easier to classify pitches from the pitcher's perspective, and there are a host of other "pitcher" things to look at. However, there is another half of the data that hasn't been covered as in depth. Looking at the PITCH f/x data from the hitter's perspective could yield some interesting nuggets of info, so today I'm branching out, spreading my wings, and looking at the hitter's version of the data.
The easiest visual to create for a hitter is a chart showing how pitchers have approached him this season. Below on the left is a chart showing where Vladimir Guerrero has been pitched to this season. The number in each box is the percent of all pitches thrown that went to that area and while it seems that pitchers might be trying to avoid throwing high pitches to Vlad, overall there isn't too much going on here. On the right is a chart that shows Guerrero's BABIP for different regions. This is a much more interesting chart and is closely related to the results on the density chart. There's a very good reason that pitchers would avoid the top third of the strike-zone with Vlad...when he puts those balls in play, he hits .565! Before we call Guinness though, it's worth noting that hitting .565 in this case means going 13-for-23. Because of the sample size issue, reading too much into Vlad's hot zones is misleading, but there are some basic patterns, such as hitting high pitches well and what appears to be a weak area, located down and away from Guerrero.
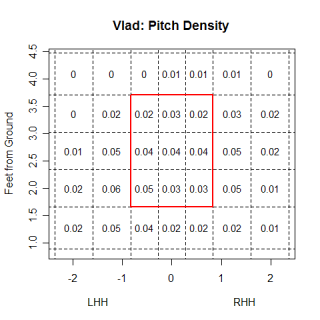
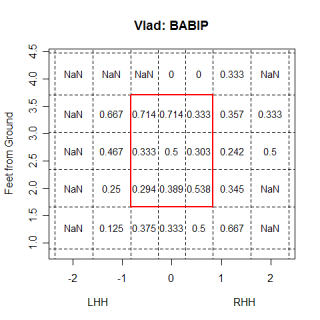
I think these types of charts are fascinating and give you a good idea of a hitter's swing. You can easily pick out where batters feast on pitches and where they struggle. With a bigger sample than what I have right now, you could even have some confidence in your conclusions about those zones. Speaking of bigger samples, here is a chart that shows the BABIP for all RHB this season. Now instead of having 10 balls in play for a box, there are 10,000, which lets you say that low and away pitches appear to give most RHB trouble, not just Guerrero. Below on the right is a BABIP chart for Jason Kendall. Kendall has been anemic at the plate this season, and you can see exactly why when you look at the chart. Inside pitches give him problems, he hasn't done much better on outside pitches, and high pitches, well, he hasn't hit those either. The only place where Kendall has had any success this season is in the lower third of the strike zone, although judging by his density chart, pitcher's haven't figured that out yet.
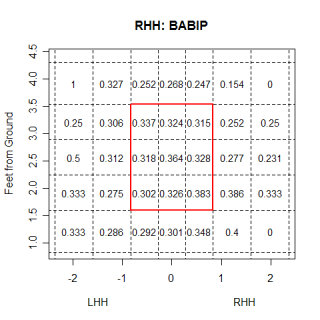
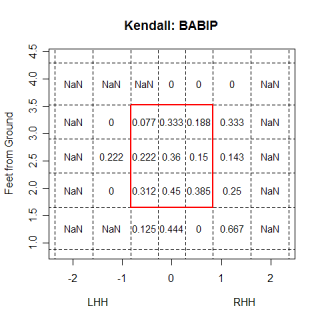
I say that pitchers haven't figured out Kendall's strength yet and avoided throwing him low pitches, but (assuming I'm correct with my assessment of his weaknesses and strengths) do pitchers ever figure out these types of patterns vs. a hitter? How necessary is it to know, and pitch to, a hitter's weaknesses and strengths? Game theory might say that pitching too often to a hitter's weakness would eventually give him an advantage because he would have a good guess on the the location where the next pitch was coming. Whether that advantage would be offset by his inability to hit the pitch is unknown, but you are dealing with Major League hitter. If you gave most hitters the location of the pitch and let them focus primarily on that spot, even if it were a spot where they otherwise had trouble, I think they would be successful. Pitchers have to vary their locations, both in and around the strike zone, to avoid giving the hitter an advantage (duh). In the case of Kendall, and every other hitter I've looked at, pitchers appear to be somewhat varying their locations, although for Kendall, pitchers have thrown more low pitches than high pitches, which cues Kendall to look for more low pitches, and enhances his only strength.
Now with some idea of where pitchers throw to certain hitters and how the hitters respond, lets look at what pitchers throw different hitters. Building on my pitch filter, and some of the earlier work done by Dan Fox, ultxmxpx and Josh Kalk I went through my database and attempted to label every (currently only the ones tracked from 50 feet) pitch in it . Any automated process that attempts to classify pitches is going to have mistakes and mine is no exception, but after comparing the filter's results on individual pitchers to the results I got from manually clustering pitches, I was generally pleased with the results. The filter remains a work in progress (it can't differentiate between a split-fingered fastball and curveball or a 2 and 4 seam fastball and has trouble with certain pitcher's change ups) but the results are pretty good overall.
Here are the MLB averages for how frequently different pitches are thrown. This is for all pitchers vs. all batters in all situations, so it isn't the most telling statistic, but it gives a general sense of how often a fastball (or change up) is thrown.
Pitch             Freq.
Fastball (FB)     0.59
Change up (CH)    0.16
Curveball (CB)    0.13
Slider (SL)       0.08
Unknown (UK)      0.04
Without further ado, here are the batters who have seen the highest and lowest frequency of each pitch, with frequency being the number of a given pitch divided by the total number of pitches that hitter has seen. (Min. of 80 total pitches tracked by the PITCH f/x system.)
Name              Pitch  Count  Total   Freq.
Tony GwynnJr.     FB      92    118     0.78
Robert Fick       FB      66     88     0.75
Reggie Willits    FB     502    673     0.75
Frank Thomas      FB     504    693     0.73
Luis Rodriguez    FB      66     91     0.73
Brad Ausmus       FB     261    360     0.73
Willie Bloomquist FB     122    169     0.72
Scott Podsednik   FB     293    407     0.72
Fred Lewis        FB     117    163     0.72
Jason Kendall     FB     456    638     0.71
============================================
Josh Paul         FB      48    111     0.43
Hanley Ramirez    FB     136    315     0.43
Dan Uggla         FB     173    406     0.43
Moises Alou       FB      97    235     0.41
Delmon Young      FB     114    291     0.39
Todd Linden       FB      48    124     0.39
Jonny Gomes       FB     107    289     0.37
Eric Hinske       FB      54    149     0.36
Alejandro De Aza  FB      35     97     0.36
The players who have seen the most fastballs are hardly surprising. Names like Bloomquist, Ausmus, Podsednik strike such fear into the hearts of pitchers across the league that pitchers are afraid to throw any off speed pitches to these batters. Or not. These hitters are awful, so pitchers don't waste their good pitches on them because they can get them out with fastballs. If I had included pitchers hitting on the list, they would have filled the top-10. I was a little confused by the inclusion of Thomas and Willits on the list, both of whom are having good seasons, but perhaps advance scouts have seen something in their swings that suggests they can't hit fastballs (or that they hit off speed pitches better than fastballs).
Here's the same chart as above, but for curve balls. Wily Mo Pena has seen the highest frequency of curveballs of any hitter, which makes perfect sense after watching him hit. Pena can't make contact with, let alone hit, off speed pitches, so pitchers have responded by throwing more of them. The rest of the list is characterized mostly by powerful free swingers like Pena who have low walk totals and lots of strikeouts; guys who will chase pitches not necessarily in the strike zone.
Name              Pitch  Count  Total   Freq.
Wily Mo Pena      CB      53    186     0.28
Koyie Hill        CB      36    130     0.28
Felix Pie         CB      21    84      0.25
Jonny Gomes       CB      72    289     0.25
Delmon Young      CB      71    291     0.24
Pedro Feliz       CB     129    562     0.23
Alfonso Soriano   CB     103    453     0.23
Rondell White     CB      38    173     0.22
Aubrey Huff       CB      54    262     0.21
Ben Broussard     CB      67    326     0.21
============================================
Ronnie Belliard   CB      18    258     0.07
Chris Woodward    CB      10    144     0.07
Terrmel Sledge    CB      12    175     0.07
Cody Ross         CB       8    128     0.06
Esteban German    CB      19    308     0.06
Brian Buscher     CB       7    124     0.06
Alex Cora         CB       7    124     0.06
Trot Nixon        CB       6    107     0.06
Luis Rodriguez    CB       3     91     0.03
Tony GwynnJr.     CB       2    118     0.02
It isn't earth shattering that bad hitters will see more fastballs than good hitters, or that Wily Mo Pena-esque hitters will see more off speed pitches than normal. Is this what should be happening though? Intuitively, this makes sense, but it would be nice to see if the numbers back it up. Looking at the Pena's BABIP (or something similar), split by pitch type would be a great way to see which pitch he actually hits well and which ones he misses. Unfortunately, there aren't enough pitches in my database to actually do this for individual hitters now, but it is something to think about for the future.
I'm closing with a chart showing batters who have seen the highest and lowest frequency of sliders. Compared with fastballs and curve balls, there isn't as big a difference between the extreme frequencies and the average frequency for sliders , but its still fun to look at who sees the most sliders.
Name               Pitch   Count   Total   Freq.
Mike Napoli        SL      17       88     0.19
John Buck          SL      47      306     0.15
Jason LaRue        SL      29      191     0.15
Moises Alou        SL      35      235     0.15
Jonny Gomes        SL      43      289     0.15
Nomar Garciaparra  SL      46      314     0.15
Josh Barfield      SL      26      178     0.15
Brian Buscher      SL      18      124     0.15
Curtis Thigpen     SL      17      120     0.14
Toby Hall          SL      28      198     0.14
===============================================
Jason Giambi       SL       4      160     0.03
Frank Catalanotto  SL       9      371     0.02
Felix Pie          SL       2       84     0.02
D'Angelo Jimenez   SL       2       89     0.02
Orlando Palmeiro   SL       2       92     0.02
Jose Cruz          SL       2       93     0.02
David Murphy       SL       3      163     0.02
Tony GwynnJr.      SL       2      118     0.02
Cory Sullivan      SL       3      195     0.02
Brian Schneider    SL       1      165     0.01
| Designated Hitter | September 13, 2007 |
Stealthy and Wise
Across Major League Baseball thus far in the 2007 season (through September 11), 74.5% of all stolen base attempts have been successful. This success rate is significantly higher than it has ever been since outs caught stealing began to be regularly recorded as a category of event. The league-wide stolen base success rate has been inching up in recent years but this season that success rate has taken a significantly new additional leap forward.
Adding up all stolen bases and stolen base attempts from 1957 through 2006, one finds that over that fifty-year period 66.6% of all stolen base attempts were successful. Before 2004, only in 1987 (70.1%) and 1995-96 (70.0% and 70.7%) did the overall MLB rate poke up briefly and slightly over the 70% threshold and in each case settled right back down within a year or two to the range of about 68% or so.
Over the past few seasons, however, the SB success rate has been rising a little bit each year, from 68.2% in 2002 to 69.4% in 2003, 70.2% in 2004, 70.6% in 2005 and then last season, 2006, the rate inched up again to its highest level of the past 50 years, 71.4%. And now, in 2007, instead of seeing any regression to a mean or any continued small increments of increase, we seem to be seeing a major acceleration of the recent increase in the SB success rate, from 71.4% in 2006 to 74.5% to date in 2007.
It is possible, perhaps, that in the last few weeks of the 2007 season a huge drop in SB success rates across MLB will bring the complete full-season number back within the expected historical range. But I can't think of a reason why stolen base success rates should drop significantly in late season games. Most likely the final 2007 numbers will look pretty much like the current rate between 74% and 75%, a result like nothing seen in the last 50 years.
What's happening here? I was curious to see whether the number of stolen bases has remained the same and just outs caught stealing have declined, suggesting players are getting faster or catchers slower, or alternatively whether stolen base attempts overall have declined, suggesting that teams are becoming more selective in their attempts and declining to run at all in lower percentage circumstances where they might have tried to steal previously. In general, the trend appears to be the latter – more selectivity.
Over the 1960s, teams averaged about .67 stolen base attempts (SBAs) by each team per game. In the 1970s that went up dramatically to about .96 SBAs per game. In the 1980s, attempts went up even a bit more, to about 1.1 SBAs a game. In the 1990s, attempts remained about 1.1 SBAs a game. But in the current decade of the 2000s, attempts have dropped dramatically to about .81 per game, and dropped to as low as .75 a game in 2005.
This drop in stolen base attempts presumably reflects a strategic reaction to the explosion of home runs in the late 1990s, which reduced the reward vs. risk ratio of stolen base attempts: the more likely it is that batter at the plate will hit a home run, the less rational it is for the runner on base to take the risk of trying to steal. But in the last couple of years, and especially in 2007, teams have seemed to learn that they had maybe grown a little too cautious, that if they exercise due care they can still take some extra steals without getting caught much more. Stolen base attempts have gone from .75 per game in 2005 to .80 in both 2006 and again so far this season. What has differed this season from last year is that of those .80 attempts per game in 2006, .57 represented successful steals and the other .23 were outs caught stealing, while this year .60 have been successful and only .20 have been outs caught stealing. With the most dramatic of the home run onslaught years apparently now behind us, teams seem to be intelligently readjusting their strategies to maximize stolen base attempt value – avoiding overly aggressive and risky attempts but not leaving high quality base advancement opportunities unused. The result is a rate of success on stolen base attempts that is unprecedented in the recorded history of such rates.
Are there differences in the stolen base success tendencies between the NL and AL? Both leagues are experiencing historically high success rates this season, the NL a bit higher than the AL, 75.4% in the NL to 73.6% in the AL, but the trend applies to both. The small edge in success rate for the NL matches the average edge the NL has had over the AL in success rates over the preceding 50 years, which has been about 1.6%. From 1957 through 2006, NL teams were successful stealing bases 67.4% of the time, compared to 65.8% of the time for AL teams, so both leagues in 2007 are ahead of their 50-year average success rate to an almost identical, and in each case very substantial, degree.
One other question that might be asked is whether the recent high level of stolen base success rates reflects a decision by teams to choose catchers more skilled on offense and less skilled at cutting down runners than in the past. Beginning in 1993 (coincidentally or not, the year of the most recent addition of major league expansion franchises), offensive performance by catchers, as well as by major league hitters generally, increased rather dramatically. Overall OPS in the majors in 1992 was .700, which had been about normal for many years – overall OPS had not been above .748 in any season since the 1930s. Then suddenly major league OPS jumped, first to .736 in 1993 and then to .763 in 1994, and has not been below .748 in any season since then. Catchers' hitting has followed along. After plodding along for years in the range of the .660s to the .680s, OPS by major league catchers jumped in 1993 to .714 and then to .727 in 1994, and has been below .700 only once (2002) since 1993.
Catchers as a group generally end up with an OPS in the range of 96% to 97% of overall league OPS, and that has been no different in the high offense, post-1993 years than it was before that. Over the full 50 years from 1957 to 2006, catcher OPS was 96.6% of major league OPS; from 1993 to 2006 that percentage was 96.5%. In 2007, catcher OPS is .712, actually a little bit lower than it has been on average since 1993 (.724). The increase in stolen base success percentage that is the topic of this article has occurred in just the last three or four years, and especially 2007. There is no indication that this increase is associated with any similarly recent jump in catcher offense, either an absolute jump or a jump relative to overall league offense.
For years prior to 2007, the underlying data on stolen bases, caught stealings, games played and league and catcher offense used in this article comes from Lee Sinins' marvelous Complete Baseball Encyclopedia database. I copied the relevant data into Excel and then added the appropriate formulas to get annual success rates and attempts per game rates. For 2007, I used the SB, CS and G data from the absolutely essential baseball-reference.com. For those interested, here's the stolen base success rate (SB/(SB+CS)) that I found for each year 1957-2007 and the stolen base attempts (SBA) per team per game ((SB+CS)/Games Started) for each year:
 	     SB 	        SBA Per Team
Year      Success Rate      Per Game
1957	    57.9%	            0.54
1958	    58.9%	            0.51
1959	    62.8%	            0.55
1960	    62.8%	            0.59
1961	    63.6%	            0.58
1962	    65.8%	            0.63
1963	    61.8%	            0.62
1964	    62.1%	            0.58
1965	    64.8%	            0.69
1966	    61.1%	            0.74
1967	    59.4%	            0.71
1968	    61.9%	            0.75
1969	    62.3%	            0.76
1970	    63.9%	            0.77
1971	    62.9%	            0.72
1972	    62.1%	            0.78
1973	    62.6%	            0.84
1974	    64.3%	            1.00
1975	    64.8%	            1.01
1976	    66.4%	            1.19
1977	    62.9%	            1.14
1978	    65.0%	            1.10
1979	    65.1%	            1.09
1980	    67.2%	            1.16
1981	    64.8%	            1.12
1982	    66.3%	            1.14
1983	    67.3%	            1.17
1984	    66.7%	            1.08
1985	    68.4%	            1.08
1986	    67.2%	            1.17
1987	    70.1%	            1.21
1988	    69.9%	            1.12
1989	    68.4%	            1.08
1990	    68.5%	            1.14
1991	    66.6%	            1.11
1992	    67.1%	            1.16
1993	    66.3%	            1.08
1994	    68.6%	            1.03
1995	    70.0%	            1.04
1996	    70.7%	            1.01
1997	    67.9%	            1.08
1998	    68.6%	            0.98
1999	    69.3%	            1.02
2000	    68.8%	            0.87
2001	    68.8%	            0.93
2002	    68.2%	            0.83
2003	    69.4%	            0.76
2004	    70.2%	            0.76
2005	    70.6%	            0.75
2006	    71.4%	            0.80
2007¹	    74.5%	            0.80
¹ through 9/11/07
Bruce Regal is a New York attorney, with an avocational interest in baseball. He maintains Metaforian, a blog devoted to the New York Mets and Baseball.
| Change-Up | September 12, 2007 |
Pat the Bat
This happens all the time. Fans and media members spend time bemoaning some player that does not suit their fancy for one reason or another, only to have that player come on strong to carry their team to glory. Then the individual who had been killing the player will talk of how the player has come out of nowhere when, in reality, the player had been quite good all along, just under-appreciated.
The guy Phillies fans and media alike love to hate is causing many of them quite a dilemma these days. A sub-.500 team as late as July 7, Philadelphia now finds themselves 2.5 games out of a wildcard slot. There is no individual more responsible for this late season surge than Pat Burrell. He has been the best hitter in baseball since the All-Star Break and better yet, has been getting it done in one clutch situation after another. The haters may just have to come around.
Pat Burrell can't field and can't run and I will concede that if he could do those things he would be a much better baseball player. If Magglio Ordonez could don the tools of ignorance once a week and spell Pudge Rodriguez instead of Mike Rabelo, that would help the Tigers a whole lot and make Mags a much more valuable player. He cannot of course, because he has limitations as a player. Just like Ryan Howard, just like Johan Santana, just like Burrell and every other athlete. Pat Burrell hits very well and this makes him a very good player. Focusing on what he cannot do while ignoring what he does quite well does Burrell a real disservice.
Burrell has been a good player for quite some time now. He is a career .259/.367/.484 hitter, good for a 119 OPS+. Since 2005, here is how he has been performing at the plate.
       PA   AVG   OBP   SLG   OPS+
2005   669 .281  .389  .504   125
2006   567 .258  .388  .502   124
2007   522 .266  .406  .525   137
Pretty good, huh? Pat Burrell still can't field, still can't run and still strikes out all the time. He is also Philadelphia's only hope for reaching the post-season. He's hitting .332/.447/674 since the All-Star Break and fans seem to be coming around, as evidenced by the palpable excitement at Citizens Bank Park that can be sensed everytime he grabs a bat these days.
I imagine even Bill Conlin and Mike Schmidt and Jack McCaffery and Pat Gillick might soon be coming around.
| Baseball Beat | September 10, 2007 |
New York: The Hottest Corners in Baseball
Weekend News: Alex Rodriguez hit his 52nd home run of the season on Sunday, extending his consecutive games streak of going yard to five. ARod has slugged seven homers during this span.
David Wright hit his 27th home run during Saturday's game, matching his career best in 2005. Including a day off on Sunday, Wright has jacked three homers with six RBI in his last six contests.
Rodriguez and Wright have jumped to the forefront of the Most Valuable Player discussions in the AL and NL, respectively. Should these two win the MVP awards, they would become the first players from the same city to capture such honors in the same year since Nellie Fox and Ernie Banks made the Windy City proud in 1959. Miguel Tejada (A's) and Barry Bonds (Giants) in 2002 and Jason Giambi (A's) and Jeff Kent (Giants) in 2000 were named MVPs as crosstown rivals in the Bay Area.
The third basemen would also become the first pair of players manning the hot corner to earn MVPs since George Brett and Mike Schmidt in 1980. Brett and Schmidt met in the World Series that fall with the latter leading the Philadelphia Phillies to the title over the Kansas City Royals in six games. The reigning MVPs were featured on the cover of Sports Illustrated in the magazine's baseball preview in April 1981. The headline aptly read, "Hotshots at the Hot Corner."
If Rodriguez and Wright were to win MVP honors in 2007, SI could do worse than putting them on the cover next spring. In the meantime, like Brett and Schmidt, New York's finest could lead their teams to the Fall Classic. The Yankees are 5 1/2 games back in the AL East but sit atop the Wild Card race with a four-game margin over the Detroit Tigers. The Mets enjoy a six-game lead over the Phillies in the NL East and could wind up with the best record in the league, earning home-field advantage in the NLDS and NLCS.
Rodriguez and Magglio Ordonez of the Tigers have been running 1-2 all season. ARod got off to an incredibly hot start, slugging 14 HR in the first three weeks of the season. He slipped to .235/.361/.422 in May, allowing Ordonez (.381/.450/.619 in May and June) to gain some traction in the AL MVP debate. However, with a strong September, Rodriguez (.533/.600/1.367 with 8 HR in 30 AB) is beginning to pull away from Mags.
AL RUNS CREATED ABOVE AVERAGE
1    Alex Rodriguez        77
2    Magglio Ordonez       65
3    David Ortiz           52
4    Carlos Pena           50
T5   Curtis Granderson     38
T5   Jorge Posada          38
7    Vladimir Guerrero     36
T8   Ichiro Suzuki         35
T8   B.J. Upton            35
10   Alex Rios             32
ARod is also leading Ordonez in Wins Above Replacement Value (WARP) and Win Shares, both of which incorporate defense into their tallies. At this point, it would be a huge surprise if Rodriguez didn't win his third MVP award this season.
Wright, on the other hand, experienced a poor April (.244/.370/.311) and has only recently become a strong candidate for NL MVP honors.
NL RUNS CREATED ABOVE AVERAGE
1    David Wright          55
2    Chase Utley           51
3    Chipper Jones         48
4    Prince Fielder        47
T5   Barry Bonds           46
T5   Hanley Ramirez        46
7    Albert Pujols         42
8    Miguel Cabrera        35
T9   Ryan Braun            32
T9   Matt Holliday         32
Wright not only leads the pack in RCAA but he also is #1 in WARP and Win Shares. According to the latter measurement, Eric Byrnes, Russell Martin, and Carlos Beltran should factor into the discussion as well. Beltran will have a tough time beating out Wright but Byrnes and Martin could become darkhorse choices if one of them leads their club to the NL West title.
Upon first blush, Wright's stats pale in comparison to ARod's. However, except for the differential in HR (and R and RBI), their numbers are remarkably similar. They have virtually the same totals when it comes to G, AB, H, 2B, 3B, SB, CS, BB, SO, AVG, and OBP. I realize that HR are a big deal – in fact, the biggest deal of 'em all – but I still think it is instructional to recognize the commonalities between the two. ARod has Wright beat up and down and around in HR and SLG, yet the latter's 27 dingers and .539 slugging percentage are impressive nonetheless.
             G    AB   R    H   2B  3B  HR  RBI  SB  CS   BB   SO   AVG   OBP   SLG
Rodriguez   141  519  132  165  28   0  52  140  22   3   82  101  .318  .424  .672
Wright      140  523   97  165  34   1  27   93  30   4   84  108  .315  .410  .539
Rodriguez, who is on pace to hit 59 home runs, could become just the sixth player in the history of the game to slug 60 in a season. If so, he would be the first non-OF/1B to reach this hallowed mark. Amazingly, he is the only non-OF/1B to rip 50 – something he has accomplished THREE times (52 in 2001 and 57 in 2002 as a SS and 52 and counting in 2007 as a 3B). Mike Schmidt never hit 50. Eddie Mathews never hit 50. Ernie Banks never hit 50.
                              YEAR       HR
1    Barry Bonds              2001       73
2    Mark McGwire             1998       70
3    Sammy Sosa               1998       66
4    Mark McGwire             1999       65
5    Sammy Sosa               2001       64
6    Sammy Sosa               1999       63
7    Roger Maris              1961       61
8    Babe Ruth                1927       60
ARod also has the opportunity to catch or surpass Babe Ruth and Roger Maris as the all-time, single-season HR king among Yankees.
The man who wears #13 on his jersey is projected to score 150 runs and knock in 159. ARod could become the first player to go 150-150 in the same season since Ted Williams in 1949.
                              YEAR       R       RBI
1    Babe Ruth                1921      177      171
2    Lou Gehrig               1936      167      152
3    Lou Gehrig               1931      163      184
T4   Babe Ruth                1927      158      164
T4   Chuck Klein              1930      158      170
6    Al Simmons               1930      152      165
T7   Jimmie Foxx              1932      151      169
T7   Joe DiMaggio             1937      151      167
T9   Ted Williams             1949      150      159
T9   Babe Ruth                1930      150      153
Once again, we're looking at nothing other than OF and 1B. ARod's potential inclusion in lists like those above is a testament to his hitting prowess as well as his overall value as an infielder.
And that other third baseman in New York is Wright behind him.
Source of Tables: Complete Baseball Encyclopedia
| Weekend Blog | September 09, 2007 |
Looking back at the 2005 draft
It's often said that it takes several years to properly evaluate a draft in any sport because it takes different lengths of time for players to mature and reach their potential. That being said, how good was the 2005 MLB draft? The first five picks went like this.
1. Justin Upton-ARI
2. Alex Gordon-KCR
3. Jeff Clement-SEA
4. Ryan Zimmerman-WAS
5. Ryan Braun-MIL
With Clement getting called up on Sept. 2nd, all five of these picks have now made their Major League debut. This might not sound like much, but since 1998 there has always been at least one top-five pick who didn't even make the majors for even a September call-up. Upton and Clement are the only two in the group to just have cups of coffee, with the other three players all essentially playing at least one full season. Zimmerman reached the majors first, a mere three months after he was drafted, while Braun is possibly the best rookie slugger ever. Gordon was better than both Zimmerman and Braun in college, and while he is having a tough year statistically, he has hit much better as the season has progressed.
Outside the top-5 picks, the draft still had a lot of value. The Rockies got Troy Tulowitzki with the 7th pick and Tulo has had a great rookie campaign as well. With the exception of Braun, Tulo might be having the best rookie year by an NL hitter. In the bottom of the first round, Craig Hansen and Joey Devine were taken, who at the time were seen as two sure bets to make the majors. They did make the majors in 2005, but struggled and eventually returned to the minors.
There are a bevy of other talented players who were taken in 2005 and so far have had cups of coffee (Jacoby Ellsbury, Clay Buchholz) or a full season (Travis Buck, Matt Garza and Mike Pelfrey). It's amazing that so many players from this draft have already made the majors (and performed well), but it remains to be seen how many will have the staying power needed for a long career.
---Joe P. Sheehan
| Command Post | September 07, 2007 |
That Sinking Feeling: Part Deux
Sinkers have been a popular topic for research with the PITCH f/x data so I'm going to that well once again and try to determine why sinkers are hit on the ground. One explanation given for why sinkers turn into ground balls is that sinkers are ordinary fastballs thrown low in the strike-zone, and pitches low in the strike-zone are more likely to be hit on the ground. This would mean that Derek Lowe's "sinker" is a similar pitch to Chris Young's fastball, but Lowe (and other pitchers with high ground ball percentages) frequently throw their fastballs low in the zone. Another possible explanation for the relationship between sinkers and ground balls is that there is something different about the flight of a sinker that causes a hitter to hit a ground ball when he puts it in play. This would mean that Lowe's sinker is actually a different pitch than a regular fastball, with hitters putting it in play on the ground, regardless of where it is thrown.
It is pretty easy to test whether there is something unique about the fastballs thrown by pitchers with low ground ball percentages (the amount of ground balls divided by all balls in play or GB%). I order to do so, I created three different groups of pitchers, based only on their GB% (the groups were pitchers with GB%>=.49 GB%<=.35, and all others) and looked for differences in their fastballs. After I had the pitchers grouped, I removed anyone I didn't have at least 450 total pitches worth of data. 450 pitches is a round, arbitrary number, but from eyeballing it, that was about the point where pitchers with only a couple of starts in Enhanced capable parks began to show up. The chart below shows a comparison between each group's average fastball.
Pitcher       MPH    Pfx_x   Pfx_z    Pitches   Group Size
Ground ball   91     -5.97   5.66     7385      16
Neutral       90     -2.95   9.14     29729     73
Fly ball      90     -0.80   10.71    4686      13
As a reminder, the pfx_x/z values are the horizontal and vertical differences between the actual pitch and a hypothetical pitch without spin. For ground ball pitchers, their fastballs end more than 5 inches higher than a spin-less fastball would, which might seem counter intuitive, except that every fastball ends up higher than a non-spinning pitch would, due to the backspin on a fastball. Fastballs thrown by neutral pitchers end 9 inches higher than a hypothetical pitch, so hitters are conditioned to seeing a pitch drop a certain amount between the mound to home, a distance that corresponds to ending 9 inches above a spin-less pitch. When a sinker is thrown, it drops 4 inches more than a "normal" fastball, so there is definitly something unique about sinkers and it makes sense that hitters would hit the top half of the ball and pound it into the ground.
If you followed that explanation, check out the chart again. If ground balls result from hitters expecting a pitch to be higher than it is, and hitting the top of the ball, fly balls seem to come from the opposite case. Rising fastballs, which are the opposite of sinkers, are fastballs that don't drop as much as "normal", due to higher amounts of backspin. A hitter will have an opposite reaction to a rising fastball compared with a sinker, as it will drop an inch less than a normal fastball does. The batter will usually hit the bottom of the ball, resulting in either a line drive or fly ball, but not a grounder. The actual values in the chart need to be taken with a grain of salt, due to tracking differences at different stadiums, but the overall pattern is there.
Now that we know sinkers are a unique pitch, it's time to test some of the other ideas from the first paragraph. Even though it is a unique pitch, the sinker could be thrown low in the strike zone, causing the ground balls. Below on the left is a chart showing what percentage of the 7385 sinkers in my sample were thrown to specific areas. There seems to be a slightly higher percentage of sinkers that end up low in the strike zone, compared both to all other sinkers and 'normal' fastballs (from the neutral group), but the differences don't seem to be anything too big, and pitchers with high GB% don't appear to throw their fastballs low in the zone any more than other pitchers.
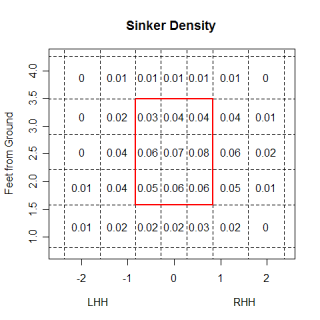
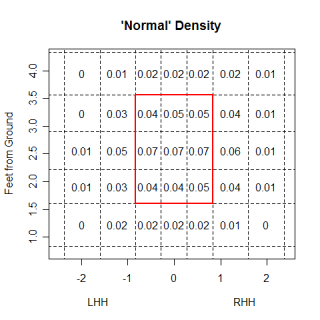
A quick note about the charts, in the past when I have used graphs like this to show the location of pitches, I've always done so from the catcher's perspective. I've gotten several requests to show those graphs from the pitcher's perspective, which is how these are. Anyway, the chart shows where sinkers are thrown to, but is the location why the sinkers are turned into ground balls? Chris Constancio has already looked at this topic and while I only considered balls-in-play and used a different set of pitchers than Constancio, (and still have a relatively small sample) my conclusion is only slightly different.
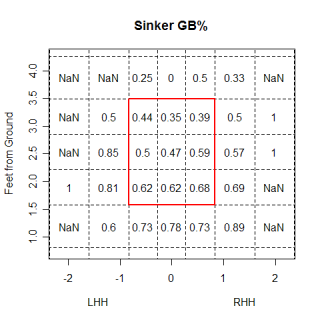
Above is a chart showing ground balls as a percent of all balls put in play for each area. What you see is a wide range of outcomes, based on location, indicating that location does play a role in determining the outcome of a sinker. Sinkers thrown to the bottom of the strike zone are hit on the ground 60% of the time, which is comparable to Derek Lowe's GB%, while sinkers that are thrown at the top of the strike zone are hit on the ground 40% of the time, which is below league average.
However, in order to say that a sinker at the top of the strike zone results in less than an average amount of ground balls, you need to know what the average GB% is for each area. The chart below on the left shows the GB% of normal fastballs, which can serve as an average. This chart follows the same pattern as the sinker chart, where the height of a pitch influences the result and you can see that in every region, sinkers have a higher GB%. Even though the GB% for a sinker varies depending on its location, (and the percents are influenced by the small amount of balls in play), in every region sinkers are 20-30% better at getting ground balls than normal fastballs, as illustrated by the chart on the right. In fact, it looks like if you shifted the sinker chart down one set of boxes, it would line up pretty well with the normal chart. A sinker that ends belt high gets the same GB% as a regular fastball does when it ends at the knees.
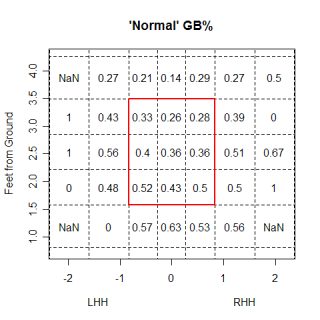
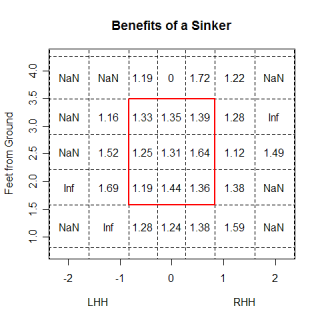
So far we've looked at the PITCH f/x values of a sinker and what happens to it when it is thrown to certain areas. A sinker is a pitch with unique flight characteristics and is frequently thrown low in the strike zone, both of which contribute to very high ground ball percentages for sinkers. However, ignoring location for a second, the optical illusion that fools a batter into hitting the top of a sinker is only effective if it doesn't become the norm...so how does Derek Lowe keep getting ground balls?
Lowe only throws three pitches, a sinker, change-up and curve, and looking at the GB% for each pitch in the chart below, it appears that he has the highest GB% with his change-up. He gets more total grounders from his sinker, but on a percentage basis, his change-up is better at getting grounders. This is based on a sample of just 33 change-ups in play, so the numbers could be totally wrong, but if this phenomenon is real, it means that Lowe's change-up is really his ground ball pitch.
Pitch    GB%      # in play
FB       62%      122
CH       85%       33
CB       50%       32
Assuming for a second that Lowe's change-up is really his ground ball pitch, it might partially explain why hitters are unable to adjust to the sinker and keep pounding that pitch into the ground. Lowe's change-up has a vertical drop of 4.23 feet from release point to home, compared to a drop of 3.71 feet for his fastball. Does this 6-inch change result in hitters again being tricked into thinking a pitch was going to break less than it actually did and hitting the top of the ball? I don't know, and while most pitcher's change-ups have a greater vertical drop than their fastballs, not all pitchers get a higher GB% from their change-up than the fastball from that same pitcher.
Unfortunately the sample sizes in all these cases are very small, so the jury is still out. I am still curious though about how the Lowes of the world continue to get such a high percent of ground balls from their sinker. Wouldn't hitters eventually realize what's happening with the movement of a sinker and adjust their swings? MLB hitters are good as a group, so there has to be some reason for them to continue hitting sinkers into the ground.
The location of any pitch when it crosses the plate is related to what happens when it is put in play, and sinkers are no exception. Low sinkers are hit on the ground more frequently than high sinkers. However, regardless of where they are thrown, sinkers are hit on the ground more frequently than an average pitch in that same location. If I were to speculate, I'd say that the movement of a sinker is more important than the location because wherever a sinker is thrown, its gets more grounders than a normal fastball. I think batters have a tough time adjusting to the break of a sinker, and if the pitch is thrown low, it just increases the chances of a ground ball.
*********************************************************************************************
That's pretty much the end of the article, but after looking at sinking fastballs and rising fastballs for several days, I got curious and wanted to see who had the highest and lowest GB% when they threw a fastball. The chart below just looks at fastballs that were put in play (min. 50 fastballs) and has some cool results.
Name             GB     BIP     GB%
Zach Miner       38     57      0.67
Sergio Mitre     48     73      0.66
Felix Hernandez  83     128     0.65
Kameron Loe      47     73      0.64
Tim Hudson       74     118     0.63
====================================
Rich Hill        24     98      0.24
Ted Lilly        19     95      0.20
Chris Young      15     70      0.21
Barry Zito       12     62      0.19
Chuck James       9     61      0.15
While most pitchers have a similar overall GB% and fastball GB%, Kameron Loe has an overall GB% of 53%, but with his fastball, he gets ground balls 64% of the time. On the other side of the spectrum, Chuck James has an overal GB% of 29%, which drops to 15% on fastballs. Looking at the full list, you can get a better sense of how some pitcher's achieve their results.
I created another table along with the ground ball table that shows the percentage of fastballs that were swung at and not put in play (the batter either missed the pitch or fouled it off).
Name             SW    Foul    BIP    Not in play%
Takashi Saito    33     31     16     0.80
Jose Valverde    26     42     21     0.76
Johan Santana    26     71     30     0.76
Tony Armas        8     52     19     0.76
Jake Peavy       43    156     71     0.74
Huston Street    11     37     19     0.72
Scott Kazmir     29     39     27     0.72
Frank Francisco  23     47     28     0.71
Brandon Morrow   34     55     36     0.71
C.J. Wilson      30     36     28     0.70
==========================================
Dustin Moseley    8     50     79     0.42
Tom Glavine       4     37     56     0.42
J.D. Durbin       3     31     48     0.41
Lance Cormier     5     18     33     0.41
John Lannan       3     21     35     0.41
Kason Gabbard    17     26     66     0.39
Oscar Villarreal  2     26     44     0.39
Sergio Mitre      9     36     73     0.38
Livan Hernandez   6     46     87     0.37
Matt Morris       9     31     76     0.34
I made this chart just for fun, but eventually I want to be able to look through all pitch types and find who has the most unhittable (or ground ball inducing) pitch, rather than just fastballs. With that list, you can get more nuanced results and really compare things like whether Saito's fastball or Santana's change-up gets more swings-and-misses.
| Baseball Beat | September 06, 2007 |
A Minor League Site of Their Own
Sean Forman has done it again. The genius behind Baseball-Reference.com has now created a similar site for the minor leagues. The minor league data goes back to 1992 and is current through September 4, 2007.
You can go to the home page and get the standings and league stats for any league by clicking on the links. You can check out the 2007 Southern League or go back a dozen years and see what took place in the 1995 Pacific Coast League.
Wanna know who led the minors in home runs this year? No problem. Click on this link and you'll get the top 100. For the curious, the answer is Craig Brazell. After studying his player page, I wouldn't place a nickel on his chances of succeeding in the majors. He's played 10 years in the minors and has 161 BB and 741 SO to show for his efforts. The left-handed-hitting first baseman had a cup of coffee with the Mets in 2004 and did little to impress scouts back then. He's a minor league lifer.
While you're at the 2007 Batting Leaders for Home Runs page, be sure to click on any of the column headings to sort your favorite category from top to bottom. The 2007 Batting Leaders for Stolen Bases? None other than Ovandy Suero, a 25-year-old Detroit Tiger farmhand wasting his time playing for Lakeland of the High-A Florida State League.
Do you think Jay Bruce might be a legitimate prospect? Well, go to the 2007 AAA Batting Leaders for Age and check it out for yourself. Not too bad for a 20-year-old, huh? Adam Jones, Billy Butler, Carlos Gomez, Daric Barton, and Evan Longoria stand out as 21-year-olds. Butler and Barton walked more than they struck out. That's always an excellent sign for a youngster, especially for a power hitter like Butler (who is hitting .305/.359/.465 in 281 plate appearances at the MLB level). I've seen him play in person and he reminds me of Greg Luzinski in terms of size, position, poor glove, (lack of) speed, and his ability to hit for average and power.
You can do any and all of the above for pitchers, too. Ever wonder who led the minors in strikeouts this year? Simple. Go to 2007 Pitching Leaders for Strikeouts and there you have it, sorted from 1-100 with all of the other pertinent stats right there at your disposal. Tip: The top 15 are all pretty good prospects. In addition to the rate stats at the far right of the page, be sure to pay attention to age vs. level. Edinson Volquez, Allan Horne, and Jack Egbert are not nearly as special as Clay Buchholz (who, as you know, has already thrown a no-hitter in the majors even though he is two years younger than all three) or Clayton Kershaw (who pitched at the same level despite being FIVE years younger).
Hey, I could go on and on but it would be better if you just let yourself loose inside those pages. Go ahead and indulge. Now. Have fun. But not so much fun that you forget to come back and read Joe P. Sheehan's Command Post article tomorrow. See you then and *here*.
| Baseball Beat | September 05, 2007 |
A Preview of This Year's Free Agent Class: Part Two - The Pitchers
Before we know it, the baseball season will be over and the discussion will have progressed from the pennant race to the playoffs to the World Series to this year's class of free agents. We got a jump on the latter by previewing the free agent position players yesterday. Today, we review the starting pitchers and relievers about to hit the open market.
If you didn't care for the hitters, you won't like the starters at all. Yes, this year's class of starting pitchers is thinner than Julian Tavarez. In fact, other than a few oldies (and maybe one goodie), there isn't a single pitcher that could be much more than a fourth or fifth starter on a middle-of-the road team.
Starting Pitchers
Kris Benson         BAL
Paul Byrd           CLE
Shawn Chacon        PIT
Matt Clement        BOS
Bartolo Colon       LAA
Scott Elarton       CLE
Josh Fogg           COL
Casey Fossum        DFA
Freddy Garcia       PHI
Livan Hernandez     ARZ
Jason Jennings      HOU
Brian Lawrence      NYM
Jon Lieber          PHI
Kyle Lohse          PHI
Rodrigo Lopez       COL
Wade Miller         CHC
Eric Milton         CIN
Odalis Perez        KC
Joel Pineiro        STL
Kenny Rogers        DET
Curt Schilling      BOS
Carlos Silva        MIN
Julian Tavarez      BOS
Brett Tomko         SD
Kip Wells           STL
Randy Wolf          LAD
Jaret Wright        BAL
Victor Zambrano     TOR
Who could have imagined that a soon-to-be-41-year-old pitcher would headline this year's crop of pitchers? Curt Schilling may not have much left in his tank but could garner some interest from a few contending clubs interested in signing him to a one-year deal. Don't rule out the Red Sox and Schilling agreeing to an incentive-laden deal that could bring back the veteran pitcher to Beantown for a fifth season.
In a similar vein, the Tigers and Kenny Rogers may see fit to work out a one-year contract to keep the 42-year-old southpaw in Detroit. Rogers, who is scheduled to start tonight for the first time since late July, is 3-2 with a 5.23 ERA in only 32.2 innings. He began the season on the disabled list after having surgery in March to remove a blood clot from his left shoulder and has spent additional time on the DL with inflammation in his elbow.
Teams may also take a flyer on Bartolo Colon and Freddy Garcia but neither is likely to earn the big bucks that would have been thrown at them had they been healthy all year.
As for club options, Paul Byrd ($8M) is the only pitcher who is apt to be renewed. The likes of Kris Benson ($7.5M) and Odalis Perez ($9M) are overpriced, while several pitchers with such options have already been released or designated for assignment (Casey Fossum and Brett Tomko) or are on the disabled list and out for the season (Randy Wolf). In picking up Joel Pineiro's contract, the Cardinals and their newest addition to the starting rotation have a mutual option for 2008. Depending on how Pineiro pitches in September (and possibly October) could determine his fate next year.
Relief Pitchers
Jeremy Affeldt      COL
Armando Benitez     FLA
Hector Carrasco     LAA
Francisco Cordero   MIL
Rheal Cormier       CIN
Vic Darensbourg     DET
Elmer Dessens       MIL
Scott Eyre          CHC
Jason Isringhausen  STL
Todd Jones          DET
Jorge Julio         COL
Joe Kennedy         TOR
Byung-Hyun Kim      FLA
Scott Linebrink     MIL
Ron Mahay           ATL
Trever Miller       HOU
Mike Myers          CWS
Joe Nathan          MIN
Chris Reitsma       SEA
Mariano Rivera      NYY
Rudy Seanez         LAD
Mike Timlin         BOS
Mike Venafro        MIN
Luis Vizcaino       NYY
Bob Wickman         DFA
Scott Williamson    BAL
Jay Witasick        TB
The relievers are a horse of a different color. Five closers top this group, including a future Hall of Famer and another who currently ranks among the best in the business. However, the cream of the crop may never become free agents because of loyalty and club options.
Mariano Rivera, who has made $10.5M in each of the past three seasons, will be free to negotiate with any team in a couple of months. It's hard to fathom him pitching for any team other than the Yankees, but I guess one has to at least ponder the possibility. Like teammate Jorge Posada, New York can afford to keep him if it so chooses. Unlike Posada, Rivera is not coming off a career season. However, if his K/BB numbers (62 SO and 8 BB in 59.2 IP) mean anything, he is far from done (despite an ERA which is the highest since his rookie season in 1995 when he started 10 out of 19 games).
Unless Joe Nathan suffers a major injury over the final four weeks of the season, consider it a foregone conclusion that the Twins will pick up the $6M club option on their All-Star closer. Although his strikeout rate is down from 2006, Nathan is enjoying another marvelous season. He would probably command a contract in the neighborhood of $10M per year in the open market.
The Cardinals hold an $8M club option on Jason Isringhausen with a $1.25M buyout. With a 1.77 ERA and 28 saves, a healthy Izzy is a good bet to be back in St. Louis next season.
Source: Cot's Baseball Contracts
| Baseball Beat | September 04, 2007 |
A Preview of This Year's Free Agent Class: Part One - The Hitters
As the baseball season enters the home stretch, I thought it would be a change of pace to take a look at this year's free agent class. Today's sneak preview focuses on position players. I will complete the two-part series tomorrow by concentrating on starting pitchers and relievers.
Depending on what happens with Alex Rodriguez and several players with club options, the free agent crop ranges from uninspiring to . . . well . . . inspiring. Here is a guide broken down position-by-position.
Catchers
Brad Ausmus         HOU
Paul Bako           BAL
Michael Barrett     SD
Gary Bennett        STL
Ramon Castro        NYM
Wiki Gonzalez       WAS
Jason Kendall       CHC
Jason LaRue         KC
Paul Lo Duca        NYM
Damian Miller       MIL
Chad Moeller        CIN
Jose Molina         NYY
Josh Paul           TB
Jorge Posada        NYY
Ivan Rodriguez      DET
Yorvit Torrealba    COL
Javier Valentin     CIN
Two of the best catchers in the game could become free agents after the end of the season, as well as a number of serviceable backstops.
Jorge Posada (.329/.411/.528) is not only having what looks like a career year but perhaps the best offensive season by any 35-year-old catcher in the game's history. Although there is no doubt that the Yankees want to keep Posada and can afford to bring him back, I can't help but think there could be an issue as far as the number of years involved. The Yankees will probably offer two years with perhaps a club option for a third while Posada will undoubtedly want three years guaranteed.
The Detroit Tigers have a $13M club option on Ivan Rodriguez for the 2008 season. Given the $3M buyout, one could argue that the cost to bring back I-Rod is only $10M. Thanks to EIGHT walks in 442 plate appearances, the future Hall of Famer's .288 OBP is as low as it has been since his rookie season in 1991. That's not all. I-Rod's AVG (.274) and SLG (.415) are at 14-year lows. It's a tough call at this point but look for Rodriguez to spend one more summer in Motown.
First Basemen
Sean Casey          DET
Tony Clark          ARZ
Jeff Conine         NYM
Julio Franco        ATL
Kevin Millar        BAL
Olmedo Saenz        LAD
Mark Sweeney        LAD
Mike Sweeney        KC
Unless a club is looking for a veteran pinch hitter on the cheap, there's not much to choose from this year's crop of free agent first basemen. Don't be surprised if one or two retire while the others cross their fingers and hope they can prolong their careers for another season or two.
Kevin Millar's $2.75M option for 2008 is guaranteed with 475 plate appearances in 2007. Given that Millar is within 20 PA of the threshold, he is a virtual certainty of returning to the Orioles next season. His salary will increase based on the number of games played and additional plate appearances but is likely to be in the vicinity of $3M.
Second Basemen
Marlon Anderson     NYM
Craig Biggio        HOU
Luis Castillo       NYM
Damion Easley       NYM
Mark Ellis          OAK
Marcus Giles        SD
Tony Graffanino     MIL
Tadahito Iguchi     PHI
Jeff Kent           LAD
Mark Loretta        HOU
Kaz Matsui          COL
Luis Rivas          CLE
Jose Valentin       NYM
The list of second basemen is a bit thin, especially after accounting for the club options that are likely to be exercised. However, this is more the norm than not at a one of the most replaceable and affordable positions on the field.
The Oakland A's hold a $5M club option with a $0.25M buyout on Mark Ellis. Given his offensive production (.262/.322/.421 with a career-high 16 HR) and defensive excellence, it would be a surprise if the A's didn't exercise their option on the 30-year-old second baseman.
Marcus Giles was non-tendered by the Atlanta Braves a year ago. He signed a one-year contract for $3.25M with the San Diego Padres in December with the club holding a $4M option for 2008. Based on his disappointing performance (.229/.300/.322) to date, the Padres are unlikely to bring Giles back next season, especially at $4M. However, it's possible that the two sides could work out a deal to keep the Brothers Giles together for one more season but at a greatly reduced price in the case of Marcus.
Matt Antonelli, 22, is on the verge of becoming San Diego's everyday second baseman. He has hit .305/.402/.490 with 21 HR, 82 BB, and 28 SB in High-A and AA this season. The 17th overall pick in the 2006 draft, Antonelli has developed home run power that was unseen in his professional debut last year and throughout his collegiate career at Wake Forest. Craig Stansberry, who was called up to the big league club 10 days ago when Giles went on the DL with a knee sprain, could serve as an interim solution if Antonelli isn't ready next spring. Claimed off waivers by the Padres last December, Stansberry hit .273/.370/.446 with 14 HR and 70 BB in 124 games with Portland (AAA). Born in Saudi Arabia, the 25-year-old played for the World team in the Futures Game during All-Star weekend in San Francisco.
Tadahito Iguchi was signed as a free agent from Japan in January 2005. The White Sox exercised a club option last October, paying him $3.25M for 2007. It included a clause requiring the White Sox (now the Phillies) to extend the deal before the conclusion of the 2007 season or grant him his release, effectively making Iguchi a free agent after three years of MLB service. Iguchi filled in admirably for Chase Utley in August when the latter was on the DL but doesn't fit into Philadelphia's longer-term plans. He won't have any trouble finding a suitor for his services next season.
Kaz Matsui has the same clause in his contract as Iguchi. After earning $20M from 2004-06, Matsui re-signed as a free agent last November for $1.5M. Given his success with the Rockies, it's possible that a mutually acceptable deal could be reached to keep Matsui in Colorado for another year or two.
Jeff Kent inked a one-year extension in March 2006 that called for a signing bonus of $2M, a salary of $9M, and a club option for 2008 at $9M plus $2.35M in performance incentives and escalators or a buyout of $0.5M. His option becomes guaranteed with 550 plate appearances in 2007. With almost 500 PA through yesterday, Kent, who turns 40 next March, is almost a sure thing to be back with the Dodgers in 2008.
Here is a list of all the second basemen aged 40 and above who played in 100 or more games:
PLAYER       OPS+ YEAR AGE TEAM  G  AB  R   H  2B 3B HR RBI  BB  SO   AVG   OBP   SLG
Joe Morgan   103  1984  40 OAK 116 365 50  89  21  0  6  43  66  39  .244  .356  .351
Nap Lajoie    99  1915  40 PHA 129 490 40 137  24  5  1  61  11  16  .280  .301  .355
Craig Biggio  83  2006  40 HOU 145 548 79 135  33  0 21  62  40  84  .246  .306  .422
Nap Lajoie    79  1916  41 PHA 113 426 33 105  14  4  2  35  14  26  .246  .272  .312
R. Maranville 60  1933  41 BSN 143 478 46 104  15  4  0  38  36  34  .218  .274  .266
R. Maranville 59  1932  40 BSN 149 571 67 134  20  4  0  37  46  28  .235  .295  .284
The good news for Kent is that these players are – or will be – Hall of Famers. The bad news for the Dodgers is that only one of them had an OPS+ equal to or better than 100. But just maybe today's 40 is yesteryear's 35, giving Los Angeles and its fans hope that Kent can be productive for at least one more season.
Shortstops
David Eckstein      STL
Cesar Izturis       PIT
Ramon E Martinez    LAD
John McDonald       TOR
Neifi Perez         DET
Juan Uribe          CHW
Omar Vizquel        SF
This is your year if you like good-field, no-hit shortstops. Even steroids haven't helped one of the members of this punchless group.
Cesar Izturis is in the final season of a three-year, $9.9M contract. There is zero chance that the Pirates will exercise their $5.45M option for 2008. Juan Uribe is also at the tail-end of a three-year deal that paid him $9.75M. The White Sox have a $5M club option for 2008. Uribe brings solid defense and . . . gasp . . . some power to the position but, with an OBP of .263 in 2006-07, is a certified out machine as a hitter.
Ramon Martinez re-signed a one-year deal with the Dodgers last November for $0.8M with a $1M club option for 2008. He's not really needed but flip a coin as to whether Ned Colletti brings back one of his favorites next season.
Third Basemen
Russell Branyan     STL
Corey Koskie        MIL
Mike Lamb           HOU
Mike Lowell         BOS
Greg Norton         TB
Abraham O. Nunez    PHI
Alex Rodriguez      NYY
OK, now we're talking. The player whose first name starts with an "A" and last name ends with a "z" holds all the cards. No, not Abraham Nunez. We're talking about Alex Rodriguez here. The Yankees third baseman has a 10-day window after the World Series to void his contract. The Texas Rangers are hoping and praying that A-Rod opts out of his agreement. Texas, which has already subsidized the Yankees to the tune of approximately $46M over the past four years, will no longer be on the hook for about $21.3M if the future Hall of Famer terminates the 10-year contract he signed in December 2000.
Under the current arrangement, the Yankees are only on the hook for $15.9M in 2008, $16.9M in 2009, and $17.9M in 2010. Should A-Rod opt out as expected, New York will most likely need to bump up its financial obligation by an average of roughly $13M for each of the next three years and add at least two more years to the back end of the contract at a minimum of $30M per season.
In the improbable event that Rodriguez chooses not to void his contract this year, he may opt out after 2008 or 2009 unless the club increases his 2009-10 salary by $5M/year or $1M more than the highest-paid MLB position player. You can check out additional details at Cot's Baseball Contracts.
The Milwaukee Brewers and Toronto Blue Jays will split Corey Koskie's $0.5M buyout. Look for the 34-year-old third baseman, who has been out all season with a postconcussion syndrome, to hang up his cleats for good. Greg Norton (.219/.343/.315) should follow Koskie's lead and retire as well. Suffice it to say that Tampa Bay will not exercise the $1M club option for 2008.
Outfielders
Bobby Abreu         NYY
Moises Alou         NYM
Barry Bonds         SF
Milton Bradley      SD
Mike Cameron        SD
Brady Clark         SD
Jeff DaVanon        OAK
Adam Dunn           CIN
Darin Erstad        CWS
Luis Gonzalez       LAD
Shawn Green         NYM
Eric Hinske         BOS
Torii Hunter        MIN
Geoff Jenkins       MIL
Andruw Jones        ATL
Bobby Kielty        BOS
Rob Mackowiak       SD
Orlando Palmeiro    HOU
Corey Patterson     BAL
Aaron Rowand        PHI
Reggie Sanders      KC
Sammy Sosa          TEX
Brad Wilkerson      TEX
Outside of Posada and the two Rodriguezes, almost all of the talent in this year's free agent class of hitters will come from the pool of outfielders. Counting Barry Bonds, there are seven players who will get the attention of more than one team. They will be expensive, especially in a market with too many dollars chasing too few players. Supply and demand will dictate that three or four players among Bobby Abreu, Mike Cameron, Adam Dunn, Torii Hunter, Andruw Jones, and Aaron Rowand will get deals that turn heads.
The Yankees have a $16M club option on Abreu for 2008. Although the 34-year-old right fielder's overall production (.284/.366/.443) isn't worthy of that salary, his second half numbers (.321/.393/.567) just might be enough to earn one more year in pinstripes. If New York passes, Abreu will receive a buyout of $2M.
Dunn will be contacted by several teams if the Reds choose not to exercise their $13M club option for 2008 that could escalate to $16M based on award bonuses. His agents should be fired for only negotiating a $0.5M buyout but that is another story. According to Cot's Baseball Contracts, "if club exercised 2008 option, Dunn receives full no-trade clause until 6/15/2008 and limited no-trade clause for the remainder of 2008 (allowing Dunn to specify 10 clubs to which he would accept a trade)."
Cameron, Hunter, Jones, and Rowand comprise a bountiful crop of center fielders. Cameron, who is putting up his usual offensive stats and chasing down flyballs in Petco, and Rowand, who is more than matching his previous career season in 2004, won't break the bank and could prove to be better values than the more highly touted Hunter and Jones.
Bonds is a special case. He earned $15.8M plus as much as $4.2M in performance bonuses this season. Other than the Giants, I don't see any team offering Bonds the opportunity to make $20M next year. If GM Brian Sabean has his way, San Francisco might not even be in the running for his services. However, owner Peter Magowan may give Bonds a chance to reach 3,000 hits by accommodating him for one more season unless he is indicted on tax evasion and perjury charges when the grand jury reconvenes later this month.
Kosuke Fukudome, who has played his entire career with the Chunichi Dragons in Japan, will be an unrestricted free agent not subject to the posting process. Nicknamed the Dome, the reigning Central League MVP has line-drive power, good on-base skills, and a strong arm. Mike Plugh at Baseball Prospectus has a more complete list of potential free agents and posting candidates from Japan.
Be sure to check back tomorrow for a discussion of the free agent pitchers about to hit the market.
Sources: Cot's Baseball Contracts and Baseball-Reference.com Play Index.