Rich Lederer • Baseball Beat
Patrick Sullivan • Change-Up
Jeremy Greenhouse • Touching Bases
Dave Allen • F/X Visualizations
Sky Andrecheck • Behind the Scoreboard
Marc Hulet • Around the Minors
Al Doyle • Past Times
Retired Uniforms:
Bryan Smith • WTNY
Joe Sheehan • Command Post
Jeff Albert • The Batter's Eye
RSS Feed
Home
*Examining the Past, Present, and Future*
Lineup Card
Recent Entries
» Putting Together a Reality Team
» Historical Hall of Fame Vote Comparisons: 2012
» An All-Christmas Team
» The New-Look Angels
» John Denny: The Forgotten Cy Young Award Winner
» Money Isn't Everything
» What Would It Take to Hit .400 in the 21st Century?
» Halos Heaven
» Brandon McCarthy's Breakout Season
» Link-o-Rama
» Historical Hall of Fame Vote Comparisons: 2012
» An All-Christmas Team
» The New-Look Angels
» John Denny: The Forgotten Cy Young Award Winner
» Money Isn't Everything
» What Would It Take to Hit .400 in the 21st Century?
» Halos Heaven
» Brandon McCarthy's Breakout Season
» Link-o-Rama
Best of Baseball Beat
Abstracts From the Abstracts
1977 Baseball Abstract
1978 Baseball Abstract
1979 Baseball Abstract
1980 Baseball Abstract
1981 Baseball Abstract
1982 Baseball Abstract
1983 Baseball Abstract
1984 Baseball Abstract
1985 Baseball Abstract
1986 Baseball Abstract
1987 Baseball Abstract
1988 Baseball Abstract
1978 Baseball Abstract
1979 Baseball Abstract
1980 Baseball Abstract
1981 Baseball Abstract
1982 Baseball Abstract
1983 Baseball Abstract
1984 Baseball Abstract
1985 Baseball Abstract
1986 Baseball Abstract
1987 Baseball Abstract
1988 Baseball Abstract
Bert Blyleven Series
Meeting Up and Hanging Out with Bert
The Results Are In And...
Aficionado Heavily Invested in Blyleven
Latest on Blyleven's Chances for the HOF
The Internet Zealot Responds
400 Down and 5 to Go...
Bert Be Home By Eleven?
Blyleven's Forgotten Season (1973)
HeyMan, Your Comments Don't Hold Water
The Waiting is the Hardest Part
Another Addition to the Blyleven Series
Search for the Truth
As Dominant as His HOF Contemporaries
Listen, Buster
A Larger Step for Blyleven
Answering the Naysayers (Part Two)
Another Small Step for Blyleven
Q&A: Blyleven on the Twins
The Majority Rules, Right?
It's All Dutch to Some
The Hall of Fame Case for Bert Blyleven
Q&A: Blyleven on Felix Hernandez
Clemens Rocketing Up Charts
Poz: An Interview With a KC Star
A HOF Chat with Tracy Ringolsby
Up Close and Personal
A Peek Into the Mind of a HOF Voter
Answering the Naysayers
It's That Time of the Year (Again)
"If Cooperstown is Calling..."
The Bert Alert
One Small Step for Blyleven...
Only the Lonely
Exclusive Interviews
Lee Sinins
Alex Belth
David Pinto
Will Carroll
Mike Carminati
Aaron Gleeman
Joe Sheehan
Jay Jaffe
Jeff Peek
Tracy Ringolsby
Joe Posnanski
Bill James Part I, II, III
Jon Lalonde
Chuck Tiffany
Dayn Perry
Fay Vincent
Nate Silver
Alex Belth
David Pinto
Will Carroll
Mike Carminati
Aaron Gleeman
Joe Sheehan
Jay Jaffe
Jeff Peek
Tracy Ringolsby
Joe Posnanski
Bill James Part I, II, III
Jon Lalonde
Chuck Tiffany
Dayn Perry
Fay Vincent
Nate Silver
Bullpen
Rich Lederer
The Odd Couple (with Alex Belth)
The MostUnder Over Underrated Player in Baseball (with Brian Gunn)
Three Wise Men (roundtable by Alex Belth)
Infrequently Asked Questions (interview with Matt Welch)
Interview (Orioles Think Tank)
Bernie and the Yanks (Bronx Banter)
Hope and Faith: How the LAA Win the World Series (Baseball Prospectus)
NL West (The Soul of Baseball)
Greatest Living Hitter? (Sports Illustrated)
Roundtable: 2008 HOF Ballot (Armchair GM)
The Most
Three Wise Men (roundtable by Alex Belth)
Infrequently Asked Questions (interview with Matt Welch)
Interview (Orioles Think Tank)
Bernie and the Yanks (Bronx Banter)
Hope and Faith: How the LAA Win the World Series (Baseball Prospectus)
NL West (The Soul of Baseball)
Greatest Living Hitter? (Sports Illustrated)
Roundtable: 2008 HOF Ballot (Armchair GM)
Patrick Sullivan
Designated Hitters
David Bromberg (Q&A: John Denny)
Mark Armour (H. Killebrew and Versatility)
Joe Lederer (Soundtrack of a Prospect)
David Bromberg (Clemente's Autograph)
David Bromberg (Woody Fryman)
D. Baumstein (WAR Against Age: Pitchers)
Doug Baumstein (The WAR Against Age)
Doug Baumstein (A Lifetime on the Road)
John Fraser (Pick Six)
Mark Armour (How to Score More Runs?)
Bill Parker (What Opening Day Tells Us)
Stan Opdyke (Pat Rispole)
Chris Jaffe (Evaluating Baseball's Mgrs)
Stan Opdyke (Baseball Radio in NYC, 1953)
A. Nathan (Performance of Baseball Bats)
Michael Weddell (Edgar Martinez/HOF)
Jon Weisman (100 Things Dodgers Fans...)
Stan Opdyke (Connie Mack and Vin Scully)
Eric Walker (Evaluating Run Production)
Brent Mayne (The Intangibles of Catching)
Chris Moore (Best Fastballs in Baseball)
Dave Baldwin (The Batter’s Brain)
Shawn Haviland (Ivy League to MLB)
Larry Granillo (Walking Off)
Rob Iracane (Solo HR Won't Break You)
Tommy Bennett (Charm of AM Radio)
Harry Pavlidis (Johan Santana's Fast Start)
John Walsh (WAR and Remembrance)
Eric Walker (Precisely Inaccurate)
Bob Timmermann (As They See 'Em)
Geoff Young (Unicycles and Delusions)
Baseball Analysis at Tufts (Groundballers)
Baseball Analysis at Tufts (GB Out Rates)
G. Rybarczyk ('09 Hit Tracker Projections)
Joe Lederer (Curt Schilling/HoF)
Conor Gallagher (Hall of Fallacies)
Chris Green (Jim Rice, HoF, the Numbers)
Shawn Hoffman (Baseball's Bear Mkt?)
Paul Anthony (Manny Syndrome)
Ross Roley (World Series Odds)
B. Timmermann (Catcher's Interference)
R.J. Anderson (Waiting the Hardest Part)
Maury Brown (Cubs, MLB, and Cuban...)
Myron Logan (Dee-Fense, Dee-Fense)
Craig Calcaterra (Frivolity, Part I, Part II)
Chad Finn (Ode to Baseball Cards)
David Cameron (Mariners Foibles)
Chris Dial (Chipper Jones)
Pat Lederer (Memory Lane)
David Appelman (Clutch Pitching)
Bob Rittner (DH)
Jonathan Mayo (Roger Clemens)
Lisa Winston (My Son-in-Law...)
Russ McQueen (The Yellow Hammer)
Bob Rittner (I'm OK, You're OK)
Mark Armour (In Defense of the HOF)
Pat Jordan (Friends)
Dan Levitt (Analysis of Terry Ryan)
Doug Baumstein (Trading Econ 101)
Ross Roley (Runner's Reluctance II)
Ross Roley (Runner's Reluctance I)
Mark Armour (No-Longer Lovable Sox)
Bruce Regal (Stealthy and Wise)
Brian Gunn (Roid Monster)
Current/McEvoy (Value of the SB)
John Rickert (Sinister Thefts)
Nate Silver (Sabermetrics)
David Vincent (Home Run Production)
Joe P. Sheehan (Enhanced Gameday II)
Mark Armour (An Ode to Sport)
David Gassko (All-Time Worm Burners)
Joe P. Sheehan (Enhanced Gameday)
John Walsh (When Titans Clash)
Fox/Williams (Quantifying Coaches II)
Fox/Williams (Quantifying Coaches I)
Jacob Luft (Bull Durham Rant)
Chad Finn (Strat-O-Matic)
Lisa Winston (Rotisserie Baseball)
Dave Studeman (Baseball Stats)
Steve Treder (Roger Craig)
Marc Normandin (Jeff Bagwell)
D. Appelman (Expanding Strike Zone)
Jeff Sackmann (Worst MiL Defenders)
Jeff Sackmann (Best MiL Defenders)
Maxwell Kates (Van Lingle Mungo)
David Appelman (Pitch Location)
Kent Bonham (Danny Ray Herrera)
Glenn Stout (Two Baseball Poems)
Bruce Regal (The Challenge Round)
Mark Lamster (Barry & Ty)
Geoff Young (NL West)
Tom Lederer (The Ryan Express)
Brian Erts (Great Leap Forward)
David Pinto (Parity and the N.L.)
Jacob Luft (Fathers and Daughters)
Jamey Newberg (Pete's Sake)
Jeff Albert (A. Jones Swing Analysis)
Jeff Albert (A-Rod Swing Analysis)
Keith Law (Death, Taxes, and Waivers)
Peter Abraham (Tales of Torre Tales)
Larry Borowsky (Let 'er Rip II)
Dan Levitt (Empirical Analysis of Bunting)
Jonah Keri (If I Met Warren Cromartie...)
Bob Klapisch (War Stories)
Bob Timmermann (John F. Kennedy HS)
Kent Bonham (Aluminum Adjustments)
Al Doyle (More Than Superstars)
Ross Roley (Instant Replay)
David Vincent (Barry Bonds Homers)
Chad Finn (Our Favorite Obscurities)
Bill Deane (1979 NL MVP)
Mark Armour (Rise/Fall of Artificial Turf)
Jeff Angus (Wally Moon Camp)
David Berri (Money and Baseball)
Larry Borowsky (Baseball w/o the #s)
Derek Zumsteg (The Irrational Market)
David Regan (Free Agent Contracts)
Peter Schmuck (Steroids and the HOF)
David Appelman (Pitchers, Pitch by Pitch)
Dan Fox (Swinging, Taking, Fouling, Etc)
Patrick Sullivan (Study of NYY CF/BOS LF)
Will Leitch (Baseball Journalism)
Jeff Sullivan (Pitcher Release Points)
Steve Treder ('69-'70 Giants)
Maury Brown (Charlie Finley)
John Brattain (Bob Johnson)
Bob Klapisch (The Case for Bert Blyleven)
Jeff Peek (Pride and Prejudice)
Dayn Perry (Bert and Warren)
Rob Neyer (If Don Sutton Was Great...)
Lisa Winston (Minor League Memories)
Alex Belth (Otis Redding Was Right)
David Cameron (Long Live the King)
Jeff Angus (Baserunning Study)
Bert Blyleven (Baseball Playoffs)
Boyd Nation (Not a Prospect List)
James Click (Batters-Baserunners Study)
Jeff Shaw (Why I Love Baseball)
David Gassko (BIP/BFP Fielding Study)
Jay Jaffe (Milwaukee Sausage Race)
Jamey Newberg (Remember When)
Bob Klapisch (Press Box to the Mound)
Dan Levitt (Predictive Value of BB)
David Vincent (Official Scorer)
Jon Weisman (Rick Monday)
Larry Borowsky (Let 'er Rip)
Will Carroll (Fictional Short Story)
Bob Timmermann (Japanese Baseball)
Cyril Morong (Best Pitching Seasons)
Sean Forman (Monte Carlo Win-Loss)
Brian Gunn (My Little Blue Book)
Joe Lederer (My Dad and Baseball)
Bill Deane (Bob Gibson, 1968)
Mark Armour (1977 Yankees)
Darren Viola (Retrosheet)
David Pinto (RFK)
Dayn Perry (Brave Heart)
Matt Welch (Dave Hansen)
Kevin Kernan (Jack McKeon)
Tom Lederer (Dodgers Road Trip)
Steve Lombardi (Slider)
Studes (Picturing Baseball)
Mike Carminati (Luck of the Drawl)
Eric Neel (Vin Scully)
J.C. Bradbury (Leo Mazzone)
John Sickels (Bill James)
Search Baseball Analysts
Archives
By Category:
Around the Majors Content Only
Around the Minors Content Only
Baseball Beat Content Only
Baseball Beat/Change-Up Content Only
Baseball Beat/WTNY Content Only
Behind the Scoreboard Content Only
Change-Up Content Only
Change-Up/Around the Majors Content Only
Command Post Content Only
Crunching the Numbers Content Only
Designated Hitter Content Only
F/X Visualizations Content Only
Past Times Content Only
Saber Talk Content Only
The Batter's Eye Content Only
Touching Bases Content Only
Weekend Blog Content Only
WTNY Content Only
By Month:
February 2012
January 2012
December 2011
October 2011
September 2011
August 2011
July 2011
June 2011
May 2011
April 2011
March 2011
February 2011
January 2011
December 2010
November 2010
October 2010
September 2010
August 2010
July 2010
June 2010
May 2010
April 2010
March 2010
February 2010
January 2010
December 2009
November 2009
October 2009
September 2009
August 2009
July 2009
June 2009
May 2009
April 2009
March 2009
February 2009
January 2009
December 2008
November 2008
October 2008
September 2008
August 2008
July 2008
June 2008
May 2008
April 2008
March 2008
February 2008
January 2008
December 2007
November 2007
October 2007
September 2007
August 2007
July 2007
June 2007
May 2007
April 2007
March 2007
February 2007
January 2007
December 2006
November 2006
October 2006
September 2006
August 2006
July 2006
June 2006
May 2006
April 2006
March 2006
February 2006
January 2006
December 2005
November 2005
October 2005
September 2005
August 2005
July 2005
June 2005
May 2005
April 2005
March 2005
February 2005
January 2005
December 2004
November 2004
October 2004
September 2004
August 2004
July 2004
June 2004
May 2004
April 2004
March 2004
February 2004
January 2004
December 2003
November 2003
October 2003
September 2003
August 2003
July 2003
June 2003
Reference
Organizational Stats
Arizona Diamondbacks Bat / Pitch
Atlanta Braves Bat / Pitch
Baltimore Orioles Bat / Pitch
Boston Red Sox Bat / Pitch
Chicago Cubs Bat / Pitch
Chicago White Sox Bat / Pitch
Cincinnati Reds Bat / Pitch
Cleveland Indians Bat / Pitch
Colorado Rockies Bat / Pitch
Detroit Tigers Bat / Pitch
Florida Marlins Bat / Pitch
Houston Astros Bat / Pitch
Kansas City Royals Bat / Pitch
Los Angeles Angels Bat / Pitch
Los Angeles Dodgers Bat / Pitch
Milwaukee Brewers Bat / Pitch
Minnesota Twins Bat / Pitch
New York Mets Bat / Pitch
New York Yankees Bat / Pitch
Oakland Athletics Bat / Pitch
Philadelphia Phillies Bat / Pitch
Pittsburgh Pirates Bat / Pitch
St. Louis Cardinals Bat / Pitch
San Diego Padres Bat / Pitch
San Francisco Giants Bat / Pitch
Seattle Mariners Bat / Pitch
Tampa Bay Devil Rays Bat / Pitch
Texas Rangers Bat / Pitch
Toronto Blue Jays Bat / Pitch
Washington Nationals Bat / Pitch
All-Star Links
Official Websites
News and Notes
Baseball News Blog
Baseball Newstand
ESPN Baseball
Fox Sports Baseball
Pro Sports Daily
Roto World
The Roto Times
USA Today Baseball
Baseball Newstand
ESPN Baseball
Fox Sports Baseball
Pro Sports Daily
Roto World
The Roto Times
USA Today Baseball
Reference and Analysis
Baseball Almanac
Baseball America
Baseball Archive
Baseball Contracts
Baseball Cube
Baseball Graphs
Baseball Library
Baseball Musings Player Database
Baseball Page
Baseball Primer
Baseball Prospectus
Baseball Reference
Baseball Statistics
Baseball Truth
Boxscore Central
Diamond Mind Baseball
Doug's Stats
FanGraphs
Fast Balls (pitchfx catalog)
Hardball Dollars
Hardball Times
Hit Tracker
Retrosheet
Rotobase/Rotoblog
Stat Corner
STATS
Tango on Baseball
Yahoo Sports MLB
Web Gems
Bill James Primer
Sabermetric Manifesto (Grabiner)
Pitching and Defense (McCracken)
Pitching and Defense (Tippett)
Transactions Primer (Neyer)
Baseball Stats (Batter's Box)
Prospect Report (Cameron)
Pitcher Workloads (Sheehan)
Goodbye to Old Baseball Ideas (Rickey)
Sabermetric Manifesto (Grabiner)
Pitching and Defense (McCracken)
Pitching and Defense (Tippett)
Transactions Primer (Neyer)
Baseball Stats (Batter's Box)
Prospect Report (Cameron)
Pitcher Workloads (Sheehan)
Goodbye to Old Baseball Ideas (Rickey)
Columnists
Baseball Blogs
Around the Majors
Athletics Nation
Baseball Crank
Baseball Musings
Baseball-Reference Blog
Batter's Box
Big League Stew
Bronx Banter
Catfish Stew
Cub Town
Dan Agonistes
Dodger Thoughts
DRays Bay
Ducksnorts
Futility Infielder
Halos Heaven
Inside the Rockies
It Might Be Dangerous
Knuckle Curve
LoHud Yankees Blog
Lookout Landing
Management by Baseball
Metaforian
Metsgeek
Mike's Baseball Rants
Only Baseball Matters
Redbird Nation
Red Reporter
Sabernomics (Braves)
Seth Speaks
ShysterBall
6-4-2 (Angels/Dodgers)
The Book
TheCubdom
The Cutting Edge
The House That Dewey Built
The View From The Bleachers
Tiger Blog
U.S.S. Mariner
Viva El Birdos
Where's Kernan
Minor Leagues
Arizona Fall League
BA Player Finder
Cal Leaguers
Jamey Newberg
JDM's Scoresheet Baseball
Minor League Baseball
Minor League Park Factors
Minor League Splits
No Pepper
Sickels' Minor League Ball
Warm October Nights
BA Player Finder
Cal Leaguers
Jamey Newberg
JDM's Scoresheet Baseball
Minor League Baseball
Minor League Park Factors
Minor League Splits
No Pepper
Sickels' Minor League Ball
Warm October Nights
Amateur
Boyd's World (College)
Cape Cod Baseball League
College Baseball Blog
College Baseball Insider
Collegiate Baseball Newspaper
College Splits
College Splits Blog
Dirtbags Baseball (Long Beach State)
NCAA Baseball
NCBWA
Team One Baseball (High School)
Texas A&M & Baseball
Cape Cod Baseball League
College Baseball Blog
College Baseball Insider
Collegiate Baseball Newspaper
College Splits
College Splits Blog
Dirtbags Baseball (Long Beach State)
NCAA Baseball
NCBWA
Team One Baseball (High School)
Texas A&M & Baseball
Historical
Cuban Baseball
House of David
Jim "Mudcat" Grant's Web Page
Negro League Baseball Players Assoc
Negro Leagues Baseball Museum
1919 Black Sox
Pacific Coast League
Philadelphia Athletics Historical Society
Shoeless Joe Jackson Society
SABR-L Archives
Walter O'Malley
House of David
Jim "Mudcat" Grant's Web Page
Negro League Baseball Players Assoc
Negro Leagues Baseball Museum
1919 Black Sox
Pacific Coast League
Philadelphia Athletics Historical Society
Shoeless Joe Jackson Society
SABR-L Archives
Walter O'Malley
Miscellaneous
Forums
Credits
Ticket Center
Tickets to Baseball -
Premium Red Sox Tickets - Tickets to Marlins Games - Cardinals Game Tickets - NY Yankee Tickets - Tickets Oakland Athletics - Dallas Cowboys Tickets - Arizona Cardinals Tickets - Tickets Seattle Seahawks - Buffalo Bills Tickets Online - Tickets to Dolphins Football
Buy Boston Red Sox tickets,
Philadelphia Phillies tix,
NY Yankees tickets,
NY Mets tickets, and
MLB All Star game tickets at ABC tickets
Not sure where to find the best online sportsbooks? Start your search with PlayersJet.
Get deals at SportsMemorabilia.com on baseball apparel, including Phillies jerseys and more for adults and children.
Shop the largest selection baseball equipment on sale at Sports Unlimited. Check out tons of baseball gloves, youth baseball gloves and catchers gear from Rawlings, Wilson, Nike & Under Armour.
2011 Draft Order
Courtesy of Baseball America
First-Round:
 1. Pirates (57-105)
 2. Mariners (61-101)
 3. Diamondbacks (65-97)
 4. Orioles (66-96)
 5. Royals (67-95)
 6. Nationals (69-93)
 7. Diamondbacks (for B. Loux)
 8. Indians (69-93)
 9. Cubs (75-87)
10. Padres (for Karsten Whitson)
11. Astros (76-86)
12. Brewers (77-85)
13. Mets (79-83)
14. Marlins (80-82)
15. Brewers (for Dylan Covey)
16. Dodgers (80-82)
17. Angels (80-82)
18. Athletics (81-81)
19. Red Sox (from DET for Martinez)
20. Rockies (83-79)
21. Blue Jays (85-77)
22. Cardinals (86-76)
23. Nationals (from CWS for Dunn)
24. Rays (from BOS for Crawford)
25. Padres (90-72)
26. Red Sox (from TEX for Beltre)
27. Reds (91-71)
28. Braves (91-71)
29. Giants (92-70)
30. Twins (94-68)
31. Rays (from NYY for Soriano)
32. Rays (96-66)
33. Rangers (from PHI for Lee)
Supplemental First Round:
34. Nationals (Dunn)
35. Blue Jays (Downs)
36. Red Sox (Martinez)
37. Rangers (Lee)
38. Rays (Crawford)
39. Phillies (Werth)
40. Red Sox (Beltre)
41. Rays (Soriano)
42. Rays (Balfour)
43. Diamondbacks (LaRoche)
44. Mets (Feliciano)
45. Rockies (Dotel)
46. Blue Jays (Buck)
47. White Sox (Putz)
48. Padres (Garland)
49. Giants (Uribe)
50. Twins (Hudson)
51. Yankees (Vazquez)
52. Rays (Benoit)
53. Blue Jays (Olivo)
54. Padres (Torrealba)
55. Twins (Crain)
56. Rays (Choate)
57. Blue Jays (Gregg)
58. Padres (Correia)
59. Rays (Hawpe)
| Baseball Beat | September 28, 2010 |
Paying Attention to the Other Races in the Final Week
Although interest in batting average, home runs, and runs batted in has waned over the past decade as more advanced metrics have emerged, these statistics are far from obsolete. Not only are AVG, HR, and RBI still the three most commonly cited stats involving hitters on radio/TV and in newsprint, but they were even played up in the new media in late August and early September as so-called statheads wrote about the possibilities of a Triple Crown winner this year.
While not as prestigious as winning the Triple Crown, there are a couple of players who are on the verge of setting "records" with respect to these stats. Specifically, if Carlos Pena and Mark Reynolds wind up hitting under .200, one or both will have the dubious distinction of hitting the most home runs or driving in the most runs in a season with a batting average below the Mendoza Line.
Going into tonight's play, Pena is hitting .198 with 27 HR and 81 RBI. Reynolds has outdone Pena slightly, hitting .199 with 32 HR and 84 RBI. Prior to this year, no player has ever accumulated more than 29 HR or 64 RBI while "hitting" under .200.
Let's take a look at where Pena and Reynolds stand in HR and RBI among those failing to crack the .200 mark.
Here are the leaders, if you will, in HR:
MAJOR LEAGUE BASEBALL
HOMERUNS                      YEAR       HR      AVG
1    Mark Reynolds            2010       32     .199
2    Mark McGwire             2001       29     .187
3    Carlos Pena              2010       27     .198
4    Rob Deer                 1991       25     .179
5    Ruben Rivera             1999       23     .195
6    Mike Schmidt             1973       18     .196
7    Steve Balboni            1990       17     .192
T8   Gorman Thomas            1986       16     .187
T8   Shane Andrews            1999       16     .195
T8   Tim Laudner              1987       16     .191
AMERICAN LEAGUE
HOMERUNS                      YEAR       HR      AVG
1    Carlos Pena              2010       27     .198
2    Rob Deer                 1991       25     .179
3    Steve Balboni            1990       17     .192
T4   Tim Laudner              1987       16     .191
T4   Gorman Thomas            1986       16     .187
6    Dean Palmer              1991       15     .187
T7   Reggie Jackson           1983       14     .194
T7   Harmon Killebrew         1975       14     .199
T9   Eric Soderholm           1972       13     .188
T9   Roger Repoz              1971       13     .199
T9   Deron Johnson            1974       13     .171
NATIONAL LEAGUE
HOMERUNS                      YEAR       HR      AVG
1    Mark Reynolds            2010       32     .199
2    Mark McGwire             2001       29     .187
3    Ruben Rivera             1999       23     .195
4    Mike Schmidt             1973       18     .196
5    Shane Andrews            1999       16     .195
6    Dave Kingman             1983       13     .198
T7   Darren Daulton           1991       12     .196
T7   Todd Hundley             2001       12     .187
T7   Bob Tillman              1969       12     .195
T7   Bob Robertson            1972       12     .193
And now RBI:
MAJOR LEAGUE BASEBALL
RBI                           YEAR      RBI      AVG
1    Mark Reynolds            2010       84     .199
2    Carlos Pena              2010       81     .198
T3   Mark McGwire             2001       64     .187
T3   Rob Deer                 1991       64     .179
5    Harry Lyons              1888       63     .194
6    Pedro Garcia             1974       54     .199
7    Coco Laboy               1970       53     .199
T8   Tom Tresh                1968       52     .195
T8   Mike Schmidt             1973       52     .196
10   Shane Andrews            1999       51     .195
AMERICAN LEAGUE
RBI                           YEAR      RBI      AVG
1    Carlos Pena              2010       81     .198
2    Rob Deer                 1991       64     .179
3    Pedro Garcia             1974       54     .199
4    Tom Tresh                1968       52     .195
5    Reggie Jackson           1983       49     .194
T6   John Gochnauer           1903       48     .185
T6   Todd Cruz                1983       48     .199
T8   Ed Kirkpatrick           1966       44     .192
T8   Harmon Killebrew         1975       44     .199
T10  Deron Johnson            1974       43     .171
T10  Tim Laudner              1987       43     .191
NATIONAL LEAGUE
RBI                           YEAR      RBI      AVG
1    Mark Reynolds            2010       84     .199
2    Mark McGwire             2001       64     .187
3    Coco Laboy               1970       53     .199
4    Mike Schmidt             1973       52     .196
5    Shane Andrews            1999       51     .195
6    Ruben Rivera             1999       48     .195
7    Germany Smith            1890       47     .191
8    Nick Esasky              1984       45     .193
9    Monte Cross              1901       44     .197
10   Darren Daulton           1991       42     .196
Three Hall of Famers grace these lists: Reggie Jackson, Harmon Killebrew, and Mike Schmidt. Jackson was on his way down, Schmidt was on his way up, and Killebrew accomplished this feat in his last season. Mark McGwire knew it was time to go when he hit .187 while clubbing 29 HR in his farewell campaign in 2001. Dave Kingman, he of 442 career home runs (the fifth-most of any hitter on these lists), hit .198 with 13 HR in 1983 before jacking at least 30 dingers in each of his final three seasons.
While far short of Jackson (139 OPS+), Killebrew (143), Schmidt (147), and McGwire (162), the 32-year-old Pena (123) is producing at a higher clip than all of the other hitters listed above, including Kingman (115) and Gorman Thomas (114).
Reynolds (108), on the other hand, appears to be heading down the path of Rob Deer (109) and fellow third baseman Dean Palmer (107), who flamed out after his age-31 season. The 27-year old may not be long for a starting assignment in the majors if he continues to strike out over 200 times per season without Gold Glove-caliber fielding or a batting average on balls in play (BABIP) that rivals his 2007-2009 mark of .343 (vs. .255 in 2010). Meanwhile, Reynolds is a cinch to become "the first regular player to strike out more times in a season than his batting average." In his defense, you have to be pretty good — or perhaps have been good — to even set such records.
While your friends are paying attention to the New York Yankees and Tampa Bay Rays or the San Francisco Giants and the San Diego Padres, make sure you don't forget about the triumphs of Carlos Pena and Mark Reynolds.
Note: Thanks to Lee Sinins and his Complete Baseball Encyclopedia for the lists.
| Change-Up | September 24, 2010 |
The Streaking O's
Last year, I wrote about how the Baltimore Orioles could be on the cusp of something special. Then, this year, I wrote about how I was so wrong about the Baltimore Orioles and how it was really the Toronto Blue Jays that were the team flying under the radar. I even mocked myself for being so wrong on Baltimore.
I wish I had hung in there with the Orioles but who could have blamed me? The Orioles were awful, almost historically so. When play ended on Sunday, August 1st, Baltimore was sporting a record of 32-73 and were 34.5 games back of first place. That’s a 49-win pace and, playing games in baseball’s most competitive division, there seemed little hope that they could turn things around.
The dismal first 105 games was a top-to-bottom group effort. Let’s start with the job Andy MacPhail did last off-season. His three most high-profile moves were to bring in free agents Garrett Atkins and Mike Gonzalez, and to trade for veteran right-hander Kevin Millwood. Atkins hit .214/.276/.286 and was released on July 6th. Gonzalez has earned nearly $275,000 for each inning pitched, which might be OK if he were Mariano Rivera. But he’s Mike Gonzalez, and through August 1st he had a 5.40 ERA in just nine appearances. He stunk, and couldn’t stay healthy. As for Millwood, he’s pitched ok at times but that 3-16 record while blocking other potential Big League- ready arms has hardly served the team’s interests. Finally, presumably because he looked down at his roster before Opening Day and noticed Cesar Izturis (65 career OPS+) was his shortstop, MacPhail added Julio Lugo for depth. In 253 plate appearances, Lugo has 6 extra-base hits and 14 walks.
A group of youngsters expected to develop into legitimate Big League contributors share culpability as well. Brian Matusz, Jake Arrieta and Brad Bergesen all struggled through August 1st. One time uber-prospect Chris Tillman has yet to show that he can be effective in the Majors, and Koji Uehara missed much of the year with injury troubles. Offensively, Nolan Reimold backed up his breakout 2009 with a .210/.289/.350 start and a season-ending achilles injury. Matt Wieters continued to disappoint. Josh Bell, the player so many praised MacPhail for prying away from Ned Colletti in exchange for George Sherrill, has floundered in 151 plate appearances. It looks like even if the veterans had performed for the Orioles, those of us who were bullish on them last season were a year or two early on the youngsters.
But the veterans own the mess that is (was) 2010, too. Ty Wigginton has managed just a .318 on-base. Brian Roberts, through August 1st (last day of the Juan Samuel era), was at .250/.313/.318. Miguel Tejada never even looked interested, hitting .269/.308/.362 before being shipped off to San Diego. Adam Jones had a .306 on-base on August 1st. Nick Markakis hit .303/.384/.488 in his 23 and 24-year old seasons. He’s hit .292/.356/.438 in his 25 and 26 seasons. Through August 1st, his first 132 innings, staff “ace” Jeremy Guthrie was 4-11 with a 4.23 ERA.
It’s well outside of my expertise to understand the impact a Manager has on a ball club, but here are the facts as they relate to Baltimore in 2010. Dave Trembley started the year 15-39. Juan Samuel, with the interim reins, went 17-34. Buck Showalter, since taking over on August 3rd, is 28-19. That 49-win pace now looks more like 65-67 wins. 49 wins is no-man’s land but heck, the 2007 Rays won 66 before reaching the World Series in 2008. Last year's San Diego Padres went 23-13 over their last 36 games, and their success has carried over into 2010. Everything has changed in Baltimore. Just look at some of the performances below:
| Pre-Buck | Post-Buck | |
|---|---|---|
| A. Jones | .272/.306/.434 | .328/.396/.500 |
| M. Wieters | .246/.322/.370 | .271/.336/.421 |
| B. Roberts | .250/.313/.318 | .293/.372/.425 |
And for the pitchers, the two numbers presented below are K/BB and then ERA.
| Pre-Buck | Post-Buck | |
|---|---|---|
| B. Matusz | 1.94, 5.46 | 2.92, 2.97 |
| J. Arrieta | 0.76, 5.47 | 1.80, 3.78 |
| B. Bergesen | 1.33, 6.63 | 1.94, 2.29 |
| J. Guthrie | 2.00, 4.23 | 2.77, 3.29 |
| Baltimore Orioles | 1.71, 5.18 | 2.27, 3.59 |
There have been other exciting developments, too. Uehara has emerged as a potential shut-down reliever with just five walks in 39 innings pitched and Luke Scott has OPS'd over .900, for instance.
The Orioles have been the AL East's best team for 45 games or so, and with a young pitching nucleus returning and Andy MacPhail's stated commitment to beefing up the offense this off-season, the O's may yet be interesting in 2011. I am reluctant to say more than that given the competitiveness of the division and my own checkered history forecasting Orioles success. But Showalter's aboard, the youngsters are coming along and the veterans are performing the way they're supposed to. From there, you'll have to draw your own conclusions.
| Touching Bases | September 23, 2010 |
Pitching vs. Pitchers
Somehow I got it in my mind that Vicente Padilla was the villain of baseball. Opponents hate him and teammates hate him even more. I'm not really sure how the idea got implanted in there (inception?), but it did, and I began to envision games in which Padilla simply exchanged beanballs with the opposing pitcher. This would go on until Joe Torre brought in Scott Proctor to relieve.
In fact, Padilla has been hit by a pitch once since 2004 and hasn't hit any opposing pitcher, although he does have one of the highest overall HBP rates of all-time. I started thinking whether any pitchers are prone to hitting other pitchers or getting hit themselves and the answer is no. Sure, big fat Joe Blanton has been hit twice this year, but that's only because he's big and fat. Kind of like Padilla. And Chris Volstad has hit three pitchers while having faced 131, which is rather impressive when you think about it. But he's never been hit himself. Unfortunately, I didn't find any evidence of pitcher's retaliating against each other. Still, I had the data, so I looked into how some approach pitching vs. pitchers
Again, I had envisioned Padilla breaking out his eephus pitch against other pitchers and embarrassing them, which would result in nobody throwing him any fastballs. Not the case. To think that there's some "I throw you fastballs, you throw me fastballs" code is rather silly. There's no correlation between throwing fastballs against pitchers and receiving them in return. It's more a matter of good hitting pitchers like CC Sabathia, Dontrelle Willis, Yovani Gallardo, Micah Owings, Mike Leake, Adam Wainwright, and Carlos Zambrano who receive a fair amount of breaking stuff. And for some reason pitchers like throwing Brad Penny junk, even though he can't hit. Jhoulys Chacin is one guy who has proven inept enough with the bat to be fed nothing but fastballs.
Cliff Lee is an interesting case. He's thrown over 100 offerings to pitchers, and all but 2% were fastballs. Furthermore, his fastballs against pitchers have been clocked one mile per hour faster than against regular batters. That means that he's probably not even throwing his cutter against pitchers, but instead only throwing his straight fastballs for easy strikes. The thing is, he's only been average against pitchers, and he's been Cliff Lee against everyone else.
Lee is an exception as a guy who throws his fastball harder against pitchers than others, which might only be the case because I'm including his cut fastballs, which skew the data. Only 10% of pitchers recorded higher fastball velocities against pitchers than otherwise. Roy Halladay has treated pitchers and non-pitchers most evenly. Andrew Miller, Javier Vazquez, Homer Bailey, Felipe Paulino, and Edinson Volquez all ease up a lot on their fastballs when facing pitchers.
Even fewer—under 5%—throw a higher rate of fastballs against pitchers than against non-pitchers, and Andrew Miller is the biggest oddity in that regard. I suppose a bigger enigma surrounding Miller is why he's still pitching in the Majors.
Although Lee throws the highest rate of fastballs against pitchers, that isn't especially exceptional, considering his already high usage of fastballs against everyone (75-80%). Knuckleballer R.A. Dickey throwing nearly half fastballs against pitchers might be the biggest change in approach of any pitcher. I was surprised to learn that Jorge De La Rosa, trusts his fastball 93-plus mile per hour enough to throw to pitchers, dealing it 85% of the time, but in normal situations, he throws it only 59% of the time. Other notable pitchers who throw more fastballs while facing their counterparts: Rich Harden, Edwin Jackson, Edinson Volquez, Pedro Martinez, Ian Kennedy, Ted Lilly, Chris Carpenter, Tim Lincecum.
James McDonald has allowed a .375 OBP against pitchers in his career.
| Baseball Beat | September 20, 2010 |
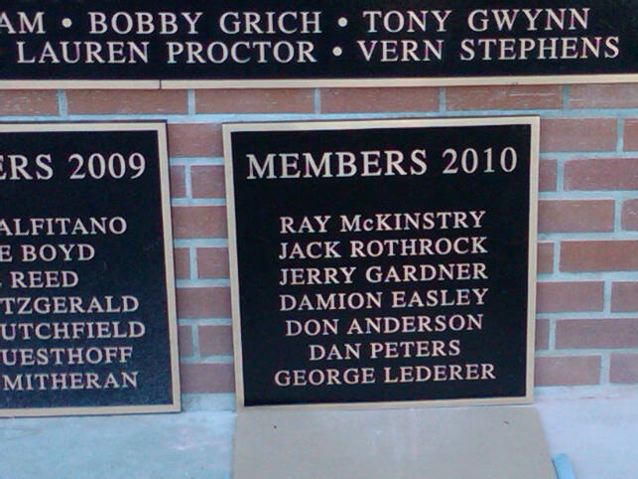
Hall of Fame Sportswriter and Dad
George Lederer, affectionately known to me as Dad, was one of seven members inducted into the Long Beach Baseball Hall of Fame on Saturday. The city's HOF was created in 2004 and the inaugural class included a couple of Cooperstown selections in Bob Lemon and Tony Gwynn as well as Bob Bailey, Jeff Burroughs, Ron Fairly, Bobby Grich, Vern Stephens, and several coaches and scouts.
 Including the class of 2010, there are now 57 honorees, 31 of whom have played in the major leagues. The list excludes such notables as Long Beach Poly's Chase Utley and former Long Beach State All-Americans, first-round draft picks, and MLB stars Bobby Crosby, Evan Longoria, Troy Tulowitzki, and Jered Weaver. This quintet will no doubt be elected shortly after their playing days are over.
Five members were added to the Long Beach Softball Hall of Fame, a group that now totals 53, many of whom have also been inducted into the International Softball Congress HOF. The Long Beach Nitehawks won ten men's World Championships during the 1950s, 1960s, and 1970s, the heyday of men's fast-pitch softball.
The ceremony was held at Blair Field and across the way at what is now known as Red Meairs Field at Joe Rodgers Stadium. There were a number of previous inductees in attendance, including former major leaguers Joe Amalfitano and Dave Frost, scouts Bob Harrison and Harry Minor, coach Bob Myers, and umpire Joe Reed.
Dad is the third journalist to be named to the Long Beach Hall of Fame. The first two were Ross Newhan (class of 2006), a former sportswriter for the Long Beach Press-Telegram and Los Angeles Times, and Frank Blair (class of 2007), the first sports editor of the Press-Telegram from 1921 until his death in 1953. Newhan was the recipient of the J. G. Taylor Spink Award by the National Baseball Hall of Fame in 2000. Four of Dad's colleagues, including former sports editors John Dixon and Jim McCormack, who also serves on the selection committee, plus Jack Teele, an NFL executive for over 30 years, and Al Larson, were on hand to honor him.
Amalfitano, who prepped at St. Anthony High School in Long Beach, told me that Peter O'Malley and his family planned to be at the ceremony and sent their well wishes to our family through him. The former player, coach, and manager also said he spoke to Sandy Koufax, who sent his regards as well.
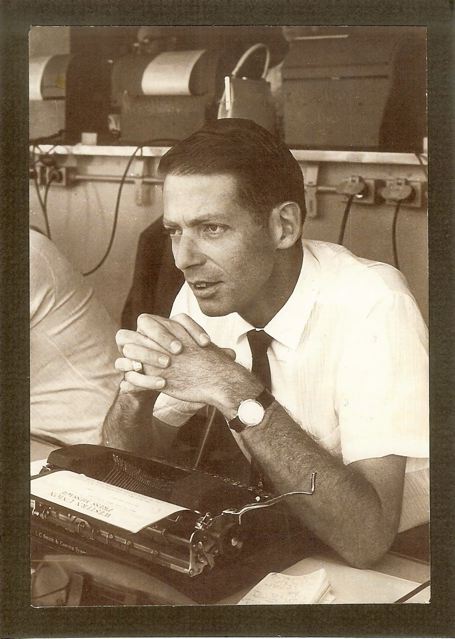 My father was the sports editor of the Wilson High School and Long Beach City College newspapers. He joined the Long Beach Independent, Press-Telegram in 1948 and mostly covered local prep and college sports for the next ten years. Dad was assigned the Dodgers beat at the tender age of 29 when the team moved from Brooklyn to Los Angeles in 1958. One of our favorite photos is of Dad walking outside the P-T in downtown Long Beach on his way to the airport for his first spring training in Vero Beach in 1958.
Dad covered the Dodgers for 11 years, including the World Series championships in 1959, 1963, and 1965. He also served as the Dodgers statistician in the post Allan Roth days and was one of four MLB official scorekeepers for the team's home games, including Koufax's perfect game in 1965. Amalfitano reminded me that he was the 26th out in that game. Dad was the president of the local chapter of the Baseball Writers Association of America and a member of the Board of Directors on a national level.
After more than a decade traveling around the country every year from late February through early October, Dad decided to accept new Angels GM Dick Walsh's (standing on the right next to my father) offer to become the club's Director of Public Relations and Promotions in early 1969. He served in that capacity until passing away in 1978 from a misdiagnosed case of malignant melanoma.
Bob Keisser featured Dad in a recent article on the front page of the Press-Telegram's sports section. In The Lederer Tree, Keisser tells the story of the family's sports legacy in Long Beach. My Mom was recognized in a follow-up column a couple of days later.
In the course of covering the Family Tree of the Lederers - the late George Lederer, the former P-T baseball writer who will be inducted into the Long Beach Baseball Hall of Fame next Saturday - the contributions of Pat Lederer, George's wife, were overlooked.That was egregious. George passed away in 1978, so it's been Pat who served as the foundation for the family for the last 30-plus years and guided her four children and seven grandchildren through life.
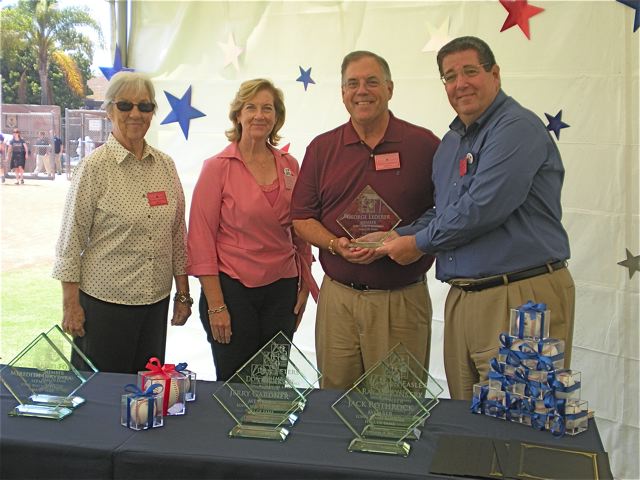
My mother, who just turned 82 last month, joined my brother Tom, sister Janet, and me for the ceremony on Saturday afternoon. Unfortunately, our younger brother Gary, who lives in Phoenix with his wife and three children, was unable to join us due to a major conflict in his schedule. Our three spouses, four of George's seven grandchildren, several members of the extended family, and numerous friends (one of whom traveled from out of the state and another drove over 100 miles) were also in attendance. Needless to say, it was a very special day.
There was only one person who was missing that we all wanted to be there with us. The Hall of Famer himself. George Lederer. My Dad.
| Touching Bases | September 16, 2010 |
Year to Year Spray Charts
Rich Lederer covered Jose Bautista's home run scatter plot on Tuesday, noting that he has yet to hit one out the other way. Bautista's spray chart this year differs sharply from last year's as well.
Perhaps Bautista's new patterns can be explained through mechanical changes. According to Frankie Pilliere, Bautista is moving his hands through the zone quicker, is starting his leg kick slightly sooner, and opening up on inside pitches.
Still, former teammate Alex Gonzalez, who Rich profiled way back when, also adapted the Blue Jays swing-for-the-fences approach. Can his change in batted ball locations be explained by a new-found approach?
On the other hand, Elvis Andrus is no longer pulling the ball, and has seen his ISO drop to 40 points, the lowest mark in the leagues, and he plays half his games in Arlington.
Similarly, Matt Kemp, possibly the most disappointing player in the league this year, evidently hasn't gotten around on pitches. He might have lost speed over the offseason, considering he went from a plus center fielder/baserunner to a guy with right around the worst UZR and stolen base numbers I've ever seen, and maybe he lost bat speed too.
I tend to think of BABIP luck for a batter as a dying quail that drops in for a hit once in a while. He controls where he hits it, but not how often it falls in. I'm beginning to think that I've underestimated the amount of randomness that can effect a batter's spray charts. A split second difference in timing is the difference between hitting the ball well and popping it up or rolling it over or something. Even though Bautista is undoubtedly hitting the ball with more authority, he's probably lucky to have done so. While I think that looking at spray chart differences can signal a change in approach, I would still expect all of these guys to regress heavily to their mean next year, both in terms of performance and batted ball locations.
| Change-Up | September 15, 2010 |
Checking In On the NL West
At the conclusion of play on August 25th, the San Diego Padres had amassed a 76-49 record, and were 6.5 and 10.5 games clear of the San Francisco Giants and Colorado Rockies, respectively. With a little more than a month to play, a club supposed to be in rebuilding mode was running away with the National League West title.
They had done it by averaging a respectable 4.5 runs per game when you consider their home ballpark, and their pitching and defense had been in top form all season long. From the beginning of the season through August 25th, the Padres were only yielding 3.4 runs per game. A closer look at the personnel might have given some pause about this team, but 125 games into this season they looked every bit the part of a legitimate contender.
Over their next 17 games, 14 of them at home, the Padres would go 4-13. Prior to the start of Monday’s series in Denver against the Rockies, from August 26th through September 12th, San Diego averaged just 2.2 runs per game while yielding 4.2. They were awful, and the division seemed to be slipping away. Their playoff odds, a lock just weeks ago, had dwindled down to the 50% mark.
The collapse was a total team effort, saving maybe superstar Adrian Gonzalez. His production remained steady. But other key contributors for the Padres were cratering. David Eckstein had held his own for much of the year but is at just .197/.242/.213 since August 25th. Yorvit Torrealba had been a nice surprise but he’s hit .219/.306/.333 from August 1st through today. Newcomers Ryan Ludwick and Miguel Tejada faltered badly, too, as the former has slugged just .323 since the losing began while the latter has managed just a .253 on-base.
Meanwhile, the Rockies got hot. Carlos Gonzalez and Troy Tulowitzki went nuts, and their pitching has improved as well. While San Diego went 4-13, the Rox ripped off a 14-4 stretch. San Francisco was playing better baseball, too. They went 10-6 over that same stretch. The NL West was shaping up to be one heck of a race.
Over the last two nights, however, things have taken yet another turn. The Padres won consecutive games on the road in Colorado thanks to a couple of huge home runs, one from Matt Stairs last night and another from Miguel Tejada on Monday. Also of note, Jon Garland bounced back and pitched well last night after a dreadful month for him. The Padres playoff odds are back up around 70%, thanks not only to their two-night resurgence, but also to Clayton Kershaw’s complete game shutout in San Francisco last night.
San Diego now has two games in the loss column on the Giants and four on the Rockies. The Padres have eight games remaining on this road trip, including another in Denver, four in St. Louis against the flailing Cardinals and three at Dodger Stadium. Then it’s the Reds and Cubs at home before what could be one of the most exciting season-ending series in a long time: three in San Francisco against the Giants.
Everything is more or less settled in the American League, faux AL East drama and all. The Phillies have scooted ahead of the Braves, but the Braves seem poised to take the NL Wild Card (although the two teams do have six games remaining against one another). That leaves the NL West, where you’ll want to remain focused if pennant race drama is your thing this time of year.
| Baseball Beat | September 14, 2010 |
Tracking Home Runs
Joey Votto slugged his 34th home run last night as the Cincinnati Reds pummeled Barry Enright and the Arizona Diamondbacks, 7-2. His dinger was overshadowed by the fact that Jay Bruce jacked two homers in his first two trips to the plate after missing a dozen games. Nonetheless, Votto's four bagger was his Major League Baseball-leading 17th HR to the opposite field according to play-by-play announcer Thom Brennaman.
I happened to be watching the game at that moment and made a note to check Votto's scatter plot on Hit Tracker, which logs and calculates the trajectory and distance of every home run in Major League Baseball. As it turns out, Greg Rybarczyk's site indicates that Votto has produced 19 homers to the left of straightaway center field (including yesterday's big fly, which isn't part of the following graph).
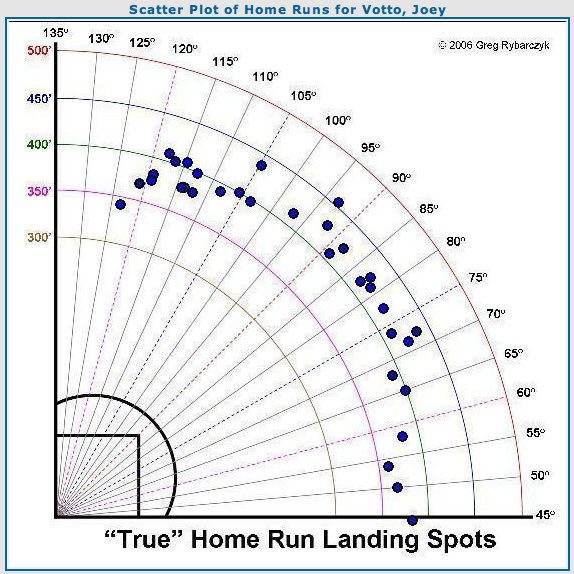
As shown, Votto has clubbed a couple of home runs just to the left of the 90° mark. My guess is that these bombs (one of which traveled 457 feet, the 24th-longest HR in 2010) were not deemed to be opposite field by MLB. The monster blast was deposited onto the party deck in center field at Great American Park, a first for Brewers' color analyst Bill Shroeder.
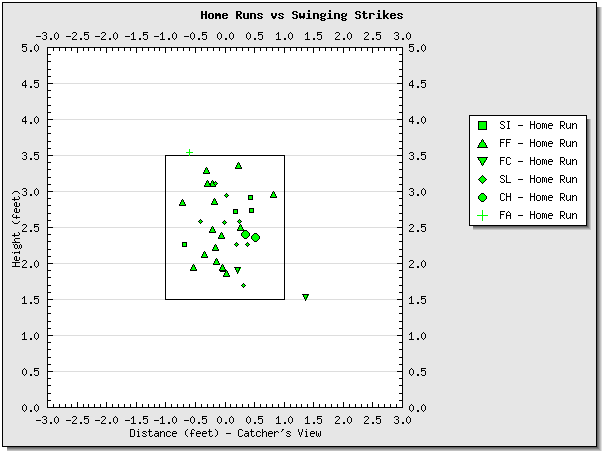
After looking at the distribution of Votto's home runs, I began to think about the pitch locations, especially those that were hit to the opposite field. Without the ability to create graphs like our own Dave Allen, I resorted to Joe Lefkowitz's PitchF/X Tool. Interestingly, all but four of Votto's long balls were turned around on pitches in the middle 60% of the strike zone. Yesterday's homer was on the pitch designated as a sinker on the outer 20% of the chart. Gameday described it as an 88-mph sinker.
By the way, Joe's site allows you to screen Votto's home runs for velocity (he has slugged three HR on 95-mph fast balls and two on 78-mph sliders at the other end of the spectrum), horizontal and vertical movements, and release points. If you have a cool boss or time on the weekend, click on the PitchF/X link in the banner at the top and play around with all the variables, including choosing a pitcher, batter, team, stadium, home plate umpire, plate discipline, pitch type, result, batted balls, count, pitch count, velocity, runners on base, and much more. It's a treasure chest full of information and fun.
Combining video with sites such as Hit Tracker and Joe Lefkowitz's PitchF/X Tool (among others) can help turn you into a baseball analyst or perhaps even an amateur scout in no time. Want to contemplate how to position fielders and pitch to Jose Bautista and Albert Pujols, the respective home run leaders in the AL and NL? Check out their scatter plots.
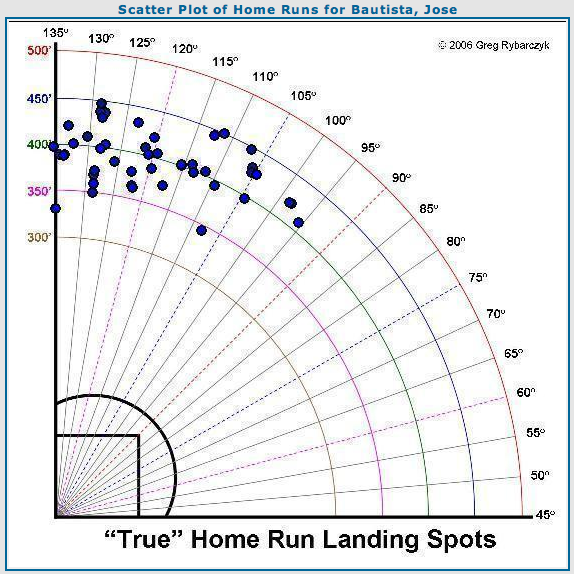
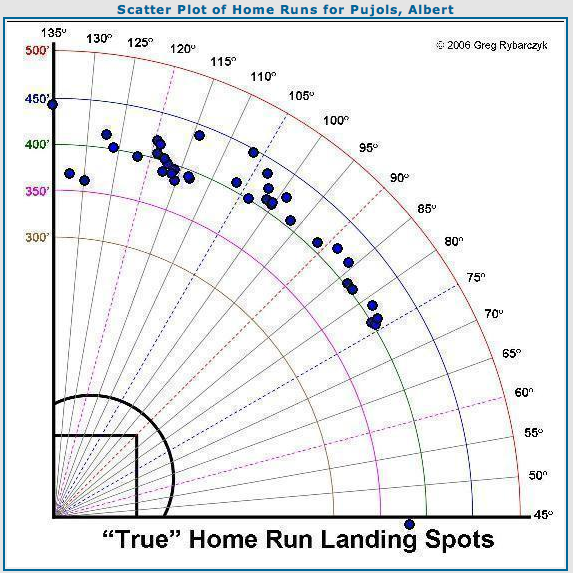
The pull hitter on the left is Bautista. The Toronto Blue Jays slugger has yet to hit a home run to the right of center field. In fact, he has only slugged about a half dozen to the middle third of the field. The other 40 or so homers have been launched to left field with more than half of those sailing over the fence between the left fielder and the foul line. Pujols, on the other hand, has tremendous power to center field, as exhibited by the fact that nearly half of his home runs have been hit to the middle third of the field. Interestingly, the three-time MVP has failed to slug a home run to the right third of the field.
Sometimes you just let the picture speak for itself.
Have fun and make sure that you don't miss lunch today.
Note: Jeremy Greenhouse's innovative Batted Ball Location Leaderboards are also valuable tools in this area.
| Around the Minors | September 10, 2010 |
AL Prospect Values: Climbing the Depth Chart
The 2010 minor league baseball regular season has come to an end. As with every season, we've seen a lot of prospect values both increase and decrease over the long season. Pre-2010 Top 10 prospect lists are sadly out of date and prospect mavens are madly starting to update their rankings for the off-season, which will see a fresh batch of indispensable lists from the likes of Baseball American, Kevin Goldstein, Keith Law, John Sickels, and FanGraphs.
It's still a little too early to talk Top 10 lists, but let's peruse the American League organizations for some prospects that have significantly increased their values over the course of the 2010 season.
Michael Kirkman, LHP, AAA/MLB
Experience: 6 years
Age: 23
Ranked by Baseball America as Texas' 16th best prospect entering 2010, Kirkman took a huge step forward with his four-pitch repertoire and 90-94 mp fastball. The lefty still needs to work on his control (4.67 BB/9 in triple-A) but he posted a solid 3.64 FIP in triple-A and allowed just 114 hits in 131.0 innings. He could also stand to induce a few more ground balls - especially if he's going to be pitching in Texas. Kirkman doesn't have a huge ceiling but he could be a solid No. 3 or 4 starter.
Steve Parker, 3B, A+
Experience: 2 years
Age: 23
Parker, the A's '09 fifth round pick, had a breakout 2010 season while playing in high-A ball. The third baseman scored more than 100 runs while just missing the milestone for RBIs. Overall, he hit .296/.392/.508 in 139 games. He also showed good power with an ISO rate of .212 while keeping the strikeouts to a respectable level for someone with his power potential: 20.0 K%. The power is good sign (although he played in a pretty potent league) because he's likely going to have to move off of third base (33 errors, and his foot work isn't good) to first base.
Johermyn Chavez, RF, A+
Experience: 5 years
Age: 21
Nick Franklin had a pretty nice season for Seattle in low-A but he's gotten a fair bit of press so let's talk about Chavez. Acquired in the "oops" trade of Brandon Morrow with Toronto, the minor league outfielder is trying to take some of the sting out of that swap. Chavez' numbers are somewhat inflated by his environment (one of the best hitting leagues in baseball) but he still slugged 32 homers (.262 ISO) after knocking out 21 in '09 in perhaps the toughest league in the minors to hit a homer. Overall in 2010, he produced a triple-slash line of .315/.387/.577 in 136 games. Chavez doesn't have great range in the outfield but he has a strong arm and profiles well in right field. Double-A will be a big test for him in 2011 and he'll be just 22 years old. He needs to trim his Ks and also learn to be a better base runner.
Jean Segura, 2B, A
Experience: 4 years
Age: 20
Alexia Amarista was a fast mover in the system in 2010 but I prefer fellow second baseman Segura. Amarista is limited due to his lack of size, limited power, and aggressive nature at the plate, which causes him to look more like a future utility player. Segura, on the other hand, is a better all around player with good speed (50 steals in '10), more power potential (.151 ISO) and better patience (7.7 BB% in '10). Overall, he hit .313/.365/.464 in 130 low-A games. The 20 year old does need to work on being more consistent in the field, although he has some arm strength that helps him make up for some of his mistakes.
Salvador Perez, C, A+
Experience: 4 years
Age: 20
Kansas City has the best minor league system in baseball without a doubt. One of the club's best prospects in '09 draft pick and catcher Wil Myers. Myers, though, is likely to move out from behind the plate before too long... but that doesn't leave a huge hole at the position thanks to the presence of Perez. Prior to '10, the 20-year-old catcher was basically considered a glove man with below-average bat. He's still an above-average defensive prospect (44% caught stealing, excellent game calling) but Perez also produced solid offensive numbers for his age and experience level. At high-A, he produced a triple-slash line of .290/.322/.411 in 99 games. He doesn't walk much (4.5 BB%) but Perez makes good, consistent contact and struck out at a rate of just 10.4%. At 6'3'' and 175 lbs, he has room to add muscle onto his frame.
Liam Hendriks, RHP, A/A+
Experience: 4 years
Age: 21
Hendriks doesn't have a fastball that he can blow by hitters but the Australian hurler is in the right organization. The Twins club is known for getting the most out of prospects who have a good feel for pitching and solid command/control. Hendriks posted a 0.96 BB/9 rate in 74.2 high-A innings in 2010, while also producing a FIP of 2.14. He also does an outstanding job of keeping the ball on the ground (52 GB%). Look for him to develop into a third or fourth starter, especially if he improves his secondary pitches. He could move up to double-A in 2011 as a 22 year old.
Wade Gaynor, 3B, A
Experience: 2 years
Age: 22
It wasn't a great season for the Tigers' minor league system but Gaynor is deserving of some attention. The '09 third round pick had a horrendous debut season but rebounded significantly in '10 in low-A. The third baseman as the potential to be an average defender, although he made 25 errors this season. Offensively, he hit .286/.354/.436 in 514 at-bats. Gaynor hit just 10 homers in '10 but he was playing in the Midwest League (a tough homer league) and he slugged 39 doubles. The right-handed hitter will look to tap into his raw power even more in 2011 at high-A ball. He's also a solid runner on the base paths, which is surprising considering his 6'3'', 225 lbs frame.
Brent Morel, 3B, AA/AAA
Experience: 3 years
Age: 23
A number of the White Sox's top prospects lost value in 2010. Morel, a third baseman, had a solid 2010 season split between double-A and triple-A. Overall, he hit .322/.359/.480 in 490 at-bats. With 37 doubles, he has some gap power but Morel's over-the-fence power is definitely below-average for the hot corner. The 23-year-old prospect made just three errors in 63 games at third in triple-A but he also played some shortstop and could develop into a utility player at the MLB level. He has a strong enough arm to play anywhere in the field. Left-handed pitcher Charlie Leesman is another player to keep an eye on in 2011. He's still raw for a former college draftee (control, secondary pitches) but he has solid velo on his heater for a lefty and induces a lot of ground balls
Joe Gardner, RHP, A/A+
Experience: 1 year
Age: 22
The Indians organization had a number of breakout prospects in 2010, including Jason Kipnis and Gardner. The right-handed throwing Gardner had a lot of success in six low-A starts before continuing to roll in 22 high-A games. His FIP sat at 3.62 and he had a respectable strikeout rate at 7.65 K/9. The key to Gardner's success, though, is his sinking fastball, which induced a staggering ground-ball rate of 67%. He reminds me a bit of current Indian Justin Masterson and could develop into a solid No. 3 starter if his secondary pitches continue to develop.
Gary Sanchez, C, R/A-
Experience: 1 year
Age: 17
Just 17, Sanchez made huge strides in 2010 with the bat after signing a $3 million deal with the Yankees in 2009 as an international free agent. The catcher hit .353/.419/.597 in 119 rookie ball at-bats before moving up to short-season ball for a 17-game stint where he posted a .339 wOBA. Like fellow Yankee catching prospect Jesus Montero, Sanchez has outstanding raw power. Unlike Montero, though, the younger prospect should remain behind the plate and has a very strong arm. He just needs to work on his game calling and receiving skills. Pitcher Dellin Betances had a bounce-back year after struggling with injuries in 2009. With that said, he made just 17 starts in 2010 and needs to be more durable to make good on his massive potential.
Jake McGee, LHP, AA/AAA
Experience: 6 years
Age: 24
Pitching is without a doubt the strength of the Rays organization and the return of McGee just helps add to the incredible depth. The lefty suffered a torn elbow ligament that required surgery in 2008 and he came back in '09 but did not return to form until 2010. McGee, 24, made 19 starts in double-A while posting a 2.53 FIP and strikeout rate of 10.19 K/9. Moved up to triple-A, the 23-year-old pitcher moved to the 'pen and tossed up a strikeout rate of 14.02 K/9 with just nine hits and three walks in 17.1 innings. Even prior to his injury, scouts thought McGee's best position would likely be closer and it looks like that may still hold true.
Ryan Lavarnway, C, A+/AA
Experience: 3 years
Age: 23
Lavarnway entered 2010 as the fourth or fifth player on Boston's organizational depth chart at catcher but moved to the forefront after second straight 20+ homer season. A former eighth round draft pick out of Yale University, Lavarnway could battle double-A teammate Luis Exposito for the future starting role in Boston - unless you buy into Jarrod Saltalamacchia. Combined between high-A and double-A, the catcher hit .288/.393/.489 in 462 at-bats. He strikes out a bit (26.6 K% in double-A) but it's a good trade off for his power output and Lavarnway also takes a good number of walks (13.7 BB%). Defensively, he's working on his receiving but he threw out 33% of base stealers.
A.J. Jimenez, C, A/A+
Experience: 3 years
Age: 20
Toronto has arguably the best catching depth in the Majors when you look at J.P.Arencibia, Brian Jeroloman, Travis d'Arnaud, Carlos Perez, Santiago Nessy, and Jimenez. The Puerto Rican was a steal in the '08 draft after he slid to the ninth round due to concerns about an injured elbow (that some thought would require TJ surgery but did not - although his elbow did act up late in '10). On the season in low-A, Jimenez hit .305/.347/.435 in 262 at-bats and he also received a two-game audition in high-A ball at the end of the season. He strikes out a bit too much (21.4 K%)for his modest power (.130 ISO) but Jimenez has shown better pitch recognition and patience and he's also a good athlete and solid base runner (16 steals) for a catcher. Defensively, he has a strong arm and projects to be an above-average defender. (51% caught stealing in '10).
Zach Britton, LHP, AA/AAA
Experience: 5 years
Age: 22
Britton entered 2010 as one of Baltimore's Top 3 pitching prospects but he ended the season as a Top 50 overall MLB prospect. The 22-year-old lefty posted a 3.30 FIP in 15 double-A games before moving up to triple-A where his FIP sat at 3.18. His strikeout rate on the year was OK but not eye-popping while in the 7.35 K/9 range but his heater has great sink and he induced ground balls at a rate of 64%. While in triple-A, Britton handled right-handed batters better than fellow lefties (.238 vs .259 average). Look for him to develop into a No. 2 starter - and he could secure a spot in the O's rotation for 2011.
Next Week: The National League
| Change-Up | September 10, 2010 |
Friday Links
These are exciting times for the family of our fearless leader here at Baseball Analysts. Rich's father George, profiled here and here in the past on this site, will be inducted into the Long Beach Baseball & Softball Hall of Fame a week from Saturday night. I mention this today in this space because the publicity surrounding George’s induction tells you a lot about Rich Lederer, his priorities and his character.
This Long Beach Press-Telegram article offers a glimpse into Rich’s upbringing and how his values came to be. He spent his childhood hanging around Major League ballparks, and most of that time was in the company of his father and brothers. To this day, Rich’s love of family and baseball shine through for anyone lucky enough to call him a friend.
Rich will have a recap of the ceremony itself one week from Monday.
==========
Given Rich's past work on payroll efficiency, I found this graphical look at the current MLB standings to be fascinating. Great stuff from Kevin Dame at Hardball Times. Oh, those Cubs.
=========
Ben Kabak has a great write-up on Brett Gardner at River Avenue Blues.
On the season, Garnder is now at .284/.390/.384 through 504 plate appearances. He’s seventh in the AL in on-base percentage, ninth in walks with 70 and fourth in steals with 40. As a defender, too, his numbers are steller. His left field UZR is 16.9, and his arm is 5.3 runs above average. His eight outfield assists are second in the American League, and opposing teams have stopped running on his arm. Have I mentioned he’s making just $452,000 this year?
That Gardner has played as much as he has for the Yanks is Exhibit A that these aren't the mid-aughts Yanks, throwing money at anything and everything when they have a hole to fill. Gardner has subtle skills, and could easily be passed over by a dumber team with championship hopes. But the Yankees aren't dumb, and their ability to pay a very good player the minimum allows them the financial freedom to flex their financial muscles elsewhere.
==========
This is the most incredible thing I've read all year. Joey Votto does not have one single infield pop-up this season. I just don't even know what to say about that. Here's 'Duk from Big League Stew:
It's difficult to get your head around, but the above headline is true: Joey Votto has not hit an infield popup all season.
==========
Enjoy the start of the NFL season this weekend, and tomorrow has an excellent slate of college football. Even though the AL playoff slots are more or less wrapped up, the NL picture remains wide open. The two series to keep your eye on are the Cards in Atlanta and the Padres hosting the Giants.
San Francisco is just a game back of San Diego, and if the Cards have a miracle comeback in them, they'll have to make a dent this weekend.
| Touching Bases | September 09, 2010 |
Another Quantitative Approach to Studying Release Point Consistency
Jeff Sullivan in this very space on January 19, 2006:
We know an awful lot about pitchers. We know how hard they throw, how many batters they strike out, what kinds of pitches they have, and whether their deliveries are fluid and easy or violent and rough. This is all objective and indisputable information that has a lot of value when it comes to projecting a pitcher's future health and success.One thing we don't know much about, though, is the consistency of a pitcher's release point. The fact that we don't have a good way of measuring what's arguably the most important part of being a good pitcher is one of the more ironic twists of modern analysis.
Well, by 2007, PITCHf/x had become all the rage. The data is available now, but I'm not sure how widely release points have been studied.
PITCHf/x estimates the ball's location at a mark 50 feet from home plate. Pitchers often shift their spot on the rubber, resulting in variations of the horizontal component of the release point. This doesn't doesn't necessarily mean that the pitcher isn't repeating his delivery, though. Therefore, I decided to only look at the vertical component. Furthermore, some pitchers use different arm slots for different pitch types, and curveballs have a higher initial trajectory than fastballs. My methodology was the find the standard deviation of a pitcher's vertical release point for the fastest 20% of his pitches. Since cameras are calibrated ever so slightly differently in every ballpark, and even in every series to some extent, I looked at pitchers at both the season and game level.
While intuitive reasoning would suggest release point consistency is automatically a positive, I didn't immediately notice anything that would allow for such a broad claim. Still, I did see how release point consistency correlates with some other things.
Pitchers with lower arm slots have more trouble with release point consistency. This makes sense because pitchers with low arm angles tend to be less skilled and practiced than more traditional over-the-top pitchers. The sidearm motion could be naturally harder to repeat. It could also be a PITCH/x issue. Higher variance in release points coincide with higher variance in movement and velocity as well.
On to some examples. Javier Lopez, a sidearmer, is the worst at maintaining a consistent release point.
Perhaps he's changing his arm slot intentionally. Jose Contreras has been an effective pitcher who deals from multiple release points. Unlike Lopez, though, Contreras has separate, consistent release point clusters, which makes it easy to see that it is part of his approach.
And now for something different, Alberto Castillo:
David Huff is a good example of a pitcher who has a very consistent release point.
In fact, Frank Viola said in 2009, ""Huff has textbook mechanics. Everything is right there. His release point is consistent with all his pitches."
Chris Carpenter and Kevin Slowey have consistent release points, too.
| Baseball Beat | September 07, 2010 |
The Top 100 K/100P Leaders
While strikeouts per pitch hasn't caught on as hoped when I introduced the idea in February 2006, there is no disputing the fact that this metric explains runs better than strikeouts per inning or strikeouts per batter faced.
As detailed in Strikeout Proficiency (Part Two), K/P has the highest correlation in each of the five run measures (ERA, R/G, ERC, FIP, and DIPS). K/BF has the second-highest correlation and K/IP has the lowest correlation. In any other words, K/P > K/BF > K/IP.
To give K/P more utility, I multiply this decimal by 100. Not only do we now get a real number out of this exercise but the standard of measurement is almost exactly the average number of pitches per start during recent years. In an era of pitch counts, it seems more instructive to me to measure starters by the number of K/100 pitches than K/9 IP.
(For context, among those who are currently qualified for the ERA title, the average pitcher has thrown 100 pitches per start and completed 6 1/3 innings. The average number of K/100P is 4.88.)
With the foregoing in mind, let's take a look at this year's leaders. Interestingly, there are 100 pitchers who have averaged at least one inning per team game, which is the minimum to qualify for the ERA title. (The stats were compiled yesterday evening in real time and may not include the entire results for late games.)
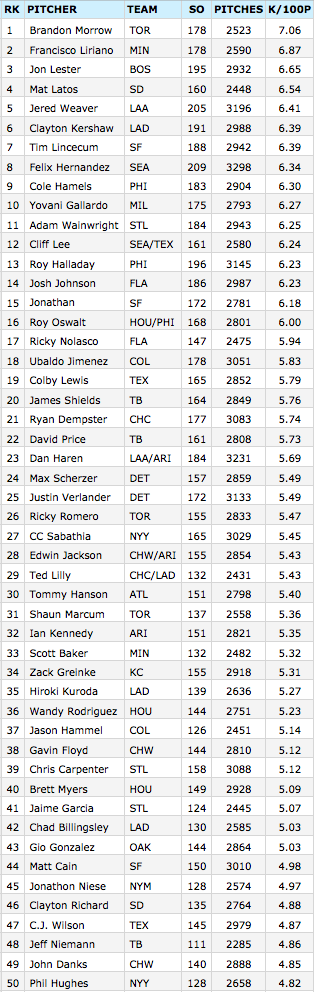
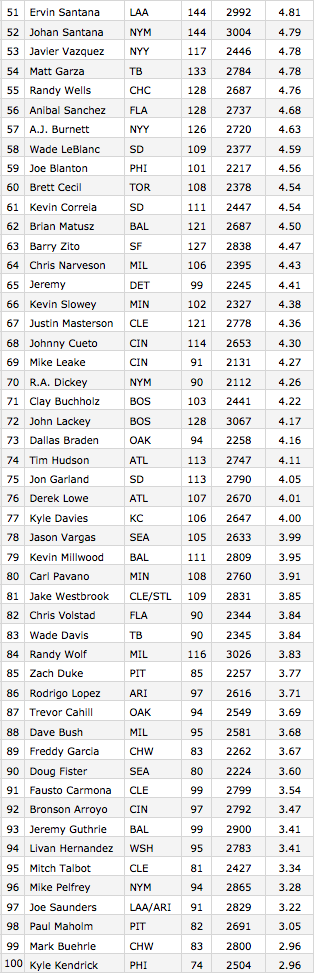 As shown, Brandon Morrow is leading the majors with 7.06 K/100P. He is averaging 97 pitches and 6.85 Ks per start. While Morrow leads MLB in K/100P, K/9, and K/BF, the 26-year-old righthander is 13th in strikeouts due to the fact that he is only averaging 5 2/3 innings per start. Aside from Morrow's dominating one-hit, 17-strikeout, complete-game shutout last month vs. Tampa Bay when he was allowed to throw 137 pitches, his starts, innings, and pitch counts have been managed closely by Cito Gaston and the Toronto front office. Along these lines, he was shut down for the season after making his last start on Friday against the New York Yankees. Although the former first round draft pick out of Cal will fall short of the required 162 innings to qualify for the ERA title, it makes little or no difference given that his 4.49 mark currently ranks 36th in the American League (out of 46 pitchers). However, it is worth noting that he has a bigger gap (1.31) between his ERA and FIP (3.18) than any starter in the big leagues.
Francisco Liriano ranks second with 6.87 K/100P. Like Morrow, Liriano's ERA (3.27), while excellent, understates his defense-independent pitching prowess this year as the lefthander tops the majors in FIP at 2.31 due to a strong strikeout rate, a better-than-average walk rate, and a home run rate (0.16 per 9) that is more than twice as low as the closest challenger (Josh Johnson, 0.34). While Liriano's HR/FB of 2.6% is probably unsustainable longer term, his xFIP (3.01), which normalizes the home run/fly ball rate to league average, still places him first in the AL and second in MLB (behind only Roy Halladay, 2.93).
Jon Lester ranks in the top five in the majors in strikeouts, K/100P, K/9, and K/BF. He is tenth in the AL in ERA and fourth in FIP and xFIP. The 26-year-old southpaw has produced three consecutive superb seasons and must now be regarded as one of the top five pitching properties in baseball.
With Stephen Strasburg sidelined through 2011, is there a better 22-year-old (or younger) pitcher than Mat Latos? The San Diego righthander is two months older than Brett Anderson and three months older than Clayton Kershaw, the other contenders for this mythical title. Latos (6.54) and Kershaw (6.39) rank fourth and sixth, respectively, in K/100P. Both starters play for teams in the NL West so they generally face similar competition. Although Latos' home ballpark is more friendly toward pitchers than Kershaw's, the former (.188/.247/.310, 2.36 ERA) has outperformed the latter (.241/.325/.350, 2.86 ERA) on the road this year. In the department of be careful when analyzing (over analyzing?) the effects of home ballparks, please note that Latos has pitched 99.1 IP on the road and just 56.1 IP at home this year. In other words, he has only thrown 36 percent of his innings at Petco Park, which means he hasn't benefited from the 87 park factor as much as one might believe without examining the facts. Oh, and it just so happens that Latos and Kershaw are the scheduled starting pitchers tonight when the Padres host the Dodgers.
At 6.41 K/100P, Jered Weaver is sandwiched between Latos and Kershaw. Weaver ranks among the top five pitchers in the majors in Ks, K/100P, K/9, K/BF, and K/BB. He is 8th in ERA, 6th in FIP, and 5th in xFIP among AL pitchers. The 6-foot-7 righthander also ranks 5th in Wins Above Replacement (WAR) and 3rd in Win Probability Added (WPA) in the junior circuit. While the Angels' ace lacks the gaudy win totals and winning percentages of CC Sabathia and David Price (and others), he has clearly been one of the five most effective starting pitchers in the league this season. Weaver can take the next step by pitching deeper into games as he is without a complete game and has only worked more than seven innings three times, primarily due to the fact that he leads the majors in pitches per plate appearance (4.17).
A lot has been written and said about Tim Lincecum's up-and-down 2010 but the fact remains that the two-time Cy Young Award winner is seventh in the majors and third in the NL in K/100P. His fastball velocity and movement have declined this season, yet he is getting more batters to swing at pitches outside the zone than ever before. In the aftermath of a poor August, the 26-year-old righthander beat the Colorado Rockies with a strong performance (8-5-1-1-1-9) on September 1. I would be slow to give up on this extraordinary talent.
Felix Hernandez leads the majors in strikeouts and ranks eighth in K/100P. He deserves to win the AL Cy Young Award as much as anybody, yet may be hurt if voters hold his mediocre win total (11) and W-L % (.524) against him. Both can be easily explained by the fact that Felix has received the lowest run support (3.90) in the AL this season. According to Lee Sinins, Hernandez would be 15-6 if he had received average run support. Sure, Sabathia is 19-5 but he has been supported by an average of 7.59 runs from his Yankees teammates. Similarly, Price (16-6) has received an average of 6.72 runs. Even Clay Buchholz, whose 15-6 record and league-leading 2.25 ERA will draw considerable attention, has been backed by 7.06 runs per nine. The truth of the matter is that Hernandez is 2nd in ERA, 3rd in FIP, 3rd in xFIP, 3rd in WAR, and 1st in WPA. No other pitcher matches those rankings.
Cole Hamels has also pitched much better than his 9-10 W-L record would suggest. He has received the fifth-lowest run support (4.92) in the NL. Teammates Roy Oswalt (3.72) and Roy Halladay (4.68) rank first and fourth, respectively. Meanwhile, the 26-year-old lefthander ranks 4th in the NL in K/100P, 7th in K/9, and 8th in K/BB and xFIP. No team wants to face the Phillies' Big Three in the postseason.
Yovani Gallardo ranks 10th in the majors in K/100P. While the Milwaukee ace can frustrate writers, analysts, and fans at times, it is hard to argue against the following NL rankings: 1st in K/9, 4th in FIP, and 6th in xFIP and HR/9. While Gallardo needs to improve his control to reach his potential, he has been victimized by the fourth-highest BABIP (.337) and the eighth-lowest LOB% (69.2%). I mean, let's give the guy a break — he's only 24 years old.
There are a number of other pitchers having superb seasons, including the next four on the list: Adam Wainwright, Cliff Lee, and the previously mentioned Roy Halladay and Josh Johnson. Along with Ubaldo Jimenez, Wainwright, Halladay, and Johnson are probably the leading favorites to win the NL Cy Young Award in 2010. An argument could be made for all four at this point. Although Lee and Halladay aren't thought of as strikeout types, both have posted strong K/100P marks in part due to their pitch-count efficiency. Lee is 3rd among qualified MLB pitchers in P/PA (3.49) and 2nd in P/IP (14.0), while Halladay ranks 6th (3.58) and 3rd (14.2) in these two measures.
Lastly, I would be remiss if I didn't point out that Strasburg (92 Ks and 1,073 pitches) averaged 8.57 K/100 pitches in 12 starts spread over 68 innings. That, my friends, is 1.51 K/100P more than the leader among all qualified pitchers!
| F/X Visualizations | September 03, 2010 |
PITCHf/x Summit 2010 Recap
A week ago today I was on my way to San Francisco for the 3rd annual PITCHf/x summit. The summit is put on by Sportvision, the company that developed the PITCHf/x system. I went last year, when I had a great time and was looking forward to this one -- it did not disappoint.
PITCHf/x summit is a bit of a misnomer because at this point Sportvision is expanding its f/x-family and this summit was largely centered around Sportvision's new FIELDf/x system. This camera-based system aims to track the the movement of all players on the field as well as the ball in play and throws between fielders. The system has been running on a test basis at AT&T park since April and Sportvision hopes to have the system in all MLB parks by next year. The availability of this future data to the public is at this point not known as Sportvision works out the business side of the project.
As part of this year's summit Sportvision released 13 games of the FIELDf/x data from AT&T to a limited number of analysts to analyze and present on at the summit. Although Sportvision is working on tracking the ball with the FIELDf/x system, that is still a work in progress and they released 'just' the player tracking data. About half of the talks at the summit were based on the FIELDf/x data and the other half on other topics. Here I present a brief recap of these talks. The presentations should be available to download in the future, and looks like they will be here when they are.
Part 1 non-FIELDf/x
Matt Lentzner and Mike Fast started off. Matt said that he has always been troubled by how movement numbers are reported, citing the often reported fact that according to PITCHf/x's spin deflection numbers (pfx_x and pfx_z) fastballs have a lot of spin deflection, or movement, while sliders have very little. Matt suggested the difference between these data and our expectations is because the spin deflection is defined, as Matt put it, from the perspective of the ball, while we think about movement from he perspective of the batter. Matt suggested that it would be useful to define two new values, the horizontal (x) and vertical (z) velocity of the pitch just as it crosses the plate. These value are affected not only by the pfx_x and pfx_z of the pitch, but also its trajectory, and could better represent the movement of a pitch as it is observed by a batter.
Matt had Mike run the numbers to see how well these metrics correlated with swinging strike rate, and also presented the leader and laggard boards for starters' fastballs' vertical plate-crossing velocity. The results were preliminary but very cool. Hopefully Mike and Matt will continue to develope this idea and share more results with us in the future.
Up next were Glenn (Doc) Schoenhals and Fred Vint of Scientific Baseball. Scientific Baseball is looking to "close the gap between the science and the game." They have leased the pitchf/x system, installed it in a training facility in Oklahoma, and combined it with a number of cameras that capture the motion of the pitcher at a high number of frames per second. They use this for player evaluation and development with players of all ages. Doc talked about the challenges of dealing with lots of PITCHf/x data, combining it with some of the visual data from the cameras, and finding a way to communicate all of that to young players, their parents and coaches who might not familiar with measures like horizontal spin deflection. Doc also has a very accurate pitching machine which he can use to fire pitches just on the edge of the strike zone, using that and the pitch/x system he has held little league (?) umpire training and practice sessions.
At that point Matt Lentzner was back up talking about an interesting pitch he has seen from Hideki Okajima. It is referred to as a rainbow curve, but is not held like a curve and does not have the movement of one. In fact, the pitch has pfx_x and pfx_z values close to zero: Matt thinks that it is a gyro ball.
Next up was Alan Nathan, who with Peter Jensen organized the summit. Alan presented the results from a series of experiments he conducted to measure the spin rate of batted balls. The pitchf/x system calculates the spin rate of pitched balls based on the fit trajectory, but not is much is known about the spin of the batted ball. This spin plays a large role in making the ball drop faster on line drives (front spin) or stay in the air longer on some fly balls (backspin). It also makes the ball slice towards the foul line (side spin). Alan directly measured the spin on the ball by firing a marked baseball at a cylindrical piece of wood bolted to a wall at 100mph and taking pictures of the ball as it came off.
Alan found a number of interesting things. The spin direction of the ball off the 'bat' was largely independent of the spin direction of the incoming ball (Alan varied the spin direction of the incoming ball). Also it in the moments when it hit the bat the ball experienced sheer deformation, causing it to 'grip' the bat. As I could understand it this stopped the spin of the ball which is why the spin of the incoming ball did not play a big role in determining the spin of the ball coming off. This 'gripping' and deformation caused the ball to come off the bat with a huge spin rate: Alan observed balls coming off with over 4000 rpm, much higher than previous estimates. Alan was very surprising by how high these values were. He is hoping to incorporate these results into a model of the bat-ball collusion.
Part 2 FIELDf/x
Vidya Elangovan, a sportvision engineer, introduced us to the fieldf/x system and some of the technical challenges of capturing the data. As noted the system is up and running at AT&T and has been since April, the hope is to have the system in all parks by the 2011 season. Vidya said that the full tracked and recorded data is ready within 20-30 minutes after the game, but at this point is not completely 'real-time' like the pitchf/x system.
The system has two to four cameras placed up high above the field and trained on the entire field of play. At AT&T they use two cameras, one between 1st and home, and the other between 3rd and home, both very high, it seems placed on stadium lights. The cameras are higher resolution than the pitchf/x cameras and take pictures every 15th of a second. A computer algorithm picks out the players, coaches and umpires, turns them into a blob and finds the center of mass of each blog and attaches a location to that point. The system also records events: pitcher releases the ball, batter hits the ball, fielder gains possession of a ball (fields it, or catches it from a throw) and fielder throws the ball. The time of each of these events is recorded along with the identify of the fielder. In the future the system will also track the location of the ball in play and throw, although those data were not released with the 13 games.
Vidya highlighted a number of the technical challenges. Shadows over part of the field during day games are challenging because they push the limits of the dynamic range of the cameras to pick up both shadowed and non-shadowed areas. Shadows of players can also artificially increase the size of player blobs, resulting in incorrect player centers. Green uniforms blend in with the grass, tricking the algorithm that picks out players from background. Similarly if players stand too still for a long time the algorithm can lose them. Finally the system picks up ridiculously large amounts of data. If Sportvision kept all those high-resolution pictures taken every 15th of a second for every game of a MLB season they would end up with petabytes of data. With just the location data for all players every 15th of a second they get one million lines of data a game. Effectively storing, transmitting and analyzing this data will be a huge challenge.
Maybe the bloggers could give us some hope.
Peter Jensen showed how he took this huge quantity of data, moved it into a databased and then into an excel-based simulation which could replay the movement of the players and ball (extrapolated from player events). Peter's simulation was well done and while it ran it also displayed some of the important pieces of information (throw speeds, distance between base runners and the next base, etc.). Whoever gets this data, teams bloggers, etc. will need to do something like Peter did to make sense of this data.
John Walsh spoke at the beginning of the data, by Skype because he was in Italy, but his talk fits in better here. John analyzed grounders. Since we had just 13 games worth (and only bottom halves of innings) and less than a month to work with the data it was hard to do more than just descriptive looks at the data. Still the descriptive look was very cool. John calculated how long each fielded grounder took to get to the fielder: the average play to 3B took about 1.5 seconds, while those to SS or 2B took about two seconds. So middle infielders get, on average, about half a second extra to get the ball. John also showed that with the data it is possible to break down the time it takes to make a double play into its consistent parts: time it takes for the ball to be fielded, time the fielder holds the ball, the time it takes for the ball to get to the next fielder, and so on.
At that point I was up. I looked at fielders' routes to balls in the air. With the data you could see how direct, or not, paths to the ball were. I showed some plays where the paths were particularly direct and some where they not so direct. Ultimately I showed a graph of hang time versus distance the fielder was from the ball for fielded balls in the air. With the trajectory of non-fielded balls as well we could add those to this graph, adding how far a fielder was to the ball and how long he would have had to get there. I noted that this would be a great basis for a fielding metric, Greg will talk more about this in his talk.
Next up was Mike Fast, who analyzed base runners. First he showed the base-running trajectories for a number of plays. When players go between two bases they take roughly the straight line between the two, but when they are going for two bases they take a rounder, almost circular approach. Based the on data Mike looked at he didn't see a lot of variability between the paths take between different players taking two bases. Mike also looked in depth at two runners, plotting their instantaneous speed at each 1/15 second interval. He showed how the runner sped up or slowed down when the pitcher started his windup, released the ball, the ball was hit, and so on. One of the runners Mike showed got up to a top speed of 18 mph.
Baseball Analyst Jeremy Greenhouse was up next. He presented two models he had parameterized with the FIELDf/x data. The first was a model to predict stolen base success probability based on a number of parameters: length of lead, amount of time it takes the base runner to get to the next base, pitch type, pitch speed, catcher pop time (time between when the catcher gets the ball to when he throws it), amount of time it takes the catcher's throw to get to second (or third). Jeremy noted that his model would not account for the baserunner's sliding ability or the fielder's tagging ability. The released FIELDf/x data had only four steal attempts so a complete parameterazation of his model was not possible, but with a larger set of data it would be very cool to see what this model would show. Jeremy had a similar model for estimating the success of fielding a fly ball.
Matt Thomas uses a DSLR to take pictures of the field of play from the press box at Busch Stadium in St. Louis. From what I understand he captures the initial position of players as each play begins and then the position when the ball is fielded. It is very cool to see the amount and level of data that Matt can collect with a consumer-level camera and his photometry skills. Matt showed distributions for the initial locations of fielders for each position based on batter handedness, batting order, inning and a number of other game states. He also showed the probability that an infielder fields a grounder based on the difference between the angle where the fielder is positioned and the angle of the grounder, it follows a relatively nice Gaussian centered just off of zero.
Max Marchi, all the way from Italy by way of NYC, Cooperstown, Syracuse, Buffalo, South Bend and Chicago, gave us examples of how you could use PITCHf/x, HITtf/x and FIELDf/x to scout players. He had a number of examples from the blogoshpere (his work, Jeremy's work, my work). It was a very cool talk to see all of the ways these data can be used to measure players' abilities.
Greg Rybarczyk was up next. Like me he looked at fielders playing balls in the air, but he added the next step to the analysis. He went through 13 innings and looked at all balls in the air and found the landing location and hang time of balls that dropped in for hits. With this he could do want I wanted to do and plot both hits and fielded balls in hang time/distance between fielder and ball space. With enough data points one could assign a probability that the average fielder fields a ball based on these two values (another value that Greg noted was important was the angle the player had to go to get the ball). Then each fielder could be assessed based on the probability the average fielder makes plays that he made or didn't. Most agreed this would be more accurate than the current zone-based methods, but it is still a question whether this method would make fielding metrics converge any faster than current methods
All presenters did a tremendous amount of work in their presentations and this is just a small sample of each presentation. If you are interested further I suggest you download the slides and look over them. Also if I mis-stated anything here please note any corrections in the comments.
If you are looking for more recaps or liveblogs you can check out Colin's, Ben's, Rob's or Dan's.
I had a great time at the summit, it was lots of fun to see some of the other members of the PITCHf/x-community. Thanks to Sportvision for putting on the conference and Alan and Peter for helping to organize it.
| Change-Up | September 01, 2010 |
The Meaning of Marlon Byrd
When Marlon Byrd signed his 3-year, $15 million contract with the Cubs this past off-season, it was seen as yet another indicator that Jim Hendry was out of touch. Why add a 32-year old center fielder with a flimsy track record of success to a team with a $144 million payroll and legitimate championship aspirations?
Here is Christina Kahrl of Baseball Prospectus reacting to the acquisition:
My initial response on Twitter (@ChristinaKahrl) was that Byrd won't slug .420 away from Texas, and while that was a flip comment*, the more I think about it, the more I'm comfortable with the idea. It might cost less than half as much as signing Gary Matthews Jr. did, but that doesn't make the signing less than half as dumb. That's the basis of comparison I'm operating from, because we've heard this story before: toolsy 31-year-old ex-fourth outfielder has big year in a superheated bandbox, gets big money, and becomes a permanent punchline on his general manager's highlight reel. No doubt Jim Hendry's moved beyond the laughter, since he's on the downslope of the Milton Bradley experience.Byrd's performance record is entirely unmysterious.
Kahrl thought the one silver lining of the move would be that Sam Fuld, a 28-year old who hasn’t managed a .400 SLG in the PCL in 2010, might be able to get some playing time more quickly given Byrd’s ability to shift to the corner outfield positions. Christina was not alone. There was a guy named Sullivan right here at Baseball Analysts who wrote the following:
It's hard not to think back to the Milton Bradley episode and how much it distracted Chicago when looking at their moves this off-season. Losing Bradley and picking up Carlos Silva and Marlon Byrd, wherever you come down on the argument that they just had to part ways with Bradley, amounts to wheel-spinning. Byrd is no better than Bradley, Silva is just awful.
Ouch.
So how has Byrd performed? He’s hitting .302/.358/.446, good for a .356 wOBA and a 119 wRC+. Byrd ranks 3rd among National League center fielders in Runs Above Replacement. When you factor defense, his season looks even more impressive. He sits 12th in Fangraphs WAR among all National League position players. By any measure whatsoever, the Byrd signing has been a masterstroke for the Cubs, albeit a bittersweet masterstroke for Cubs fans as they ponder what might have been if their team’s other pieces were up to par.
A lot of Byrd’s success offensively has been tied to a high in-play average of .338, but then again his career figure is .325. He’s murdered lefties to the tune of a .953 OPS, and in case you think his output is tied to Wrigley, he’s been much better on the road than he has at home. Defensively, as you can deduce from his WAR number, he appears to have been terrific this season. Just five months into a 3-year deal, the complete story of the Byrd acquisition is as yet unwritten. He is hitting just .245/.268/.340 over the last 28 days. Nonetheless he's been good enough to date that it warranted attention.
I wanted to post this for a couple of reasons. The first was simply to point out a ray of light in an otherwise miserable Cubs season. Byrd seems to have exceptional make-up and character – check out his blog here – and has quickly become a fan favorite. When I attended Wrigley in late June to watch the Cubs take on Pittsburgh, I noticed how much the fans seated in the bleachers adored Byrd, cheering wildly as he took the field in the first inning. And Byrd impressed me by how much he seemed to be relishing the opportunity to patrol the Wrigley outfield in front of such appreciative fans. Byrd would be one of the great stories of 2010 if Derrek Lee and Aramis Ramirez had come to play this year.
Another reason I wanted to post this was to consider what it means when the saberists get it so wrong. A 32-year old whose offensive value had been tied to hitting in Texas, who had not even experienced real Big League success until age 29...well that’s not a guy worth inking to a guaranteed 3-year deal, right? That’s how my thinking went anyway. But there are considerations that teams take into account, granted inaccurately at times, that performance analysts do not.
I don’t know if what follows is true, but I bet a lot of it is, and I also bet this represents much of the case for Byrd that refutes the reasons not to sign him that Christina and I exclusively considered. Here goes:
Byrd is a guy with outstanding character who works hard and has never been in better shape. He will be a remarkable influence on his teammates, and the opportunity to play for a team with a rich tradition like the Cubs will not be lost on him. Whatever drop-off a move away from Arlington entails, consider all of these factors enough to counteract it. He’s a mature player, a true professional who got a late start but is now ready to take his game to a new level into his mid-30’s.
I bet there’s a scout out there, probably working for the Cubs, who had written something precisely to that effect on Byrd. That scout was dead right, and I know as a result of the Byrd case I will be looking into factors I previously had not considered when analyzing player movement.