Rich Lederer • Baseball Beat
Patrick Sullivan • Change-Up
Jeremy Greenhouse • Touching Bases
Dave Allen • F/X Visualizations
Sky Andrecheck • Behind the Scoreboard
Marc Hulet • Around the Minors
Al Doyle • Past Times
Retired Uniforms:
Bryan Smith • WTNY
Joe Sheehan • Command Post
Jeff Albert • The Batter's Eye
RSS Feed
Home
*Examining the Past, Present, and Future*
Lineup Card
Recent Entries
» Putting Together a Reality Team
» Historical Hall of Fame Vote Comparisons: 2012
» An All-Christmas Team
» The New-Look Angels
» John Denny: The Forgotten Cy Young Award Winner
» Money Isn't Everything
» What Would It Take to Hit .400 in the 21st Century?
» Halos Heaven
» Brandon McCarthy's Breakout Season
» Link-o-Rama
» Historical Hall of Fame Vote Comparisons: 2012
» An All-Christmas Team
» The New-Look Angels
» John Denny: The Forgotten Cy Young Award Winner
» Money Isn't Everything
» What Would It Take to Hit .400 in the 21st Century?
» Halos Heaven
» Brandon McCarthy's Breakout Season
» Link-o-Rama
Best of Baseball Beat
Abstracts From the Abstracts
1977 Baseball Abstract
1978 Baseball Abstract
1979 Baseball Abstract
1980 Baseball Abstract
1981 Baseball Abstract
1982 Baseball Abstract
1983 Baseball Abstract
1984 Baseball Abstract
1985 Baseball Abstract
1986 Baseball Abstract
1987 Baseball Abstract
1988 Baseball Abstract
1978 Baseball Abstract
1979 Baseball Abstract
1980 Baseball Abstract
1981 Baseball Abstract
1982 Baseball Abstract
1983 Baseball Abstract
1984 Baseball Abstract
1985 Baseball Abstract
1986 Baseball Abstract
1987 Baseball Abstract
1988 Baseball Abstract
Bert Blyleven Series
Meeting Up and Hanging Out with Bert
The Results Are In And...
Aficionado Heavily Invested in Blyleven
Latest on Blyleven's Chances for the HOF
The Internet Zealot Responds
400 Down and 5 to Go...
Bert Be Home By Eleven?
Blyleven's Forgotten Season (1973)
HeyMan, Your Comments Don't Hold Water
The Waiting is the Hardest Part
Another Addition to the Blyleven Series
Search for the Truth
As Dominant as His HOF Contemporaries
Listen, Buster
A Larger Step for Blyleven
Answering the Naysayers (Part Two)
Another Small Step for Blyleven
Q&A: Blyleven on the Twins
The Majority Rules, Right?
It's All Dutch to Some
The Hall of Fame Case for Bert Blyleven
Q&A: Blyleven on Felix Hernandez
Clemens Rocketing Up Charts
Poz: An Interview With a KC Star
A HOF Chat with Tracy Ringolsby
Up Close and Personal
A Peek Into the Mind of a HOF Voter
Answering the Naysayers
It's That Time of the Year (Again)
"If Cooperstown is Calling..."
The Bert Alert
One Small Step for Blyleven...
Only the Lonely
Exclusive Interviews
Lee Sinins
Alex Belth
David Pinto
Will Carroll
Mike Carminati
Aaron Gleeman
Joe Sheehan
Jay Jaffe
Jeff Peek
Tracy Ringolsby
Joe Posnanski
Bill James Part I, II, III
Jon Lalonde
Chuck Tiffany
Dayn Perry
Fay Vincent
Nate Silver
Alex Belth
David Pinto
Will Carroll
Mike Carminati
Aaron Gleeman
Joe Sheehan
Jay Jaffe
Jeff Peek
Tracy Ringolsby
Joe Posnanski
Bill James Part I, II, III
Jon Lalonde
Chuck Tiffany
Dayn Perry
Fay Vincent
Nate Silver
Bullpen
Rich Lederer
The Odd Couple (with Alex Belth)
The MostUnder Over Underrated Player in Baseball (with Brian Gunn)
Three Wise Men (roundtable by Alex Belth)
Infrequently Asked Questions (interview with Matt Welch)
Interview (Orioles Think Tank)
Bernie and the Yanks (Bronx Banter)
Hope and Faith: How the LAA Win the World Series (Baseball Prospectus)
NL West (The Soul of Baseball)
Greatest Living Hitter? (Sports Illustrated)
Roundtable: 2008 HOF Ballot (Armchair GM)
The Most
Three Wise Men (roundtable by Alex Belth)
Infrequently Asked Questions (interview with Matt Welch)
Interview (Orioles Think Tank)
Bernie and the Yanks (Bronx Banter)
Hope and Faith: How the LAA Win the World Series (Baseball Prospectus)
NL West (The Soul of Baseball)
Greatest Living Hitter? (Sports Illustrated)
Roundtable: 2008 HOF Ballot (Armchair GM)
Patrick Sullivan
Designated Hitters
David Bromberg (Q&A: John Denny)
Mark Armour (H. Killebrew and Versatility)
Joe Lederer (Soundtrack of a Prospect)
David Bromberg (Clemente's Autograph)
David Bromberg (Woody Fryman)
D. Baumstein (WAR Against Age: Pitchers)
Doug Baumstein (The WAR Against Age)
Doug Baumstein (A Lifetime on the Road)
John Fraser (Pick Six)
Mark Armour (How to Score More Runs?)
Bill Parker (What Opening Day Tells Us)
Stan Opdyke (Pat Rispole)
Chris Jaffe (Evaluating Baseball's Mgrs)
Stan Opdyke (Baseball Radio in NYC, 1953)
A. Nathan (Performance of Baseball Bats)
Michael Weddell (Edgar Martinez/HOF)
Jon Weisman (100 Things Dodgers Fans...)
Stan Opdyke (Connie Mack and Vin Scully)
Eric Walker (Evaluating Run Production)
Brent Mayne (The Intangibles of Catching)
Chris Moore (Best Fastballs in Baseball)
Dave Baldwin (The Batter’s Brain)
Shawn Haviland (Ivy League to MLB)
Larry Granillo (Walking Off)
Rob Iracane (Solo HR Won't Break You)
Tommy Bennett (Charm of AM Radio)
Harry Pavlidis (Johan Santana's Fast Start)
John Walsh (WAR and Remembrance)
Eric Walker (Precisely Inaccurate)
Bob Timmermann (As They See 'Em)
Geoff Young (Unicycles and Delusions)
Baseball Analysis at Tufts (Groundballers)
Baseball Analysis at Tufts (GB Out Rates)
G. Rybarczyk ('09 Hit Tracker Projections)
Joe Lederer (Curt Schilling/HoF)
Conor Gallagher (Hall of Fallacies)
Chris Green (Jim Rice, HoF, the Numbers)
Shawn Hoffman (Baseball's Bear Mkt?)
Paul Anthony (Manny Syndrome)
Ross Roley (World Series Odds)
B. Timmermann (Catcher's Interference)
R.J. Anderson (Waiting the Hardest Part)
Maury Brown (Cubs, MLB, and Cuban...)
Myron Logan (Dee-Fense, Dee-Fense)
Craig Calcaterra (Frivolity, Part I, Part II)
Chad Finn (Ode to Baseball Cards)
David Cameron (Mariners Foibles)
Chris Dial (Chipper Jones)
Pat Lederer (Memory Lane)
David Appelman (Clutch Pitching)
Bob Rittner (DH)
Jonathan Mayo (Roger Clemens)
Lisa Winston (My Son-in-Law...)
Russ McQueen (The Yellow Hammer)
Bob Rittner (I'm OK, You're OK)
Mark Armour (In Defense of the HOF)
Pat Jordan (Friends)
Dan Levitt (Analysis of Terry Ryan)
Doug Baumstein (Trading Econ 101)
Ross Roley (Runner's Reluctance II)
Ross Roley (Runner's Reluctance I)
Mark Armour (No-Longer Lovable Sox)
Bruce Regal (Stealthy and Wise)
Brian Gunn (Roid Monster)
Current/McEvoy (Value of the SB)
John Rickert (Sinister Thefts)
Nate Silver (Sabermetrics)
David Vincent (Home Run Production)
Joe P. Sheehan (Enhanced Gameday II)
Mark Armour (An Ode to Sport)
David Gassko (All-Time Worm Burners)
Joe P. Sheehan (Enhanced Gameday)
John Walsh (When Titans Clash)
Fox/Williams (Quantifying Coaches II)
Fox/Williams (Quantifying Coaches I)
Jacob Luft (Bull Durham Rant)
Chad Finn (Strat-O-Matic)
Lisa Winston (Rotisserie Baseball)
Dave Studeman (Baseball Stats)
Steve Treder (Roger Craig)
Marc Normandin (Jeff Bagwell)
D. Appelman (Expanding Strike Zone)
Jeff Sackmann (Worst MiL Defenders)
Jeff Sackmann (Best MiL Defenders)
Maxwell Kates (Van Lingle Mungo)
David Appelman (Pitch Location)
Kent Bonham (Danny Ray Herrera)
Glenn Stout (Two Baseball Poems)
Bruce Regal (The Challenge Round)
Mark Lamster (Barry & Ty)
Geoff Young (NL West)
Tom Lederer (The Ryan Express)
Brian Erts (Great Leap Forward)
David Pinto (Parity and the N.L.)
Jacob Luft (Fathers and Daughters)
Jamey Newberg (Pete's Sake)
Jeff Albert (A. Jones Swing Analysis)
Jeff Albert (A-Rod Swing Analysis)
Keith Law (Death, Taxes, and Waivers)
Peter Abraham (Tales of Torre Tales)
Larry Borowsky (Let 'er Rip II)
Dan Levitt (Empirical Analysis of Bunting)
Jonah Keri (If I Met Warren Cromartie...)
Bob Klapisch (War Stories)
Bob Timmermann (John F. Kennedy HS)
Kent Bonham (Aluminum Adjustments)
Al Doyle (More Than Superstars)
Ross Roley (Instant Replay)
David Vincent (Barry Bonds Homers)
Chad Finn (Our Favorite Obscurities)
Bill Deane (1979 NL MVP)
Mark Armour (Rise/Fall of Artificial Turf)
Jeff Angus (Wally Moon Camp)
David Berri (Money and Baseball)
Larry Borowsky (Baseball w/o the #s)
Derek Zumsteg (The Irrational Market)
David Regan (Free Agent Contracts)
Peter Schmuck (Steroids and the HOF)
David Appelman (Pitchers, Pitch by Pitch)
Dan Fox (Swinging, Taking, Fouling, Etc)
Patrick Sullivan (Study of NYY CF/BOS LF)
Will Leitch (Baseball Journalism)
Jeff Sullivan (Pitcher Release Points)
Steve Treder ('69-'70 Giants)
Maury Brown (Charlie Finley)
John Brattain (Bob Johnson)
Bob Klapisch (The Case for Bert Blyleven)
Jeff Peek (Pride and Prejudice)
Dayn Perry (Bert and Warren)
Rob Neyer (If Don Sutton Was Great...)
Lisa Winston (Minor League Memories)
Alex Belth (Otis Redding Was Right)
David Cameron (Long Live the King)
Jeff Angus (Baserunning Study)
Bert Blyleven (Baseball Playoffs)
Boyd Nation (Not a Prospect List)
James Click (Batters-Baserunners Study)
Jeff Shaw (Why I Love Baseball)
David Gassko (BIP/BFP Fielding Study)
Jay Jaffe (Milwaukee Sausage Race)
Jamey Newberg (Remember When)
Bob Klapisch (Press Box to the Mound)
Dan Levitt (Predictive Value of BB)
David Vincent (Official Scorer)
Jon Weisman (Rick Monday)
Larry Borowsky (Let 'er Rip)
Will Carroll (Fictional Short Story)
Bob Timmermann (Japanese Baseball)
Cyril Morong (Best Pitching Seasons)
Sean Forman (Monte Carlo Win-Loss)
Brian Gunn (My Little Blue Book)
Joe Lederer (My Dad and Baseball)
Bill Deane (Bob Gibson, 1968)
Mark Armour (1977 Yankees)
Darren Viola (Retrosheet)
David Pinto (RFK)
Dayn Perry (Brave Heart)
Matt Welch (Dave Hansen)
Kevin Kernan (Jack McKeon)
Tom Lederer (Dodgers Road Trip)
Steve Lombardi (Slider)
Studes (Picturing Baseball)
Mike Carminati (Luck of the Drawl)
Eric Neel (Vin Scully)
J.C. Bradbury (Leo Mazzone)
John Sickels (Bill James)
Search Baseball Analysts
Archives
By Category:
Around the Majors Content Only
Around the Minors Content Only
Baseball Beat Content Only
Baseball Beat/Change-Up Content Only
Baseball Beat/WTNY Content Only
Behind the Scoreboard Content Only
Change-Up Content Only
Change-Up/Around the Majors Content Only
Command Post Content Only
Crunching the Numbers Content Only
Designated Hitter Content Only
F/X Visualizations Content Only
Past Times Content Only
Saber Talk Content Only
The Batter's Eye Content Only
Touching Bases Content Only
Weekend Blog Content Only
WTNY Content Only
By Month:
February 2012
January 2012
December 2011
October 2011
September 2011
August 2011
July 2011
June 2011
May 2011
April 2011
March 2011
February 2011
January 2011
December 2010
November 2010
October 2010
September 2010
August 2010
July 2010
June 2010
May 2010
April 2010
March 2010
February 2010
January 2010
December 2009
November 2009
October 2009
September 2009
August 2009
July 2009
June 2009
May 2009
April 2009
March 2009
February 2009
January 2009
December 2008
November 2008
October 2008
September 2008
August 2008
July 2008
June 2008
May 2008
April 2008
March 2008
February 2008
January 2008
December 2007
November 2007
October 2007
September 2007
August 2007
July 2007
June 2007
May 2007
April 2007
March 2007
February 2007
January 2007
December 2006
November 2006
October 2006
September 2006
August 2006
July 2006
June 2006
May 2006
April 2006
March 2006
February 2006
January 2006
December 2005
November 2005
October 2005
September 2005
August 2005
July 2005
June 2005
May 2005
April 2005
March 2005
February 2005
January 2005
December 2004
November 2004
October 2004
September 2004
August 2004
July 2004
June 2004
May 2004
April 2004
March 2004
February 2004
January 2004
December 2003
November 2003
October 2003
September 2003
August 2003
July 2003
June 2003
Reference
Organizational Stats
Arizona Diamondbacks Bat / Pitch
Atlanta Braves Bat / Pitch
Baltimore Orioles Bat / Pitch
Boston Red Sox Bat / Pitch
Chicago Cubs Bat / Pitch
Chicago White Sox Bat / Pitch
Cincinnati Reds Bat / Pitch
Cleveland Indians Bat / Pitch
Colorado Rockies Bat / Pitch
Detroit Tigers Bat / Pitch
Florida Marlins Bat / Pitch
Houston Astros Bat / Pitch
Kansas City Royals Bat / Pitch
Los Angeles Angels Bat / Pitch
Los Angeles Dodgers Bat / Pitch
Milwaukee Brewers Bat / Pitch
Minnesota Twins Bat / Pitch
New York Mets Bat / Pitch
New York Yankees Bat / Pitch
Oakland Athletics Bat / Pitch
Philadelphia Phillies Bat / Pitch
Pittsburgh Pirates Bat / Pitch
St. Louis Cardinals Bat / Pitch
San Diego Padres Bat / Pitch
San Francisco Giants Bat / Pitch
Seattle Mariners Bat / Pitch
Tampa Bay Devil Rays Bat / Pitch
Texas Rangers Bat / Pitch
Toronto Blue Jays Bat / Pitch
Washington Nationals Bat / Pitch
All-Star Links
Official Websites
News and Notes
Baseball News Blog
Baseball Newstand
ESPN Baseball
Fox Sports Baseball
Pro Sports Daily
Roto World
The Roto Times
USA Today Baseball
Baseball Newstand
ESPN Baseball
Fox Sports Baseball
Pro Sports Daily
Roto World
The Roto Times
USA Today Baseball
Reference and Analysis
Baseball Almanac
Baseball America
Baseball Archive
Baseball Contracts
Baseball Cube
Baseball Graphs
Baseball Library
Baseball Musings Player Database
Baseball Page
Baseball Primer
Baseball Prospectus
Baseball Reference
Baseball Statistics
Baseball Truth
Boxscore Central
Diamond Mind Baseball
Doug's Stats
FanGraphs
Fast Balls (pitchfx catalog)
Hardball Dollars
Hardball Times
Hit Tracker
Retrosheet
Rotobase/Rotoblog
Stat Corner
STATS
Tango on Baseball
Yahoo Sports MLB
Web Gems
Bill James Primer
Sabermetric Manifesto (Grabiner)
Pitching and Defense (McCracken)
Pitching and Defense (Tippett)
Transactions Primer (Neyer)
Baseball Stats (Batter's Box)
Prospect Report (Cameron)
Pitcher Workloads (Sheehan)
Goodbye to Old Baseball Ideas (Rickey)
Sabermetric Manifesto (Grabiner)
Pitching and Defense (McCracken)
Pitching and Defense (Tippett)
Transactions Primer (Neyer)
Baseball Stats (Batter's Box)
Prospect Report (Cameron)
Pitcher Workloads (Sheehan)
Goodbye to Old Baseball Ideas (Rickey)
Columnists
Baseball Blogs
Around the Majors
Athletics Nation
Baseball Crank
Baseball Musings
Baseball-Reference Blog
Batter's Box
Big League Stew
Bronx Banter
Catfish Stew
Cub Town
Dan Agonistes
Dodger Thoughts
DRays Bay
Ducksnorts
Futility Infielder
Halos Heaven
Inside the Rockies
It Might Be Dangerous
Knuckle Curve
LoHud Yankees Blog
Lookout Landing
Management by Baseball
Metaforian
Metsgeek
Mike's Baseball Rants
Only Baseball Matters
Redbird Nation
Red Reporter
Sabernomics (Braves)
Seth Speaks
ShysterBall
6-4-2 (Angels/Dodgers)
The Book
TheCubdom
The Cutting Edge
The House That Dewey Built
The View From The Bleachers
Tiger Blog
U.S.S. Mariner
Viva El Birdos
Where's Kernan
Minor Leagues
Arizona Fall League
BA Player Finder
Cal Leaguers
Jamey Newberg
JDM's Scoresheet Baseball
Minor League Baseball
Minor League Park Factors
Minor League Splits
No Pepper
Sickels' Minor League Ball
Warm October Nights
BA Player Finder
Cal Leaguers
Jamey Newberg
JDM's Scoresheet Baseball
Minor League Baseball
Minor League Park Factors
Minor League Splits
No Pepper
Sickels' Minor League Ball
Warm October Nights
Amateur
Boyd's World (College)
Cape Cod Baseball League
College Baseball Blog
College Baseball Insider
Collegiate Baseball Newspaper
College Splits
College Splits Blog
Dirtbags Baseball (Long Beach State)
NCAA Baseball
NCBWA
Team One Baseball (High School)
Texas A&M & Baseball
Cape Cod Baseball League
College Baseball Blog
College Baseball Insider
Collegiate Baseball Newspaper
College Splits
College Splits Blog
Dirtbags Baseball (Long Beach State)
NCAA Baseball
NCBWA
Team One Baseball (High School)
Texas A&M & Baseball
Historical
Cuban Baseball
House of David
Jim "Mudcat" Grant's Web Page
Negro League Baseball Players Assoc
Negro Leagues Baseball Museum
1919 Black Sox
Pacific Coast League
Philadelphia Athletics Historical Society
Shoeless Joe Jackson Society
SABR-L Archives
Walter O'Malley
House of David
Jim "Mudcat" Grant's Web Page
Negro League Baseball Players Assoc
Negro Leagues Baseball Museum
1919 Black Sox
Pacific Coast League
Philadelphia Athletics Historical Society
Shoeless Joe Jackson Society
SABR-L Archives
Walter O'Malley
Miscellaneous
Forums
Credits
Ticket Center
Tickets to Baseball -
Premium Red Sox Tickets - Tickets to Marlins Games - Cardinals Game Tickets - NY Yankee Tickets - Tickets Oakland Athletics - Dallas Cowboys Tickets - Arizona Cardinals Tickets - Tickets Seattle Seahawks - Buffalo Bills Tickets Online - Tickets to Dolphins Football
Buy Boston Red Sox tickets,
Philadelphia Phillies tix,
NY Yankees tickets,
NY Mets tickets, and
MLB All Star game tickets at ABC tickets
Not sure where to find the best online sportsbooks? Start your search with PlayersJet.
Get deals at SportsMemorabilia.com on baseball apparel, including Phillies jerseys and more for adults and children.
Shop the largest selection baseball equipment on sale at Sports Unlimited. Check out tons of baseball gloves, youth baseball gloves and catchers gear from Rawlings, Wilson, Nike & Under Armour.
2011 Draft Order
Courtesy of Baseball America
First-Round:
 1. Pirates (57-105)
 2. Mariners (61-101)
 3. Diamondbacks (65-97)
 4. Orioles (66-96)
 5. Royals (67-95)
 6. Nationals (69-93)
 7. Diamondbacks (for B. Loux)
 8. Indians (69-93)
 9. Cubs (75-87)
10. Padres (for Karsten Whitson)
11. Astros (76-86)
12. Brewers (77-85)
13. Mets (79-83)
14. Marlins (80-82)
15. Brewers (for Dylan Covey)
16. Dodgers (80-82)
17. Angels (80-82)
18. Athletics (81-81)
19. Red Sox (from DET for Martinez)
20. Rockies (83-79)
21. Blue Jays (85-77)
22. Cardinals (86-76)
23. Nationals (from CWS for Dunn)
24. Rays (from BOS for Crawford)
25. Padres (90-72)
26. Red Sox (from TEX for Beltre)
27. Reds (91-71)
28. Braves (91-71)
29. Giants (92-70)
30. Twins (94-68)
31. Rays (from NYY for Soriano)
32. Rays (96-66)
33. Rangers (from PHI for Lee)
Supplemental First Round:
34. Nationals (Dunn)
35. Blue Jays (Downs)
36. Red Sox (Martinez)
37. Rangers (Lee)
38. Rays (Crawford)
39. Phillies (Werth)
40. Red Sox (Beltre)
41. Rays (Soriano)
42. Rays (Balfour)
43. Diamondbacks (LaRoche)
44. Mets (Feliciano)
45. Rockies (Dotel)
46. Blue Jays (Buck)
47. White Sox (Putz)
48. Padres (Garland)
49. Giants (Uribe)
50. Twins (Hudson)
51. Yankees (Vazquez)
52. Rays (Benoit)
53. Blue Jays (Olivo)
54. Padres (Torrealba)
55. Twins (Crain)
56. Rays (Choate)
57. Blue Jays (Gregg)
58. Padres (Correia)
59. Rays (Hawpe)
| Around the Minors | February 28, 2010 |
Year of the Rookie: The 2010 NL Edition
One of the more exciting story lines each season in Major League Baseball is the Rookie of the Year race. The announcement of the eventual winners is really not the best part, though. The most exciting aspect of the competition is the race itself for the simple fact that we get introduced to the stars of tomorrow.
The 2010 season is shaping up to be another great year for rookies. The '09 season ended up being a pretty amazing run with fans being introduced to the likes of Florida's Chris Coghlan, Atlanta's Tommy Hanson, Pittsburgh's Andrew McCutchen, Oakland's Andrew Bailey and Brett Anderson, Baltimore's Chris Tillman, Toronto's Ricky Romero, and Texas' Elvis Andrus... as well as many, many others.
This week, we'll take a look at the National League's most promising rookies. Over the past 10 seasons, the winners of the Rookie of the Year award have gone on to do some great things. Some of those successful winners include: Milwaukee's Ryan Braun, Florida's Hanley Ramirez, Philadelphia's Ryan Howard, New York's Jason Bay, and St. Louis' Albert Pujols. A few of the past winners that have failed to build upon their immediate successes include Florida's Dontrelle Willis, and Colorado's Jason Jennings. The jury remains out of '08 winner and Chicago Cub Geovany Soto.
Early 2010 Rookie Favorites
Stephen Strasburg, RHP, Washington
2009 Peak Level: Arizona Fall League
2010 Roadblock: His arbitration eligibility
Yeah, last summer's top draft pick could probably hold his own in the Majors right now. But why should he? The organization would be much better off by giving him some minor league innings of experience and delaying his arbitration eligibilty, which will therefore help control his cost and possibly keep him in Washington longer. Strasburg is likely already better than three projected members of the '10 starting rotation: Scott Olsen, J.D. Martin, and Garrett Mock. And he could very well be better than John Lannan, and Jason Marquis. You really have to appreciate how rare it is for a prospect - with basically zero pro experience - to be better than all five big-league pitchers in a club's starting rotation.
Buster Posey, C, San Francisco
2009 Peak Level: The Majors
2010 Roadblock: Management and Bengie Molina
The Giants club saved Molina from a chilly free agent market, but who is going to save general manager Brian Sabean from himself? The club's man-crush on veterans is once again showing its ugly face, as the MLB-ready Posey is in danger of A) beginning the year in the minors, or B) seeing his development stunted by playing multiple positions. Yes, the kid is athletic enough to play a number of positions, but he hasn't been catching all that long so he needs to keep polishing his act behind the dish. Long-term, his value is at its highest by wearing the tools of ignorance.
Jason Heyward, RF, Atlanta
2009 Peak Level: Double-A
2010 Roadblock: (snicker) Matt Diaz
Over the past year, as the Heyward love has increased, readers have been asking: "Is Heyward really that good?" In a recent FanGraphs podcast I likened his possible immediate big-league impact to Albert Pujols... and yes that is extremely high praise, but the 20-year-old outfielder really is that good. Check out his triple-slash line from double-A in '09: .352/.446/.611 in 162 at-bats. With Chipper Jones in decline, Heyward could be the club's best hitter in 2010 (His biggest competitior is probably Brian McCann) and, with apologies to Tommy Hanson, he is the future face of the franchise.
Alcides Escobar, SS, Milwaukee
2009 Peak Level: The Majors
2010 Roadblock: Craig Counsell
Fans received a glimpse of Escobar's potential last season after he replaced incumbent shortstop J.J. Hardy, who was demoted to the minors. With Hardy's off-season trade to Minnesota (which says a lot about the club's faith in its new shortstop), the full-time gig is now Escobar's and he could have an Elvis Andrus-type of season at shortstop for the Brewers... and the Rangers' infielder's '09 season was good enough to earn him the runner-up spot in the Rookie of the Year race in the American League. Escobar is a little bit more experienced than Andrus and he has a great glove, as well as some speed on the base paths (42 steals in 52 tries at triple-A in '09). With the likes of Ryan Braun and Prince Fielder in the line-up, the rookie should score a lot of runs.
Madison Bumgarner, LHP, San Francisco
2009 Peak Level: The Majors
2010 Roadblock: Todd Wellemeyer
There has been a lot said about Bumgarner's drop in velocity in '09 but velo, although important, is not the end-all-and-be-all for a pitcher's success. With that said, the lefty could probably use a little more seasoning in the minors if you consider the fact that his FIP has risen (3.56 FIP in double-A, compared to his ERA of 1.93), while his K/BB has dropped (to 2.30 BB/K), with each promotion. Bumgarner still has the ceiling of a No.2 starter for me, but he's just 20 years old. However, the fact that Wellemeyer is the other option for the fifth spot worries me.
The Sleepers
Josh Thole, C, New York
2009 Peak Level: The Majors
2010 Roadblock: Rod Barajas
You can't really fault the Mets organization for nabbing Barajas. The club got great value for a veteran catcher who slammed 19 homers last year for the Blue Jays. Thole is a much different type of player, with almost zero power (.094 ISO in double-A). However, you don't find many big league catchers that can hit .300 with a solid eye at the plate.
Drew Storen, RHP, Washington
2009 Peak Level: Double-A
2010 Roadblock: Matt Capps, Brian Bruney
Storen is that other guy that Washington selected in the first round of the '09 amateur draft. Well that other guy is rather talented, too, although he'll need to shed the curse that has infected the likes of Craig Hansen and Ryan Wagner - fellow college relievers who reached the Majors quickly only to burn out almost as fast. Storen's chances of closing for Washington in '10 took a significant downturn after the club acquired both Capps (free agency) and Bruney (trade).
Ian Desmond, SS, Washington
2009 Peak Level: The Majors
2010 Roadblock: Cristian Guzman
The Washington organization has been promoting Desmond as its shortstop of the future since he was in High-A ball and he's seemingly struggled with the pressure at times. However, a strong '09 season, which included as successful MLB audtion, seemed to finally thrust him into the '10 starting role by bumping incumbent shortstop Guzman to second base. However, the club then went out and signed Adam Kennedy to play second, which now shifts Guzman back to short or it will make him a very expensive back-up.
Chris Heisey, LF, Cincinnati
2009 Peak Level: The Majors
2010 Roadblock: Jonny Gomes
The Reds club recently re-signed Gomes to a big-league deal so he's the favorite for playing time in left field. However, there is a rather unimpressive backlog of outfielders, including Chris Dickerson, Wladimir Balentien and Laynce Nix, vying for playing time at the position. Heisey could end up being the best of the bunch, although his long-term outlook is probably fourth outfielder due to his average power for the outfield corner.
Eric Young Jr., 2B, Colorado
2009 Peak Level: The Majors
2010 Roadblock: Clint Barmes
I'm an unapologetic Young Jr. fan. As such, I have no issues with suggesting that he brings more to the table on offense than Barmes, who currently projects to receive the majority of the playing time at second base. Yes, the incumbent hit 23 homers, but he also posted a .294 OBP. The ability to get on base and steal 50+ bases from Young could have a much bigger impact in the Rockies lineup, which would wreak havoc on the base paths with four 20+ stolen base threats. Maybe the Rockies and I can meet half way if the club agrees to use Young in a super-sub role that guarantees him 400 at-bats.
The Second-Half Reinforcements
Mike Stanton, RF, Florida
2009 Peak Level: Double-A
2010 Roadblock: His Strikeout Rate
Stanton is one of the Top 5 prospects in all of baseball but the club is likely to receive more immediate help from first base prospect Logan Morrison. Stanton reached double-A in '09 at the age of 19 but his massive strikeout rates (33.1%) and modest double-A numbers suggest he has more work to do.
Andrew Cashner and Jay Jackson, RHPs, Chicago
2009 Peak Level: Double-A and Triple-A
2010 Roadblock: Randy Wells and Tom Gorzelanny
The Cubs big league club is set to infuse some youth into its veteran-laden rotation. Both Cashner and Jackson and near-MLB ready, which is good considering the health questions surrounding most of the pitchers in the starting rotation.
Jason Castro, C, Houston
2009 Peak Level: Double-A
2010 Roadblock: J.R. Towles
The tandem of Towles and Humberto Quintero will not strike fear in the hearts of many opponents. However, Towles has posted some good minor league numbers so there is still hope that he'll realize his potential. If he continues to struggle, though, Castro should be summoned to the Majors... and he has a much brighter future than rookie shortstop Tommy Manzella, who has received a lot of attention lately.
Pedro Alvarez, 3B, Pittsburgh
2009 Peak Level: Double-A
2010 Roadblock: Andy LaRoche
LaRoche cannot afford to slip this season. The incumbent third baseman had a respectable season in '09 (.324 wOBA) but he is now 26 and has yet to play up to his former prospect hype. Alvarez' triple-slash line at double-A in '09 (.333/.419/.590) has the former No.1 draft pick breathing down LaRoche's neck.
Aroldis Chapman, LHP, Cincinnati
2009 Peak Level: Did Not Play
2010 Roadblock: Matt Maloney, Micah Owings
The Cincinnati Reds organization surprised a lot of people by making a late, successful charge at the hard-throwing Chapman. He's impressing a lot of people early on in spring training but it's probably a little much to expect him to step right into a big league rotation. The organization seems serious about trying to win in '10 so it likely won't hesitate to lean on Chapman if he has some early success.
Next Monday: The American League Rookies
If you're looking for a great advantage for the 2010 Fantasy Baseball Season, considering purchasing a copy of the 2010 FanGraphs Second Opinion fantasy baseball companion. It features 582 pages of in-depth analysis for just $7.95.
| Touching Bases | February 28, 2010 |
Stakeholders - New York Mets
From now through the beginning of the regular season, we will not be posting in-depth round-tables previewing each division like we have in years past. Instead we will feature brief back-and-forths with "stakeholders" from all 30 teams. A collection of bloggers, analysts, mainstream writers and senior front office personnel will join us to discuss a specific team's hopes for 2010. Some will be in-depth, some light, some analytical, some less so but they should all be fun to read and we are thrilled about the lineup of guests we have teed up. Today it's Pat Andriola on the New York Mets.
Pat was one of the first people to introduce me to sabermetrics. I returned the favor by introducing him to "The Wire", which he had finished the night before our interview. We used that as a jumping off point.
![]() Jeremy Greenhouse: If Omar Minaya were a character from "The Wire," who would he be?
Jeremy Greenhouse: If Omar Minaya were a character from "The Wire," who would he be?
Pat Andriola: I need a minute to think about this...You know who I think it is, it’s Pryzbylewski. Prezbo is clearly a guy, like Omar as a GM, who is thrown into a certain situation. Prezbo was in the police department where everything lines up for him to be there, but maybe it’s not the best situation for him. Like Prezbo was better off at school, maybe Minaya should be on the sidelines as a scout—head of scouting—because he gets a deer in the headlights look as GM. He makes some silly signings, like Prezbo shoots a cop accidentally. I think that’s it. That’s my on the spot answer.
JG: Nice one. I like that. Let’s talk about the core a little. Or you can just rant on Francesca.
PA: I wrote an article a couple years back on MetsGeek about the core. Right now, Wright, Reyes, Beltran, and Santana I would say is the core.
JG: Is Bay in that core?
PA: Right, I mean what is the core? It means nothing. It’s such a silly term. It’s basically a group of really good players. Like a lot of teams have a core of really good players. The Phillies have a core of really good players. The Yankees have a core of really good players. The question is: can you surround this bunch of really good players with other good players to be competitive? I think Wright is going to have a really good year this year. I think Reyes is going to have a nice year. Santana, we’ll see about the surgery. We’ll see about Bay and how he handles left field in Citi. I think they’ll all be fine. I’m not really worried about them. There are bigger question marks than the core.
JG: So what are your thoughts on Citi Field so far? How do you think Wright and Bay handle it this year?
PA: Aesthetically, I love Citi Field. And I think it does work well for the Mets. It’s very simplistic, but it really does help Reyes to have more room in the outfield to spray the ball and get triples. I mean he didn’t have enough time to take full advantage of it and understand the park and play to the park. If you saw Angel Pagan, Pagan had a bunch of triples last year. And for Pagan to be able to hit liners into the gap and get to third base, that’s the least Reyes could do.
JG: What has to happen for the Mets to make the playoffs?
PA: For the Mets to make the playoffs, I think it comes down to the rotation. Basically, you have Johan at the front. I think he’ll be fine. I think Pelfrey will have a better year than he did last year. I’m a huge Pelfrey fan. So basically it comes down to Perez, Maine, and Niese or whoever else they put in the fifth spot. I’m overly optimistic about the rotation. I’m not about the lineup. But I feel like Perez is going to have a good year. People forget he had some pretty good years 2-3 years ago. I think Maine's fine as a fourth starter. Niese I’m a huge fan of. He’s coming back from a really, really tough injury—the guy literally collapsed on the mound—so it’s tough. Even if it doesn’t work out, they got some good backup options. I wrote an article on The Hardball Times a couple weeks ago about how much I like Nelson Figueroa. I think he can step in if necessary. And if the Mets are competitive at the deadline, they have the prospects to trade for a starting pitcher.
But will the offense produce? Obviously there are so many question marks. Other than David Wright, who’s something of a question mark in himself, there’s no guarantee. We don’t know how Bay’s going to adjust to Citi Field and the NL. We don’t know about Beltran. We know about Francoeur, but that’s a different story. Murphy and Tatis at first, Castillo at second, Reyes coming back, the catcher is now Barajas, Thole, Santos, Chris Coste, everyone else you want to throw in there. The offense has so many question marks. It's clearly possible, they have enough talent, the question will be when they play out the season, how’s the talent going to come together?
JG: How many WAR would you say for that first base platoon?
PA: Assuming for just the guys on the Mets right now, basically just Tatis and Murphy, it all depends on how Murphy does defensively. I think Murphy will put up one WAR. I think Tatis will put up—I say two WAR combined. I think they both put up one. That’s basically because I think Murphy will be pretty good defensively this year.
JG: How good defensively? I mean considering the positional adjustment. Do you think he’s a league average hitter?
PA: Oh yeah, he’s definitely a league average hitter. I’m not a big Murphy fan personally. I don’t think he’s good enough to play first base every day. I definitely think he’s good enough to hit .270/.335/.4-whatever.
JG: I know you're an atheist, but how do you explain the existence of Jenrry Mejia?
PA: If you’re going to say that it’s God, it has to be that God hates the Dominican Republic to the point where he makes it so destitute that the only option young kids can turn to is baseball, and that’s why Mejia is so good. So maybe that’s the only God point rather than God created his right arm.
I love Mejia, I’ve talked about him forever. I’m really worried the Mets are going to put him in the bullpen to start the season. I hope that doesn’t happen. I hope they put him back in Binghamton next year. His peripherals in Binghamton were really solid last year. I hope he continues to prosper there and move up the ranks. I don’t want to see him get thrown in. He has that look of a set-up guy or closer that people can think "Oh, this is one of those late-inning guys, a K-Rod because of that electric arm." And they can forget that he can actually be a very good starter if they leave him in the minors for long enough.
JG: Where would you rank Fernando Martinez in the top 100?
PA: You saw what I wrote on THT. I got a little heat for that. Project prospect, which I think is the premier web site for prospect analytics right now, they put him 10. I would actually be less bullish than that. I would probably put him at 20 right now. So I did my rankings for the Mets, I put F-Mart first. He’s proven so much at such a young age, I don’t buy into the ceiling argument for Mejia just yet because I think F-Mart’s ceiling is just as high if not higher. So I would put F-Mart 20, and I need to see more from Mejia than just the one year. I know the scouts drool over him. I drool over him. But I would still put him around 40-45ish.
Pat Andriola is a junior at Tufts University who writes for The Hardball Times. He just finished an economics internship in Major League Baseball's Labor Relations Department. He can be followed on Twitter @tuftspat.
| February 26, 2010 |
Slider-Fastball Pitch Sequencing
I have talked about before how I think that pitch sequencing analysis is one of the big places that pitchf/x data can be useful. I know that I linked them in my last post, but I want to again highlight just some of the great work done so far on the topic: Joe Sheehan looked at the frequencies of pitch types following each other for a handful of pitchers; Josh Kalk had a couple of articles one looking at the topic generally and another looking at the high fastball then curve combination; Max Marchi looked at the best one-two pitch combinations; and Jonathan Hale looked at the effect of fastball speed on subsequent changeups.
As I noted in my last post on the topic, about Mariano Rivera, for me the best way to start this study of pitch sequencing is to find simple, easy-to-analyze examples. Last time I choose Rivera since he has effectively three pitches, an inside cutter, an outside cutter and a fastball. This makes the analysis of pitch sequencing relatively straightforward. Today I am going to take a similar approach but broaden the scope of pitchers.
To do so I choose a group of pitchers who have a simple pitch repertoire. I choose fastball-sliders relievers. There is a rather large group of relievers who succeed with just the two pitches so it offered a large enough sample size of pitchers with just two pitches. Arbitrarily I picked out all relievers who in 2009 threw 90% or more fastballs and sliders and threw at least 30% of both of those two (so I didn't just get guys who went up and threw all fastballs). So when a batter faces one of these guys he knows he is going to see a fair number of fastballs and sliders, but not much else. To further simplify the analysis I just looked at at-bats between RHPs and RHBs.
As a group these pitchers threw 53% fastballs, 44% sliders and 3% other pitches in 2009. Here is where those pitches ended up in the strike zone, again just pitches to RHBs.
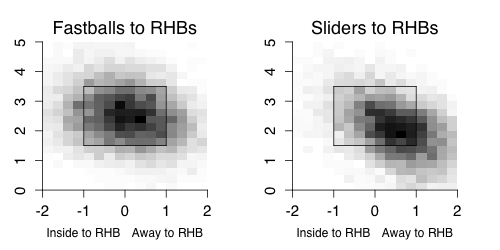
Not surprisingly the fastballs mostly around the zone and the sliders down-and-away. That is just for reference, the main point of the post is the sequencing aspects of the pitches.
First we can see whether these pitchers were more or less likely to throw a slider, or fastball, based on the previous pitch. For each pitcher I looked at the fraction of sliders after a fastball or after a slider versus his overall fraction of sliders. The same for his fastballs.
Situational slider fraction compared to overall slider fraction

after slider    1.17
after fastball  0.95

Situational fastball fraction compared to overall fastball fraction

after slider    0.88
after fastball  1.06
It looks like pitchers return to the same pitch more often than switch. I am not sure whether this has to do with batter quality (low-power batters are more likely to see fastballs which result in more fastball-fastball combinations) or count (the pitch after a hitter’s count, when a fastball is likely, is still likely to be a hitter’s count) or whether these pitchers are truly preferentially going slider-slider and fastball-fastball.
For whatever reason it happens it turns out to be a good idea. Here I note the difference in average run value of slider after a slider or fastball from the average run value on all sliders. A negative number means the pitch is better, gives up fewer runs, in that situation. For the rates, whiffs and slugging, I switch to fraction rather than difference.
sliders
                rv100  whiff   slg on contact
after slider	-0.05   1.02    0.87
after fastball   0.43   0.95    1.16

fastballs
                rv100   whiff   slg on contact
after slider	 0.02    1.01    1.08
after fastball  -0.18    0.97    0.91
Sliders after a previous slider have better results than the average slider. This is seen in the whiff rate and in the slugging on contact. Similarity for fastballs there is better performance after a previous fastball, although it is seen just in the slugging on contact fastballs. So the whiff rate on a fastball following a fastball is a little lower than the average fastball, but the slugging rate is much lower. On the other hand both of these pitches are worse after the other compared to their average performance.
Maybe batters facing these two-pitch pitchers expect a slider after a fastball, and vice versa, and when they see the same one again it trips them up. Or again this could be some sort of sampling effect. Either way I hope to continue this analysis looking at the interaction of subsequent pitches based on their location and movement.
| Change-Up | February 26, 2010 |
Stakeholders - St. Louis Cardinals
From now through the beginning of the regular season, we will not be posting in-depth round-tables previewing each division like we have in years past. Instead we will feature brief back-and-forths with "stakeholders" from all 30 teams. A collection of bloggers, analysts, mainstream writers and senior front office personnel will join us to discuss a specific team's hopes for 2010. Some will be in-depth, some light, some analytical, some less so but they should all be fun to read and we are thrilled about the lineup of guests we have teed up. Today it's Bernie Miklasz on the St. Louis Cardinals.
![]() Patrick Sullivan: Let's just get this out of the way right off the bat. I can't think of a less interesting sideshow of a non-story than the "Big Mac is a distraction" meme that seems to emanate from mainstream sports media circles. I think it's petty and self-fulfilling. Where do you come down on it? Is the team distracted? Do fans that you come across really care that much if Mark McGwire is the hitting instructor for the St. Louis Cardinals?
Patrick Sullivan: Let's just get this out of the way right off the bat. I can't think of a less interesting sideshow of a non-story than the "Big Mac is a distraction" meme that seems to emanate from mainstream sports media circles. I think it's petty and self-fulfilling. Where do you come down on it? Is the team distracted? Do fans that you come across really care that much if Mark McGwire is the hitting instructor for the St. Louis Cardinals?
Bernie Miklasz:: I happen to agree with your opinion on McGwire. This is primarily a media-driven story generated to please, well, the media. Somewhere along the line mainstream baseball writers and columnists -- and I am a member of that particular tribe -- appointed themselves to sit on the high court and hand down moral judgments. That's above my pay grade. McGwire used steroids. He shouldn't have used steroids. He admitted using steroids. He apologized for using steroids. He'll never get into the Hall of Fame because of steroids. What else is there to add, really? Whatever McGwire says won't be good enough for some folks. We're now into dissecting apologies. We're going line by line and grading the confessor on his sincerity, candor, style, emotional appeal, etc. The judges at the Cannes film festival aren't this snooty.
As for McGwire being a distraction ... I'm in Jupiter, Fla. at the Cardinals' camp. McGwire is working hard. The players clearly enjoy working with him. He seems to be off to a good start. They're bonding. He's already fixed a loop in Ryan Ludwick's swing. They all seem to be happy. I don't see any distractions. I guess it's possible at some point. You never know when card-carrying members of the BBWAA will show up to deliver another sermon on the mount. Or mound.
PS: The Cardinals have a nice luxury in that they have three of the very best players in the game in Albert Pujols, Matt Holliday and Adam Wainwright. You could throw Chris Carpenter in there too if you'd like. From there, construct the road map to 90-95 wins for me. Which players have the potential to step forward this year? Is the back end of the rotation good enough?
BM: The back end of the rotation was pretty weak in 2009. The top three -- Adam Wainwright, Chris Carpenter and Joel Pineiro - combined for a 2.79 ERA in their 94 starts. The other six pitchers who started games had a 5.16 ERA. Despite that instability and ineffectiveness in the fourth spots, the team still won 91 games.
So what's changed? Pineiro left as a free agent. Brad Penny was recruited on a one-year deal and he seems like an ideal turnaround candidate for Dave Duncan, the horse whisperer of big-league pitching coaches. Duncan has coveted Penny for a long time, so I'm assuming Penny will benefit from the working relationship, as many other starters have before him. Kyle Lohse wasn't healthy last season - he had a sequence of weird, non-pitching injuries - and he should bounce back strong in 2010. There are a few decent options (Kyle McClellan, Jaime Garcia, the surgically-repaired Rich Hill) for the fifth-starter job, and all of them are better than Todd Wellemeyer, who was the No. 5 last season. I think there's a fair chance that the Cardinals will have a better rotation in 2010. Penny and Lohse are the keys. There's some anxiety over Ryan Franklin as a closer, but I'm thinking we'll address this in another question, no?
Offensively, the Cardinals should make gains in at least a couple of areas. They'll have a full season of Matt Holliday in left field. He likes the league. He likes the home ballpark. He likes the run-producing opportunities presented to a man who hits behind Albert Pujols. Ryan Ludwick's days of slugging .600 are probably over, but he's been working with batting coach Mark McGwire to reduce the loop in his swing; will that help Ludwick push his line-drive rate back to 2008 levels? Possibly. But I'm going to resist nitpicking Ludwick too much; over the last two seasons he ranks third among MLB outfielders in RBIs, fifth in homers and 13th in OPS.
Colby Rasmus had a subdued rookie season in 2009; his good start was negated by a hiatal hernia that sapped his strength. Rasmus is healthy now, and stronger. He did a reasonably solid job against lefties during his progression in the minors, so I'm going to suggest that he'll do a lot better than hit .160 against LHP's - which was what he did with them last season. David Freese certainly has a lot to prove at third base, but look at it this way: Cardinals' third basemen ranked 28th in the majors in OPS last season, and Freese should ratchet that up a bit. Right now the Cardinals have a sketchy, thin bench. It will be young. It could be a liability. But I also think GM John Mozeliak will address the area via trade at some point.
The Cardinals were mediocre at getting on base last season (.332 OBP) and that's a primary reason for hiring McGwire as the batting coach. He's emphasizing a more selective hitting approach.
The Cardinals should be better defensively. Brendan Ryan played exceptionally well at shortstop, but logged only 830 innings (26th among MLB shortstops). He'll play more (and prevent more runs) in 2010. I don't know what to say about Skip Schumaker at 2B; his defensive metrics in 2009 were rather unsightly, and he was almost hopeless in going to his left for ground balls. But he improved as the year went on. (Will you take my word on that? Probably not.) Dare we propose that Schumaker can approach average ratings in 2010? And Freese is a better fielder than the assortment of loose parts used at 3B by the Cardinals last season.
There's also this Pujols fellow. I'm told he's pretty good in all phases of the game.
PS: A quick reaction to your last answer: I find your commentary on the supporting cast to be altogether persuasive. I think there are some really interesting parts flying under the radar. But I find your remarks about Holliday and the "top three" (you acknowledge Pineiro's departure will hurt) a tad problematic because I think their performances are unlikely to hold constant. Matt Holliday had a .380 in-play average (Pujols' average was .299 by comparison). Without taking anything away from Adam Wainwright or Chris Carpenter, both out-pitched their fielding independent numbers and I still have to think Carpenter's health is something of a question. Thoughts?
BM: Granted, Holliday won't be able to sustain the burst of offense (.353 / .419 / .604) he provided after coming over from Oakland in late July. His numbers were sick. But even if Holliday fulfills his CHONE projection for 2010, we're talking about 25 homers, 100 runs, nearly 100 RBIs and an OPS of around .900. Plus above-average defense. Last season the Cardinals had all sorts of problems in the outfield. Ludwick's slugging fell off, Rasmus was diminished by the hernia, Rick Ankiel lost his plate discipline, and the other corner outfield spot was a wasteland. It explains why the Cardinals' outfield had a .743 OPS, which ranked 24th in the majors. If everyone holds up physically, and Holliday-Rasmus-Ludwick start 150 or more games, that OPS should spike in 2010. If there's any injury, watch out. But isn't that true of every contender?
As for the rotation, obviously there's a big problem if Carpenter goes down. When he's been healthy, the Cardinals are a playoff team. When he's been unable to pitch, the Cardinals don't make the playoffs. But you may have more of a reason to worry about Wainwright. He pitched 233 innings last season. He averaged 106 pitches per start. On the pitcher-abuse points chart, he was No. 6. Will this impact him in 2010? Interesting question. But Wainwright is a strong guy, and he gets smarter about pitching every year. So we'll see if all of those innings (and 3,614 pitches) took anything out of him.
PS: It doesn't hurt that the NL Central is awful, right?
BM: No question, that's been a factor in the Cardinals' success over the years. Interestingly, since becoming the Cardinals manager Tony La Russa has a higher winning percentage (.562) against NL West teams than he does against NL Central teams (.558).
But back to the Central question. How much is this a matter of the Cardinals being good as opposed to the others being so lousy? I suppose it depends on your perspective. But the Cardinals have had impressive stability and continuity, and that's a strength. This is La Russa's 15th season in St. Louis, and during that time the other five NL Central teams have employed 34 managers. And over these 15 years the Cardinals have had one owner and two GMs. And the second GM, John Mozeliak, was trained by the first, Walt Jocketty. But look around the rest of the division. Four of the other five NL Central franchises have been sold at least once, and the fifth, Houston, is for sale now. And I can't count all of the GMs and various rebuilding projects. The Cardinals get major points for having a consistent plan, philosophy, and steady leadership.
PS: There's an Ed Wade joke in here somewhere, but I'll abstain. Thanks so much for participating, Bernie. Want to offer up a quick 1-6 prediction for the NL Central and we'll wrap this up?
BM: 1. St. Louis: A lot of terrific pieces are in place, including Albert Pujols and the strong 1-2 rotation punch of Chris Carpenter and Adam Wainwright. But the Cardinals will need Carpenter to make 30 starts. And watch out for the closer, Ryan Franklin. He got swings and misses only 18 percent of the time last season, and the random nature of luck caught up to him late in the 2009 season. There isn't a clear alternative closer in the bullpen.
2. Chicago: I actually think the Cubs will be better than many think. No, the Cubs aren’t getting good value for their $140 million payroll. I like the projected Fukudome-Nady platoon in right. But if Zambrano and Lilly stay healthy, and if Soriano doesn't have another season in which he plays like an 83-year-old – well, there’s a chance if the Cardinals slip.
3. Cincinnati: The Reds have become something of a trendy pick. Not to win anything, but to move up. A rising team. I’ll buy some of that stock. I like the rotation and figure that the offense will wake up a bit in 2010.
4. Milwaukee: Not enough starting pitching.
5. Houston: Bad farm system, strange spending habits, declining stars. The arrow is definitely pointing down.
6. Pittsburgh: In the words of David Byrne: Same as it ever was.
Bernie Miklasz, 51, has been the lead sports columnist for the St. Louis Post-Dispatch since 1989. He's also written for the Dallas Morning News and the late Baltimore News-American. He grew up in Baltimore and learned baseball by watching Earl Weaver manage.
| Change-Up | February 25, 2010 |
Stakeholders - Washington Nationals
From now through the beginning of the regular season, we will not be posting in-depth round-tables previewing each division like we have in years past. Instead we will feature brief back-and-forths with "stakeholders" from all 30 teams. A collection of bloggers, analysts, mainstream writers and senior front office personnel will join us to discuss a specific team's hopes for 2010. Some will be in-depth, some light, some analytical, some less so but they should all be fun to read and we are thrilled about the lineup of guests we have teed up. It might be a misrepresentation to characterize today's guest as a Nats "stakeholder" but he certainly was a huge fan of the Montreal Expos. It's Jonah Keri on the Washington Nationals.
 Patrick Sullivan: First, thanks a lot for joining us, Jonah. It's no secret that you look back on your days as a Montreal Expos fan with fondness. So tell me, if the 2009 Washington Nationals were in the same division as the 1994 Expos and they faced one another 19 times, what would Washington's record have been in those games?
Jonah Keri: Expos 18, Nationals 1. Montreal wins the first 18 games of the season series, escalating their post-game drinking after each win. The Expos finally lose Game #19 after Larry Walker, Marquis Grissom, Pedro Martinez and John Wetteland consume so much Molson Canadian that they begin hallucinating, mistake Adam Dunn for a fire-breathing dragon, and jump into the St. Lawrence River.
PS: Speaking of Adam Dunn, any idea why he is still playing in the National League? I had the "chance" to watch him play a game at 1st Base for the Nats last September at Wrigley and it was one of the worst single-game defensive performances I've witnessed. Oh and did I mention he started 84 games in the outfield last season?
JK: He's playing in the NL because no AL team saw fit to match the Nats' offer. Teams are (mostly) wise to the limited value of one-dimensional players. Most of the teams that aren't wise to this (say, KC) don't have the money to sign 'em anyway.
PS: Makes sense. Where do you come down on a signing like Jason Marquis? On the one hand, he won't figure into the next (first) Nats World Series team but on the other, you need to field a competitive baseball team. My personal take is that sometimes bad teams take too much heat for playing in the free agent middle market. What do you think?
JK: I agree with the general point, that you still have to puts butts in seats - plus always the option to flip a vet for prospects later. Just depends on the particulars of a given signing. In this case the price didn't seem too egregious.
PS: Ok let's focus on the positive for a moment. Talk to me about Stephen Strasburg, Ryan Zimmerman and Nyjer Morgan. Don't talk to me about Shairon Martis.
JK: I expect Strasburg to be in the Nationals' rotation and pitching well by June 1, if not sooner. His unique contract ensures the Nats don't need to play any dodgy games of service time suppression; the Rays got the benefit of a full Evan Longoria season in 2008 for similar reasons, and that worked out great. Strasburg instantly becomes one of the two best players on the team, with enough star power to be the rare player who gooses attendance by himself by dint of the "Dude, let's go see the Nats tonight! Strasburg's pitching!" demographic.
Zimmerman's the real deal. He's still only 25 so there's additional power potential there, which is scary after he cranked 73 extra-base hits last season. He's also a great defender and a worthy challenger to Beefcake McWright for the title of best third baseman in the NL.
I'm not completely sold on Nyjer Morgan. Yes, I'm well aware of the UZR numbers that say that Nyjer Morgan was more valuable than Joe Morgan last season (I'm almost not kidding). I'm just not ready to throw a parade in someone's honor for one year's worth of defensive data. Yes, he looked good in limited playing time in previous seasons, but this was Morgan's first year as a (near-)everyday player. I'm not convinced this is a player who's a lock for nearly 3 wins of value on his defense alone. The fact that he turns 30 this year doesn't inspire confidence either. If I were the Nats, I would have shopped Morgan this off-season after what was likely a career year. The problem is that the teams who will properly identify his great defensive value are also probably intelligent enough to be skeptical of one-year numbers and generally aware of the risk of regression to the mean. So the Nats will be stuck with a cheap defensive whiz who gets on base and steals tons of bases. There are worse fates, even if 2009 was the best we'll ever see from Morgan.
PS: Ok, the starting pitching is horrible, the bullpen has a few interesting arms in Brian Bruney, Matt Capps, Tyler Walker and Ross Detwiler, and here's the lineup.
C - Pudge
1B - Dunn
2B - Kennedy
3B - Zimmerman
SS - Guzman
LF - Willingham
CF - Morgan
RF - Dukes
Am I nuts or is that a decent lineup? Tell me what you think and then give me a prediction for this Nats team. Where would you set the over/under on wins?
JK: Pudge is finished and Guzman is a pretty lousy hitter when he's not over .300. Otherwise, absolutely. Loved the Adam Kennedy signing in particular. It's entirely possible that Kennedy's .337 wOBA last year was a fluke and that he'll revert back to being a negative at bat. But he put up those numbers playing in the AL, in Oakland no less, and his BABIP wasn't so far above career norms (.326, vs. .311 lifetime) that it suggests a huge regression ahead. Yes he's 34, no he's never been anything close to an elite player - but for $1.25 million, after the season he had in '09, Kennedy's a good get.
Dunn, Zimmerman and Willingham speak for themselves, all very good offensive players. Morgan's a useful table-setter and Dukes has plenty of upside in him, if the Nats will just leave him alone and give him 500 PAs.
Wins might be another story. Factors like bullpen can make a huge difference in converting talent into actual wins, and you're right that the Nats haven't made much of an effort to build out that part of the roster - with good reason, because giving big contracts to relief pitchers when you're not a contender makes little sense. PECOTA has the Nats at 76 wins, CHONE says 74. If Strasburg is in the rotation all year, or most of the year, I could see it. Otherwise, given the holes that come after the team's top few players, I'd take the Under on that 75-win midpoint.
PS: Great. Thanks so much, Jonah. Seems like the Nats might be a pretty decent bet for biggest jump in year over year win totals.
Jonah Keri is a writer for Bloomberg Sports (check out Bloomberg Sports' full suite of fantasy baseball tools here). He's also writing a book about the Tampa Bay Rays, their climb from worst to first, and the Wall Street-inspired methods they used to get there (Spring 2011, ESPN Books/Ballantine).
| Touching Bases | February 25, 2010 |
Shot Location Efficiency
A couple weeks ago, I wrote an article using data from basketballgeek showing shot location visualizations. The logical next step from visualizing the data is to use it for more analytical purposes. So I set about to build a model to predict points based on shot location.
Here is the expected field goal percentage based on shot location. The data set runs from 2006-2007 to this year's All-Star Break and contains over 600,000 shots.
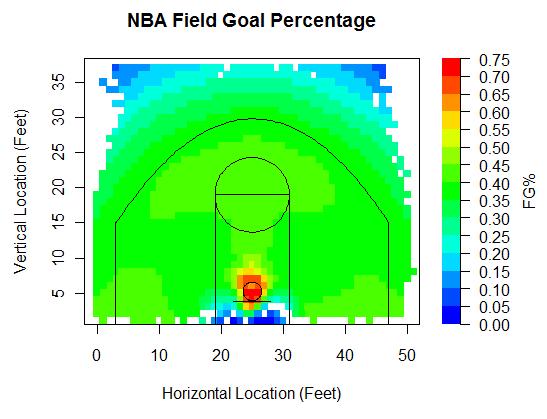
That is the starting point for my model. I take the expected field goal percentage for a given spot on the floor, and multiply it by either two or three, depending on whether the shot is an attempted two pointer or three pointer.
Another part of my model is offensive rebounding rate. From the field goal percentage chart, you can see that some three point locations are as high percentage shots as some two point locations, yet the value of a three pointer is inherently higher. Offensive rebounding rate on three pointers as compared to long two pointers is another reason that mid-range jumpshots are inefficient plays.
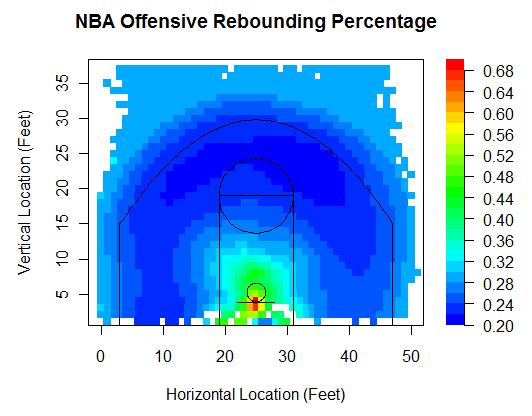
The value of an offensive rebound is contested in the basketball analytics community, as I recently learned. I understand why player evaluations based on linear weights don't work at all in basketball, but I'm not sure why they wouldn't work on the team level. Why can't we say that the average value of an offensive rebound is roughly equal to the average value of adding another possession. If somebody can enlighten me on if and why this assumption is faulty, I would appreciate it. Regardless, the average possession yields something like 1.05 points, so for each shot location, I multiplied the expected missed field goal percentage by the expected offensive rebounding percentage and again multiplied that by 1.05.
Then, I found the shooting foul rate based on shot location. This was a challenge, since the play by play files don't chart foul locations. I therefore used three resources to try to predict shooting foul locations. Ryan Parker collected data that tracks the locations of nearly every event over ten games, including 200 or so shooting fouls, which definitely helped. 82Games has charted shooting fouls, though the data isn't very granular, and they don't mention the magnitude of the study. Lastly, I found the shot locations of all made baskets where there was an and1. Here's what I came up with.
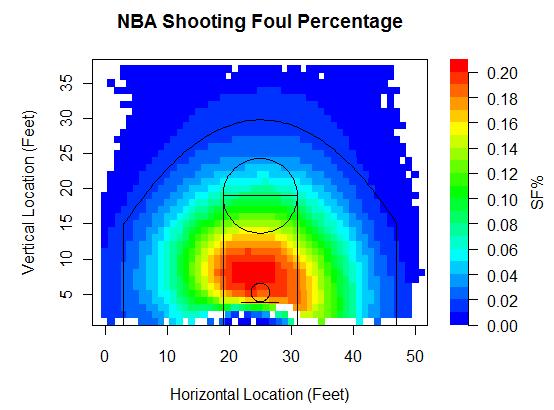
I think the above graph reasonable. It's too smooth, since I think there is probably a steep breaking point where players stop taking mainly jump shots and start playing with their backs to the basket. Jump shots are much less likely to draw fouls than post-ups, however my model can't capture that since I use smoothing techniques. The play-by-play data does include shot type information, so if I had a do-over, I would do some testing based on jumpers vs. other shot types. Anyway, what I do with my shooting foul model is multiply the rate of missed shots at a given location by the shooting foul percentage at that location, and then multiply that by either 2 or 3, and again by either 0.76 or 0.81, depending on whether the respective shot was a 2 or a 3, which represent the number of free throws a player earns for a shooting foul on a missed shot and the made free throw rates on those shots. I also multiplied the rate of made shots by the expected And1 percentage, which is much lower than the shooting foul percentage.
Put that all together, and here's my ultimate point expectancy model.
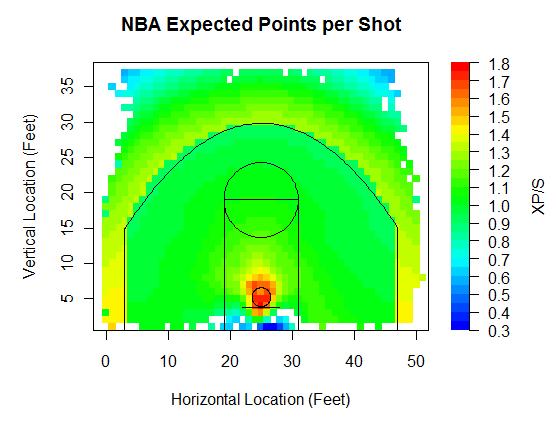
The average is up around 1.25. That's about 0.2 points better than the average possession, since plays that don't result in shots either end up as personal fouls or turnovers, mainly turnovers, which net 0 points. I applied the model on five-man units as well as individual players.
First, the top and bottom five five-man units in shot location efficiency, or expected points per shot. Ideally, some of the shooting, free throw, and rebounding percentage would be customized but I'm using league average rates for this entire study. Minimum 500 shots.
| Unit | Shots | Efficiency | eFG% |
|---|---|---|---|
| Dwight Howard Hedo Turkoglu Jameer Nelson Maurice Evans Rashard Lewis | 768 | 1.34 | 60.81% |
| Boris Diaw Gerald Wallace Nazr Mohammed Raymond Felton Stephen Jackson | 629 | 1.31 | 51.67% |
| Amare Stoudemire Leandro Barbosa Raja Bell Shawn Marion Steve Nash | 598 | 1.31 | 55.52% |
| Dwight Howard Hedo Turkoglu Jameer Nelson Keith Bogans Rashard Lewis | 1480 | 1.30 | 55.07% |
| Boris Diaw Emeka Okafor Gerald Wallace Raja Bell Raymond Felton | 1147 | 1.30 | 53.10% |
| Antonio McDyess Chauncey Billups Rasheed Wallace Richard Hamilton Tayshaun Prince | 1974 | 1.20 | 50.48% |
| Derrick Rose Joakim Noah John Salmons Luol Deng Taj Gibson | 546 | 1.20 | 45.79% |
| Kevin Garnett Mark Blount Mike James Ricky Davis Trenton Hassell | 1243 | 1.20 | 51.05% |
| Brandon Roy Joel Przybilla LaMarcus Aldridge Martell Webster Steve Blake | 1036 | 1.19 | 50.43% |
| Earl Watson Jeff Green Johan Petro Kevin Durant Nick Collison | 517 | 1.19 | 45.16% |
I'm happy to see that the Eastern Conference Champion Magic are the top team on this list because I'd always assumed that their offense last year was extremely efficient. The Magic had two options on offense. Dwight Howard took shots at the rim, while Hedo Turkoglu and Rashard Lewis hoisted threes. That unit was also by far the best in effective field goal percentage in the league, so they were getting high percentage shots, making high percentage shots, and though I can't include their free throw rates or offensive rebounding rates since those would be pains to calculate, I'm sure that with Dwight Howard, the Magic were successful at getting to the line and grabbing rebounds. The Suns, of course, are one of the top five teams.The Bobcats, surprisingly, take highly efficient shots, but don't make many of them. On the other end, we already knew the Bulls run an inefficient offense, and I'm not surprised to see the Pistons do too. That Thunder offense last year must have been absolutely brutal.
Now turning to defense, teams that force the least efficient shots.
| Unit | Shots | Efficiency | eFG% |
|---|---|---|---|
| Dikembe Mutombo Juwan Howard Rafer Alston Shane Battier Tracy McGrady | 766 | 1.20 | 46.54% |
| Dwight Howard Hedo Turkoglu Jameer Nelson Maurice Evans Rashard Lewis | 845 | 1.21 | 48.58% |
| Aaron Brooks Luis Scola Ron Artest Shane Battier Yao Ming | 670 | 1.21 | 46.19% |
| Bruce Bowen Fabricio Oberto Michael Finley Tim Duncan Tony Parker | 858 | 1.21 | 48.95% |
| Chuck Hayes Rafer Alston Shane Battier Tracy McGrady Yao Ming | 1007 | 1.21 | 43.15% |
| Emeka Okafor Gerald Wallace Jason Richardson Jeff McInnis Raymond Felton | 766 | 1.29 | 52.87% |
| Marc Gasol Mike Conley O.J. Mayo Rudy Gay Zach Randolph | 1700 | 1.29 | 52.56% |
| Jeff Green Kevin Durant Nenad Krstic Russell Westbrook Thabo Sefolosha | 1691 | 1.29 | 49.91% |
| C.J. Miles Deron Williams Mehmet Okur Paul Millsap Ronnie Brewer | 768 | 1.29 | 54.75% |
| Boris Diaw Gerald Wallace Nazr Mohammed Raymond Felton Stephen Jackson | 631 | 1.29 | 55.23% |
It's no surprise that the Rockets force teams into low percentage shots, as they boast three of the top five five-man units. That defensive lineup containing Chuck Hayes, Shane Battier, and Yao must be impregnable. And what do you know, but the Magic offense that generated the most efficient shots also had the defense that allowed the second most inefficient shots. Interestingly, the Bobcats offense that ranked second in shot efficiency actually allowed the most expected points per shot on the other end of the floor. I don't think I've watched a Bobcat game this year, but I'd be interested to know what's going on with that unit. A couple surprises on the bottom five list. The Thunder have made noise throughout the league for their much-improved defense, yet it's not a matter of holding opponents to inefficient shots. Instead, their opponents have gotten quality shots off, but have not made them, which would point to an impressive ability to contest shots. Also, the Thunder might do a good job of defensive rebounding and not fouling, which wouldn't appear in the numbers I'm showing.
The next table includes defensive stats for individual players, but still uses data based on the entire five-man opposition. I raised the minimum to 1,000 shots.
| Name | Shots | Efficiency | eFG% |
|---|---|---|---|
| Dikembe Mutombo | 2826 | 1.21 | 43.77% |
| David Harrison | 1360 | 1.21 | 47.65% |
| Shaquille O'Neal | 8909 | 1.22 | 49.34% |
| Yao Ming | 8181 | 1.22 | 45.74% |
| Jacque Vaughn | 2878 | 1.22 | 45.95% |
| Sam Young | 1334 | 1.28 | 50.64% |
| Salim Stoudamire | 1815 | 1.28 | 48.51% |
| Russell Westbrook | 6876 | 1.29 | 49.45% |
| Chris Douglas-Roberts | 2590 | 1.29 | 51.51% |
| Louis Williams | 3580 | 1.29 | 49.50% |
I could've guessed that the top defenders at forcing low percentage shots would be centers, since preventing shots at the rim is the best way to force inefficient jump shots. Dikembe Mutombo, even at (insert whatever made-up hilarious age here), remained an astonishingly good defender. He forced opposing teams into inefficient shots, and no player held rivals to as low an effective field goal percentage as Deke. I'm not sure if any of the guys who show up on the bottom five have reputations as poor defenders. Basketballvalue exhibits poor defensive ratings for Russell Westbrook and Lous Williams and says that by adjusted +/- Sam Young has been a flat-out awful player in general this year, though the guy who runs basketballvalue is the stats guy for Sam Young's team, the Grizzlies.
This table shows how a player's five-man unit performed while he was on the court.
| Name | Shots | Efficiency | eFG% |
|---|---|---|---|
| Steve Francis | 1405 | 1.31 | 48.01% |
| Eddy Curry | 5605 | 1.30 | 49.02% |
| Stephon Marbury | 5168 | 1.30 | 48.13% |
| Renaldo Balkman | 3842 | 1.30 | 47.07% |
| Donyell Marshall | 2634 | 1.30 | 46.70% |
| Antonio McDyess | 9614 | 1.21 | 48.42% |
| Cuttino Mobley | 8225 | 1.21 | 46.33% |
| Earl Barron | 1592 | 1.21 | 44.91% |
| Will Solomon | 1127 | 1.21 | 49.56% |
| Sam Cassell | 4017 | 1.20 | 46.93% |
The top four players were all Knicks during this time frame, as were three of the next eight on the leaderboard. All this is telling us is that Stevie Franchise, Starbury, and Baby Shaq all excel at hanging and banging, and that Isiah is attracted to that type of player. Sam Cassell, on the other hand, can't get to the rim. So I decided to take out a player's own shots, and include only shots by a player's teammates while he was on the floor.
| Name | Shots | Efficiency | eFG% |
|---|---|---|---|
| Steve Francis | 1161 | 1.32 | 49.61% |
| Jameer Nelson | 7475 | 1.31 | 52.49% |
| Stephon Marbury | 4137 | 1.31 | 48.65% |
| Steve Nash | 11406 | 1.30 | 56.11% |
| D.J. Augustin | 2986 | 1.30 | 48.44% |
| Amir Johnson | 3566 | 1.21 | 47.80% |
| Joel Anthony | 3196 | 1.21 | 47.70% |
| Roko Ukic | 1124 | 1.21 | 50.09% |
| Joel Przybilla | 7054 | 1.20 | 48.28% |
| Erick Dampier | 8368 | 1.20 | 49.46% |
At one end are players who spread the ball around and at the other end are players who inhibit floor spacing. Steve Nash's teammates had easily the highest effective field goal percentage, and oh by the way, Nash's own eFG% beats out that of his his teammates. Erick Dampier and Joel "Prezbo" Pryzbilla clog the paint like a hot fudge sundae clogs one's arteries.
| Change-Up | February 24, 2010 |
Stakeholders - Seattle Mariners
From now through the beginning of the regular season, we will not be posting in-depth round-tables previewing each division like we have in years past. Instead we will feature brief back-and-forths with "stakeholders" from all 30 teams. A collection of bloggers, analysts, mainstream writers and senior front office personnel will join us to discuss a specific team's hopes for 2010. Some will be in-depth, some light, some analytical, some less so but they should all be fun to read and we are thrilled about the lineup of guests we have teed up. We kick our Stakeholders series off today with none other than Dave Cameron on the Seattle Mariners.
 Patrick Sullivan: Dave Cameron, longtime Mariners fan, how much do you miss Bill Bavasi? It's OK, you can tell us, your friends at Baseball Analysts.
Dave Cameron: As a fan, not at all. As a blogger, more than you could imagine. We started blogging about the Mariners during the decline years of the Gillick era, when stuff started to go badly, so the first six years of USSMariner's existence essentially boiled down to a series of "Oh God no don't do that" posts, which were easy to write. Bill gave us Jose Vidro, Designated Hitter, for heaven's sake. From the perspective of someone who needed something to write about regularly, Bill was a gold mine. As any Royal fan will now tell you, covering a disaster of a GM doesn't take much creativity. It's easy.
Jack is not nice enough to provide similar material. The new front office stole all of our thunder, preaching the value of defense and guys who don't swing at everything. They basically implemented the plan we were begging Bill to put in place, and so now, we're left writing some version of a pat-on-the-back post. Oh, you found another undervalued good glove role player for the league minimum? Thanks, but what am I supposed to say that I haven't said yet? They're making us into cheerleaders, and frankly, I'm not comfortable in this role. I don't know how to root for a well run organization. I've never had these emotions before. They're new and they scare me.
But that doesn't mean I want Bill back.
PS: Everyone loves the off-season Seattle just had. We get it. But now I want to understand where you think they could have done better. I mean isn't there a real chance that the lineup is just awful?
DC: Interestingly, the move that I have the most reservations about has nothing to do with the offense. The "Your Brandon Is Better Than My Brandon" trade is the one move this winter that I think could end up turning out really poorly. Brandon Morrow is, without a doubt, a frustrating pitcher with a lot of red flags - lousy command, inconsistent secondary stuff, inability to get lefties out, a history of arm problems, and diabetes are just a few of the reasons he might never turn into anything. But he's still a 25-year-old pitcher making the league minimum with more strikeouts than innings pitched in his career. And the M's turned him into a relief pitcher.
Now, Brandon League is a good relief pitcher, and the bullpen needed help, but still, that trade has a lot of downside. Maybe the odds of Morrow putting it all together weren't great, but the potential payoff if he did was huge. The M's cashed in a high risk, high reward pitcher for a safer play to help them in 2010, but potentially surrendered a lot of long term value in the process. I can understand the reasoning behind the deal, but I still think that there were other ways to bolster the relief corps without sacrificing a guy with significant upside.
As for the offense, sure, there's a chance they could be terrible, but again, our DHs the last four years have been Carl Everett, Jose Vidro, and Ken Griffey Jr. We know how to cope with teams that can't score. And, honestly, I think this group of hitters is better than people give them credit for. Their runs scored total from a year ago is misleading, as the team performed horribly with men on base, and that's not predictive. A lot depends on Milton Bradley and how often he can stay in the line-up. If he gives the team 120+ games, the offense should be average-ish, maybe a tick below. Ichiro and Figgins are quality hitters, Bradley is as well when he's in the line-up, and Lopez/Kotchman/Gutierrez are all about average. Byrnes and Garko kill lefties and have enough upside to potentially be useful regulars. This isn't the 27 Yankees, but the Mariners should score 700 to 725 runs, which isn't awful for a team that plays half of its games in Safeco Field.
PS: I agree on Milton Bradley being the key to the offense. I'm rooting like heck for him. I've been accused of making too many excuses for Bradley but I just think he was never set up to succeed in Chicago. Who do you think will write more about Bradley this year, the Chicago or Seattle press? Out of the chute, Chicago has a HUGE edge.
DC: It will be interesting to see how the media in Seattle handles Milton. For the most part, it's a lower pressure group, and one that will not be as confrontational as the Chicago group was. But they won't turn a blind eye if he gives them something to write about. There is one beat writer in particular (Geoff Baker, Seattle Times) who won't hesitate to stir the pot when he senses a potential story, and he focuses quite heavily on the clubhouse interaction side of the game, so he won't be covering for Bradley if he's acting out. But, I think there are reasons to think this could work.
Seattle is not Chicago. Bradley has thrived in other low pressure markets like Texas and San Diego, which Seattle is more comparable too. And, while we obviously lean more towards the talent side of things in the chemistry debates, having Ken Griffey Jr around can only help. Bradley's been outspoken about his respect for Junior, and having someone he'll listen to may allow them to put out some small fires before they turn into an explosion. There are reasons to think that the Mariners may get the reasonably well behaved version of Bradley that was a big part of some good teams in the not too distant past.
But, of course, it could go badly wrong. There's no denying the fact that Milton has talked himself off of almost every team he's ever been part of. If he slumps out of the gate and the team isn't doing well, he's an easy target for people who will want to blame the team's regression on the decision to upset the clubhouse chemistry from a year ago. It's a pre-written narrative for the media, and they will take advantage of that storyline if handed the opportunity. So, it's in everyone's best interests for Bradley to hit the crap out of the ball in April and the team to get off to a hot start. If they're in last place in May, people will blame Milton, and I don't think the M's want to bet their season on Bradley responding well to criticism.
PS: Talk to me a little bit about Seattle's starting pitching after Felix Hernandez and Cliff Lee.
DC: As those two go, so go the Mariners. It's certainly a risk to put your eggs in the basket of two pitchers, and an extended DL stint for either one probably takes the Mariners out of contention. But, these two are legitimately among the top arms in baseball, and the Mariners will be the favorite in every game where they take the hill. If they can get 65 starts out of that pair, there's a good chance they'll get 45+ wins in those games, and they could then play below .500 ball the rest of the season and still be a playoff contender. That's the blueprint, essentially - win early and often when Felix and Lee are on the hill, try not to get pummeled when the other guys start.
Will it work? I don't know. But if it does, and the Mariners end up making the post-season, that duo makes them a nightmare to face in a short series. The Mariners certainly aren't as good as the Yankees, Red Sox, or Rays, but in a 7 game series where Felix and Lee take the hill four times, the differences are minimized. With these two guys, the Mariners have a roster built for October. Whether the surrounding pieces are good enough to get them there, we'll see, but there are certainly two cornerstones in place for a post-season run that ends
with a parade.
PS: Thanks so much for your time, David. Want to wrap with a prediction? Maybe even a kind word about Jered Weaver?
DC: I predict that there will be far too many words written about the Mariners this year. Based on the quantity of articles written this winter, it seems that the Mariners have become the new go-to-story for national media looking to focus on how an organization is changing the game, and unfortunately, this team is going to become something of a litmus test for the value of defense. There have been so many words written about how the M's have gone gaga for fielding that I feel like the skeptics of defensive metrics are just waiting for this team to struggle so they can hold the Mariners as evidence that defense doesn't really matter or UZR isn't accurate.
So, let me just throw this out there - this team very well might not win. They've bet big on a few guys staying healthy and productive, and they're counting on guys playing better than they have in the recent past in order to score enough runs to contend. There are a ton of risks in this roster, and it could all go horribly wrong. There are plausible scenarios where this team loses 90 games, and they have nothing to do with defense being overrated.
I am rooting for this team to do well as a fan, but also as someone who has fought hard for the acceptance of defensive value over the last few years. Defense matters, whether the Mariners end up winning with this particular roster or not.
As for Weaver, I still see him as a mid-rotation starter, but I will say that his splits have led me down an interesting path, which I think may end up leading us to better understand how certain pitchers can indeed use deceptive motions and arm slots to sustain "lucky" performances against same handed hitters. It's not exactly the highest compliment I could pay someone, but not every innings eater ends up pushing knowledge forward, so thanks for being weird, Jered.
Dave Cameron is a co-founder of USSMariner.com and is also the managing editor of the FanGraphs blog. He also contributes to the Wall Street Journal, and was the editor of the Maple Street Press 2010 Mariners Annual. His wife deserves a medal for allowing him to do all this.
| Behind the Scoreboard | February 23, 2010 |
Spring Training, PECOTA, and the Regular Season
Over at Sports Illustrated last week, I wrote an article on how spring training records aren't all that meaningless. It's been a blast writing over at SI.com, but one of the downsides is that I can't delve into as much nitty-gritty as I can here. When I run a regression or do a study, I like to be able to report things like p-values, standard errors, and other things that baseball analysts use to assess a study's validity. I know it would be tough for me to take a study seriously without those kinds of metrics, so I'm going to provide some of that detail here. The discussion is particularly salient in light of Richard Lederer's recent criticism and discussion of PECOTA.
If you haven't read my original article, the point of my study was to determine whether spring training games had any predictive value at all. Like most fans, I was of the mind that spring stats and standings had pretty much no bearing on what will occur during the regular season. David Cameron had a piece over at Fangraphs saying as such last week (anecdotal evidence only though). I set out to find if this was true.
To measure the impact of spring training, I first needed a "gold standard" prediction. For this I used Baseball Prospectus' PECOTA projections. If spring training data could improve on PECOTA's predictions, I would feel confident in saying that spring training could really be worth a second look.
The Results
To do this, I did a regression analysis which tried to predict a team's season WPCT going back to 2003. Obviously the PECOTA prediction was one key variable. The second variable, which was of more interest, was whether a team under or over-performed in spring training, measured by (Spring Training WPCT - PECOTA WPCT).
The results of the model are below:
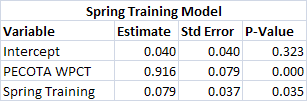
This gives the formula:
WPCT = .040 + (PECOTA WPCT) *.916 + (Spring Training WPCT - PECOTA WPCT) * .079
As we see, the spring training variable is significant and positive even when accounting for a team's expertly predicted WPCT. This means that indeed spring training records actually do have some predictive value and do add to our prior knowledge of a team's skills. As I wrote last week, the most surprising spring training teams should adjust their projections by about 3 games or so.
One important thing to note however is that while adjusting a team's projected WPCT by using spring stats is a statistically significant improvement, don't expect a huge boost in accuracy. The Root Mean Squared Error (RMSE) goes from .055 using only PECOTA, to .054 using PECOTA and spring training records. That issue is one that plagues any type of projection system. Even if you include things that really are important and really do increase accuracy, the net result is quite small. To drive home the point, PECOTA's .055 RMSE is not even all that much better than just predicting every team will go .500. The Everybody Plays .500 Projection System has an RMSE of .070.
PECOTA will be correct within 9 games 67% of the time, while the Everybody Plays .500 System will be correct within 11 games 67% of the time. The difference between one of the top projection systems and knowing absolutely nothing is not all that great. That's not a knock on PECOTA, it just underscores the fact that it's really difficult to predict what's going to happen. Knowing spring training records is an improvement, but it still leaves us relatively in the dark.
Do We Have to Regress PECOTA?
Another interesting thing I found in my research into this was that PECOTA's predictions may be overzealous. I had assumed that PECOTA did not regress to the mean in the 2003 and 2004 seasons, when they were predicting the Yankees to win 109 games. They said they did some major overhauls and I assume this was one of them. In my research above, I corrected this for them and regressed to the mean in '03 and '04. The problems were not nearly as bad in subsequent years and I assumed they had been fixed. However, they still seem to persist.
Unbiased predictions would cause a regression of PECOTA to WPCT to have a slope of 1 and no intercept. However, using just 2005-2009 data, we see that this is not the case. We see a quite significant intercept of .10 (p-value of .02). Meanwhile the coefficient for PECOTA is .8, where it should be 1. In essence, PECOTA has been too overzealous in its predictions. If it predicts a team to go 10 games over .500, the best statistical estimate is that the team goes 8 games over .500. When betting against PECOTA, it pays to take the under on good teams and the over on bad teams.
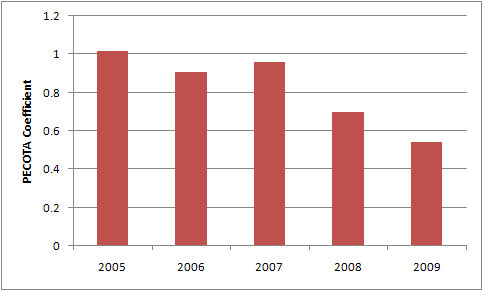
The chart above shows the PECOTA to WPCT regression coefficient, where the ideal is 1. As you can see, from 2005-2007, they accounted well for the regression effect. But in the past two years they've gone downhill. While luck can wreak havoc with any projection system, the problem is beginning to look a little more systematic. Looking at the 2010 projections, they seem to pass the eyeball test (Angels notwithstanding), but I'll be curious to see whether this problem persists in 2010 as well. As I showed above, it wouldn't hurt for them to use spring training stats in their projections as well.
| Baseball Beat | February 22, 2010 |
Long Beach State's Thompson Shines on Rainy Opening Night
The NCAA college baseball season got underway on Friday night. I was fortunate to be on hand for an opener once again as Long Beach State upended the visiting Pepperdine Waves, 2-1, behind Jake Thompson's first complete game of his career.
Six years ago, I saw Jered Weaver strike out the first ten USC batters, including four in the third inning, in Long Beach State's home opener. I was also in attendance when Stephen Strasburg ushered in the 2009 season by striking out 11 while fashioning an electric fastball that registered at 100 mph on the radar guns.
While Thompson is not in the same class as Weaver or Strasburg, the junior righthander is a legitimate prospect. His fastball sat at 92-93 all game and hit 95 with an adrenaline rush on the last pitch when he struck out Ryan Heroy on a high heater to end it. The Friday night ace was efficient, throwing 105 pitches (including just one that was called a ball in the first three innings) while whiffing six and allowing only a half dozen batters to reach base.
At 6-3 and 225 pounds, Thompson has a thick body with strong legs. Only 20 years old, he is young for a junior. Jake passed his GED and skipped his senior season at Wilson HS to enroll at Long Beach State a year early. Thompson is also short on experience due to the fact that he sat out his junior year in high school after transferring from Mayfair HS where he went 6-1 with a 1.33 ERA as a sophomore.
Recruited by the highly regarded Troy Buckley three years ago, Thompson didn't receive his new pitching coach's tutelage in his freshman and sophomore years owing to the fact that his mentor left the program to become the minor league pitching coordinator with the Pittsburgh Pirates. Buckley returned to Long Beach as an assistant head coach prior to this season and Thompson appears to be back on track after not living up to expectations the past two years.
Buckley has an outstanding track record in handling college pitchers. In order, Abe Alvarez, Jered Weaver, Jason Vargas, Cesar Ramos, Andrew Carpenter, and Brian Shaw were all selected in the first two rounds of the MLB draft after working under Buckley. All but Shaw, the most recent draftee of the six, have reached the majors.
Thompson outdueled Cole Cook, a draft-eligible sophomore who posted a 7-3 record with a 3.69 ERA as a freshman in 2009. The 6-6, 220-pound righthander's favorite player is none other than Jered Weaver. Cook's fastball was mostly 93 with a high of 96. He also flashed an excellent curveball and induced two inning-ending double plays in the fourth and fifth. Cook threw 96 pitches, including 66 strikes, over seven innings while allowing seven hits, a walk, two runs, and striking out seven. Look for Thompson and Cook to get taken in the early rounds in the MLB Draft this June.
In a weekend tournament that featured Long Beach, Pepperdine, Cal State Fullerton, and Oregon, the Dirtbags fell to the Ducks, 6-2, on Saturday and to the No. 4-ranked Titans, 8-1, on Sunday. CSF's Christian Colon, a potential first-round draft pick, went 2-for-4 with a solo home run in the latter contest.
Oregon is led by two-time National Coach of the Year George Horton, who spent 11 seasons at Cal State Fullerton and led the Titans to the 2004 National Championship. He is one of nine men to have appeared in Omaha as a player (1975) and a head coach. Horton's club beat his alma mater, 7-3, on Friday and lost to Pepperdine, 11-7, on Sunday.
Elsewhere, Gerrit Cole of No. 23 UCLA threw a dandy in an MLB Urban Invitational contest on Friday evening at UCLA's Steele Field at Jackie Robinson Stadium. He allowed two runs but only one hit and no walks over six innings en route to a 16-2 victory over Southern in which the Bruins belted four home runs. Cole is one of the early candidates to go No. 1 in the 2011 draft. The Yankees took him in the first round in 2008 but the 6-4, 220-pound righthander opted to attend UCLA instead.
Top-ranked Texas dropped two out of three to New Mexico over the weekend. No. 2 LSU swept Centenary with the Tigers outscoring the Gentlemen 34-12. The 6-7, 230-pound Anthony Ranaudo, who could make a strong case as the best college pitcher in the country, allowed one unearned run over five innings on Friday. Paul Mainieri won his 1,000th career game on Saturday.
No. 3 Virginia took two out of three from East Carolina, No. 5 Rice lost all three games to No. 30 Stanford, and No. 6 Florida State, No. 7 UC Irvine, No. 8 Arizona State, No. 9 Georgia Tech, and No. 10 Florida all swept their opponents over the weekend. The Seminoles outscored Georgia State 37-12. However, the Rambling Wreck did them one better, crushing Missouri State 37-3, including a 4-0 whitewash in Bryan Smith's featured opener that saw Deck McGuire, a 6-6, 218 junior righthander, toss seven scoreless innings with 10 strikeouts and no walks. If Ranaudo isn't the top college pitching prospect in this year's class, then it is probably McGuire.
For more on college baseball, be sure to check out D1 Baseball, Baseball America, Boyd's World, and College Baseball Splits.
| Baseball Beat | February 21, 2010 |
PECOTA and History on the Angels Side of Not Being 21 Games Worse in 2010
My short post on Friday seemed to create quite a stir in the comments section so I promised to deliver a follow-up piece that would expand upon my initial take on Baseball Prospectus' prediction whereby the Los Angeles Angels would go 76-86 and finish last in the AL West in 2010.
If the truth be told, PECOTA has been consistent, if not accurate, when it comes to the Angels. It has underestimated the number of Angels wins by a minimum of eight games every season since 2004. On average, the system has shortchanged the Angels by 11 games per annum over the past half dozen years.
| Year | Projected Wins | Actual Wins | Difference |
|---|---|---|---|
| 2010 | 76 | ||
| 2009 | 84 | 97 | -13 |
| 2008 | 87 | 100 | -13 |
| 2007 | 86 | 94 | -8 |
| 2006 | 81 | 89 | -8 |
| 2005 | 83 | 95 | -12 |
| 2004 | 82 | 92 | -10 |
| Average | 84 | 95 | -11 |
After reviewing these results, I have more confidence than ever in PECOTA, at least as it relates to the Angels. Here is the formula: Take the number of wins that the system forecasts for the Halos and add a minimum of eight and a maximum of 13 victories to determine the range of the team's expected win total.
With respect to 2010, PECOTA believes the Angels will win 76 games. Add 8-13 wins and... bingo, you get the range of victories (84-89) for the coming season. If you desire a more pinpoint total, then take PECOTA + 11 = 87.
While I admit to hindsight bias, my point of contention is not based on a sample size of one or two, nor selectively choosing this year or that year. Instead, it is based on each of the past six seasons. (PECOTA actually overestimated the number of Angels wins by five in the system's first year of existence in 2003. For the 2003-2009 period, PECOTA missed by an average of approximately 8 1/2 wins per season.)
If PECOTA is right and the Angels win 76 (or fewer) games in 2010, it will mark only the 36th time since Major League Baseball went to a 162 game schedule in 1961 (AL) and 1962 (NL) that a team's win total fell by at least 21 games year over year. In other words, such a collapse happens twice every three seasons or about one in 40 times when you factor in the total number of seasons involved during this period.
Granted, the higher the wins in the base year, the higher the odds of achieving infamy in the following year. Excluding 2009, teams have won 90 or more games 377 times since 1961. Twenty-one of those clubs (or 5.6%) won at least 21 fewer games the next season. Similarly, teams have matched or exceeded the Angels win total of 97 games last year 100 times since 1961. Nine of those clubs (9.0%) won at least 21 fewer games the following campaign. As a result, if history is any guide, there is less than a 1-in-10 chance of the Angels being 21 games worse in 2010 than 2009.
Here is a list of all the teams whose win totals have fallen by 21 or more games since the schedule was expanded to 162 games.
| Team | Year | Wins | Year | Wins | Decline |
|---|---|---|---|---|---|
| SEA | 2007 | 88 | 2008 | 61 | 27 |
| SD | 2007 | 89 | 2008 | 63 | 26 |
| LAD | 2004 | 93 | 2005 | 71 | 22 |
| KC | 2003 | 83 | 2004 | 58 | 25 |
| SEA | 2003 | 93 | 2004 | 63 | 30 |
| ARI | 2003 | 84 | 2004 | 51 | 33 |
| LAA | 2002 | 99 | 2003 | 77 | 22 |
| CHC | 2001 | 88 | 2001 | 67 | 21 |
| SEA | 2001 | 116 | 2002 | 93 | 23 |
| TEX | 1999 | 95 | 2000 | 71 | 24 |
| CHC | 1998 | 90 | 1999 | 67 | 23 |
| SD | 1998 | 98 | 1999 | 74 | 24 |
| FLA | 1997 | 92 | 1998 | 54 | 38 |
| OAK | 1992 | 96 | 1993 | 68 | 28 |
| MIL | 1992 | 92 | 1993 | 69 | 23 |
| PIT | 1992 | 96 | 1993 | 75 | 21 |
| SD | 1992 | 82 | 1993 | 61 | 21 |
| LAD | 1991 | 93 | 1992 | 63 | 30 |
| DET | 1988 | 88 | 1989 | 59 | 29 |
| CLE | 1986 | 84 | 1987 | 61 | 23 |
| STL | 1985 | 101 | 1986 | 79 | 22 |
| LAD | 1985 | 95 | 1986 | 73 | 22 |
| CWS | 1983 | 99 | 1984 | 74 | 25 |
| LAA | 1982 | 93 | 1983 | 70 | 23 |
| LAA | 1979 | 88 | 1980 | 65 | 23 |
| OAK | 1976 | 87 | 1977 | 63 | 24 |
| NYM | 1976 | 86 | 1977 | 64 | 22 |
| ATL | 1974 | 88 | 1975 | 67 | 21 |
| MIN | 1970 | 98 | 1971 | 74 | 24 |
| CIN | 1970 | 102 | 1971 | 79 | 23 |
| CLE | 1968 | 86 | 1969 | 62 | 24 |
| CWS | 1967 | 89 | 1968 | 67 | 22 |
| BAL | 1966 | 97 | 1967 | 76 | 21 |
| LAD | 1966 | 95 | 1967 | 73 | 22 |
| NYY | 1964 | 99 | 1965 | 77 | 22 |
As it relates to the Angels, it would be one thing if the team's payroll had been slashed or its roster dismantled via trades or free agency this fall and winter. However, the reality is that the Halos personnel has not changed materially since last October. Sure, the Angels may give up a little by losing Chone Figgins, Vladimir Guerrero, and John Lackey and replacing them with the untested Brandon Wood, the aging Hideki Matsui, and Joel Pineiro, who is coming off a career year. Maybe 2009 is as good as it gets for Erick Aybar and Kendry Morales even though both players are just 26 years old. Perhaps Bobby Abreu, 36, and Torii Hunter, 34, fall off the cliff at the same time despite providing relatively steady production over the past several years.
On the other hand, is it unreasonable to expect Scott Kazmir to contribute more to the Angels cause over the course of a full season in 2010 than he did in his only month of service in 2009? The 26-year-old lefthander has averaged nearly 29 starts during his first five campaigns. Pop in 23 additional starts for Kazmir and take away a like number from your choice of Matt Palmer (13 GS in 2009), 21-year-old rookie Sean O'Sullivan (10), Shane Loux (6), 22-year-old rookie Trevor Bell (4), Dustin Moseley (3), and 23-year-old rookie Anthony Ortega (3) and tell me what that's worth?
Speaking of starting pitchers, have we forgotten just how good Ervin Santana was in 2008 when he ranked in the top ten in MLB in FIP, xFIP, WHIP, K/9, K/BB, and WAR? Well, the 27-year-old righthander opened up 2009 on the DL, racked up a 7.81 ERA in the first half, and settled down to a 3.09 ERA with two complete game shutouts in the final two months.
Could Howie Kendrick, who hit .358/.391/.558 in the second half after returning from a stint in the minors, add more value in 2010 than 2009 when he played in only 105 games? How about Kevin Jepsen, the strikeout/groundball specialist with one of the hardest and best fastballs as well as cutters and sliders in the game?
Look, the Angels are likely to suffer their share of injuries this year. One or two youngsters won't pan out. One or two veterans will disappoint. But, maybe... just maybe a few things will go their way that could serve to offset some of the negative surprises that are bound to occur in the season ahead.
Put it all together and it seems difficult to comprehend how the Angels could go from 97 wins in 2009 to 76 wins in 2010.
| Baseball Beat | February 19, 2010 |
This Just In: Angels Will Be 21 Games Worse in 2010 Than 2009
I opened up the inbox of my emails this morning and was notified via the Baseball Prospectus Premium Newsletter that "a changing of the guard sees the Angels drop to the bottom behind a Rangers/Mariners battle" in its AL West preview. With my curiosity piqued, I clicked on the attendant link and scrolled down to the following excerpt:
Los Angeles AngelsProjected record: 76-86
Why They Might Win: While they have lost Lackey, they still have a very formidable rotation with Jered Weaver, Joe Saunders, Ervin Santana, Scott Kazmir, and Joel Pineiro. Mike Scioscia is among the game's best managers; his teams always outperform the sum of their parts.
Why They Might Not Win: Figgins is a big loss. He was excellent both as a table-setter at the top of the batting order and with the glove at third base. Counting on Brian Fuentes and Fernando Rodney to be the primary late-inning relievers just seems to be asking for trouble.
Player Who Could Surprise: Brandon Wood, whom it seems has been a prospect since Jim Fregosi was the Angels' star, will finally get his chance at the major-league level. PECOTA projects Wood to hit 25 home runs as Figgins' replacement.
Player Who Could Disappoint: Rodney converted 37 of 38 save opportunities for Detroit last season, but PECOTA sees him with a 4.34 ERA this year, a high figure for a guy who was paid a lot of money on the free-agent market to pitch in high-leverage situations.
Hmmm... According to PECOTA, the Angels are going to win 21 fewer games in 2010 than 2009 and finish last in the AL West.
Let me see if I can reconcile that difference. Rely on last year's actual or this year's projected PECOTA or WAR if you must, but I'm just going to spell out the major differences in personnel between the 2010 and 2009 Angels.
Joel Pineiro vs. John Lackey, Brandon Wood vs. Chone Figgins, Hideki Matsui vs. Vladimir Guerrero, and Fernando Rodney vs. Darren Oliver. I guess each one of these pairings is going to amount to a loss of five wins. Oops, I forgot to mention that if Scott Kazmir can stay healthy, the Angels will get a full season out of him rather than one month. We'll keep it simple and call six months vs. one month a push. With respect to the rest of the team, which is made up mostly of young players getting better rather than old players getting worse, they will be responsible for losing one more game this year than last year.
You see, last year, the Angels were apparently talented and lucky. This year, the Angels apparently lack talent and are going to be unlucky. Nice.
I just wish BP would put its money where its mouth is and book that 76 as an over/under. I would be the first one in line.
| Touching Bases | February 18, 2010 |
The Verducci Effect
On Monday, Will Carroll noted that the Verducci Effect was being discussed on MLB Network. On Tuesday, Tom Verducci posted his ten young pitchers at risk of the Effect. Then to top it off, yesterday Josh Hermsmeyer unveiled a free player injury database. I've been meaning to research the Verducci Effect for some time, so this seemed like as good a time as any.
The Verducci Effect, also known as the Year-After Effect, is defined by BP as "a negative forward indicator for pitcher workload," Specifically, pitchers under the age of 25 who have 30-inning increases year over year are at risk. David Gassko's research pointed to the opposite. With pitch by pitch data from FanGraphs and disabled list data from Rotobase, I attempt to expand on Gassko's preliminary analysis, although purely numerical research on injury prediction and pitch limits will never come close to showing conclusive results.
I found 340 pitchers who pitched three consecutive years in MLB at ages 25 and under since 2002. 140 of them fit the Verducci Effect, while 200 did not. Here's the data.
| IP | FBV | K/9 | BB/9 | GB% | BABIP | WHIFF | ZONE | DL | DAYS | |
|---|---|---|---|---|---|---|---|---|---|---|
| Year One | 48.3 | 90.4 | 7.3 | 3.7 | 41.5% | 0.313 | 20.6% | 51.4% | 18.71% | 51.6 |
| Year Two | 126.5 | 91.1 | 7.0 | 3.4 | 44.2% | 0.302 | 19.7% | 52.0% | 20.14% | 36.6 |
| Year Three | 113.1 | 90.9 | 7.2 | 3.3 | 43.3% | 0.305 | 19.6% | 51.4% | 29.50% | 59.4 |
| Difference | -13.3 | -0.2 | 0.2 | -0.1 | -0.8% | 0.003 | -0.1% | -0.6% | 9.35% | 22.8 |
| IP | FBV | K/9 | BB/9 | GB% | BABIP | WHIFF | ZONE | DL | DAYS | |
|---|---|---|---|---|---|---|---|---|---|---|
| Year One | 80.5 | 91.3 | 7.0 | 3.6 | 42.1% | 0.301 | 20.6% | 52.0% | 20.49% | 48.9 |
| Year Two | 65.7 | 91.3 | 7.1 | 3.6 | 42.2% | 0.326 | 20.2% | 51.4% | 34.63% | 69.5 |
| Year Three | 85.2 | 91.5 | 7.3 | 3.5 | 41.9% | 0.306 | 20.7% | 51.0% | 36.10% | 57.6 |
| Difference | 19.5 | 0.1 | 0.2 | -0.1 | -0.3% | -0.019 | 0.5% | -0.4% | 1.46% | -11.9 |
The first point of interest is the decrease in innings pitched for those under the influence of the Verducci Effect. I should preface the rest of this analysis with a few popular credos: TINSTAAPP, regression to the mean, and small sample size. First, pitching is an inherently risky business. Dave Cameron recently wrote a great piece on how successful young pitchers often peak early. This problem is exacerbated by the nature of the Verducci Effect, which dictates that pitchers establish a career high in innings pitched. If you take any group of players who establish a career high in any category, chances are that they will regress to the mean the following year. Finally, my sample again only contains 140 Verducci pitchers. One can't draw important conclusions from a sample of that size. You've been given fair warning.
In general, 25-and-under pitchers improve their peripherals in their third year. Their strikeout rate trends up while their walk rate trends down. Gassko found similar results. I'm not so interested in whether or not young pitchers improve; I'm looking to see where Verducci Effected pitchers differ from other pitchers.
Therefore, the Difference row is the row of interest, as it represents the change from the innings-jump year to the Year After. There are four terms in the Difference row that report different positive/negative signs (besides innings pitched) between each group. BABIP, velocity, whiff rate, and days per DL trip. That Verducci Effected pitchers suffer worse luck based on BABIP and that their counterparts exhibit better fortune speaks to the infallibility of regressing to the mean. I'm not so interested in the contact rate of pitchers, but I decided to further explore the possible velocity and injury aspects of the Verducci Effect. So I turned to the statistical technique of regression analysis.
First, I tried predicting fastball velocity using several separate variables for age, past velocity, and past workload. I've looked at the topic of velocity curves before. Velocity generally peaks during a pitcher's mid twenties. Here are the regression results, which I've broken down by variable type.
| Age | Coefficient | P-Value |
|---|---|---|
| 32 Up | NA | NA |
| 29-32 | 0.14 | 0.03 |
| 26-29 | 0.30 | 0.00 |
| 26 Down | 0.55 | 0.00 |
Younger pitchers have a .5 MPH advantage over older pitchers in velocity.
| Velocity | Coefficient | P-Value |
|---|---|---|
| Year One | 0.18 | 0.00 |
| Year Two | 0.78 | 0.00 |
Fastball velocity from the previous year has nearly five times as much predictive value as fastball velocity from two years ago.
| Workload | Coefficient | P-Value |
|---|---|---|
| Year One Pitches (1000) | 0.06 | 0.11 |
| Year Two Pitches (1000) | -0.14 | 0.00 |
| Verducci Effect | -0.30 | 0.02 |
The previous year's workload helps predict velocity. Throwing a thousand pitches in a year coincides with a drop in velocity of more than a tenth of a mile per hour. This could represent the difference between starters and relievers, in that starters throw more pitches at a lower velocity than relievers. Also, pitchers who have undergone the Verducci Effect have thrown softer than non-Effected pitchers to the tune of 0.3 MPH.
Next, I ran another linear regression to predict days spent on the disabled list in a pitcher's third consecutive year of pitching.
| DL History | Coefficient | P-Value |
|---|---|---|
| Year One DL Trips | 4.19 | 0.09 |
| Year Two DL Trips | 5.90 | 0.01 |
| Year One DL Days | -0.03 | 0.46 |
| Year Two DL Days | 0.18 | 0.00 |
First off, predicting future health is hard. While I was able to predict nearly 90% of a pitcher's fastball velocity without developing a very sophisticated model. The disabled list model explains only 6% of a pitcher's health. Nevertheless, injuries from the previous year are significant, as each trip to the DL tends to yield another several days on the DL the following year.
| Age | Coefficient | P-Value |
|---|---|---|
| 32 Up | NA | NA |
| 29-32 | -1.31 | 0.60 |
| 26-29 | -3.72 | 0.13 |
| 26 Down | -0.16 | 0.96 |
Age isn't a very strong predictor of future injuries. Pitchers on either extreme of the age spectrum are most at risk, but the results aren't significant. Verducci might've chosen a wise cutoff at age 25, as this table shows that there could well be a point at which pitchers grow less vulnerable.
| Workload | Coefficient | P-Value |
|---|---|---|
| Year One Pitches (1000) | 0.6 | 0.78 |
| Year Two Pitches (1000) | 4.3 | 0.06 |
| Verducci Effect | 0.63 | 0.90 |
The Verducci Effect, like most everything else I tested, is not significant in predicting future injuries. Injuries are hard enough to predict as is, and there's certainly no straightforward rule of thumb. A high workload does coincide with a trip to the DL the following year, though the causative effect may be that pitchers who throw a lot of pitches have more opportunities to get injured, rather than the pitches placing more stress on their arms.
Verducci identifies the likes of Felix Hernandez and Josh Johnson as pitchers at risk. Verducci Effect or not, those guys aren't going to replicate their spectacular seasons. But Verducci also points to lesser pitchers such as Homer Bailey and Joba Chamberlain, who failed to live up to their prodigious potential last year. Bailey's fastball velocity leaped up three MPH last year while Joba's velocity dipped by a similar amount. I say if they stay healthy, they both improve on their performance from last year, but chances are at least one of them hits the DL. The data show that workload and age help predict production, velocity, and injuries, but the jury's still out as to whether the Verducci Effect helps explain the nexus between injury and risk beyond what one would expect from young pitchers with taxing workloads.
| Change-Up | February 17, 2010 |
Boston's Bullpen
Ostensibly, the 2009 Red Sox had one of the very best bullpens in the American League, trailing only Oakland for bullpen ERA. I was reminded of this since I finally had a chance this week to dig into my Hardball Times 2010 Annual on a cross-country flight, and one of the points Evan Brunell's 2009 AL East round-up makes is that relief pitching was really the only area where Boston enjoyed an edge over the rival Yankees.
If ERA is your thing, Jonathan Papelbon had another excellent year. Hideki Okajima, Takashi Saito, Ramon Ramirez and Daniel Bard combined for over 235 innings of 3.21 ERA pitching. Billy Wagner pitched effectively down the stretch. Of the Red Sox relievers slated for regular work in 2009, it was only Manny Delcarmen that struggled.
While Wagner and Saito have both moved onto Atlanta, Delcarmen, Ramirez, Bard and Okajima are back. And when you peek more closely at the second half performance in 2009 of these four, the outcome is not quite as pretty. All four saw their performances drop off dramatically. Ramirez and Okajima's peripherals were awful, Delcarmen was finally shelved after his performance made it plainly evident that he was hurt and Bard suffered from some tough in-play luck. By the time the post-season started, the Red Sox bullpen was limping to the finish line. Papelbon's Game 3 meltdown against the Angels in the ALDS seemed a fitting ending for a team that struggled for bullpen consistency over their last 70 games or so.
With their starting pitching looking top notch, their defense much improved and a lineup in store for another big year, the Red Sox come into 2010 with some questions in the bullpen. Have a look at Boston's relief holdover contingent's fielding independent figures from 2009:
               xFIP
Papelbon       3.98
Bard           3.25
Delcarmen      5.32
Okajima        4.59
Ramirez        5.09
If you take Boston's starting rotation plus Tim Wakefield and then add these five, the Red Sox would appear to have one roster spot available in the bullpen. But given what I have run through thus far, it seems like contingency planning for subpar performance from Delcarmen, Okajima and/or Ramirez would be smart. Likewise, Papelbon's walk rate spike is worth monitoring. Bard seems like he might be the most solid of the bunch.
Smartly, the Red Sox seem to be planning for the worst case with a host of youngsters, live arms, reclamation projects and hangers-on with mixed track records in professional baseball. The list won't knock your socks (Sox?) off, but it would seem likely that a couple of effective arms would emerge from the likes of Joe Nelson, Brian Shouse, Boof Bonser, Ramon A. Ramirez, Michael Bowden, Fabio Castro, Scott Atchison, Dustin Richardson, Felix Doubront, Fernando Cabrera, Junichi Tazawa and others. Some will move on because they are out of options or because they negotiated out-clauses in their Minor League contracts, but it appears that the Red Sox should have enough alternatives throughout the organization to move quickly should the bullpen falter early.
Since he is out of options and because he would seemingly fit the Justin Masterson role of live righty arm who can spot start, I am rooting for Boof Bonser to have a big Spring. From there, I think the rest of it will have to sort itself out as the year goes on.
| Behind the Scoreboard | February 16, 2010 |
There Are Two Types of Pitchers....
Two weeks ago, I used a principal component analysis to try to separate hitters into two distinct groups. The hitters broke down between "three-true-outcome" players like Adam Dunn (lots of homers, walks and strikeouts) and small-ball type players like Ichiro Suzuki (contact hitters with a lot of singles, but not many walks or homers). This week I'll attempt to do the same for pitchers. As I mentioned last week, the principal component anaylsis basically attempts to create a "component" that maximizes the variance between players. The created component will be the one metric that best differentiates between the players.
A principal component analysis depends greatly on the variables fed into it. For hitters, I used the singles, doubles, triples, homers, walks, and strikeouts per plate appearance as the input variables. While I could do that here, I thought I would use variables over which the pitcher had more direct control. Using Fangraphs pitch data, I used the following: % of Fastballs Thrown (including cutters), % of Sliders, % of Changeups, Velocity of Fastball, Ground Ball%, Walks per PA, and Strikeouts per PA. I thought about using Hits per PA, and HR per PA, but since those are largely a function of luck and I didn't want to measure that, I decided to leave them out. Like before, each variable was normalized before putting it into the model.
For hitters I was uncertain of what to expect, however for pitchers I had a fairly good idea. I expected that the two groupings of pitchers would be between power pitchers and control pitchers. However, I wasn't exactly sure how it would break it down. Running the analysis, the factor loadings for the first principal component were as follows:
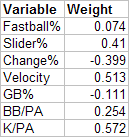
As it turns out, my intuition was correct - it does indeed separate pitchers into power pitchers and control guys. Higher scores indicate power pitchers. A pitcher's strikeout rate is the biggest determinant of his power score, followed by his velocity, and how often he throws his slider. Another indicator of being a "power pitcher" is walking more hitters. Predictably, pitchers who threw a lot of changeups had a lower power pitcher score. Meanwhile, somewhat surprising (to me, at least) was that whether the pitcher was a flyball or groundball pitcher didn't really make a bigger difference one way or another. I suppose I had expected power pitchers to throw high fastballs and hence give up more flyballs. With a coefficient of -.111, this was in that direction, but was not very strong. Also surprising was that the percentage of fastballs thrown was not a major factor.
So who were the top and bottom pitchers in terms of "power" score? Like last week, the scores were standardized to have an average of 100 and a standard deviation of 15. The top 10 power pitchers were all relievers, many of them very good. This is perhaps to be expected. After all, relievers have the luxury of being one-pitch or two-pitch pitchers, and hence they can throw harder and likely don't rely on the change-up. The number one power pitcher is Cubs reliever Carlos Marmol, who Richard Lederer has profiled recently. Marmol relies heavily on his slider, throws hard, and gives up a ton of walks, as well as getting his fair share of strikeouts. At #2 is the Dodgers' Jonathan Broxton, who throws a flaming fastball and strikes out a ton of hitters as well.
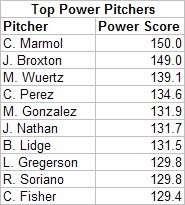
How about the "craftiest" pitchers? The leaderboard is below:
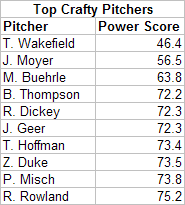
As you might expect, Tim Wakefield is the craftiest. Throwing no sliders, and only 10% fastballs at an average speed of just 72 mph, he's the direct opposite of Jonathan Broxton or Carlos Marmol. Jaime Moyer also is the quintessential "crafty left-hander". Righties can be crafty as well, with the Cardinals' Brad Thompson listed as the fourth craftiest pitcher, throwing very few sliders and not giving up many walks or dishing many strikeouts.
An interesting case is #7, Trevor Hoffman. Most closers are power pitchers, with closers comprising about half of the top 10 most powerful pitchers. Hoffman, used to be that guy, but he now has below average velocity and relies heavily on the change-up (he does still get his fair share of K's however, which is why he isn't listed higher).
With the top 10 power pitchers all relievers, you might wonder who the most powerful starting pitchers were. The list of leaders is below:
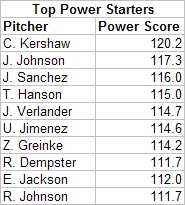
As you can see, it's a pretty exclusive group. While some of the power pitching relievers aren't necessarily all that effective, the top 10 power starters are all pretty much All-Star caliber. Apparently, if you're a starting pitcher who has the ability to pitch like a reliever for an entire game, you're going to be really effective. Sitting at #1 is the 21-year old phenom Clayton Kershaw. The biggest reason he's on the list is that he both strikes out a ton of batters and walks a lot as well. Couple that with a huge fastball, and you've got a true power pitcher. The rest of the list is a who's who of young, outstanding flamethrowers. The only exception is Randy Johnson, who can miraculously still pitch like a power pitcher well into his 40's.
Unlike the hitting breakdown, where three-true-outcome hitters were about as good as small-ball hitters, that wasn't true here. Here, power pitchers are clearly generally more effective than "crafty" pitchers. Not that there aren't effective crafty pitchers such as Mark Buerhele or Trevor Hoffman, but as a rule power pitchers are better. There's a reason that teams love guys who can throw hard. The results of the analysis wasn't too surprising, but it was interesting to see how the principal component analysis divided the pitchers into two groups. In theory, we could look to find other orthogonal traits by looking at the second and third principal components. However, as with the hitting data, I wasn't able to make much substantive sense out of the other components.
You can check out the full list of pitchers (with 50 or more IP) at the link below:
| Baseball Beat | February 15, 2010 |
Pitchers with the Highest Three True Outcomes (SO-BB-HBP)
Last week, I wrote about The Curious Case of Carlos Marmol. The Chicago Cubs closer had an unusual season in 2009, ranking among the best relievers in strikeout, hit, and home run rates while finishing with the worst walk and hit by pitch rates.
Marmol's propensity to strike out, walk, and hit batters last year ranked seventh ever and the highest since 2004 among pitchers with 50 or more games. Thanks to Lee Sinins and his Complete Baseball Encyclopedia, here's a list of all the pitchers with at least a 50 percent rate (expressed in decimal terms below).
                              YEAR      %        SO        BB       HBP     BFP       G
1    Armando Benitez          1999     .542      128       41        0      312       77
2    Brad Lidge               2004     .523      157       30        6      369       80
3    Eric Gagne               2003     .523      137       20        3      306       77
4    Matt Mantei              1999     .521       99       44        5      284       65
5    Byung-Hyun Kim           2000     .519      111       46        9      320       61
6    Billy Wagner             1999     .517      124       23        1      286       66
7    Carlos Marmol            2009     .507       93       65       12      335       79
8    John Rocker              2000     .506       77       48        2      251       59
9    Jeff Nelson              2001     .505       88       44        6      273       69
10   Billy Wagner             1997     .502      106       30        3      277       62
11   Rob Dibble               1992     .500      110       31        2      286       63
For what it is worth, here are the single-season leaders for ERA qualifiers (defined as the modern-day requirement of 1 IP/team game).
                              YEAR      %        SO        BB       HBP     BFP
1    Kerry Wood               1998     .471      233       85       11      699
2    Randy Johnson            2001     .464      372       71       18      994
3    Randy Johnson            1997     .445      291       77       10      850
4    Randy Johnson            1991     .441      228      152       12      889
5    Randy Johnson            1992     .437      241      144       18      922
6    Kerry Wood               2003     .436      266      100       21      887
7    Nolan Ryan               1977     .436      341      204        9     1272
8    Kerry Wood               2001     .431      217       92       10      740
9    Nolan Ryan               1976     .431      327      183        5     1196
10   Pedro Martinez           1999     .430      313       37        9      835
Kerry Wood and Randy Johnson comprise the top six and seven of the top ten seasons of all time. Nolan Ryan appears twice and Pedro Martinez, mostly owing to his 37.5 percent strikeout rate (which edges out the Big Unit's K rate in 2001 by less than a tenth of a point), ranks tenth. No pitcher prior to 1976 made the list.
Lastly, here are the career leaders (with a minimum of 2000 IP).
                                 %        SO       BB       HBP     BFP
1    Randy Johnson              .384     4875     1497      190    17067
2    Nolan Ryan                 .384     5714     2795      158    22575
3    Sam McDowell               .361     2453     1312       59    10587
4    Pedro Martinez             .356     3154      760      141    11394
5    Sandy Koufax               .340     2396      817       18     9497
6    Tom Gordon                 .325     1928      977       38     9058
7    David Cone                 .321     2668     1137      106    12184
8    Roger Clemens              .317     4672     1580      159    20240
9    Al Leiter                  .315     1974     1163      117    10334
10   Bobby Witt                 .306     1955     1375       39    11003
Johnson, Ryan, and Martinez are joined by Sam McDowell, Sandy Koufax, Tom Gordon, David Cone, Roger Clemens, Al Leiter, and Bobby Witt. Johnson's career rate (38.448 percent) tops Ryan's (38.392) by a tiny fraction.
McDowell, who was known as Sudden Sam for his heat, led the American League in strikeouts and walks five times each from 1965-1971. He was on the cover of Sports Illustrated in May 1966 and the recipient of an outstanding SI article by Pat Jordan in August 1970.
Witt had the highest walk rate (12.5 percent) in the group. A hard-throwing righthander, Witt was drafted out of the University of Oklahoma by the Texas Rangers in the first round with the third overall pick of the 1985 amateur draft. After pitching just 35 innings with an 0-6 record and a 6.43 ERA in Double-A that summer, he earned a spot in the starting rotation the following spring. Witt led the AL in walks (143) and wild pitches (22) in 157.2 innings. He led the league in BB three times and WP twice in his first four seasons in the big leagues. While Bobby never topped the circuit in strikeouts, he whiffed 221 batters in 222 innings when he fashioned a 17-10 record and a 3.36 ERA (118 ERA+) during his best campaign in 1990.
Generally speaking, the pitchers on the lists above possess some of the best stuff in the past half century. A handful became legends while many others never quite lived up to their promise.
| F/X Visualizations | February 12, 2010 |
Another Attempt
There were many of comments to my post last week about re-formatting the box score. Although some liked it, the majority applauded the effort but were not pleased with result. Outside of one disgruntled commenter who thought that the very act of attempting a new box score was an assault on the game of baseball for 'the average fan', the reasoned objections could be distilled to two: you could not easily find each player's stats for the game, and following the baserunners progression was hard.
I admitted the first limitation to begin with, and even though it was raised by a large number of people, I am going to ignore it. I guess I should have called the graph a score card rather than a box score -- as some commenters suggested -- so people would not assume they could find those stats. As I stated in the comments I was more interested in producing a graph that allowed easy reconstruction of the game in your mind than finding a new way to report game statistics.
For that reason the second issue, not being able to easily follow the base runners, I found more troubling. Some commenters suggested I just leave it out entirely but I wanted to keep it. I thought the information was needed to give a feel for how important individual at-bats were, whether a team stranded a lot so runners, when runners were moved over and other things very important to the flow of a baseball game. The problem was not too much data, but data improperly displayed.
Luckily in stepped Matt Lentzner. Matt sent me an emailing suggesting an ingenious way to deal with this problem and make the runner progression very easy to see. I hope you find the solution as satisfying as I do.
Another addition, which was suggested by a commenter in last week's post, was to include the type of ball in play (bunt, grounder, pop-up, fly and line drive) and the fielder. So F8 is a fly to center. If that is a hit the F8 is boxed. So here is the result, and let me say again it owns a huge debt to Matt.
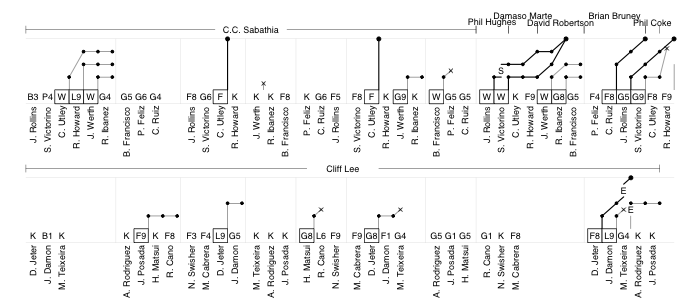
Free to reproduce for non-profit/personal use, but we reserve the right to license it to for-profit enterprises.
The runner progression is done very nicely, I think, as it allows you to follow each individual runner and to see how each batter did at progressing the runners. Runner who eventually score have their line bolded. Progression by steals and errors are indicated with letters and runners thrown out on the base paths with exes. Fielder's choices and reaching on a dropped 3rd strike are also possible (In the top of the fourth Jayson Werth was thrown out at first on a dropped third strike). This format keeps all the aspects I liked about the original format:
This formulation gives a better feel for the pace of the game, and allows the events to be easily recreated: in the top of the first CC Sabathia escaped a base-loaded two-outs jam; Phil Hughes took over to start the eighth and walked the only two batters he faced, both of whom came around to score on Raul Ibanez's single; Utley's two solo-HRs were the only runs through the first seven innings; Cliff Lee didn't allow a runner past first until the ninth, and up to that point faced just three batters over the minimum; the Yankees burned through five relievers, who gave up four runs, in the last two innings; the top of the ninth ended with Shane Victorino getting thrown out at home on a Ryan Howard double and the game ended with two more Cliff Lee strikeouts. All of this can be easily seen through a close, but not difficult, reading of the chart.
This approach has the added benefit of being easily recreated by hand on graph paper, as alternative way to score games. Anyway thanks to the readers, and especially to the commenters and Matt, for humoring my bizarre impulse for a second week.
| Touching Bases | February 11, 2010 |
Shot Location Visualizations
There's been an influx of publicly-available NBA data over the last few years. While there's no data with the detail of pitchf/x or databases with the sophistication of FanGraphs that analysts can get their hands on for basketball, there have been gradual improvements. My favorite type of basketball data to look at is shot location data, which is why I regularly visit HoopData. On Saturday, I came across the last few years of raw shot location data on BasketballGeek. I'm far from an expert in APBRmetrics, and I don't know whether the basketball blog-dome has its own Dave Allen, but I felt like it might be fun to produce some visualizations using this data. Eli Witus has previously charted this data in several ways, so I'm going to be reproducing some of his work. Click on images for a larger view.
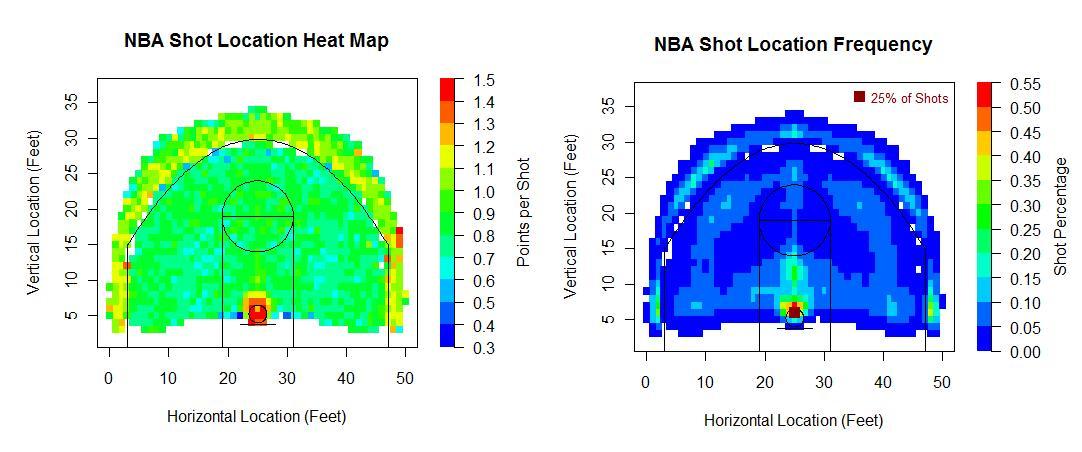
Each point represents one square foot and the goal is located 5.25 feet from the baseline and 25 feet from the sideline.
The most efficient shots are those at the rim or those from three. The least efficient are ten-foot jumpers it would seem. None of this data includes free throws or offensive rebounding, so the only inputs are missed shots, made two-point shots, and made three-point shots. Witus' chart on offensive rebounding suggests that mid-range jumpers, in addition to being low-percentage shots, yield the lowest rate of second-chance points.
Something I find interesting in the shot location frequency chart is that there are equally-spaced patches along the three-point arc as well as the 17-foot arc where players like to shoot, which I call the corner, the wing, and the middle. I understand a lot of this has to do with floor spacing, and the corner three has such a high frequency since it is 1.75 feet closer to the basket than threes along the arc, nevertheless I feel like players are predisposed to wanting to take shots from normal angles (0, 45, 90 degrees). Maybe it's just me.
I also made splits of the above graphs. Home vs. away. 1st, 2nd, 3rd, and 4th quarters. The first minute of a quarter vs. the final two minutes of the fourth or overtime.
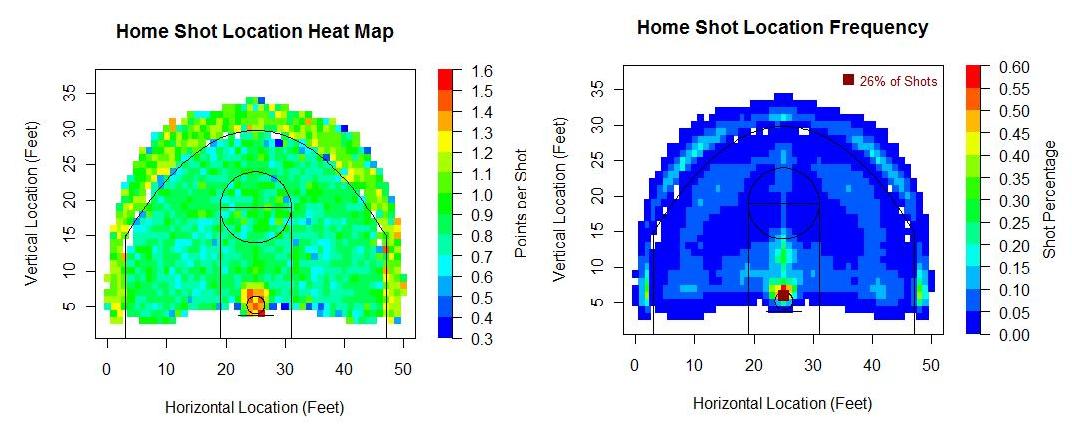
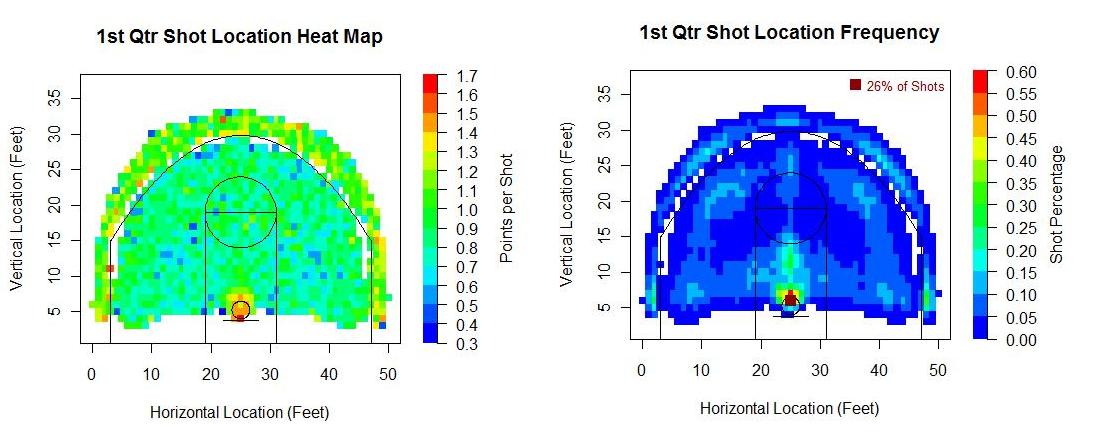
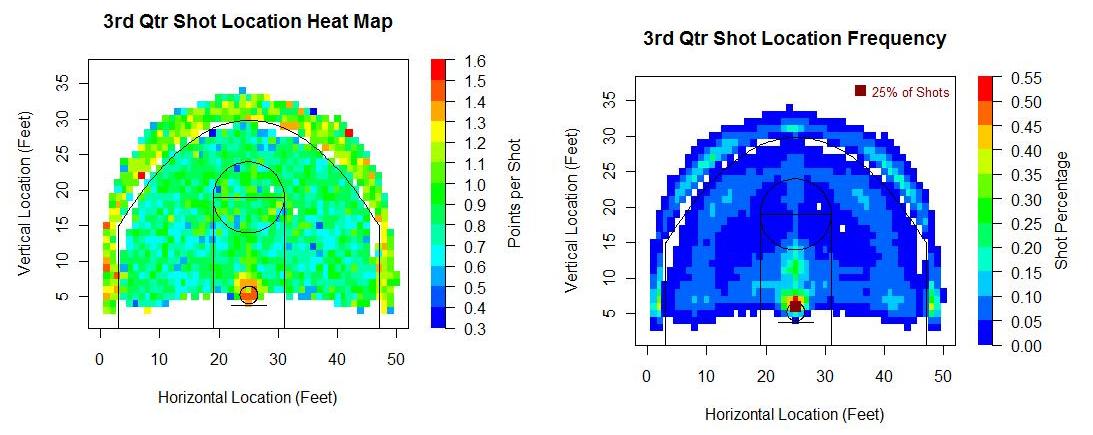
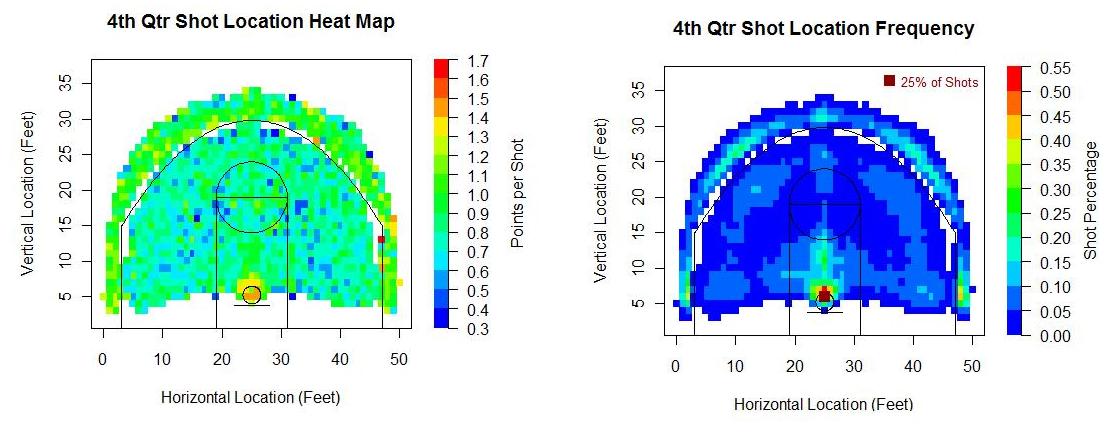
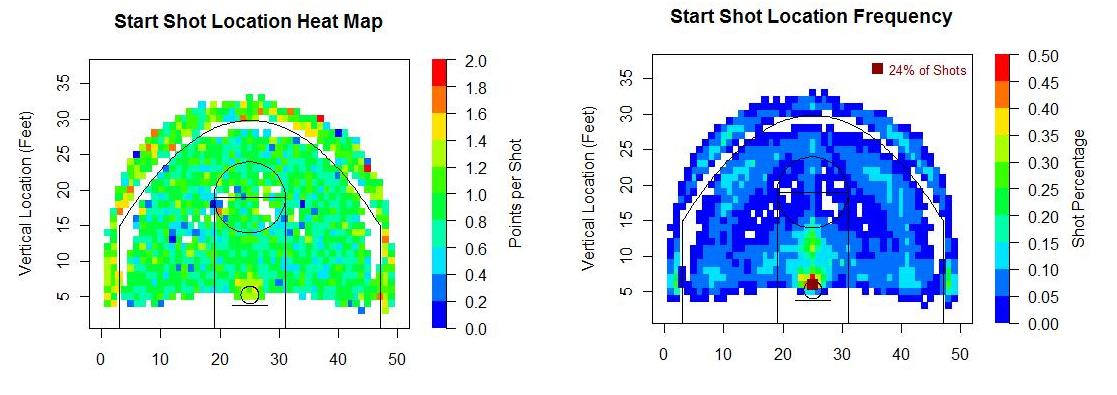
I chose to only include points where significant amount of shots have occurred, and therefore didn't need to use any smoothing. The charts are plenty smooth already. But I did smooth out and pretty up the chart I made for field goal percentage.
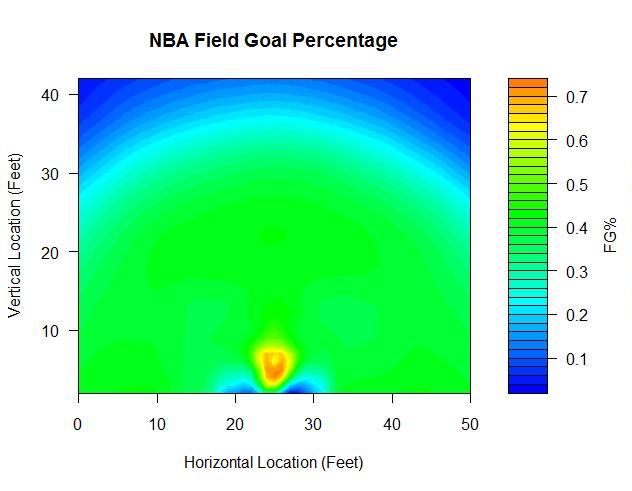
I also thought it might be nice to break down this data on the team and player level. The first team I considered was of course everybody's favorite statistically-oriented team, the Houston Rockets. You may recall that, nearly a year ago to the day, Daryl Morey penned a self-aggrandizing self-profile in the New York Times titled "Moreyball."* In it, Morey wrote
"The 3-point shot from the corner is the single most efficient shot in the N.B.A. One way the Rockets can tell if their opponents have taken to analyzing basketball in similar ways as they do is their attitude to the corner 3: the smart teams take a lot of them and seek to prevent their opponents from taking them."
The Chicago Bulls are not what you would call one of the smart teams, if this statement is taken at face value. According to HoopData, The Bulls lead the league in long twos attempted, but are last in threes attempted. That makes no sense. I've plotted each point where the Rockets and Bulls have attempted at least ten shots since 2006 along with the points per shot.

You can see that the Bulls have a much fuller area where they shoot long twos—those shots from 15 feet out to the three-point line. The Rockets area outside the arc contains a higher number of points. Also, the Rockets paint area is green, representing 0.8-1.2 points per shot by the scale, while the Bulls paint area is blue, good for 0.6-1.0 points per shot by that scale.
*I wouldn't be Daryl Morey first of all. I wouldn't write the story "Moreyball." I understand that when you write a profile, you want to be the hero. That is apparently what Morey has done. But it's not going to make him popular with the other GMs or the other people in basketball.
Now I didn't actually read the piece, as why would I want to read a story about a computer that gives computer numbers? After all, how do you think we got Madoff? But if Morey is so smart, then why hasn’t he won a championship? Statistics don’t tell the whole story, especially with players like Shane Battier. I mean, if Morey thinks Shane Battier is so good, then how come he only scores six points a game? The Rockets have only made the playoffs because 75% of basketball is play from the center and Houston lucked out by drafting Yao Ming.
Finally, I wanted to look at individual players. Since players have taken at most 5,000 shots or so over the last few years, I decided to smooth out their heat maps. I also added contour lines showing where players like to shoot. Here's a look at the consensus two best players in the game:
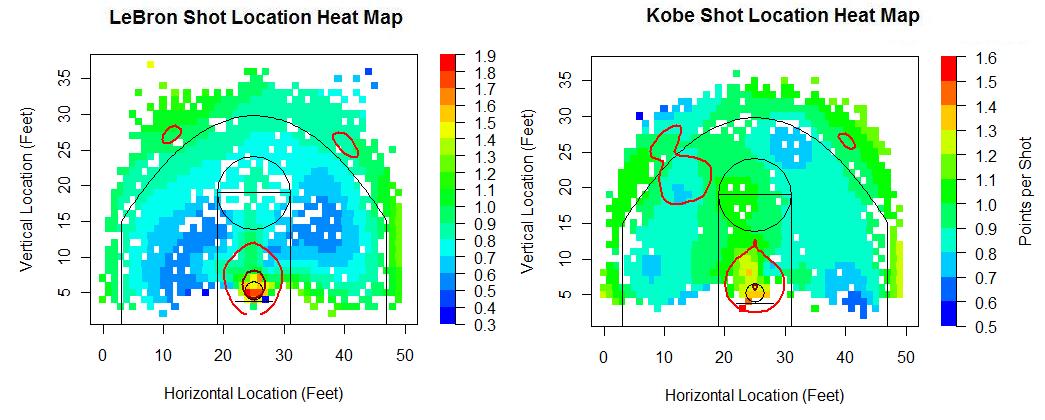
They have similar shot location distributions. Both shoot from anywhere on the floor, but are especially drawn to the three point shot from either wing. Kobe also likes to step in from the right wing and pull up from the free throw line extended. LeBron takes a higher rate of shots at the rim.
As for their success when shooting, Bryant would appear to trump James by color alone. Note that the color scales are different, but even so, Kobe has a better mid-range game than LeBron. LeBron has blue patches where he earns less than 0.6 points per shot, while Kobe has no points from reasonable shooting locations on the floor where he shoots that poorly. Thing is, there's that tiny little area right underneath the rim that accounts for over a third of James' shots, and he's the best player in the league when shooting from the restricted area. The color scale for LeBron extends up to 1.9 points, while it only goes up to 1.6 for Kobe, and those figures represent how effective each player is when shooting from spots in close proximity to the rim.
I made these graphs for several other players I was interested in, which you can view by clicking on the player names. Dwyane Wade, Tim Duncan, Kevin Garnett, Kevin Durant, Chris Bosh, Carmelo Anthony, Dirk Nowitzki, Paul Pierce, Steve Nash, Rashard Lewis, and Joe Johnson.
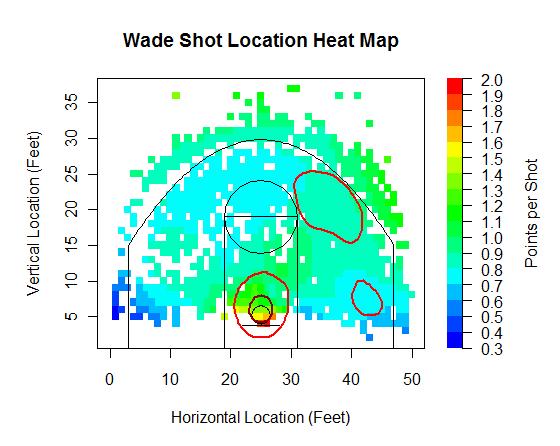
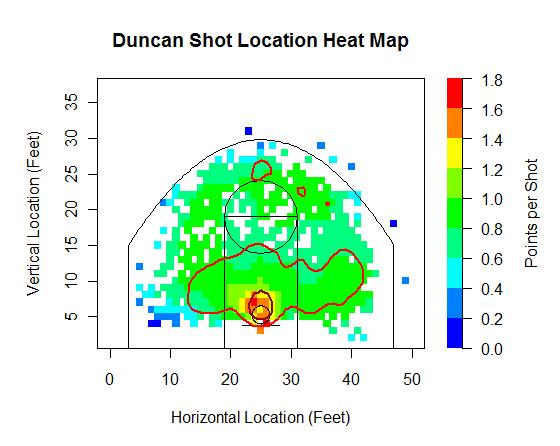
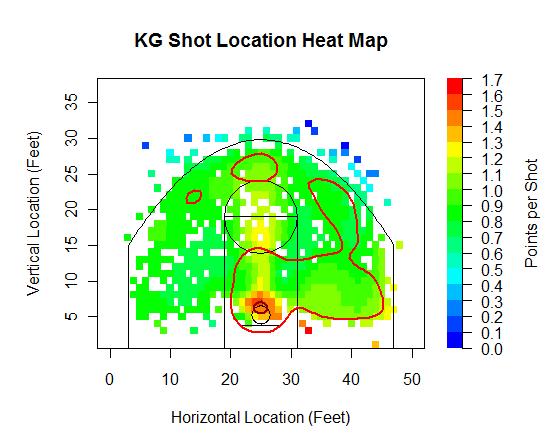
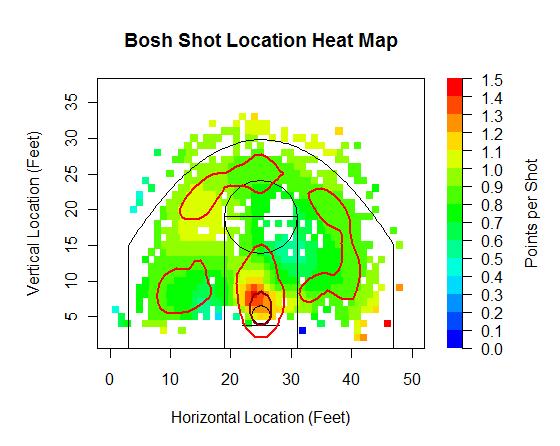
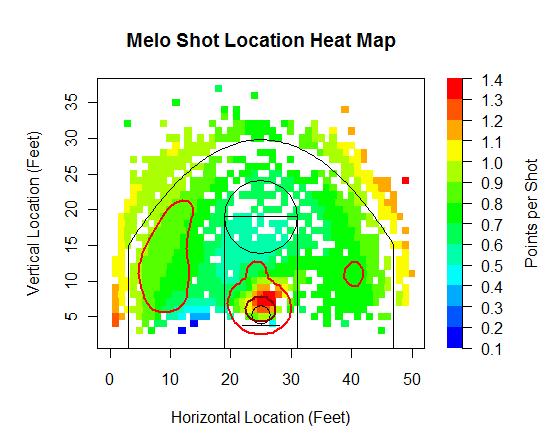
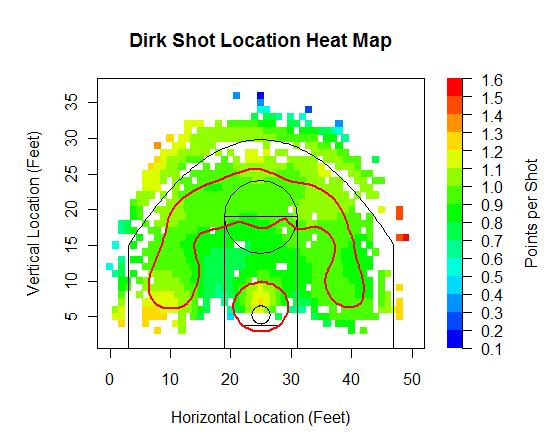
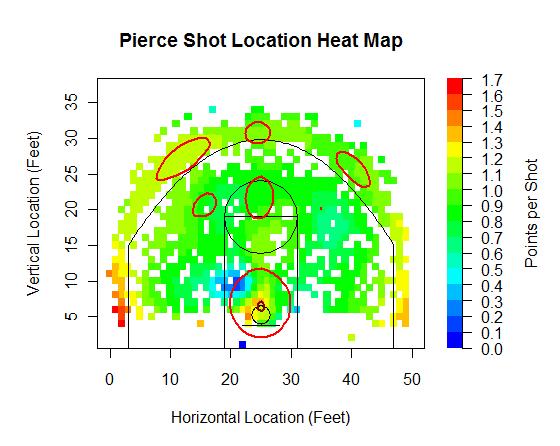
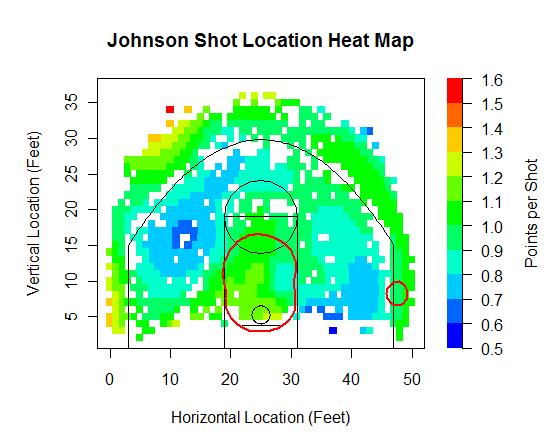
| Touching Bases | February 11, 2010 |
Shooters by Zones
Last week, I looked at Hitters by Zones, and I'm going to use the same format this week. My sample includes all NBA regular season games since the 2006-2007 season up to Saturday. Data from BasketballGeek. First, a crude chart showing the percentage of shots in each zone and how players fare when shooting, indicated by color. I didn't include any data on free throws, so the only inputs are missed shots, made two-point shots, and made three-point shots.
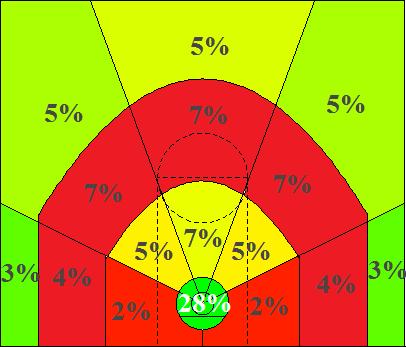
Shots at the rim yield the highest return, followed closely by three pointers, specifically the corner three. Mid-range jumpers are the worst.
Getting right to the leaderboards, highlighting the top five and bottom five. There are sixteen of these this time, but I’m going to again leave the commentary short and I’ll leave a spreadsheet at the end. The listed leaderboards will be limited to players with at least 50 shots in a zone, but I'm including all players in my spreadsheet, and you might just want to skip straight to that.
I'm defining the side of the floor as that side you would face if you were standing on a basketball court, so the left side of the chart provided is actually the right side of the floor.
Right-Corner Threes
| Player | Shots | Points/Shot |
|---|---|---|
| J.J. Redick | 54 | 1.69 |
| Mike Miller | 70 | 1.53 |
| Vince Carter | 73 | 1.52 |
| Courtney Lee | 69 | 1.43 |
| Anthony Parker | 256 | 1.42 |
| Rasheed Wallace | 64 | 0.70 |
| Baron Davis | 64 | 0.70 |
| Earl Watson | 56 | 0.70 |
| Shawn Marion | 126 | 0.69 |
| Luke Ridnour | 51 | 0.67 |
The word on the street is that the NBA's grand market inefficiency is long-range shooters. As much as I dislike Reddick, I have to admit that he's clearly a valuable, and likely undervalued player. Parker has taken the most threes from the right corner in this time span, making his continued success more impressive.
Left-Corner Threes
| Player | Shots | Points/Shot |
|---|---|---|
| Steve Blake | 166 | 1.51 |
| Jason Kapono | 87 | 1.48 |
| Jameer Nelson | 85 | 1.45 |
| Bobby Simmons | 139 | 1.45 |
| Nick Young | 55 | 1.42 |
| Matt Barnes | 116 | 0.81 |
| Antawn Jamison | 98 | 0.80 |
| Baron Davis | 66 | 0.77 |
| Monta Ellis | 62 | 0.74 |
| Devean George | 66 | 0.68 |
I'd be very interested to see what players have large differences between how they shoot from the right side of the floor vs. the left side of the floor. Have there been any public studies based on handedness and shot location?
Baron Davis might want to stop shooting threes. Monta Ellis has surprisingly had the worst offensive rating in the NBA this year, though Kevin Pelton points to small sample size.
Right-Wing Threes
| Player | Shots | Points/Shot |
|---|---|---|
| Anthony Morrow | 69 | 1.51 |
| Chris Quinn | 63 | 1.49 |
| Delonte West | 104 | 1.38 |
| D.J. Augustin | 79 | 1.37 |
| Steve Nash | 373 | 1.36 |
| Sebastian Telfair | 101 | 0.66 |
| Ronnie Brewer | 59 | 0.66 |
| Kyle Lowry | 54 | 0.61 |
| Bobby Brown | 51 | 0.59 |
| Antoine Wright | 54 | 0.41 |
I can't remember ever having seen Steve Nash miss a three. He's so ridiculously efficient, but I still feel like he should be shooting more of them, even though he's already taken the third most of any player over the last few years from the right wing.
Left-Wing Threes
| Player | Shots | Points/Shot |
|---|---|---|
| Anthony Morrow | 81 | 1.41 |
| Danilo Gallinari | 104 | 1.35 |
| Juan Dixon | 76 | 1.34 |
| Daniel Gibson | 216 | 1.31 |
| Juan Carlos Navarro | 157 | 1.30 |
| Greg Buckner | 50 | 0.64 |
| Eddie Jones | 61 | 0.64 |
| Anthony Carter | 59 | 0.61 |
| Kyle Lowry | 63 | 0.52 |
| Josh Smith | 76 | 0.36 |
Boy, is it a good thing Josh Smith has stopped shooting 3s this year. He and Zach Randolph both. Smith and Randolph have been key parts to the Hawks' and Grizzlies' surprising success, and I like to think their much improved shot selection has played a role. I'm happy to see my man Gallo is already on the leaderboard. He's got to be the favorite in the weekend's three-point contest. And after his YouTubing of Roy Hibbert, he should be in the dunk contest too. Shades of Shawn Kemp, and Gallo's been as potent on the floor as Kemp was off it.
Middle Threes
| Player | Shots | Points/Shot |
|---|---|---|
| Jonny Flynn | 52 | 1.50 |
| Jason Kapono | 59 | 1.34 |
| Kelenna Azubuike | 88 | 1.33 |
| Troy Murphy | 517 | 1.32 |
| Matt Bonner | 156 | 1.28 |
| Sergio Rodriguez | 90 | 0.59 |
| Marquis Daniels | 54 | 0.57 |
| Adam Morrison | 61 | 0.52 |
| Darrell Armstrong | 61 | 0.49 |
| Andre Miller | 59 | 0.27 |
Impressive stuff from Troy Murphy. He and Andrea Bargnani stand alone in threes attempted from straight on, with Rasheed Wallace, another 6-11 big man coming a distant third.
Right-Corner Mid-Range
| Player | Shots | Points/Shot |
|---|---|---|
| Anthony Morrow | 56 | 1.14 |
| Dirk Nowitzki | 314 | 1.13 |
| Vince Carter | 125 | 1.10 |
| Andre Miller | 242 | 1.04 |
| Luke Ridnour | 56 | 1.04 |
| Adam Morrison | 73 | 0.63 |
| Jason Richardson | 115 | 0.63 |
| Emeka Okafor | 75 | 0.61 |
| Bonzi Wells | 53 | 0.60 |
| Josh Smith | 73 | 0.60 |
Luke Ridnour was dead last at shooting threes from the right corner, but is fifth when he takes a few steps in.
Left-Corner Mid-Range
| Player | Shots | Points/Shot |
|---|---|---|
| Kyle Korver | 76 | 1.16 |
| Al Horford | 74 | 1.11 |
| Randy Foye | 87 | 1.08 |
| Malik Allen | 76 | 1.08 |
| Brandon Bass | 110 | 1.07 |
| Kenyon Martin | 73 | 0.60 |
| Darius Songaila | 70 | 0.60 |
| Andray Blatche | 93 | 0.58 |
| Ronald Murray | 77 | 0.55 |
| Josh Smith | 64 | 0.44 |
I'm starting to get the feeling that Josh Smith can't shoot.
Right-Wing Mid-Range
| Player | Shots | Points/Shot |
|---|---|---|
| Tyronn Lue | 87 | 1.15 |
| Steve Nash | 307 | 1.12 |
| Ray Allen | 201 | 1.08 |
| Chris Bosh | 300 | 1.03 |
| Antoine Wright | 51 | 1.02 |
| Jerry Stackhouse | 86 | 0.58 |
| Devin Brown | 59 | 0.58 |
| Adam Morrison | 88 | 0.57 |
| Quinton Ross | 107 | 0.54 |
| Anderson Varejao | 55 | 0.47 |
Now that Bruce Bowen's retired, Varejao might be my least favorite player in the NBA, so I like seeing him there.
Left-Wing Mid-Range
| Player | Shots | Points/Shot |
|---|---|---|
| Nate Robinson | 130 | 1.02 |
| Jose Calderon | 245 | 1.01 |
| Jamario Moon | 91 | 1.01 |
| Kurt Thomas | 113 | 1.01 |
| Jamal Crawford | 292 | 0.99 |
| Rodney Carney | 53 | 0.53 |
| Zaza Pachulia | 67 | 0.48 |
| Trevor Ariza | 67 | 0.48 |
| Anderson Varejao | 67 | 0.48 |
| Marcus Camby | 76 | 0.45 |
Five Knicks/former Knicks on this list. Nate Robinson and Jamal Crawford have a whole lot of things in common.
Middle Mid-Range
| Player | Shots | Points/Shot |
|---|---|---|
| Mikki Moore | 94 | 1.15 |
| Steve Nash | 179 | 1.09 |
| Chris Webber | 53 | 1.09 |
| Kyle Lowry | 66 | 1.06 |
| Juwan Howard | 129 | 1.02 |
| Lou Williams | 70 | 0.54 |
| Rasual Butler | 71 | 0.51 |
| Darko Milicic | 56 | 0.50 |
| Jeff Green | 77 | 0.49 |
| Sasha Pavlovic | 53 | 0.45 |
Isn't Pavlovic supposed to be a shooter?
Right-Corner Short
| Player | Shots | Points/Shot |
|---|---|---|
| Tony Parker | 107 | 1.18 |
| David Lee | 52 | 1.15 |
| Paul Pierce | 59 | 1.12 |
| Carlos Boozer | 54 | 1.11 |
| Richard Hamilton | 71 | 1.10 |
| Spencer Hawes | 58 | 0.62 |
| Kevin Durant | 81 | 0.62 |
| Hedo Turkoglu | 53 | 0.60 |
| Jeff Green | 60 | 0.60 |
| Rudy Gay | 60 | 0.60 |
Wayne Winston says that Kevin Durant and Jeff Green don't play well together. I'm surprised that Durant is inefficient from anywhere on the floor.
Left-Corner Short
| Player | Shots | Points/Shot |
|---|---|---|
| Ronald Murray | 50 | 1.20 |
| LeBron James | 88 | 1.14 |
| Rajon Rondo | 57 | 1.09 |
| Carlos Boozer | 72 | 1.08 |
| Elton Brand | 102 | 1.08 |
| Chris Wilcox | 122 | 0.64 |
| Andray Blatche | 56 | 0.61 |
| Lamar Odom | 51 | 0.59 |
| Mehmet Okur | 65 | 0.58 |
| Allen Iverson | 57 | 0.53 |
Wilcox has taken the tenth most shots in the league from this spot on the floor, and he is the only player to have taken at least 65 shots (up to Okur) and net less than 0.7 points per shot.
Right-Wing Short
| Player | Shots | Points/Shot |
|---|---|---|
| Mikki Moore | 74 | 1.24 |
| Ray Allen | 178 | 1.13 |
| Maurice Evans | 62 | 1.13 |
| Kendrick Perkins | 165 | 1.13 |
| Fabricio Oberto | 87 | 1.13 |
| Peja Stojakovic | 51 | 0.63 |
| Richard Jefferson | 135 | 0.61 |
| Andrei Kirilenko | 52 | 0.58 |
| Desmond Mason | 124 | 0.56 |
| Ben Wallace | 67 | 0.51 |
Mikki Moore is a surprisingly effective shooter from the floor, as the only player to top two leaderboards. This year, he's made 29 of his 34 shots at the rim.
Left-Wing Short
| Player | Shots | Points/Shot |
|---|---|---|
| Fabricio Oberto | 65 | 1.29 |
| Kendrick Perkins | 128 | 1.20 |
| Adam Morrison | 59 | 1.15 |
| Luis Scola | 87 | 1.13 |
| Tony Parker | 257 | 1.12 |
| Tracy McGrady | 81 | 0.62 |
| Ron Artest | 117 | 0.62 |
| Tyrus Thomas | 55 | 0.51 |
| Brad Miller | 60 | 0.50 |
| Larry Hughes | 87 | 0.44 |
You may recall that Larry Hughes had a web site devoted to his poor shooting called heylarryhughespleasestoptakingsomanybadshots.
Middle Short
| Player | Shots | Points/Shot |
|---|---|---|
| Luke Ridnour | 116 | 1.28 |
| Matt Bonner | 81 | 1.19 |
| Kevin Garnett | 295 | 1.13 |
| Mike Miller | 63 | 1.11 |
| Richard Hamilton | 190 | 1.11 |
| Delonte West | 95 | 0.59 |
| Sasha Pavlovic | 55 | 0.55 |
| JaVale McGee | 61 | 0.52 |
| Ben Wallace | 81 | 0.49 |
| Trevor Ariza | 58 | 0.45 |
I'd love to know whether Ben Wallace is a good player or not. I like to think defense and rebounding can outweigh being a zero on offense.
At Rim
| Player | Shots | Points/Shot |
|---|---|---|
| LeBron James | 1438 | 1.49 |
| Shaquille O'Neal | 919 | 1.48 |
| Dwight Howard | 1639 | 1.48 |
| Brendan Haywood | 575 | 1.45 |
| Kevin Garnett | 536 | 1.45 |
| Rodney Stuckey | 715 | 1.02 |
| Raymond Felton | 959 | 1.00 |
| Ben Gordon | 555 | 0.99 |
| Russell Westbrook | 627 | 0.99 |
| Rafer Alston | 579 | 0.93 |
I limited this leaderboard to players with at least 500 shots. My conclusion last week was that Albert Pujols is good, and I'll close this piece out by saying the same of LeBron James.
| Crunching the Numbers | February 11, 2010 |
Lincecum's Value
I don't have any numbers crunched here, so I'm going to be relatively conservative and ask for someone--anyone--to tell me what the San Francisco Giants are doing strategically with their offers to Lincecum.
Let's talk game theory. The basic idea is that when there are two agents with potentially conflicting goals, the best strategy for each depends on their assessment of the best strategy of the other. The Lincecum arbitration case is an excellent example: there are two players, Lincecum and the Giants, in a zero sum game that determines Lincecum's 2010 salary (and beyond). The goal is pick a number that is closer to what an arbitrator would find to be a reasonable salary than your opponent does. Whoever picks the closer number is likely to win. If Lincecum asked for $43 million, the Giants could have offered $2 million and won. Clearly both sides are going to make more reasonable offers than that, but you get the point: the craziness of your offer depends on the perceived craziness of your opponents.
Lincecum's request, $13 million, is not too crazy. Its high, but he has no peers to be compared to. If you base his salary on his performance, and not his peers, $13 million is a bargain. If you look for the closest peer, its Ryan Howard who won his case for $10 million. The Giants offer was just strange: at $8 million, it was well below the previous highest-paid arbitration-set salary. I don't think many people would argue that Lincecum is worth 0.8 Ryan Howards. If Lincecum should be expected to make slightly more than Howard, say $11 million, a conservative figure, Lincecum's offer of $13 million is closer than the Giants $8. So the Giants appear to have low-balled Lincecum; not by a huge amount, but they low-balled him nonetheless. If we agree on a reasonable value of $11, the Giants would be expected to lose, but they could still have a decent chance of winning. In a non-trivial percent of possible universes, their team successfully argues their side and wins the day.
But I'd argue that game theoretic considerations make the Giants offer look really, really bad. First, the outcome of this arbitration hearing won't just affect Lincecum's 2010 salary; it will set the standard for his 2011 and 2012 salary as well. It will be easier for Lincecum to ask for $17 million in 2011 if he is making $13 million in 2010 as opposed to, say, $10 million. So the cost of losing this arbitration hearing is greater than the immediate costs of the $8 million bid. That means that another $2 million spent today saves a potential $4-6 million down the road. This would argue that both players should consider a conservative approach: make sure you win this hearing by bidding close to his true value. Its hard to argue that $8 million is close to his true value.
Second, what the Giants really want to do is sign Lincecum to a long-term deal. Lincecum will have an incentive to do so, given the likelihood for any pitcher to get injured. But by making such a low bid on the arbitration hearing, the Giants have put themselves in an awful negotiating position. Lincecum can expect to win his hearing and thus will be less likely to negotiate. If the Giants had bid, say, $10, there would be a very good chance they would win, which would put more pressure on Lincecum to accept a long-term deal at a price the Giants would prefer. If we were using game theory to build a model of this arbitration process, the potential for injury would be a force that drives down Lincecum's asking price. On the other side, however, it would not substantially affect the Giants estimate of his value. They could be expected to take out injury insurance to protect themselves from the possibility of Lincecum's arm falling off. The net effect is biased in favor of a long-term contract. I think the recent history of long-term deals being struck before arbitration hearings supports this principle.
So if the end goal was to tie Lincecum down for the long term at a good rate, why did the Giants choose to low-ball him? Their most recent offer to Lincecum is being reported to be at $37 for three years: $9.5, $12.5 and $15 respectively. Lincecum is reported to want a deal that starts at $13, not $9.5. Well, of course he does; if he doesn't make a deal, he'll probably make $13 next year. Why start at $9.5? The Giants offer would have had considerably more weight behind it if they had offered $9.5 up front.
In an alternate universe, the Giants offered $10.5 million in arbitration. They then offered $10.5, $13, $15.5 for the next three years. They would have had a very good chance of winning that hearing, and Lincecum would have had very good reason to take the long term deal. In this universe, it would be reasonable to expect him to get tied down for 3 years at under $40 million.
My general point is this: sometimes it is a better strategy to offer to pay more for a good or service. Sometimes a high initial bid will result in a lower long-term cost. The Lincecum arbitration may be just such a case, but the Giants swung and missed completely.
| Baseball Beat | February 09, 2010 |
The Curious Case of Carlos Marmol
After watching my nephew Brett make his PGA Tour debut in the Northern Trust Open at Riviera Country Club last Thursday, my wife and I headed to Palm Desert to hang out for a couple of days while our house was being fumigated for termites.
I woke up on Friday morning, checked my emails, and read the following news in Lee Sinins' daily ATM Report.
The Cubs re-signed P Carlos Marmol to a 1 year, $2.125 million contract, to avoid salary arbitration.YEAR AGE RSAA ERA G GS IP SO SO/9 BR/9 W L SV NW NL TEAM 2007 24 26 1.43 59 0 69.1 96 12.46 10.38 5 1 1 5 1 Cubs 2008 25 17 2.68 82 0 87.1 114 11.75 8.97 2 4 7 4 2 Cubs 2009 26 9 3.41 79 0 74 93 11.31 14.59 2 4 15 4 2 Cubs CAREER 40 3.42 239 13 307.2 362 10.59 12.34 14 16 23 18 12 LG AVG 0 4.35 307.2 235 6.88 12.90 17 17
I glanced at Marmol's three-year stat line and noticed that he struck out 11.31 batters per nine innings last season. Not too shabby, I thought. I had been under the impression that he didn't have a particularly good year. Despite his stellar SO/9 rate (or more commonly referred to as K/9), Marmol did indeed struggle as noted in the column next to it on the right. BR/9 stands for "base runners per 9," which is essentially WHIP expressed over nine innings rather than one (although HBP are included in the former and not the latter).
In Marmol's case, hit by pitch is not a trivial statistic. He hit 12 batters last season, good bad enough to rank third in the majors. The 28-year-old righthander, in fact, was the only reliever to reach double digits in this category.
A BR/9 of 14.59 means Marmol allowed 1.62 base runners per inning. That's a horrific rate for any pitcher, much less a closer/setup man. Marmol got there in a strange manner. Carlos allowed 43 hits, 65 walks, and 12 hit batters in 74 innings.
Nolan Ryan, one of the most famous high walks/low hits pitchers of all time, only had two seasons when he allowed more walks than hits. Unlike Marmol, Ryan never approached a BB/H ratio of 1.5:1. His worst ratio was 1.13 in 1970 when he was a 23-year-old part-time starter for the New York Mets. Marmol's BB/H ratio was 1.51 last year. Ryan's career ratio was 0.71. Marmol's ratio over his first four seasons? A stunning 1.03.
Among pitchers with 50 or more games, Marmol had the second-best batting average against (.171 vs. .170 for Jonathan Broxton) and the third-best HR/9 (0.24) and HR/TBF (0.60%) even though he is an extreme flyball pitcher. However, Marmol also had the worst BB/9 (7.91), BB/TBF (19.40%), HBP/9 (0.16), and HBP/TBF (3.58%).
You might say that Marmol missed the strike zone and a lot of bats. If so, you would be right. He struck out, walked, or hit a batter more than half the time! Yup, Carlos had a combined 170 SO, BB, and HBP while facing 335 batters in 2009.
What should we make of Marmol? His K/9, BAA, and HR/9 suggest he is one of the best relievers in the game. On the other hand, his BB and HBP rates indicate that he is a wild man and far from a polished product. Like my house, you can throw a tent over Marmol. While I wouldn't want to exterminate him if I were Jim Hendry or Lou Piniella, I might be inclined to sell tickets to his circus act if I were new Cubs' owner Tom Ricketts.
By the way, Brett and former major winners Padraig Harrington, Davis Love III, Corey Pavin, Vijay Singh, and Mike Weir all missed the cut last week as Steve Stricker won his fourth tournament in less than a year to pass Phil Mickelson as the No. 2 player in the World Golf Rankings.
| Designated Hitter | February 08, 2010 |
Evaluating Baseball's Managers
[Editor's Note: Chris Jaffe, writer for The Hardball Times, has written a new book, “Evaluating Baseball’s Managers.” The commentary below is the introductory essay to EBM’s Chapter 5, which is titled “Rise of the Fundamentalists, 1893-1919.”]
The importance of managers peaked at the turn of the century. They inhabited a specific period in the evolution of baseball between two crucial metamorphoses of the game. First, in the late nineteenth century, field generals like Gus Schmelz and Ned Hanlon caused the rise of the modern manager and the extinction of the old business manager. By placing a premium of the preparation of players before contests and handling strategy during them, the position of manager came into its own. A generation later, the rise of the front office diminished the manager’s position by serving as a rival power source within the franchise. Between these transformations, managerial power in the sport crested. Managers ascended into the ranks of ownership with greater frequency than at any other time in baseball history, as there were fewer steps between themselves and owners. Even those who did not own a share of the club frequently had considerable autonomy. When John McGraw became Giants manager, he told the owners which players to keep or remove from the roster, indicating who called the shots for that franchise. Not all managers wielded such authority in this era, and many held considerable power in the future, but they had their strongest opportunity to control the entire franchise at the turn of the century.
Managerial power also reached its zenith because coaching was more important in this period than any other. Old time baseball is often remembered as a glory era, when players dedicated themselves to the craft of the game in a way that modern players with their supposedly softer attitudes never could. Though this attitude is very frequent in the modern day, ideas that the old-timers were better, wiser, and more dedicated are as old as the game itself.
People look at John McGraw and his devotion to those precious fundamentals. He ordered his players come to the park to practice and work out for several hours every day, making the athletes perform precisely in accordance with his formidable will. Other managers, like Frank Chance, made a similar fervent push for sound ball. Chance’s Cubs had a well-earned reputation as the sharpest players in the league.
However, not only was the deadball era far from being the golden era of fundamentals, but the evidence used to make it seem like a Mecca of proper execution are the very facts that indicate otherwise. John McGraw did not want his players practicing constantly because they were so committed, but because those who earned a spot in major league baseball commonly displayed poor fundamentals. The book Crazy ‘08 by Cait Murphy provides an interesting window into baseball during the 1908 NL pennant race. Despite focusing on teams that diligently practiced their basics – McGraw’s Giants and Chance’s Cubs – examples of shoddy play litter the book. It was not a matter of errors; the gloves and conditions of the day made muffed grounders understandable. The problems went deeper. Virtually every game contained at least one boneheaded play that could not be blamed on the conditions. Flies landed between fielders. A base runner would be doubled off on a pop up. An outfielder would misplay a grounder for an inside-the-park home run. These plays still happen, but not nearly as often. If the Cubs and Giants played like that, imagine how the doormats played. There were also some extremely smart plays, but the floor for proper conduct was much lower in 1908.
It seems strange that teams that practiced so religiously played so poorly, but think for a second. Much of what is now received wisdom was still being worked out. In the last quarter of the nineteenth century, players slowly began figuring out how to work together, or back each other up. For example, what should a catcher do when a base runner is caught in a run-down between first and second? Where should the shortstop go when the runner on first heads for third on a single to right? People are not born knowing the answers.
Look at it from the point of view of someone born in 1879 earning a roster slot in 1900. He grew up in a world where even the best players at the highest levels were still learning the core basics. It did not trickle down to Iowa’s cornfields or Pennsylvania’s coal mines overnight. Neither TV nor radio existed to teach him how the pros acted. Odds were very good he had never seen a big league game, and may not know anyone who has. Sandlot baseball has always been self-regulating, but there is usually at least some fundamental knowledge for kids to rely on. When he starts playing semipro ball, his manager was likely another player, probably under 30 years old himself. That man hopefully has some exposure to the basics being threshed out, but that was not guaranteed. Even if the skipper had basic knowledge of fundamentals, perhaps he cannot coach well. Depending on the club’s finances, he might be a business manager. If a kid could hit or possessed a strong arm, he would receive playing time, no matter how ignorant he was of fundamentals.
Thus you end up with the following story told by baseball historian Fred Stein. In 1897, a rawboned young buck called Honus Wagner began playing for the Louisville Colonels. His manager, a not yet 25-years-old Fred Clarke, told the kid to “lay one down” in his next at bat. Instead, Wagner hit a home run. Appreciative of the result but curious as to why the rookie ignored his instructions to bunt, Clarke asked Wagner what happened. Shamefacedly, the future Hall of Famer shortstop admitted he had never heard the phrase “lay one down” before. He had no idea what his manager was talking about. This was the situation Clarke, McGraw, and Chance contended with.
Fundamentals first have to be developed. Then they diffuse. Next, their instruction becomes institutionalized. Once the lessons become second nature to one generation, the next wave can be fully and immediately immersed in them. Nowadays, high schoolers are better versed in solid fundamentals than many big leaguers a century ago. After enough years and decades go by, fundamentals are so ingrained even Little Leaguers learn them, and you assume that everyone getting paid to play the game knows them by heart. Even a poor kid from the Dominican Republic has access to more knowledgeable adults and coaches than was the case for an 1890s Wisconsin farm boy.
This might oversell the point. At SABR’s annual convention in 2007, I heard Cait Murphy talk about what she learned from researching her book, and she was surprised at how advanced the level of play sometimes was. Examples of intelligent play existed – for instance the Cubs had worked out an impressive system of defensive signals amongst each other. However, such plays coincided with embarrassing miscues, as the floor for acceptable play was quite low. A wide discrepancy existed in the quality of fundamental ball played in these years. The more advanced examples of shrewd gamesmanship were often the result of major league managers instilling those values into their charges.
This explains why coaching fundamentals mattered so much for this generation of managers. The basic ideas of how to play had been worked out, now it was a time to diligently instruct them to the players. McGraw, Chance, and their ilk focused on the fundamentals because their players so sorely lacked knowledge that these pointers could significantly improve squads.
A century later, in his bestseller Moneyball, Michael Lewis introduced the phrase “market inefficiency” to baseball fans. He argued the 2002 A’s won 103 games despite a low payroll because they realized the baseball world undervalued the importance of on-base percentage. By exploiting this gap between reality and perception, A’s GM Billy Beane made his team a winner. A century earlier, the market inefficiency was fundamentals. The best managers, such as McGraw and Chance, were those who could transform raw clumps of talent into majestic creations. One should not underestimate how important sound play was back then. In the early twentieth century some teams made 100 fewer errors a year than their rivals. Combined with improved base running, solid mental play, and all those other little things, proper fundamentals were worth many wins.
Chris Jaffe is an instructor of history and a columnist for the The Hardball Times. He lives in Schaumburg, Illinois. For more information about Chris Jaffe and Evaluating Baseball’s Managers, visit the author’s website.
| F/X Visualizations | February 05, 2010 |
Thoughts on a New Box Score
I have fond memories of, as a child, reading box scores in the newspaper. In the pre-internet, or at least pre-internet in my house, days box scores in newspapers was the medium by which I, and I assume, most people consumed baseball data. The data were all there, tightly yet efficiently packed in a format that allowed you to pull out any or all you wanted without feeling overwhelmed. Each was small enough for box scores for all the day's games to fit on one page.
I still read box scores, the medium has changed to the internet, but the box score itself is largely the same. I guess the format has stayed largely the same since the mid-1800s. Some of the stats are different but the layout is very similar. Over 150 years with little change shows that the format is remarkably successful, but that does not mean there cannot be innovations. FanGraphs's WPA charts are not box scores per se, but are a very effective way of presenting what happened in a game.
I thought it would be an interesting exercise to attempt to create a new box score. I wanted it to retain the original box score's quality of presenting a relatively large amount of information in a relatively small space, but making that data accessible and not overwhelming. Beyond that I hoped my new method gave a more immediate feeling for the pace and tenor of the game, like the WPA chart does.
Here is my attempt. The image is may be too small, but I kept it that way so that it didn't push out the right margin of the page. You can click on it for a larger version. I used game one of the 2009 World Series for the example.
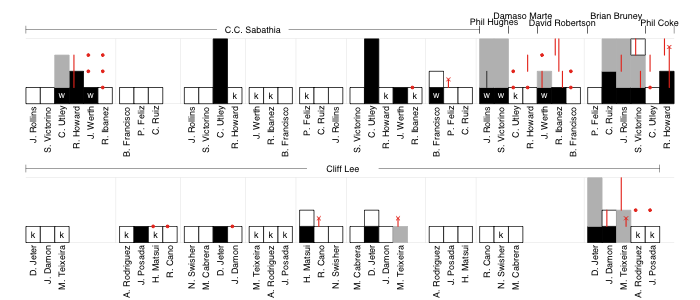
Each at-bat is represented by a bar, the height of which denotes the base the batter reached. White bars are for outs, black for hits or walks. The batter's progression around the rest of the bases that inning is indicated in gray (steals have a vertical black line through them). Runners on-base during an at-bat are indicated in red: circles for those not moved over in the at-bat, lines to show their progression as a result of the at-bat and an 'ex' if they were thrown or tagged out in that at-bat.
The score can be counted along as the black or gray bars reach the top. That also allows you to count individual batter's runs scored or pitcher's runs allowed. Red lines that reach the top are RBIs.
Compared to a traditional box score it is harder to find an individual player's line. For example to see that Chase Utley went 2-4 with 2 HRs, 2 runs, 2 RBIs, a strikeout and a walk you have to go through, find his at-bats and count all of the events. But the trade-off is, I think, this formulation gives a better feel for the pace of the game, and allows the events to be easily recreated: in the top of the first CC Sabathia escaped a base-loaded two-outs jam; Phil Hughes took over to start the eighth and walked the only two batters he faced, both of whom came around to score on Raul Ibanez's single; Utley's two solo-HRs were the only runs through the first seven innings; Cliff Lee didn't allow a runner past first until the ninth, and up to that point faced just three batters over the minimum; the Yankees burned through five relievers, who gave up four runs, in the last two innings; the top of the ninth ended with Shane Victorino getting thrown out at home on a Ryan Howard double and the game ended with two more Cliff Lee strikeouts. All of this can be easily seen through a close, but not difficult, reading of the chart.
What do you think of this format: Complicated and poorly laid out? Hard to read? Brilliant? I welcome constructive criticism in light of what you want from a representation of a baseball game.
| Touching Bases | February 04, 2010 |
Hitters by Zones
Few in MLB can beat a well-located pitch down and away. I wanted to look up those who could, so I broke the plate area down into nine zones, scaling the vertical component of the pitch for the batter’s height. For this analysis, I decided to restrict my sample to only 2009 pitches at which the batter swung. Here’s a crude chart showing the percentage of swings in each zone and how batters fare when swinging, indicated by color.
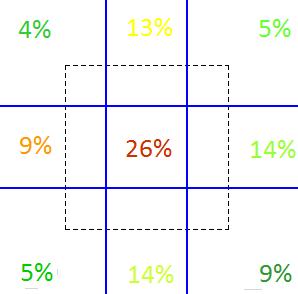
Batters have the advantage when the pitch is middle-middle, and for the other eight zones, the run value is negative.
Getting right to the leaderboards. There are nine of these, but I’m going to leave the commentary short and I’ll leave a spreadsheet at the end.
Down-In
| Name | Runs | Swings |
|---|---|---|
| Derrek Lee | 5.6 | 57 |
| David Wright | 3.8 | 72 |
| Corey Hart | 3.6 | 60 |
| Hunter Pence | 2.8 | 73 |
| Carlos Delgado | 2.6 | 11 |
| Chase Headley | -5.9 | 58 |
| Ryan Braun | -6.1 | 84 |
| Aubrey Huff | -6.2 | 56 |
| David Ortiz | -6.2 | 64 |
| Ryan Howard | -6.6 | 84 |
Ryan Howard and David Ortiz are similar type hitters who like the ball out over the plate but can get beat inside. Carlos Delgado hit a homer, three doubles and a single on his eleven swings at pitches down and in.
Down-Middle
| Name | Runs | Swings |
|---|---|---|
| Joey Votto | 10.6 | 193 |
| Brian Roberts | 9.9 | 204 |
| Miguel Cabrera | 9.7 | 191 |
| Dustin Pedroia | 6.9 | 150 |
| Nick Markakis | 6.8 | 160 |
| Garret Anderson | -11.7 | 174 |
| Nate McLouth | -12.3 | 125 |
| Jack Cust | -12.7 | 124 |
| Dan Uggla | -13.4 | 185 |
| Derek Jeter | -13.9 | 173 |
I’m surprised Derek Jeter’s on this list, as he’s a successful groundball hitter. Dan Uggla and Jack Cust on the other hand are fly ball hitters.
Down-Away
| Name | Runs | Swings |
|---|---|---|
| Carlos Gonzalez | 1.8 | 69 |
| Denard Span | 1.5 | 68 |
| Ichiro Suzuki | 1.4 | 121 |
| Robinzon Diaz | 1.2 | 18 |
| Trevor Crowe | 1.2 | 17 |
| Hideki Matsui | -12.8 | 107 |
| Adam LaRoche | -13.4 | 145 |
| Jayson Werth | -13.5 | 138 |
| Ryan Howard | -13.8 | 231 |
| Brandon Inge | -14.0 | 120 |
It appears foot speed is instrumental if one is to succeed by swinging at pitches down and away. I’m assuming the highest percentage of grounders are on pitches in this location, and speed is important to get on base via the grounder. Pitching Howard down in the zone seems to be a good idea.
Middle-In
| Name | Runs | Swings |
|---|---|---|
| Martin Prado | 13.2 | 87 |
| Michael Young | 10.9 | 132 |
| James Loney | 10.2 | 83 |
| Mike Cameron | 8.8 | 113 |
| Derrek Lee | 8.3 | 116 |
| Willie Bloomquist | -7.1 | 121 |
| Lyle Overbay | -7.2 | 42 |
| Jeff Francoeur | -7.6 | 172 |
| Edgar Renteria | -8.5 | 132 |
| Mark DeRosa | -14.1 | 125 |
Derrek Lee likes the ball inside.
Middle-Middle
| Name | Runs | Swings |
|---|---|---|
| Prince Fielder | 30.7 | 249 |
| Mark Teixeira | 29.9 | 294 |
| Ryan Braun | 29.6 | 281 |
| Adam Dunn | 25.3 | 294 |
| Andre Ethier | 25.2 | 323 |
| Augie Ojeda | -10.9 | 128 |
| Nick Punto | -11.3 | 191 |
| Luis Rodriguez | -11.8 | 129 |
| Ty Wigginton | -12.0 | 219 |
| Dioner Navarro | -13.1 | 174 |
This is clearly the most telling list in terms of quality of hitter. To be successful swinging the bat, you have to be able to hit the ball pitched down the middle.
Middle-Away
| Name | Runs | Swings |
|---|---|---|
| Adrian Gonzalez | 8.2 | 156 |
| Robinson Cano | 7.2 | 175 |
| Ryan Braun | 7.2 | 101 |
| Nick Markakis | 6.3 | 178 |
| Brad Hawpe | 5.9 | 228 |
| Pedro Feliz | -10.5 | 129 |
| Jimmy Rollins | -10.7 | 301 |
| Chase Utley | -11.1 | 232 |
| Curtis Granderson | -13.3 | 252 |
| Aaron Hill | -13.6 | 152 |
I already knew that Adrian Gonzalez and Robinson Cano excelled hitting the ball the other way, so it makes sense that they also excel at hitting outside pitches. The Phillies are not so good at hitting the ball when pitched away. They are good at baserunning, however.
Up-In
| Name | Runs | Swings |
|---|---|---|
| Casey McGehee | 5.1 | 84 |
| Michael Young | 5.0 | 85 |
| Marco Scutaro | 3.8 | 43 |
| Seth Smith | 3.8 | 14 |
| Pablo Sandoval | 3.1 | 81 |
| Hunter Pence | -7.1 | 77 |
| Matt Holliday | -7.7 | 85 |
| Clint Barmes | -8.0 | 75 |
| Jhonny Peralta | -8.6 | 85 |
| Michael Cuddyer | -10.3 | 123 |
Michael Young also likes the ball inside. He beat out Lee by six runs last year on pitches at least half a foot inside. Seth Smith had seven hits on the 14 pitches he swung at up and in, including four for extra bases.
Up-Middle
| Name | Runs | Swings |
|---|---|---|
| Michael Cuddyer | 10.7 | 186 |
| Raul Ibanez | 9.7 | 114 |
| Aaron Hill | 9.6 | 223 |
| Kevin Youkilis | 7.5 | 172 |
| Todd Helton | 7.4 | 168 |
| Orlando Cabrera | -10.3 | 204 |
| Jason Giambi | -11.3 | 109 |
| Mike Cameron | -11.6 | 122 |
| Jose Bautista | -11.9 | 136 |
| Mark Reynolds | -13.5 | 177 |
Michael Cuddyer was last at pitches up and in, but first at pitches up and over the plate. I find this very interesting. If you’re a pitcher, you can jam Cuddyer, but you better not miss.
Up-Away
| Name | Runs | Swings |
|---|---|---|
| Albert Pujols | 5.5 | 82 |
| Matt Wieters | 4.7 | 42 |
| Chris Coghlan | 4.7 | 76 |
| Matt Kemp | 3.9 | 56 |
| Jacoby Ellsbury | 3.8 | 58 |
| Jimmy Rollins | -6.0 | 110 |
| Rafael Furcal | -6.1 | 93 |
| Jorge Cantu | -6.4 | 56 |
| Brian Roberts | -7.3 | 76 |
| Emilio Bonifacio | -8.0 | 73 |
It took you a whole article to find Albert Pujols at the top of a leaderboard. My analysis confirms Rich Lederer's preliminary hypothesis. Pujols continues to be good.
Here's a spreadsheet containing all hitters with at least ten pitches swung at in a zone. And why not? Pitchers too.
| Change-Up | February 03, 2010 |
Josh Beckett: To Extend or Not?
Whether you think they've shaped up as a bunch of banjo-hitting ninnies or the stingiest run prevention unit this side of the 1968 St. Louis Cardinals, or both, or somewhere in between, the Boston Red Sox have set their 2010 roster for all intents and purposes. While Red Sox players and fans alike gear up for another exciting season with high expectations, it falls to the Boston front office to focus on longer term roster planning, no small task given the personnel shifts that are sure to continue.
In the lineup David Ortiz, Victor Martinez and Adrian Beltre will become unrestricted free agents at the end of the 2010 season. Red Sox closer Jonathan Papelbon's contract also expires and given his not-so-subtle eagerness for his big payday, it's fair to say he will probably be moving on. The most critical looming free agent decision, however, will center on Josh Beckett. Beckett will pitch out his 30-year old season this year, his fifth in a Red Sox uniform.
The choice to extend Beckett will test Theo Epstein and his Baseball Operations staff. Beckett's popular, both with teammates and Boston's rabid fan base. We all know that Beckett has experienced an inordinate amount of post-season success. And yet, whether it's a nagging injury here or there, his proclivity to give up the gopher ball or the mere fact that he will be 31 in the first season of his new contract, the Red Sox have a number of red flags to consider. Let's take stock of the factors surrounding Beckett's case.
The first thing to understand is that Beckett is a truly elite pitcher. Since he joined the Red Sox, let's look at where he has ranked in the American League in both xFIP and Wins Above Replacement (WAR):
          xFIP      WAR
2006       21       30
2007        4        2
2008        2        8
2009        7        7
In just under 800 total innings pitched since 2006, Beckett has a 116 ERA+ but if you take out his outlier 5.01 ERA season his first year in Boston, that ERA+ figure jumps to 126 while averaging just under 200 innings per season. To see how he has stacked up since 2007 with other American League pitchers, consider below:
                IP      ERA+
Greinke        553.2     149
Halladay       710.1     141
F. Hernandez   629.2     133
Lackey         563.2     129
Sabathia       593.1     129
Beckett        587.1     126
You get the picture. Josh Beckett is an excellent power arm with historically standout peripherals and dependable durability, and that's a critical part of this equation. He's not Mike Hampton or Barry Zito. And yet, before you commit the sort of dollars it will take to secure Beckett's services, it's essential to understand how pitchers perform from 31 on.
Above, I showed where Beckett stacked up among American League pitchers from 2007 to 2009 with at least 500 innings pitched. Applying the same parameters but extending it out to include the National League and pitchers 31 and older, we get a total of 10 pitchers (as opposed to 35 under 31). Half of them posted ERA+ totals under 100 over that time, and the rest of the list looks like this:
                IP      ERA+
Lilly          588.2     124
D. Davis       542.0     110
Lowe           605.2     108
Pettitte       614.0     104
Washburn       523.1     102
The rest of the list includes Kevin Millwood, Jamie Moyer, Braden Looper, Jeff Suppan and Livan Hernandez. Aside from Ted Lilly, I think the Red Sox would be disappointed with output in line with any of the other 9 pitchers. But let's tinker with the list further. Let's say the Red Sox or any other team giving Beckett 5 years would like him to average 175 innings per season. So let's set the following Play Index list parameters: at least 875 innings (5x175) with an ERA+ of at least 110 from 2000 to 2009, age 31 and older. Here is what we get.
| Rk | Player | ERA+ | IP | Age | Tm |
|---|---|---|---|---|---|
| 1 | Randy Johnson | 137 | 1885.1 | 36-45 | ARI-NYY-SFG |
| 2 | Roger Clemens | 134 | 1454.1 | 37-44 | NYY-HOU |
| 3 | Curt Schilling | 133 | 1569.1 | 33-40 | TOT-ARI-BOS |
| 4 | John Smoltz | 132 | 1058.2 | 34-42 | ATL-TOT |
| 5 | Pedro Martinez | 126 | 935.0 | 31-37 | BOS-NYM-PHI |
| 6 | Greg Maddux | 117 | 1939.2 | 34-42 | ATL-CHC-TOT-SDP |
| 7 | Mike Mussina | 116 | 1790.2 | 31-39 | BAL-NYY |
| 8 | Tom Glavine | 114 | 1753.2 | 34-42 | ATL-NYM |
| 9 | Andy Pettitte | 113 | 1342.0 | 31-37 | NYY-HOU |
| 10 | Al Leiter | 111 | 1096.1 | 34-39 | NYM-TOT |
Whoa. You might have to go to the very bottom of that list before you even get to a non future Hall of Famer. In Major League Baseball, only the truly elite starting pitchers survive. And Jamie Moyer and Tim Wakefield, I suppose, but that's another story.
The first lesson here is that it's critical to understand that there is a premium to be paid on the unrestricted free agent market, and that you have to recalibrate performance expectations. You might not get the late-aughts Beckett for his next contract, and it might feel like you've overpaid at times, but when you consider how much value Boston got in this last contract, it could all even out. Let's take the John Lackey deal as an example and given Lackey's similarities to Beckett, it's not a bad proxy at all. If you believe Fangraphs free agent dollar values assigned to each win, all the Red Sox need from Lackey to make the deal worthwhile is output like Scott Baker or Carl Pavano produced in 2009, or Andy Sonnanstine in 2008. Can Beckett do that in his 31 to 35 seasons? Maybe.
The second lesson is that, given the odds of a 30-plus pitcher living up to his end of the deal, there are probably better areas to allocate your free agent spend. In Boston's case, this is especially true given the commitment they have made to John Lackey this off-season. As a Red Sox fan, I am not ready to state explicitly that they should let Beckett walk but $35-$40 million committed to Lackey and Beckett annually from 2011-2014 has the potential to hamper Boston's flexibility. As with anything else, this decision will come down to Boston's ability to meld medical, scouting and performance analysis insight to generate an accurate projection of Beckett's future output.
Now don't mess it up!
| Behind the Scoreboard | February 02, 2010 |
There Are Two Types of Players...
In this article, I'll attempt to finish the title's sentence by doing a principal component analysis on player statistics. Going into this I had no idea what I would find or whether the principal component analysis would find anything interesting at all.
For those unfamiliar with the type analysis, the point of it is to reduce a large number of potentially correlated variables down to a few key underlying factors that explain the variables. The researcher feeds the computer a bunch of records (in the this case, players) and several key variables (in this case, their statistics), The computer, blind to what those variables actually mean, spits out a set of underlying factors which explain the "true" underlying causes for the variables in question. It does this by maximizing the variability between the players. It's then up to the researcher to interpret what each factor represents. In this case, I'm looking for the one underlying factor that best describes a player.
In the baseball world, I wondered what one underlying factor best determined a player's statistics. Normally, this type of analysis would be done on many more variables, but I wanted to see what it would pick out from players' basic, non-team influenced statistics: 1B, 2B, 3B, HR, BB, K.
The principal component analysis spits out a bunch of factors, each with decreasing importance in determining a player's statistics. Only the first one really had much meaning to it, and with only six variables to analyze, this wasn't much of a surprise. The analysis attempts to differentiate players as much as possible, but the big question was how did it divide the players? It could have pitted good players vs. bad players, power hitters vs. contact hitters, patient players vs. free swingers, etc. But what happened?
In fact the factor loadings for the first principal component were as follows:
1B -.556
2B .132
3B -.259
HR .502
BB .382
SO .456
As it turns out, the analysis shows that if you want to put the players into two distinct camps, one camp (whose overall scores will be positive) is made up guys who hit with power, walk a lot, and strikeout a lot, while another camp (whose scores will be negative) is made up of guys who hit a lot of singles and triples and make contact.
I actually think this makes a lot of sense in describing a player's hitting style in just one number. While of course there are plenty of metrics out there to determine a player's skill and value to a team, there isn't a single metric that describes a player's playing style on a sliding scale. A Batting Style score using these values as weights does just that.
On one end of the spectrum are contact hitters, small-ball, Mike Scioscia/Ozzie Guillen type players who make their living with singles, triples, and not striking out much. The other end are Earl Weaver/Billy Beane type players who hit homers and draw walks. Which type of player a man is best determines his statistics. It's Moneyball vs. small-ball. This one number represents the spectrum of playing styles.
To get a Batting Style score for each player, we can simply multiply their normalized statistics by the weights above. Doing so gives a normally distributed set of players with a range going from about -4 to 4. To make the results a little more intuitive, I converted this to a scale where the average was 100 with a standard deviation of 15. Players with high scores are "three true outcome" type players while those with low scores play with the opposite style.
How does the Batting Style number look according to 2009 data? The top ten most extreme players of each batting style are shown below:
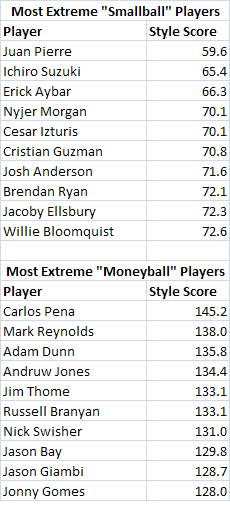
Now, it's hard to imagine a two more different sets of players. Everything that the first group of players does well, the second group does poorly, and vice-versa. Both sets have some good players and some bad players, and whether a player is good or bad doesn't much affect his Style score. Adam Dunn and Jason Bay provided good hitting value to their clubs, as did Jacoby Ellsbury and Ichiro, they just did it in different ways. A stat like wOBA tells you the value of a particular player. For instance, in 2009 Russell Branyan had a wOBA of .368 and Ichiro had a wOBA of .369. So they seem like pretty much the same player, right? Of course not. Ichrio and Branyan have two completely opposite styles of play. Ichiro has speed, gets a ton of singles and rarely homers, walks, or strikes out. Meanwhile Branyan's entire value is based on the long ball and the base on balls. The Batting Style score shows the immense difference between the two players. Branyan has the fifth highest Batting Style score, while Ichiro has the second lowest score.
Of course, not every player falls into one of these two types. Players who have a "medium" style can have moderate scores on each metric. For example, Ronnie Belliard does everything about average, hence his Batting Style score is about average. It also includes unusual players who don't fall into the usual patterns. Aaron Hill doesn't walk much or strikeout much, but he hits homeruns. Hence, his overall style falls in the middle. Meanwhile Bobby Abreu walks a lot, but also gets a lot of singles. Hence, he doesn't fall into either extreme either. The Batting Style doesn't discriminate based on the skill of the player, although as you might expect, guys who have the power/walk Batting Style are as a whole slightly more valuable simply because guys who hit a lot of homeruns and take a lot of walks, are generally more valuable than singles hitters, though the difference is not major. Guys on the contact end of the spectrum have a wOBA of about 10 points lower than guys on the power end of the spectrum. You can check out the full list of player Batting Style scores here:
It's also interesting to look at this same list through history. Which players had the most extreme styles of during each decade? The list below (including all players with at least 1000 career PA's) shows the top three extreme players in each decade.
As you might expect, Babe Ruth is the original power/walk/strikeout player. As someone who revolutionized the game in that regard, it comes as no surprise. Harmon Killebrew, Mark McGwire, Dave Kingman, are others that famously fall into that same mold and are identified here. Meanwhile, Willie Wilson, Nellie Fox, and Matty Alou are on the other end of the spectrum - precisely the guys that you would expect. The analysis was run on the dataset as a whole (though to really be correct, it really should be run on each individual year). Over time, the styles have definitely shifted away from the contact approach and towards the power/walk style. Overall, there's not really a surprise in the bunch except for the fact that I've never heard of some of the older, more obscure players. Personally, I find both styles of player fun to watch as their extreme styles seem to make them more colorful, though I think that the power guys have historically caught more grief from fans and have been underrated up until the recent sabermetric revolution.
Whether a statistic like Batting Style has any real value to it or not, I think it's fun. Obviously, a line of six statistics isn't too hard to digest, but I like the idea of a single number describing a player's hitting style. In any case, it was interesting that the principal component analysis picked up on the two distinct styles and drew the scale the way it did. I think if you asked fans to name two completely opposite hitters, you would get a lot of Juan Pierre/Adam Dunn responses, which shows that the principal component analysis picked out an intuitive result.
| Touching Bases | February 01, 2010 |
Thoughts on Bloomberg Sports
Bloomberg Sports unveiled its two new products to the media on Sunday afternoon, and I was one of those fortunate enough to be in attendance. Thoughts:
The fantasy product, to be released this month on a trial basis, contains a draft kit and in-season tools. Player news, stats, and data visualizations are all available with at most three clicks of the mouse. Bloomberg Sports is not providing any new data sources to the consumer, but in partnerships with MLB and Rotowire, BBGSports aggregates relevant player statistics and news, laying the data out in a friendly and efficient interface. Pretty much all of the offensive and pitching stats/splits available on Baseball Reference and FanGraphs are available in Bloomberg’s product. Even better, those stats that aren’t included can be written into the system. You can create new stats and the product is adaptable to the most obscure fantasy league settings. All of these stats can be easily ranked and charted. 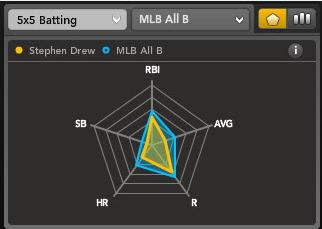 The best visualization I saw was their “spider” chart, which is similar to Justin Bopp’s DiamondView and Kevin Dame's 5 Tool Analyzer.
Attached to the fantasy product will be a team of writers led by Jonah Keri, whose background in business and baseball analysis makes him a neat fit, but more importantly, Keri’s refined post-up game and precise outlet passes are reminiscent of a younger, Jewish Wes Unseld. BBGSports has decided to produce some of its written content for free, and lock some behind a pay wall. I imagine the free content will be similar to FanGraphs’ written content, in that it will use progressive analysis to inform the reader as well as to promote the site’s statistical engine. But what will be behind the pay wall? The Baseball Prospectus model is sensible in that BP leaves its more random material, for lack of a better term, in the open (Interviews, TWIQ, Roundtables), while leaving its selling point—progressive analysis—behind the pay wall. However, BBGSports isn’t selling its analysis. In fact, BBGSports is selling others' analysis, as Bloomberg specializes in collecting and distributing relevant news from thousands and thousands of web sites. So I wonder if BBGSports is just going to put some of its written content behind the pay wall to satisfy the consumer who likes to feel that he’s getting more bang for his buck. I hope that BBGSports finds a way to differentiate its free analysis from that which is paid for. I look forward to seeing what Keri and Co. have in store, and who it is that composes Keri’s company.
My chief criticism of BBGSports’ fantasy product is, oddly enough, with its only never-before-seen-to-me data. Again, I don't think the product was built to harvest any new data, but rather to provide an incredibly convenient database that consists of already-available information. In that mission, BBGSports has succeeded. But BBGSports went ahead and set up a proprietary algorithm to rank players in a traditional 5x5 fantasy league. The rank, called “B-Rank,” is not customizable to league settings as of yet and the methodology behind the ranking system was not explained despite multiple questions from the audience. The speakers, headlined by the impressive Stephen Orban, did not share any intentions to market the B-Rank, nor did they explain the B-Rank’s value, yet they nevertheless insisted on keeping it entirely secret. Now, to be fair, there is a very nice ranking feature that allows you to rank players using whatever categories and filters you’d like, and exclude drafted players or put players on your watch list and all that good stuff. But the B-Rank looms over it. One of my favorite things about my fantasy experience at ESPN is the player rater, which rates players in each category based on a Z-Score, and then sums those scores to form a comprehensive rating. This is intuitive and understandable, and I can adjust these rankings to my own whims since I understand what goes into them. But with the B-Rank, I have no idea why players are ranked where they are.
Same with the new projection system. Even if BBGSports is releasing the new PECOTA, we wouldn’t be buying it, since BBGSports hasn’t shown that it is an expert in sabermetrics, and the speakers were in fact adamant that they are not baseball experts. So why should I care that BBGSports is launching a projection system? If you were to follow the projection’s advice and draft Ryan Howard fourth or Matt Kemp sixth, I would take pity on your children, for they would have been born to a poor fantasy baseball player. Instead of taking its cue from Baseball Prospectus, whose initiative it is to develop new and progressive analytics, BBGSports should follow in FanGraphs’ footsteps and assemble an assortment of projections. And if BBGSports wants its own projection system, I feel the user should have the ability to modify the projections however he or she pleases. If BBGSports wants B-Rank to catch on, then BBGSports will need to treat it the same way as FanGraphs treated WAR. FanGraphs went through pains to ensure that readers understood the thought process and calculations behind WAR. It would be a big plus and potential selling point for BBGSports to create a ranking system that can become universally accepted among fantasy players, but that’s not happening if fantasy players don’t know what the hell B-Rank consists of.
BBGSports might want to allow one of its programmers to play around with the data and periodically release new metrics that incline to the sabermetric bent. As I’ve stated, I don’t think Bloomberg should be trying to introduce any proprietary metrics, but along the same lines as BBGSports' written analysis, perhaps a quantitative analyst can demonstrate how the product in place can be utilized to develop one’s own projections/rankings/metrics using only the data provided by BBGSports. The B-Rank would be a great start, if only its purpose wasn't defeated by protecting the algorithm.
Fortunately, BBGSports appears genuinely interested in consumer feedback. I feel that its willingness to accept and respond to feedback will be instrumental to BBGSports' success. The fantasy product exists to make the fantasy player’s job easier and more fun, which necessitates the fantasy player’s input. As for the pro product, with only 30 teams to sell to, BBGSports will have to cater individually to each and every team. To get a glimpse of the the pro product, see David Appelman’s post. Incorporated into the pro product are pitchf/x data and and the tools to integrate whatever proprietary information teams are already holding into the BBGSports database, which can only be accessed via a proper bar code and finger print. The visuals provided by Appelman and Ben Kabak speak to BBGSports as an innovative and interactive product. And from what I've heard and seen so far, improvements will be ongoing.
Already in an advantageous relationship with MLB and MLB advanced media, Bloomberg Sports will likely want to partner up with STATS, Baseball Info Solutions, and Baseball America. Bloomberg Sports will eventually become the leading distributor for all private data collectors, as BBGSports does a better job of presenting that data than any other provider I’ve seen.