Rich Lederer • Baseball Beat
Patrick Sullivan • Change-Up
Jeremy Greenhouse • Touching Bases
Dave Allen • F/X Visualizations
Sky Andrecheck • Behind the Scoreboard
Marc Hulet • Around the Minors
Al Doyle • Past Times
Retired Uniforms:
Bryan Smith • WTNY
Joe Sheehan • Command Post
Jeff Albert • The Batter's Eye
RSS Feed
Home
*Examining the Past, Present, and Future*
Lineup Card
Recent Entries
» Putting Together a Reality Team
» Historical Hall of Fame Vote Comparisons: 2012
» An All-Christmas Team
» The New-Look Angels
» John Denny: The Forgotten Cy Young Award Winner
» Money Isn't Everything
» What Would It Take to Hit .400 in the 21st Century?
» Halos Heaven
» Brandon McCarthy's Breakout Season
» Link-o-Rama
» Historical Hall of Fame Vote Comparisons: 2012
» An All-Christmas Team
» The New-Look Angels
» John Denny: The Forgotten Cy Young Award Winner
» Money Isn't Everything
» What Would It Take to Hit .400 in the 21st Century?
» Halos Heaven
» Brandon McCarthy's Breakout Season
» Link-o-Rama
Best of Baseball Beat
Abstracts From the Abstracts
1977 Baseball Abstract
1978 Baseball Abstract
1979 Baseball Abstract
1980 Baseball Abstract
1981 Baseball Abstract
1982 Baseball Abstract
1983 Baseball Abstract
1984 Baseball Abstract
1985 Baseball Abstract
1986 Baseball Abstract
1987 Baseball Abstract
1988 Baseball Abstract
1978 Baseball Abstract
1979 Baseball Abstract
1980 Baseball Abstract
1981 Baseball Abstract
1982 Baseball Abstract
1983 Baseball Abstract
1984 Baseball Abstract
1985 Baseball Abstract
1986 Baseball Abstract
1987 Baseball Abstract
1988 Baseball Abstract
Bert Blyleven Series
Meeting Up and Hanging Out with Bert
The Results Are In And...
Aficionado Heavily Invested in Blyleven
Latest on Blyleven's Chances for the HOF
The Internet Zealot Responds
400 Down and 5 to Go...
Bert Be Home By Eleven?
Blyleven's Forgotten Season (1973)
HeyMan, Your Comments Don't Hold Water
The Waiting is the Hardest Part
Another Addition to the Blyleven Series
Search for the Truth
As Dominant as His HOF Contemporaries
Listen, Buster
A Larger Step for Blyleven
Answering the Naysayers (Part Two)
Another Small Step for Blyleven
Q&A: Blyleven on the Twins
The Majority Rules, Right?
It's All Dutch to Some
The Hall of Fame Case for Bert Blyleven
Q&A: Blyleven on Felix Hernandez
Clemens Rocketing Up Charts
Poz: An Interview With a KC Star
A HOF Chat with Tracy Ringolsby
Up Close and Personal
A Peek Into the Mind of a HOF Voter
Answering the Naysayers
It's That Time of the Year (Again)
"If Cooperstown is Calling..."
The Bert Alert
One Small Step for Blyleven...
Only the Lonely
Exclusive Interviews
Lee Sinins
Alex Belth
David Pinto
Will Carroll
Mike Carminati
Aaron Gleeman
Joe Sheehan
Jay Jaffe
Jeff Peek
Tracy Ringolsby
Joe Posnanski
Bill James Part I, II, III
Jon Lalonde
Chuck Tiffany
Dayn Perry
Fay Vincent
Nate Silver
Alex Belth
David Pinto
Will Carroll
Mike Carminati
Aaron Gleeman
Joe Sheehan
Jay Jaffe
Jeff Peek
Tracy Ringolsby
Joe Posnanski
Bill James Part I, II, III
Jon Lalonde
Chuck Tiffany
Dayn Perry
Fay Vincent
Nate Silver
Bullpen
Rich Lederer
The Odd Couple (with Alex Belth)
The MostUnder Over Underrated Player in Baseball (with Brian Gunn)
Three Wise Men (roundtable by Alex Belth)
Infrequently Asked Questions (interview with Matt Welch)
Interview (Orioles Think Tank)
Bernie and the Yanks (Bronx Banter)
Hope and Faith: How the LAA Win the World Series (Baseball Prospectus)
NL West (The Soul of Baseball)
Greatest Living Hitter? (Sports Illustrated)
Roundtable: 2008 HOF Ballot (Armchair GM)
The Most
Three Wise Men (roundtable by Alex Belth)
Infrequently Asked Questions (interview with Matt Welch)
Interview (Orioles Think Tank)
Bernie and the Yanks (Bronx Banter)
Hope and Faith: How the LAA Win the World Series (Baseball Prospectus)
NL West (The Soul of Baseball)
Greatest Living Hitter? (Sports Illustrated)
Roundtable: 2008 HOF Ballot (Armchair GM)
Patrick Sullivan
Designated Hitters
David Bromberg (Q&A: John Denny)
Mark Armour (H. Killebrew and Versatility)
Joe Lederer (Soundtrack of a Prospect)
David Bromberg (Clemente's Autograph)
David Bromberg (Woody Fryman)
D. Baumstein (WAR Against Age: Pitchers)
Doug Baumstein (The WAR Against Age)
Doug Baumstein (A Lifetime on the Road)
John Fraser (Pick Six)
Mark Armour (How to Score More Runs?)
Bill Parker (What Opening Day Tells Us)
Stan Opdyke (Pat Rispole)
Chris Jaffe (Evaluating Baseball's Mgrs)
Stan Opdyke (Baseball Radio in NYC, 1953)
A. Nathan (Performance of Baseball Bats)
Michael Weddell (Edgar Martinez/HOF)
Jon Weisman (100 Things Dodgers Fans...)
Stan Opdyke (Connie Mack and Vin Scully)
Eric Walker (Evaluating Run Production)
Brent Mayne (The Intangibles of Catching)
Chris Moore (Best Fastballs in Baseball)
Dave Baldwin (The Batter’s Brain)
Shawn Haviland (Ivy League to MLB)
Larry Granillo (Walking Off)
Rob Iracane (Solo HR Won't Break You)
Tommy Bennett (Charm of AM Radio)
Harry Pavlidis (Johan Santana's Fast Start)
John Walsh (WAR and Remembrance)
Eric Walker (Precisely Inaccurate)
Bob Timmermann (As They See 'Em)
Geoff Young (Unicycles and Delusions)
Baseball Analysis at Tufts (Groundballers)
Baseball Analysis at Tufts (GB Out Rates)
G. Rybarczyk ('09 Hit Tracker Projections)
Joe Lederer (Curt Schilling/HoF)
Conor Gallagher (Hall of Fallacies)
Chris Green (Jim Rice, HoF, the Numbers)
Shawn Hoffman (Baseball's Bear Mkt?)
Paul Anthony (Manny Syndrome)
Ross Roley (World Series Odds)
B. Timmermann (Catcher's Interference)
R.J. Anderson (Waiting the Hardest Part)
Maury Brown (Cubs, MLB, and Cuban...)
Myron Logan (Dee-Fense, Dee-Fense)
Craig Calcaterra (Frivolity, Part I, Part II)
Chad Finn (Ode to Baseball Cards)
David Cameron (Mariners Foibles)
Chris Dial (Chipper Jones)
Pat Lederer (Memory Lane)
David Appelman (Clutch Pitching)
Bob Rittner (DH)
Jonathan Mayo (Roger Clemens)
Lisa Winston (My Son-in-Law...)
Russ McQueen (The Yellow Hammer)
Bob Rittner (I'm OK, You're OK)
Mark Armour (In Defense of the HOF)
Pat Jordan (Friends)
Dan Levitt (Analysis of Terry Ryan)
Doug Baumstein (Trading Econ 101)
Ross Roley (Runner's Reluctance II)
Ross Roley (Runner's Reluctance I)
Mark Armour (No-Longer Lovable Sox)
Bruce Regal (Stealthy and Wise)
Brian Gunn (Roid Monster)
Current/McEvoy (Value of the SB)
John Rickert (Sinister Thefts)
Nate Silver (Sabermetrics)
David Vincent (Home Run Production)
Joe P. Sheehan (Enhanced Gameday II)
Mark Armour (An Ode to Sport)
David Gassko (All-Time Worm Burners)
Joe P. Sheehan (Enhanced Gameday)
John Walsh (When Titans Clash)
Fox/Williams (Quantifying Coaches II)
Fox/Williams (Quantifying Coaches I)
Jacob Luft (Bull Durham Rant)
Chad Finn (Strat-O-Matic)
Lisa Winston (Rotisserie Baseball)
Dave Studeman (Baseball Stats)
Steve Treder (Roger Craig)
Marc Normandin (Jeff Bagwell)
D. Appelman (Expanding Strike Zone)
Jeff Sackmann (Worst MiL Defenders)
Jeff Sackmann (Best MiL Defenders)
Maxwell Kates (Van Lingle Mungo)
David Appelman (Pitch Location)
Kent Bonham (Danny Ray Herrera)
Glenn Stout (Two Baseball Poems)
Bruce Regal (The Challenge Round)
Mark Lamster (Barry & Ty)
Geoff Young (NL West)
Tom Lederer (The Ryan Express)
Brian Erts (Great Leap Forward)
David Pinto (Parity and the N.L.)
Jacob Luft (Fathers and Daughters)
Jamey Newberg (Pete's Sake)
Jeff Albert (A. Jones Swing Analysis)
Jeff Albert (A-Rod Swing Analysis)
Keith Law (Death, Taxes, and Waivers)
Peter Abraham (Tales of Torre Tales)
Larry Borowsky (Let 'er Rip II)
Dan Levitt (Empirical Analysis of Bunting)
Jonah Keri (If I Met Warren Cromartie...)
Bob Klapisch (War Stories)
Bob Timmermann (John F. Kennedy HS)
Kent Bonham (Aluminum Adjustments)
Al Doyle (More Than Superstars)
Ross Roley (Instant Replay)
David Vincent (Barry Bonds Homers)
Chad Finn (Our Favorite Obscurities)
Bill Deane (1979 NL MVP)
Mark Armour (Rise/Fall of Artificial Turf)
Jeff Angus (Wally Moon Camp)
David Berri (Money and Baseball)
Larry Borowsky (Baseball w/o the #s)
Derek Zumsteg (The Irrational Market)
David Regan (Free Agent Contracts)
Peter Schmuck (Steroids and the HOF)
David Appelman (Pitchers, Pitch by Pitch)
Dan Fox (Swinging, Taking, Fouling, Etc)
Patrick Sullivan (Study of NYY CF/BOS LF)
Will Leitch (Baseball Journalism)
Jeff Sullivan (Pitcher Release Points)
Steve Treder ('69-'70 Giants)
Maury Brown (Charlie Finley)
John Brattain (Bob Johnson)
Bob Klapisch (The Case for Bert Blyleven)
Jeff Peek (Pride and Prejudice)
Dayn Perry (Bert and Warren)
Rob Neyer (If Don Sutton Was Great...)
Lisa Winston (Minor League Memories)
Alex Belth (Otis Redding Was Right)
David Cameron (Long Live the King)
Jeff Angus (Baserunning Study)
Bert Blyleven (Baseball Playoffs)
Boyd Nation (Not a Prospect List)
James Click (Batters-Baserunners Study)
Jeff Shaw (Why I Love Baseball)
David Gassko (BIP/BFP Fielding Study)
Jay Jaffe (Milwaukee Sausage Race)
Jamey Newberg (Remember When)
Bob Klapisch (Press Box to the Mound)
Dan Levitt (Predictive Value of BB)
David Vincent (Official Scorer)
Jon Weisman (Rick Monday)
Larry Borowsky (Let 'er Rip)
Will Carroll (Fictional Short Story)
Bob Timmermann (Japanese Baseball)
Cyril Morong (Best Pitching Seasons)
Sean Forman (Monte Carlo Win-Loss)
Brian Gunn (My Little Blue Book)
Joe Lederer (My Dad and Baseball)
Bill Deane (Bob Gibson, 1968)
Mark Armour (1977 Yankees)
Darren Viola (Retrosheet)
David Pinto (RFK)
Dayn Perry (Brave Heart)
Matt Welch (Dave Hansen)
Kevin Kernan (Jack McKeon)
Tom Lederer (Dodgers Road Trip)
Steve Lombardi (Slider)
Studes (Picturing Baseball)
Mike Carminati (Luck of the Drawl)
Eric Neel (Vin Scully)
J.C. Bradbury (Leo Mazzone)
John Sickels (Bill James)
Search Baseball Analysts
Archives
By Category:
Around the Majors Content Only
Around the Minors Content Only
Baseball Beat Content Only
Baseball Beat/Change-Up Content Only
Baseball Beat/WTNY Content Only
Behind the Scoreboard Content Only
Change-Up Content Only
Change-Up/Around the Majors Content Only
Command Post Content Only
Crunching the Numbers Content Only
Designated Hitter Content Only
F/X Visualizations Content Only
Past Times Content Only
Saber Talk Content Only
The Batter's Eye Content Only
Touching Bases Content Only
Weekend Blog Content Only
WTNY Content Only
By Month:
February 2012
January 2012
December 2011
October 2011
September 2011
August 2011
July 2011
June 2011
May 2011
April 2011
March 2011
February 2011
January 2011
December 2010
November 2010
October 2010
September 2010
August 2010
July 2010
June 2010
May 2010
April 2010
March 2010
February 2010
January 2010
December 2009
November 2009
October 2009
September 2009
August 2009
July 2009
June 2009
May 2009
April 2009
March 2009
February 2009
January 2009
December 2008
November 2008
October 2008
September 2008
August 2008
July 2008
June 2008
May 2008
April 2008
March 2008
February 2008
January 2008
December 2007
November 2007
October 2007
September 2007
August 2007
July 2007
June 2007
May 2007
April 2007
March 2007
February 2007
January 2007
December 2006
November 2006
October 2006
September 2006
August 2006
July 2006
June 2006
May 2006
April 2006
March 2006
February 2006
January 2006
December 2005
November 2005
October 2005
September 2005
August 2005
July 2005
June 2005
May 2005
April 2005
March 2005
February 2005
January 2005
December 2004
November 2004
October 2004
September 2004
August 2004
July 2004
June 2004
May 2004
April 2004
March 2004
February 2004
January 2004
December 2003
November 2003
October 2003
September 2003
August 2003
July 2003
June 2003
Reference
Organizational Stats
Arizona Diamondbacks Bat / Pitch
Atlanta Braves Bat / Pitch
Baltimore Orioles Bat / Pitch
Boston Red Sox Bat / Pitch
Chicago Cubs Bat / Pitch
Chicago White Sox Bat / Pitch
Cincinnati Reds Bat / Pitch
Cleveland Indians Bat / Pitch
Colorado Rockies Bat / Pitch
Detroit Tigers Bat / Pitch
Florida Marlins Bat / Pitch
Houston Astros Bat / Pitch
Kansas City Royals Bat / Pitch
Los Angeles Angels Bat / Pitch
Los Angeles Dodgers Bat / Pitch
Milwaukee Brewers Bat / Pitch
Minnesota Twins Bat / Pitch
New York Mets Bat / Pitch
New York Yankees Bat / Pitch
Oakland Athletics Bat / Pitch
Philadelphia Phillies Bat / Pitch
Pittsburgh Pirates Bat / Pitch
St. Louis Cardinals Bat / Pitch
San Diego Padres Bat / Pitch
San Francisco Giants Bat / Pitch
Seattle Mariners Bat / Pitch
Tampa Bay Devil Rays Bat / Pitch
Texas Rangers Bat / Pitch
Toronto Blue Jays Bat / Pitch
Washington Nationals Bat / Pitch
All-Star Links
Official Websites
News and Notes
Baseball News Blog
Baseball Newstand
ESPN Baseball
Fox Sports Baseball
Pro Sports Daily
Roto World
The Roto Times
USA Today Baseball
Baseball Newstand
ESPN Baseball
Fox Sports Baseball
Pro Sports Daily
Roto World
The Roto Times
USA Today Baseball
Reference and Analysis
Baseball Almanac
Baseball America
Baseball Archive
Baseball Contracts
Baseball Cube
Baseball Graphs
Baseball Library
Baseball Musings Player Database
Baseball Page
Baseball Primer
Baseball Prospectus
Baseball Reference
Baseball Statistics
Baseball Truth
Boxscore Central
Diamond Mind Baseball
Doug's Stats
FanGraphs
Fast Balls (pitchfx catalog)
Hardball Dollars
Hardball Times
Hit Tracker
Retrosheet
Rotobase/Rotoblog
Stat Corner
STATS
Tango on Baseball
Yahoo Sports MLB
Web Gems
Bill James Primer
Sabermetric Manifesto (Grabiner)
Pitching and Defense (McCracken)
Pitching and Defense (Tippett)
Transactions Primer (Neyer)
Baseball Stats (Batter's Box)
Prospect Report (Cameron)
Pitcher Workloads (Sheehan)
Goodbye to Old Baseball Ideas (Rickey)
Sabermetric Manifesto (Grabiner)
Pitching and Defense (McCracken)
Pitching and Defense (Tippett)
Transactions Primer (Neyer)
Baseball Stats (Batter's Box)
Prospect Report (Cameron)
Pitcher Workloads (Sheehan)
Goodbye to Old Baseball Ideas (Rickey)
Columnists
Baseball Blogs
Around the Majors
Athletics Nation
Baseball Crank
Baseball Musings
Baseball-Reference Blog
Batter's Box
Big League Stew
Bronx Banter
Catfish Stew
Cub Town
Dan Agonistes
Dodger Thoughts
DRays Bay
Ducksnorts
Futility Infielder
Halos Heaven
Inside the Rockies
It Might Be Dangerous
Knuckle Curve
LoHud Yankees Blog
Lookout Landing
Management by Baseball
Metaforian
Metsgeek
Mike's Baseball Rants
Only Baseball Matters
Redbird Nation
Red Reporter
Sabernomics (Braves)
Seth Speaks
ShysterBall
6-4-2 (Angels/Dodgers)
The Book
TheCubdom
The Cutting Edge
The House That Dewey Built
The View From The Bleachers
Tiger Blog
U.S.S. Mariner
Viva El Birdos
Where's Kernan
Minor Leagues
Arizona Fall League
BA Player Finder
Cal Leaguers
Jamey Newberg
JDM's Scoresheet Baseball
Minor League Baseball
Minor League Park Factors
Minor League Splits
No Pepper
Sickels' Minor League Ball
Warm October Nights
BA Player Finder
Cal Leaguers
Jamey Newberg
JDM's Scoresheet Baseball
Minor League Baseball
Minor League Park Factors
Minor League Splits
No Pepper
Sickels' Minor League Ball
Warm October Nights
Amateur
Boyd's World (College)
Cape Cod Baseball League
College Baseball Blog
College Baseball Insider
Collegiate Baseball Newspaper
College Splits
College Splits Blog
Dirtbags Baseball (Long Beach State)
NCAA Baseball
NCBWA
Team One Baseball (High School)
Texas A&M & Baseball
Cape Cod Baseball League
College Baseball Blog
College Baseball Insider
Collegiate Baseball Newspaper
College Splits
College Splits Blog
Dirtbags Baseball (Long Beach State)
NCAA Baseball
NCBWA
Team One Baseball (High School)
Texas A&M & Baseball
Historical
Cuban Baseball
House of David
Jim "Mudcat" Grant's Web Page
Negro League Baseball Players Assoc
Negro Leagues Baseball Museum
1919 Black Sox
Pacific Coast League
Philadelphia Athletics Historical Society
Shoeless Joe Jackson Society
SABR-L Archives
Walter O'Malley
House of David
Jim "Mudcat" Grant's Web Page
Negro League Baseball Players Assoc
Negro Leagues Baseball Museum
1919 Black Sox
Pacific Coast League
Philadelphia Athletics Historical Society
Shoeless Joe Jackson Society
SABR-L Archives
Walter O'Malley
Miscellaneous
Forums
Credits
Ticket Center
Tickets to Baseball -
Premium Red Sox Tickets - Tickets to Marlins Games - Cardinals Game Tickets - NY Yankee Tickets - Tickets Oakland Athletics - Dallas Cowboys Tickets - Arizona Cardinals Tickets - Tickets Seattle Seahawks - Buffalo Bills Tickets Online - Tickets to Dolphins Football
Buy Boston Red Sox tickets,
Philadelphia Phillies tix,
NY Yankees tickets,
NY Mets tickets, and
MLB All Star game tickets at ABC tickets
Not sure where to find the best online sportsbooks? Start your search with PlayersJet.
Get deals at SportsMemorabilia.com on baseball apparel, including Phillies jerseys and more for adults and children.
Shop the largest selection baseball equipment on sale at Sports Unlimited. Check out tons of baseball gloves, youth baseball gloves and catchers gear from Rawlings, Wilson, Nike & Under Armour.
2011 Draft Order
Courtesy of Baseball America
First-Round:
 1. Pirates (57-105)
 2. Mariners (61-101)
 3. Diamondbacks (65-97)
 4. Orioles (66-96)
 5. Royals (67-95)
 6. Nationals (69-93)
 7. Diamondbacks (for B. Loux)
 8. Indians (69-93)
 9. Cubs (75-87)
10. Padres (for Karsten Whitson)
11. Astros (76-86)
12. Brewers (77-85)
13. Mets (79-83)
14. Marlins (80-82)
15. Brewers (for Dylan Covey)
16. Dodgers (80-82)
17. Angels (80-82)
18. Athletics (81-81)
19. Red Sox (from DET for Martinez)
20. Rockies (83-79)
21. Blue Jays (85-77)
22. Cardinals (86-76)
23. Nationals (from CWS for Dunn)
24. Rays (from BOS for Crawford)
25. Padres (90-72)
26. Red Sox (from TEX for Beltre)
27. Reds (91-71)
28. Braves (91-71)
29. Giants (92-70)
30. Twins (94-68)
31. Rays (from NYY for Soriano)
32. Rays (96-66)
33. Rangers (from PHI for Lee)
Supplemental First Round:
34. Nationals (Dunn)
35. Blue Jays (Downs)
36. Red Sox (Martinez)
37. Rangers (Lee)
38. Rays (Crawford)
39. Phillies (Werth)
40. Red Sox (Beltre)
41. Rays (Soriano)
42. Rays (Balfour)
43. Diamondbacks (LaRoche)
44. Mets (Feliciano)
45. Rockies (Dotel)
46. Blue Jays (Buck)
47. White Sox (Putz)
48. Padres (Garland)
49. Giants (Uribe)
50. Twins (Hudson)
51. Yankees (Vazquez)
52. Rays (Benoit)
53. Blue Jays (Olivo)
54. Padres (Torrealba)
55. Twins (Crain)
56. Rays (Choate)
57. Blue Jays (Gregg)
58. Padres (Correia)
59. Rays (Hawpe)
| F/X Visualizations | April 30, 2010 |
The Network Structure of Baseball Blogs: Part 1
Earlier in the week I read about the network structure of twitter employees' accounts and that got me thinking about the network structure of baseball blogs. Network theory (or graph theory) looks at the structure of objects connected by pairwise connections. It has been used to study the structure of the internet, email networks, the phone and power grids, epidemiological networks, food webs and tons of other things. In this case you can think of baseball blogs as vertices and then connect them with edges if they link one another, then graph out all the connected blogs and see whether there is any structure.
I used the data from BallHype to generate the web. I looked at their top 200 baseball blogs and then went back to each blog's last 100 posts and saw which of the other 200 blogs linked to that post. These are links from posts to posts not general links from a blog to another blog. Here are all the blogs with at least one connection to the main component, with an edge draw whenever one blog links another.
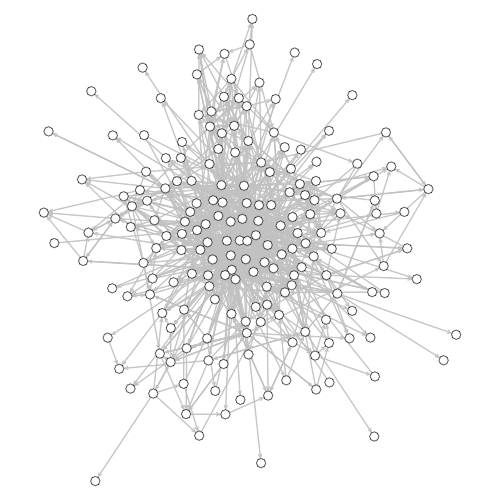
To make the image a little more simple and only show the stronger connections I re-drew this graph with edges only when one blog linked another one three or more times. I dropped out blogs which were not connected to the main component using this new edge definition. Each link is directed with an arrow going from the linking blog to the linked blog.
The algorithm tries to draw the vertices in positions such that they are close to blogs that linked them and which they linked. So you can sort of see clusters of blogs which should be similar (linked to and from similar blogs). Here I have labeled the top 15 blogs (a cutoff that conveniently includes Baseball Analysts -- BA).
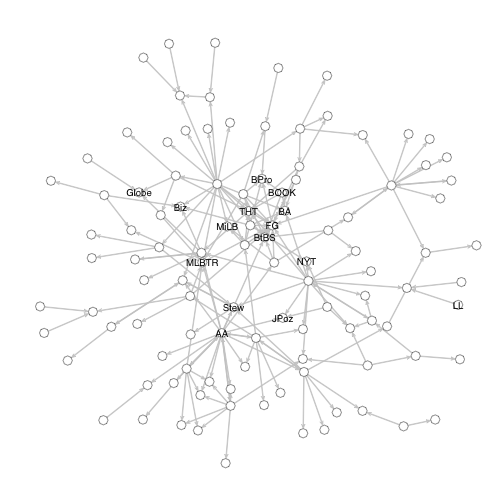
Here you can see BA cluster out with the well-connected center of the network particularly close to its sabermetric brethren: the Hardball Times, Baseball Prospectus, The Book Blog, FanGraphs and Beyond the Box Score.
Next I wanted to see how strongly blogs following the same teams clustered out together in the network. I should say that the vertices are not all of the blogs, because of the cutoff I am only showing blogs which connect to this strongly connected component (remember my definition for an edge is three or more links). The Reds Sox, Cubs, Cardinals and Angles all have lots of blogs in the top 200 but most of these fell away, presumably because they either did not link enough or did not have a enough links in (I am not saying anything about the quality of these blogs based on that). Some other teams with a lot fewer blogs had more stay in the network.
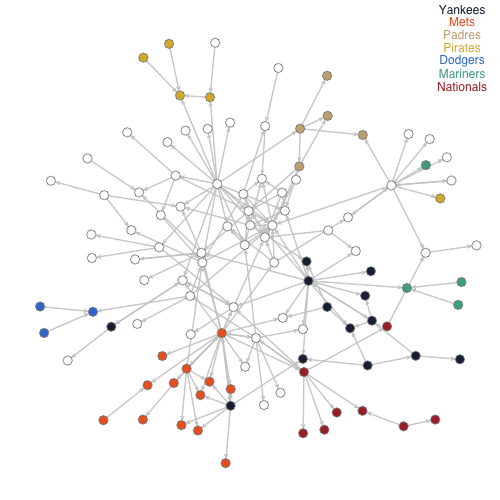
The Yankees and Mets are well represented with many blogs that are well connected, and a couple connections between the two. There are a handful of blogs which cover both Mets and Yankees, such as Mike Silva's Blog and the New York Time's Bats Blog, and I just randomly assigned those to either the Yankees or Mets. Having one blog that links to lots of other team blogs really keeps lots in the network which would other wise drop out. Fack Youk is the Yankee blog with may links going out. Amazing Avenue, the main hub of the Mets network, has many connections going out and coming in.
Then you have some surprising teams. Who knew there were so many Nats blogs? You can see this is largely driven by one, Federal Baseball, which regularly links a number of other Nats blogs. On the other hand the Pirates section is driven by one blog, PBC blog, which receives links in from a number of other blogs. There is an interesting blog in there, Call to the Pen, which links to Padres, Mariners and Pirates blogs, as well as many others.
I am not trying to make a value statement that having blogs in this network is a better than not (e.g., I am not saying that the Nationals blog community is any better or worse than the Red Sox blog community). I am just showing the network based on my arbitrary way of defining a connection.
This is a first pass at the data and next week I will dig a little deeper into the network structure. How connected is the network? What is the average distance between two random blogs? Do any teams cluster out together?
| Change-Up | April 29, 2010 |
Geovany Soto's Ridiculous Start to 2010
It's April 29, the Cubs are 10-12, and they sit 2.5 games back of the Philadelphia Phillies and San Francisco Giants for the National League Wild Card. They're 4.5 games back of the hot-starting St. Louis Cardinals in their own division. It's been a mixed bag thus far for the Cubs, with slow starts by key players and bullpen woes mitigated in part by surprisingly strong performances from players they did not expect as much from. On the whole, despite coming off of a home series loss to the Washington Nationals, I think the Cubs should feel encouraged by how the season has played out to date. When your biggest problems are Derrek Lee and Aramis Ramirez, there's hope.
No player has contributed more to the Cubs winning efforts thus far in 2010 than Geovany Soto, as heartening a sign as any for Cubs fans. After a banner 2008, he fell off badly last season. Since he only had two years of full-time service to his name, it was hard to tell which Soto to expect. Well the 27-year old catcher has started the year at a .362/.516/.511 clip and while I don't think a .516 on-base represents the player Soto really is, his torrid start would seem to suggest that he is very much capable of another 2008.
How Soto has managed this start has been a case study in the virtuous cycle that is a solid approach at the plate. Let's dig into Fangraphs' plate discipline stats for Soto. We'll look at his 2010 numbers versus an averaged figure for 2008 and 2009.
Here's a quick rundown of the definitions of each of the stats listed:
* O-Swing%: The percentage of pitches a batter swings at outside the strike zone.
* Z-Swing%: The percentage of pitches a batter swings at inside the strike zone.
* Swing%: The overall percentage of pitches a batter swings at.
* Zone%: The overall percentage of pitches a batter sees inside the strike zone.
* SwStr%: The overall percentage of swinging strikes
          O-Swing%  Z-Swing%  Swing%  Zone%  SwStr%
'08-'09:   18.6     64.7      41.9    50.2    9.7
2010:      12.1     52.9      28.9    41.1    5.8
Here's what we learn from this: Soto is swinging at way fewer pitches outside of the strike zone, swinging at fewer pitches inside the strike zone, swinging less overall, seeing far fewer pitches inside the strike zone and incurring far fewer swinging strikes. What's more interesting is the inter-related nature of these numbers.
If you swing at fewer pitches outside of the strike zone (balls), you can be more selective within the strike zone while up in the count. If you aren't swinging at balls or difficult-to-hit strikes, you will walk more frequently and make better contact when you do swing. In Soto's case, this is revealed in his ridiculous 36.8 line drive percentage and unsustainable .417 batting average on balls in play (BABIP).
Basically, he's been perfect at home plate this season. In full counts, Soto has hit .333/.684/.333, compared to the 2009 NL average of .235/.475/.380. Unbelievably, he's posted a .500 on-base percentage in 18 plate appearances after the count ran to 1-2. Again, the 2009 NL average on-base percentage after the count was 1-2 in was .234. Basically, while most hitters more or less freak out and ditch selectivity altogether while down in the count, Soto has been unfazed.
This is all very unlikely to keep up, of course, but it's hard to imagine some of Soto's new approach won't stick. He seems to be coming to the plate with a real plan this year, and that's to swing less. The result is that he's hitting more, better than any other catcher in baseball this April.
| Touching Bases | April 28, 2010 |
Some Research on BABIP Using PITCHf/x Data
The advent of PITCHf/x has created a contingent of DIPS apostates. Dave Allen has done a substantial amount of research on how to evaluate the quality of a pitch in terms of run value, and I'd like to use similar methods while focusing solely on BABIP.
First, heat maps for plate location, a topic which Dave has already researched. You can click on the image to enlarge it, but the gist is that pitchers who can jam batters or force them to put low-and-outside pitches in play will achieve low BABIPs, while pitches extending from down-and-in to up-and-away yield high BABIPs.
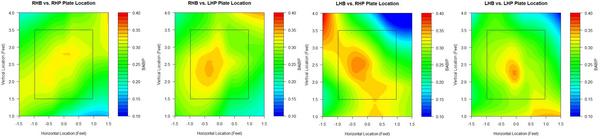
However, few pitchers actually have significant control over both the location of the pitch and whether or not the batter puts it in play. It turns out that the range of expected BABIP for pitchers based on the location of pitches put in play is 25 points, except for one outlier. The average BABIP in RHB vs. LHP matchups is around .310, and the maximum expected BABIP for such situations was .325. The second-lowest was Scott Feldman at .300, whose actual BABIP against lefties these last couple of years was .265. I think Feldman's cutter has successfully jammed lefties, and if you look at the RHB vs. LHP heat map, you can see a thick blue area up at the hands where lefties manage a BABIP of about .100.
Mariano Rivera's expected BABIP against LHBs based on pitch location came out to .270 compared to an actual BABIP of .225. No other pitcher had an expected BABIP below .290. Dave has written extensively about Rivera's ability to control his BABIP by commanding his pitches. I think Mo is unique in this regard. Maybe Greg Maddux in his prime was controlling BABIP by locating his pitches, but I think any pitcher who can consistently force batters to put well-located pitches into play is an exception.
Next, release points. You can see that those pitches thrown at extreme release points result in different BABIPs than pitches at traditional release points. Some of this is the nature of local regression not regressing, or "smoothing," enough for outliers, but nevertheless, I think sidearmers can legitimately control BABIP. The range in expected BABIP for pitchers when based on release points is three times as large as it is when based on pitch location.
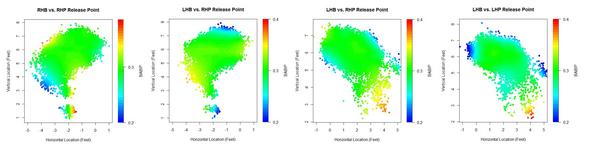
Darren O'Day, Peter Moylan, Joe Smith, Justin Masterson, J.P. Howell, Brian Shouse, and Trever Miller all throw at low arm angles and I think that is why they have been able to control BABIP against same-handed batters. Hideki Okajima and Trevor Hoffman, while not sidearm, also have unusual release points against same-handed batters that I think have contributed to deflated BABIPs.
Sidebar: Dave jinxed Brett Anderson with his fantastic post on FanGraphs about Anderson's release points varying by batter handedness. Even though Anderson has switched to a uniform release point regardless of the batter, he still has had one of the ten most extreme differences in horizontal release points depending on batter handedness. Alberto Castillo shifts 2.5 feet on the rubber, while Ben Sheets, Hoffman, Fu-Te Ni, and Francisco Liriano are the only other pitchers who move approximately a foot in the direction of the batter. At the other end, Jose Contreras, Darren O'Day, Felipe Paulino, and Manny Corpas shift about a foot the other way. Turns out there's no evident relationship between how much pitchers move on the rubber and their platoon splits. I suppose if there was a correlation, you'd see more guys doing it.
The effect of release points on BABIP might actually be the effect of pitch movement. I've yet to break BABIP down by pitch movement, but I did find the average BABIPs on pitch types.
| Pitch Type | RHP vs. RHB | RHP vs. LHB | LHP vs. RHB | LHP vs. LHB |
|---|---|---|---|---|
| CB | 0.289 | 0.299 | 0.302 | 0.307 |
| CH | 0.303 | 0.292 | 0.290 | 0.296 |
| F2 | 0.309 | 0.330 | 0.319 | 0.306 |
| F4 | 0.300 | 0.312 | 0.301 | 0.309 |
| FC | 0.275 | 0.295 | 0.305 | 0.298 |
| SF | 0.303 | 0.289 | 0.303 | 0.304 |
| SL | 0.286 | 0.309 | 0.308 | 0.276 |
| KN | 0.283 | 0.284 |
Part of the reason sinker/slider guys have large platoon splits is because those two pitches exhibit the largest BABIP platoon splits. Changeups and splitters show reverse platoon splits with regards to BABIP. The first group of pitchers found with the ability to maintain a sub-.300 BABIP was knuckleballers, and knuckleballs do indeed have the lowest BABIP of any pitch type.
| Designated Hitter | April 26, 2010 |
How to Score More Runs? Play the Best Hitters
In the past twenty years Major League Baseball has seen a pronounced increase in run scoring, a phenomenon often credited to the use of performance enhancing drugs. You may have heard about this. Teams scored 4 to 4.5 runs per game nearly every year from 1975 and 1992 but have exceeded those levels ever since, scaling 5 runs per game in 1999 and 2000. Although diluted pitching is mentioned on occasion, or smaller ballparks, or a smaller strike zone, this period is likely destined to be known as the “steroid era,” reflecting the popular consensus of the causes of the higher offensive levels. Those who believe that the use of PEDs has decreased in recent years point to the major leagues 4.61 runs per game last year, the second lowest total in the past 15 years. More skeptical people would point out that the offense is still at a higher level than it had been in the previous 40 years. Either way, run scoring is often seen as a proxy for the prevalence of PEDs.
Of course, there are other explanations for the run scoring, and the true cause is likely a combination of several factors which work together. To give just one example, the strike zone, especially about a decade ago, had shrunk to such a degree that a bulked up slugger could repeat the same powerful stroke on every swing. Whereas Henry Aaron's swing had to be flexible enough to handle a letter high fastball and a breaking ball at the knees, Mark McGwire’s swing did not. The reduced strike zone, I would argue, helped lead to the bulked up bodies and the various methods, good and bad, of attaining them. The causes work together.
One factor often overlooked in the increased offense is a very basic one: managers are choosing to play better hitters than they used to. As an illustration, I present the story of Don Buford.
Buford was a college football and baseball star at USC who did not begin his pro career until he was 23. He always had great on-base skills (walking over 90 times twice in the minors) and even a little power, despite his 5-feet-7, 160 pound frame. In 1963, at age 26, he led the International League in batting average, doubles, runs scored, and stolen bases and was named the minor player of the year by The Sporting News. The White Sox organization moved him to third base in 1962, and then moved him to second base for his rookie major league season of 1964. He never became a great infielder, but he was a fine offensive player right away. In 1965, he hit .283 with 67 walks and 37 extra base hits, standout numbers in the 1960s especially for a middle infielder. He was not a kid, 28 years old, but one of the better players in the American League.
In 1966 Eddie Stanky replaced Al Lopez as manager, took one look at Buford and decided he needed to steal more bases and bunt more. This sort of worked—Buford stole 51 bases, and led the league with 17 sacrifices—but he was a less valuable player. The 1967 White Sox contended until the final weekend despite hitting .225 and scoring just 3.28 runs per game, both totals next-to-last in the league. Buford was seen as epitomizing this team—chopping down on the ball to beat out hits, hitting behind the runner, stealing bases—and the club was seen as proof that you could win without any hitting. After the season the White Sox made a six player deal with the Orioles, sending Buford and two pitchers for Luis Aparicio, a good shortstop who would fit right into their offense.
With the Orioles Buford had no place to play, as the club had Brooks Robinson at third base and Dave Johnson at second base, and manager Hank Bauer used Buford as a reserve infielder. At the All-Star break he had started 22 games and played in 26 others, mainly at second, and was hitting .234. During the break, Bauer was fired and replaced by first base coach Earl Weaver.
Usually when a manager, especially a rookie manager, takes over at mid-season he just keeps doing what the other guy was doing. Why call attention to the fact that you thought your predecessor was wrong? Earl Weaver did not really think that way. Weaver had managed against Buford in the minor leagues, and believed that he was a better player than Bauer did. In his first game as manager, he played Buford in center field and hit him leadoff in the order. Buford walked and scored in the first, homered in the fifth, and the Orioles beat Washington 2-0. Buford led off every game the rest of the season, and responded by hitting .298 with 11 home runs and 45 walks in the final 82 games of the season. In 1968, these were star numbers. “Don Buford is the spark plug,” said Frank Robinson after the season, “the guy who always gets on base, who doesn’t scream or yell, but when you see him out there on a sack, you just have just got to bring him home.” Buford scored 45 runs in the second half of the season.
Buford led off for the Orioles the next three years, and helped ignite a league-leading offense for one of the greatest teams ever assembled. Buford did not become more valuable as a player by lifting weights or moving to a better park so much as he played for a manager who allowed him to be the player that he could be. Weaver did not want Buford to chop down on the ball and run like hell to first base. According to Buford, Weaver just wanted him to get on base and hit line drives.
This pattern is also seen in the career of Joe Morgan, a similar, though decidedly better, player. They were about the same size, both second basemen, though Buford was out of position there, and both had decidedly underrated on base skills. While Buford’s skills were misunderstood by Eddie Stanky, Morgan’s were misunderstood by Harry Walker. Morgan hit .260 every year with a bunch of steals, so Walker had him sacrifice and hit behind the runner. Morgan also had extra base power and walked 90 or 100 times a year, but middle infielders were not really judged that way in 1970. Morgan’s power was seen more as a source of trivia than part of the conversation when discussing his value.
Unlike Walker, and unlike most everyone else at the time, Morgan knew how a baseball offense worked and he did not mind telling people about it. When a reporter asked him about his stolen bases, he would say, “Stolen base totals don’t impress me unless the player has a high stolen base percentage.” He talked about getting on base even when no one was asking him about it. Walker did not care for Morgan’s outspoken confidence, an attitude Morgan believed was racially motivated. When he was leading the Astros in home runs in the middle of the 1971 seasons, Morgan said, “This team’s going nowhere if I lead the team in home runs.” When he did, in fact, lead the team in home runs and his team finished fourth, he reminded reporters of his earlier prediction, adding, “no matter what some people might tell you.” Harry Walker correctly interpreted this as a criticism of his baseball acumen, and Morgan was soon sent to the Reds in an eight-player deal that kicked the Big Red Machine into a new gear.
While Earl Weaver has received proper credit for his role in utilizing the talents of Don Buford, Sparky Anderson’s effect on Morgan has gotten less attention than it warrants. While some in the press were raving about the Astros acquisition of Lee May in the deal, it was Anderson who said of Morgan, “He gets on base an awful lot of times. His on base ratio is unbelievable.” Unlike Walker, who considered himself a teacher of hitting, Anderson told Morgan to get on base and crush the ball whenever he swung. The Reds already had two big egos in Pete Rose and Johnny Bench, and Anderson was perfectly comfortable adding a third. Anderson later called Morgan “the smartest man I ever coached.” Walker was threatened by Morgan’s obvious intelligence, while Anderson considered it an asset. Bench and Rose quickly saw what they had, and made it clear that chopping down on the ball would not be acceptable.
So what do we make of all this? In the past generation or so, there has been a growing appreciation for plate discipline, the willingness to see a lot of pitches and get on base. Teams are stressing this skill in the minor leagues, players are becoming more aware of the value of patience, and managers are utilizing on-base percentage in deciding who makes the team and who plays. Assuming this is a good thing, that managers are doing a better job of playing the right guys and directing the offense more effectively, than it stands to reason that this revolution should, in and of itself, be leading to more runs being scored.
Weaver was ahead of his time in his ability to put the right guys on the field, with Buford being perhaps the best example of this. Similarly, Sparky Anderson deserves credit for allowing Joe Morgan to be Joe Morgan. In today’s game, there is a much greater understanding of how runs are scored and how players should be developed to produce those runs. This appreciation has, every obviously, led to higher scoring games. Returning to pre-1993 offensive levels will take more changes than just removing performance enhancing drugs.
Mark Armour is a baseball writer living in Corvallis, Oregon, and the director of SABR’s Baseball Biography Project. His book Joe Cronin: A Life in Baseball was recently published (to good reviews) by the University of Nebraska Press. He and Dan Levitt are working on a sequel to their 2003 book Paths to Glory.
| Behind the Scoreboard | April 24, 2010 |
The Science of Playoffs
What is the point of having playoffs? I mean this not as a snarky rhetorical, but as a real question. Playoffs are a given in every major sport today, but it wasn't always that way. Before 1969, there were no playoffs in baseball, just one seven-game series between the winners of two completely separate leagues. Other sports were more quick to adopt playoffs. The NFL adopted playoffs in 1933 - a one game championship between the winners of the East and West divisions. The NBA had extensive playoffs almost from its inception, allowing 12 of its 17 teams to make the playoffs in 1950. The NHL was also an early adopter. The NBA scaled back its playoffs. Meanwhile, MLB has expanded its playoffs. With all of these different approaches to playoffs, who is right? To answer that, the point of the playoffs must be determined.
One way to look at it is that playoffs shouldn't be necessary at all unless there's a tie for first place. If the goal is to choose the best team and crown them as champion, then that would be the ideal approach. For instance, in 2009, the Yankees had a record that was six games better than any other AL team. Is there anything that could have happened in the playoffs to overturn the evidence that the Yankees were the best AL team in 2009? Not really. If we assume that teams remain static over the course of a season, the best way to evaluate a team's skill is to look at its overall record including the playoffs (schedule adjusted). Even had the Yankees been swept out of the first round, the evidence would point to the conclusion that New York had the best ballclub. So if it's a certainty that the Yankees were the best AL team, then what's the point of having any playoffs? Why not just send them straight to the World Series? That's one view, and a view baseball had until 1969.
But here's another view. The statement above is actually incorrect. It is not a certainty that the Yankees are the best team. It is a certainty that no matter what happens in the playoffs, that the Yankees are most likely the best team. But, because of variability we can't ever be certain who's the best, and sometimes we may not be very close to certain at all.
Consider a scenario in which, based on their records, one team has a 70% chance of being the "true" best team. Meanwhile, there's a 30% probability that a second team is the "true" best team. What do we do? One approach is to simply give the first team the championship. They are most likely the best team, and so they should be given the title. But the second team might be mad. "Hey, we deserve 30% of that championship!" Well, they don't give out parts of championships. But you could, in essence, give them 30% of a championship by giving them a 30% chance to win one whole championship. This could take place by having the commissioner pick a ball out of a lottery at the end of the season. The lottery machine would be filled with 70% of Team A's balls and 30% of Team B's balls. If your team's ball comes up, it is awarded the championship. They could do that. But it would a pretty awful way to end a season.
Championships should be decided on the field, not by ping pong balls. The solution to the uncertainty? Playoffs. Instead of drawing a lottery, you can simply set-up playoffs. And, if you structure the playoffs so that Team A has a 70% chance to win and Team B has a 30% chance to win, then you will have achieved the same effect. Except now the championship is decided on the field. These playoffs give each team a chance to win in proportion to the probability that it was the best team in the regular season. If your team, based on the regular season, has a 10% chance of being the "true" best team, then you will have a 10% chance of winning the playoffs and claiming the championship. Seems fair to me.
Of course, that's only if you set-up the playoffs just right. If you were to make the National League playoffs a 16-team NCAA-style single elimination knockout tournament, those two probabilities would not even be close to matching one another. The chance that a bad team could win would the tournament would be much higher than the probability that they were the best team during the regular season.
An Example
Let's take a simple example with just two teams. In 2008, the Cubs won 97 games, with a .602 WPCT. The Phillies won 92 games, with a .568 WPCT. If we regress these to the mean, which I won't go into here, you get the Cubs with a predicted "true" WPCT of .569 and the Phillies with a predicted "true" WPCT of .548. Each of these has a standard error of about .032. Hence, the probability that the Cubs are "truly" better than the Phillies is about 68%. So, in order to be "fair", a playoff series should be structured so that the Cubs have a 68% chance of winning. However, in a seven-game series with home field advantage to the Cubs, Chicago has only a 56% to win (this includes the fact that Cubs are likely better than the Phillies). But 56% is too low. Their five game lead is substantial, and should not be able to be so easily erased by a simple best of seven series. So how about we change things up? We still play a seven game series, but we spot the Cubs a 1-0 lead. Running the numbers again, now the Cubs have a 69% chance of winning the series. That's almost perfect! It gives the Cubs an advantage, but the Phillies still have a chance to win. And they can do it by winning just four out of six games.
The above set-up is the fairest one to determine the championship between the Phillies and Cubs. Of course, purists will say that the Cubs should be awarded the championship regardless. After all, if the Phillies win 4 out of 6 games, the Cubs will still have a better record than Philadelphia. Hence, the Cubs still are the team that's most likely the best "true" team in the league. Even though the above system is "fair", it still quite easily allows for the championship to be awarded to a team which is probably inferior. And that's part of the point. Likely inferior teams can win, but only if they do something extraordinary in the playoffs.
2009 AL Playoffs
Now let's take a larger example. In the 2009 AL, any baseball fan could tell you that there were three dominant teams: the Yankees, the Angels, and the Red Sox, with the Yankees likely being the best of the bunch. The probabilities I calculated of being the true best team back that up. The Yankees, with six more victories than any other team, have a probability over 50%, while the Red Sox and Angels are significantly lower. The probabilities for other teams are close to 0%. So did the AL playoffs match those probabilities well? Take a look at the chart below:
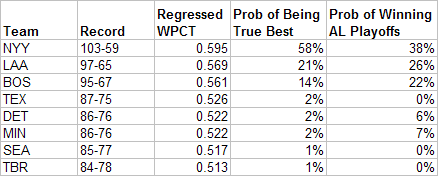
The Yankees were not amply rewarded for their regular season dominance, and their playoff probabilities were much too low. Additionally, the Twins and Tigers' probabilities were much too high. And as a final issue, the Red Sox also had too high of a probability. So how could the 2009 AL playoffs have been made fairer? First, by limiting the teams to just New York, Boston, and Los Angeles, you can set the Tigers and Twins probabilities down to zero. Then, since New York is far ahead and LA and Boston close together, it makes sense to have Boston and LA play each other in a five game series, with the winner playing the Yankees. What happens if we test that scenario, with LA and New York having the home field advantage? We get the following: probabilities:
Yankees: 58%
Angels: 23%
Red Sox: 19%
The Red Sox probability is a little higher than we'd like, but overall it's a pretty spot on match to the probabilities that each is the true best team in the league. Additionally, in their guts, I think most fans would agree that this would have been a fair playoff setup given the results of the regular season.
2009 NL Playoffs
Now I'll move to the NL and get a little wild. The NL was more evenly spread. The Dodgers had the best record, but several other teams were close behind. Additionally, there were several lagging contenders who, because of the overall parity, could potentially be the best true team in the league. The chart below shows the probabilities for the 2009 NL:
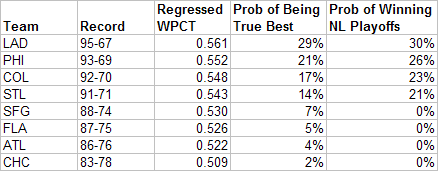
Overall, the probabilities are not way off like they were for the 2009 AL, however, there are still some inequities. The actual playoff probabilities are too high for each of the playoff team and they are too low for the teams that did not make the playoffs. Playing around with the numbers - here's the closest I could come to evening this out:
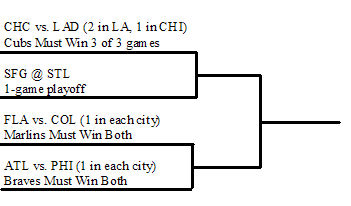
As you can see, the lowly Cubs do make the playoffs. But it will take a three-game sweep of the mighty Dodgers to advance. Additionally, teams such as Atlanta and Florida also have a shot, but will need to win two straight games against their superior foes to advance. The probabilities in this scenario match well with the probabilities of each team being the best true NL team. The results are below:
Dodgers: 28%
Phillies: 21%
Rockies: 19%
Cardinals: 13%
Giants: 9%
Marlins: 4%
Braves: 4%
Cubs: 1%
Conclusion
In this way, this playoff set-up is actually both more fair and often allows more teams to actually make the playoffs. Obviously, the drawback is that the playoffs aren't set in advance, with the additional drawback being that it's hard to match the probabilities exactly. So at least one team will end up getting the short end of the stick, and then they'll be mad. Additionally, really complicated playoff systems don't exactly have the best track record in major sports (see the BCS). Still I think a scenario like this is something that is inherently fairer in that it rewards teams in proportion to their accomplishments during the regular season - something that the current system famously does not do.
Ideally a system like this would work pretty well for a non-major sport that was a little more flexible on its scheduling and a little less rigid in its traditions. But, to be honest, it's likely impractical at any level. Still this method can be used to evaluate playoff structures and see where the holes are. In baseball, it's clearly that inferior teams have too large an edge in the playoffs. In other sports, depending on the structure, length of season, true talent distribution, the size of the home field advantage, etc, things may be different.
| F/X Visualizations | April 23, 2010 |
Looking at Some Games with My New Score Card
Before the season I talked about considering a new box score. I got a lot of great feedback and worked on a second version with a lot of input from Matt Lentzner. I probably created the wrong impression by initially calling the graph a box score, I was corrected that it would be better to consider it a score card. It functions better as such and does not raise the same kind of assumptions (seeing each player's numbers).
Anyway with a couple weeks in the books I wanted to see how the score card did with a handful of the more interesting games played. I should say that it took me a little bit of work to get the system completely automated and I still have some kinks to work out (the end of some innings look like double plays or triple plays when they shouldn't be), if you see any other problems please tell me in the comments so I can try and fix them. I kept the length of each image the same so I didn't push the margin of the page out too far, but this means that each image has a different scale. Click on it for a full sized version.
First off here is a wild game the Padres played on April 12th in which they scored ten runs in a single inning.
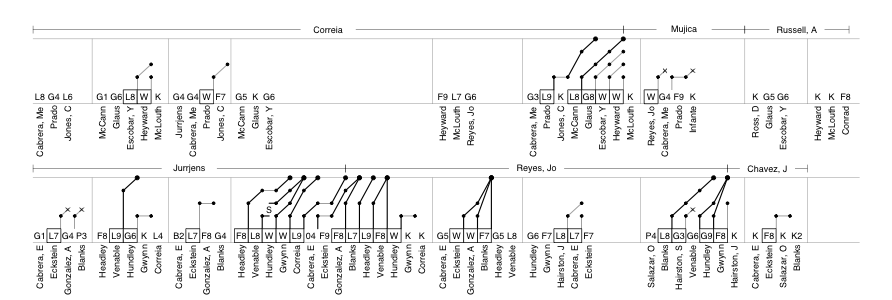
That inning included four straight singles followed, later, by three straight doubles and then a home run.
Next I wanted to check out was last Saturday's epic 20-inning match between the Mets and Cardinals.
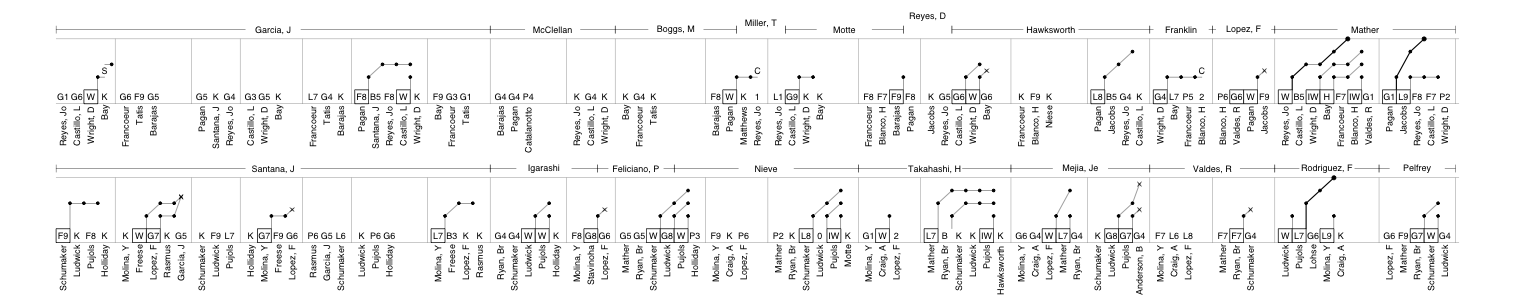
Here the scaling becomes a big issue. This 20-inning game stretches the score card out very far. Sean Forman suggested the I flip it so that the game progresses down rather than to the left. I like having it go to the left so you 'read' the game as you would a sentence (obviously reading to the left is just the way some people read). But websites scroll down way more than they scroll to the left so having the card progress down would be a more natural flow for web viewing.
Next here is Ubaldo Jimenez's no hitter.
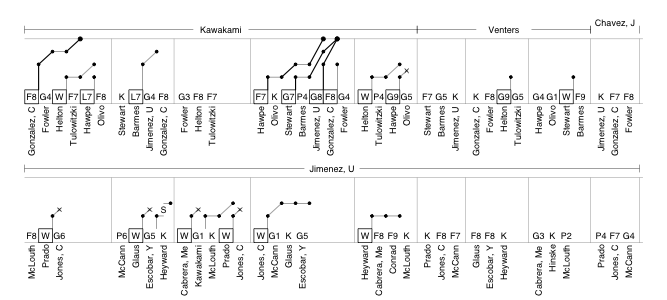
You can see Jimenez actually had quite a number of base runners early in the game. Through the first five innings he gave up six walks, but the last four innings were perfect. I also think there is a balk in there that my algorithm is not picking up.
Next I choose Tuesday's game in which Jonathan Sanchez and the Giants one-hit the Padres, but still lost.
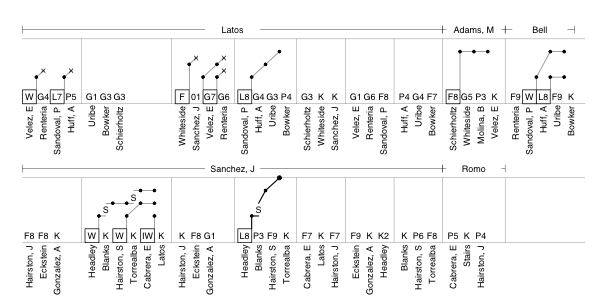
You can see how in the fourth the one hit off Sanchez, a Chase Headley line drive single to center, turned into the game's only run. With Kyle Blanks batting Headley stole 2nd and then advanced to third on Blanks's foul pop out to first. He then scored on Scott Hairston's fly out to right.
Finally here is yesterday's 20-0 rout of the Pirates by the Brewers.
Baseball games are wonderfully diverse and I enjoying thinking about ways of reporting and displaying that diversity. Over the season I want to make some more tweaks to this method, including trying out Sean's suggestion of flipping the orientation.
| Touching Bases | April 22, 2010 |
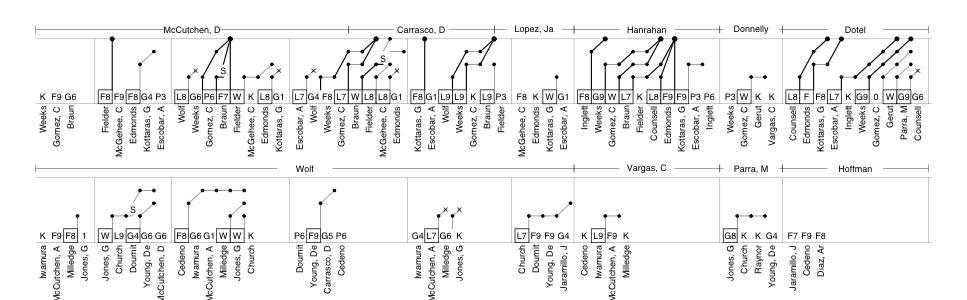
Clusters in the Outfield (Part 2)
Last week in this very space, I used cluster analysis to try to quantify a hitter's spray chart. Commenter "Nightfly" asked, "Are the sample sizes for switch-hitters large enough to run a comparison of, say, Victor Martinez against himself, from each side of the plate?" So instead of comparing hitters to each other as I did last time, I'm going to juxtapose players against themselves. I ran the numbers to see which switch-hitters had the biggest gap between cluster centers, grouping by handedness. It turns out, Carlos Beltran is a pull hitter from both sides of the plate, which forces outfielders to shade five yards in either direction depending on whether he's batting righty or lefty. And to answer your question, Nightfly, no, Victor Martinez cannot throw out baserunners.
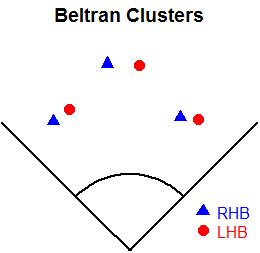
I changed the color scheme and symbols of the graph at the suggestions of commenters Studes and Alex, and as always, I'd appreciate any advice on how to improve the visuals provided.
That outfielders position themselves differently based on the batter's handedness is intuitive, but what other more subtle clues might improve outfielder positioning? Rich Lederer and commenter Fat Ted suggest I incorporate PITCHf/x data into my analysis.
For the upcoming analysis, I'm going to adhere to Peter Jensen's advice that I only look at balls that were caught by outfielders which improves the accuracy of the data but limits the sample.
First, I looked at how batted ball location fluctuates based on pitch type. It turns out that an outfielder only has to move several feet in general if he knows whether a fastball (two-seam, four-seam, cut) or an off-speed pitch (curve, slider, change, split, knuckle) is coming.
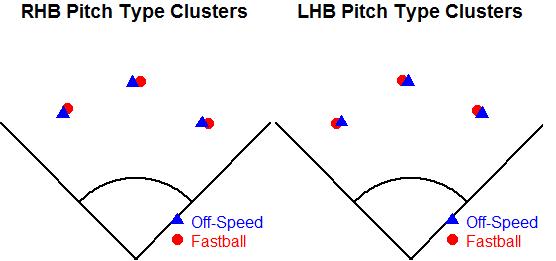
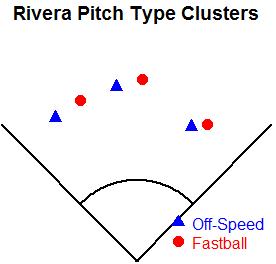
Juan Rivera, a right-handed batter, is one player who really gets around on off-speed pitches.
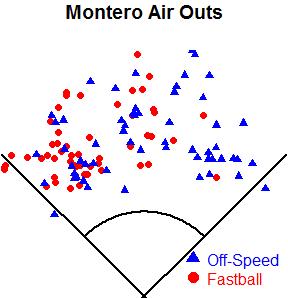
Meanwhile, Miguel Montero, a left-handed batter, nearly broke my clustering algorithm with his inability to pull fastballs. A visiting right fielder might fare just as well turning balls in play into outs by positioning himself in the Chase field pool when Montero is gearing up for a fastball.
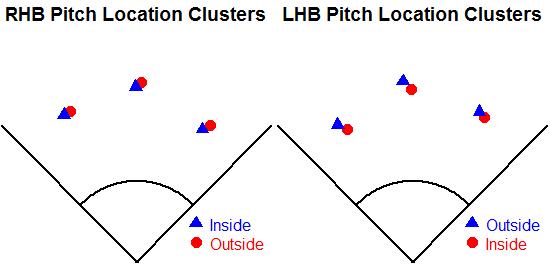
I also looked at patterns dealing with pitch location by splitting the plate into halves. In addition to the fact that batters tend to go the other way with outside pitches and pull inside pitches, Balls on the outer half are also driven slightly farther than balls inside
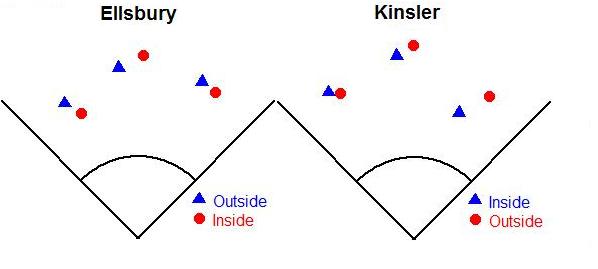
Some hitters, like Jacoby Ellsbury and Ian Kinsler, can't drive inside pitches the other way with authority, which I imagine would be useful information to outfielders.
| Change-Up | April 21, 2010 |
What's Wrong With the Red Sox?
Baseball's simplicity can be frustrating sometimes. Teams score runs by avoiding outs and efficiently advancing runners by mixing in power. Preventing runs means amassing outs without allowing too many base-runners or extra base hits. If you consistently score runs better than you prevent them, you win. AND THAT'S IT. As a Manager or General Manager, your job is to assemble personnel positioned to consistently score more runs than they allow. At the beginning of the season, it appeared that the Red Sox had such a team. 13 games into the 2010 season, it still appears the Red Sox have such a team.
So what about baseball's simplicity? Why is it frustrating? The 2010 Boston Red Sox serve as a great example in that as much as we want to stretch for an explanation for why they are off to such an awful start, the answer is much simpler than we'd like to think. It's because a bunch of really good baseball players are playing really poorly. That doesn't make for very good copy or talk radio, though.
Here's Nick Cafardo of The Boston Globe:
All one has to do is look at the team that demolished the Sox this Patriots Day weekend, the Rays, who went 11-16 to start last season and never recovered. In the AL East, you just can’t be 4-9 after 13 games, 6 games behind the Rays and 5 1/2 in back of the Yankees, and think it’s going to be easy to come back.That’s why it wasn’t too early to be concerned about David Ortiz after only two games of the season. It wasn’t too early to question whether Mike Cameron was a suitable replacement for Jason Bay. It wasn’t too early to wonder whether Victor Martinez could be the full-time catcher and still maintain his hitting.
Cafardo even floats the prospect of Jon Lester being sent to the Minors to fix his problems. Here's Michael Silverman of the Boston Herald, gleefully stomping on the Red Sox' grave 13 games in.
Everything is going wrong right now.And that means everyone was right.
By everyone, that means if you were worried that the “run prevention” philosophy was a bunch of bunk, the 4-9 Red Sox and their 10 errors and their nowhere-near-as-advertised defense have proved your point.
If you were worried that the offense was looking thin, the 4-9 Red Sox, now 0-for-their-last-32 with runners in scoring position, have proved your point.
If you were worried that David Ortiz [stats] was going to get off to a poor start, the 4-9 Red Sox and their designated hitter with the two RBI, .289 slugging percentage and .158 average have proved your point.
If you were worried about catchers Victor Martinez and Jason Varitek [stats] not being able to throw out base-stealers, the 4-9 Red Sox and the 22 stolen bases they have allowed - while throwing out just one runner - have proved your point.
If you were worried about the Yankees or the Rays, the 4-9 Red Sox, who are now a combined 1-6 against the twin towers of the AL East, have proved your point.
Here you have two attempts to diagnose structural problems with the way the Red Sox approached this past off-season. And what is the evidence that Boston faltered in putting together this roster? Why it's their first 13 games of course. If only the Red Sox had retained Jason Bay instead of Mike Cameron, then everything would be better (don't tell Cafardo and Silverman that Bay is off to a .245/.351/.327 start with the Mets).
Boston won 95 games last year, lost Bay, added a top-20 pitcher in John Lackey, an upgraded shortstop in Marco Scutaro and two veteran top-notch defenders in Mike Cameron and Adrian Beltre. You could argue whether or not those moves amounted to an improved team or not, but even if you come down on the side that they did not improve, nobody thought they would play .300 baseball and hit, pitch and field like some of the very worst teams in baseball. The team's composition is not the issue. They're just playing terribly. Just consider the following:
At the outset of the season, if you knew that even two or three of those 12 bullets would unfold, you would have known the Red Sox would struggle to start the year. It's the combination, THAT EVERYTHING IS GOING WRONG, that has made it so disastrous. I listed those bullets out to evidence that the Red Sox are simply playing really badly, and that their first 13 games are not an indictment on how this roster was constructed.
None of this to say that their start might not portend some problems. Martinez has looked disastrous behind home plate, his ineptitude tossing runners out turning Red Sox games into veritable track meets for opposing teams. Age could be a factor too, as Cameron (37) is already out for an extended period of time while players like Ortiz (34), Drew (34), Scutaro (34) and Beltre (31) all struggle. Finally, injuries of any sort can threaten a team's hopes. Ellsbury missed his 8th straight game last night and who knows how Daisuke Matsuzaka will hold up? All of these are legitimate concerns, albeit ones that applied to last year's roster too. They couldn't throw out anyone on the base paths in 2009 either, still had an oldish team and battled injuries all season long. Again, back to my point. It's hard to fault structural problems with the way this roster was assembled for Boston's slow start.
In the midst of a 4-10 stretch in 2004, Globe scribe Tony Massarotti, then at the Herald, thought he knew what was wrong with the Red Sox. He titled his article "Moneyball is going bankrupt" and wrote at length about how the Red Sox had a philosophical problem. They didn't understand what it took to play winning baseball consistently. Just like Michael Silverman thinks that "run prevention" is a bad thing as it relates to the 2010 Red Sox, Mazz disliked how Boston eschewed small ball, a style of play he favored.
In the meantime, while the Red Sox just stand around and wait, the Yankees try to create. New York stole three more bases last night, bringing its series total to seven, and had attempted nine steals in the series; the Red Sox have attempted none. New York has a sacrifice bunt; the Red Sox have none. The Yankees have struck out six times; the Red Sox have struck out 19.But the Red Sox have four home runs and the Yankees have one, so at least the slugging percentage and OPS will be up to snuff.
The victories? They come by chance in this system. They come on the nights where the Red Sox get good pitching and hit a few homers, and they actually manage to catch the ball. They come on the nights where everything lines up perfectly, and we all know that those occasions in life come along all too infrequently.
These are the sorts of things that sportswriters come up with, accountability free, when things are going badly. Boston was playing its worst baseball of the year when Mazz wrote that piece. As far as Mazz was concerned, it was not because they were simply playing like crap, but because they were not bunting enough. At best, it's terrible analysis. At its worst it's rabble-rousing. Whatever the case, things would "line up perfectly" enough for the Red Sox to win 98 games and their first World Series since 1918 in 2004.
In 2008, the Yankees won 87 games and finished in 3rd place in the AL East. Robinson Cano and Derek Jeter struggled, Hideki Matsui was not himself and Melky Cabrera was a disaster. Andy Pettitte did not perform like he typically would. It was no indictment necessarily of the roster but rather a team that exemplified the greatest truth when it comes to sports front office management: that projecting human performance, inherently, is subject to all sorts of pitfalls.
Maybe the Red Sox will bounce back, maybe they won't. As I see it, the most likely scenario is that they start to play like they can but this hole proves too much to overcome. I would say the next likeliest outcome is that the Red Sox are firing on all cylinders at some point when the Rays or Yanks falter over a two-week stretch, allowing Boston to climb back into the race. Finally, and this really is entirely possible, maybe this year too many guys have off years. If that's the case, the Red Sox might not win 80 games. And you know why that will be? Simple, of course: because a bunch of good players will have failed to play well.
| Past Times | April 20, 2010 |
The 1959 White Sox Set a Record - in 2008
How can any team - even a pennant winner like the 1959 Chicago White Sox - set a very impressive record nearly a half century after going to the World Series? Is there a statistic that hasn't been calculated in this numbers-obsessed era? Although the "Go-Go Sox" were known for solid pitching, airtight defense and team speed, this record was set by manager Al Lopez and his coaching staff.
Lopez (born August 20, 1908) owned the record for most career games by a catcher (1918) until Carlton Fisk surpassed that mark in 1987. Known for his defensive skills, Lopez played for the Brooklyn Dodgers, Boston Braves/Bees, Pirates and Indians. He was an National League All-Star in 1934 and 1941.
Lopez was also the only manager to beat out the Yankees for the American League pennant from 1949 to 1964, achieving that feat with the 1954 Cleveland Indians as well as the '59 White Sox. By living until October 20, 2005 - or 97 years and 71 days - the Hall of Famer set the example for his four-man coaching staff.
Pitching coach Ray Berres (born August 31, 1907) actually beat Lopez in longevity. The Wisconsin native passed away on February 1, 2007 at the age of 99 years and 154 days. Although he is forgotten today, Berres - a weak-hitting backup catcher from 1934 to 1945 - is one of the premier pitching coaches in baseball history. He spent 18 seasons with the White Sox, and Berres survived six managerial changes during that time because of his skill in working with the staff.
Don Gutteridge (born June 19, 1912) began his major league career with the Cardinals in 1936. He played third and second base for the Redbirds until going to the St. Louis Browns in 1943. As the team's second baseman and leadoff hitter, Gutteridge was a part of the 1944 Browns, the only pennant winner in the franchise's nearly unbroken 52-year run of futility.
Gutteridge was the first base coach and worked with the infielders for the south siders as the team won its first pennant in 40 years. He also served as the White Sox manager in 1969 and 1970 after Lopez retired, and Gutteridge spent more than a decade scouting for the Dodgers after his career in uniform ended. The Pittsburg, Kansas native died in his home town.on September 7, 2008 at the age of 96 years and 80 days.
Third base coach Tony Cuccinello (born November 8, 1907) displayed better than average power and run production for a 5'7" infielder during his big league career.
After making his big league debut as a third baseman with the Reds in 1930, Cuccinello came through with a career high 14 HR and 94 RBI for the Dodgers in 1934. Being moved to second base in 1931 wasn't a problem, as Cuccinello racked up 93 RBI with just two home runs. Career highs in doubles (39) and batting average (.315) undoubtedly helped in the run production department.
An N.L. All-Star in 1933 and 1938, Cuccinello was one of many players who extended their careers because of the World War II talent shortage. As a sore-legged 37-year old, he closed out his big league career in 1945 by hitting .308 in 402 ABs for the White Sox. Yankees second baseman Snuffy Stirnweiss edged out Cuccinello for the batting title by hitting .309 thanks to an error call that was changed to a hit during the last game of the season.
As a noted sign stealer who was at the center of a 1967 controversy over that age-old tactic, Cuccinello sometimes stood out from his low-key peers. After scouting for the Yankees well into his 70s, Cuccinello retired in Tampa and lived just down the street from his close friend Lopez. The long-time coach died at 87 years and 317 days on September 21, 1995.
Bench coach Johnny Cooney (born March 18, 1901) died young - at 85 years and 112 days on July 8, 1986 - when compared to the other members of the Sox brain trust. If you want a weird baseball career path and biography, Cooney's story would be all but impossible to duplicate.
One of the few big leaguers from Rhode Island, Cooney was signed as a left-handed pitcher by the Boston Braves. His best season came in 1925, when he went 14-14 for the 70-83 Braves. Cooney was eighth in the National League with a 3.48 ERA, and his ERA+ was 115. The southpaw gave up just 50 walks in 245.2 innings pitched for just 1.83 BB per nine innings pitched. That was fourth best in the NL.
Numerous bone chips and fragments - more than a dozen were removed, and the surgery permanently shortened Cooney's left arm - all but ended his mound career by 1930. What could a hurler with a bum wing do to make a living in the early days of the Great Depression?
A talented slap hitter - he hit .379 (25 for 66) with a lone double in 1923 and .320 (33 for 103) in 1925 - Cooney kept his baseball career alive by moving to the outfield. He turned out to be a skilled defender in center field and played in the American Association from 1930 to 1935. Casey Stengel became well acquianted with Cooney's skills while managing in Toledo. When the Old Perfesser was named manager of the Brooklyn Dodgers, Cooney returned to the majors at age 34 in 1935.
What made Cooney's transition from the mound to the outfield noteworthy is his rare combination of batting right-handed and throwing from the left side. Although Cooney could poke and slice singles like a dead ball era maestro, his power was nonexistent.
Cooney never took a home run trot in 1376 at-bats with the Dodgers and Boston Bees/Braves from 1936 to 1938 while hitting .282, .293 and .271. He struck out just 39 times during those three seasons, or once every 35.3 ABs, but a combined 68 walks in that span didn't help his on-base percentage..
When the former pitcher finally went yard, he didn't mess around. At age 38, Cooney hit the only home runs in his 3372 career big league ABs in consecutive games against the New York Giants at the Polo Grounds on September 24 and 25, 1939. Both bombs came in the third inning with a runner on base. It would be interesting to know if either or both of Cooney's homers barely cleared the 279-foot left field fence at the Polo Grounds.
Even with the end of the power drought, the best was yet to come for Cooney. His .318 average for the Bees in 1940 was third in the National League. After being the toughest strikeout in the league with just eight Ks in 368 ABs in 1939, Cooney nearly duplicated that feat by whiffing just nine times in 365 ABs in 1940. No other player has come remotely close to making his first appearance among either league's top 10 hitters at such an advanced age, and certainly not in the top three.
Turning 40 didn't slow the former pitcher at all in 1941. Cooney's .319 performance in 441 ABs was second to Pete Reiser. In an era where batting average was revered, it came as no surprise that Cooney won the Veteran Player of the Year award from The Sporting News.
The wheels fell off in 1942, as Cooney hit just .207 with seven RBI in 198 ABs. He hung on until 1944 as a wartime pinch-hitter with the Dodgers and Yankees. Cooney finished his long career with a 34-44 record and 3.72 ERA as a pitcher and a .286 (965 for 3372) average as an outfielder and occasional first baseman.
Are there any common denominators among the long-lived members of the 1959 White Sox coaching staff? Although Cuccinello could get animated at times, this was a group of men who were known for their calm personalities and lack of temper tantrums. No Billy Martins, Earl Weavers or high-maintenance divas in this bunch.
It's purely coincidential, but Lopez, Berres, Cooney and Gutteridge each had one child - all sons. Cuccinello's three children were the exception to the general trend. Both Berres and Cooney turned down managing opportunities because they didn't want the constant stress that came with the job.
Lopez, Berres, Gutteridge, Cuccinello and Cooney lived a total of 464 years and four days, which works out to just over 92.8 years per person. While the White Sox teams they ran were notorious for a lack of power and slugging, no one can top this five-man group in average lifespan and sheer longevity.
| Baseball Beat | April 18, 2010 |
Breaking News: Andy Pettitte Is Better Than Bert Blyleven
A member of the Baseball Writers Association of America who has written extensively on why he has never voted for Bert Blyleven for the Hall of Fame now believes Andy Pettitte is going to Cooperstown.
That's right, long-time Blyleven dissenter Jon Heyman appears to have endorsed Pettitte's candidacy for the HoF in a Twitter post over the weekend.
i think pettitte's going to cooperstown for his great 1) consistency, 2) durability, 3) octobers, 4) explanation.
Speaking of "consistency," while Heyman is entitled to his opinion on both Blyleven and Pettitte, it would be nice if he could be consistent in his evaluation of these two pitchers. You see, three months ago, Heyman wrote the following (emphasis mine):
I look at numbers, too, and while my numbers may be slightly more simplistic than WHIP, WAR or VORP, I think they tell a story of a pitcher who was extremely good, consistent and durable but not quite Cooperstown-worthy. Blyleven was dominant in a lot of at-bats (thus, the 3,701 strikeouts) and even a lot of games (60 shutouts). But he was never dominant for a decade, a half decade or even a full season.
"...extremely good, consistent and durable but not quite Cooperstown-worthy."
Heyman admits in his own words that Blyleven has two of the four things he loves about Pettitte.
OK, so we know that Blyleven has the "consistency" and "durability" down. What's missing? Ahh... "octobers" and "explanation" (whatever the heck that is).
Let's take a look at those Octobers. Blyleven pitched in an era before the Division Series so let's focus on League Championship Series and World Series. He was 5-1 with a 2.47 ERA, 1.08 WHIP, and 4.50 K/BB ratio covering five different series, eight games, and 47.1 innings pitched. Pettitte is 12-6 with a 3.99 ERA, 1.37 WHIP, and 2.15 K/BB ratio covering 16 different series, 26 games, and 162.1 innings. I know that WHIP thing may be a bit difficult to calculate (hits plus walks divided by innings), but it looks to me like Blyleven gets the vote for quality and Pettitte for quantity.
Alrighty, then the big difference between these two pitchers must come down to Heyman's fourth building block: explanation. Explanation? What the heck is explanation? Seriously. Jon, please explain. You can devote an entire guest column right here at Baseball Analysts to explain what "explanation" means and/or why Pettitte deserves to be enshrined and Blyleven does not. Have at it.
In the meantime, here is a quick and dirty summary of Pettitte's and Blyleven's regular season career:
               ERA+       IP
Pettitte       116       2946
Blyleven       118       4970
Blyleven edges Pettitte in ERA+ while pitching two thousand more innings! That's right, Pettitte would have to pitch about ten more years at a slightly better clip to equal Blyleven's career. Did I mention that Pettitte will be 38 years old in June?
But, hey(man), "it's called the Hall of Fame, not the Hall of Numbers." Silly me, I was led to believe that great numbers led to fame but, then again, Eddie Gaedel didn't have have great numbers (although a 1.000 OBP isn't bad) but is certainly famous. Maybe Heyman can take up the "Eddie Gaedel for Hall of Fame" cause. If that's stretching things too far (or if you want to argue that Gaedel is infamous rather than famous), how about Johnny Vander Meer? Don Larsen? Roger Maris? Maury Wills? Fernando Valenzuela? Joe Carter? I'm sure there are many, many other famous players who should be considered for the Hall in Heyman's mind.
Speaking of which, did Heyman vote for Mark McGwire? I mean, he's pretty famous, no? Well, Heyman put McGwire on his "Disqualified List."
Disqualified List (own personal list*)25. Mark McGwire. Admitted andro use made him into a home run hero before moving into pariah territory. Projected percentage: 28 percent.
That's right, McGwire is disqualified for taking steroids (and admitting to taking them) while taking steroids and admitting to such just may be Pettitte's key to Cooperstown.
Yes, consistency. Heyman's arguments aren't very consistent but, boy, they are sure durable. It must be nice.
| F/X Visualizations | April 16, 2010 |
How Nasty Was that Pitch?
Every year Sportvision and MLBAM fine tune and make additions to their already excellent pitchf/x system. This year is no different. Mike Fast covered this year's changes over at the Hardball Times, and I wanted to expand on a couple points. Some of the changes involve tweaks to the classification algorithm. It looks to me like the algorithm is classifying more two-seam fastballs (also called sinkers) and doing a pretty good job of it. They have also added some pitch types. Mike noted the knuckle curve, and they also added a Eephus pitch (thrown by Vicente Padilla) and the screwball (thrown by Daniel Ray Herrera).
Another addition is the 'nasty' metric that MLBAM has attached to every pitch. I wanted to check out what makes a pitch nasty in the eyes of MLBAM. As Mike noted the nasty metric does not seem to be related to the speed or movement of a pitch, but the big determinate, it looks to me and Mike, is pitch location at least for fastballs.
Here is a smoothed average of the nasty-ness of four-seam fastballs by location for RHBs versus RHPs.
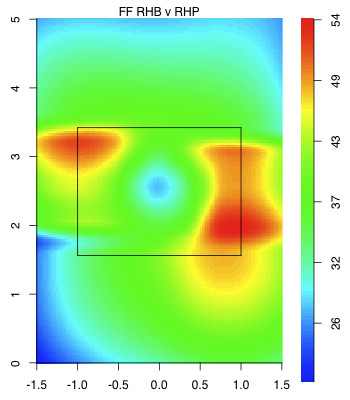
Here is LHBs versus RHPs (the other two are here and here).
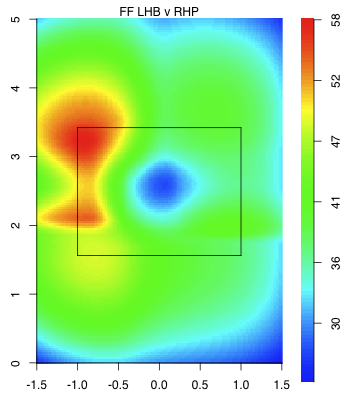
It looks like nasty score varies widely by pitch location, with those pitches far out of the zone or down the middle of the plate having the lowest score and those around the edges of the zone the best. Particularly pitches down-and-away, up-and-in and to a less extent those up-and-away have a very high nasty score. These values match up very well with the run values by pitch location that I showed about a year ago. So it looks to me like the nastiness of a pitch is a measure of how hard the pitch is to hit based on its location, with nasty pitches in a hard to hit location and a non-nasty pitches either in the fat of the plate or a clear ball.
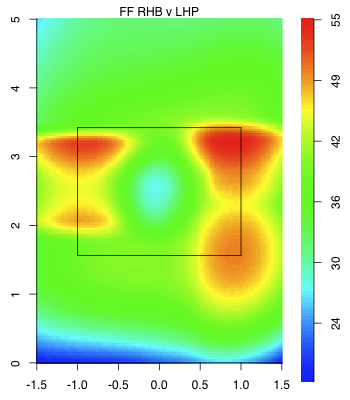
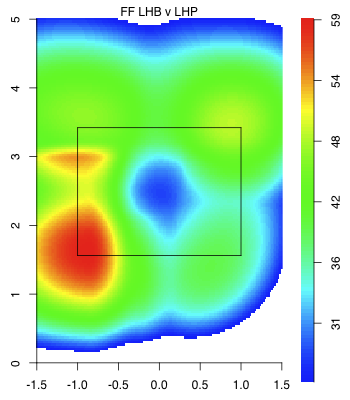
The results are similar for other pitch types. Here for the slider:
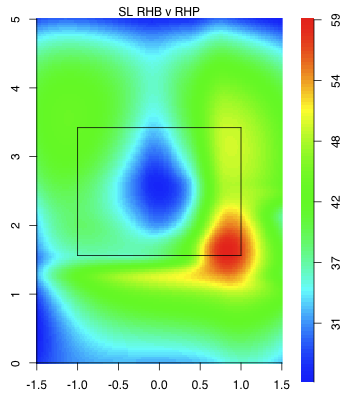
And here for the changeup:
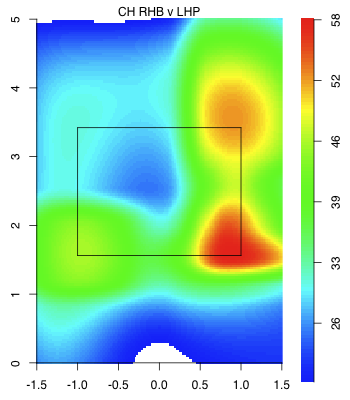
Overall I think this is a nice addition to the pitchf/x values for the casual Gameday watcher. The speed of a pitch is something that is easily understood and even the movement, although less than the speed, can be put in context (that fastball had a lot of 'rise). The nasty value helps to put the location in context, "that pitch was in a hard to hit location."
| Touching Bases | April 15, 2010 |
Clusters in the Outfield
"I waved in my outfielders. When they got in around me, I said, 'Sit down there on the grass right behind me. I'm pitching this last guy without an outfield.'" -- Satchel
Outfielder positioning has been a hot topic over at The Book Blog recently. Max Marchi has done some great research on the topic of defense positioning.
Using MLBAM data, which reports the location of where the ball was fielded, as well as Peter Jensen's Gameday translations, I queried the hit locations of balls in the air that left the infield but stayed in the ballpark. I restricted my sample to only hitters who had at least 100 balls in the air from one side of the plate through 2008-2009. I then ran a k-means algorithm that split the spray chart into three different clusters. I wouldn't say that the centers of each cluster indicate where a fielder might be positioned, since a lot more than just getting to balls goes into positioning, but one might put it that they indicate the middle of a fielder's area of responsibility. I think of it as a tidy way to quantify someone's spray chart.
For example, Joe Mauer hits the ball in the air the other way a lot. The left-fielder is responsible for three times as many fly balls off Mauer's bat as the right fielder. Conversely, Carlos Pena pulls a fair share of his fly balls. Assigning each ball to a fielder yields the following chart:
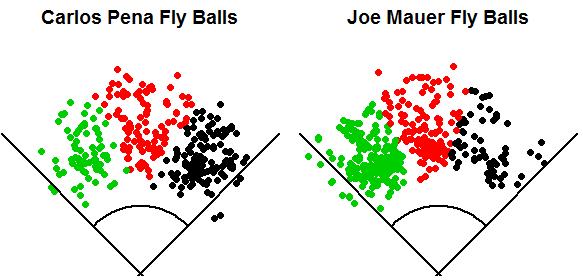
Logically, a fielder would get to the most balls the fastest by standing in the middle of his zone. Again, that often doesn't align with the actual job of the fielder, which is to prevent runs. Averaging the clusters produces the following centers:
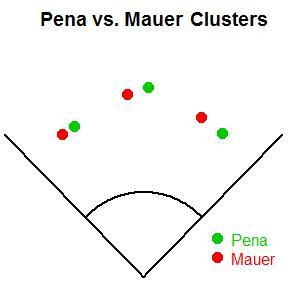
So the difference in the average hit locations between a great pull hitter and a great opposite-field hitter comes out to around 30 feet.
The most interesting and informative chart is probably the one that splits batters by handedness.
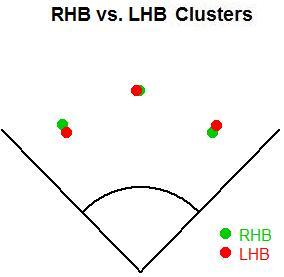
On average, corner outfielders have to move 15-20 feet depending on the handedness of the batter. This is the result of pulled balls traveling farther than opposite-field balls. The center fielder only moves five feet in general. Grouping by pitcher handedness didn't produce any visibly different results.
Now, I'll look at some of the most extreme differences in cluster centers. While Pena and Mauer have an extreme difference in the rate of balls they put in play to each field, their clusters were in close proximity as compared to Scott Podsednik and Ray Durham, whose centers were 50-100 feet apart.
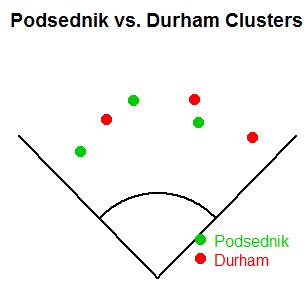
As for right-handed batters, Derek Jeter is the only player who hits a higher rate of balls in the air to the opposite field than Joe Mauer. Jeter leaves the right fielder responsible for over half of his fly balls, and he forces the right fielder to play closer to the line than any other right-handed batter. I'll compare him to Jesus Flores.
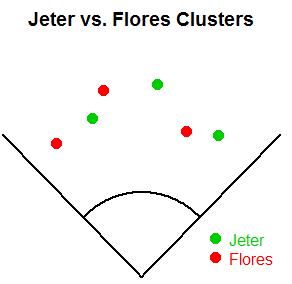
All of the previous charts have dealt with fly ball angle, but fly ball distance is just as important in outfield positioning. The first pair I noticed was Cody Ross and Gregor Blanco
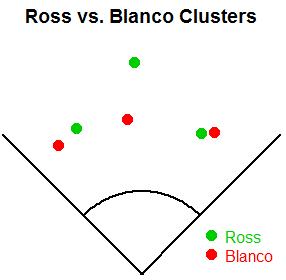
Here, we see some of the unreliability in either the GameDay location data or the pixels-to-feet. Cody Ross has power, and power to center, but something is off. He doesn't routinely hit 400-foot flies that stay in the ballpark. Oh, well.
Looking at pull power to left, there's a more realistic difference between Chris Iannetta and Ryan Roberts.
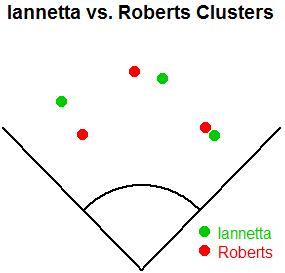
And the obvious choice for the final coupling is Luis Gonzalez and Paul Bako.
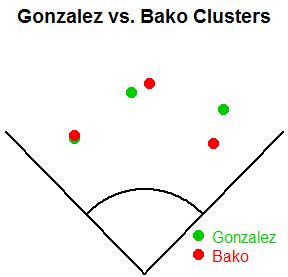
The only player for whom my clustering algorithm spat out something funky was Clete Thomas. His spray chart is unusual in that he appears to have decent power to left-center, but not so much to right-center, which creates a distinct region in left-center where no fielder would ever play, and leaves a neighboring vacancy where the center fielder is traditionally positioned.
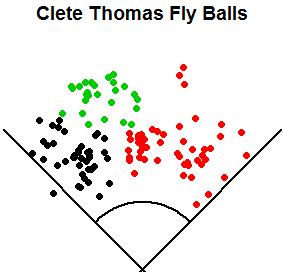
| Behind the Scoreboard | April 13, 2010 |
Structural Unfairness In Baseball's Divisions
A couple of weeks ago, I had planned on penning an article for SI.com on MLB's wild-haired proposal to reshuffle the divisions in order to make them more equitable. My thesis was to be that there was little reason to do so. Teams ebb and flow and the shuffling is unnecessary. The record of AL East teams against the other divisions is barely over .500 since 1996, so the AL East isn't that much of a powerhouse anyway. To boot, when looking at 90-win teams that missed the playoffs, the AL East housed fewer of these teams than either of the other two AL divisions. I'm glad I didn't write that article, because I'd have been wrong. Here, I'll show why.
Let it be known, I still think the proposal is a hare-brained scheme. Swapping strong AL East teams with weaker ones would be tantamount to just handing the flag to Boston and New York. Additionally it wouldn't be fair to those "weak" AL teams - after all, maybe they'd surprise people and make a run. Plus the whole thing just seems jury-rigged and unseemly. Still, there is a real question of what structural advantages and disadvantages are built into the current system.
The Effect of Market Size on Winning
Certainly some teams figure to be better than others long-term. Market forces are a very real phenomenon, and the fact is that big-markets and owners with deep pockets can have a strong effect on a team's performance. How those big-market teams are distributed among the divisions can have a strong impact on the game.
As a first step, I ranked all 30 teams based upon "market size", and when I mean market size, I mean not only the size of the market, but also things like ownership's willing to spend money, etc. This was somewhat subjective, however I think my ordering was reasonable. I then assigned each team a market "value" according to the normal distribution, so teams like the Dodgers and Yankees got the highest scores, and teams like the Rays and Pirates got the lowest. I then did a regression to predict WPCT (data pulled from 1995-2009) from this market size variable. As expected, the two were significantly correlated. The predicted WPCT for the biggest team (the Yankees), was .558. That translates to about 90 wins, which I think is a pretty good over-under for a future undetermined future Yankees team. The market size advantage drops off quickly after that. The Red Sox have an average WPCT of .537, translating to 87 wins. Meanwhile, most teams are clustered close to .500. As you can see, market size matters but doesn't hand a team anything. Overall, the WPCT's predicted from market size had a standard deviation of .027.
True Talent
Now, the standard deviation of team WPCT as a whole since 1996 has been .072. The factors adding up to this .072 SD can be described in the following equation:
Total Variance = (Between Franchise Variance Due to Market Size) + (Within Franchise Variance Due to Other Factors) + (Team Variance Due to Luck)
The "Other Factors" translates to teams' ebb and flow of talent - sometimes the same franchise will produce a good team, and sometimes it will produce a bad team. Since we know all of the other variables except this one, we can easily solve for it and we get the following values:
Total SD = .072
Market Size SD = .027
Within Team SD = .054
Luck SD = .039
And it all adds up: (.072)^2 = (.027)^2 + (.054)^2 + (.039)^2
Knowing all of the factors that go into a team's performance, I set up a simulation to estimate the probabilities of each team making the playoffs. The simulation was set up to play a balanced schedule against each of the other teams in the league, plus a handful of "interleague" games against a .500 opponent (I didn't have time to program in the unbalanced schedule unfortunately, although I think this is a relatively small issue). So, how much structural disparity is there in baseball? Are teams like the Rays really at a huge disadvantage due to playing in the AL East?
Long Term Playoff Probabilities
The following chart shows what happens in the simulation:
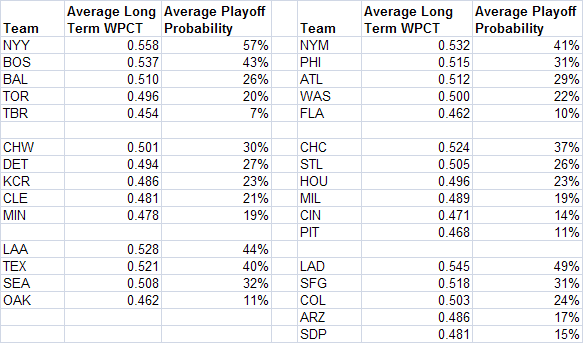
Indeed, the Rays are at the biggest disadvantage of any team in baseball. As one of baseball's smallest market teams, and in one of baseball's toughest divisions, they have just a 7% chance to make the playoffs. To clarify, these percentages are for some theoretical year in the future, NOT taking into account the personnel currently on the club, the quality of the management, etc. The team with the biggest advantage is the Yankees, who have a 57% chance to make the playoffs in any given year. Of course, these numbers are quite dependent on the market size ratings I assigned teams earlier. And, my guesses aren't exactly the gold standard.
Additionally, it's not Bud Selig's fault if the Rays and Pirates are small market clubs. A large part of the reason for the small probability for teams like the Rays is due to their own small-market nature. That's useful to know, but the impetus of the piece was whether the divisions themselves were unfair to certain teams.
Playoff Probabilities Given an Average Team
To take the nature of the particular team out of it, I changed the team in question's long-term average WPCT to .500. For instance, if the Rays were not small market, and instead had an expected WPCT of .500, how often would they make the playoffs? And is that probability higher or lower than it would be in other divisions? Below is a chart showing the probability of making the playoffs, assuming that the target team has an average WPCT of .500.
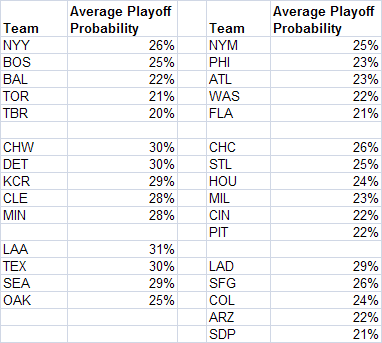
As it turns out, the Rays are still getting the shortest stick in baseball. Even assuming they have no market disadvantages (or advantages), they have just a 20% probability of making the playoffs in a given year. How does this compare to other teams? The most favorable structural advantage goes to the Los Angeles Angels. Assuming no market advantages, their probability of making the playoffs is 31%. That means that just due to their competition, the Angels will make the playoffs three times for every two times that Tampa makes the playoffs. Not surprisingly, besting the Yankees, Red Sox, Orioles, and Blue Jays is tougher than beating the Rangers, Mariners, and A's. For one, it's easier to beat three other teams than four. And for another, the Red Sox and Yankees are usually tougher to beat than any of the other AL West teams. Those are observations any fan could make, but the effect on the probability of winning is quantified here.
The rest of the AL West is also substantially easier than the AL East. Oakland has a 25% chance of making the playoffs, while the Mariners and Rangers push 30%.
Additionally, the AL Central is a great place to call home. Again, assuming no market advantages or disadvantages for the target team, each team has a 28%-30% chance of making the playoffs. Again, this is a far cry from the Rays' 20%.
How about the Yankees themselves? Again, making their average ability equal to .500, they figure to make the playoffs 26% of the time. These odds are higher than that of the Rays (because they don't have to face a powerhouse Yankee team), but still lower than any AL Central team or most of the AL West. The AL East is tough even for the big dogs.
Now let's move over to the National League. The first thing to notice is that it's generally tougher to win in the NL than the AL. This makes sense because there are more teams to beat in the NL, but the same number of playoff spots. Many of the teams approach the Rays' probability of winning. In the NL East, the Marlins have a 21% chance of making the playoffs, in the NL Central the Pirates have a 22% chance of winning, and in the NL West, the Padres have a 21% chance of winning. However, there is not quite as much disparity among the larger market clubs. Of the large market players, the Cubs have just a 26% chance to make the playoffs, while the Mets have a 25% chance, and the Dodgers have a 29% chance. This is in contrast to the AL, where a number of teams have probabilities approaching 30%. A summary of the average probability of making the playoffs in each division is below.
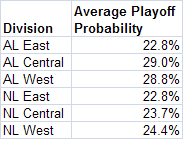
Conclusion
So what's the conclusion? Yes, some teams face significantly higher hurdles than others. It's not just the Rays that face the problem, but many other National League clubs as well. Paradoxically, because they don't have to play themselves, the large market teams face an easier schedule than their small market counterparts. Situations like these create the imbalances we see here.
The AL East is indeed a tough division, but it's actually about the same toughness as the NL East. It's actually the AL Central and the AL West that are the outliers, in that they are easier divisions than the rest of baseball. If MLB is keen on evening that up, one potential solution is to move Toronto to the AL Central and the Twins to the AL West. That would make the AL East a four-team division and hence easier to win, would toughen the AL Central by adding the Blue Jays instead of the Twins, and would toughen the AL West by adding a fifth team. The NL's division imbalance is solved nicely by having the smaller market teams populate the NL Central. The fact that it has six teams counteracts the fact that the teams are likely to be of a little lower quality, and hence the NL Central is about as easy to win as the West or East.
Is the model perfect? No, because it's difficult to estimate each team's average long-term WPCT. Still, the underlying conclusions, especially regarding which divisions are easiest or hardest, should hold. The teams from the AL East have a legitimate beef, especially the Rays. However, compared to other AL divisions, the National League is also getting a raw deal. These types of inequities are part of the game, but they should be minimized if possible. With these numbers, it hopefully be more clear on how large these inequities really are. Whether baseball will do something about it remains to be seen.
| Baseball Beat | April 12, 2010 |
My 2010 Fantasy Baseball Team
I thought I would share my fantasy baseball team with readers once again. As I noted last year, "our league is one of the longest, continuous fantasy pools in the country. The Lakewood Players League, as it is known, has been in existence, in one form or fashion, for over 30 years."
The LPL is a 16-team, non-keeper league. We draft new teams each year. We do not allow trades or waiver wire pickups. Instead, we allow owners to select 28 players and offer three replacement drafts at each of the quarter poles in the season.
It's a family affair with my brother serving as commissioner and an original team owner, my son and nephew co-owning a franchise, and a cousin and another cousin's husband also sharing a team. A few of the other 12 owners are friends dating back to junior and senior high school in the dark ages of the 1960s and 1970s.
While our fantasy pool is guilty of including a few team-dependent stats, we have made a few rule changes over the years to minimize stolen bases and saves. Unlike most fantasy/rotisserie pools, stolen bases are not one of four or five offensive categories. Instead, we take net stolen bases (defined as SB - 2*CS), multiply that by .5 and add it to walks plus hit by pitches. In other words, we treat (net) stolen bases as "extra" bases, if you will. As a result, you won't find Jacoby Ellsbury and Carl Crawford being drafted in the first round of our pool. We have also reduced the value of closers by making saves worth half as much as the other pitching categories (IP, ERA, WHIP, and K minus BB).
I had the good fortune of winning our fantasy pool last year for the seventh time since 1989. I have finished third or better in all but one year since 2001. I am hopeful that I can repeat like I did in 1989 and 1990 or put together a three-peat a la 1995-1997. But the competition is tough with the team to beat owning three of my players from last year (Albert Pujols, Matt Holliday, and Tommy Hanson) plus Adam Lind and Brian McCann at the turn in the fourth and fifth rounds.
Here are my draft picks:
1. Ryan Braun: Drafting in the fifth spot, I was pleased to get Braun as I had him ranked as my No. 1 outfielder and No. 3 overall hitter. In less than three full seasons, the 26-year-old slugger has averaged 40 doubles, 7 triples, and 39 home runs (along with 113 runs and 121 RBI) per 162 games. Knock off 10% for minor injuries and rest and it seems reasonable to expect Braun to hit over .300 with at least 35 doubles and 35 home runs and a minimum of 100 runs and 110 RBI. Those stats will work just fine for me.
2. Justin Upton: My decision came down to Upton or Matt Holliday. I went with Upton based on his age and upside. I have him hitting .300 with 30 HR and 90-100 runs and RBI this year. Whether those projected numbers turn out to be better than what Holliday puts up remains to be seen.
3. Ricky Nolasco: I love Nolasco. I had him last year, too. His 5.06 ERA last year masked a 3.35 FIP and his 4.43 K/BB ratio was the fifth-best in baseball. An ace in the making, he commands his 91-92 mph fastball and uses his tight slider and 12-to-6 curve as swing and miss pitches. Is as good a bet as anyone not named Tim Lincecum or Roy Halladay to win the NL Cy Young Award.
4. Joey Votto: He was my seventh-ranked first baseman. The Big 5 were all gone after the first 18 selections and Adrian Gonzalez was taken with the 29th pick. In addition, Mark Reynolds (eligible at 3B and 1B), Kevin Youkilis (also 3B/1B), Justin Morneau, Kendry Morales, Adam Dunn (OF/1B), and Pablo Sandoval (3B/1B) were off the board as well, making Votto an easy choice for me with the 60th overall pick.
5. Gordon Beckham: I liked Beckham here because, as a 2B/3B, he gave me the flexibility to go in either direction later in the draft. Pro rating his rookie stats over 150 games yields 41 2B, 20 HR, 84 R, 92 RBI, and 60 BB. I can live with those numbers at either position.
6. Manny Ramirez: Going into the draft, I had no designs on taking Manny. However, I was amazed that he was still available this late in the draft. Ramirez was the No. 12 pick in 2009 and No. 92 in 2010. That's called value. I mean, is Manny not going to hit .290 with at least 25 HR and 90 RBI, even if he only plays 130-140 games?
7. Jose Reyes: This pick was similar to my previous one in that Reyes was our pool's fourth overall pick last year and 101st this year. Sure, he missed over 100 games in 2009 with a hamstring injury and sat out most of the spring but the latter was due to a a hyperactive thyroid, which seems rather minor to this non-medical expert. Now in his eighth season, Reyes doesn't turn 27 until June.
8. Ryan Dempster: After putting together the nucleus of one of the best offenses in our league, I needed to add a couple starters with my eighth- and ninth-round picks. Dempster was not only the best pitcher on the board but also the most reliable in my judgment. He was 6-4 with a 3.15 ERA and a 4:1 K/BB ratio in 14 GS after returning from the disabled list with a broken toe in late July.
9. Jonathan Sanchez: Everyone knows that Sanchez threw a no-hitter last year, but did you realize that he was 6-4 with a 3.46 ERA and a MLB-best 10.5 K/9 the rest of the way? Like most young pitchers, he needs to become more efficient with his pitch count in order to work deeper into games. The stuff is there. Here's hoping for 180 innings with an improved walk rate.
10. Chipper Jones: Less than a week into the season and I'm already second guessing myself for this pick. But, injury risk or no, has his star fallen so far that he goes from a third rounder to a tenth rounder from one year to the next? Remember, walks are a full category in our league. Chipper had 101 free passes last year and walked more often than he struck out (89). The projection systems have him hitting at least .285 with 20 HR and producing 70-plus R and RBI. No way I can get those numbers at a non-1B or OF position this late in the draft.
11. Colby Rasmus: Now this is a guy I wanted to get. I'm quite sure I had him ranked higher than any of my competitors. A former No. 1 draft pick, top five overall prospect by Baseball America in 2008 and 2009, coming off a fantastic spring (.362/.500/.707 with 5 HR and 16 BB/18 SO), and batting fifth behind Albert Pujols and Matt Holliday gave me confidence to step up on this 23-year-old center fielder. If I'm wrong on Rasmus, it will be due to the fact that he fails to solve LHP (.160/.219/.255 in 115 career plate appearances).
12. Stephen Strasburg: I believe Strasburg is more valuable in fantasy drafts than generally perceived. You park the kid for two months, activate him when he is called up to the majors, and bank his stats for the final four months when he figures to be a top-20 pitcher in any league that counts strikeouts. I'm prepared for the fact that the Nationals will certainly limit his starts, pitch counts, and innings, which means he could be shut down by early- to mid-September. That's fine. I can plug in one of my other starting pitchers in April, May, and late September. But I'll take the best pitching prospect in decades during June, July, August, and early September.
13. Carl Pavano: Not a popular choice among many fellow participants, I took Pavano because his control is valuable in our league as we double count walks via WHIP and SO minus BB. He is an injury risk for sure, but one that I can manage around if necessary.
14. Matt Thornton: While others were paying up for closers, I sat back and drafted the reliever with the fifth-highest SO-BB total last year. The lefty whiffed 29.3% and walked 7.0% of the batters faced. He is basically a "here it is" type, pumping 95-96 mph fastballs 90 percent of the time. The combination of his velocity and location make him virtually unhittable. A good get in my mind.
15. Mat Latos: Great arm plus big ballpark means the potential is there for the youngster to shut down opponents at home this year. Only 22, Latos will be handled carefully by Bud Black and the Padres. He pitched a combined total of 123 innings in the minors and majors in 2009 and will likely be limited to about 150 IP in 2010. I plan on using Latos selectively.
16. Fausto Carmona: Who knows what I'm getting with this pick? Is Carmona the pitcher who placed fourth in the AL Cy Young Award balloting in 2007 or the wild man who posted a 13-19 record with a 5.89 ERA while allowing more walks than strikeouts in 2008 and 2009? His first start last week (6 IP, 1 H, 3 R, 6 BB, 1 SO) suggests he may be a bit of both. If the 26-year-old righthander can throw bowling balls for strikes like he did three years ago, then this pick just may be the steal of the draft.
17. Chris Perez: I was hopeful that Perez would seize the opportunity to serve as Cleveland's closer in Kerry Wood's absence and keep the job all year long. Well, the early returns are mixed. I loved his first two games and loathed his third.
18. Gio Gonzalez: This pick is all about upside. I moved Gonzalez up on my draft board when he was named the A's 5th SP as I was keenly aware of his stuff and witnessed him striking out 10 Angels without allowing a walk in his final start in 2009. Gio drew the Halos in his first assignment on Friday and was 92-93 with one of the biggest yakkers this side of Erik Bedard. He could be Jonathan Sanchez nine rounds cheaper.
19. John Baker: By far, my worst position player. I was going to take Matt Wieters but my son nabbed him in the sixth round four picks in front of me. I clearly preferred Manny, Reyes, Dempster, et al to the remaining catchers so I resigned myself to taking somebody like Baker. I'm not happy about it but am hopeful that he can reproduce his 2009 season and give me a .270 AVG with 25 2B, 10 HR, and 50-60 R and RBI.
20. David Freese: His time may have finally arrived this season. Freese hit well in the minors (.308/.384/.532) and held his own this spring (.293/.372/.453) with surprisingly decent BB (10) and SO (15) totals. The projection systems have him hitting .265-.280 with 12-15 HR. Not bad for a backup third baseman.
21. Matt LaPorta: Although LaPorta has started five out of six games at first base, he may end up in left field once Russell Branyan (herniated disc) returns from the DL. However, it's a crowded situation with three lefthanded hitters (Branyan, Michael Brantley, and Travis Hafner) competing with LaPorta at 1B, LF, and DH, which could reduce him to a platoon player if he doesn't get off to a good start.
22. Luke Gregerson: The San Diego Padres setup man had the seventh-highest SO-BB total among relievers in 2009. He possesses a wicked slider and could become the team's closer if Heath Bell is traded this summer.
23. Cameron Maybin: My fifth outfielder. While the just-turned 23-year-old center fielder is playing in his fourth MLB season, he has yet to accumulate 200 plate appearances in a single year. He can run like the wind and is a star in the making. Hitting in the two hole between Chris Coghlan and Hanley Ramirez won't hurt his numbers.
24. Mike Aviles: It was slim pickings at this point and I still needed a backup SS, 2B, and C. This selection could come back to haunt me as the Royals optioned him to Triple-A Omaha over the weekend to free up a roster spot for Gil Meche. Coming off Tommy John surgery, Aviles won me over with an outstanding rookie season in 2008 (.325/.354/.480) and a huge spring (.471/.517/.725 with 6 BB and 2 SO). Unfortunately, I don't decide who gets to play in Kansas City.
25. Blake DeWitt: He won the second base job in the spring and should put up respectable numbers two years after hitting .264 with 9 HR in just over 400 plate appearances as a 22-year-old rookie. Good sign: DeWitt has walked five times while striking out only once in his first five games.
26. Miguel Olivo: Did you know that Joe Mauer (28) was the only catcher who slugged more home runs than Olivo (23) last year? Olivo ranked 8th in RBI (65) and 13th in R (51). Hey, he's Bengie Molina with a few more strikeouts.
27. Pedro Alvarez: With a 28-man roster, I have the ability to sit on Alvarez while awaiting his likely recall around Memorial Day.
28. Dan Hudson: The White Sox optioned Hudson to Triple-A Charlotte prior to the season. The 23-year-old righthander, who went a combined 14-5 with a 2.32 ERA at four levels in the minors, was named MLB.com's 2009 Minor League Starting Pitcher of the Year. He was brought up to the majors in September and pitched six games, posting a 1-1 record with a 3.38 ERA. Hudson should get another shot this year if Freddy Garcia gets hurt or implodes.
Although I like my team, I'm not looking too swift after the first week. I'm in 13th place, lagging in troubles (doubles plus triples), runs, RBI, and innings pitched. The poor showing in the offensive categories is a function of Jones and Reyes missing a combined seven games while the lack of innings is due to not having any starting pitchers going twice last week. I should be able to make up these innings this week as Nolasco, Dempster, Pavano, and Carmona are each scheduled to start twice.
If nothing else, it should be a fun season.
| Baseball Beat | April 10, 2010 |
Get 'Em While You Can
If Pedro Alvarez and Carlos Santana are still available in your fantasy baseball pool, you might not want to wait much longer to pull the trigger on them. Facing each other, the two highly touted prospects homered in their minor-league debuts and both have already jacked three home runs in only two games.
From CBS Sportsline:
News: Pirates 3B prospect Pedro Alvarez is wasting little time making a huge impact for Triple-A Indianapolis of the International Leauge. In just his second game on Friday, Alvarez hit two homers and drove in five runs. He has already gone deep three times and driven in seven runs. He is also hitting .333.
Meanwhile, Pittsburgh's third baseman Andy LaRoche is 1-for-13 with no extra-base hits and four strikeouts. Manager John Russell has placed LaRoche in a tough spot by batting him seventh, one spot in front of the pitcher. He walked three times on Wednesday and has already seen 76 pitches in 17 plate appearances. LaRoche's 4.47 P/PA is tied for 12th in the National League.
Look for Alvarez, the second overall pick in the 2008 draft, to be playing in Pittsburgh no later than June 1 when teams are basically free to call up players and retain them for an additional three years before these so-called "Super Two" prospects become eligible for arbitration. It's possible, however, that Alvarez could force himself on the Pirates sooner if he continues to rake and LaRoche doesn't greatly improve upon his .227/.314/.348 career line.
News: Carlos Santana went 4 for 5 with two home runs and four RBI as the Columbus Clippers (Triple-A) smashed the Indianapolis Indians, 17-4, Thursday night.
Santana performed his magic on his 24th birthday. After two games, he is 6-for-10 with three HR and two doubles. He was the MVP of the Eastern League (Double-A) in 2009 and California League (High-A) in 2008. The only catcher standing between the switch-hitting Santana and the majors is Lou Marson (0-for-8 with 0 BB and 2 SO). A former third baseman, Santana has the arm to work behind the plate. However, he still needs to enhance his receiving and game-calling skills and is unlikely to be rushed to the big leagues despite a bat that could hit in the middle of the Cleveland order right now.
Lastly, for anybody who has been living on Mars, Stephen Strasburg will make his professional debut on Sunday. The No. 1 draft choice in 2010 will start for the Harrisburg Senators, the Washington Nationals' Double-A affiliate. He will face the Altoona Curve (Pittsburgh Pirates). The game will be streamed online via ESPN3 and broadcast on MiLB Gameday Audio at 2 p.m. ET. (Aroldis Chapman will begin his professional career at the same time as Strasburg, starting for Cincinnati's Triple-A Louisville Bats against Detroit's Toledo Mud Hens. This game will also be available via ESPN3.)
Strasburg, who pitched nine innings and allowed two runs while striking out 12 batters and walking one this spring, is expected to throw 85-90 pitches. According to Washington Post writer Dave Sheinin, money will trump talent and performance in determining when Strasburg gets called up by the Nats.
"Beyond just the baseball factors -- even the greatest prospects can benefit from some time in the minors -- the Nationals have a strong financial incentive to hold off on Strasburg's big league debut until at least late May, in order to delay his reaching free agency and arbitration eligibility....All they would have to do is keep him in the minors for at least 20 days, which would prevent him from gaining enough service time to qualify for free agency at the end of his sixth season, thus retaining his rights through 2016, instead of 2015. This isn't being cheap. It's being smart. And every team does it."
I recommend reading the article in full as it is an excellent primer on arbitration and free agent eligibility, including the Super Two status I referred to above.
* * *
Update (4/11/10): Strasburg pitched five innings and allowed four hits, two walks, and four runs (one earned) while striking out eight batters. He was credited with the win as Harrisburg beat Altoona 6-4. Strasburg survived a wobbly opening inning, giving up a double, single, and walk after retiring the first two hitters. The righthander retired the side in order in the second and third innings, striking out the final two batters in both frames. He was a victim of poor fielding in the fourth when Altoona scored three unearned runs, then worked a 1-2-3 fifth to finish his assignment for the afternoon.
Overall, the fireballer threw 82 pitches with his fastball sitting at 97-99 through the first three innings and touching 100 a few times (according to the stadium gun as reported by the play-by-play announcer). His 83-mph hammer curve was generally effective and he flashed an 89/90-mph changeup with diving, tailing action that resembled a two-seam fastball. With three "plus to plus-plus" offerings, Strasburg's stuff is unrivaled in both the minors and majors. While money considerations will dictate the timing of Strasburg's MLB debut, his command will determine whether he is just the best pitcher on the Nationals or one of the best hurlers in the National League this year.
While I didn't watch Chapman, his pitching line (4.2-5-1-0-1-9) suggests that he dominated Toledo batters at times. According to an MLB.com article, the Cuban defector "fired 10 pitches that read 99 mph or faster and five that traveled at least 100 mph." Mud Hens outfielder Brennan Boesch struck out twice on 101- and 100-mph heaters.
Louisville manager Rick Sweet said, "No debut compares to that at this level. As soon as the radar gun hit 100, you could hear the buzz in the ballpark."
Toledo manager Larry Parrish, who spent 15 years in the majors, was impressed with the 6-foot-4, 185-pound southpaw's arm strength but noticed mechanical flaws in his delivery. "He wasn't J.R. Richard or Nolan Ryan out there. Today, he walked one. In the big leagues, he would've walked eight. Would you like to have him? Heck yeah, but he's just not a finished project yet."
Well, the kid is only 22 with one professional game under his belt. Give him some time. As Sweet opined, "He could probably pitch in the big leagues right now and have success. The timetable is nothing more than him getting his whole game together. He's got some things to work on other than pitching."
| F/X Visualizations | April 09, 2010 |
The First Five Days in Home Runs
With the first couple days of the season in the books I thought it would be cool to look at the superlative HRs of the season -- not as any real analysis, just for the fun of it. I have been playing around with ways to display HRs that show information about the pitch the HR was hit off of and the HR itself. My current version combines these pieces of information into a single graph with two different scales: a finer scale shows the location of the pitch in the strike zone (the box at the base of the image), this box in the x-z plane; and then the larger scale showing the approximate angle of the HR in play connected to the dot of the pitch, this now in the x-y plane. The superlatives HRs are marked in red. All data through last night.
Here are the HRs by RHBs off RHPs.
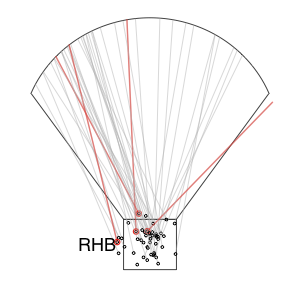
These include four of the superlatives I looked at. First off you have the farthest inside HR. It is easy to see in the image (right by the 'B' in RHB) and was 14 inches inside of the center of the plate. That was Delmon Young's HR off of a Fernando Rodney changeup yesterday. The highest HR is also easy to see. It was 3 feet 9 inches high, a four-seam fastball from Kevin Millwood hit by Evan Longoria on Tuesday. Below and slightly to the left of that was the HR off the fastest pitch. That was Yuniesky Betancourt's unlikely HR on Monday off of Justin Verlander's 98.6 MPH fastball. The last HR, to the right of the fastest, was the shortest HR, Miguel Cabrera's 342-foot shot off of Joakim Soria on Wednesday (distance by HitTracker).
Here are the HRs by RHBs off of LHPs.
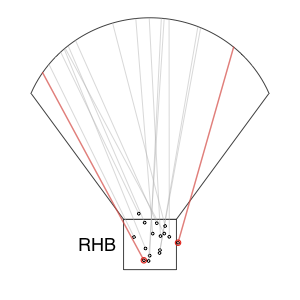
This includes two superlative HRs. The HR on the farthest outside pitch -- 12.75 inches off of the center of the plate -- was Mark DeRosa's HR off of a 86mph Tim Byrdak fastball on Monday. The other HR here was the HR off of the slowest pitch. That is Rajai Davis's HR on a 70mph Ryan Rowland-Smith curve.
Here are the HRs by LHBs off of RHPs
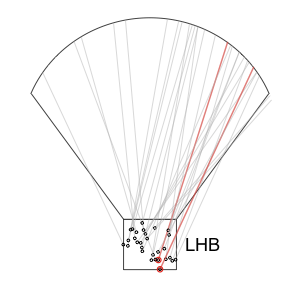
Here you have the HR off of the lowest pitch, Wednesday's Travis Ishikawa HR on a Jeff Fulchino change just 1.5 feet high. The other HR here is the farthest, Jason Heyward's Monday HR, the first of his career, a 476-foot blast off of Carlos Zambrano.
Finally, the HRs by LHBs off of LHPs.
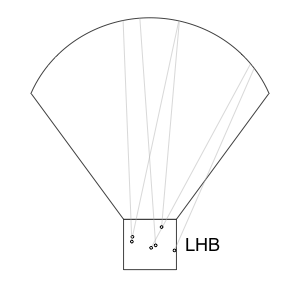
Here there were no superlative HRs based on the categories I looked at.
I guess I am guilty of 'digging the long ball' and finding ways of looking at them, but I hope forgive this prosaic impulse.
| Designated Hitter | April 07, 2010 |
What Opening Day Tells Us (or not)
I totally understand where it comes from, but there's nothing quite like the elation and consternation that surrounds every little thing that happens on baseball's Opening Day. Every individual event is a good sign or a bad sign (or both); guy A got three hits and is ready to take a big leap forward; guy B took an oh-fer and is on the way out. This much attention won't be paid to a game again until October.
Ultimately, of course, we all know that there are 161 more of these (or 2415 of them league-wide, minus a few rainouts), and what happened in this one doesn't mean any more (or less) than what happens in any of the others. But just for fun, I thought I'd use my indispensable Baseball Reference Play Index subscription to look at some big opening day successes and failures and at what those players did for the rest of the season, and see whether any patterns emerge.
Two Homers
Albert Pujols managed to hit two out on Monday, to no one's surprise, and so did Garrett Jones. Since 2000, 24 other guys have done it a total of 27 times (including another by Pujols) with Dmitri Young hitting three out in 2005. The list includes prodigious sluggers like Bonds, Pujols, Guerrero, and Juan Gonzalez; guys having uncharacteristic power years like Shannon Stewart (who hit two out on opening day 2000, a year in which his 21 HR eclipsed his second best by 62%) and Ivan Rodriguez (who went on to hit 27 in just 91 games in 2000); and others like Felipe Lopez (who hit just 7 more homers in all of 2009) and Corey Patterson (11 more in 82 more games in 2003). Oh, and Chris Shelton (who got just 408 more PA in 2006 and has had just 145 more in the majors since) and Tony Clark (who had just 74 more PA and 2 more HR left in his 2009 season, and very likely his career).
In those 27 seasons, the players have averaged 27 home runs per season, one homer every 19.7 plate appearances, 33 homers per 660 PA. Over those 24 players' entire careers, they've averaged a homer every 22.9 PA, or 29 every 660.
So you could look at it a few ways. On one hand, guys who hit 2 homers on opening day see their season-long homers increase by 13.8% over their career norms, which sounds like a lot. On the other hand, they've already hit two of those, so for the rest of the season -- assuming they're healthy and good enough to play the season out at all -- they've only got two "extra" homers left. Basically, it seems to me, the fairest thing would be to expect them to hit from games 2 to 162 the exact same number of HR that you had expected them to hit all season long. The two on opening day are a nice bonus, but not a sign of a sudden transformation.
Four Hits (or more)
As a Twins fan, I was all set to start grumbling about Carlos Gomez's debut with the Brewers, but then I was reminded that in his first five games with the Twins, Go-Go did this. Gomez, Pujols and Carlos Gonzalez all went 4-for-5 on Monday. Just how little does that mean for their next six months or so?
Well, as you'd expect, darn little. 20 guys managed four hits on opening day last decade (two of them, Craig Biggio and Aaron Miles!!?!, got five -- and then Miles turned around and got 4 again the following year). And like the homer-hitters, they're all over the map. 2009's hit-collecting heroes were Adam Lind, who never looked back, and Emilio Benifacio, who never looked so good again.
In the seasons in which those 20 hitters collected four or five on opening day, they combined to hit nearly .291. In the years prior to that one (which I should've done above, no doubt, rather than looking at their careers as a whole -- and even better, I should be looking at only the preceding three seasons or so -- but it's too late now), they hit a shade over .280.
Seems fairly significant, but a lot of it is just that great opening day itself; give them one hit that day rather than four (or two rather than five, so we're subtracting 60 hits and 0 AB from the whole), and their collective single-season average drops to .284. And, a lot of it is driven by Derrek Lee, whose four hits on opening day 2005 was the kickoff to a campaign in which the theretofore .266 hitter hit .335; if we remove Lee from both sides of the equation, the other 19 were career .282 hitters who hit .288 that season (and if we then take three of their 4-5 opening day hits back out, the season average drops to .281, almost exactly their prior career averages).
All of which is to say that I don't think the data support a conclusion that a player who collects four hits on opening day is likely to perform better the rest of the season than he has in the past. It so happens that Gomez and Gonzalez might both be ready to break out in some way this season (and let's be honest -- if Pujols just decided to hit .400 this year and went out and did it, would you be that surprised?), and if they do, maybe you'll hear people say that you could see the change in them from day one of the new season.
But I don't think you could.
The Oh-fer
Seven different guys were saddled with oh-for-fives on opening day 2010, including some pretty big names: Jacoby Ellsbury, Denard Span (who swung the bat like he thought if he hit it it might find his mother again), James Loney, Skip Schumaker, Aaron Rowand, and the Cabrerae Orlando and Melky. Those seven guys went 0-for-35 with a walk (Melky's) and 10 strikeouts.
Every year there's a guy or two who surprises everybody by just stinking up the joint all year (or just for the first half), seemingly from day one. Last year it was Ortiz and Burrell. Seems like Paul Konerko has been that guy two or three times in his career. Are one of these seven going to be That Guy 2010?
There are 68 guys who went at least 0-for-5 in opening days since 2000, and that's too many for me to check, so I'm going to keep the sample similar to the above and go from 2006 on. That gives us 27 names -- 25 0-for-5s, and Jason Bay and Placido Polanco each went 0-for-6 in 2008 (Polanco racking up an eye-popping -.354 WPA).
Let's see...this group of guys actually put up better batting averages in their oh-fer year than they had previously; they were career .267 hitters who, that season, hit .274. But the takeaway point here is that there's just no correlation with anything at all. Matt Holliday started off the 2007 season 0-for-5 and had the best year of his career, finishing second in the MVP voting. Jose Reyes started 2006 0-for-5 and made the jump from .273/.300/.386 to .300/.354/.487. On the other hand, Andruw Jones' opening day goose egg was the harbinger of his sudden collapse in 2007. Jeff Francouer started his first full season with a big zero, and ended up showing his true colors after a promising half-season in 2006. Travis Buck had a promising partial year in '07, but '08 was awful from day one, and he's never recovered. JJ Hardy and Ryan Doumit had nightmarish 2009s, and both of them got started on it straight away. David Dejesus' bad start to 2007 led to his worst batting average by 20 points and worst full-season OPS by nearly 60.
Interestingly, a couple other guys had kind of famous collapses either the year before or the year after their oh-fer start. Alfonso Soriano came up empty to start 2008, but wasn't terrible until 2009. Jason Bay's 0-for-6 in 2008 looked like a carryover from his awful 2009, but he came back strong. Other guys are just bad hitters -- Jason Kendall, Willie Tavaras. And a lot of others were just their normal, every-season selves having a bad day.
So if a guy has a really, really bad opening day, is that a bad sign? Well, it's not a good sign. And for some guys, it certainly seems to be the beginning of very bad things. But for many more, it's just a bad day. If you think you can tell one apart from the other, go ahead and take your chances.
The Auspicious Debut
Since 1920 (as far back as BBREF goes for these purposes), there have been 30 guys who (a) made their major league debut on their team's opening day and (b) hit a home run in that game. (Nobody's ever hit two or more.) Jason Heyward, the Jay Hey Kid, was the 30th.
I'm not going to mess with a spreadsheet for this one, but it's a good idea to take a look at that list. A couple really good players on the list. Orlando Cepeda, Ken Boyer, Luis Gonzalez, Will Clark. And a lot of guys I've almost never heard of. And Jordan Schafer, and Kosuke Fukudome, and Kenji Johjima, and Travis Lee.
On the other hand, sorting the list by age tells a different story. Heyward was the second-youngest ever to do it, less than a month behind Hall of Famer Cepeda, and the next guy to have done it was nearly a year older (though it's worth noting it's a guy who totaled 79 PA in the big leagues). But it's not like he's surrounded by great players on that list. He just happens to be right behind one guy who was really good for a fairly long time.
The point is, as I guess the point of all of this was: Jason Heyward might be every bit the special player everybody thinks he is, but one home run -- even one 450-foot home run in one's first-ever at bat -- doesn't prove it, or even provide particularly strong evidence of it. If there's anything we can learn from any of these opening day stats or events, it's months (or, in Heyward's case, years) before we know we can learn those things, and that they weren't just random blips. Opening day is just about the greatest day of the year, for all kinds of reasons. But I think I'd find it even greater if people didn't get in quite such a tizzy over one day (or even one month, or two, but that's another post) in a looooooooong season.
Bill runs the blog The Daily Something, featuring a largely sabermetrics-focused post on some topic related to baseball five days a week. You can become a fan on Facebook or follow him on Twitter.
| Behind the Scoreboard | April 06, 2010 |
How Do Experts Make Their Predictions?
Yesterday, we at Baseball Analysts revealed our "expert" predictions. Now there's so much luck that goes into winning baseball games, that making predictions on Opening Day is basically a fool's game. Still, everyone loves to make them. It was my pleasure this season to be able to publish my picks for the first time, both here, and over at SI.com.
However, I'll have to admit that I was a little bit conflicted when asked to provide my pre-season selections. What, exactly, is the goal in making the picks? Do I merely choose the teams who I think have the best chance to win each division, league, World Series, etc? Or do I choose teams that I think are underrated by others, but might not necessarily be the teams I would stake my life upon? What does the average sportswriter do? Do they make selections just to make a statement or show how smart they are or do they stick to those that they really think are the best clubs?
Putting it into a more economic context, what is the payoff function which most sportswriters use? One possible method is a simple one, where the goal is simply to make as many correct picks as possible. If this is the goal, the best method is to simply pick teams which have the highest probability to win. The problem with this method is that there isn't a whole lot of room for creativity. Think the Marlins are an underrated ballclub, who has a good chance to contend? Perhaps you handicap the NL East as the following: PHI 33%, ATL 32%, FLA 30%. That's probably a lot more favorable towards the Marlins than most people would say, and a lot less favorable towards the Phillies. But, under this method of making predictions, you'd have to go with the conventional wisdom pick of the Philadelphia Phillies to win the East, just like the rest of the world.
Another drawback of this method is that when looking at a bunch of "expert" picks, there isn't much to choose from between the experts. Over at SI.com, all 13 experts, including yours truly, picked the Phillies to win the East. There's not much to choose from between the writers, and as a fan, it doesn't tell you much about what the Phillies chances actually are. Assuming writers use this method of making their selections, all it means is that each thinks that the Phillies have the best chance to win the East. Whether that chance is 30%, 50%, 80% or 99% is unknown.
However, there's some evidence that not every expert makes their picks this way. Jim Caple, at ESPN, is picking the Giants over the Twins in the 2010 World Series. SI's Tom Verducci is picking the Twins to win the AL Pennant. SI's Albert Chen has the Rays winning it all. Could these things happen? Sure, all of these teams have the potential to go all the way. However, I can't image that any of these experienced baseball writers would really stake their lives on these picks. More likely, these experts wanted to select teams which were underrated. On the off chance that the Giants do knock off Minnesota in the World Series, Jim Caple will look like a genius. If the Yankees defeat the Phillies, like I picked, I simply look like a purveyor of conventional wisdom. Thus, there may be incentive to make upset picks.
A payoff function that would reflect this thinking would give experts credit in inverse proportion to the number of other people making that same selection. Thus if a 60% of people were picking the Phillies to win the East, then you would get 1.67 points of "credit" (1/.6 = 1.67) if you also picked the Phillies and they actually won. If only 5% of people were picking the Marlins, you would get 20 points of credit (1/.05) for making that correct selection. This would give someone an incentive to pick the Marlins if they thought they were underrated, even if they didn't think they necessarily were the team most likely to win.
As a matter of fact, if all experts used this type of payoff function, the result would be an efficient marketplace, in which the percentage of writers making each pick would correspond to the probabilities that each team would actually win. This would occur, because an equilibrium would be reached where, according to the market, the expected payoff for selecting any of teams would be equal. To maximize points, you'd have to not pick the teams you thought would win, but instead pick the teams you thought were underrated by others. This would truly become efficient if experts could change their picks after viewing what the other experts had chosen, as it would reach an equilibrium where no expert could gain an advantage by changing his or her selection. A made-up example with 10 writers and the probabilities they assign to each team winning the AL East is below:
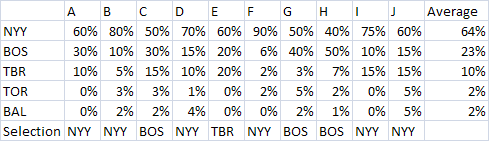
Writer G, though he thinks the Yankees are better than the Red Sox, thinks more highly of the Red Sox than most other writers, and hence he has incentive to pick the Boston over New York. The same goes with writer C and with writer E concerning the Rays. The result is that none of the writers have an incentive to change their picks, hence it reaches an equilibrium of six writers choosing the Yankees, three writers choosing the Red Sox, and one writer choosing the Rays. This roughly corresponds to the consensus probabilities of each team winning the AL East (it would match-up more exactly if there were more than just ten people making predictions). This is a more interesting outcome than if each writer simply chose the team they thought most likely to win. In that case, all but one would have chosen the Yankees - a far cry from the actual consensus handicapping of the division.
If this were actually done this way, this would actually yield the fan some cool information. Getting the collective probabilities of success from experts would be interesting and useful info. Unfortunately, it doesn't appear that writers make their picks this way either. None of the 49 writers for either ESPN or SI chose either the Indians or the Athletics to win their division. These teams certainly aren't the favorites, but they definitely have a better chance of winning than 1 in 49. If experts made their picks in the above manner, at least a few would have chosen these sleeper teams to win. Likewise, at SI, every writer picked the Phillies to win. However, the Phillies have far from a 100% chance to win the division. Were the payoffs doled out as above, a fair amount of writers (including me) would have changed their picks to the Braves or perhaps even the Marlins or Mets. Hence, it's pretty obvious that experts don't make their picks with this payoff in mind.
So, if experts don't go with either of these payoff functions, then how do they make their selections? Good question. For most, it's probably a combination of the two. I would say most probably pick the team that is most likely to win, however, if it's close they'll likely choose an upset, just to go against the conventional wisdom. At least, that's my hunch. It's pretty tough to tell what's actually going on inside the head of the average sportswriter. For me personally, the one area I went out on a limb was in picking the Tigers to win the AL Central. If my life depended on making the right selection, I might have gone in another direction, but seeing as I thought it was pretty much a 4-team crapshoot, I went with Detroit, a pretty good ballclub that no one else seemed to be picking. In all, the various ways people make selections, and of course, the uncertainty surrounding any Major League season, makes preseason picks fairly useless. Still, I'd love to see how writers would respond to participating in a system like the above, where the payoffs were inversely proportional to the number of experts making that same pick. At least then we could glean some interesting information out of them.
| April 05, 2010 |
Get Your 2010 Results Before the Season Even Begins
Notwithstanding the New York Yankees at Boston Red Sox made-for-TV opener Sunday night, the 2010 season gets underway today. Although they say the games are played on the field and not on paper, that's not about to stop us from making our paper — err, cyber-based — predictions right here and now. We recognize our predictions are bound to fail more often than not but, hey, we're gonna go on record anywhere.
Feel free to call us out in October should you wish (heck, feel free to call us out now if you are so inclined), but we're not going to pay attention unless you go out on a limb by listing your forecasts in the comments below.
| Rich | Sully | Sky | Jeremy | Dave | Consensus | |
|---|---|---|---|---|---|---|
| AL East | BOS | NYY | NYY | NYY | NYY | NYY |
| TB | BOS | BOS | TB | BOS | BOS | |
| NYY | TB | TB | BOS | TB | TB | |
| BAL | BAL | TOR | BAL | BAL | BAL | |
| TOR | TOR | BAL | TOR | TOR | TOR | |
| AL Central | CWS | MIN | DET | MIN | MIN | MIN |
| MIN | CWS | MIN | CLE | CWS | CWS | |
| DET | CLE | CLE | CWS | CLE | CLE | |
| CLE | DET | CWS | DET | DET | DET | |
| KC | KC | KC | KC | KC | KC | |
| AL West | LAA | LAA | TEX | TEX | TEX | TEX |
| TEX | TEX | LAA | SEA | LAA | LAA | |
| SEA | SEA | SEA | LAA | SEA | SEA | |
| OAK | OAK | OAK | OAK | OAK | OAK | |
| AL Wild Card | TB | BOS | BOS | TB | BOS | BOS |
| NL East | PHI | PHI | PHI | ATL | ATL | PHI |
| ATL | ATL | ATL | PHI | PHI | ATL | |
| FLA | FLA | FLA | NYM | FLA | FLA | |
| NYM | NYM | NYM | FLA | NYM | NYM | |
| WAS | WAS | WAS | WAS | WAS | WAS | |
| NL Central | STL | STL | STL | STL | STL | STL |
| CIN | CIN | MIL | CIN | CIN | CIN | |
| MIL | CHC | CHC | MIL | MIL | MIL | |
| CHC | MIL | CIN | CHC | CHC | CHC | |
| HOU | HOU | HOU | HOU | PIT | HOU | |
| PIT | PIT | PIT | PIT | HOU | PIT | |
| NL West | COL | COL | LAD | LAD | COL | COL |
| LAD | LAD | COL | COL | LAD | LAD | |
| SF | SF | SF | ARI | SF | SF | |
| ARI | ARI | ARI | SF | ARI | ARI | |
| SD | SD | SD | SD | SD | SD | |
| NL Wild Card | LAD | ATL | ATL | PHI | LAD | ATL |
| ALCS Champ | BOS | BOS | NYY | NYY | NYY | NYY |
| NLCS Champ | COL | STL | PHI | ATL | ATL | ATL |
| World Series Champ | BOS | BOS | NYY | NYY | ATL | BOS/NYY |
Rich: I believe the Red Sox, Rays, and Yankees are the three best teams in the majors, yet only two of them will make the postseason. New York could just as easily finish first as third. Same goes for Boston and Tampa Bay. All three clubs will win at least 90 games with the division winner and the wild card exceeding 95. The AL and World Series champion will also come from this division. The rest of the teams in the league know they need to win their division in order to qualify for the postseason. Second place in the AL West or Central won't sniff an opportunity to compete in the ALDS.
Over in the NL, I believe the Cardinals will win the Central as handily as any division titleist. I'm not nearly as convinced with respect to the East and West, as both appear to be two-way races between the Phillies/Braves and the Rockies/Dodgers. One of these four teams will earn the wild card. It says here that Colorado will prevail in the NLCS and meet Boston in a repeat of the 2007 World Series with the Red Sox winning it once again but not via a sweep as before. One other thing: Mike Lowell will not be the WS MVP in 2010!
Sully: I don't have much conviction about my American League East or West picks. The top three in the AL East look like the top-3 in all of baseball to me, but Philadelphia could lay claim to a top-3 spot as well. I think the last place team in the AL West will be a lot closer to the division winner in terms of quality than the 2nd place team will be to the respective division winners in either the AL or NL Central. I believe St. Louis, Colorado, Philadelphia and Minnesota will all manage to win their divisions without much of a challenge.
Who knows on the post-season? Any number of teams could make a run if they qualify thanks to top-heavy pitching staffs. Would you want to face Seattle in a five-gamer? For a World Series prediction, I will call a 2004 Fall Classic rematch and say Boston takes their 3rd World Series title in 7 seasons.
Sky: Yes, I'm going with the rematch of the Phillies and Yankees in the World Series once again. I think it's hard to say that anyone will come close to the Yankees and Red Sox as the best two teams in baseball. The AL Central is a complete crapshoot, but I'm going with the Tigers, partly because they seem like they are trying to win now, and if they are in it they'll likely to acquire spend the pieces they need midseason. I could really be convinced to go with any of the four top teams in that division though. In the AL West, I like the revamped Rangers, and I think the Mariners were playing a bit over their heads last season. They've made some nice pickups, but I don't think it will be enough to carry them to the top. In the NL, time is running out for the Phillies' potential dynasty, but they should have enough to win the NL again this year. I like the Braves and their young pitching to win the wild card and contend for the East. I'm not real high on the Cardinals this season, because their two aces will regress, but I can't be convinced to go with any other NL Central team this year. Finally in the West, I'm betting that Manny Ramirez can hold up one more season and carry LA to another division crown. I don't see them getting past the Phillies in the playoffs however.
Jeremy: I mainly go against the grain by picking the Braves to win the NL East. I think the Phillies are getting old, and I think with Jason Heyward, the Braves are poised to go on another 14-division-title streak. After watching J.D. Drew take a called strike three last night, I just don't see how I could allow myself to put the Red Sox in the playoffs. And the Rockies seem to be a trendy pick, but the Dodgers have a guy I like to call Vin Scully. No big deal.
Dave: The Yankees are the best team in the league, but I went with an upset in the World Series to make things a little fun. Atlanta's two young phenoms will bust out and the team will have a great year. In the AL West things will break Texas's way, they will build on their 87-win season last year and win the division. The AL and NL Centrals play out similarily to how most see it, with the Minnesota and St Louis the classes of their divisions. I think the NL West will be close with Colorado narrowly edging out Los Angeles, but the Dodgers will pick up the Wild Card.
There you have it. Where did we go right or wrong? You decide.
| Touching Bases | April 05, 2010 |
Finally Joining the Old Guard
Bill Simmons is one of my favorite writers on the planet. An inspiration. The highlight of my 11th-grade Physics class was being pulled from class by a friend who told me that I had made Simmons’ mailbag. Reading his latest piece on Friday made me smile. Profusely. But I thought it would be funny for a Sabermetrician to write the exact opposite type of piece.
Question: Who’s going to have the biggest decline in baseball this year -- Ben Zobrist, Joel Pineiro, J.A. Happ, or Joe Mauer?
Answer: None of the above. The answer is me.
See, I’ve loved writing about baseball these past two years, developing stats too complicated for the common fan’s liking. Did I respect the work of ESPN, Murray Chass, Dan Shaughnessy, Mike Lupica, and everyone else in that community? Of course not. I just hated the ignorance of it, the concept that opinion could trump data. If whimsies always prevailed, what was the point of analysis? I longed for the future when I could say things like, “Brett Gardner has had the 11th highest WAR rate among outfielders in the last two years. Calling him a fourth outfielder is batshit crazy.” And there wouldn’t be some dude calling WFAN and WEPN saying, “Well, I think…”
Look at that last sentence again.
Fundamentally, it’s fundamental. I just admitted I longed to be objective with my analysis.
My first favorite player was Scott Brosius, New York's flappable third baseman. I don’t know why. I was a third baseman as a kid and I guess I just thought he was a really good defender. Fun to watch. Don’t really care if he stood the test of time, although he does rate well by WOWY. I just enjoyed watching him barehand bunts and hit World Series home runs off BYK like any True Yankee. Hence, my attitude for the past few years could be summed up like this:
“Who cares if your favorite player/team sucks? I’m just presenting the data, no need to take offense. Shouldn’t change how you enjoy watching the game.”
Things shifted this winter when a guy told me that I live in my mother’s basement. Instinctively, I understood that I don’t live in my mother’s basement. I live in a dorm room on campus. Why would somebody tell me that I live in my mother’s basement when he has no bearing for that remark? Why would you try to purposely offend me, when you don’t even know me? Why are you so angry? Calm down, bro. Have a beer.
Baseball friends I trusted kept telling me, “Think of it existentially. The mother’s basement is a metaphor for “the past,” and the guy was really talking about himself. So in actuality, he was saying that he lives in the past and feels that you’re encroaching upon his territory. He’s getting older and more out of touch, and he’s uncomfortable with change.”
I wanted to believe it. Cautiously, nervously, I started researching where my tuition and room and board were coming from, begrudgingly coming to one conclusion: I do “live in my mother’s basement.” My mother’s basement is a painfully unoriginal insult disguised as a cliché. I am my parents’ genes with arms and legs. I am dependent on my parents. Does this paragraph make sense? No. Ignoring logic…that’s the trick. And the nonsense indicated that my sensibilities were wrong.
Little did I know, the ball was rolling for me. I spent March making myriad friends and clearing my acne and losing my virginity and GTLing, and not speaking with a nasally voice for mostly unselfish reasons (The world is a better place when I’m socially active.), but also because I realized that the only way to avoid insults from the old guard is to conform. I even understand why mainstream guys take it so personally whenever a stat junky spouts out an informed baseball study. It’s too hard to be a Sabermetrician these days. Takes a lot more time than you might think.
Without further ado, I am leaving the world of Sabermetrics. Getting out of my mother’s basement makes life more fun. At least for me.
| Change-Up | April 05, 2010 |
Stakeholders - Philadelphia Phillies
Since late February, a collection of bloggers, analysts, mainstream writers and senior front office personnel have joined us to discuss a specific team's hopes for 2010. Some have been in-depth, some light, some analytical, some less so but the series has been well received and we were thrilled about the lineup of guests we were able to attract. While it was intended as a preview series, time got away from us and so we are just going to keep at it until we have finished all 30 teams. We may even keep at it throughout the season. Today it's Tommy Bennett on the Philadelphia Phillies.
![]() Patrick Sullivan: So the Phillies have Roy Halladay. That's a very good thing as far as the 2010 club is concerned. But they also lost Cliff Lee, and there are some that viewed the move as just kind of wheel-spinning and unnecessary when you look at all the pieces exchanged. What were your thoughts?
Patrick Sullivan: So the Phillies have Roy Halladay. That's a very good thing as far as the 2010 club is concerned. But they also lost Cliff Lee, and there are some that viewed the move as just kind of wheel-spinning and unnecessary when you look at all the pieces exchanged. What were your thoughts?
Tommy Bennertt: The answer to this question depends entirely on how you frame the tradeoff. Compare the deal the Phillies now have Halladay signed to ($60M for 2011-2013) is almost certainly better than the deal that the Phillies could have reached with Cliff Lee, and I think it's pretty clear that Halladay is the superior pitcher. However, when you disaggregate the deal that brought Halladay to town from the one that sent Lee to Seattle, it looks a little bit more questionable.
Ultimately, I view the two trades together as a shifting forward of wins from four (or so) years in the future to the immediate present and next two years. Those two years are critical for the Phillies, because that's when you'll have Howard, Rollins, Werth, and the rest of the core together on the same team. As much as possible, you want to stack your wins in the same seasons, and I think this helps them do that. That being said, I think the prospects the Phillies gave up--especially Kyle Drabek and Michael Taylor--are going to be good players.
PS: What did you think of the off-season more generally? Did you support the Placido Polanco acquisition? Is Ruben Amaro lucky, good, neither?
TB: I thought Polly was a fine pickup. From the looking that I've done, the best bargains are usually found later in the winter, but it comes at the considerable cost of certainty. What Amaro did was trade value for certainty, and with a team that is this ready to compete, I think that is a completely justifiable tradeoff. The transition from second to third won't be as hard on Polanco as it would be on some other players (because of his defensive skill set, most notably his arm). Also, he's going to have a natural comfort level in Philadelphia from playing there in the past that frankly a lot of other guys would not. You can deny the measurability of intangibles all you want, but until you've survived the boos raining down from the upper decks, you can't really say you'll hack it in Philly.
PS: Ok, I'll stop with the negativity. Let's now discuss how the Phillies sure seem to have an awesome baseball team. Talk about Cole Hamels. I am already hearing some in the mainstream talking about how Hamels looks as sharp as ever and how he is poised for a big "bounce-back" year. We know the truth though, right? He will probably be really good again because, well, he is really good.
TB: Things that were very close to the same or better from '08 to '09 about Cole Hamels: K/9, BB/9, HR/9, GB%, FIP, SIERA.
Things that were worse from '08 to '09 about Cole Hamels: Strand rate, ERA, BABIP, IP.
Hamels is one of those cases that will really test your faith in DIPS theory. If you would rather rely on strand rate, ERA and BABIP, then you can say he's worse now than he was last offseason. Otherwise, just relax. It's fine. He's a great pitcher.
One impulse might be to say that Hamels was regressing to the mean after a stellar '08, but even that isn't really true when you look at his peripherals. He basically repeated every skill-based achievement last year except innings pitched that he had in '08. Like I said, though, Philly fans are fickle and there are some things you just can't get away with.
PS: Can we get Chase Utley an MVP award? Want to talk about him? How good is he and how good has he been? Want to put some historical context around it? He's terrific, of course, but I would guess there are still some who think that he's been the 3rd best position player throughout this great Phillies run.
TB: I have this theory that historically great second basemen are always underrated. The best second basemen ever (Joe Morgan, Rogers Hornsby, Nap Lajoie, Eddie Collins) are almost criminally underrated as ballplayers. Even Jackie Robinson, one of the most celebrated players in baseball history, isn't given the respect he deserves for his actual play on the field. So I think Utley has a bit of an uphill climb.
On the other hand, he's basically doing all the things you need to do to become a top-20, and perhaps top-10 or higher, second baseman all time. Basically, he's got a good shot at passing Sandberg and Alomar (and I think you can make a reasonable case that he'll do both), and once he's there he's basically in the top 10 all-time. I have a hard time conceiving of a Hall of Fame that doesn't include the ten best players at each position. In other words, barring injury, I think he's got a legitimate shot at the Hall, and a fortiori, a shot at a minimum of one MVP award.
Let me put it another way for perspective: Chase Utley is the best player on the Phillies and he's the best player in baseball that doesn't have a Cy Young, a Rookie of the Year, or an MVP award. Then again, he's got the most glorious television expletive in Philadelphia history.
PS: Ok, 2010. What do you expect of the Phillies? Will they get a serious challenge in the NL East? Do they have another title run in them?
TB:I'm legitimately worried about the Braves. Their weakest positions on offense are probably second base (Martin Prado) and right field (Jason Heyward). Those are still two pretty darn good players, and their pitching staff will do enough so that they'll win around 87-88 games. If Tommy Hanson doesn't hit a stumbling block, I think they can survive that thumping sound you hear (Jair Jurrjens falling back to earth).
If the Phils can hold off the Braves (or at least secure the Wild Card), I'm not sure there's a team they are likely to face before the World Series that would be able to go 1-2 like Halladay-Hamels in a short series. The bullpen could always, however, make things interesting. Call it Halladay, Hamels, rain, and pray for a complete game.
Tommy Bennett writes for Baseball Prospectus and can be found on Twitter @tommy_bennett
| Change-Up | April 04, 2010 |
Stakeholders and Beyond
When we decided back in February to forego our traditional roundtable format for this season's previews, there were a number of drivers. First, there are lots of previews everywhere around the web and we didn't want to go with something undifferentiated. Second, we thought the interview format with various baseball constituents would make for good reading. Third, candidly, we were all a bit short on time. Between travel, work, work travel, and school, we all had schedules not exactly conducive to preview season.
So Stakeholders seemed like it would be a good way to go. And it was. Some smart baseball folks have given it high praise and if you've missed it, here is the list of teams we have featured thus far (we will have the Philadelphia Phillies up a bit later today, too):
New York Yankees - Cliff Corcoran
Boston Red Sox - Zack Scott
Tampa Bay Rays - R.J. Anderson
Minnesota Twins - Aaron Gleeman
Kansas City Royals - Joe Posnanski
Seattle Mariners - Dave Cameron
Oakland Athletics - David Forst
New York Mets - Pat Andriola
Washington Nationals - Jonah Keri
St. Louis Cardinals - Bernie Miklasz
Milwaukee Brewers - Larry Granillo
Pittsburgh Pirates - Joe Sheehan
Los Angeles Dodgers - Jon Weisman
We have fallen woefully short of our goal of having all 30 teams done in time for the season and for that, I take personal responsibility. I spearheaded the initiative and for a whole bunch of reasons, did not finish it in time for the beginning of baseball season. BUT, as I said, we have been thrilled with the output. So we are going to keep after it, finish up all 30 teams, and then I plan to continue the series from time to time throughout the season.
Our readers are best served when we're engaging other baseball websites, writers and front office personnel. There's no reason that it has to be just a preview series. Stakeholders, though incomplete, was a success. Because we think it was a success, you can expect more quick interviews like the ones you have seen over the last 5 weeks in the coming weeks and months.
=========
Speaking of engaging other writers, kudos to Peter Abraham of The Boston Globe. Abraham highlighted in today's edition the Tufts University course, Sabermetrics: The Objective Analysis of Baseball. In the piece, Abraham mentions our very own Jeremy Greenhouse of Tufts, who, as you all know, has been doing groundbreaking work right here since his very first post. Abraham gets extra credit for running the piece on the same day that his colleague Dan Shaughnessy wrote his laziest mail-in of anti-stat drivel to date, which is saying something when you consider all the drivel that has come to define Shaughnessy's body of work.
Finally, still along the lines of baseball writers enaging one another, the guys from the hilarious and insightful Yankees blog Fack Youk asked me to preview the Boston Red Sox in a Stakeholders-style preview of their own. Go on and check it out if you'd like.
Happy Baseball, everyone. It's here.
| F/X Visualizations | April 03, 2010 |
Saying Goodbye to the Metrodome
Earlier today Jeremy chatted with Aaron Gleeman about the Twins and they noted Target Field, the new home of the Twins. It sounds like Aaron is pretty excited about it, as I am sure all Twins fans are. But I wanted to take a brief moment to note the passing of the Metrodome as the home of the Twins. I will do so in the same way that I did for the two New York parks this time last year and the only way I could think to do so: a run value map based on the Gameday recorded locations of balls in play and home runs at the Metrodome.
The locations are again taken from Gameday and then translated by Peter Jensen's factors. Gameday records where the balls are fielded not where they landed (Jensen has not yet released the 2009 transition factors so for 2009 I used the 2008 values). Each event (out, double play, single, …) is given its run value and then the run values for each location were fit using a loess regression. The the run value for each location, as predicted by the regression, was color coded. I have finally taken Studes' advice and flipped the color scheme so that blue is low (good for the pitcher) and red is high (good for the batter).
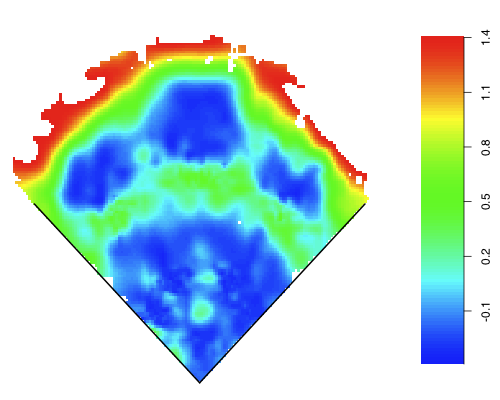
This is not meant as a serious statistical analysis (for serious analysis using the Gameday locations go to Jensen's series or hold tight for Colin Wyer's Gameday-based defensive metric), rather a pretty picture and a way to say goodbye to the Metrodome.
| Touching Bases | April 03, 2010 |
Stakeholders - Minnesota Twins
From now through the beginning of the regular season, we will not be posting in-depth round-tables previewing each division like we have in years past. Instead we will feature brief back-and-forths with "stakeholders" from all 30 teams. A collection of bloggers, analysts, mainstream writers and senior front office personnel will join us to discuss a specific team's hopes for 2010. Some will be in-depth, some light, some analytical, some less so but they should all be fun to read and we are thrilled about the lineup of guests we have teed up. Today it's Aaron Gleeman on the Minnesota Twins.
![]() Jeremy Greenhouse: If you were the Twins new stats guy, what would be your first order of business?
Jeremy Greenhouse: If you were the Twins new stats guy, what would be your first order of business?
Aaron Gleeman: Order lunch. I never crunch numbers on an empty stomach. After that, I'd push to set up a meeting with the decision-makers to present some of the concepts and stats I'd be using, because the analysis means nothing if the front office doesn't understand or value the underlying concepts and based on their statements so far they don't yet.
JG: Bill Smith seems to be guided more by faith than science. So is Locke his best "Lost" comp?
AG: Well, he can't be Hurley any more because he dropped something like 50 pounds, so Locke might be the best comp. Right now I suspect the new stat guy's best "Lost" comp is probably Artz or maybe even the pilot who got yanked out of the plane in the first episode. Also, if there's a Kate comp working in the Twins' front office my head may explode.
JG: How many wins does the loss of Joe Nathan cost the team, and how would you handle the Twins bullpen?
AG: My best guess is that Joe Nathan's injury costs the Twins three or four wins. I'd like to see them try a true "closer-by-committee" because they have 4-5 capable right-handers and Jose Mijares is death on lefties, but despite Ron Gardenhire using that phrase to describe his ninth-inning plans I think he'll settle on one guy for the job within a few weeks.
JG: Twins starters don't strikeout many guys. The defense rated poorly in terms of UZR last year. Something's gotta give. Do you think the defense turns it around this year, or would the staff be better served with starters who strike out more than 4.5 batters per nine (Nick Blackburn)?
AG: It'll be an interesting experiment, for sure, because the Twins' pitching staffs have long been fly-ball heavy with great control and mediocre strikeout rates, yet their outfield defense has the potential to be pretty bad if past numbers prove accurate and their infield defense has the potential to be very good with J.J. Hardy and Orlando Hudson up the middle and Nick Punto getting most of the starts at third base. Beyond that no one knows how the new ballpark will play and they're switching from turf to grass. I think the key will be whether Denard Span's scouting reports or small-sample size UZRs end up telling the story about his ability in center field.
JG: Delmon Young. Positive or negative WAR?
AG: Positive, but not by a ton. Delmon Young lost a bunch of weight this offseason, he's still pretty young, and everyone takes any positive thing he does as a sign that it's all coming together finally, but I'm definitely not a believer. He swings at everything, his bat speed is often sluggish, and he's yet to show any of the supposed power potential Twins fans have been hearing about for years now. He's also a horrible, clumsy defender, so he'd need to really have a strong year at the plate to post a solid WAR.
JG: Joe Mauer. That's not a question. That's a statement of fact.
AG: Preach.
JG: What are you hearing about Target Field in terms of aesthetics and how it will play?
AG: Everyone seems to love it, which I think is a combination of the Twins doing a really nice job putting the place together and the fact that Minnesotans have been watching baseball in a warehouse for a couple decades. It seems very tough to predict how new ballparks will play, but I suspect it'll be more hitter-friendly than the Metrodome was in recent years. I'm just hoping it's not too extreme in either direction.
JG: Have you ever considered calling yourself Aaron Gleeman III to gain credibility with Twins fans?
AG: I don't have the je ne sais quoi to pull that off like LaVelle E. Neal III (or LEN3, if you're nasty). I'd probably go with "Trey" in that scenario, although Hillman has kind of ruined that for all the III's out there.
JG: The Twins are the best, most talented team in the division to be sure. So what are you most nervous about heading into the season?
AG: I think the impact of losing Nathan has generally been overstated, but the bullpen is definitely in flux right now and whether or not the closer role is overvalued he's still one hell of a reliever. I'm probably most nervous about that, along with Justin Morneau's health. But at the end of the day I think you're right that they have the most talented team in what figures to once again be a pretty weak division.
Aaron Gleeman is the Senior Baseball Editor at Rotoworld and owner of aarongleeman.com. He was the co-founder and main operator of The Hardball Times before leaving to write for NBC Sports, where he writes the Baseball Daily Dose column for Rotoworld, and he, along with Craig Calcaterra, D.J. Short, and Drew Silva write the constantly updated HardballTalk blog.
| Baseball Beat | April 02, 2010 |
Stakeholders - Los Angeles Dodgers
We turn to Jon Weisman, the proprietor of Dodger Thoughts, to discuss the Los Angeles Dodgers in our Stakeholders series that has featured writers, analysts, and team executives giving us the inside scoop on each of the 30 teams in the Major Leagues. Jon and I met in 2003 and became colleagues at All-Baseball.com in 2004. His blog was subsequently hosted at Baseball Toaster and the Los Angeles Times, and it was moved to the ESPN Los Angeles earlier this year. He has been a regular member of our roundtables previewing division races and also served as a guest columnist in 2005.
Grab a cup of coffee and pull up a chair as we discuss all things Dodgers.
Rich Lederer: Let's give our readers an executive summary at the outset of our discussion. The Dodgers won 95 games, captured the NL West, and competed in the NLCS in 2009. Do you expect the team to be better, worse, or about the same this year?
Jon Weisman: I can't go enough out on a limb to say they'll be better, but I think they'll be closer to last year's level than a lot of people think. They have to replace Randy Wolf's production, but I think they can with a strong full season from Chad Billingsley, Clayton Kershaw pitching deeper into games, Hiroki Kuroda avoiding line drives, and perhaps more help from the farm system in the rotation this year. I do think Vicente Padilla is a mirage waiting to be exposed, though. Charlie Haeger is an interesting wild card - he may be banished by April, but he might turn out to be a real boon. And then of course the lineup figures to be as solid as last year, if not more so with growth from Matt Kemp and James Loney and a potential comeback from Russell Martin. I'm not saying everything couldn't go wrong to leave us with another 2005, but I'm not betting that'll happen.
 Rich: I think it is safe to say that the Dodgers will win more than 71 games this year. After opening the season with a 16-8 record, that team went into the tank and was victorious in only 55 of its final 138 games. Jim Tracy was fired by the Dodgers, then hired and fired once again by the Pittsburgh Pirates, but caught on with the Colorado Rockies early last summer and was named NL Manager of the Year. Do you anticipate that the Rockies will be the Dodgers' main source of competition within the division this year?
Jon: Yep. I don't think it's a flawless team, but they have a nice collection of players. The Giants still lack the bats to be considered a preseason favorite, and even though the Diamondbacks will be improved, I think they have a long way to climb. But there are always surprises.
Rich: Peter Gammons reported that the Dodgers have an $83 million payroll for 2010. He also said that the team spent the least amount of money on the MLB Draft and international signings the past two years. While it's clear that the Dodgers have been retrenching, I believe that payroll figure is a result of some Bernie Madoff-type accounting as the club has deferred salary to Manny Ramirez and obligations to many former players that may not be fully reflected in this reported total.
Jon: Nothing personal against Peter, since he's far from the only one doing it, but it's pretty disengenuous to ignore the deferred money or the money going to people like Juan Pierre and Andruw Jones when calculating what the Dodgers are spending, which is what that $83 million figure does. Isn't the big complaint against the Dodgers that they didn't go after a big-ticket free agent? Well, you don't often get those unless you take some risk or defer some money. The Dodger payroll is much closer to $100 million, which isn't sky-high but it's competitive enough. Furthermore, unless you believed the Dodgers should have handed John Lackey a guaranteed five-year, $80 million contract - the kind of contract that would typically blow up in their faces - there really wasn't a payroll issue to the offseason other than the non-arbitration offers to Wolf and Orlando Hudson.
Rich: Just who did the Dodgers add this year? How will the 2010 version differ from 2009?
Jon: They added very little - it's more about who they retained (i.e., the young core plus Manny) and their potential for growth. But there won't be a ton of difference - this is probably the most stable lineup the team has had in years.
Rich: How will the Divorce McCourt affect the Dodgers' ability to take on payroll during the season?
Jon: It's speculation, but I do think there's room for the Dodgers even in the current climate to make a decent midseason acquisition. But I'm not expecting Albert Pujols.
Rich: While every team could use an Albert Pujols, this Dodgers club should score a lot of runs. If Matt Kemp, Andre Ethier, and Manny Ramirez hit like they have in the past, the Dodgers are set with one of the most dangerous 2-3-4 hitters in the game. That said, when it comes to Ramirez, should we expect him to be the Manny of August and September 2008, the post-drug suspension Manny of 2009, or somewhere in between?
Jon: I'm more worried about Rafael Furcal than Ramirez. Furcal may or may not be healthy; either way, I think his skills are aging and I don't know how much effectiveness he has left. I don't have any idea what Ramirez will do this year, but I do think it's very relevant that he was hitting after the suspension but before his injury, and I think one might take his media silence this spring as an indication of his determination.
Rich: Moving down the lineup, is there reason to expect James Loney to fulfill his potential or is the Loney we've seen the past few years who he is?
Jon: I expect Loney to improve - maybe even reach his potential - but of course I don't think many people define his potential as that of a serious power hitter.
Rich: What's going on with Russell Martin? He added muscle and gained a bunch of weight during the offseason but strained his groin in early March and has been working his way back into shape. Do you see him bouncing back from his worst season ever and returning to his 2006-2008 form or is it possible that he could surprise us all by putting up career numbers in his age-27 season?
Jon: I expect a bit of a rebound from Martin, because it's hard to imagine him doing much worse, but it would be something if he had career numbers. Right now, if he can just maintain the good on-base percentage he has typically had, even as his power and speed have declined, I'd be happy. Even if he's in the Opening Day lineup, though, this might be the first year that Martin goes on the disabled list.
Rich: On the run prevention side, can a rotation with Vicente Padilla as its Opening Day starter and Charlie Haeger as its fifth compete for the NL West title?
Jon: Certainly. First of all, whether Padilla pitches in the first or fourth game of the season is pretty irrelevant. As for the fifth spot, the other NL West teams certainly have question marks there as well - most teams rotate guys through that slot no matter what. In no way does the Dodger starting rotation disqualify them from competing. It might simply come down to health across the board - does Brandon Webb recover it, does Jeff Francis maintain it, does Tim Lincecum keep it? And so on...
Rich: Let's talk about the bullpen. It was one of the best in the majors last year, yet Joe Torre will be without Ronald Belisario and Hong-Chih Kuo for most of April. Belisario finally made it to camp after missing the first five weeks of spring due to visa problems. He was a huge positive surprise last year as a rookie but will begin the season on the restricted list. Kuo, who was the Belisario of 2008, is on the DL. Do you think Jonathan Broxton, George Sherrill, and Ramon Troncoso can nail down the seventh, eighth, and ninth innings with little or no help from what otherwise looks to be a mediocre group of relievers?
Jon: It's similar to the rotation question. Say what you will about the Dodger bullpen, I don't see a whole lot of teams that have great fourth and fifth relievers. At least in the case of the Dodgers, they might have them by the end of April. And the team has a great number of candidates to try to help things out. Relief pitching is very volatile and unpredictable - just look at Brad Lidge, for example. But I don't see the Dodgers at a disadvantage on April 5 compared to other teams. For one thing, their top divisional rival will start the season without its closer.
Rich: How do you feel about the team's defense?
Jon: I'd like to feel better. The infield to the left of Loney is shaky, and I include Furcal in that. And Kemp is really going to be worked in center field covering for Ramirez and Ethier. One of the more interesting decisions the Dodgers might face this year is, for example, if Blake DeWitt slumps, do they call up a defensive-minded infielder like Chin-Lung Hu to plug that hole and at least improve the defense, rather than resort to Ronnie Belliard or Jamey Carroll.
Rich: Are there any minor leaguers who may contribute this year?
Jon: Among others, I expect we'll see Scott Elbert and Josh Lindblom, and since James McDonald again qualifies as a minor-leaguer, him too. Don't know that we'll see as much from the farmhands in the lineup, which looks more stable. But if the team loses an outfielder for any length of time, Xavier Paul is in line to help.
Rich: Do you think Joe Torre and Vin Scully will both be back in 2011?
Jon: You know, I have no idea. I'll admit I was a tiny bit surprised (and relieved, of course) Vin returned for this season - and I took that as a sign that he might want to do it until he physically can't anymore. Torre might simply come down to dollars, but I think he generally has liked managing the Dodgers.
Rich: Thanks, Jon. I know that I can speak for millions of Dodgers fan in hoping that Vin stays around forever. He *is* the Dodgers to most of us. It's hard to fathom following the team without him.
A native of Los Angeles, Jon Weisman has been writing about the Dodgers at Dodger Thoughts since 2002. He is the author of 100 Things Dodgers Fans Should Know & Do Before They Die. Weisman began covering sports professionally in 1985, complemented by adventures in writing for and about the screen that have culminated in his current position as a features editor at Variety. Any downtime he can muster will be happily spent with his wife and three young children.
| Touching Bases | April 01, 2010 |
Whose Stuff Plays Up?
Relievers hold several advantages over starters. For one, relievers don't have to worry about pacing themselves. Moreover, they never have to face the same batter twice in one outing. So Steve Treder has determined that throughout history, "reliever ERAs have been consistently better, almost always by a factor of between 5% and 10%" To prove that the difference in ERA is, in fact, a difference in difficulty rather than skill level, you need to find pitchers who have both started and relieved, and compare their performance in each role. Tangotiger has come up with a rule of thumb to quantify what you'd expect if you were to convert a starter to a reliever. "Basically, use the “rule of 17”: difference in BABIP is 17 points higher as starter. K/PA is 17% higher as reliever. And HR per contacted PA is 17% higher as starter. Walk rate is FLAT."
But every pitcher is different. You'll hear every now and then that somebody has a "bullpen mentality." And some are more suited for the bullpen because their stuff "plays up." So I went into my PITCHf/x database and pulled out the pitch-by-pitch data for all 118 pitchers who had thrown at least 100 fastballs as both a starter and a reliever from 2007-2009.
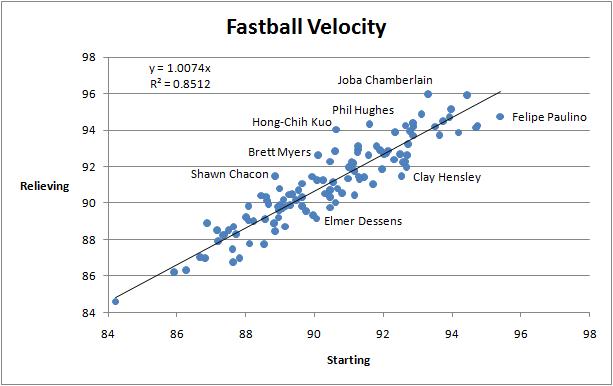
85% of the variance in a pitcher's fastball velocity when he switches roles can be explained by his previous fastball velocity. In general, pitchers add about 0.7 miles per hour to their fastball by making the switch from starter to reliever. But there are exceptions. Hong-Chih Kuo is a true outlier. His fastball has been 3.4 MPH faster in the pen. It's possible that Kuo has built up arm strength since he quit starting a couple years ago. But maybe he was simply more suited for the pen, and the Dodgers found the right position for him. Conversely, Felipe Paulino has pitched to better results as a starter, which could be attributable to his unusual ability to throw harder in that role. As a starter, he's managed to break the 95-MPH threshold with his fastball, which makes him a breakout candidate for 2010, especially considering his career 6.40 ERA vs. 4.23 xFIP.
How about changes in pitching styles? In the bullpen, a pitcher can survive with only two pitches, while starters need to keep extra pitches in their back pocket for the third and fourth times through the order.
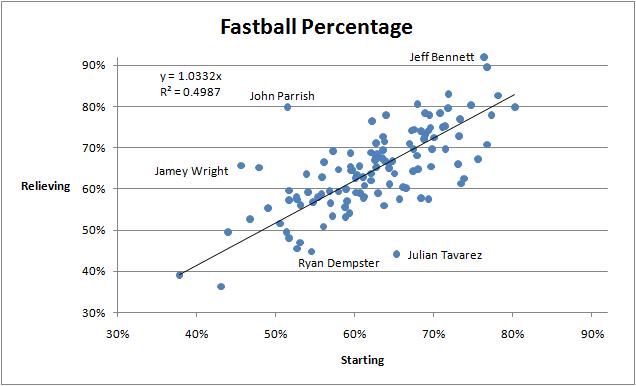
Pitchers throw 3% more fastballs in relief, but there are wide swings depending on the pitcher. I'm still including only pitchers with at least 100 fastballs thrown in both roles, and it takes much longer for fastball rate to stabilize than fastball velocity, so that explains some of the variance. I think that some pitchers throw more breaking balls in the bullpen because they've pick up a platoon advantage. This certainly applies to Julian Tavarez, who has used his breaking balls more often than his fastballs since entering a relief role and becoming something of a ROOGY.
Finally, a Google Motion Chart containing number of pitches, StuffRV/100, fastball percentage, and fastball velocity for the 118 pitchers in my data set.
| Change-Up | April 01, 2010 |
Stakeholders - Milwaukee Brewers
From now through the beginning of the regular season, we will not be posting in-depth round-tables previewing each division like we have in years past. Instead we will feature brief back-and-forths with "stakeholders" from all 30 teams. A collection of bloggers, analysts, mainstream writers and senior front office personnel will join us to discuss a specific team's hopes for 2010. Some will be in-depth, some light, some analytical, some less so but they should all be fun to read and we are thrilled about the lineup of guests we have teed up. Today it's Larry Granillo on the Milwaukee Brewers.
 Patrick Sullivan: Well let me just ask you right off the bat, Larry, what do you make of the 2010 Brewers in comparison to the 2009 club? Last year was fairly tumultuous from a personnel standpoint, most notably evidenced by J.J. Hardy's tenure as a Brewer coming to an end unceremoniously. How's this year's club looking?
Larry Granillo: I don't know exactly what happened with JJ Hardy last year, but it reeks of mismanagement. And, frankly, coming from the Doug Melvin regime, that's incredibly disappointing. Sure, JJ was hitting poorly, but his defense more than made up for it. To top it off, the demotion to Nashville, and the ensuing (blatant) service-time manipulation, wasn't even all that fruitful, as Melvin was only able to turn JJ into Carlos Gomez. I've heard that JJ isn't all that pleased with the Brewers organization these days, and I can't blame him one bit.
As for the rest of the 2010 Brewers, it's hard to say. The offense, despite the loss of Mike Cameron, should be pretty healthy still. When you have Ryan Braun and Prince Fielder hitting back to back for 150+ games a year, that's how things tend to be. But even a high-powered offense is helpless when you have the worst pitching staff in baseball, and the 80-win 2009 Brewers are pretty good proof of that. The 2010 staff isn't all that different - or, at least, isn't all that better talent-wise.
The biggest hope I have for the 2010 Brewers - and I think this is true for a lot of fans - is that the 2009 staff was *so* bad that it's not likely to happen again. So many pitchers had career-worst years - Parra, Bush, Looper, Suppan - that even a little regression to the mean will make the team better. If that does happen, and Braun and Fielder keep hitting the hide off the ball, then an 85-87 win season doesn't seem all that crazy. And, in this division, that might be all that they need.
PS: How good is Yovani Gallardo? How good do the Brewers need him to be in order to contend for post-season play?
LG: The one bright spot in the 2009 Brewers' rotation was the young ace, Yovani Gallardo. He pitched brilliantly in the first half, including being a major part of one of the best games I've ever seen live, but faded in the second-half. He tends to overthrow the ball at times, as young power pitchers are wont to do, and that takes its toll in the form of increased walks and high pitch counts. He'll have to learn to control that as he matures if he wants to be the superstar that we all know is in him. Luckily for us, he is only 24 years old.
How good is Yovani Gallardo? Let's just say that the Brewers aren't too far away from having two homegrown, legitimate MVP contenders and one homegrown, legitimate Cy Young contender playing together every year. I can't wait.
PS: What do you think Milwaukee's best shot at the playoffs is? Will it be easier to snag the Wild Card or to somehow catch St. Louis in a light-looking NL Central?
LG: Neither is much of a given, or even all that likely, but I'd have to say that catching the Cardinals is the Crew's best shot at the 2010 playoffs. The Cards took the division last year with 91 victories, and that was with Cy Young-caliber seasons from their top two pitchers and some memorable years by a few role players/rookies. And though I consider them (easily) the best team in the Central, I don't see them matching that total this year. It's entirely possible that an 86- or 88-win team could win this division. The Wild Card is bound to be more competitive than that.
PS: Try and put into perspective for Milwaukee fans and fans of other clubs just how good of a hitting pair Ryan Braun and Prince Fieder make. I mean, it's bordering on historic, wouldn't you say?
LG: I try to steer clear of words like "historic" just because I don't trust my own biases, but Prince and Braun are something, aren't they? The best thing about watching these two play everyday is just how consistent they are. You might see them pressing a bit in the occasional at-bat (those Miller Park fences look awfully close at times), but, for the most part, they keep true to the same approach day-in and day-out. There's no doubt in my mind that it helps the club win more games. I wouldn't say the Prince/Braun combo is on par with the likes of Griffey/A-Rod or Aaron/Matthews yet, but a duo like this comes along very rarely and we Brewers fans are lucky to see it. (Maybe they're a power-hitting version of the 1970s Yount/Molitor pair?)
PS: What are your expectations for Rickie Weeks?
LG: Sadly, this could be the 3rd year in a row you've asked that question, and I wouldn't realize it. There's a lot to like about Rickie Weeks, and his recent track-record seems to show an improving ballplayer. The optimism and loyalty the Brewers have shown him is definitely grounded in something.
He's also coming off his second wrist injury in the last three years (one on each wrist), and we all know how dangerous those can be. When it comes to Rickie Weeks, you have to remember this: an injury-plagued, 40-game season seems to be about as likely as an All-Star caliber campaign. Of course, with this being his age-27 season, the Brewers' loyalty to Rickie could be running out here in 2010. Maybe he can use that as a motivator.
PS: Talk a little more about some of the new regulars for the Brew Crew. I have four players in mind. How do you feel about Alcides Escobar, Carlos Gomez, Randy Wolf and Doug Davis? Comment on the Brewers' catching, too, if you would. Can't get worse than Jason Kendall, right?
LG: I'm pretty stoked about the Escobar era. The kid can flash some leather (though it should be noted that JJ wasn't exactly Adam Dunn out there). I'm not convinced that his bat will translate to the major league level all that well, but there is some potential there. The defense is the key, though. When you're pitching stinks, it's always nice to have someone who knows how to field the ball playing behind you.
Same goes for Gomez. His defense is great and will make the pitching staff better, but his bat has a long way to go. I will say this: I was disappointed when the Brewers traded JJ Hardy straight-up to the Twins for Gomez. I was disappointed when the club made it clear that they would not re-sign Mike Cameron. But I was never disappointed that Carlos Gomez is on the team. Now we just have to hope that he can improve that hitting a bit.
The biggest positive that the JJ-for-Gomez trade gave the Brewers was the $10 million the club saved by making Gomez the starting CF. Of course, they then went out and spent that money on the 33-yr old Randy Wolf who was coming off a career-year in Dodger Stadium. It's probably not the best signing, but, given the club's position and the lack of quality pitchers on the market, it was probably the best move they could make. He should help give the team some stability in the middle of the rotation.
As will Doug Davis. Davis is no one's idea of top-of-the-rotation pitcher, but he's a middle-of-the-pack innings eater. That'll make a difference with this staff. The biggest positive about the Wolf and Davis signings, though, is that they each mean fewer starts by the likes of Braden Looper (cut) and Jeff Suppan (on the "disabled" list and in danger of being cut). As I said before, that just may be enough for the 2010 Brewers.
PS: Thanks a lot, Larry!
Larry Granillo lives in Milwaukee and writes slightly-too-long posts about Charlie Brown, batting helmets, and Opening Day at the blog Wezen-Ball.com. He can be found on Twitter at @wezen_ball.