Rich Lederer • Baseball Beat
Patrick Sullivan • Change-Up
Jeremy Greenhouse • Touching Bases
Dave Allen • F/X Visualizations
Sky Andrecheck • Behind the Scoreboard
Marc Hulet • Around the Minors
Al Doyle • Past Times
Retired Uniforms:
Bryan Smith • WTNY
Joe Sheehan • Command Post
Jeff Albert • The Batter's Eye
RSS Feed
Home
*Examining the Past, Present, and Future*
Lineup Card
Recent Entries
» Putting Together a Reality Team
» Historical Hall of Fame Vote Comparisons: 2012
» An All-Christmas Team
» The New-Look Angels
» John Denny: The Forgotten Cy Young Award Winner
» Money Isn't Everything
» What Would It Take to Hit .400 in the 21st Century?
» Halos Heaven
» Brandon McCarthy's Breakout Season
» Link-o-Rama
» Historical Hall of Fame Vote Comparisons: 2012
» An All-Christmas Team
» The New-Look Angels
» John Denny: The Forgotten Cy Young Award Winner
» Money Isn't Everything
» What Would It Take to Hit .400 in the 21st Century?
» Halos Heaven
» Brandon McCarthy's Breakout Season
» Link-o-Rama
Best of Baseball Beat
Abstracts From the Abstracts
1977 Baseball Abstract
1978 Baseball Abstract
1979 Baseball Abstract
1980 Baseball Abstract
1981 Baseball Abstract
1982 Baseball Abstract
1983 Baseball Abstract
1984 Baseball Abstract
1985 Baseball Abstract
1986 Baseball Abstract
1987 Baseball Abstract
1988 Baseball Abstract
1978 Baseball Abstract
1979 Baseball Abstract
1980 Baseball Abstract
1981 Baseball Abstract
1982 Baseball Abstract
1983 Baseball Abstract
1984 Baseball Abstract
1985 Baseball Abstract
1986 Baseball Abstract
1987 Baseball Abstract
1988 Baseball Abstract
Bert Blyleven Series
Meeting Up and Hanging Out with Bert
The Results Are In And...
Aficionado Heavily Invested in Blyleven
Latest on Blyleven's Chances for the HOF
The Internet Zealot Responds
400 Down and 5 to Go...
Bert Be Home By Eleven?
Blyleven's Forgotten Season (1973)
HeyMan, Your Comments Don't Hold Water
The Waiting is the Hardest Part
Another Addition to the Blyleven Series
Search for the Truth
As Dominant as His HOF Contemporaries
Listen, Buster
A Larger Step for Blyleven
Answering the Naysayers (Part Two)
Another Small Step for Blyleven
Q&A: Blyleven on the Twins
The Majority Rules, Right?
It's All Dutch to Some
The Hall of Fame Case for Bert Blyleven
Q&A: Blyleven on Felix Hernandez
Clemens Rocketing Up Charts
Poz: An Interview With a KC Star
A HOF Chat with Tracy Ringolsby
Up Close and Personal
A Peek Into the Mind of a HOF Voter
Answering the Naysayers
It's That Time of the Year (Again)
"If Cooperstown is Calling..."
The Bert Alert
One Small Step for Blyleven...
Only the Lonely
Exclusive Interviews
Lee Sinins
Alex Belth
David Pinto
Will Carroll
Mike Carminati
Aaron Gleeman
Joe Sheehan
Jay Jaffe
Jeff Peek
Tracy Ringolsby
Joe Posnanski
Bill James Part I, II, III
Jon Lalonde
Chuck Tiffany
Dayn Perry
Fay Vincent
Nate Silver
Alex Belth
David Pinto
Will Carroll
Mike Carminati
Aaron Gleeman
Joe Sheehan
Jay Jaffe
Jeff Peek
Tracy Ringolsby
Joe Posnanski
Bill James Part I, II, III
Jon Lalonde
Chuck Tiffany
Dayn Perry
Fay Vincent
Nate Silver
Bullpen
Rich Lederer
The Odd Couple (with Alex Belth)
The MostUnder Over Underrated Player in Baseball (with Brian Gunn)
Three Wise Men (roundtable by Alex Belth)
Infrequently Asked Questions (interview with Matt Welch)
Interview (Orioles Think Tank)
Bernie and the Yanks (Bronx Banter)
Hope and Faith: How the LAA Win the World Series (Baseball Prospectus)
NL West (The Soul of Baseball)
Greatest Living Hitter? (Sports Illustrated)
Roundtable: 2008 HOF Ballot (Armchair GM)
The Most
Three Wise Men (roundtable by Alex Belth)
Infrequently Asked Questions (interview with Matt Welch)
Interview (Orioles Think Tank)
Bernie and the Yanks (Bronx Banter)
Hope and Faith: How the LAA Win the World Series (Baseball Prospectus)
NL West (The Soul of Baseball)
Greatest Living Hitter? (Sports Illustrated)
Roundtable: 2008 HOF Ballot (Armchair GM)
Patrick Sullivan
Designated Hitters
David Bromberg (Q&A: John Denny)
Mark Armour (H. Killebrew and Versatility)
Joe Lederer (Soundtrack of a Prospect)
David Bromberg (Clemente's Autograph)
David Bromberg (Woody Fryman)
D. Baumstein (WAR Against Age: Pitchers)
Doug Baumstein (The WAR Against Age)
Doug Baumstein (A Lifetime on the Road)
John Fraser (Pick Six)
Mark Armour (How to Score More Runs?)
Bill Parker (What Opening Day Tells Us)
Stan Opdyke (Pat Rispole)
Chris Jaffe (Evaluating Baseball's Mgrs)
Stan Opdyke (Baseball Radio in NYC, 1953)
A. Nathan (Performance of Baseball Bats)
Michael Weddell (Edgar Martinez/HOF)
Jon Weisman (100 Things Dodgers Fans...)
Stan Opdyke (Connie Mack and Vin Scully)
Eric Walker (Evaluating Run Production)
Brent Mayne (The Intangibles of Catching)
Chris Moore (Best Fastballs in Baseball)
Dave Baldwin (The Batter’s Brain)
Shawn Haviland (Ivy League to MLB)
Larry Granillo (Walking Off)
Rob Iracane (Solo HR Won't Break You)
Tommy Bennett (Charm of AM Radio)
Harry Pavlidis (Johan Santana's Fast Start)
John Walsh (WAR and Remembrance)
Eric Walker (Precisely Inaccurate)
Bob Timmermann (As They See 'Em)
Geoff Young (Unicycles and Delusions)
Baseball Analysis at Tufts (Groundballers)
Baseball Analysis at Tufts (GB Out Rates)
G. Rybarczyk ('09 Hit Tracker Projections)
Joe Lederer (Curt Schilling/HoF)
Conor Gallagher (Hall of Fallacies)
Chris Green (Jim Rice, HoF, the Numbers)
Shawn Hoffman (Baseball's Bear Mkt?)
Paul Anthony (Manny Syndrome)
Ross Roley (World Series Odds)
B. Timmermann (Catcher's Interference)
R.J. Anderson (Waiting the Hardest Part)
Maury Brown (Cubs, MLB, and Cuban...)
Myron Logan (Dee-Fense, Dee-Fense)
Craig Calcaterra (Frivolity, Part I, Part II)
Chad Finn (Ode to Baseball Cards)
David Cameron (Mariners Foibles)
Chris Dial (Chipper Jones)
Pat Lederer (Memory Lane)
David Appelman (Clutch Pitching)
Bob Rittner (DH)
Jonathan Mayo (Roger Clemens)
Lisa Winston (My Son-in-Law...)
Russ McQueen (The Yellow Hammer)
Bob Rittner (I'm OK, You're OK)
Mark Armour (In Defense of the HOF)
Pat Jordan (Friends)
Dan Levitt (Analysis of Terry Ryan)
Doug Baumstein (Trading Econ 101)
Ross Roley (Runner's Reluctance II)
Ross Roley (Runner's Reluctance I)
Mark Armour (No-Longer Lovable Sox)
Bruce Regal (Stealthy and Wise)
Brian Gunn (Roid Monster)
Current/McEvoy (Value of the SB)
John Rickert (Sinister Thefts)
Nate Silver (Sabermetrics)
David Vincent (Home Run Production)
Joe P. Sheehan (Enhanced Gameday II)
Mark Armour (An Ode to Sport)
David Gassko (All-Time Worm Burners)
Joe P. Sheehan (Enhanced Gameday)
John Walsh (When Titans Clash)
Fox/Williams (Quantifying Coaches II)
Fox/Williams (Quantifying Coaches I)
Jacob Luft (Bull Durham Rant)
Chad Finn (Strat-O-Matic)
Lisa Winston (Rotisserie Baseball)
Dave Studeman (Baseball Stats)
Steve Treder (Roger Craig)
Marc Normandin (Jeff Bagwell)
D. Appelman (Expanding Strike Zone)
Jeff Sackmann (Worst MiL Defenders)
Jeff Sackmann (Best MiL Defenders)
Maxwell Kates (Van Lingle Mungo)
David Appelman (Pitch Location)
Kent Bonham (Danny Ray Herrera)
Glenn Stout (Two Baseball Poems)
Bruce Regal (The Challenge Round)
Mark Lamster (Barry & Ty)
Geoff Young (NL West)
Tom Lederer (The Ryan Express)
Brian Erts (Great Leap Forward)
David Pinto (Parity and the N.L.)
Jacob Luft (Fathers and Daughters)
Jamey Newberg (Pete's Sake)
Jeff Albert (A. Jones Swing Analysis)
Jeff Albert (A-Rod Swing Analysis)
Keith Law (Death, Taxes, and Waivers)
Peter Abraham (Tales of Torre Tales)
Larry Borowsky (Let 'er Rip II)
Dan Levitt (Empirical Analysis of Bunting)
Jonah Keri (If I Met Warren Cromartie...)
Bob Klapisch (War Stories)
Bob Timmermann (John F. Kennedy HS)
Kent Bonham (Aluminum Adjustments)
Al Doyle (More Than Superstars)
Ross Roley (Instant Replay)
David Vincent (Barry Bonds Homers)
Chad Finn (Our Favorite Obscurities)
Bill Deane (1979 NL MVP)
Mark Armour (Rise/Fall of Artificial Turf)
Jeff Angus (Wally Moon Camp)
David Berri (Money and Baseball)
Larry Borowsky (Baseball w/o the #s)
Derek Zumsteg (The Irrational Market)
David Regan (Free Agent Contracts)
Peter Schmuck (Steroids and the HOF)
David Appelman (Pitchers, Pitch by Pitch)
Dan Fox (Swinging, Taking, Fouling, Etc)
Patrick Sullivan (Study of NYY CF/BOS LF)
Will Leitch (Baseball Journalism)
Jeff Sullivan (Pitcher Release Points)
Steve Treder ('69-'70 Giants)
Maury Brown (Charlie Finley)
John Brattain (Bob Johnson)
Bob Klapisch (The Case for Bert Blyleven)
Jeff Peek (Pride and Prejudice)
Dayn Perry (Bert and Warren)
Rob Neyer (If Don Sutton Was Great...)
Lisa Winston (Minor League Memories)
Alex Belth (Otis Redding Was Right)
David Cameron (Long Live the King)
Jeff Angus (Baserunning Study)
Bert Blyleven (Baseball Playoffs)
Boyd Nation (Not a Prospect List)
James Click (Batters-Baserunners Study)
Jeff Shaw (Why I Love Baseball)
David Gassko (BIP/BFP Fielding Study)
Jay Jaffe (Milwaukee Sausage Race)
Jamey Newberg (Remember When)
Bob Klapisch (Press Box to the Mound)
Dan Levitt (Predictive Value of BB)
David Vincent (Official Scorer)
Jon Weisman (Rick Monday)
Larry Borowsky (Let 'er Rip)
Will Carroll (Fictional Short Story)
Bob Timmermann (Japanese Baseball)
Cyril Morong (Best Pitching Seasons)
Sean Forman (Monte Carlo Win-Loss)
Brian Gunn (My Little Blue Book)
Joe Lederer (My Dad and Baseball)
Bill Deane (Bob Gibson, 1968)
Mark Armour (1977 Yankees)
Darren Viola (Retrosheet)
David Pinto (RFK)
Dayn Perry (Brave Heart)
Matt Welch (Dave Hansen)
Kevin Kernan (Jack McKeon)
Tom Lederer (Dodgers Road Trip)
Steve Lombardi (Slider)
Studes (Picturing Baseball)
Mike Carminati (Luck of the Drawl)
Eric Neel (Vin Scully)
J.C. Bradbury (Leo Mazzone)
John Sickels (Bill James)
Search Baseball Analysts
Archives
By Category:
Around the Majors Content Only
Around the Minors Content Only
Baseball Beat Content Only
Baseball Beat/Change-Up Content Only
Baseball Beat/WTNY Content Only
Behind the Scoreboard Content Only
Change-Up Content Only
Change-Up/Around the Majors Content Only
Command Post Content Only
Crunching the Numbers Content Only
Designated Hitter Content Only
F/X Visualizations Content Only
Past Times Content Only
Saber Talk Content Only
The Batter's Eye Content Only
Touching Bases Content Only
Weekend Blog Content Only
WTNY Content Only
By Month:
February 2012
January 2012
December 2011
October 2011
September 2011
August 2011
July 2011
June 2011
May 2011
April 2011
March 2011
February 2011
January 2011
December 2010
November 2010
October 2010
September 2010
August 2010
July 2010
June 2010
May 2010
April 2010
March 2010
February 2010
January 2010
December 2009
November 2009
October 2009
September 2009
August 2009
July 2009
June 2009
May 2009
April 2009
March 2009
February 2009
January 2009
December 2008
November 2008
October 2008
September 2008
August 2008
July 2008
June 2008
May 2008
April 2008
March 2008
February 2008
January 2008
December 2007
November 2007
October 2007
September 2007
August 2007
July 2007
June 2007
May 2007
April 2007
March 2007
February 2007
January 2007
December 2006
November 2006
October 2006
September 2006
August 2006
July 2006
June 2006
May 2006
April 2006
March 2006
February 2006
January 2006
December 2005
November 2005
October 2005
September 2005
August 2005
July 2005
June 2005
May 2005
April 2005
March 2005
February 2005
January 2005
December 2004
November 2004
October 2004
September 2004
August 2004
July 2004
June 2004
May 2004
April 2004
March 2004
February 2004
January 2004
December 2003
November 2003
October 2003
September 2003
August 2003
July 2003
June 2003
Reference
Organizational Stats
Arizona Diamondbacks Bat / Pitch
Atlanta Braves Bat / Pitch
Baltimore Orioles Bat / Pitch
Boston Red Sox Bat / Pitch
Chicago Cubs Bat / Pitch
Chicago White Sox Bat / Pitch
Cincinnati Reds Bat / Pitch
Cleveland Indians Bat / Pitch
Colorado Rockies Bat / Pitch
Detroit Tigers Bat / Pitch
Florida Marlins Bat / Pitch
Houston Astros Bat / Pitch
Kansas City Royals Bat / Pitch
Los Angeles Angels Bat / Pitch
Los Angeles Dodgers Bat / Pitch
Milwaukee Brewers Bat / Pitch
Minnesota Twins Bat / Pitch
New York Mets Bat / Pitch
New York Yankees Bat / Pitch
Oakland Athletics Bat / Pitch
Philadelphia Phillies Bat / Pitch
Pittsburgh Pirates Bat / Pitch
St. Louis Cardinals Bat / Pitch
San Diego Padres Bat / Pitch
San Francisco Giants Bat / Pitch
Seattle Mariners Bat / Pitch
Tampa Bay Devil Rays Bat / Pitch
Texas Rangers Bat / Pitch
Toronto Blue Jays Bat / Pitch
Washington Nationals Bat / Pitch
All-Star Links
Official Websites
News and Notes
Baseball News Blog
Baseball Newstand
ESPN Baseball
Fox Sports Baseball
Pro Sports Daily
Roto World
The Roto Times
USA Today Baseball
Baseball Newstand
ESPN Baseball
Fox Sports Baseball
Pro Sports Daily
Roto World
The Roto Times
USA Today Baseball
Reference and Analysis
Baseball Almanac
Baseball America
Baseball Archive
Baseball Contracts
Baseball Cube
Baseball Graphs
Baseball Library
Baseball Musings Player Database
Baseball Page
Baseball Primer
Baseball Prospectus
Baseball Reference
Baseball Statistics
Baseball Truth
Boxscore Central
Diamond Mind Baseball
Doug's Stats
FanGraphs
Fast Balls (pitchfx catalog)
Hardball Dollars
Hardball Times
Hit Tracker
Retrosheet
Rotobase/Rotoblog
Stat Corner
STATS
Tango on Baseball
Yahoo Sports MLB
Web Gems
Bill James Primer
Sabermetric Manifesto (Grabiner)
Pitching and Defense (McCracken)
Pitching and Defense (Tippett)
Transactions Primer (Neyer)
Baseball Stats (Batter's Box)
Prospect Report (Cameron)
Pitcher Workloads (Sheehan)
Goodbye to Old Baseball Ideas (Rickey)
Sabermetric Manifesto (Grabiner)
Pitching and Defense (McCracken)
Pitching and Defense (Tippett)
Transactions Primer (Neyer)
Baseball Stats (Batter's Box)
Prospect Report (Cameron)
Pitcher Workloads (Sheehan)
Goodbye to Old Baseball Ideas (Rickey)
Columnists
Baseball Blogs
Around the Majors
Athletics Nation
Baseball Crank
Baseball Musings
Baseball-Reference Blog
Batter's Box
Big League Stew
Bronx Banter
Catfish Stew
Cub Town
Dan Agonistes
Dodger Thoughts
DRays Bay
Ducksnorts
Futility Infielder
Halos Heaven
Inside the Rockies
It Might Be Dangerous
Knuckle Curve
LoHud Yankees Blog
Lookout Landing
Management by Baseball
Metaforian
Metsgeek
Mike's Baseball Rants
Only Baseball Matters
Redbird Nation
Red Reporter
Sabernomics (Braves)
Seth Speaks
ShysterBall
6-4-2 (Angels/Dodgers)
The Book
TheCubdom
The Cutting Edge
The House That Dewey Built
The View From The Bleachers
Tiger Blog
U.S.S. Mariner
Viva El Birdos
Where's Kernan
Minor Leagues
Arizona Fall League
BA Player Finder
Cal Leaguers
Jamey Newberg
JDM's Scoresheet Baseball
Minor League Baseball
Minor League Park Factors
Minor League Splits
No Pepper
Sickels' Minor League Ball
Warm October Nights
BA Player Finder
Cal Leaguers
Jamey Newberg
JDM's Scoresheet Baseball
Minor League Baseball
Minor League Park Factors
Minor League Splits
No Pepper
Sickels' Minor League Ball
Warm October Nights
Amateur
Boyd's World (College)
Cape Cod Baseball League
College Baseball Blog
College Baseball Insider
Collegiate Baseball Newspaper
College Splits
College Splits Blog
Dirtbags Baseball (Long Beach State)
NCAA Baseball
NCBWA
Team One Baseball (High School)
Texas A&M & Baseball
Cape Cod Baseball League
College Baseball Blog
College Baseball Insider
Collegiate Baseball Newspaper
College Splits
College Splits Blog
Dirtbags Baseball (Long Beach State)
NCAA Baseball
NCBWA
Team One Baseball (High School)
Texas A&M & Baseball
Historical
Cuban Baseball
House of David
Jim "Mudcat" Grant's Web Page
Negro League Baseball Players Assoc
Negro Leagues Baseball Museum
1919 Black Sox
Pacific Coast League
Philadelphia Athletics Historical Society
Shoeless Joe Jackson Society
SABR-L Archives
Walter O'Malley
House of David
Jim "Mudcat" Grant's Web Page
Negro League Baseball Players Assoc
Negro Leagues Baseball Museum
1919 Black Sox
Pacific Coast League
Philadelphia Athletics Historical Society
Shoeless Joe Jackson Society
SABR-L Archives
Walter O'Malley
Miscellaneous
Forums
Credits
Ticket Center
Tickets to Baseball -
Premium Red Sox Tickets - Tickets to Marlins Games - Cardinals Game Tickets - NY Yankee Tickets - Tickets Oakland Athletics - Dallas Cowboys Tickets - Arizona Cardinals Tickets - Tickets Seattle Seahawks - Buffalo Bills Tickets Online - Tickets to Dolphins Football
Buy Boston Red Sox tickets,
Philadelphia Phillies tix,
NY Yankees tickets,
NY Mets tickets, and
MLB All Star game tickets at ABC tickets
Not sure where to find the best online sportsbooks? Start your search with PlayersJet.
Get deals at SportsMemorabilia.com on baseball apparel, including Phillies jerseys and more for adults and children.
Shop the largest selection baseball equipment on sale at Sports Unlimited. Check out tons of baseball gloves, youth baseball gloves and catchers gear from Rawlings, Wilson, Nike & Under Armour.
2011 Draft Order
Courtesy of Baseball America
First-Round:
 1. Pirates (57-105)
 2. Mariners (61-101)
 3. Diamondbacks (65-97)
 4. Orioles (66-96)
 5. Royals (67-95)
 6. Nationals (69-93)
 7. Diamondbacks (for B. Loux)
 8. Indians (69-93)
 9. Cubs (75-87)
10. Padres (for Karsten Whitson)
11. Astros (76-86)
12. Brewers (77-85)
13. Mets (79-83)
14. Marlins (80-82)
15. Brewers (for Dylan Covey)
16. Dodgers (80-82)
17. Angels (80-82)
18. Athletics (81-81)
19. Red Sox (from DET for Martinez)
20. Rockies (83-79)
21. Blue Jays (85-77)
22. Cardinals (86-76)
23. Nationals (from CWS for Dunn)
24. Rays (from BOS for Crawford)
25. Padres (90-72)
26. Red Sox (from TEX for Beltre)
27. Reds (91-71)
28. Braves (91-71)
29. Giants (92-70)
30. Twins (94-68)
31. Rays (from NYY for Soriano)
32. Rays (96-66)
33. Rangers (from PHI for Lee)
Supplemental First Round:
34. Nationals (Dunn)
35. Blue Jays (Downs)
36. Red Sox (Martinez)
37. Rangers (Lee)
38. Rays (Crawford)
39. Phillies (Werth)
40. Red Sox (Beltre)
41. Rays (Soriano)
42. Rays (Balfour)
43. Diamondbacks (LaRoche)
44. Mets (Feliciano)
45. Rockies (Dotel)
46. Blue Jays (Buck)
47. White Sox (Putz)
48. Padres (Garland)
49. Giants (Uribe)
50. Twins (Hudson)
51. Yankees (Vazquez)
52. Rays (Benoit)
53. Blue Jays (Olivo)
54. Padres (Torrealba)
55. Twins (Crain)
56. Rays (Choate)
57. Blue Jays (Gregg)
58. Padres (Correia)
59. Rays (Hawpe)
| Baseball Beat | January 31, 2007 |
Categorizing Minor League Pitchers: Part Three - High-A
Part One: The Starters
Part Two: Low-A
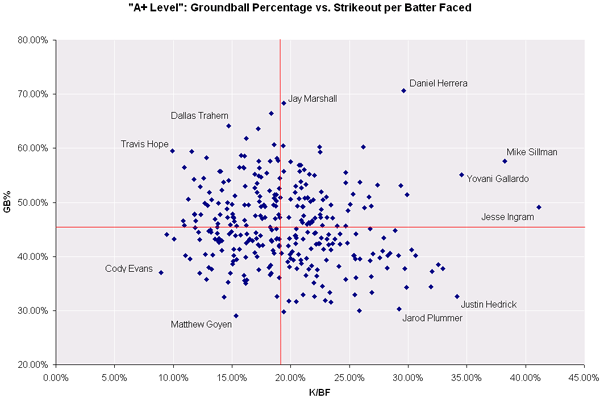
Continuing our tour of the minor leagues categorizing pitchers by strikeout and groundball rates, we focus on High-A (also known as A+) today. High-A comprises three leagues: California, Carolina, and Florida State.
According to Mike Hollman of Inside the Warehouse, the 2006 pitching means for the three leagues were as follows:
                  STARTERS                       RELIEVERS
         ERA    K/9    BB/9    HR/9  |   ERA    K/9    BB/9    HR/9
CAL     4.81   7.36    3.32    0.87     4.40   8.06    3.97    0.75
CAR     4.13   6.58    3.41    0.72     3.90   7.46    3.94    0.64
FSL     3.82   7.04    3.05    0.68     3.82   8.07    3.12    0.69
The ERAs in the Florida State League are lower than the Carolina and California Leagues. The latter has the highest ERAs and HR/9 rates. Relief pitchers, not surprisingly, had lower ERAs and HR/9 rates as well as a higher K/9 across the board. The key takeaway is that the CAL is more of a hitter's paradise and is not as pitcher friendly as the CAR and FSL.
The graph below includes strikeout and groundball data for every pitcher in High-A with 50 or more innings. The x-axis is strikeouts per batter faced (K/BF) and the y-axis is groundball percentage (GB%). The graph is divided into four quadrants with the mid-point equal to the average K/BF of 19.10% and the average GB% of 45.79%.
As a reminder, the northeast quadrant is comprised of pitchers with above-average strikeout and groundball rates; the southeast quadrant encompasses pitchers with above-average strikeout and below-average groundball rates; the northwest quadrant is made up of pitchers with above-average groundball and below-average strikeout rates; and the southwest quadrant is the home for pitchers with below-average strikeout and groundball rates.
There were 64 pitchers (out of 317 qualified) that landed in the northeast quadrant. The following table lists the top half, sorted by K/BF.
NORTHEAST QUADRANT (ABOVE-AVG K AND GB RATES)
PITCHER            TEAM   LG    K/BF     GB%
Jesse Ingram       TEX    CAL   41.13%   49.14%
Mike Sillman       STL    FSL   38.22%   57.63%
Yovani Gallardo    MIL    FSL   34.56%   55.06%
Mark Rogers        MIL    FSL   29.91%   51.41%
Daniel Herrera     TEX    CAL   29.61%   70.68%
Fernando Hernandez CWS    CAR   29.35%   53.05%
Franklin Morales   COL    CAL   27.37%   53.18%
Daniel Powers      MIN    FSL   26.84%   49.36%
J. P. Martinez     MIN    FSL   26.67%   51.01%
Manny Parra        MIL    FSL   26.29%   48.95%
Samuel Deduno      COL    CAL   26.18%   60.26%
Sean Gallagher     CHN    FSL   25.89%   53.70%
Joseph Bisenius    PHI    FSL   25.31%   51.52%
John Bannister     TEX    CAL   25.06%   49.64%
Justin Thomas      SEA    CAL   24.89%   48.47%
Aaron Trolia       SEA    CAL   24.69%   55.56%
Nick Pereira       SF     CAL   24.68%   53.60%
Kevin Lynch        LAA    CAL   23.56%   47.10%
Reid Santos        CLE    CAR   23.43%   49.49%
Rodrigo Escobar    HOU    CAR   23.10%   47.19%
Joshua Schmidt     NYY    FSL   23.02%   51.03%
Nick Debarr        TB     CAL   22.76%   50.51%
Robert Rohrbaugh   SEA    CAL   22.60%   48.72%
Ryan Schroyer      BOS    CAR   22.58%   51.97%
Zachary Hammes     LAD    FSL   22.56%   47.19%
Jonathan Barratt   TB     CAL   22.52%   47.76%
Jesse Litsch       TOR    FSL   22.50%   59.34%
Jose Garcia        FLA    FSL   22.44%   60.22%
Paul Kometani      TEX    CAL   22.05%   47.06%
Billy Buckner      KC     CAL   22.02%   54.96%
Jimmy Barthmaier   HOU    CAR   21.93%   50.49%
Edwin Vera         TEX    CAL   21.83%   46.55%
As detailed in the opening article on starters, Yovani Gallardo, Franklin Morales, Samuel Deduno, and Sean Gallagher all qualified for the 25-50 club (25% K/BF and 50% GB rate). Mark Rogers, who turned 21 yesterday, also made the 25-50 club. The fifth overall pick in the 2004 draft has a high ceiling but one that may never be reached. The 6-foot-2, 205-pound RHP underwent shoulder surgery in January and will miss the 2007 season.
John Bannister (25.06%/49.64%) and Justin Thomas (24.89%/48.47%), both 23, barely missed as did Nick Pereira (24.68%/53.60%), 24, who succeeded at A+ (7-1, 2.06) but was overmatched upon his promotion to AA where his K and GB rates dropped and his H, HR, and BB skyrocketed.
Although Jesse Ingram dominated CAL opponents (6-0, 2.43), the 24-year-old reliever didn't fare nearly as well after he received the phone call to join AA Frisco in the Texas League (3-2, 5.21) and was horrible in the Arizona Fall League (0-0, 12.41 with 19 H, 17 ER, 7 BB, and 6 SO in 12.1 IP).
Mike Sillman went 4-3 and recorded 35 saves with a 1.10 ERA. Keep in mind, however, that the former Cornhusker turned 25 in December and has not pitched a single inning above A+. It's difficult to say how well the righthanded submariner will perform against better competition as he advances through the Cardinals' system.
Kent Bonham wrote a guest column last October on Danny Ray Herrera. The diminutive (5'8", 145) LHP pitcher out of New Mexico had a phenomenal season last year as a junior in college and in his professional debut in the Arizona and California Leagues. Herrera had a 2.86 ground outs/air outs ratio at the University of New Mexico, then had the highest GB rate (70.68%) in A+ after he signed with the Texas Rangers. Oh, the 45th-round draft pick recorded a MiLB ERA of 1.45 over 62 IP without allowing a single home run.
Seventy-nine pitchers fell into the southeast quadrant. The top 40 are listed in the following table.
SOUTHEAST QUADRANT (ABOVE-AVG K AND BELOW-AVG GB RATES)
PITCHER            TEAM   LG    K/BF     GB%
Justin Hedrick     SF     CAL   34.16%   32.64%
Jose Arredondo     LAA    CAL   32.95%   37.75%
Brian Anderson     SF     CAL   32.57%   38.51%
Matthew Scherer    STL    FSL   32.05%   37.21%
Kevin Whelan       NYY    FSL   31.94%   34.43%
Juan Ovalles       WAS    CAR   30.65%   40.13%
Kevin Slowey       MIN    FSL   30.28%   41.18%
Harvey Garcia      FLA    FSL   29.86%   34.34%
Jose Mijares       MIN    FSL   29.73%   37.74%
Jarod Plummer      KC     CAL   29.23%   30.30%
Dennis Dove        STL    FSL   29.17%   40.15%
Scott Elbert       LAD    FSL   28.87%   44.83%
Radhames Liz       BAL    CAR   28.44%   40.61%
Bo Hall            MIL    FSL   28.25%   40.17%
Donald Veal        CHN    FSL   28.21%   37.84%
Homer Bailey       CIN    FSL   27.92%   43.48%
Scott Lewis        CLE    CAR   27.83%   41.02%
Kyle Wilson        LAD    FSL   27.57%   39.74%
Elvys Quezada      NYY    FSL   26.98%   40.54%
Adalberto Mendez   CHN    FSL   26.89%   33.33%
Milton Tavarez     TOR    FSL   26.86%   36.24%
Matt Daley         COL    CAL   26.78%   45.13%
Ricky Romero       TOR    FSL   26.75%   39.24%
Daniel Core        TOR    FSL   25.89%   39.53%
Michael Megrew     LAD    FSL   25.83%   30.00%
Brett Wayne        TB     CAL   25.54%   36.11%
Robert Hinton      MIL    FSL   25.54%   44.19%
Eric Hurley        TEX    CAL   25.48%   39.58%
Jim Henderson      WAS    CAR   25.45%   32.88%
Alberto Bastardo   LAD    FSL   25.42%   40.22%
Matt Farnum        TEX    CAL   25.35%   40.14%
James Happ         PHI    FSL   24.84%   42.53%
Johnny Cueto       CIN    FSL   24.70%   35.76%
Alexander Hinshaw  SF     CAL   24.68%   45.60%
Kyle Stutes        SD     CAL   24.17%   44.16%
Troy Patton        HOU    CAR   24.17%   42.27%
Ben Stanczyk       MIL    FSL   24.12%   38.21%
Chris Schutt       MIN    FSL   23.97%   45.61%
Garrett Olson      BAL    CAR   23.77%   43.22%
Alan Horne         NYY    FSL   23.55%   42.37%
Jose Arredondo and Kevin Slowey, both of whom turn 23 this spring, struck out over 30% of the batters they faced in A+. Arredondo (6'0", 170) impressed in the hitter friendly CAL League (2.30 ERA w/ 11.5 K/9, 6.2 H/9, and 0.40 HR/9) but got lit up at AA Arkansas in the Texas League (6.53 ERA, 1.68 WHIP). The 6-foot-3, 190-pound Slowey is as polished as they come. He has plus-plus major league command of his fastball. If you believe in the power of stats, then you have to love the pride of Winthrop University. The RHP has pitched 220.2 minor league innings with a 1.96 ERA, 0.80 WHIP, and a 7.8:1 K/BB ratio.
Other notables include Scott Elbert, Radhames Liz, Donald Veal, Homer Bailey, and Scott Lewis. Elbert, 21, held Florida State and Southern League opponents to 6 H/9 in 146 combined IP while whiffing 173. However, the 6-2, 190-pound LHP gave up 9 HR in 32.1 IP at home in Jacksonville. He needs to improve his control (MiL career 4.99 BB/9) to reach his full potential.
Liz, who turns 24 in June, will likely start at AA again after struggling upon a mid-season promotion for the second year in a row. The 6-2, 170-pound RHP with a mid-90s fastball, may wind up as a reliever if he doesn't "learn" how to pitch.
The 22-year-old Veal made a smooth transition from Low-A (29.55%/34.52%) to High-A (28.21%/37.84%) when he was called up last summer. The 6-4, 215 LHP was 11-5 with a 2.16 ERA, 174 SO, 82 BB, and 7 HR in 154.1 combined IP.
Bailey, who turns 21 in May, was one of the few pitchers who actually improved his K and GB rates upon a mid-season promotion. His 96-97 mph fastball and plus curveball translated well at the higher minor league level and his stuff should earn him a trip to Cincinnati at some point during the 2007 season.
Lewis, 23, led the minors with a 1.48 ERA. The southpaw had a monster April and May when he threw 41 IP with only 2 ER while striking out 56 against just 4 BB. Lewis, who was kept on a strict pitch count all year, has excellent command of a below-average fastball coupled with an outstanding 12-to-6 curve.
Ricky Romero, Eric Hurley, J.A. Happ, and Troy Patton are also prized prospects. Romero, the first pitcher taken in the 2005 draft, pitched well in High-A (2-1, 2.47 ERA w/ 9.46 K/9) but struggled in Double-A (2-7, 5.08 ERA w/ 5.51 K/9). However, the lefty finished the year strong, including a four-game stretch covering 23 IP where he gave up only four ER. Hurley was promoted to AA before he turned 21. The RHP's ERA was more than two runs better in the TEX League even though his K, BB, and GB data were about the same at both levels. The 6-6, 200-pound Happ jumped from A+ to AA to AAA in the same year while averaging a strikeout per inning. Patton, 21, went 7-7 with a 2.93 ERA in High-A, then regressed to 2-5, 4.37 with a 7.35 K/9 in Double-A.
There were 85 pitchers who placed in the northwest quadrant. The table below includes the top quartile, as determined by GB rates.
NORTHWEST QUADRANT (ABOVE-AVG GB AND BELOW-AVG K RATES)
PITCHER            TEAM   LG    K/BF     GB%
Connor Falkenbach  TOR    FSL   18.35%   66.47%
Dallas Trahern     DET    FSL   14.70%   64.13%
Rommie Lewis Jr.   BAL    CAR   17.22%   63.58%
Justin Berg        CHN    FSL   16.21%   61.84%
Tim Lahey          MIN    FSL   18.57%   60.70%
Travis Hope        NYM    FSL    9.92%   59.46%
Wesley Whisler     CWS    CAR   11.59%   59.45%
Jaime Garcia       STL    FSL   15.76%   58.65%
Adam Russell       CWS    CAR   16.05%   58.54%
Richie Daigle      SD     CAL   12.81%   58.22%
Thomas King        SF     CAL   18.80%   58.09%
Mark Rosen         ARI    CAL   18.91%   57.67%
Evan Englebrook    HOU    CAR   18.22%   57.62%
Abe Woody          CIN    FSL   17.26%   57.62%
Jeff Hahn          DET    FSL   15.63%   56.47%
Jacob Marceaux     FLA    FSL   15.97%   56.46%
Nick Webber        STL    FSL   10.94%   56.45%
Douglas Mathis     TEX    CAL   17.33%   56.39%
Eric Haberer       STL    FSL   16.00%   56.39%
Casey Cahill       BAL    CAR   13.95%   55.74%
Adam Bright        COL    CAL   14.06%   55.74%
Dallas Trahern was profiled on Monday. Adam Russell, 24, has come a long way from his days at Ohio University. The 6-8, 250-pound groundball specialist had a better ERA at High-A than Double-A but his K and BB rates improved materially upon his promotion last summer. Russell's upside may be higher than his more renowned teammate Lance Broadway.
I'm not particularly interested in minor league pitchers with below-average strikeout and groundball rates. There wasn't much to pick from the 78 hurlers who placed in the least desirable quadrant although I chose to include the worst half dozen as ranked by K/BF.
SOUTHWEST QUADRANT (BELOW-AVG GB AND K RATES)
PITCHER            TEAM   LG    K/BF     GB%
Cody Evans         ARI    CAL    8.96%   36.97%
Luis Atilano       ATL    CAR    9.41%   44.07%
Tyler Adamczyk     STL    FSL   10.07%   43.23%
A. J. Shappi       ARI    CAL   11.03%   40.22%
Brian Allen        TB     CAL   11.44%   39.53%
Jim Paduch         CIN    FSL   11.85%   45.29%
If a pitcher can't whiff at least 10% of the batters faced, he better have a good excuse like working on a new set of pitches or an injury. Otherwise, I would suggest that such pitchers go back to school, earn their degrees, and get real jobs.
The five-part series will continue tomorrow (Double-A) and conclude on Friday (Triple-A).
| Baseball Beat | January 30, 2007 |
Categorizing Minor League Pitchers: Part Two - Low-A
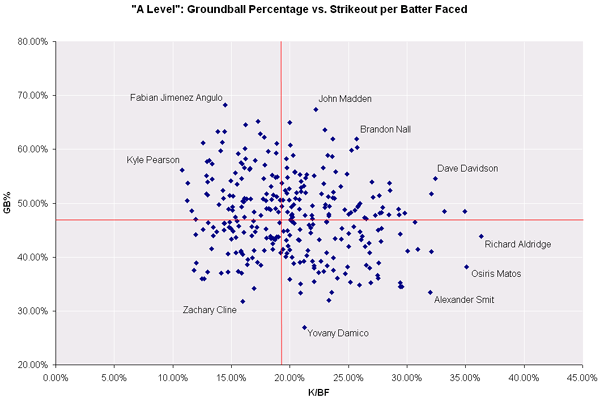
Yesterday's Categorizing Minor League Pitchers focused on starters at all levels other than Rookie and Short Season. Today's article is the first of four follow-ups, covering more than 300 pitchers who performed in Low-A (also referred sometimes as A- or even A) last year.
The graph below includes strikeout and groundball data for every pitcher in the Midwest and South Atlantic Leagues with 50 or more innings. The x-axis is strikeouts per batter faced (K/BF) and the y-axis is groundball percentage (GB%). There are four quadrants with the mid-point equal to the average K/BF of 19.92% and the average GB% of 47.71% and for relievers.
The following table shows the breakdown by strikeout and groundball rates from Low-A all the way up to Major League Baseball. The MiLB GB percentages are slightly understated due to the fact that bunted balls were included in the balls in play totals. If bunted balls were excluded, the GB% would be approximately 1-2% higher across the board.
Not surprisingly, the K/BF and GB% generally decline as the competition stiffens. Hitters at advanced levels put the ball in play more often and tend to get greater lift by hitting more line drives and flyballs.
                K/BF      GB%
Low-A          19.92%    47.71%
High-A         19.10     45.79
Double-A       19.13     45.32
Triple-A       17.91     44.61
MLB            16.83     43.63
I found it interesting that the strikeout and groundball rates flatten out between High-A and Double-A, whereas they drop by approximately one percentage point at each of the other jumps.
A total of 73 pitchers ranked in the northeast quadrant. The list below includes those in the top half, ranked by K/BF.
NORTHEAST QUADRANT (ABOVE-AVG K AND GB RATES)
PITCHER            TEAM   LG    K/BF     GB%
Todd Doolittle     FLA    SAL   34.96%   48.48%
Michael Zagurski   PHI    SAL   33.19%   48.48%
Dave Davidson      PIT    SAL   32.43%   54.55%
Brent Leach        LAD    SAL   32.06%   51.75%
Andrew Barb        PHI    SAL   29.82%   48.18%
Ricky Steik        DET    MDW   29.30%   47.83%
Matt Davis         CLE    SAL   29.26%   48.92%
Johnny Cueto       CIN    MDW   28.57%   52.36%
Mark McCormick     STL    MDW   28.51%   53.72%
Blake Jones        FLA    SAL   28.45%   47.86%
Jo-Jo Reyes        ATL    SAL   27.91%   49.23%
Wade Davis         TB     MDW   27.82%   48.25%
Justin Vaclavik    PIT    SAL   27.70%   48.18%
Matthew Trent      STL    MDW   27.62%   51.41%
Noe Rodriguez      CWS    SAL   27.31%   47.74%
Michael Bowden     BOS    SAL   27.09%   51.10%
David Patton       COL    SAL   26.99%   53.97%
Greg Dupas         TB     MDW   25.99%   50.00%
Chi-Hung Cheng     TOR    MDW   25.84%   49.48%
Anthony Claggett   DET    MDW   25.78%   49.32%
Jaime Garcia       STL    MDW   25.72%   60.37%
Brandon Nall       NYM    SAL   25.70%   61.90%
Aaron Walker       TB     MDW   25.53%   48.68%
Joey Newby         OAK    MDW   25.24%   59.85%
Carlos Carrasco    PHI    SAL   25.21%   48.23%
Jose Marte         TEX    MDW   25.00%   47.98%
Ronald Hill        PHI    SAL   24.89%   55.41%
Jonathon Niese     NYM    SAL   24.67%   48.84%
Cory Wade          LAD    SAL   24.35%   53.15%
Kraig Schambough   KC     MDW   23.92%   55.81%
Nick Adenhart      LAA    MDW   23.80%   50.85%
Kevin Guyette      BOS    SAL   23.72%   52.03%
Russ Savickas      TOR    MDW   23.68%   61.90%
Eduardo Baeza      ARI    MDW   23.66%   50.96%
Thomas Fairchild   HOU    SAL   23.61%   58.69%
Eddie De La Cruz   TB     MDW   23.36%   49.46%
Ryan Tucker        FLA    SAL   23.33%   47.99%
Other than Brent Leach (who started all 11 of his games at Low-A before becoming a full-time reliever at High-A), no starting pitcher had a K/BF rate over 30%. Four starters (Johnny Cueto, Mark McCormick, Michael Bowden, and Jaime Garcia) qualified for the 25-50 club. The 5-foot-11, 174-pound Cueto, 21, was a combined 15-3, 3.00 with 143 SO and 38 BB in 138 IP in the MDW (A-) and FSL (A+). McCormick, a 23-year-old hard-throwing RHP out of Baylor, has walked 72 batters in 105 innings the past two seasons. Bowden (20, RHP, 6'3", 215) had the sixth-highest K/BF rate among all starting pitchers in the minors with above-average GB results. As I noted in the comments section yesterday, Garcia, a 20-year-old LHP, put up sensational stats in Low-A but wasn't quite as special once he moved up to High-A (15.76%/58.65%).
Baseball America named Nick Adenhart, 20, as the top pitcher in the Midwest League and Carlos Carrasco, 20, as the top pitcher in the South Atlantic League. Garcia and Wade Davis, 21, also ranked among the top 10 players in the MDW. Although not shown, Sean West (20.82%/50.70%), a 21-year-old LHP, placed in the top 10 in the SAL.
Other notables:
Jo-Jo Reyes, 22, had a combined 12-5 record with a 3.51 ERA in Low-A and High-A but his K and GB rates declined after his promotion. The 43rd overall pick in 2003, Reyes had Tommy John surgery in 2004, tore his ACL in 2005, and bounced back to become the starting pitcher in the SAL All-Star Game in 2006. The 6-foot-2, 230-pound lefthander has a Sid Fernandez-type body and a deceptive delivery to boot.
Chi-Hung Cheng, who turns 22 in June, pitched for Lansing in the Midwest League for the second consecutive season. The lefthander from Taiwan tore his labrum and underwent surgery during the off-season. He isn't scheduled to pitch again until the middle of the year. Cheng, who has struck out more than a batter per inning at each stop in his minor league career, throws a plus curveball but lacks command of an average fastball. His road to the majors may be as a reliever.
A total of 81 pitchers ranked in the southeast quadrant. The list below includes those in the top half, ranked by K/BF.
SOUTHEAST QUADRANT (ABOVE-AVG K AND BELOW-AVG GB RATES)
PITCHER            TEAM   LG    K/BF     GB%
Ryan Aldridge      LAA    MDW   36.32%   43.80%
Osiris Matos       SF     SAL   35.06%   38.19%
Will Inman         MIL    SAL   32.06%   40.98%
Alexander Smit     MIN    MDW   31.97%   33.46%
Jacob McGee        TB     MDW   30.92%   41.49%
Brad Kilby         OAK    MDW   30.67%   46.53%
Ryan Doherty       ARI    MDW   30.04%   41.10%
Donald Veal        CHC    MDW   29.55%   34.52%
Brandon Erbe       BAL    SAL   29.42%   35.25%
Eduardo Morlan     MIN    MDW   29.41%   34.47%
Clay Buchholz      BOS    SAL   29.40%   44.23%
Matt Avery         CHC    MDW   27.84%   45.35%
Scott Mitchinson   PHI    SAL   27.78%   42.96%
Ruben Flores       SEA    MDW   27.60%   38.89%
David Quinowski    SF     SAL   27.54%   36.11%
Kevin Lynn         TB     MDW   27.51%   45.03%
Samuel Gervacio    HOU    SAL   27.50%   36.62%
Jason Rice         CWS    SAL   26.88%   35.19%
Raymar Diaz        HOU    SAL   26.82%   37.93%
Hunter Jones       BOS    SAL   26.81%   40.77%
Yohan Pino         MIN    MDW   26.76%   42.58%
Derek Miller       MIL    SAL   26.52%   38.49%
Paul Moviel        CWS    SAL   26.50%   47.12%
Harold Williams    SEA    MDW   26.41%   41.99%
Justin Rayborn     CHC    MDW   26.37%   47.28%
German Marte       NYM    SAL   26.18%   43.87%
Billy Carnline     TOR    MDW   26.09%   43.26%
Matthew Maloney    PHI    SAL   25.97%   44.64%
Chris Nicoll       KC     MDW   25.93%   34.82%
Joshua Outman      PHI    SAL   25.43%   45.59%
Ismael Casillas    BOS    SAL   25.14%   35.32%
James McDonald     LAD    SAL   25.00%   44.33%
Jason Ray          OAK    MDW   25.00%   41.95%
Thomas Cowley      CLE    SAL   24.90%   38.17%
David Hernandez    BAL    SAL   24.72%   36.88%
Sean Stidfole      TOR    MDW   24.45%   45.31%
Donald Julio       ARI    MDW   24.36%   43.37%
Sergio Romo        SF     SAL   24.03%   36.07%
Marlon Arias       LAD    SAL   23.85%   43.45%
Jeff Kamrath       TB     MDW   23.73%   39.84%
Daniel Griffin     SF     SAL   23.72%   37.50%
Ryan Aldridge, a 23-year-old righthanded reliever, had the highest K/BF rate of any pitcher with 50 or more innings at Low-A. He recorded 24 saves while limiting opponents to a .169 BAA.
Will Inman, 20; Alexander Smit, 21; and Jacob McGee, 20, had K/BF rates over 30%. All three pitchers were featured in yesterday's article.
Baseball America named Inman and Brandon Erbe, 19, among the top ten players in the SAL, and McGee and Donald Veal, 22, among the top ten in the MDW. Although not shown, Matthew Walker (20.24%/47.41%), a 20-year-old RHP, placed in the top ten in the MDW.
Other notables include Ryan Doherty, a 7-foot-1, 255-pound relief pitcher from Notre Dame. An intimidating force on the mound, the 23-year-old righthander won 9 games out of the bullpen while posting a 2.59 ERA with 5 saves and 76 SO in 62.2 IP. Eduardo Morlan, 21, was 2-0 with a 0.00 ERA in his final four starts (22 IP, 12 H, 6 BB, 26 SO) and could be a sleeper for 2007.
Clay Buchholz, 22, had a combined record of 11-4 with a 2.42 ERA in the SAL and CAR, striking out 140 batters in 119 innings, including 23 in 16 frames at the more advanced High-A level. Matthew Maloney, 23, was the SAL Pitcher of the Year. The 6-foot-4, 220-pound southpaw led the league in W (16-9), IP (168.2), and SO (180), and was second in ERA (2.03).
A total of 81 pitchers ranked in the northwest quadrant. The list below includes those in the top quartile, ranked by GB%.
NORTHWEST QUADRANT (ABOVE-AVG GB AND BELOW-AVG K RATES)
PITCHER            TEAM   LG    K/BF     GB%
F. Jimenez Angulo  CHC    MDW   14.48%   68.27%
Garrett Patterson  NYY    SAL   17.26%   65.16%
Blake Maxwell      BOS    SAL   16.21%   64.56%
Justin Blaine      PHI    SAL   14.40%   63.30%
Brad James         HOU    SAL   13.86%   63.27%
Jean Garavito      PIT    SAL   17.47%   62.90%
Eric Brown         NYM    SAL   17.81%   62.22%
Ryan Shaver        SF     SAL   14.23%   61.32%
Anthony Cupps      ARI    MDW   12.59%   61.21%
Jeramy Simmons     NYM    SAL   18.88%   61.05%
Chris Hayes        KC     MDW   16.14%   60.19%
Kyle Waldrop       MIN    MDW   14.06%   59.67%
Burke Badenhop     DET    MDW   18.13%   59.59%
Jake Stevens       ATL    SAL   18.82%   59.26%
Chris Volstad      FLA    SAL   15.58%   59.15%
Dane Renkert       MIL    SAL   19.68%   58.30%
Jason Cairns       STL    MDW   16.23%   58.21%
Julian Cordero     TEX    MDW   17.01%   57.94%
Brok Butcher       LAA    MDW   13.11%   57.92%
Cory Meacham       STL    MDW   12.91%   57.72%
The Cubs acquired Fabian Jimenez Angulo and Joel Santo (who had the second-lowest K/BF ranking in the dreaded southwest quadrant) from the Padres for Scott Williamson last July. Although Angulo has been a groundball machine, the 20-year-old lefthander from Columbia has allowed 336 hits in 284 minor league innings while surrendering 163 walks vs. 154 strikeouts.
Chris Volstad, who I covered in more detail yesterday, is the most highly regarded prospect in the northwest quadrant. The 20-year-old righthander was listed among the top two pitchers and top ten players in the SAL by Baseball America.
A total of 70 pitchers ranked in the southwest quadrant. The list below includes the bottom six in terms of K/BF, sorted in ascending order.
SOUTHWEST QUADRANT (BELOW-AVG GB AND K RATES)
PITCHER            TEAM   LG    K/BF     GB%
Zachary Simons     COL    SAL   11.82%   37.59%
Joel Santo         CHC    MDW   11.95%   44.14%
Ryan Rote          CWS    SAL   11.96%   47.03%
Ryan Schreppel     ARI    MDW   12.00%   38.87%
Scott Taylor       CHC    MDW   12.48%   35.95%
Waner Mateo        NYM    SAL   12.60%   45.16%
The six pitchers in the above table would be better labeled as suspects than prospects. I'm not sure how Scott Taylor and Waner Mateo pulled off ERAs in the 3s but the other four all had ERAs in the 5s and 6s.
I will continue my five-part series tomorrow, breaking down the 2006 K and GB rates for High-A pitchers, followed by Double-A on Thursday, and Triple-A on Friday.
Once again, I extend a special thanks to Jeff Sackmann of Minor League Splits for gathering the raw data and David Appelman of FanGraphs for providing the graphs.
| Baseball Beat | January 29, 2007 |
Categorizing Minor League Pitchers: Part One - The Starters
Earlier this month, I published a two-part special designed to categorize major league starters and relievers by batted ball types and strikeout rates. I am going to continue this project by analyzing minor league pitchers this week, beginning with starters today and covering all pitchers by level of classification from Tuesday through Friday.
Strikeout and groundball tendencies can tell us more about pitchers than win-loss records, ERAs, and most opinions. Pitchers who combine high K and GB rates are almost always successful. Conversely, pitchers who combine low K and GB rates are rarely successful.
It's no secret that strikeouts are the best outcome for a pitcher. Next to infield flies, grounders are the least harmful among batted ball types. Although groundballs result in a higher batting average than fly balls, their run impact is lower because the hits are usually limited to singles and an occasional double down the first or third base line, whereas balls in the air that turn into hits become doubles, triples, or home runs.
Groundball rates are an important predictor of home runs because the latter can be influenced to a much greater degree by park factors, which vary significantly from one minor league stop to another. Keep in mind that no attempt has been made to adjust the data for classification, league, or park factors.
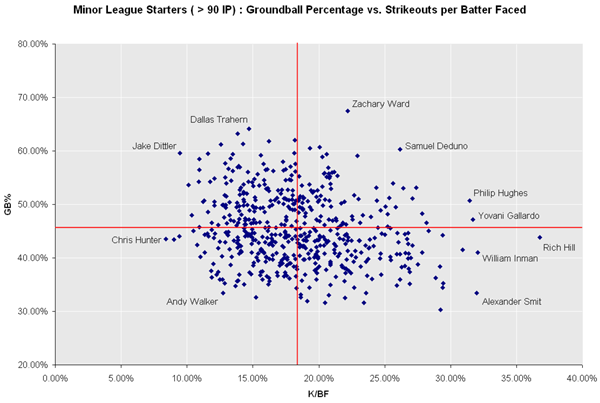
To provide a visual aid, the strikeout and groundball rates for all minor league starters with 90 or more innings have been plotted in the graph below. The x-axis is strikeouts per batter faced (K/BF) and the y-axis is groundball percentage (GB%). The graph is divided into four quadrants with the mid-point equal to the average K/BF of 18.42% and the average GB% of 45.68%.
The northeast quadrant is comprised of pitchers with above-average strikeout and groundball rates; the southeast quadrant encompasses pitchers with above-average strikeout and below-average groundball rates; the northwest quadrant is made up of pitchers with above-average groundball and below-average strikeout rates; and the southwest quadrant is the home for pitchers with below-average strikeout and groundball rates.
Most of the outlying names in the northeast and southeast quadrants were highlighted last year when I ran a three-part series on Screening for Pitching Prospects. Rather than using K/BF and GB%, I sorted pitchers by high K/9 and low HR/9 rates.
I have listed the top 25 pitchers in the northeast quadrant by strikeout rate. Ages are as of July 1, 2007. Organizations, for the most part, are updated to include trades. Levels are based on classifications where the pitcher threw at least 50 innings in 2006. Stats have been combined for those who competed at more than one level, provided they pitched a minimum of 50 innings at each of the stops.
NORTHEAST QUADRANT (ABOVE-AVG K AND GB RATES)
PITCHER             AGE    ORG    LEV     K/BF      GB%
Yovani Gallardo     21     MIL    A+/AA   31.70%    47.14%
Philip Hughes       21     NYY    AA      31.44     50.72
T. J. Nall          26     LAD    AA      28.17     46.61
Wade Davis          21     TB     A       27.82     48.25
Franklin Morales    21     COL    A+      27.37     53.18
Michael Bowden      20     BOS    A       27.09     51.10
Dana Eveland        23     MIL    AAA     26.42     53.05
Samuel Deduno       23     COL    A+      26.18     60.26
Chi-Hung Cheng      22     TOR    A       25.84     49.48
Adam Miller         22     CLE    AA      25.61     53.92
Sean Gallagher      21     CHC    A+/AA   25.33     51.24
Carlos Carrasco     20     PHI    A       25.21     48.23
Tom Gorzelanny      24     PIT    AAA     25.20     45.88
John Bannister      23     TEX    A+      25.06     49.64
Jonathon Niese      20     NYM    A       24.67     48.84
Mitch Talbot        23     TB     AA      24.41     50.68
Cory Wade           24     LAD    A       24.35     53.15
Renyel Pinto        24     FLA    AAA     23.94     47.71
Ryan Tucker         20     FLA    A       23.33     47.99
Kevin Roberts       23     MIL    A       23.13     46.60
Justin Thomas       23     SEA    A/A+    23.01     51.02
Kason Gabbard       25     BOS    AA/AAA  22.92     59.13
Adam Daniels        24     STL    A       22.70     51.75
Jonathan Barratt    22     TB     A+      22.52     47.76
Zach Ward           23     MIN    A       22.20     67.44
When separating the wheat from the chaff, it helps to look at age vs. level. Yovani Gallardo, Philip Hughes, and Sean Gallagher all pitched in Double-A as 20-year-olds. T.J. Nall pitched in Double-A as a 25-year-old. All else being equal, you take the younger pitcher every time. Nall isn't the only Dodgers hurler that needs to be discounted due to his age. Cory Wade spent the majority of the season pitching in Low-A as a 23-year-old. He was promoted to High-A (Vero Beach, Florida State League) and got clobbered (2-4, 8.24 ERA with 9 HR in 39.1 IP). Despite Wade's excellent K and GB rates at Low-A, he is NOT a legitimate prospect. [Update: Nall signed with the Washington Nationals as a minor league free agent on 11/6/06.]
Gallardo won't turn 21 until next month, yet is about as polished and mature as any minor leaguer. Milwaukee's second-round draft pick in 2004 ate up hitters in A+ (6-3, 2.09 ERA) and AA (5-2, 1.63) although his K and GB rates dipped at the higher level. The righthander out of Mexico led the minors with 188 strikeouts in 155 combined innings while only allowing 104 hits and 6 HR. At 6-foot-3 and 215 pounds, he combines size with stuff (including a low-90s fastball, a slider, and changeup), command, and performance. Unlike Nall and Wade, Gallardo is the real deal.
Hughes, a 6-foot-5, 220-pound righthander, went 12-6 with a 2.16 ERA in 146 combined innings in the Florida State (A+) and Eastern (AA) Leagues. The first-round draft choice in 2004 was a dominant force down the stretch (5-0, 1.43 with 62 SO, 21 H, and 9 BB in 44 IP) and in the first game of the playoffs (13 punchouts in 6 IP vs. Portland, the team that won the EL championship). He throws a heavy two-seam fastball, a four-seamer that sits at 93-95, a plus curve, and is working on developing his changeup. Hughes will begin the season in Triple-A at the Yankees' new Scranton/Wilkes Barre affiliate and should reach the Big Apple no later than this summer.
Gallagher, while not nearly in the class of Gallardo or Hughes, has been overlooked by many prospect analysts. The 6-foot-2, 225-pound righthander sported an 11-5 record and a 2.51 ERA with 171 SO in 164.2 combined IP in the FSL and Southern League (AA). However, the big jump in Gallagher's walk rate (5.73 BB/9) when he was promoted to West Tennessee bears watching this year. The youngster may have tried to be "too fine" rather than trusting his stuff against the older competition.
Special mention also goes to Franklin Morales, Michael Bowden, Dana Eveland, Samuel Deduno, and Adam Miller for being part of the 25-50 club. 25% K rate. 50% GB rate. The combination is rare at any level. Among major leaguers, only one starting pitcher (Francisco Liriano) and four relievers (Bobby Jenks, J.J. Putz, Dennys Reyes, and Billy Wagner) pierced both marks last year.
Speaking of Liriano, Colorado Rockies GM Dan O'Dowd said Morales has "Francisco Liriano-type ability." The lefthander struck out 16 batters in a 7-inning game last year and has whiffed 369 and walked 176 batters in 315.1 career frames. He works in the mid-90s and has reportedly touched the upper-90s. K/GB types like Morales and Deduno at Coors Field would help mitigate the disadvantage of pitching in such extreme altitude.
Zach Ward was selected by the Cincinnati Reds in the third round in 2005. The pride of Gardner-Webb University made his pro debut in Low-A in 2006 and went 7-0 with a 2.29 ERA before being traded to the Minnesota Twins for Kyle Lohse in July. What makes Ward unique is his MiLB-high (among pitchers with at least 100 innings) GB rate of 67.44%. With a heavy fastball that sits in the low-90s and a hard slider, the 6-foot-5, 225-pound righthander allowed only 3 HR in 144.1 IP last year. He is a long ways from the bigs but is an intriguing prospect to say the least.
The following are the top 20 pitchers in the southeast quadrant by strikeout rate.
SOUTHEAST QUADRANT (ABOVE-AVG K AND BELOW-AVG GB RATES)
PITCHER             AGE    ORG    LEV     K/BF      GB%
Rich Hill           27     CHC    AAA     36.78%    43.84%
Will Inman          20     MIL    A       32.06     40.98
Alexander Smit      21     MIN    A       31.97     33.46
Jacob McGee         20     TB     A       30.92     41.49
Brandon Erbe        19     BAL    A       29.42     35.25
Eduardo Morlan      21     MIN    A       29.41     34.47
Clay Buchholz       22     BOS    A       29.40     44.23
Scott Elbert        21     LAD    A+/AA   29.17     38.40
Donald Veal         22     CHN    A/A+    28.86     36.26
Homer Bailey        21     CIN    A+/AA   28.31     45.07
Scott Lewis         23     CLE    A+      27.83     41.02
Scott Mathieson     23     PHI    AA      27.50     38.75
Tyler Clippard      22     NYY    AA      27.09     42.35
Francisco Cruceta   25     TEX    AAA     26.97     39.95
Glen Perkins        24     MIN    AA      26.91     37.38
Raymar Diaz         23     HOU    A       26.82     37.93
Johnny Cueto        21     CIN    A/A+    26.78     44.66
Kevin Slowey        23     MIN    A+/AA   26.77     39.90
Radhames Liz        24     BAL    A+/AA   26.56     40.88
Humberto Sanchez    24     NYY    AA/AAA  26.54     44.48
Rich Hill (7-1, 1.80 ERA with 135 SO in 100 IP) dominated the Pacific Coast League last spring and earned a promotion to the Chicago Cubs. After going 0-4 with a 9.31 ERA in his first four starts, the 6-foot-5, 205-pound southpaw went 6-3 with a 2.92 ERA, a 1.05 WHIP, and 8.89 K/9. He turns 27 in March.
As of next week, Will Inman will no longer be a teenager. The third-round draft pick in 2005 overcame a sore right shoulder early in the season to go 10-2 with a 1.71 ERA at West Virginia in the South Atlantic League. His peripheral stats (10.90 K/9, 1.95 BB/9, and 0.24 HR/9) were among the best in the minors. The three HR he allowed last year all came in his final two starts. Inman can flat out pitch. His durability and stuff will dictate just how good he becomes.
Maybe I'm just partial to Dutch pitchers but Alexander Smit baffled Midwest League hitters when he became a starting pitcher in the second half of the season. The lefthander fashioned a 5-1 record with a 2.31 ERA while punching out 106 batters over 78 IP. He has fanned more than 12 per nine innings during his minor league career.
Jacob McGee and Wade Davis (with the fourth-highest K/BF rate in the northeast quadrant) formed a strong 1-2 punch for Southwest Michigan in the Midwest League. McGee K'd 171 batters in 134 innings. The southpaw has a lively fastball that he can dial up to around 95-96 mph on occasion. He is far from a finished project but has the size, stuff, and handedness that make scouts sit up and take notice.
Homer Bailey, Johnny Cueto, Humberto Sanchez, and Clay Buchholz fell just below the average GB rate and missed placing in the northeast quadrant. That said, it's much better to have a K/BF rate 10 percentage points above the norm with league-average GB tendencies than the other way around.
The next table lists the top dozen pitchers in the northwest quadrant ranked by GB rates. A few pitchers in this group may stick in the majors but not nearly the same number or percentage as those in the northeast or southeast quadrants. Pitchers who miss bats are the most likely to graduate to the majors but keeping the ball on the ground is the next best avenue to the Show.
NORTHWEST QUADRANT (ABOVE-AVG GB AND BELOW-AVG K RATES)
PITCHER             AGE    ORG    LEV     K/BF      GB%
Dallas Trahern      21     DET    A+      14.70%    64.13%
Brad James          23     HOU    A       13.86     63.27
Jack Cassel         27     SD     AA/AAA  18.17     62.07
Justin Berg         23     CHC    A+      16.21     61.84
Ryan Shaver         22     SF     A       14.23     61.32
Anthony Cupps       24     ARI    A       12.59     61.21
Burke Badenhop      24     DET    A       18.13     59.59
Jake Dittler        24     CLE    AAA      9.44     59.58
Wesley Whisler      24     CWS    A+      11.59     59.45
Jamie Vermilyea     25     TOR    AAA     13.47     59.39
Chris Volstad       20     FLA    A       15.58     59.15
Aaron Laffey        22     CLE    AA      13.32     58.56
Dallas Trahern is a classic groundball pitcher who throws strikes and keeps the ball in the yard. A 34th-round draft pick out of high school, the 6-foot-3, 190-pound righthander throws a sinking fastball in the low-90s and a hard slider. He's been moving up one level per year and is likely to be assigned to Erie in the Eastern League (AA) as a 21-year-old. Like most of the pitchers in this group, Trahern suffers from a lower-than-desirable strikeout rate.
The biggest name and body belongs to Chris Volstad, one of Florida's five first-round draft picks in 2005. The 6-foot-7 RHP struggled in the early part of 2006 (including 1-4, 5.94 in May), then went 6-1 with a 1.53 ERA in the second half. He is an extreme groundball pitcher who gave up 21 unearned runs in 152 IP last year. Volstad and his fellow first rounders are slated for High-A Jupiter in the Florida State League this spring.
The southwest quadrant is not the place you want to be if your goal is to earn a major league pension. The bottom half dozen pitchers ranked by strikeout rate would be best served by learning a new pitch, approach, or occupation.
SOUTHWEST QUADRANT (BELOW-AVG GB AND K RATES)
PITCHER             AGE    ORG    LEV     K/BF      GB%
Chris Hunter        26     LAA    AA      8.38%     43.58%
Sean Burnett        24     PIT    AAA     9.00      43.48
Luis Atilano        22     WAS    A+      9.41      44.07
Tim Kester          35     BAL    AAA    10.49      45.10
Jerome Williams     25     PHI    AAA    10.77      42.44
A. J. Shappi        24     ARI    A+     11.03      40.22
Sean Burnett may be too young to cut loose at this point, but the former first-round draft pick of the Pittsburgh Pirates is no longer the highly regarded prospect he once was as a high school All-American in 2000 or the organization's Minor League Player of the Year in 2001 and 2002 or the Carolina League Pitcher of the Year in 2002 or the Eastern League Pitcher of the Year in 2003. In fairness to Burnett, he had elbow surgery in April 2005 and missed the entire season. His career is on the line in 2007.
Jerome Williams threw 260 innings in the big leagues and won 17 games for the Giants before his 23rd birthday. A first-round selection in 1999, the native of Honolulu was assigned to Low-A ball his first year out of high school, then progressed one level per year until reaching the majors in 2003. He was traded to the Cubs in 2005 and claimed off waivers by the Phillies in September 2006. Williams is only 25 but his career is going in the wrong direction.
Tim Kester, on the other hand, is a minor league lifer. He has been pitching professionally since 1993 but has never thrown a single pitch in the majors. Drafted by the Yankees in 1990 and 1991, Kester didn't sign until he was selected by the Astros in 1993. The righthander has been employed by Houston, Boston, and Baltimore, working 1,482 innings for 10 different minor league clubs. If nothing else, Kester has traveled extensively and would be a good person to ask for motel accommodations in rural and suburban towns across the country.
I will break down the 2006 K and GB rates for pitchers (including relievers) in Low-A on Tuesday, High-A on Wednesday, Double-A on Thursday, and Triple-A on Friday.
A special thanks to Jeff Sackmann of Minor League Splits for gathering the raw data and David Appelman of FanGraphs for providing the graphs throughout the five-part series.
| WTNY | January 26, 2007 |
2007 WTNY Prospect Mailbag
Baseball prospects are far from sure bets, products of attrition that disappoint far too often. However, that does not stop the collective hope of fan bases, who watch and read about these players and project an organizational up-tick because of them.
In writing my annual prospect list from SI.com, I received nearly one hundred e-mails, evidence of this on a fantastic scale. The information age has brought people closer to prospects than ever, and now, the valuation of top prospects seems to be at an all-time high. Over the course of today (Friday), I will go through questions posed to me in the comments section of Tuesday's post and via e-mail, answering as many as possible. Also, if more questions arise from people, drop them in the comments section here, and we'll get to them as well. Here's a refresher course on each of the series of articles:
Honorable Mentions
Prospects 75-61
Prospects 60-46
Prospects 45-31
Prospects 30-16
Final 15 Prospects
If you need catching up, I'm Bryan Smith, co-founder and former writer on this site. I wrote my annual prospect list at SI.com, but gained permission from the site to run the final installment at Baseball Analysts on Tuesday. Rich has been gracious enough to allow to finish today, creating a mailbag that has annually accompanied this feature. Enjoy!
How would you "tier" this list? Where are the drop-offs from "uber-prospect" to "really really good prospect" to "really good prospect"?
If you need reminder of the list, click here, and scroll towards the bottom of that page. To answer this question, I can say that the minor leagues has four uber prospects. The top four players are absolutely fantastic prospects, and my confidence in their future success is very high. Delmon Young was #1 on this list a year ago, but is #2 now, despite being closer to the Major Leagues. Those four represent the utmost tier of the list.
After that, the next tier is probably a big one, something like 5 (Brandon Wood) to 27 (Mike Pelfrey). Ranking of some players within that tier is pretty obvious, but nonetheless, these players project as future All-Stars, but all of whom do worry me in some sense. Whether it is Brandon Wood's strikeouts, Andrew Miller's control or Tim Lincecum's health, something is holding these players back right now. After this, tiering becomes more difficult, but eye-balling it, the last few tiers would go something like 28-45, 46-62, and 63 to eightysomething. Each tier is made up of many like prospects, and each prospect has a pretty glaring weakness.
Would you say this is a strong prospect list compared to '06, '05, '04? It seems there's a lot of talent. I'm only asking because I feel the tops of those years--Felix, the '05 Young, Mauer, and maybe B.J. Upton at one point--were all "better" prospects than Gordon. Am I wrong?
In my honorable mention article at SI.com, I noted that the minor leagues seem to have more talent than ever. I really do attribute this to the gains made in utilizing information, combining statistics and scouting reports to draft most effectively. While dogmatic organizations tend to be at the back of farm system rankings, those who can look at all the information make this the deepest list I have ever written.
I wrote above that there were only four uberprospects, but when can you remember there were four prospects as good as these four at once?
Also, it was very difficult for me to not rank some of those within honorable mention in my top 75. I had comments written out for guys like Jeremy Jeffress and Eric Campbell, but ultimately, depth pushed them out. If I'm bored in the future, I could probably come up with another 50 names that just missed making the honorable mention. There has not been a more fun time to evaluate prospects in the history of baseball, I say.
How good of an indicator do you feel this list is in relation to a team's overall farm system strength? In other words, how worried should an organization be if it has poor or minimal representation on the list?
Not especially worried, I would say. Top-heavy prospects are important for farm system strength, but they are one component - teams need star power prospects, depth in prospects, and must have graduated prospects recently to get high grades from me. By looking at the number of players in my top 100, that only tells you about how many top-heavy players each team has.
Nonetheless, organizations with two players or less in the top 100 do represent some of the worst farm systems in the game: Washington, San Diego, Toronto, etc. These teams have a long ways to go - the Padres and Blue Jays must start being better in the Major League draft. I think Washington isn't far from having a good farm system again, as the 2006 draft has good potential and the organization now teams together Dana Brown with the superbly talented Mike Rizzo.
If you want to get a good idea of farm system strength, try and pool together my top 100 list with some team-by-team top 10 rankings at Baseball America or Baseball Prospectus. If you can get a feel for the depth in each top 10 -- a club like the Cardinals has good depth despite not being top-heavy at all -- then your organization is fine.
Where would the Japanese rookies - Daisuke Matsuzaka, Akinori Iwamura, Kei Igawa - rank on your list?
An inevitable question, as I am usually pretty stubborn by not allowing these guys entrance into my list. It stems from respect for the leagues in Japan, as they do a far better job of preparing these players for the Major Leagues than AAA could.
Matsuzaka is the easiest ranking, as his game is so complete. I think his fastball and slider combination will be among the top in the Major Leagues, and he will be all the more devastating by showing another 3-4 pitches to batters to keep them off balance. He has a history of pitching in big games, and his control has improved heavily in the last three seasons. Matsuzaka is ready for the Major Leagues, and the Red Sox landed the right-hander at a good price. With three years of an ERA around 3.50 (or less) coming, Matsuzaka would rank third on this list.
Next, rather unusually, I have Igawa. Most rank Iwamura next, but I really think Igawa can be a good Major League starter as well. Problem with Igawa is that in his scouting profile, I see shades of Barry Zito, shades of Ted Lilly, and shades of Kaz Ishii. But, it's not really useful to claim a player to be between a Cy Young pitcher and a replacement-level one, so I'm guessing he can be Lilly-esque. Igawa combines a low 90s fastball with a slow, deadline overhand curve, and mixes in a usable slider and average change. The key for him, and what proved to be Ishii's downfall, will be maximizing his fastball control in the Major Leagues. If he can set up batters for the curve effectively, Igawa could save the Yanks a lot of money on what Barry Zito would have given them. I will say Igawa would be unofficially 46 on my list, between Jeff Niemann and Chuck Lofgren.
Iwamura, the Devil Rays versatile infielder, is most worrisome to me. He brings over very good power from Japan, and the isolated slugging percentage numbers translated at a place like Baseball Prospectus seem about right to me. However, I can't get over Iwamura's strikeout numbers - no Japan player has traveled across the Pacific with those numbers. It will be extremely hard for Iwamura to hit .280 is he whiffs in 25% of his plate appearances, which I think could happen. And furthermore, since most Japan players walk less in the Major Leagues, I don't think he will walk enough to support his drop in batting average. I am not high on Iwamura at all, who would not surprise me if he turned out to be no better than Pedro Feliz. Iwamura would be in my honorable mention.
How can you rank Homer Bailey ahead of Phillip Hughes. Looking at their statistics side by side, Hughes' numbers are better in every respect. And if you say that it's the stuff that defines the greater prospect, the difference in stuff between Hughes and Bailey is minimal with Bailey having slightly more velocity although Hughes has a heavier ball. Further, if it is stuff that defines the prospect than I'm certain you can find a myriad of prospects who have the same stuff as Bailey and Hughes. The key than must be the marriage between stuff and control that translates into success and therefore the better prospect. Isn't that the embodiment of Phillip Hughes? The remarkable maturity (pitching knowledge), super stuff, and superior control all combine to create one of the best pitching prospects we've ever seen. The part of that equation that Homer Bailey holds is super stuff and improving control. Taking into account the previous argument, you can only conclude that Phillip Hughes is indeed the better pitching prospect.
By a power of about eight million, this type of question (dealing with these two prospects) was the most popular I received, speaking to the fabulous intensity of Yankee fans. Still, its funny, because the difference between the two players is totally negligible. Both prospects are generational, both are top tier, and both project as aces in the Major Leagues (the only two in the minors). So, I don't really think the individual ranking is important, but I will do Bailey the hnor of defending him, since he was ultimately my choice.
As far as "stuff" goes, I disagree with the question, I don't think you can find other stuff like Bailey's or Hughes' in the minor leagues. Someone like Jason Neighborgall might have impressive raw stuff, but it doesn't compare to these two players, as he has no idea where it is going. Say what you will about Homer Bailey's command, but it hardly had an adverse effect on his performance in 2006. In the end, I decided to label the Reds prospect with the minors best stuff, and I again, I disagree with the e-mail about how he labels their fastballs. I would not say that Hughes has more life than Bailey, but instead more sink, as Bailey's exploding four-seamer has plenty of life. I love Hughes' two-seamer, however, so the fastball difference is about as negligible as their overall ranking.
But, again, why Bailey? What overcomes Hughes' edge in command? Two things: breaking ball and health. Now, let me remind, I'm not claiming Hughes is poor in either category at all. His curveball is fantastic, but my reports of Bailey's hook were phenomenal. The pitch might be a 75 on the 20-80 scouting scale soon, and it should generate a lot of swings-and-misses at the Major League level. While Hughes is long removed from past shoulder soreness, he is still more susceptible for future injury than Bailey.
Now listen: I believe Philip Hughes will not only pitch in the Majors in 2007, but I believe he'll start admirably in the playoffs. I believe he will anchor the Yanks' rotation for years to come. And I also believe the same for Homer Bailey's, who has enough star power to reinvigorate the city of Cincinnati.
If Franklin Morales can improve his control w/o altering his delivery, or, at least, with minimal impact to his delivery, do you think he could be considered in the top 25-30 range? His "stuff" is pretty filthy when he's on target.
This will be the key for Morales. I place this question deliberately after the Bailey/Hughes one for a reason, in the previous ranking, I allude to a ideological belief I have in prospects that Morales reinforces: command can be taught, raw stuff cannot. Pitching coaches are very important aspects to baseball, and their effect on teaching young players command has been seen again and again. Very often, I have players with great stuff and iffy command ranked pretty high, because I do believe in the power of a pitching coach. Morales is a player whose raw stuff is among the ten best pitching prospects in the game, but he is going to have to make the most out of Spring Training, the AA pitching coach and the Rockies' roving pitching instructor. Still, Morales can probably be successful even with only minor improvements in control, as I documented in his player comment at SI.com that he will improve in 2007 merely be leaving the California League's hot sun.
To what extent do you take defense (both a player's individual ability based on scouting or available metrics, and the position they play on the defensive spectrum) into consideration when ranking position players?
As heavily as possible. After all, evaluating minor leaguers is all about tools, and defense encapsulates two of the six (five plus patience) tools that I use. So, reports about a player's range and his arm are of superb important to me. Also, as this question alludes, the defensive spectrum has a large impact on rankings, as you can see in some of the spots on my list.
One e-mail asked me about why I chose Tulowitzki as a better prospect than Longoria. After all, the latter probably has better power skills, and overall, is probably the better future hitter. But the difference between these two players on the list represents how much I weigh defense into rankings. Tulo had a head start because he plays shortstop, and he also plays it well. Longoria is a solid-average fielder, but Tulo has good range and a great arm. Up the middle.
I think the hardest position to consider defense effectively is the catching position. Offensive catchers are the dream of every Major League General Manager, but there are rarely very many in the game at once. They are extremely rare. The reason for this is because many offensive minor league catchers (I'm looking at you, Josh Phelps) don't make it in the Major Leagues because of defense. While Jarrod Saltalamacchia and Neil Walker both were helped by their position, and its relative ranking on the defensive spectrum, it is still very hard to know if they will play good enough defense to enter the Offensive Catcher fraternity.
Hopefully this answered the question.
How much do off-field and or personal issues(i.e. Elijah Dukes' recent/consistent transgressions) weigh in the rankings? Is there a red flag, so to speak, when it only is considered if applicable?
I don't think that I weigh make-up as high as other evaluators, or those within the game. Certainly it is an important part of becoming a star, but I think it is so hard to quantify, it is almost not worth doing. Delmon Young did not drop in my rankings because of the bat-throwing incident, or concerns about his anger. Instead, he dropped because he hasn't shown consistent patience in the minor leagues.
Elijah Dukes did drop because of his make-up, and because his anger continually effects his on-field play. But Dukes fantastic ability keeps him in the top 40. Ultimately, I could not drop him any more, because we simply do not know the effect a promotion to the Majors will have on him. Just as easily as his anger could destroy him (which sounds like a line from Star Wars ... Elijah Dukes as Anakin Skywalker?), he could also get a chip on his shoulder and become a superstar. Since we have no way of knowing this, guessing and ending up wrong seems foolish.
In the end, I won't remember 2006 as the season in which the Devil Rays cut Dukes season short because of his antics, I'll remember him taking Chuck James' fastball 500 feet out of the Durham ballpark, over the blue monster in left field. Talent speaks to me more than anger.
Mad lib: I agonized the most over the ranking of: the three 18-year-old star prospects. Fernando Martinez, Jose Tabata and Elvis Andrus are all extremely unique prospects, like Felix Hernandez was at one time. All of them have the talent to rise to the top of my list one day, but each is so likely to bust out at some point. These players, high on star power and attrition, are always the hardest to rank. With these three, I was changing their rankings constantly, trying to find something that worked for me. Ultimately, F-Mart's good showing in the AFL proved to me his power was real, and his good showing in that left him atop the group of three. Still, I really like Tabata, so I knew he couldn't be far behind. If he rises to my top 10 next season, don't consider me surprised. The hardest to rank of this group was Elvis Andrus, who struggled a bit offensively, as he isn't nearly as strong at these other two players. Still, Andrus could be a very good defensive shortstop and still learn to be an offensive force, a combination which should leave Braves fans drooling. These three players leave me very excited for 2007, when the projection will slowly be turning into realization for each prospect.
The Astros have a catcher that is getting high marks in their minor league system named JR Towles. He always has a high average and plays almost daily in the 3 years in the minor leagues. What have you heard about this young man? The Astros need a catcher after Ausmus leaves...could he possibly be the next in line?
I am familiar with Towles, he had a good season in Lexington, where I was able to see him play during the summer. In person, Towles has one glaring need: time in the weight room. Very skinny, Towles power and health would be much improved with some added strength. He showed some good, yet crude, defense behind the plate: memorably, he threw one ball to the right field wall after attempting to throw behind a baserunner at first base. It was a good, aggressive move that displayed plus arm strength, but it also reinforced complaints about his raw ability. Towles largest positive is good plate coverage, he's a natural hitter with a propensity for contact. This bodes well for his future, as his weaknesses are more easily rectified than problems with his bat. Towles didn't get much consideration for this list, but the Astros are high on him, despite drafting Max Sapp in the first round. As far as replacing Ausmus goes, he very well could, but I don't see Towles becoming Major League ready until at least 2009.
Adam Jones was 19 on your mid-season list...the drop from 19 to 25 isn't all that significant I realize, but did he do anything to drop his stock in the last months of the season? He appeared to take a big jump forward from June-on in Triple-A, but struggled in the majors. If he continues what he did from June-on in the minor leagues, do you see him as a potential top-10 guy next year (assuming no callup)?
Jones drop is not significant at all. He was passed by the best 2006 draftees, as well as the year's best breakout players. I still think very highly of Jones, and my position on his future is unchanged since midseason. However, his Major League trial should create a little cause for concern about his ability to hit a breaking ball. With a decent amount of ML at-bats, the next time Jones reaches the Majors, every team will have a scouting report on him. The Mariners, an organization that shows little patience with prospects, will need to make sure that Jones has mastered the pitching he sees in the PCL before promoting him again. Also, while I remain high on Jones' defense, I was a bit disheartened to read Dave Cameron's lackluster reviews of it at USS Mariner. In compiling the Best Tools of AAA for Baseball America, managers raved to me about Jones defense, so I do think he will be above-average in the Major Leagues. Jones could probably get to 10-15 before his call-up next year, but that's probably where his "rank ceiling" is.
Probably too far in the future, but how about Angel Villalona?
Certainly what I have read about Villalona thus far is intriguing, and it sounds like he should finally give the Giants a star position player prospect. It has been a long time. The reason I didn't rank him yet is two reasons: he has not played in a game yet, and I just don't know enough about him. Baseball America does such a wonderful job bringing these players to the public, but ranking Villalona solely on what I read in BA would be dishonest. For now, I'm willing to wait to see his power in a minor league, and then try and talk to someone who say him before I give him a good ranking. Still, he's probably somewhere 101-125, which for a 16-year-old is pretty remarkable. Kudos to BA for reporting this information so well, and look out for some teenage power in the Arizona Summer League (presumably) next summer.
Last year you had Jon Lester ranked #14. He will probably start the year in the minors for the Red Sox while he rebuilds his strength after recuperating from kicking cancer's butt. If he still qualified for your list, what would he rank this year?
Impossible to say. I am so excited Lester is going to be on the mound in 2007 -- he's a hero -- it speaks to his character as a prospect. We have no idea how much weight or strength loss Lester sustained during cancer, but he's a workhorse, and I don't doubt it will all come back. This is such an uplifting story that it trumps prospect rankings. Lester is a player that everyone, including Yankees fans, should be rooting for. A goal of mine for 2007 is to see him pitch somewhere, and I know that I will wear a Lester jersey into Fenway Park before his career is done.
You have T.Snider ranked 1 spot ahead of A.Lind. What pushed Snider ahead in your eyes?
They are neck and neck. Lind is a favorite prospect of mine, a breakout player I targeted last year whose pure bat proved to have some big power in it. I also am a big Snider fan, the make-up you have heard about in the past came across so well through an interview. These guys are both really good prospects, but I do think Snider could just be more of an offensive force in the Major Leagues. I likened Lind's offensive profile to Carlos Lee, but I think Snider can be above that, even if his size does worry me a bit. Another factor, which we shouldn't overlook, is that Snider will probably reach the Major Leagues at the age of 21 or 22, long before the age Lind will be during his 2007 rookie season.
Keep your minor league questions coming in the comments section of this post, and I will try to answer as many as I can in the next few days. Thanks!
| Past Times | January 25, 2007 |
A Credit to Cooperstown
Tony Gwynn's 97.6 percent of this year's Hall of Fame vote and first-year induction in Cooperstown is well deserved. In the postwar era, only Ted Williams has surpassed Gwynn's .338 career average.
What made Gwynn stand out in the 1990s was his willingness and insistence on stroking line drives rather than swinging for the fences. "I'm comfortable with my style," he said on numerous occasions, and the results proved that statement to be true.
While many of his 3141 hits came on opposite field ropes and grounders in the "5.5" hole between short and third, Gwynn could also pull an inside pitch for extra bases and hit the occasional home run. The other numbers - eight National League batting titles, including a career-best .394 in 1994, six other times above .350, five 200-hit seasons and seven years as the NL leader in hits - are truly impressive.
All this was done with a 32 1/2 or 33-inch bat that weighed a mere 30 or 30 1/2 ounces. Gwynn's self-described "peashooter" was a deadly weapon in his skilled hands. While most players use a 34 or 35-inch piece of lumber, Gwynn's choice shows a willingness to think for himself and go against conventional wisdom.
The batting titles and piles of hits didn't come easily. Gwynn worked tirelessly on his swing and defense (going from a mediocre outfielder to a five-time Gold Glover) in addition to being a pioneer in the use of video to find flaws in his swing and check out opposing pitchers.
In describing his approach to baseball, one word - "grinder" or "grinding" - is often used by Gwynn. That term comes from a work ethic passed from his parents, who held jobs at a warehouse and in the postal system to pay the bills and provide baseball equipment for their sons. Younger brother Chris hit .261 as a backup outfielder and pinch-hitter with three teams from 1987 to 1996.
Even though Gwynn has been retired since 2001, the family legacy lives on in the majors. Son Tony Jr. - a speedy centerfielder - made his big league debut (.260 in 77 ABs) with the Brewers in 2006.
The grinder mentality was especially evident in 1996. Playing on a partially torn right achilles tendon, Gwynn hit .353 to win his seventh NL batting title. The injury kept Gwynn from using his legs and driving the ball as much as normal, and opposing teams knew it.
"It was my toughest batting championship," Gwynn told me in a 1997 Baseball Digest interview. "I couldn't pull the ball much, so I hit a lot of dying quails to left and grounders up the middle. I felt like I was cheating. I was lucky to win the title."
Those quotes were pure Gwynn, a person who has always been quick to credit others and crack self-deprecating jokes. Asked about his play in right field, the sure-handed Gwynn replied, "I don't have the greatest arm, but it's pretty accurate. On defense, I just try to put myself where the ball is going to be hit. Just being smart and trying to anticipate what will happen counts for a lot in this game."
Need more stats and accomplishments? From 1991 to 1996, Gwynn struck out just 105 times in 2944 at-bats, never exceeding 19 whiffs in any season during that stretch. Many current players would gladly take Gwynn's six-year K total in a single campaign.
From 1993 to 1997, Gwynn had five consecutive seasons above .350. He happily credits Ted Williams for his advice to pull inside pitches when the opportunity presented itself. Tony still had plenty of opposite field knocks and hits up the middle, but his newfound willingness to pull the ball made him all the more dangerous and productive.
Even though the Padres went 1-8 in their only World Series appearances in 1984 and 1998, Gwynn didn't let the team down, as he hit .371 (13 for 35) over those nine games. The most memorable of those hits was a long home run at Yankee Stadium off David Wells in Game 1 of the '98 Fall Classic.
Professionalism and class? The final game of Gwynn's career took place against the Rockies at Qualcomm Stadium on October 7, 2001. A knee injury limited Gwynn to pinch hitting, and the stands were packed with fans eager to see one last at-bat from the line drive machine.
Teammate Rickey Henderson recognized the importance of the day and asked out of the lineup to keep the spotlight on Gwynn, who insisted that Henderson start in his usual leadoff role. That's because Rickey was parked at 2999 hits. Gwynn knew the 42-year-old Henderson couldn't be certain of another chance to reach the 3000-hit level, so he wanted a fellow future Hall of Famer to have the opportunity to nail it down.
Henderson blooped an opposite field double on the first pitch he saw to reach 3000, and he left the game at the end of the inning. Gwynn grounded out as a pinch hitter in a 14-5 loss. The player who turned down free agent opportunities to leave San Diego is still part of the community, as Gwynn has been the head coach at San Diego State (his alma mater) since 2003.
Congratulations, Tony. You deserve to be a first-ballot Hall of Famer. Thanks for playing the game with total dedication and being an inspiration to those of us who seldom cleared the fences.
| Change-Up | January 24, 2007 |
Last Impressions Are Lasting Impressions Part 2: The Hurlers
Last Friday, I took a look at those hitters whose Post-All Star break numbers might portend a 2007 that will surprise baseball fans. This week, I will tackle the pitchers. Whose second half of the year in 2006 spells great things for 2007? Here goes one guy's take.
Starting Pitchers
Andy Pettitte
Post-All Star Break 2006: 93.1 IP, 2.80 ERA, 3.19 K/BB, 8.29 K/9
While teams tripped over themselves to ink the Gil Meches and Jeff Suppans of the world, the Yankees signed the guy that may very well have been the best pitcher in baseball over the last few months of 2006. Andy Pettitte, with little fanfare, dominated after the All Star break in 2006. While the press focuses their attention on the Bombers' neighbors to the northeast and their signing of Daisuke Matsuzaka, the Yanks might have made the low-cost (relatively speaking) deal of the off-season.
C.C. Sabathia
Post ASB 2006: 103.0 IP, 2.97 ERA, 4.33 K/BB, 7.95 K/9
Doesn't it seem like this guy is perpetually on the cusp of superstardom? Now cast aside as a guy whose time has come and gone, the general baseball public seems to have settled on the notion that Sabathia is a mid-rotation, serviceable entity and little more. I disagree. Sabathia flashed good peripherals in 2006 and was phenomenal in the second half. Just 26, his time is yet to come.
Matt Cain
Post ASB 2006: 99.1 IP, 3.26 ERA, 2.48 K/BB, 8.97 K/9
He's 22 and one of the most valuable commodities in baseball - a young pitcher with years of cheap service time ahead of him. The San Francisco Giants, and in particular their General Manager Brian Sabean, may have a reputation for assembling old teams but Cain is one of the best young players, position or hurlers, in all of baseball. I look for Cain to be a Cy Young candidate in 2007.
Rich Hill
Post ASB 2006: 80.0 IP, 2.93 ERA, 3.29 K/BB, 8.89 K/9
Rich Hill has been putting up video game type Minor League numbers for quite some time now. Stat-heads who like to contend that Minor League performance can very easily predict MLB numbers have witnessed their dissenters pointing to Hill as an example that it takes a little something extra in "The Show." Time and again Hill would warrant a call up, and time again he would fall flat on his face. Until the summer of 2006 that is. Hill seems to have figured out what he needs to do in order to translate his Minor League dominance into Major League competence.
Ben Sheets
Post ASB 2006: 85.2 IP, 3.15 ERA, 8.80 K/BB, 9.25 K/9
Everybody knows about Sheets and the numbers he put up in 2004. Everybody also seems to have written off the 28 year-old right-hander after consecutive injury-plagued seasons. Injury risk is real and I have no idea how Sheets is going to hold up going forward but fans ought to recognize that this guy is still one hell of a dominant force when he is out there. With their promising young nucleus, Sheets may well be the difference between Milwaukee competing for a division crown and faltering once again.
Relievers
Dennys Reyes
Post ASB 2006: 29.0 IP, 0.31 ERA, 3.30 K/BB, 10.24 K/9
If you want a data point for the ground-ball/strikeout type that Rich has demonstrated are so damn effective, Reyes is your guy. A lot of the time he strikes 'em out and does it without letting 'em put it in play. But even when they do hit it, the result is often harmless as Reyes induces grounders with the best of them. Major League defenders are capable of scooping up grounders and tossing hitters out at will. Look for Reyes's star to shine a little brighter in 2006. He'll get the recognition he deserves.
Cla Meredith
Post ASB 2006: 45.0 IP, 1.00 ERA, 5.50 K/BB, 6.60 K/9
Doug Mirabelli, huh? And Josh Bard as a throw in? Meredith dominated down the stretch in 2006, as he walked a batter about every full moon or so and effectively employed a strategy whereby he let hitters make a little contact at spacious Petco Park. Not quite a household name, look for Meredith to emerge as a bullpen star in 2007.
Takashi Saito
Post ASB 2006: 36.1 IP, 1.98 ERA, 4.17 K/BB, 12.39 K/9
Takashi Saito was as dominant as they come late in 2006. I am well aware that he will be 37 on Opening Day of 2007 but this guy clearly has the stuff to shut down Major League hitters and better still, his motion and delivery remain unfamiliar to the vast majority of them. Saito will still be one of the National League's very best in 2007.
You never know with the pitchers but these are the guys that I think will take up a lot more of the public's mindshare than you might anticipate in 2007. Each showed impressive stuff to close out 2006 and each should continue to impress in the forthcoming year.
| WTNY | January 23, 2007 |
The 2007 WTNY Prospect List
There is no greater season for a prospect evaluator than the winter, as we finally bear down, combine all the evidence and take our stances. For the fourth winter in a row, I have compiled a list of the minor league's 75 best talents -- Major League Baseball's future stars. This winter, I was lucky enough to have SportsIllustrated.com invite me to post my list at their site. This was a fantastic opportunity at heightened exposure as well as the ability to have my wordiness edited by Jake Luft. Over the last week I have written six installments, the last of which is also produced below. The other five pieces at SI:
Honorable Mentions
Prospects 75-61
Prospects 60-46
Prospects 45-31
Prospects 30-16
With the allowance of Luft and SI.com, I have opted to simultaneously post the final edition of my list at Baseball Analysts. I have much nostalgia built into this site and its readers, so I wanted to post my prospect list in this forum again.
Finally, Rich has allowed me to come back to Analysts this Friday as well, as I wanted to compile a mailbag of the questions I receive during the presentation of this list. So, if you have any burning prospect-related questions, leave them in the comments below or e-mail me and I will pick as many as I can to answer Friday. Thanks, as always, for reading.
Bryan Smith's Top 75 Prospects in 2007
For the purposes of this list, a prospect is a player who played predominantly in the minor leagues last season or was drafted in the 2006 June draft. A player loses eligibility for this list once he surpasses 50 innings pitched or 130 at-bats in the major leagues. Japanese imports Daisuke Matsuzaka, Akinori Iwamura and Kei Igawa were not considered due to lengthy experience overseas. Players are judged based on what scouting and statistical reports claim on their potential. Each prospect is presented below with his 2007 baseball age and 2006 statistics.
15. Jay Bruce, 20, RF, Cincinnati Reds
2006 Stats (Class A-): .291/.355/.516, 19 SB in 444 AB
Bruce had a historic season for a teen-ager in the Midwest League, showing left-handed power unrivaled for a player of his maturity. Like so many young left-handed hitters, Bruce has work to do with southpaws, striking out in 30 percent of his at-bats against them in 2006. This is not what scares me. What does is the context within Bruce's numbers and the similarities they bear to Brian Dopirak's legendary Midwest League season in 2004. That year Dopirak became wildly hyped in prospect circles, but I made note of a 27-game stretch during the summer in which he was a decidedly better player than the rest of the season, which is the same thing that happened to Bruce in 2006. In 33 games between June 4 and July 10, Bruce was amazing, hitting .427 and clubbing 24 extra-base hits. The rest of the season? A paltry .238 batting average. However, his power did remain consistent throughout the season, so I am now cautiously confident in Bruce's future.
14. Andrew McCutchen, 20, CF, Pittsburgh Pirates
2006 Stats (A-/AA): .294/.359/.450, 23 SB in 531 AB
Speed is the name of McCutchen's game, as his quickness with his legs and bat leave the Pirates thinking big with their future center fielder. Generously listed at 170 pounds, McCutchen relies on ridiculous bat speed to hit for plus power. His power was restrained much of the season by the spacious dimensions at his home park; he slugged .536 on the road in Low-A. With quickness unrivaled for players with his power, McCutchen also profiles to steal 30 bases and win Gold Gloves down the road. Raw in both areas, McCutchen could stand at least another season and a half in the minor leagues, but his late-season success at AA might have pushed his timetable forward significantly.
13. Tim Lincecum, 23, RHP, San Francisco Giants
2006 Stats (SS/A+): 1.71 ERA, 14H/31.2IP, 58K/12BB
In modern college baseball history, no pitcher has been as dominant in a single season as Jered Weaver was in 2004. In his final year at Long Beach State, Weaver posted a 1.63 ERA and struck out 213 batters while scouts nitpicked his game. In 2006, Weaver received his vindication for his overshadowed Golden Spikes season, dominating the Majors as a rookie. There are numerous similarities between Weaver and Lincecum, who had a 1.99 ERA and 199 strikeouts as a junior at Washington. Lincecum has better stuff than Weaver, touching the high-90s with his fastball while featuring a hammer curveball, but his height (he's about 6-feet tall) led to a drop to the 10th overall selection in the 2006 draft. Lincecum's largest pitfall could be the combination of his violent delivery and extreme workload. The Giants will work hard at managing both in 2007, preparing Lincecum to contribute in the majors by 2008.
12. Andrew Miller, 22, LHP, Detroit Tigers
2006 Stats (A+): 0.00 ERA, 2H/5IP, 9K/1BB
The first player from the 2006 draft to reach the majors, Miller was also the best the draft had to offer. Since opting for North Carolina instead of the Devil Rays out of high school, Miller had long been marked as the player-to-top in his class. Miller won Baseball America's College Player of the Year award with a marvelous junior season. Extremely projectable at a lanky 6-foot-6, Miller's four-seam fastball is already 94-97 mph. As a starter, his bread and butter is a sinking two-seam fastball and a slider that few left-handed hitters can touch. A September call-up showed the Tigers how dominant Miller profiles to be, but also how raw his delivery and command still are; he struck out six batters and walked 10 in 10 1/3 innings with Detroit. Miller will likely begin in Double-A Erie next season and could be pushing for a major-league roster spot again late in the season.
11. Troy Tulowitzki, 22, SS, Colorado Rockies
2006 Stats (AA): .291/.370/.473, 6 SB in 423 AB
Incumbent Clint Barmes struggled in 2006, which means there is nothing holding Tulowitzki back from playing every day in Coors Field. Tulowitzki is a gifted contact hitter who sprays the ball all over the field with gap power. It isn't a stretch to project him as a perennial .300 hitter who bangs out 40 doubles annually. He also has a power stroke that should produce 10 to 20 home runs a season. In the field, he is mistake-prone but shows good range and a cannon arm from the hole. Despite struggling with Colorado in September, Tulowitzki proved in the Arizona Fall League that he's ready for The Show.
10. Adam Miller, 22, RHP, Cleveland Indians
2006 Stats (AA): 2.84 ERA, 133H/158.1IP, 161K/46BB
Miller has gone under a distinct maturation in the minors, the type separating "pitchers" like Jake Peavy from "throwers" like Kerry Wood. Formerly known as "Mr. 101" stemming from a late-season velocity reading before an arm injury in 2004, Miller has since backpedaled his approach and trusted his stuff. These days, Miller focuses on keeping his darting two-seamer down in the zone (resulting in a 1.59 G/F ratio in AA) and striking out hitters with his plus-plus slider. Miller's maturation is still a work in progress. That was evident in 2006 as he allowed seven home runs in his first 10 starts. However, the right-hander limited opponents to a mere two home runs the rest of the season thanks largely to an improved command of his slider.
9. Billy Butler, 21, LF, Kansas City Royals
2006 Stats (AA): .331/.388/.499, 1 SB in 477 AB
Butler played in an unfriendly hitting environment (Wichita) in 2006. At home during the season, Butler hit just one home run compared to 14 while on the road. The latter number more accurately details Butler's huge power potential. Butler's combination of contact and power skills are fantastic, and his late-season performance indicates he could be even better next year. Between June 1 and his exit to play for Team USA, Butler batted .354 while striking out just 33 times. Butler creates an adventure with every fly ball in left field, but his defensive shortcomings will be forgotten if he can provide protection for Alex Gordon in the Royals' lineup.
8. Cameron Maybin, 20, CF, Detroit Tigers
2006 Stats (A-): .304/.387/.457, 27 SB in 385 AB
Maybin lived up to all the hype in his first pro season. He might not be the second coming of Ken Griffey Jr., but Maybin has a generational five-tool set. Many have pointed to Maybin's .408 BABIP (Batting Average on Balls In Play) and called his season overrated, but I don't believe this is true. Maybin has the same kind combination of speed and line-drive ability that allows Ichiro to post high BABIPs every season, albeit not quite as high as .408. While his numbers could come down a bit with worse luck in 2007, it also could be pointed out his numbers took a hit by an early return from a thumb injury. Maybin struggled horribly in his first 15 games coming off the DL, hitting just 12-for-56 without much power. With a healthy season, I think Maybin could improve on his 2006 numbers in the Florida State League; the speedy center fielder has greater power than he showed in the tough Midwest League.
7. Justin Upton, 19, CF, Arizona Diamondbacks
2006 Stats (A-): .263/.343/.413, 15 SB in 438 AB
Like his brother, B.J. Upton, Justin Upton is an extremely divisive prospect as people struggle to understand why his output has not matched his talent. The latter was obvious for four years of high school, and nationally on display in spring training when Upton looked fantastic against the Chicago White Sox on WGN. Upton has a mature body with extremely long legs, which combined with his speed give him fantastic home-to-first times. Upton draws deserved comparisons to Alfonso Soriano, who has a similarly long, controlled and powerful swing. Most people have questioned Upton's makeup due to his poor season, but the concerns are overdone; expectations were just too high for the 2005 draft's top pick. Upton might not be as major-league ready as we thought last March, but his All-Star ceiling should not be altered because of an average debut.
6. Chris Young, 23, CF, Arizona Diamondbacks
2006 Stats (AAA): .276/.363/.532, 17 SB in 402 AB
While the exit of fan favorite Luis Gonzalez provides a public relations hit to Arizona in 2007, the entrance of Young should quickly make D-Backs fans forget their former hero. This will be most evident defensively, as Arizona adds Young's fabulous range in center, pushing Eric Byrnes to left field and surely saving the pitching staff many runs. Offensively, Young should be at least on par with Gonzalez next season, if not better. Young has the chance to be a 25 homer/25 steals threat as a rookie and is the odds-on favorite to capture National League Rookie of the Year honors. Young began making better contact last season as well, but his batting average didn't go up, the product of bad luck against southpaws. His BABIP was .100 points worse against left-handers, and when that number improves, Young could threaten to break the .300 barrier for his first time as a pro.
5. Brandon Wood, 22, SS, Los Angeles Angels
2006 Stats (AA): .276/.355/.552, 19 SB in 453 AB
After a breakout season of epic proportions in the hitter-friendly California League in 2005, Wood entered last year with a considerable amount of pressure. Was it a fluke? Can his offensive approach continue to produce big results? Will his power sustain at higher levels? What Wood proved in 2006 was that he was indeed a top prospect, showing substantial power throughout the season. Wood is going to suffer through a lot of variance in his numbers because of his high strikeout rate, but his ability to hit the ball out of any park offsets concerns about his swing-and-miss tendencies. By walking more often last season, Wood became a more valuable prospect, making a potential move to the hot corner far less daunting. Expect Wood to push the Angels to a decision on whether to call him up in 2007 as Salt Lake's altitude should lend to Wood's 100th minor-league home run by midseason.
4. Philip Hughes, 21, RHP, New York Yankees
2006 Stats (A+/AA): 2.16 ERA, 92H/146IP, 168K/34BB
If Roger Clemens does not return to the Bronx in 2007, Hughes will be the hot-button issue in New York come June. By then, Hughes will be dominating AAA with every outing. The Yankees have done a fabulous job preparing Hughes for his midseason call-up, slowly increasing his workload in the minor leagues. With 146 innings last year, Hughes should be able to pitch consistently through October, by which time he might already be the Yankees' No. 2 starter. Far more impressive than Hughes' heavy sinker or jaw-dropping curveball is his understanding of pitching; he is the most intelligent phenom in recent memory. Hughes does not give in to any bat, rarely allows free trips to first base, and gets groundballs consistently from the stretch. Hughes is as good as a New York pitching prospect has been in a long time.
3. Homer Bailey, 21, RHP, Cincinnati Reds
2006 Stats (A+/AA): 2.47 ERA, 99H/138.2IP, 156K/50BB
A year ago, things did not add up with Homer Bailey. The prep star's full season debut began in the pitcher-friendly Midwest League, where he allowed a 7.73 H/9, struck out 125 batters and allowed just five home runs in just over 100 innings. However, his ERA was 4.43. The reason? Sixty-two walks, indicating poor command that Bailey had not shown as a high schooler. The anomalies I saw straightened themselves out in 2006, when Bailey became the game's best pitching prospect. The electricity of Bailey's stuff -- the life of his fastball and break on his curve -- are fantastic, and Bailey already attacks hitters like a veteran. In 2005, Bailey walked fewer than two batters just six times. In 2006, he raised the number to nine starts. If he can make a 50 percent improvement on that number again next season, Bailey will finish the year in Cincinnati.
2. Delmon Young, 21, RF, Tampa Bay Devil Rays
2006 Stats (AAA): .316/.341/.474, 22 SB in 342 AB
I wanted Young to be my top prospect this season. He held that role a year ago and I have long predicted his future superstardom. My views on Young's future are unchanged heading into this season, but Young was downgraded to the No. 2 spot on this list because of one negative trait: patience. Young does not have great makeup (see: bat toss at umpire), but he would hardly be the first superstar to combine success with anger. What I can't overlook is Young's allergy to drawing walks, as he has just 20 since a mid-July promotion to AAA in 2005. Young must walk more in the majors to reach his full potential, but his power, hand-eye coordination, speed and throwing arm will make him an All-Star regardless.
1. Alex Gordon, 23, 3b, Kansas City Royals
2006 Stats (AA): .325/.427/.588, 22 SB in 486 AB
Gordon is the ultimate hitting prospect. A left-handed hitter with a gorgeous swing, the 2005 Golden Spikes award winner made the transition to wooden bats look easy. He thrived in the Texas League, becoming a potential savior in the eyes of Royals fans. Unlike Butler, Wichita's pitcher-friendly tendencies did not faze Gordon, who hit 19 home runs in the seasons' final 60 games. This did correspond with a rise in strikeouts (63 over that span), but the Royals do not question Gordon's ability to hit for average. Also an intelligent player, Gordon understands the value of a walk and also is fantastic at picking out the right times to steal a base. The Royals expect him to hit and hit quickly as a rookie in 2007.
The rest of my top 75 prospect list is in order after the jump, and remember to leave your questions for the mailbag on Friday.
| The Batter's Eye | January 22, 2007 |
Open Water
The "shark" is now officially in the waters of Major League Baseball, and a recent article asks if Jeff Samardzija is a good investment for the Cubs. I think it is a good question; as for the answer: it depends. There is no way I can comment on the quality of pitching repertoire, but fortunately, his video from Notre Dame last year is recent enough to give some ideas that might accelerate his development.
This is Dayn Perry's main thought that has the most relevance here:
Samardzija has a good power-pitcher's build and fields his position well, but his mechanics, while consistent, need refining.
What does "refining" mean? Let's take a look...
Here is Samardzija at Notre Dame in 2006. The clips are from the same game, live (facing batters, not warm-ups):

The left side shows Samardzija coming from the full wind-up, while he is going from the stretch on the right side. Each clip is synched to release point (as all of the following comparisons will be), and right off the bat there is something that does not match up. Samardzija is moving considerably slower from the wind-up. What I mean by that is primarily the difference in time from high-knee lift to release point. High-knee lift can be thought of the time when maximal loading of the hip region is occurring, and this shows that Samardzija is unloading his hips much sooner from the wind-up. There is just about nothing going on for Samardzija as he lifts his front leg out of the wind-up. He looks much better out of the stretch, as his hips load and begin to move out during knee lift. In short, Samardzija looks much more efficient out of the stretch.
My first thought here is that the main areas of focus should be tempo and rotation - either taking less time to produce the current amount of force or producing more force in his existing amount of time. A few comparisons will help illustrate:

Samardzija (89 mph) is on the left and 2006 1st-rounder, Daniel Bard (93 mph), is on the right. These come out of the stretch, where Samardzija is quicker; however, it appears he is still a little behind Bard - behind in terms of really maximizing his ability to throw the ball HARD. You can see how far Samardzija is into his motion before Bard even starts. Some of the articles I have read mention that Samardzija has been throwing consistently in the low-90s and up to 97, so perhaps he is making adjustments on the fly (his draft scouting report cited a high 80s fastball). Another issue to consider is how Samardzija is going to be used - some suggest he will be limited to the bullpen if his off-speed pitches do not develop. In either case, it appears Samardzija might be able to use his body a little better in order to create more velocity and hopefully limit the stress on his arm.
To be fair, knee lift to release is not the only means of measuring tempo. Hand break is another. Here is a look at Samardzija next to hard-throwing Scott Williamson:

I highlighted the hand break for each and also threw in a red line just to show the different position as they make their move to home plate. Williamson starts his leg lift much sooner, but it also reaches a point much higher, and in the end he is only one frame behind in terms of knee lift to release. A little technical, I know, but it shows Williamson is getting a lot more accomplished in terms of loading his hips. And then the red line is just an indicator of how Williamson is creating forward movement by using his hips. Getting back to hand break, Williamson is more aggressive. He has some momentum coming down out of a higher set and this gives him a little bit more juice (elastic energy) as he prepares to throw.
Now that I've mentioned the hips, it is time for a look at rotation. The Williamson clip shows this, but I am going to break out two of the best here - none other than Roger Clemens and Pedro Martinez.
Going from the wind-up, here is Clemens (1986 version) and Samardzija:

You can see the obvious difference in timing of high-knee lift, but I have slowed down the section of interest here (here is an isolated look). Clemens is using hip rotation much more effectively going into footplant, and as a result, he has more aggressive shoulder rotation to deliver his arm to release. This would be an area of improvement that could not only add velocity, but also reduce wear and tear on the arm.
Lastly, Pedro (Boston version) will show how it is done out of the stretch:

Here is an isolation shot. I will point out once more how much quicker Samardzija is out of the stretch because he is not as far behind here. But the rotation is key. Pedro is much smaller and I can not imagine that he is nearly the athlete Samardzija is, but he is very efficient. The main thing on the Samardzija side is that he looks like he is reaching or lunging into footplant, which prevents him from really using his hips. Maybe a shorter stride is in order? That is for the pitching coaches to decide and see which things work.
For $10 million over 5 years, was signing Samardzija a good investment? We'll see. There is opportunity and a lot of light at the end of the tunnel here. His clips from the stretch indicate that he has an idea of moving more quickly and his athleticism gives reason to believe he can make adjustments. Considering his past splitting time between baseball and football combined with a few areas of potential improvement, Samardzija just might develop into a pretty good pitcher. If his mechanics stay as is, developing a better feel for his breaking pitches allow him to move along as a starter. Should he have trouble refining the off-speed stuff, improved efficiency might just allow him to develop a mid-high 90s fastball and become a force from the bullpen. Pulling off both means this "shark" could swim for a long time.
| Change-Up | January 19, 2007 |
Last Impressions Are Lasting Impressions
GM's. Fantasy owners. Even everyday fans. Anyone interested in baseball always has an interest in identifying those players most likely to exceed expectations. Whether a leg up on one's competitors or barstool sports argument fodder, finding the sleepers represents a feather in the cap.
One method in identifying such players is taking a look at the prior season's second-half statistics. Simply pulling up Post-All Star numbers from a given season is hardly the best means of predicting the proceeding season's dark-horse improvement candidates. On the whole, more scientific methods that factor a wider array of data points like PECOTA or ZIPS will prove more accurate. Still, second-half numbers can help to pick out the guys flying under the radar heading into a new year.
Sometimes players who have mediocre numbers over a full campaign post a strong second half, and their full-season numbers may not portend what the following season has in store as well as their second-half numbers. I am well aware that second-half numbers can also represent little more than a 60-game hot stretch. But this piece will seek to find the players at each position (pitchers next week) who impressed after the All-Star break last season and look primed for big things in 2007.
Catcher
Brian McCann
Post-All Star Break 2006 (AVG/OBP/SLG): .324/.372/.630
As promising young backstops go, everyone knows about Joe Mauer but what about Brian McCann? The 22-year-old catcher who posted a 146 OPS+ in 2006 is highly regarded, but I am not sure baseball fans fully appreciate just how good Brian McCann appears to be. I'll still take Mauer for his superior ability to reach base, but catchers that can hit this well at such a young age are a rarity, and I think 2007 is the season McCann begins to get the appreciation he deserves.
First Base
Richie Sexson
Post ASB 2006: .322/.399/.613
Now 32-years-old and being written off by General Managers and fantasy owners everywhere after posting a full season that hardly stood out after a crummy first half (.706 OPS), the savvy fan can look for a bigtime bounce back from Richie Sexson. He was phenomenal in the second half, and his impressive numbers listed above are even more so when you consider that Sexson plays his home games in the spacious Safeco Field in Seattle.
Second Base
Robinson Cano
Post ASB 2006: .365/.380/.638
Sure, I would like to see him with a little more discipline at the plate and, yes, I understand that the .365 batting average is hardly sustainable. But we are talking about a 24-year-old second baseman with one of the prettiest, most athletic looking swings in the game who hits with power like no other at his position in today's game. If he stays healthy, Cano should be an absolute force in 2007.
Third Base
Garret Atkins
Post ASB 2006: .354/.437/.625
Atkins has been highly touted since he joined the Colorado Rockies and showed promise here and there over the years before putting it all together over his final 73 games of 2006. Confident and smack in his prime at the age of 27, look for Atkins to emerge and join the impressive group of top-tier third basemen. Miguel Cabrera, Aramis Ramirez and David Wright would be best served to press on and not look back. Atkins is gaining on them.
Shortstop
Rafael Furcal
Post ASB 2006: .339/.399/.564
For those who wrote off Rafael Furcal after his slow start in 2006, they sure missed one heck of a good baseball player during the stretch run. How good was Furcal? His .963 second half OPS was good for 16th best in the National League. And remember, he's a shortstop...with one of the best gloves in the game...playing home games at Dodger Stadium. In short, he was one of the very best players in baseball after the All-Star Game. Look for him to be excellent once again in 2007.
Left Field
Chris Duncan
Post ASB 2006: .295/.374/604
I know, I know. His minor league track record underwhelms. Many smarter than me will probably have Duncan on their "primed for a 2007 crash landing" list. Not me and I will tell you why. I love the high on-base percentage without the superb batting average. It's suggestive of a mature, sustainable approach. This is not Jeff Francoeur smacking and hacking his way to a .400/.400/.500 type of 35-game start to his MLB career. Duncan looked the part of a veteran player combining a great physical and mental approach. That's why I believe that even if he does not quite keep it up, he will still be a very good player.
Center Field
Ryan Church
2006 Post ASB: .305/.376/.550
Ryan Church famously and absurdly lost his starting role and roster spot on the Opening Day Washington Nationals to Brandon Watson and although it took him too long to get back up with the big club, when he did, he impressed. 28 years old now and ready to assume a full-time starting gig in the Big Leagues for the first time in his career, Church has a chance to be one of the best center fielders in the National League.
Right Field
J.D. Drew
Post ASB 2006: .279/.410/.530
Maybe this is a homer call but that's a damn impressive line from an agile outfielder playing home games at Chavez Ravine. Now J.D. will be playing home games at Fenway (we think), and I look for him to come to play in order to silence a Red Sox fan base grumbling as a result of Drew's soft perception (deserved or undeserved).
There you have it, baseball fans. These are the guys I expect to exceed expectations in 2007. GM's still have time for a trade, fantasy owners can make a mental note for their upcoming drafts and the barstoolers can store up some ammo. These eight will come to play in 2007.
| Designated Hitter | January 18, 2007 |
The Greeks, Bill James and the Beauty of Baseball Stats
You've heard of Pythagoras, right? If you're a fan of baseball stats, you might associate Pythagoras with Bill James's Pythagorean Formula, RS^2/(RS^2+RA^2), which calculates a team's expected winning percentage. It's a sublime formula, really. It captures critical information in a simple way and expresses the relationship between runs scored, runs allowed and winning just so.
If you're not a baseball analyst, you probably associate Pythagoras with right triangles, as in A^2+B^2=C^2, where C is the length of the hypotenuse. It's another beautiful formula. From what I've read, Pythagoras didn't exactly invent it, but he did popularize it. Still, it wasn't Pythagoras's greatest contribution to mankind.
Pythagoras actually invented the musical scale we use today. If you place your finger exactly halfway up a guitar string, the note of the string is an octave higher. Put your finger on a spot two-fifths the length of the string, and you get a perfect fifth note. It's said that Pythagoras discovered this, and he found that the simplest ratios of string length created the most harmonious notes.
Reportedly, this was a huge revelation to the Greek. He felt that he had discovered a fundamental Truth, something that uncovered the deepest meanings of the universe. In a way, he had.
Pythagoras had discovered the power and beauty of ratios. He became convinced that mathematical ratios were the foundation of all beauty in the universe. He conceived of the music of the spheres, in which all planets orbit the earth in a circle, set in a specific ratio from the earth, which emits its own tone throughout the universe.
Pythagoras took his findings seriously. He developed a following - a cult, really - that believed that universal truths could be found in numbers. His disciples considered him a kind of god and followed him loyally.
I don't know anyone who thinks of Bill James as a kind of god, but there are many of us who feel that our eyes were opened by his Abstracts. He didn't just discuss baseball and its numbers, he uncovered the beauty in its numbers. Take that Pythagorean Formula...
James found that you can reasonably predict a team's performance by its runs scored and allowed. He also found that the relationship is geometric; Runs aren't just doubled in the formula, they're squared.
The power of two is everywhere in life. E=MC squared, after all. When you move closer to a light, cutting the distance in half, the light doesn't become twice as bright. The brightness is squared. When you double the sides of a square, its size doesn't just double, it's squared.
So when Bill James discovered that the nature of runs to winning is squared, it seemed as though something essential and fundamental had been discovered. And he didn't stop there.
Take any league in modern baseball history and multiply its On-Base Percentage by its total bases. Know what you'll usually get? A number that is very, very close to the total number of runs scored in that league. I mean, how amazing is that?
League  Year     OBP    TB       OBP*TB   Runs    Diff    %Diff
NL      1968    .300    18,737    5621    5577      44      1%
NL      1954    .335    17,106    5731    5624     107      2%
NL      1925    .348    17,751    6177    6195     -18      0%
AL      1997    .340    33,495   11388   11164     224      2%
AL      1977    .330    31,307   10331   10247      84      1%
AL      1959    .323    16,118    5206    5391    -185     -3%
I don't know if Bill James is the person who discovered this relationship but, like Pythagoras and his theorem, he will forever be associated with it because it was the basis of the very first Runs Created formula: A+B/C, where A is times on base, B is total bases and C is plate appearances.
Once again, James had found a simple formula and ratio, multiplicative in nature, that expressed the fundamental nature of baseball.
Of course, James created other metrics, too. He created Game Scores, Defensive Efficiency Record, Secondary Average and Isolated Power. He developed points systems for Hall of Fame and award eligibility. He created his own ways to project player careers (the Brock system), major league performance from minor league performance (MLE's) and the Favorite Toy.
James's findings were simple and beautiful. They were something new in the baseball firmament and they created a new kind of baseball fan, a bit like Pythagoras's cult. But, as with Pythagoras, questions began to undermine the beauty of the numbers.
One of Pythagoras's followers, an unfortunate man named Hippasus, discovered that some numbers are irrational. That is, the digits of some numbers continue infinitely like Pi (3.14159...) or the square root of two (1.41421...). Hippasus developed a proof showing that irrational numbers exist. Pythagoras considered this sacrilege, and reportedly had him drowned.
But the truth couldn't be held back, and the logic of Hippasus's finding was eventually recognized. Thousands of years later, a guy named Copernicus came along and established, once and for all, that the planets don't revolve around earth. They revolve around the sun. Pythagoras's music of the spheres doesn't really exist at all.
Pythagoras's math wasn't wrong, really. The trouble was that, for all of its beauty, it wasn't fundamentally sound enough to take future mathematicians where they needed to go. Newton and Einstein could never have conceived of calculus and relativity (relatively) if they had stuck to Pythagoras's mathematical ideals. Sometimes, progress requires a revision of the fundamentals.
Early in his career, Bill James really wasn't interested in creating the most precise statistics. He was interested in the framework, in the insights that would lead to revolutionary thinking about baseball and its players. So he didn't include counting stats like stolen bases and sacrifice hits in Runs Created. Like Pythagoras, he was most interested in the beauty and insight.
As time moved on, however, he became more interested in accuracy, and his formulas became more complex. He eventually added stolen bases, situational hitting and lots of other things to Runs Created. In fact, the current Runs Created formula is virtually unrecognizable compared to its original version, even though it still follows the A+B/C format.
The Pythagorean Formula has changed too. James recognized that squaring runs scored and allowed wasn't quite accurate enough, and changed the formula's factor to 1.83. I remember my disappointment when he did that, thinking that Pythagoras wouldn't approve.
Subsequent researchers have gone further, and found that the correct factor is dependent on the overall run environment. In other words, the impact of runs scored and allowed changes according to the average number of runs scored in each league each year.
Just think how Pythagoras would have responded to that.
Many years ago, Pete Palmer built his own runs estimator formula called Linear Weights, in which each offensive event (singles, home runs, walks, outs, etc.) is weighted by a specific amount. James didn't like Linear Weights. He once criticized Palmer's system because the weights of each event were computed after the end of the year (and he also doesn't like stats that use averages as a baseline).
However, Tangotiger showed, in a persuasive article called "How Runs are Really Created" a few years ago, that context really does matter. You can't really know the impact of each type of batting event unless you know how many times every event occurred.
In fact, Tango went one step further and showed that the format of James's original Runs Created formula wasn't quite right. He advocates the use of a formula developed by David Smyth called Base Runs. And if you take some time to think about it, you have to agree with him.
When you look at things in more detail, sometimes the fundamental structures that have gotten you so far have to change. That's what Hippasus meant to Pythagoras, and that's what has happened to James's original formulas, too.
Baseball writers like Rich and me aren't really researchers. We're communicators. We want to reach out to fans who are curious about the game of baseball and describe to them how the "inner game" of baseball statistics works. We are truly following in the footsteps of James, who is a fantastic writer, and we want to express the same joy at the beauty of baseball stats.
On the other hand, hardcore researchers are finding new ways of describing the game's statistics, and we want to share that with general baseball fans too. So we're in a curious bind. We want to continue to talk about the music of the spheres, but we also want to acknowledge the Copernican solar system.
At Baseball Graphs and the Hardball Times, I've helped keep Bill James's Win Shares in the public's eye. At the same time, however, I've conducted my own research and tried to improve his system. Some researchers have told me that trying to correct Win Shares isn't possible, that the framework is too flawed. But there is much I like about Win Shares, so I soldier on.
In the end, my quest may be quixotic, but as long as I help a few fans see a bit more in the numbers, and help a few researchers get a little more visibility for their efforts, I'll be happy. At least, hopefully, no one will try to drown me.
Dave Studeman is a writer at the Hardball Times, and also the manager of the Baseball Graphs website.
| Baseball Beat | January 17, 2007 |
Blyleven: As Dominant as His Hall of Fame Contemporaries
The results of the Hall of Fame balloting were announced last Tuesday. As expected, Cal Ripken Jr. (98.5%)and Tony Gwynn (97.6%) were near-unanimous choices. Congrats go out to these first-time candidates for their well-deserved honors.
Ripken and Gwynn were the only players who received the necessary 75% of the vote to qualify for Cooperstown. Except for Goose Gossage and Dave Concepcion, all of the other holdover candidates lost ground. Among those who suffered a setback was none other than Bert Blyleven. Only the Lonely saw his vote total fall from 277 to 260 and his percentage retreat from 53.3% to 47.7%.
Blyleven's loss of momentum and lack of overall support are disappointing and surprising in the face of the evidence that he is Hall worthy. Unfortunately, there are not enough voters who are willing to take the time to study the facts. Although Blyleven's record speaks for itself, too many writers seem to be looking for reasons not to vote for him. The most common objection to his candidacy is that he wasn't one of the dominant pitchers of his era. To that, I say nonsense.
Despite claims to the contrary, dominance is not measured solely by 20-win seasons, All-Star games, or Cy Young Awards. Wins are dependent on run support, while All-Star appearances and Cy Young votes are heavily influenced by W-L records. The circular logic (or illogic) also extends to the Hall of Fame voting. Wins = All-Star games and Cy Youngs = Cooperstown.
The whole thing is rather silly. It's really all about wins (and little else). A pitcher is deemed dominant because he won games, or so goes the conventional wisdom. Sorry, but a pitcher should be deemed dominant because he prevented the other team from scoring runs. If a pitcher works deep into games and keeps runs off the board, he has performed his job. It's no more complicated than that.
Shutouts may not be as meaningful of a gauge in today's era when complete games are a rarity, but they were a great measure of pitching prowess prior to the 1990s. More than anything else, dominant pitchers threw shutouts.
Let's take a look at how Blyleven compared in this category with the 11 starting pitchers in the Hall of Fame who overlapped his career by at least five years.
                  SHO     GS      PCT
Tom Seaver        61      647     9.43%
Nolan Ryan        61      773     7.89
Bert Blyleven     60      685     8.76
Don Sutton        58      756     7.67
Bob Gibson        56      482    11.62
Steve Carlton     55      709     7.76
Jim Palmer        53      521    10.17
Gaylord Perry     53      690     7.68
Juan Marichal     52      457    11.38
Fergie Jenkins    49      594     8.25
Phil Niekro       45      716     6.28
Catfish Hunter    42      476     8.82
Blyleven, who ranks ninth in career shutouts, is third among his HoF contemporaries in blanking the opposition, one behind the leaders (Nolan Ryan and Tom Seaver). He ranks sixth in shutouts as a percentage of games started. As such, you can see that Blyleven's success was not just about longevity. He had more white washes and notched them at a greater rate than Don Sutton, Steve Carlton, Gaylord Perry, Fergie Jenkins, and Phil Niekro.
Blyleven won 15 1-0 games - more than of any of these pitchers. He ranks third all time in the number of 1-0 victories, trailing only Walter Johnson and Christy Mathewson. On the other hand, Blyleven lost nine 1-0 games - also more than any of these pitchers. That's not a negative. If anything, it is indicative of his poor run support over the years (which, according to Chris Jaffe's Run Support Index or Pete Palmer's SUP, ran about 3-4% below average for Blyleven's career).
Strikeouts are another indicator of dominance. An out may be an out but a strikeout, unlike a batted ball, isn't dependent on team defense. As such, I would argue that strikeouts are one of the most basic measures of dominance at the pitcher-batter level. Let's see how Blyleven fares in this area.
                  SO      BF       PCT
Nolan Ryan        5714    22575    25.31%
Steve Carlton     4136    21683    19.07
Bert Blyleven     3701    20491    18.06
Tom Seaver        3640    19369    18.79
Don Sutton        3574    21631    16.52
Gaylord Perry     3534    21953    16.10
Phil Niekro       3342    22677    14.74
Fergie Jenkins    3192    18400    17.35
Bob Gibson        3117    16068    19.40
Juan Marichal     2303    14236    16.18
Jim Palmer        2212    16112    13.73
Catfish Hunter    2012    14032    14.34
Blyleven, who ranks fifth in career strikeouts, is third in Ks among these distinguished pitchers. He ranks fifth in K/BF. Once again, you can see that Blyleven's success was about the quantity and quality of his career numbers. He struck out more batters in total and at a greater rate than Sutton, Perry, Niekro, Jenkins, Juan Marichal, Jim Palmer, and Catfish Hunter.
In addition to strikeouts and shutouts, the number of low-hit complete games is a useful measure of dominance. Thanks to Retrosheet and Baseball-Reference.com's Play Index (the best $29 one can spend when it comes to baseball subscriptions), we can now see how Blyleven compares to these same 11 pitchers (listed in the order of their major league debuts).
                0-Hit    1-Hit    2-Hit    3-Hit    4-Hit    Total
Bob Gibson        1        2        8       24       31       66
Juan Marichal     1        3        6       13       32       55
Gaylord Perry     1        1       13       21       43       79
Phil Niekro       1        2       13       14       27       57
Steve Carlton     0        6        9       21       34       70
Jim Palmer        1        5       11       19       25       61
Catfish Hunter    1        1        6       20       19       47
Fergie Jenkins    0        3       10       20       30       63
Don Sutton        0        5       10       14       25       54
Nolan Ryan        7       12       18       32       29       98
Tom Seaver        1        5       10       27       31       74
Bert Blyleven     1        5        9       13       41       69
Blyleven is tied for second with the most no-hitters, tied for third in one-hitters, tied for eighth in two-hitters, tied for last in three-hitters, and is second in four-hitters. He ranks fifth in the number of four-hit or better games (although with a greater percentage of four-hitters than any other pitcher in the group). As shown below, Blyleven had more low-hit games (LH) and at a superior rate than Niekro, Sutton, and Hunter.
                  LH      GS      PCT
Nolan Ryan        98      773    12.68%
Gaylord Perry     79      690    11.45
Tom Seaver        74      647    11.44
Steve Carlton     70      709     9.87
Bert Blyleven     69      685    10.07
Bob Gibson        66      482    13.69
Fergie Jenkins    63      594    10.61
Jim Palmer        61      521    11.71
Phil Niekro       57      716     7.96
Juan Marichal     55      457    12.04
Don Sutton        54      756     7.14
Catfish Hunter    47      476     9.87
The win-loss record in these games isn't particularly meaningful in my judgment, but I decided to include this information to counter those who might suggest that Blyleven pitched well but didn't win such battles.
                  W-L      PCT
Nolan Ryan        87-11   .888
Gaylord Perry     72-7    .911
Tom Seaver        68-6    .919
Steve Carlton     67-3    .957
Bert Blyleven     65-4    .942
Jim Palmer        60-1    .984
Fergie Jenkins    60-3    .952
Bob Gibson        58-8    .879
Juan Marichal     54-1    .982
Don Sutton        52-2    .963
Phil Niekro       51-6    .895
Catfish Hunter    44-3    .936
Blyleven ranks fifth in the number of wins with four or fewer hits allowed. He ranks sixth in winning percentage. Carlton is the only pitcher in the group with more wins and a better winning percentage than Blyleven when it comes to low-hit games.
Interestingly, three of Blyleven's four losses occurred in 1975 when he pitched for a Minnesota team that went 76-83 and placed fourth in the AL West. He allowed seven runs (five earned) in those three games but the Twins only scored once. His other loss took place in 1986 after Bert had returned to MIN (71-91, 6th in the AL West), and he was on the short end of a 3-0 defeat.
Let's further refine these pitching gems to low-hit games with no more than one walk.
                  Total    W-L     GS     PCT
Fergie Jenkins      42     41-1    594    7.07%
Bert Blyleven       33     33-0    685    4.82
Gaylord Perry       33     31-2    690    4.78
Tom Seaver          31     30-1    647    4.79
Juan Marichal       29     29-0    457    6.34
Jim Palmer          23     23-0    521    4.41
Don Sutton          23     22-1    756    3.04
Catfish Hunter      22     22-0    476    4.62
Steve Carlton       21     21-0    709    2.96
Phil Niekro         20     19-1    716    2.79
Bob Gibson          18     16-2    482    3.73
Nolan Ryan           9      8-1    773    1.16
Blyleven is tied for second in the number of games with four or fewer hits and one or no walks. He ranks second in wins and is tied for first in winning percentage. Blyleven also ranks third in low-hit, low-walk games as a percentage of games started.
I also examined the number of low-hit, low-walk games each pitcher tossed as a percentage of the number of low-hit, low-walk games thrown by all major leaguers during each hurler's respective career to adjust for the slight differences in eras. (Incidentally, Blyleven is the only pitcher among the 12 who did not pitch a single inning during the 1960s and is one of just two who performed beyond 1988.)
                   PCT      LG AVG     RATIO
Fergie Jenkins     7.07%     2.34%     3.02
Bert Blyleven      4.82      1.94      2.49
Juan Marichal      6.34      2.64      2.40
Tom Seaver         4.79      2.17      2.21
Gaylord Perry      4.78      2.40      1.99
Jim Palmer         4.41      2.30      1.91
Catfish Hunter     4.62      2.46      1.88
Bob Gibson         3.73      2.63      1.42
Don Sutton         3.04      2.19      1.39
Steve Carlton      2.96      2.22      1.33
Phil Niekro        2.79      2.24      1.25
Nolan Ryan         1.16      2.04      0.57
Blyleven has the second-best ratio of games with four or fewer hits and one or no walks compared to the major league average. In other words, aside from Jenkins, he was the most proficient of the bunch at throwing such gems.
Shutouts. Strikeouts. Low-hit, low-walk complete games. Those are generally under the control of the pitcher and are much better ways of evaluating dominance than 20-win seasons, All-Star appearances, and Cy Young votes.
If Steve Carlton, Bob Gibson, Catfish Hunter, Fergie Jenkins, Juan Marichal, Phil Niekro, Jim Palmer, Gaylord Perry, Nolan Ryan, Tom Seaver, and Don Sutton were dominant pitchers, then Bert Blyleven was dominant, too. If these pitchers are Hall of Famers, then Blyleven is a Hall of Famer as well. How they can all have plaques in Cooperstown while Blyleven continues to sit on the outside looking in is incomprehensible and a wrong that should be righted.
| Baseball Beat | January 16, 2007 |
Listen, Buster
Buster Olney wrote a column last Tuesday, entitled "On Blyleven's Candidacy" (ESPN Insider subscription required). Olney, who has never voted for Blyleven in the past, gives his reasons as to why he didn't support him again this year.
I have highlighted excerpts of Olney's comments below followed by my responses.
I've looked for a way around the strong belief that Blyleven is the pitcher's version of Harold Baines -- a very steady, reliable player during a long career, but never a dominant presence for a period of at least a few years.
Bert Blyleven has now been reduced to a "pitcher's version of Harold Baines?" You've got to be kidding me, right? I mean, how can Olney make such a comment while keeping a straight face?
I will grant you, Harold Baines was a good hitter. Maybe even a very good hitter. However, as a player who spent the vast majority of his time as a designated hitter, I'm not sure you can say he was much more than that. But I will concede that he was a good, solid hitter.
Blyleven, on the other hand, was a great pitcher. I would even argue (and will in tomorrow's article) that his record is no worse than right smack in the middle of the pack with 11 Hall of Fame pitchers who overlapped his career by five or more years.
I'm not talking perception here. Instead, I'm talking about facts. Blyleven was one of the best pitchers in the league in 1971, 1973, 1974, 1975, 1976, 1977, 1981, 1984, 1985, 1986, and 1989. I won't go through all the details here but will point you to this article instead.
TOP FIVE RANKINGS
SO:   13x (including 6 consecutive years from 1971-76)
K/BB: 13x (including 7 straight from 1970-76)
SHO:   9x (led the league 3x)
ERA:   7x
ERA+:  7x (led league in 1973)
WHIP:  7x
Blyleven also placed in the top five multiple times in many other categories, including W, H/9, BB/9, K/9, IP, GS, and CG.
Baines, on the other hand, was rarely among the top hitters in the league. Given that there are about twice as many batters in the starting lineup as there are pitchers in the starting rotation, I'll expand the rankings to ten in order to be fair to Baines.
TOP TEN RANKINGS
AVG:   3x (with a high of 6th in 1985)
OBP:   1x (7th in 1989)
SLG:   1x (led league in 1984)
OPS:   3x (high of 6th in 1984)
OPS+:  4x (high of 5th in 1989)
TB:    2x (high of 5th in 1984)
HR:    1x (9th in 1984)
RBI:   2x
Baines also ranked in the Top 10 at least twice in 3B, G, and AB.
We can also compare Blyleven and Baines by looking at their Black Ink, Gray Ink, HOF Standards, and HOF Monitor. There is some double counting with the top five and ten rankings above, but these tallies are instructive nonetheless. The overall ranks are in parentheses.
BLYLEVEN
Black Ink: Pitching - 16 (129) (Average HOFer ~ 40)
Gray Ink: Pitching - 239 (24) (Average HOFer ~ 185)
HOF Standards: Pitching - 50.0 (36) (Average HOFer ~ 50)
HOF Monitor: Pitching - 120.5 (68) (Likely HOFer > 100)
BAINES
Black Ink: Batting - 3 (499) (Average HOFer ~ 27)
Gray Ink: Batting - 40 (595) (Average HOFer ~ 144)
HOF Standards: Batting - 43.5 (116) (Average HOFer ~ 50)
HOF Monitor: Batting - 66.5 (267) (Likely HOFer > 100)
Baines was good but Blyleven was great.
With almost all of the current Hall of Famers, there is a period in their careers in which they had a turn as The Man. Blyleven was clearly a very good pitcher for a long time, but did he dominate his league the way other current and future Hall of Famers have -- Seaver, Gibson, Carlton, Clemens, Johnson, Maddux, Martinez?
I didn't realize that those seven pitchers were the standards. I mean, one could easily argue that Olney's talking about six of the top dozen pitchers in the history of baseball and another who certainly belongs in the top 20. Why does a pitcher have to "dominate his league" in the manner of these inner circle Hall of Famers in order to get elected as well?
I can't find another Hall of Famer voted in by writers with less than three All-Star appearances; Blyleven had two. Blyleven never finished first or second in Cy Young balloting and was never the most coveted free-agent pitcher or the object of a huge bidding war in trade talk, the way that Tom Seaver and even Vida Blue were.
"Never the most coveted free-agent pitcher or the object of a huge bidding war in trade talk." When did either become criterion for the Hall of Fame? I mean, Buster is groping here. It sounds to me like he might be looking for a reason to vote for Mike Hampton when he becomes eligible down the road. With respect to All-Star appearances, I say "big deal." I addressed this matter last month in response to naysayers like Olney.
During the course of Steve Carlton's career, he finished in the top three in his league in ERA, strikeouts, victories or Cy Young voting 23 times. Tom Glavine has done that 14 times; Roger Clemens 38. Nolan Ryan did this 23 times; Fergie Jenkins 18; Don Sutton 6, Ron Guidry 11, Randy Johnson 35; Blyleven, 12 times.
Notice the three-card monte trick Buster is pulling here? He switches from "first or second in Cy Young balloting" a couple of excerpts above to "top three" in the latest. Besides, combining rankings of stats with vote totals doesn't make a whole lot of sense to me. Be that as it may, let's run this same exercise using "top five" rather than "top three" and see what we come up with here. Why he picked these pitchers, who knows? But let's give it a go, huh?
                  ERA     SO     W    CYA    TOT
Blyleven            7     13     2      3     25
Carlton             5     12     8      6     31
Glavine             5      1     8      6     20
Clemens            12     16    11     10     49
Ryan                5     18     3      6     32
Jenkins             0      8     7      5     20
Sutton              4      3     4      5     16
Guidry              3      5     4      4     16
Johnson             8     13    10      9     40
Hmmmph. Blyleven doesn't look so bad now. Funny how that works. Instead of placing seventh out of nine under Olney's methodology, Blyleven now ranks in the center, trailing only Clemens, Johnson, Ryan, and Carlton while beating out two Hall of Famers in Jenkins and Sutton and one HOFer-to-be in Glavine (as well as Guidry). Looks like an argument on behalf of Blyleven rather than against.
In his second year on the Hall of Fame ballot, in 1999, Blyleven got 14.08 percent of the vote. I can find only one example since 1969 in which a player ever polled that low among writers and was subsequently elected -- Luis Aparicio, who got 11.97 percent of the vote in 1981 and was elected in 1984.
What does this have to do with anything? The writers got the vote wrong. What else is new?
What I wanted to hear from his peers, the guys who faced him, was this: He was easily among the most dominant pitchers of our generation; he wasn't Seaver or Carlton, but he was right there behind them. If I had heard that from even half of those I talked to, I would've reconsidered my vote. What I heard from almost all of them was this: He had a great curveball and he could be really tough. I wanted to vote "yes" for Blyleven; I did not.
Whom did he poll? Obviously not George Brett. "He was as good as there was for a long time. Bert is up there with the toughest four or five guys I faced in my career. Hopefully, he will get in. I'd think he'd be a perfect fit."
"Was as good as there was for a long time." Sounds pretty dominant to me. And coming from one of the best hitters of his generation to boot, a player who happened to face Blyleven more than any other batter this side of Reggie Jackson.
"Bert is up there with the toughest four or five guys I faced in my career." I would imagine so. Brett went 27-for-117 vs. Blyleven with only 2 HR, good for a batting line of .231/.281/.342. Boy, that Blyleven guy must have been lucky to do so well against a three-time batting average champ and first-ballot Hall of Famer like Brett.
"Hopefully, he will get in. I'd think he'd be a perfect fit."
Touche.
[Additional reader comments and retorts at The Baseball Think Factory.]
| Past Times | January 12, 2007 |
Double Minded
The longevity of baseball records such as Joe DiMaggio's 56-game hitting streak or Ted Williams' .406 season (both in 1941) are cited as evidence of the impressiveness of such feats.
Another record that is a reliable indicator of a hitter's effectiveness has gone virtually unchallenged since it was set in 1931, and a milestone that has stood for 75 seasons is completely overlooked. Journeyman Earl Webb hit .333 (seventh in the American League) for the Red Sox in that Great Depression year, but that wasn't his top statistic.
The left-handed hitting outfielder smacked 67 doubles in 589 at-bats during the best season of his career. Not only has Webb's record stood for three quarters of a century, but it has never been seriously challenged since 1936, when Joe Medwick hit 64 two-baggers for the Cardinals. Hank Greenberg also came close with 63 doubles in 1934. Prior to Webb, the league recordholders were George Burns (Indians) with 64 in 1926 and Paul Waner's (Pirates) 62 doubles in 1932.
Since most of the yearly and career doubles leaders are among the top players of all time or at least All-Star caliber performers, Webb's long-running reign is something of an anomaly. While he did hit .306 lifetime with five teams from 1925 to 1933, Webb recorded just 2161 big league ABs and 661 hits in that span.
Like many players of the era, Webb's career didn't progress in a normal, orderly 21st century pattern. Aside from a four-game cup of coffee with the Giants, Webb didn't see significant time in the majors until he was 29 years old. Some SABR members have speculated that Webb might have stopped at second base on potential triples to pad his doubles record, but that seems unlikely.
Statistics and records attracted far less publicity 75 years ago than they do today. ESPN, MLB.com, Bill James and his disciples plus the hordes of TV cameras that are a part of the scene today didn't exist. Even Ty Cobb's 4000th hit in 1927 received scant attention and generated little newspaper copy, so a fringe record like doubles was sure to be ignored.
Although it's easy to assume that Webb flicked piles of opposite-field doubles off the Green Monster in '31, that hypothesis doesn't stand up, as Fenway Park's famed left field fence didn't reach its current height until 1934. Webb may have picked up a few two-baggers to left, but most of his home field doubles landed in Fenway's spacious power alleys.
How about hitting 60 doubles, which is still well short of breaking Webb's record? Charlie Gehringer is the only player besides Medwick to reach that mark in the past 70 years, as he smacked 60 two-baggers in 1936. When going through the list of the top doubles hitters, one thing becomes obvious. Whether they are sluggers (Stan Musial, Carl Yastrzemski, Don Mattingly), line-drive types (Pete Rose, Wade Boggs, Joe Sewell) or from the dead ball era (Nap Lajoie, Honus Wagner, Ty Cobb, Tris Speaker), players who produce 35 or more doubles a season with regularity are consistently among the best hitters in the game.
While there are occasional jourmeymen exceptions among the league leaders such as Billy Gardner (36 doubles for the Orioles in 1957) and Lee Maye (44 with the Milwaukee Braves in 1964), the parallel between doubles and overall hitting ability is obvious. The stats for "swing from the heels, high strikeout" types support this argument.
Take two of Dave Kingman's typical seasons as an example. In 1976, "Kong" slugged 37 home runs with 86 RBI for the Mets. His other stats include a .238 batting average (113 for 474), 135 strikeouts, 14 doubles and just 28 walks for a meager on-base percentage of .286.
Kingman's second tour of duty with the Mets in 1982 was an even more extreme exercise in one-dimensional offense. His .204 average (109 for 535) stands out despite 37 HR and 99 RBI. Just nine doubles and 156 Ks made Kingman the ultimate all-or-nothing hacker. His 59 walks were an improvement over 1976 and bumped his OBP to .285.
Rob Deer was a more selective version of Kingman, and he cloned Kingman's 1976 (113 for 474/.238) performance with the Brewers in 1987. Deer's 28 HR and 80 RBI came with an American League record 186 whiffs and just 15 doubles. On the plus side, Deer drew 86 walks for a decent .360 OBP.
Deer compiled some of the most unusual stats in history with the Tigers in 1991. He hit just .179 (80 for 448) with 25 HR and 64 RBI. There were no quick ABs for Deer that season, as he had 175 strikeouts and 89 walks. Deer had just 14 doubles while putting up this freak show of a performance.
Not many players can add 68 points to their batting average and still come in under .250, but that's what Deer did in 1992 when he hit .247 in 393 ABs. The stat line includes 32 HR, 64 RBI and 20 doubles, or six more than the previous season in 55 fewer ABs. Deer's strikeouts and walks declined to 131 and 51, respectively.
When it comes to all-or-nothing sluggers (with the emphasis on nothing), Dave Nicholson stands out from the pack. Touted as the great hope for the power-starved White Sox in 1963, Nicholson came through with 22 HR and 70 RBI. That was the good news.
The rest of the stats includes a .229 average, 175 strikeouts and just 11 doubles in 449 ABs. Nicholson's lack of ability to make contact reached surreal proportions in 1964, when he whiffed 126 times in just 294 at-bats. Thirteen homers and 39 RBIs were accompanied by just six doubles and a .204 average. Nicholson did draw some free passes, as he piled up 102 walks over those two seasons.
For his career, Nicholson hit just .212 with a staggering 573 Ks in 1419 ABs. His 61 homers nearly doubled his puny total of 32 doubles. Mark McGwire's final year in 2001 is something like Nicholson or Deer. Big Mac's 29 homers in just 299 at-bats looks good, but he hit a meager .187 with just four doubles and 118 strikeouts.
On the other end of the power spectrum, defensive whiz Rafael Belliard is an ultimate example of the sure-handed middle infielder with "automatic out" written on him. In a long career (1982-98), Belliard had just 55 doubles in 2301 ABs. A .221 average, .270 OBP, two home runs and 142 RBI round out the stats.
Although he had four triples in 286 at-bats with the Pirates in 1988, Belliard managed to avoid hitting a double all season. A .213 average and 11 RBI doesn't look out of place in his year-by-year numbers.
A steep falloff in doubles can be a sign of aging and declining offensive production.
Musial - a doubles machine and an eight-time National League leader in that category - hit just 10 two-baggers in 337 ABs with a .255 average in his final season in 1963. The decline in his usually high number of doubles had begun four seasons earlier. Likewise, Rose had just 14 doubles and 0 HRs while hitting .245 in 493 ABs at age 42 in 1983.
Gil Hodges was a clutch-hitting slugger and Gold Glover at first base, but the ravages of age also caught up with him. Playing on bad knees in 1961 and 1962, the New York fan favorite hit just five doubles in 342 at-bats with the Dodgers and first-year Mets. Solid-hitting, four-time Gold Glove shortstop Alan Trammell had just a pair of doubles over 193 ABs during his final season with the Tigers in 1996.
The trend can also apply to role players. Eddie Robinson slammed 16 homers in just 173 ABs with the Yankees in 1955 (Yankee Stadium's short rightfield fence didn't hurt the lefty swinger). There was a lone double among his 36 hits. Robinson's .208 BA wasn't as bad as it looked, as 36 walks led to a .358 OBP.
That the was the last hurrah for a three-time member of the 100-RBI club. Robinson bounced among five American League teams in 1956 and 1957, hitting just .196 (52 for 265) with seven doubles, eight dingers and 26 RBI.
Take a look at historically weak-hitting teams, and you'll find they almost always bring up the rear in the doubles department.
The punchless 1942 Phillies (42-109) scored just 396 runs. While they edged out the New York Giants by a 168-162 margin in doubles to avoid last place in that category, the Giants outhomered the Phils by a 109-44 margin. In addition, the Polo Grounds seems to be a unfriendly environment for doubles.
With a .231 team average and a roster of inexperienced pitchers and position players, it's no surprise that the 1952 Pirates finished at 42-112. The team hit 181 doubles (last in the majors) in spacious, extra base-friendly Forbes Field while scoring 515 runs.
As second-year expansion teams, the Mets and Houston Colt .45s spent 1963 scoring as few runs as possible.
The Colts his .220 with 464 runs scored, while Casey Stengel's collection of castoffs hit .219 and produced 501 runs. The 170 doubles by the Colts and 156 two-baggers from the Mets were the lowest in the majors.
Opposing pitchers welcomed the San Diego Padres when they debuted in 1969, as the team hit just .225 (.281 OBP) with 464 runs scored even though they faced expansion-diluted pitching. Not surprisingly, the Padres were last in the NL with 180 doubles.
The 1972 Texas Rangers proved to be even more inept than they were as the Washington Senators the year before. Rangers pitchers could have won a lawsuit for nonsupport, as the offensive numbers included a .217 team average, 461 runs scored in 154 games and an American League-low 166 doubles.
Texas hitters (for lack of a better word) proved their versatility by also finishing last in home runs (56), triples (17), OBP (.288) and slugging percentage (.290). On the bright side, the 54-100 team's 926 strikeouts were good for 10th in a 12-team league. Six Rangers with 125 or more plate appearances hit under .200.
Doubles reached a low ebb in the American League from 1967 to 1974, a time when home runs and batting averages were also down. No one reached the 40 mark in those eight years, and the league leaders include Tony Oliva (34 in 1967), Reggie Smith (33 in 1971) and Lou Piniella (33 in 1972).
Pedro Garcia became perhaps the worst player to ever lead the league in an offensive category when he tied with Sal Bando by swatting 32 doubles in 1973. The Brewers second baseman had a solid (for the era) rookie season, hitting .245 with 15 HR and 54 RBI. It was straight downhill from there, as Garcia hit .199 in 452 ABs in 1974. Toss out his rookie stats, and the balance of Garcia's career shows a .208 average (253 for 1217) and just 62 walks.
With the inflated offensive numbers of the steroid era, the 201 doubles by the 2003 Tigers (43-119) are as dismal or worse than some of the weak-hitting teams of previous decades. That's because the next lowest total in the AL was the 274 two-baggers by the Rangers.
Who knows how many routine fly outs from 1980 are now doubles? Fifteen of the 36 seasons of 50 or more doubles in the National League have taken place since 1995, and 14 American Leaguers have done the same. That's nearly a third of the 44 seasons of 50 or more doubles in AL history.
A number of current and recent players have a knack for ending up at second base with one swing. The list includes Todd Helton, Luis Gonzalez, Miguel Cabrera, Garret Anderson, Carlos Delgado, Edgar Martinez, Mark Grace and Jeff Cirillo. Albert Pujols whacks plenty of doubles as well, as he racked up 51 each in 2003 and 2004 along with 47 in 2001. Pujols' gaudy numbers in doubles and homers are comparable to Lou Gehrig. Keep an eye on Freddy Sanchez, as the 2006 NL batting champion (.344, 200 hits) also topped the league with 53 doubles.
Craig Biggio leads active players with 637 doubles, good for ninth all-time. Biggio needs 70 hits in 2007 to reach the 3000 level, and he could end up as high as fifth in doubles (passing Brett's 665, with Wagner, Yaz and Lajoie in between) depending on how he performs. The Astros star has had seven seasons with 40 or more doubles. Biggio topped the majors with 44 two-baggers in strike-shortened 1994. He also led both leagues with 51 doubles in 1998 and 56 in 1999.
Using a sharp fall in doubles as a warning indicator, Frank Thomas is the player to watch in 2007. The Big Hurt has seven seasons of 35 or more doubles on his resume, including an American League-best 46 in 1992. The Big Hurt had just 11 doubles in 466 ABs with the A's to go with his 39 HR and 114 RBI. Will Thomas continue his impressive run production with the Blue Jays, or will he decline rapidly as he approaches age 39?
So who is the king of doubles? Who would you want at the plate with runners on first and second down a run or two in the ninth inning when a long gapper or rope down the line will tie or win the game?
Speaker and Musial are the obvious choices, but I wouldn't cry if Cobb, Brett or Boggs were hitting for my team. From the right side, Biggio or Edgar Martinez are the modern picks, with Lajoie as another excellent choice.
While teams with fewer hits will naturally score lower in the doubles category, the difference goes beyond comparing batting averages. Good all-around hitters consistently smack the ball hard, which naturally leads to high doubles totals. In more than a few cases, young players with gap power (think Brett and Musial) develop into sluggers, while those who hit humpbacked singles and routine fly outs have to find new careers.
| Designated Hitter | January 11, 2007 |
Humm Baby!
Roger Craig retired at the age of 62, following the 1992 season. He completed a career that had spanned 43 years of nearly continuous employment in professional baseball. Craig isn't in the Hall of Fame, and doesn't deserve to be, but his achievements as a player, coach, and manager were many, and his range of experience - success, failure, and just plain adventure - ranks among the more fascinating in the long history of the sport.
Roger Lee Craig was an impressive physical specimen: 6-foot-4, 190 pounds, a right-handed pitcher with big broad shoulders and long, slim legs. He was born in Durham, North Carolina, on February 17th, 1930. Like so many other players through the decades, Craig lied about his age, passing himself off as having been born on that date in 1931. A one-year difference may not seem like much, but the ruse may well have succeeded in gaining Craig opportunities on several rosters.
Most careers include ups and downs, but few have such roller-coaster peaks and valleys as Craig's. Five years after signing off the North Carolina State campus with Branch Rickey's Brooklyn organization, as a major league rookie Craig found distinct success as a key contributor to the pennant and World Series triumph of the fabled "Boys of Summer" 1955 Dodgers. Yet before he reached the majors, Craig had so fiercely struggled with his control that twice he'd been demoted to lower classifications. In one season he walked 173 minor league batters, and in another 175.
After establishing himself as an effective major leaguer in 1955-56, Craig regressed so badly that he was sent back to the minors in 1958, where he endured a hideous 5-17 campaign. But the next year Craig would not only be recalled to the majors in mid-season, but would deliver a tremendous performance, sparking the now-Los Angeles Dodgers to a second-half drive to another pennant and World Series championship. The team sprinted to the 1959 finish, winning 17 of their final 22, and it was Craig anchoring the kick with four victories and a September ERA of 1.01. On the season's final regular season game, Craig delivered a complete-game 7-1 triumph, clinching a first-place tie.
But two seasons later Craig slumped terribly, his ERA ballooning to 6.15, as he was pummeled for 22 home runs in 113 innings. The Dodgers then allowed him to be picked up in the National League's first-ever expansion draft, and thus began the episode for which Craig is probably best-known: he was the ace pitcher for the famously hapless New York Mets of 1962-63. Deployed in a thankless workhorse role, in two seasons Craig appeared in 88 games for the Mets, 64 of them starts, and 469 innings. Despite pitching reasonably well under these brutal conditions - his ERA+ over that span was 92 - Craig was supported so pitifully that his won-lost record was 15-46. That two-season defeat total was the highest recorded by any major league pitcher since the early 1930s, and will almost certainly never be approached again.
Over the 90-day span from May 4 to August 4 of 1963, Craig lost 18 straight decisions, tying the most ever in the National League. With his record standing at 2-20, in an attempt to change his luck Craig switched his uniform number from 38 to 13. On August 9, with two outs and the bases loaded in the bottom of the ninth in a 3-3 tie against the Cubs, Mets' third baseman Jim Hickman hit a high, lazy fly. Cubs' left fielder Billy Williams settled under it, but the descending ball grazed the overhanging Polo Grounds second-deck scoreboard, fewer than 300 feet from home plate: a grand slam! Craig's streak was over. In the post-game clubhouse celebration, Hickman was quoted: "I think he kissed me."
Following that season Craig was traded to the St. Louis Cardinals. In late July of 1964 the Cards were below .500, in seventh place, before roaring down the stretch to capture their first pennant in nearly two decades. In that fall's memorable World Series victory over the dynastic Yankees, Craig was a particular hero, as described by St. Louis shortstop Dick Groat in Danny Peary's We Played the Game:
Game Four was the key game. We had to win it, but Sadecki fell behind 3-0 in the first inning. [Manager Johnny] Keane brought in Roger Craig with men on first and second. He had the best pickoff move in the league besides Elroy Face. And we picked off Mantle at second. That may have been the biggest play of the Series because it prevented them from scoring again. Craig and Ron Taylor shut out the Yankees on two hits for 8 2/3 innings. And in the top of the fifth, Ken Boyer hit a grand slam homer off Al Downing, which was enough for us to win 4-3. That was the turning point in the Series.
Craig's playing career finally reached its end in 1966, and the following year his old organization, the Dodgers, hired him as a scout. Then in 1968 Craig landed his first managerial job, for the Dodgers' Texas League farm club in Albuquerque.
From 1969 through 1977 Craig served as a major league pitching coach, for the Padres and Astros, as well as a stint as a minor league pitching instructor for the Dodgers. Among the pitchers who blossomed under Craig's tutelage in this period were Dave Roberts, Clay Kirby, Fred Norman, and Joe Niekro. In 1978-79 Craig managed the San Diego Padres; in their first season under his guidance the Padres achieved their first-ever winning record.
Then Craig became the pitching coach for the Detroit Tigers. In his playing days Craig's best pitch was the slider, but in Detroit his teaching of the split-finger fastball to Jack Morris gained Craig particular renown as something of a split-finger guru. In the 1984-85 off-season Mike Scott of the Astros sought out Craig and learned the split-finger from him; Scott's career would utterly turn around. Particularly in Scott's case, the split-finger, which became the emblematic pitch of the 1980s, was widely suspected to be something more of a spit-finger - as in foreign substance, that is.
In September of 1985 Al Rosen, newly installed as the General Manager of the San Francisco Giants, hired Craig as his field manager. The once-proud Giants had been encountering hard times: the 1985 club that Craig took over in the season's final couple of weeks lost 100 games for the only time in franchise history, going all the way back to 1883. Craig undertook bold action in 1986, installing as regulars first baseman Will Clark and second baseman Robby Thompson, even though neither had any experience as high as triple-A. The young team was completely revitalized, surging to first place before eventually finishing third. Craig's positive, good-humored spirit was infectious, and with his all-purpose catch phrase, "Humm Baby!" he became an enormously popular figure in the Bay Area.
In 1987 Craig's Giants won their first division championship since 1971, and in 1989 they captured their first pennant since 1962. Craig's managerial style made audacious use of the squeeze play and featured some highly questionable baserunning aggressiveness: for instance, Clark in 1987 was thrown out 17 times in 22 steal attempts. Nevertheless Craig's teams were loose yet focused, and disciplined on defense. Player after player thrived under Craig's firm-but-warm leadership. Among those who achieved career-best performance while playing for Craig were Clark, Kevin Mitchell, and Candy Maldonado, along with pitchers young and old: Jeff Brantley, Mike Krukow, Kelly Downs, Don Robinson, and his most prominent San Francisco split-finger pupil, the wickedly effective Scott Garrelts.
One of Craig's teammates from his Brooklyn days, Randy Jackson, described him this way:
On the road, I ran around with my roommate, Roger Craig ... Roger was probably my favorite roommate. He was a smart, funny guy.
Through the twists and turns of his long career, Craig maintained that sort of popularity. Few figures in the sport were more respected, and few enjoyed careers as interesting as his.
Hall of Famers who were teammates of Roger Craig:
Sparky Anderson, Richie Ashburn, Lou Brock, Jim Bunning, Roy Campanella, Don Drysdale, Bob Gibson, Ferguson Jenkins, Sandy Koufax, Tommy Lasorda, Tony Perez, Pee Wee Reese, Frank Robinson, Jackie Robinson, and Duke Snider.
Additional All-Stars who were teammates of Roger Craig:
Dick Allen, Gus Bell, Ken Boyer, Ralph Branca, Jackie Brandt, Bob Buhl, Lew Burdette, Johnny Callison, Chris Cannizzaro, Leo Cardenas, Gino Cimoli, Mike Cuellar, Ray Culp, Tommy Davis, Willie Davis, Johnny Edwards, Sammy Ellis, Don Elston, Carl Erskine, Ron Fairly, Dick Farrell, Curt Flood, Carl Furillo, Jim Gentile, Jim Gilliam, Dick Groat, Tommy Harper, Tommy Helms, Bill Henry, Ray Herbert, Jim Hickman, Don Hoak, Gil Hodges, Tommy Holmes, Frank Howard, Ron Hunt, Grant Jackson, Larry Jackson, Randy Jackson, Julian Javier, Joey Jay, Cleon Jones, Darold Knowles, Ed Kranepool, Harvey Kuenn, Clem Labine, Norm Larker, Billy Loes, Sal Maglie, Jim Maloney, Felix Mantilla, Lee May, Tim McCarver, Billy McCool, Dale Mitchell, Wilmer Mizell, Wally Moon, Walt Moryn, Charlie Neal, Don Newcombe, Irv Noren, Joe Nuxhall, Jim O’Toole, Jimmy Piersall, Vada Pinson, Johnny Podres, Rip Repulski, Cookie Rojas, Pete Rose, John Roseboro, Bobby Shantz, Chris Short, Curt Simmons, Bob Skinner, Tony Taylor, Frank Thomas, Bill White, Stan Williams, Maury Wills, Rick Wise, Gene Woodling, and Don Zimmer.
Hall of Famers who managed Roger Craig:
Walt Alston and Casey Stengel.
Hall of Famers who were coached and/or managed by Roger Craig:
Steve Carlton, Gary Carter, Rollie Fingers, Gaylord Perry, Ozzie Smith, and Dave Winfield.
Additional All-Stars who were coached and/or managed by Roger Craig:
Kevin Bass, Steve Bedrosian, Jack Billingham, Vida Blue, Jeff Brantley, Bob Brenly, Chris Brown, John Burkett, Brett Butler, Will Clark, Royce Clayton, Chili Davis, Mark Davis, Ron Davis, Larry Dierker, Pat Dobson, Dave Dravecky, Mark Fidrych, Ken Forsch, Phil Garner, Scott Garrelts, Rich Gossage, Billy Grabarkewitz, Atlee Hammaker, Mike Hargrove, Dave Henderson, George Hendrick, Tommy Herr, John Hiller, Randy Jones, Terry Kennedy, Bob Knepper, Mike Krukow, Mike LaCoss, Jeffrey Leonard, Mickey Lolich, Aurelio Lopez, Willie McGee, Greg Minton, Kevin Mitchell, Jack Morris, Terry Mulholland, Joe Niekro, Matt Nokes, Claude Osteen, Dan Petry, Dan Quisenberry, Mike Remlinger, Rick Reuschel, J.R. Richard, Dave Righetti, Lary Sorensen, Chris Speier, Gene Tenace, Robby Thompson, Manny Trillo, Matt Williams, Don Wilson, and Joel Youngblood.
Steve Treder is a staff writer for The Hardball Times, has presented papers to the Cooperstown Symposium on Baseball and American Culture, and had numerous articles published in Nine: A Journal of Baseball History and Culture. A lifelong San Francisco Giants' fan, he is Vice President for Strategic Development for Western Management Group, a compensation consulting firm headquartered in Los Gatos, California.
| Change-Up | January 10, 2007 |
Mixed Up Sox
[Editor's note: Patrick Sullivan has agreed to join Baseball Analysts as a regular contributor. Sully, as he is known throughout the baseball blogosphere, joins us from The House That Dewey Built. He should be familiar to our readers, both as a guest columnist and as a participant in the AL East roundtables the past two years. I have the utmost respect for his analytical and writing skills and am confident that he will be a great addition to our staff. You can learn more about our special friendship here and here. Please welcome Pat aboard and feel free to address him as Sully in the comments section.]
For my introductory Change-Up post at Baseball Analysts, I thought I would tackle something near and dear to my heart. It's a topic that also represents a hat-tip of sorts to my past, both as a fan and blogger. So let's get to it.
Based on the numbers below, which player would you contend had the better career?
           GAMES  AVG  OBP  SLG  OPS+
Player A:  2,089 .298 .352 .502  128
Player B:  2,606 .272 .370 .470  127
Here are some additional numbers, including plate appearances, total bases, bases on balls, outs made and times the player grounded into a double play:
           PA     TB     BB     OUTS   GIDP
Player A:  9,058  4,129  670    6,221  315
Player B: 10,569  4,230  1,391  6,965  227
To give you a sense of peak value, here are their respective best five seasons in terms of OPS+:
Player A    Player B
  158         163
  154         156
  148         148
  141         147
  137         137
To my eye, they look pretty comparable, though I would take Player B's career. He played longer, had a slightly better peak, and derived more of his offensive value from his on-base percentage than he did from his slugging percentage. Quality and quantity. The best of both worlds.
Now what if I told you that Player B played right field and Player A left field? The same output from a right fielder as a left fielder will always be more valuable from the guy playing right because it is a more demanding defensive position. And then what if I told you Player B also won eight Gold Gloves while Player A was considered a mediocre defender at best?
And then what if I told you that the two were not only contemporaries, but teammates? Wouldn't it stand to reason that the media and general public could come to a fair assessment of who the better player was?
Well in case you haven't yet figured it out, Jim Rice is Player A and Dwight Evans is Player B. Rice received 63.5% of Hall of Fame votes yesterday, making him a likely bet to get in on next year's thin ballot. Dewey, on the other hand, never managed 8% of the votes and only managed to stay on the ballot for three years.
So why the perception gap? I have a few theories. For one, Rice had his best seasons early in his career and leveled off some thereafter while Evans started relatively slowly and became a superstar during the middle part of his career. It seems that each had their reputations solidified during their early years - Rice as the superstar and Evans as the good defender with an OK bat.
Also, Rice's best seasons, particularly 1977 and 1978, came for some very good Boston Red Sox teams while Evans did his best work for more mediocre editions of the Carmine Hose in the early 80's. Further, Rice excelled in the back-of-the-trading-card AVG/HR/RBI numbers whereas Evans stood out because he walked a lot, mixed in some pop and played great defense. Evans's statistical edges come in categories less valued by the mainstream. Take all of this together and the inexplicable, that fans and media alike recall Rice's work more favorably than Dewey's, becomes a little easier to account for.
Fan opinion is one thing. Fans are busy. Fans have jobs. Fans do not devote their professional lives to the coverage of baseball. But the media owes the game and the integrity of the Hall of Fame more - not the least of which is a good faith attempt at understanding the sport. Wouldn't it be more useful for you to know, say, that Evans twice led the American League in OPS while Rice did just once (something I had no idea of before researching for this piece) than to listen to story after story about how "Rice was the most feared hitter in the league for a decade?"
Dwight Evans was a better player than Jim Rice and yet the Baseball Writers' Association of America would have you believe that they were not even in the same galaxy as players, with the conventional wisdom being that Rice was better. Well you can take the more "feared" guy. I'll take the more durable player who was the superior offensive force, defender and baserunner.
| Baseball Beat | January 09, 2007 |
Categorizing Pitchers (Part Two): Relievers
As a follow-up to yesterday's Categorizing Pitchers by Batted Ball Types and Strikeout Rates (which focused on starters), today's article is devoted exclusively to relievers.
The graph below includes strikeout and groundball data for every reliever in the majors (defined for this exercise as those with 30 or more innings who started less than one-third of the time). The y-axis is groundball percentage (GB%) and the x-axis is strikeouts per batter faced (K/BF). There are four quadrants with the mid-point equal to the average GB% of 43.30% and average K/BF of 18.63% for relievers. By comparison, starters had a mean GB% and K/BF rates of 43.8% and 15.88%, respectively. Interestingly, while the groundball rates were virtually the same, the average strikeout rate among relievers was 2.75 percentage points higher or 17.3%.
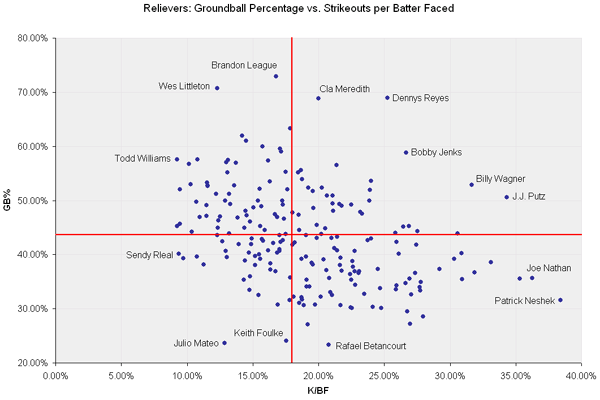
Graph courtesy of David Appelman, FanGraphs.
The average ERA among all qualifiers was 3.90. The average ERA for relievers with above-average K rates was 3.67. The average ERA for those with below-average K rates was 4.13. Similarly, the average ERA for relievers with above-average GB rates was 3.93, while the average ERA for those with below-average GB rates was 3.88.
The average ERA by quadrants:
       W        E
N     4.12     3.55
S     4.14     3.73
As shown, it appears as if groundball rates do not positively impact ERA for relievers - at least not in 2006. Instead, it's all about strikeouts. This is potentially a very interesting and enlightening conclusion.
The various results are also much tighter. As one would expect, the average ERA for each type was lower across the board for relievers than starters. But the disparity in average ERA between relievers with above-average and below-average K and GB rates is not as significant as it was for starters.
ERA is far from foolproof as a measurement of a relief pitcher's effectiveness. Win Probability Added (WPA) is arguably a better metric to use when evaluating relievers. That said, reliever ERA isn't worthless and is a decent indicator of performance.
Let's take a closer look at the results, beginning with the northeast quadrant and going clockwise. The pitchers are sorted by K/BF rates in the first three tables and by GB% in the last table.
NORTHEAST QUADRANT (ABOVE-AVG GB AND K RATES)
Name                    GB%     K/BF
J.J. Putz               50.55%  34.32%
Billy Wagner            52.84%  31.65%
Brad Lidge              43.85%  30.59%
Hong-Chih Kuo           44.30%  27.52%
Tom Gordon              45.28%  26.88%
Bobby Jenks             58.79%  26.67%
Luis Vizcaino           45.12%  26.47%
Taylor Tankersley       44.00%  25.84%
Dennys Reyes            68.99%  25.26%
Mike Wuertz             53.64%  24.00%
Scot Shields            51.93%  23.93%
Scott Williamson        50.00%  23.86%
Adam Wainwright         47.55%  23.30%
Greg Aquino             47.86%  23.18%
C.J. Wilson             49.18%  22.51%
John Grabow             48.97%  21.78%
Matt Thornton           49.33%  21.59%
Ambiorix Burgos         43.32%  21.43%
Fernando Rodney         56.54%  21.38%
Tim Hamulack            48.04%  21.12%
Pedro Feliciano         49.43%  21.09%
Heath Bell              50.85%  21.08%
Juan Rincon             50.92%  20.63%
Aaron Heilman           44.86%  20.51%
Akinori Otsuka          52.33%  20.26%
Jason Isringhausen      43.83%  20.23%
Cla Meredith            68.84%  20.00%
Manuel Corpas           45.45%  19.85%
Joe Kennedy             48.57%  19.59%
Ryan Dempster           51.74%  19.59%
Duaner Sanchez          52.32%  19.21%
Brendan Donnelly        43.62%  19.06%
Mariano Rivera          53.92%  18.77%
Scott Downs             55.60%  18.65%
As shown in the graph, J.J. Putz, Billy Wagner, Bobby Jenks, Dennys Reyes, and Cla Meredith stand out as outliers with significantly higher strikeout and/or groundball rates than the others. Brad Lidge's K rate (30.59%) is worth pointing out. I wouldn't give up on him. He pitched much better on the road (.202/.311/.271) than at home (.267/.350/.509). Anyone who dominated hitters the way he did away from Minute Maid Park can pitch on my team.
SOUTHEAST QUADRANT (BELOW-AVG GB AND ABOVE-AVG K RATES)
Name                    GB%     K/BF
Patrick Neshek          31.58%  38.41%
Joe Nathan              35.62%  36.26%
Takashi Saito           35.50%  35.31%
Francisco Rodriguez     38.55%  33.11%
B.J. Ryan               36.65%  31.85%
Jose Valverde           35.43%  30.94%
Jorge Julio             40.25%  30.88%
Jonathan Broxton        39.25%  30.31%
Jonathan Papelbon       37.35%  29.18%
Logan Kensing           28.57%  27.95%
Kiko Calero             34.90%  27.80%
Fernando Cabrera        33.33%  27.73%
Joel Zumaya             33.98%  27.71%
Scott Eyre              41.77%  27.44%
Mike Gonzalez           36.64%  27.35%
Trever Miller           32.58%  27.05%
Rafael Soriano          27.15%  26.97%
Scott Cassidy           35.51%  26.92%
Brian Sikorski          29.47%  26.76%
Brian Fuentes           34.73%  26.64%
Francisco Cordero       40.10%  26.09%
Kyle Farnsworth         34.25%  25.95%
Derrick Turnbow         42.38%  25.94%
Will Ohman              33.53%  25.87%
Justin Speier           30.07%  24.77%
Damaso Marte            33.80%  24.71%
Joaquin Benoit          37.27%  24.50%
George Sherrill         30.30%  24.14%
Alan Embree             42.95%  23.98%
Jason Frasor            42.66%  23.72%
Eddie Guardado          32.73%  23.49%
Huston Street           36.95%  23.10%
Dan Wheeler             36.55%  23.05%
Joe Nelson              34.45%  22.80%
Justin Duchscherer      36.88%  22.77%
Ron Mahay               40.63%  22.76%
Bob Howry               37.79%  22.61%
Tyler Johnson           38.78%  22.56%
Rick Helling            30.11%  22.54%
Chad Cordero            35.32%  22.48%
Jon Rauch               30.20%  22.45%
Arthur Rhodes           36.43%  22.43%
David Aardsma           36.99%  21.78%
Rudy Seanez             30.63%  21.69%
Scott Linebrink         39.37%  21.66%
Jimmy Gobble            38.04%  21.62%
Ramon Ramirez           40.72%  21.40%
Tyler Yates             41.18%  21.20%
Joe Borowski            32.50%  21.05%
Vinnie Chulk            43.07%  20.98%
Scott Proctor           33.00%  20.89%
Kevin Gregg             35.66%  20.82%
Rafael Betancourt       23.35%  20.78%
Emiliano Fruto          37.14%  20.61%
Randy Flores            39.06%  20.41%
Trevor Hoffman          32.24%  20.16%
Kurt Birkins            43.02%  19.85%
Ron Villone             30.74%  19.73%
Aaron Fultz             38.18%  19.56%
Brandon McCarthy        38.46%  19.49%
Kevin Correia           34.12%  19.32%
Russ Springer           27.06%  19.17%
Chris Ray               35.33%  19.10%
Guillermo Mota          34.12%  19.09%
Scott Dohmann           39.58%  19.05%
Jamie Walker            30.61%  18.88%
Joel Peralta            31.72%  18.75%
Jose Capellan           32.06%  18.71%
Andy Sisco              39.23%  18.71%
The outliers depict why Minnesota's bullpen was so effective last year. Just as Reyes was one of the standouts in the NE quadrant, Patrick Neshek and Joe Nathan head the group of relievers with above-average strikeout and below-average groundball rates. Add Juan Rincon (50.92% GB and 20.63% K/BF) and Jesse Crain (55.19%/18.46%) to the mix and the Twins received 307 relief innings at an ERA of 2.35.
SOUTHWEST QUADRANT (BELOW-AVG GB AND K RATES)
Name                    GB%     K/BF
Christopher Britton     31.06%  18.55%
Jeremy Accardo          42.27%  18.18%
Armando Benitez         32.20%  18.13%
Bob Wickman             41.76%  18.03%
Jonathan Sanchez        35.77%  17.84%
Jason Bergmann          31.55%  17.82%
Keith Foulke            24.05%  17.56%
Chad Paronto            42.60%  17.30%
Neal Cotts              42.29%  17.13%
Fernando Nieve          40.97%  17.03%
Matt Capps              40.65%  17.02%
Jeremi Gonzalez         30.77%  16.92%
Bryan Corey             40.34%  16.87%
Ken Ray                 36.89%  16.72%
Mike Stanton            42.11%  16.55%
Randy Messenger         38.38%  16.36%
Travis Harper           37.24%  16.33%
Brian Tallet            40.76%  16.16%
Roberto Novoa           42.56%  15.77%
Brandon Lyon            42.86%  15.70%
Tony Pena               39.22%  15.56%
Josh Hancock            40.08%  15.48%
Bruce Chen              32.56%  15.45%
Danys Baez              39.68%  15.18%
Ryan Vogelsong          38.02%  15.17%
Esteban Yan             42.98%  14.91%
Brandon Medders         41.88%  14.87%
David Riske             35.97%  14.81%
Wil Ledezma             33.51%  14.77%
Roman Colon             40.31%  14.71%
Fabio Castro            38.89%  14.40%
Jorge Sosa              35.34%  14.31%
Jake Woods              41.95%  13.95%
Chad Gaudin             39.49%  13.04%
Jon Adkins              40.70%  12.93%
Julio Mateo             23.63%  12.86%
Danny Miceli            42.42%  12.68%
Brian Meadows           38.13%  11.25%
Mike Timlin             39.65%  10.75%
Brian Sweeney           39.27%   9.70%
Sendy Rleal             40.13%   9.36%
Except for a few closers who have fallen from grace, this is a pretty non-descript group of pitchers. I don't think I would want to bank on any of these relievers. Sendy Rleal should give thanks for having had the opportunity to pitch in the big leagues last year. It would be one thing if he was a left-hander but a RHP with a K/BF rate of less than 10% has almost no chance to survive at this level.
NORTHWEST QUADRANT (ABOVE-AVG GB AND BELOW-AVG K RATES)
Name                    GB%     K/BF
Brandon League          72.87%  16.76%
Wes Littleton           70.75%  12.32%
Chad Bradford           63.30%  17.86%
Ryan Wagner             62.00%  14.18%
Rick White              60.98%  14.49%
Chad Qualls             60.00%  15.73%
Fausto Carmona          59.58%  17.06%
Scott Feldman           59.06%  17.14%
Todd Williams           57.56%   9.23%
Sean Green              57.55%  10.79%
Scott Schoeneweis       57.50%  13.12%
Shawn Camp              57.32%  16.16%
Julian Tavarez          57.01%  12.99%
J.C. Romero             56.97%  13.72%
Joe Beimel              56.78%  10.17%
Salomon Torres          55.24%  17.52%
Jesse Crain             55.19%  18.46%
Brad Thompson           55.14%  13.06%
Chad Harville           53.49%  16.30%
Christopher Sampson     53.27%  11.54%
Todd Jones              52.94%  10.29%
Gary Majewski           52.77%  13.61%
Rick Bauer              52.77%  11.59%
Ray King                52.67%  11.56%
Edwin Jackson           52.10%  15.52%
Mike Wood               52.05%   9.45%
Todd Coffey             52.03%  17.65%
Danny Kolb              51.22%  12.21%
Brian Shouse            51.20%  13.22%
Hector Carrasco         50.00%  17.27%
Geoff Geary             50.00%  15.38%
Lance Cormier           50.00%  12.91%
Jeremy Affeldt          49.70%  10.71%
Braden Looper           49.36%  13.31%
Tom Martin              49.20%  17.29%
Jon Switzer             49.14%  11.46%
Todd Wellemeyer         48.92%  15.65%
Jason Davis             48.66%  15.04%
Matt Belisle            48.06%  14.44%
Darren Oliver           47.76%  18.02%
Mike Myers              47.42%  16.67%
Macay McBride           47.31%  18.47%
Steve Kline             47.20%  14.54%
Jason Grilli            47.09%  11.48%
Ryan Franklin           47.06%  12.54%
Roberto Hernandez       46.97%  16.84%
Matt Herges             46.88%  10.98%
Oscar Villarreal        46.86%  13.85%
Dave Borkowski          46.58%  17.39%
Jose Mesa               46.32%  12.38%
Saul Rivera             46.11%  14.80%
William Eyre            45.62%   9.45%
Elmer Dessens           45.28%  15.57%
Rheal Cormier           45.28%   9.27%
Matt Guerrier           44.96%  12.33%
Matt Wise               44.93%  14.36%
Manny Delcarmen         44.57%  18.52%
David Weathers          44.55%  15.92%
LaTroy Hawkins          44.24%  10.34%
Ruddy Lugo              43.91%  13.22%
Bill Bray               43.83%  17.49%
Brad Halsey             43.61%  12.30%
Craig Hansen            43.55%  17.05%
Brandon League is intriguing. The groundball specialist could become a highly effective set-up man or perhaps even a closer if he can improve his K rate from 16.76% toward 20%. He made huge strides in 2006 and won't turn 24 until March. League was death on RHB (.178/.239/.238) and handled LHB (.276/.323/.362) admirably as well.
In addition to the notes I made at the end of yesterday's article, be aware of the small sample size caveat when it comes to relief pitchers. However, the aggregate results are statistically relevant with more than 10,000 innings measured.
| Baseball Beat | January 08, 2007 |
Categorizing Pitchers by Batted Ball Types and Strikeout Rates
We all know that strikeouts are the best outcome for a pitcher. When a batter fails to put the ball in play, there is little or no chance for him to reach base or to advance runners on base. Among batted ball types, infield flies are the least harmful, followed by ground balls, outfield flies, and line drives. Although groundballs result in a higher batting average than fly balls, their run impact is lower because the hits are usually limited to singles and an occasional double down the first or third base line, whereas balls in the air that turn into hits are almost always doubles, triples, or home runs.
According to Dave Studenmund's Batted Balls Redux article in The Hardball Times Baseball Annual 2007, strikeouts had a run impact of -0.113, infield flies -0.088, groundballs 0.045, outfield flies 0.192, and line drives 0.391 per incident last year.
Based on the above information, it follows that just as pitchers with high strikeout rates would generally fare better than those with low rates, pitchers with high groundball rates would normally fare better than those with low rates (all else being equal). Furthermore, it also suggests that pitchers who combine higher strikeout and groundball rates will outperform those with lower rates.
To provide a visual aid to categorize such pitchers, I created a graph (with the help of David Appelman of FanGraphs), plotting the strikeout and groundball rates for everyone in the major leagues who completed 100 or more innings and started in at least 33% of their appearances. The y-axis is groundball percentage (GB%) and the x-axis is strikeouts per batter faced (K/BF). The graph is divided into four quadrants with the mid-point equal to the average GB% of 43.80% and average K/BF of 15.88%.
The northeast quadrant is comprised of pitchers with above-average groundball and strikeout rates; the southeast quadrant encompasses pitchers with above-average strikeout and below-average groundball rates; the northwest quadrant is made up of pitchers with above-average groundball and below-average strikeout rates; and the southwest quadrant is the home for pitchers with below-average groundball and strikeout rates.
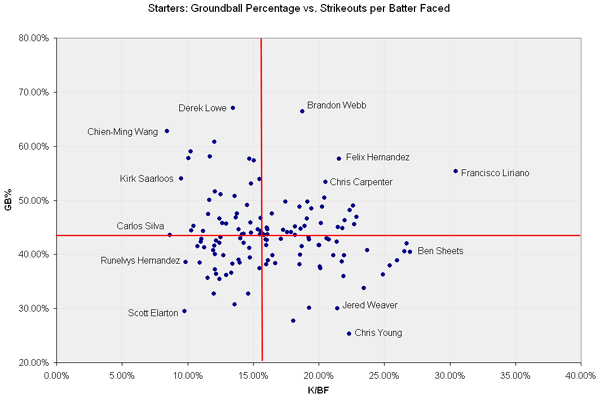
The average ERA among all qualifiers was 4.44. The average ERA for starters with above-average K rates was 4.12. The average ERA for those with below-average K rates was 4.78. Similarly, the average ERA for starters with above-average GB rates was 4.24, while the average ERA for those with below-average GB rates was 4.62.
The average ERA by quadrants:
       W        E
N     4.53     3.94
S     5.01     4.27
Not surprisingly, pitchers with the highest strikeout and groundball rates had the lowest average ERA (3.94), while those with the lowest K and GB rates had the highest average ERA (5.01). In the hybrid categories, pitchers with above-average strikeout and below-average groundball rates (4.27) beat those with below-average K and above-average GB rates (4.53).
Looking at the outliers in the graph would help us reach the same conclusion. There isn't a one of us who wouldn't take Brandon Webb, Felix Hernandez, Chris Carpenter, or Francisco Liriano over Scott Elarton or Runelvys Hernandez. Liriano, in fact, arguably had the best combination of K and GB rates, while Elarton had the worst combo. Lo and behold, Liriano had the lowest ERA (2.16) among starters with at least 100 IP and Elarton had one of the worst (5.34).
Let's take a closer look at the results, starting with the northeast quadrant and going clockwise. The pitchers are sorted by K/BF rates in the first three tables and by GB% in the last table.
NORTHEAST QUADRANT (ABOVE-AVG GB AND K RATES)
Name                    GB%     K/BF
Francisco Liriano       55.33%  30.44%
Carlos Zambrano         46.88%  22.90%
Brett Myers             45.55%  22.69%
Roger Clemens           49.02%  22.62%
Jeremy Bonderman        48.17%  22.37%
John Smoltz             46.29%  21.98%
Scott Olsen             44.80%  21.81%
Felix Hernandez         57.72%  21.57%
C.C. Sabathia           45.05%  21.45%
Chris Carpenter         53.34%  20.54%
A.J. Burnett            50.49%  20.45%
Erik Bedard             48.81%  20.26%
Josh Johnson            45.77%  20.18%
Adam Loewen             48.48%  19.44%
Andy Pettitte           49.77%  19.16%
Dave Bush               46.65%  19.10%
Danny Haren             45.24%  18.92%
Brandon Webb            66.48%  18.74%
Kelvim Escobar          44.70%  18.63%
Roy Oswalt              48.80%  18.53%
Josh Beckett            45.10%  18.18%
Vicente Padilla         44.10%  17.89%
Doug Davis              44.08%  17.59%
Cory Lidle              49.72%  17.45%
Kevin Millwood          44.57%  17.31%
Dontrelle Willis        47.54%  16.41%
Jose Contreras          44.62%  16.09%
Wandy Rodriguez         44.95%  16.04%
That's an elite group of pitchers. The best of the bunch are those with strikeout rates above 20% and/or groundball rates over 50%. I had already signaled out Hernandez, Carpenter, and Liriano, but check out A.J. Burnett. The latter is one of the premier pitchers in baseball when healthy.
While Jose Contreras and Wandy Rodriguez fall into the NE quadrant, both pitchers have K and GB rates that are close to the league average. As such, I would be reluctant to label either one as a special pitcher.
On the other hand, I would be shocked if Hernandez (4.52), Adam Loewen (5.37), and Josh Beckett (5.01) don't lower their ERA by at least 0.50 and perhaps by more than 1.00 in 2007. With Liriano injured, I would rank Felix directly behind Johan Santana as the pitcher most likely to lead the AL in ERA this year.
SOUTHEAST QUADRANT (BELOW-AVG GB AND ABOVE-AVG K RATES)
Name                    GB%     K/BF
Ben Sheets              40.41%  26.98%
Scott Kazmir            41.97%  26.72%
Johan Santana           40.59%  26.54%
Cole Hamels             38.86%  25.99%
Jake Peavy              38.00%  25.41%
Pedro Martinez          36.29%  24.91%
Daniel Cabrera          40.72%  23.72%
Orlando Hernandez       33.78%  23.46%
Chris Young             25.37%  22.31%
Curt Schilling          39.83%  21.94%
Matt Cain               35.98%  21.88%
Aaron Harang            38.69%  21.75%
Jered Weaver            30.03%  21.43%
Mike Mussina            42.37%  21.39%
Javier Vazquez          39.84%  21.10%
Ian Snell               42.78%  20.79%
John Lackey             42.99%  20.61%
Jason Schmidt           37.40%  20.13%
Ted Lilly               37.73%  20.08%
Boof Bonser             41.69%  20.05%
Randy Johnson           41.71%  20.00%
Oliver Perez            30.12%  19.28%
James Shields           42.75%  19.26%
Gil Meche               43.12%  19.24%
Byung-Hyun Kim          41.51%  18.72%
Chris Capuano           39.88%  18.59%
Bronson Arroyo          38.15%  18.55%
Brad Penny              43.54%  18.20%
Chuck James             27.67%  18.06%
Kyle Lohse              42.89%  17.11%
Ervin Santana           38.41%  16.67%
Claudio Vargas          39.86%  16.47%
Ricky Nolasco           38.84%  16.15%
Taylor Buchholz         43.73%  16.08%
Rodrigo Lopez           42.61%  16.06%
Justin Verlander        41.72%  15.98%
Barry Zito              38.20%  15.98%
Ryan Madson             42.79%  15.97%
There are a couple of dozen outstanding pitchers in this group, most notably those listed in the top half (or with K rates over 20%). Ben Sheets, Scott Kazmir, and Santana had almost identical K and GB rates. Cole Hamels and Jake Peavy rank just below this threesome with metrics not too dissimilar from one another or those immediately above them.
Oliver Perez (6.55) has the most room to shave a couple of runs off his ERA. Having gone to bat for Daniel Cabrera (4.74) last year, I hesitate to bring up his name again but he and Ian Snell (4.74) are good bets to show improvement in 2007.
SOUTHWEST QUADRANT (BELOW-AVG GB AND K RATES)
Name                    GB%     K/BF
Chan Ho Park            43.60%  15.84%
Jason Jennings          43.77%  15.74%
Victor Santos           43.64%  15.52%
Brett Tomko             37.47%  15.48%
Tim Wakefield           39.39%  14.75%
Freddy Garcia           41.19%  14.72%
Cliff Lee               32.70%  14.63%
Esteban Loaiza          42.10%  14.29%
Odalis Perez            43.72%  14.14%
Jon Lieber              42.96%  14.01%
Tony Armas Jr.          38.52%  14.00%
Jeff Weaver             38.99%  13.90%
Eric Milton             30.80%  13.60%
Jaret Wright            38.30%  13.44%
Livan Hernandez         36.58%  13.35%
Michael O'Connor        36.17%  12.97%
Jarrod Washburn         39.87%  12.73%
Joe Blanton             43.13%  12.50%
Jae Seo                 35.40%  12.45%
Jon Garland             42.11%  12.44%
Noah Lowry              36.38%  12.19%
Josh Fogg               42.55%  12.16%
Jamie Moyer             40.03%  12.08%
Seth McClung            37.25%  12.07%
Brad Radke              41.64%  12.05%
Shawn Chacon            32.70%  12.02%
Ramon Ortiz             40.81%  11.94%
Woody Williams          35.69%  11.54%
Kris Benson             41.32%  11.27%
Jason Marquis           42.88%  11.03%
John Koronka            42.30%  11.01%
Paul Byrd               38.52%  10.93%
Steve Trachsel          41.52%  10.73%
Runelvys Hernandez      38.58%   9.84%
Scott Elarton           29.49%   9.78%
Carlos Silva            43.62%   8.63%
This is the quadrant that you want to avoid. It is inhabited by some of the worst starters in the game. If you fail to miss bats and don't keep the ball on the ground when it is put into play, you are going to run into trouble. There is basically only one way to survive in this quadrant: throwing strikes and maintaining a low walk rate. Freddy Garcia, Jon Lieber, Jon Garland, Brad Radke, Paul Byrd, and Carlos Silva fit this description. But these types of pitchers live on the edge with very little margin for error.
Chan Ho Park, Jason Jennings, and Victor Santos were near league average in K and GB rates and should be classified more like Jose Contreras and Wandy Rodriguez (both of whom fell in the NE quadrant) than the rest of their SW brethren.
NORTHWEST QUADRANT (ABOVE-AVG GB AND BELOW-AVG K RATES)
Name                    GB%     K/BF
Derek Lowe              67.04%  13.47%
Chien-Ming Wang         62.80%   8.44%
Jake Westbrook          60.80%  12.06%
Jason Johnson           59.02%  10.25%
Jamey Wright            58.06%  11.69%
Aaron Cook              57.77%  10.05%
Tim Hudson              57.66%  14.70%
Roy Halladay            57.33%  15.07%
Kirk Saarloos           54.00%   9.49%
Clay Hensley            53.87%  15.50%
Paul Maholm             53.05%  14.85%
Miguel Batista          51.66%  12.09%
Zach Duke               51.12%  12.51%
Greg Maddux             50.80%  13.57%
Kenny Rogers            50.07%  11.66%
Luke Hudson             49.10%  14.55%
Mark Hendrickson        47.59%  13.77%
Joel Pineiro            47.46%  11.55%
Sean Marshall           46.81%  13.68%
Nate Robertson          46.75%  15.55%
Jeff Suppan             46.65%  12.43%
Casey Fossum            45.88%  14.81%
Aaron Sele              45.76%  12.64%
Matt Morris             45.66%  12.96%
Brian Moehler           45.25%  10.43%
Jeff Francis            44.67%  13.88%
Anibal Sanchez          44.61%  15.35%
Mark Redman             44.41%  10.27%
Mark Buehrle            44.35%  11.19%
Tom Glavine             44.28%  15.56%
Elizardo Ramirez        44.00%  14.84%
Enrique Gonzalez        43.84%  14.29%
This is an interesting group of pitchers. As a whole, they rank well behind those in the NE quadrant and well ahead of those in the SW quadrant. Although they are the opposite of the pitchers in the SE quadrant, their results (in terms of ERA) are the most similar. The two groups just get there in drastically different ways. The NW pitchers succeed by inducing grounders and keeping the ball in the park, whereas the SE hurlers thrive on strikeouts.
Derek Lowe, Chien-Ming Wang, and Jake Westbrook are the biggest outliers - three pitchers who turned more than 60% of batted balls into grounders. As such, Lowe (0.58), Wang (0.50), and Westbrook (0.64) had extraordinarily low HR/9 rates. They also have one other common thread: low walk rates. Lowe (2.27), Wang (2.15), and Westbrook (2.34) offset their high hit rates by limiting the number of bases on balls.
Roy Halladay, Clay Hensley, Nate Robertson, Anibal Sanchez, and Tom Glavine - all with K/BF rates exceeding 15% - are within a few whiskers of being in the NE group. However, Sanchez and Glavine are close to league average with K rates just to the west and GB% slightly to the north of the means.
I would rather know a pitcher's strikeout and groundball rates than his ERA. Throw in a third dimension - walk rates - and you have almost everything you need to know about a pitcher. Focusing on the components gives one a much more comprehensive understanding of a pitcher's upside and downside than looking at a single metric such as ERA.
(Notes: I could have chosen run average (RA) rather than earned run average (ERA), but the results would have been essentially the same in both direction and magnitude. As previously demonstrated, groundball pitchers generally give up a greater percentage of unearned runs because more errors (of the fielding and throwing type) are committed on grounders than balls hit in the air. Ballpark factors, team defense, and the level of competition may affect the components and/or ERA to varying degrees.)
Tomorrow: Categorizing Relievers by Batted Ball Types and Strikeout Rates.
| Baseball Beat | January 06, 2007 |
Weekend Ramblings
This weekend's column segues from one point to another, covering the Randy Johnson trade to Bert Blyleven's Hall of Fame candidacy with a musing here and there along the way.
The theme of the first two bullet points is the following: "When you don't have a sound argument, fall back on the fact that you know better than everyone else because you have been around awhile."
With a tip o' the cap to Repoz at The Baseball Think Factory, here is an exchange between Kay and Chris from West Nyack (as transcribed by Ken at Fire Joe Morgan):
Kay: Randy Johnson won 17 games last year in the toughest division in baseball...People say he didn't win in the playoffs. Neither did Mike Mussina and we signed him to a two-year extension. He's well worth the money he has on his contract....16 million. He won 17 games...please don't forget that.Chris: You keep saying that it's important that Randy Johnson won 17 games, but equally as important is, he had a five ERA.
Kay: Why does that matter? Only thing that matters is the W.
Chris: The win is the function of the team. But the ERA is more indicative of how he pitched.
Kay: How come Mike Mussina didn't win 17 games?
Chris: This isn't about Mike Mussina. How many pitchers in the AL would win 17 games if they pitched behind the Yankees. With that run support?
Kay: But...but...It doesn't matt...I again I tell you I understand what you're saying that it's a function of a team but I also say it's a function to a...You're a Yankee fan right? They scored eight runs he gave up six...they won, so what....he's a veteran pitcher that knows how to pitch to the score so his ERA is going to be higher. It doesn't matter. All that matter is if he wins and loses.
Chris: Any pitcher who gives up six runs a game under your scenario would win 17 games.
Kay: Pitchers pitch to the runs they are given. Good pitchers do that.
Chris: That's not true. Pitchers are going out there to give up the fewest runs possible.
Kay: No. If the Yankees score 8 runs in five innings he's not going for the shutout!
Chris: What about the year Jason Marquis won 15 games and had a 6.21 ERA. Are you impressed with that?
Kay: No, not in the National League.
Chris: What if he did it in the American League?
Kay: Yeah. I would [be impressed].
Chris: So you would take someone like that over Kevin Millwood in '04 who went 9-13 in and won the ERA title with Cleveland.
Kay: I'm gonna tell you why, and you are bringing up good points so I am not going to say that you are 100% wrong here. I believe by watching baseball my whole life and being involved with it for 25 years is that there is nothing harder to do in sports than to win a game by a pitcher.
[Ken inserts the following comments on FJM - "Nothing harder, save for the fact that in every major league game that has ever been played it has happened exactly one time."]
Kay: That's why the era of the 300 win pitcher is going. It's not easy to win games. And there is an art to it. So if the art is to win 17 games and have a 5.00 ERA I don't care. All these sabermetricians get locked up with all of these stats and I don't. You know what stat I care about? Did he win the game?
Would you rather have a guy really lose a good game. "Wow, he pitched well -- we only lost 2-1!" I always said this about those pitchers, "Oh, the Yankees only scored one, then you have to give up zero." In twenty years you're going to look back on Mike Mussina in game 2 against the Tigers...had a 3-1 lead and we lost 4-3....That's not that bad...yeah, it is bad! He gave up runs he shouldn't have given up!
I don't care that his ERA was 5. It was good enough to win 17 games. Mike Mussina didn't win 17 games.
[Kay closes the exchange with Chris, who has remained silent during the former's diatribe.]
Kay: You are wrong in that sense...dead wrong.
"Watching baseball my whole life and being involved with it for 25 years." Just precious. As a commenter asked at the BTF, I wonder why Johnson didn't "pitch to the score" in 2004 when he went 16-14 with a 2.60 ERA for Arizona? He must have forgotten how or perhaps the 43-year-old veteran of 19 big league seasons just learned this skill in the past two years.
15. Bert Blyleven, Stat freaks love this guy. It's true that his 3,701 strikeouts (fifth all-time) and 287 career victories are numbers that are generally good enough for enshrinement, but unlike a lot of those stathounds, I saw the entirety of his career and he was rarely one of the best. Had only one 20-win season at a time they weren't so rare and only four years with Cy Young votes.
"I saw the entirety of his career." Well, bust my buttons, that's an expert of a different color. Gotta love the emotional attack on "stat freaks" and "stathounds." If you use stats and your name isn't Heyman, you're either a "freak" or a "hound." If you use stats and your name is Heyman, then it's OK because you were there.
I don't know, Jon. I never saw Ty Cobb, Babe Ruth, Christy Mathewson, or Walter Johnson play in person.
| Designated Hitter | January 04, 2007 |
Baseball Immortality: It's in the Bags
It was essentially a foregone conclusion that Jeff Bagwell would retire after the 2006 season, and he left the game on the field with little fanfare outside of Houston. The last memories of Jeff Bagwell as a player come from his first and only appearance in the grand stage of the World Series in October 2005, with his Astros falling to the Chicago White Sox in just four games, although that certainly is not the legacy he left behind.
During the course of his 15 seasons on the field for the Astros, Jeff Bagwell was one of the most consistent and productive baseball players in either league, and finished his career as one of the top first basemen in history. Sixteen years ago, few would have predicted anything resembling baseball immortality for the man who would become known simply as "Bags."
Jeff Bagwell was born on May 27, 1968; this is the same birthday as fellow first base slugger, Frank Thomas. After attending Xavier High School in Middletown, CT, Bagwell attended the University of Hartford before he was drafted by the Boston Red Sox in the fourth round of the 1989 amateur draft. Bagwell had grown up a Red Sox fan, idolizing Hall of Famer Carl Yastrzemski, and was now a member of the same organization.
In 1989, Bagwell spent most of his season with Winter Haven of the Florida State League. He would hit .310/.384/.419 there while only striking out around 10 percent of the time. He would follow that up with a more impressive stint at New Britain of the Eastern League in 1990: Bagwell hit .333/.422/.457 with 34 doubles and 7 triples, but only 4 homeruns.
The problem was that the Red Sox were seemingly set at third base, Bagwell's position at the time. Future Hall of Famer Wade Boggs was the current third baseman, and the Red Sox had Scott Cooper - who would finish his career with a paltry OPS+ of 89 - waiting in the wings at third base. Lou Gorman, General Manager of the Boston Red Sox at the time, dealt Jeff Bagwell to the Houston Astros in exchange for relief pitcher Larry Andersen. The Red Sox would go on to win the division title, and Bagwell would put together a Hall of Fame caliber career for the 'stros. That trade has been lambasted so universally that it was given its own chapter in Rob Neyer's Big Book of Baseball Blunders:
In the Stats 1991 Major League Handbook - published shortly after the 1990 season - Bill James published projections for 413 major league hitters...But there was another set of projections: fifteen minor-leaguers included under the heading, "These Guys Can Play Too And Might Get A Shot." And among those fifteen minor leaguers was Jeff Bagwell, with a .318 batting average. Better than Tony Gwynn's...the underlying causes of the nonprediction were simple: the Eastern League was a pitcher's league, and New Britain's Willow Brook Park was a pitcher's ballpark. Bagwell was twenty-two in 1990, and he'd batted .333 with thirty-four doubles (tops in the league) and seventy-three walks (fourth in the league). Gorman simply didn't know how good Bagwell was.
Bagwell would appear in only seven more minor league games from this point forward, and those were all for rehab stints. Gorman had dealt Bagwell for a variety of reasons: he would need to switch to first base, he wasn't expected to develop homerun power, and the Sox needed the help badly in the bullpen. Well, Bagwell turned into a Gold Glove first baseman and hit 449 homeruns, but never did develop that secondary pitch that would have made him a valuable mop-up guy out of the pen.
Bagwell's first major league season went very well, with Bags bringing home the Jackie Robinson Award at year's end after hitting .294/.387/.437 in one of the toughest home parks for a hitter in the history of the game - Clay Davenport's translations spit out an equivalent line of .316/.414/.509, to put his production into context. It was not particularly close either, with Bagwell taking all but one first place vote. The following year, Bagwell would hit .273/.368/.444 and be worth 10.4 Wins Above Replacement. Before he even developed the power that he was later known for, Bagwell had already put together a 10-win season; not to continue to beat a thoroughly flogged and quite dead horse, Larry Andersen was only worth 7.9 WARP1 from 1990 Boston to the end of his career with Philadelphia in 1994.
In 1993 Bagwell put together what should have been another 10-win season, but fell just short of that mark as a result of playing in only 142 games. He did manage to hit .320/.388/.516 though, thanks in part to a .342 batting average on balls in play. This was exceptional for the Astrodome, and would only improve the following season, the best of Jeff Bagwell's career.
1994 was cut short for Jeff Bagwell because of a broken hand suffered on a hit-by-pitch as well as the player strike. By season's end, though, Bagwell had posted an OPS of 1.201 by hitting .368/.451/.750. Bags walked 65 times while striking out just as often, hit 39 homeruns in 400 at-bats, finished with 73 extra-base hits, posted the best defensive season of his career according to Rate while winning a Gold Glove, and even stole 15 bases at a 79 percent success rate. Measured by OPS+, Bagwell's season was 113 percent above the average, good for the 24th best mark of all-time, and one point and rank ahead of his birthday mate, Frank Thomas, whose loftiest mark came in 1994 as well. Both players took home the Most Valuable Player award at the end of the year with Bagwell becoming just the fourth player in history to do so unanimously. Bags also won the Silver Slugger Award for first base as well while making the first of three All-Star appearances. Incredibly, most of this production came at home: Bagwell hit .373/.459/.816 in the Astrodome, and "only" .362/.443/.683 on the road. His Davenport Translated line was .370/.464/.792; that's the kind of line that would force Babe Ruth to buy you a beer or two.
In 1995, Bagwell's season was cut short by a broken hand for the third consecutive year. He was vulnerable to inside pitches because of his unique stance; he began in a wide-open, crouched stance - almost like he was sitting in an imaginary chair - and would explode upwards into his swing. He began to wear protective padding on his batting gloves to shield his hands, and did not succumb to a broken hand again. I once wore Jeff Bagwell's batting gloves at the All-Star Fanfest from the 1999 All-Star Game in Boston, and I can vouch for how heavily padded they were. With his now-protected hands, Bagwell was able to post the second-best season of his career in 1996, putting together a 12-win season that was all bat, finishing with a 179 OPS+.
Bagwell's peak offensive years were from 1994-1999, with Equivalent Averages of .385, .318, .355, .342, .335, and .343. According to Jay Jaffe's JAWS system, which leverages career and peak WARP into one number to help determine Cooperstown worthiness, Bagwell's peak WARP score is third best all-time among first basemen, behind only Lou Gehrig and Cap Anson. He was very good-to-excellent from 2000 to 2004, but not quite as dominant as his peak. The Astros signed him to a five-year extension in 2001 that would prove ill-fated, as Bags' arthritic shoulder began to bother him to the point of missing significant chunks of time in the fourth year of the deal.
During the 2004 season, Bagwell was able to exorcise the playoff demons that haunted the Astros' Killer B's from their first playoff trip in 1997 up through 2001. He hit .318/.400/.682 in the National League Division Series against the Braves and .259/.355/.333 against the Cardinals in the National League Championship Series, vast improvements on his career playoff line of .174/.344/.174 prior to that year. The lack of timely playoff hits had plagued the Astros' most productive hitters every year they failed to win a playoff series, although the sample sizes were small and the circumstances usually beyond their control.
Bagwell also had some interesting streaks in his career: from 1996 to 2001, he hit 30 homeruns, drove in 100 runs and scored 100 runs. From 1996 to 2002, he walked at least 100 times, and had six seasons with over a .300 batting average, much to Lou Gorman's chagrin. Bagwell also managed to steal 202 bases over his career while only getting caught 78 times (72 percent success). In 1997, he became the first player at first base to record over 30 homeruns and 30 steals in the same season, a feat he duplicated in 1999. As previously mentioned, Bagwell was a fine defensive first baseman, with 127 Fielding Runs Above Average to his credit, as well as a Gold Glove in 1994.
He would play his last game in front of the hometown Astros fans at Minute Maid Park, coming to bat as a pinch hitter who did not reach base; an anticlimactic ending for an incredible player in his first trip to the World Series. With the end of his career, eyes now turn towards his Hall of Fame credentials. Some may question the validity of his statistics because of the era he played in, and others may take his numbers at face value with nary a mention of performance enhancing drugs in his history. Statistically, Bagwell is a shoo-in [corrected], with his Hall of Fame Monitor score of 149.5 where the average Hall of Famer is 100, and his Hall of Fame Standard score of 59.0 where the average Hall of Famer is a 50, as well as his JAWS score of 106.4, third all-time among first basemen. Whether or not he actually makes it is another story entirely, as he finished with 2,314 hits and 449 homers, relatively low totals for Hall of Fame first basemen, or so the belief goes among more traditionally minded baseball fans.
Jeff Bagwell could be a victim of his success in other areas; Bill James has said that players who do very well in many aspects of the game are often overlooked in favor of those who excel greatly in just one area, and Bagwell was an extremely well-rounded player, especially for a first baseman. Here's hoping from one of his fans that history smiles kindly upon him and remembers the man for what he contributed in all facets of the game, rather than a lack of 3,000 hits or 500 homeruns or some such nonsense.
Marc Normandin is a communication major at Merrimack College in Massachusetts, and currently writes a weekly column for Baseball Prospectus. He also contributes to the digital magazine HEATER, writes occasional guest columns at Mets Geek, and posts analysis at his blog Beyond the Box Score.
| Baseball Beat | January 03, 2007 |
Run Element Ratio
In the 1988 Baseball Abstract, Bill James introduced the concept of "run element ratio" when discussing Rickey Henderson in the Player Ratings and Comments section.
Run element ratio divides the parts of secondary average into that which is valuable early in the inning, valuable for scoring runs (walks and stolen bases) and that which is valuable late in the inning, or valuable for driving in runs (power). The formula is (SB+BB)/(TB-H). If a player is over 1.00, then generally speaking you want him up early in the inning. If he is under 1.00, then he is more valuable later in the inning. Vince Coleman's career run element ratio is 4.4, meaning that he has little use except as a leadoff man; Don Mattingly's is .38, meaning that he is much more valuable later in the inning.
With the foregoing in mind, I thought it would be interesting to examine the run element ratio leaders and laggards for the 2006 season.
TOP 20
 1. Joey Gathright       3.05
 2. Jason Kendall        2.46
 3. Willy Taveras        2.09
 4. Dave Roberts         2.00
 5. Brad Ausmus          2.00
 6. Scott Podsednik      1.96
 7. Felipe Lopez         1.89
 8. Luis Castillo        1.88
 9. Chone Figgins        1.77
10. Bobby Abreu          1.71
11. Nick Punto           1.68
12. Ryan Freel           1.62
13. Kenny Lofton         1.60
14. Brady Clark          1.53
15. Omar Vizquel         1.48
16. David Eckstein       1.46
17. Ichiro Suzuki        1.45
18. Brian Giles          1.40
19. Jamey Carroll        1.38
20. Craig Counsell       1.35
The number one mission for any leadoff hitter is to get on base. As James points out in another essay (entitled "The Lineup") in the same Abstract, "The largest determination of how many runs are likely to be scored in an inning is whether or not the lead-off man reaches base. If the lead-off man reaches base, the number of runs that will probably be scored in an inning is about three times as high as if the lead-off man is put out."
Players with high OBP and high run element ratios are ideal leadoff hitters, especially if they also run the bases well. Brad Ausmus, for example, doesn't have a high OBP (.308) and isn't as fast as he was earlier in his career. Therefore, he is an outlier and would not be a good fit at the top of a lineup.
In the Cory Snyder comments, James lists the players with the lowest run element ratios. Well-known names include Mattingly, Mark McGwire, Jim Rice, Harold Baines, Will Clark, and Joe Carter. "These are all players who are much better at finishing trouble than at starting it."
BOTTOM 20
 1. Miguel Olivo         .145
 2. Juan Uribe           .147
 3. Jeff Francoeur       .195
 4. Johnny Estrada       .220
 5. Joe Crede            .231
 6. Shea Hillenbrand     .239
 7. Bengie Molina        .253
 8. Robinson Cano        .261
 9. Kenji Johjima        .284
10. Pedro Feliz          .306
11. Craig Monroe         .317
12. A.J. Pierzynski      .319
13. Aramis Ramirez       .325
14. Ben Broussard        .333
15. Juan Rivera          .344
16. Angel Berroa         .362
17. Matt Holliday        .363
18. Ty Wigginton         .364
19. Rich Aurilia         .385
20. Jacque Jones         .386
James concedes that "there are two types of players who are awkward to position properly in the an offense. Those are 1) players who have no speed but still have high run element ratios, like Mike Scioscia and Mike LaValliere; and 2) players who have extremely low run element ratios. A player like Scioscia is difficult to position offensively because he is much more valuable early in the inning than late in the inning, but managers are reluctant to use him early in the inning because of his lack of speed."
As it relates to lineup construction, James counters the conventional wisdom that was popular back then and, for the most part, today.
One of the things that I have found, just in the last year, is that one problem in the design of an offense is the use of players with extremely low run element ratios in the four and five spots, who often lead off the second inning, leading to extremely few runs scored in the second inning. If you look at the list above, you'll see that many of these players, who are the least suited in baseball to lead off an inning, usually bat in the spot where they often lead off the second inning. I think you should try to avoid that.If the player is an outstanding hitter, like Don Mattingly or Harold Baines or Mark McGwire or Will Clark or Jim Rice at his best or Matt Nokes last year, you can avoid this problem by placing the player in the number three spot. In the case of Nokes, for example, you can move Kirk Gibson or Alan Trammell, who run element ratios are about 1.00 and who therefore are as valuable at one part of the inning as at another, to the fourth and fifth spots, and use Nokes at third; that way you'll score just as many runs in the first inning (I think) and more in the second.
The harder case is when you have a player who has a very low run element ratio, but who isn't really a good enough hitter to be put in the number three spot, like Cory Snyder or Jim Presley. In my opinion, these people logically should hit eighth. The eighth spot is the end of the cycle of the offense, either in the NL, where the pitcher bats ninth, or in the AL, where the ninth spot is ideally filled by a player who doesn't get on base enough to be a lead-off man, but who still has a high run element ratio - thus starting off the next offensive cycle. But that creates a problem, too, because if you put an undisciplined hitter batting ahead of the pitcher he won't get any pitches to hit, and his strikeouts will usually go through the roof. So Cory Snyder is a hard player to use offensively - wherever you put him, you create one problem or another.
James says Andre Dawson (whose run element ratio was .246) "wasn't anything like the Most Valuable Player in the National League. If you drive in runs but don't do anything to carry on the offense, that's going to show up in the RBI count of the next two or three players." Later on, James points out, "An RBI man helps the offense in one way but hurts it in the other; a player who sets the table helps the offense in both ways. That is why the St. Louis Cardinal offense works so well - an offense of eight leadoff men, or eight guys with high run element ratios, is a perfectly workable offense, because so long as people keep getting on base, runs are going to keep scoring. But an offense that strings together several people with low run element ratios is not workable."
The Detroit Tigers may have been a bit one-dimensional last year. And I don't mean pitching. I'm talking about the type of offensive players. The lineup was filled with low run element ratios in basically every spot.
Craig Monroe          .317
Magglio Ordonez       .434
Brandon Inge          .439
Ivan Rodriguez        .453
Chris Shelton         .486
Placido Polanco       .563
Curtis Granderson     .698
Sean Casey            .717
Carlos Guillen        .843
The Tigers were third in the AL in HR but second-to-last in BB. The team was 12th in OBP, 11th in SB, and last in SB%. Sure, DET was fifth in runs scored but perhaps the club could have been even more productive by changing out a "run producer" for a set-the-table type offensive player.
There is more than one way to skin a cat or score runs to be more specific. Walks are always good, but they are generally more valuable at the beginning rather than later in an inning. Hits, on the other hand, are usually worth more with runners on than with nobody on base. Having the proper balance and knowing when to emphasize one over the other are two ways of getting the most out of a team's offense.
[Update: The Run Element Ratios for all players with at least 400 plate appearances are listed in the comments below.]