Rich Lederer • Baseball Beat
Patrick Sullivan • Change-Up
Jeremy Greenhouse • Touching Bases
Dave Allen • F/X Visualizations
Sky Andrecheck • Behind the Scoreboard
Marc Hulet • Around the Minors
Al Doyle • Past Times
Retired Uniforms:
Bryan Smith • WTNY
Joe Sheehan • Command Post
Jeff Albert • The Batter's Eye
RSS Feed
Home
*Examining the Past, Present, and Future*
Lineup Card
Recent Entries
» Putting Together a Reality Team
» Historical Hall of Fame Vote Comparisons: 2012
» An All-Christmas Team
» The New-Look Angels
» John Denny: The Forgotten Cy Young Award Winner
» Money Isn't Everything
» What Would It Take to Hit .400 in the 21st Century?
» Halos Heaven
» Brandon McCarthy's Breakout Season
» Link-o-Rama
» Historical Hall of Fame Vote Comparisons: 2012
» An All-Christmas Team
» The New-Look Angels
» John Denny: The Forgotten Cy Young Award Winner
» Money Isn't Everything
» What Would It Take to Hit .400 in the 21st Century?
» Halos Heaven
» Brandon McCarthy's Breakout Season
» Link-o-Rama
Best of Baseball Beat
Abstracts From the Abstracts
1977 Baseball Abstract
1978 Baseball Abstract
1979 Baseball Abstract
1980 Baseball Abstract
1981 Baseball Abstract
1982 Baseball Abstract
1983 Baseball Abstract
1984 Baseball Abstract
1985 Baseball Abstract
1986 Baseball Abstract
1987 Baseball Abstract
1988 Baseball Abstract
1978 Baseball Abstract
1979 Baseball Abstract
1980 Baseball Abstract
1981 Baseball Abstract
1982 Baseball Abstract
1983 Baseball Abstract
1984 Baseball Abstract
1985 Baseball Abstract
1986 Baseball Abstract
1987 Baseball Abstract
1988 Baseball Abstract
Bert Blyleven Series
Meeting Up and Hanging Out with Bert
The Results Are In And...
Aficionado Heavily Invested in Blyleven
Latest on Blyleven's Chances for the HOF
The Internet Zealot Responds
400 Down and 5 to Go...
Bert Be Home By Eleven?
Blyleven's Forgotten Season (1973)
HeyMan, Your Comments Don't Hold Water
The Waiting is the Hardest Part
Another Addition to the Blyleven Series
Search for the Truth
As Dominant as His HOF Contemporaries
Listen, Buster
A Larger Step for Blyleven
Answering the Naysayers (Part Two)
Another Small Step for Blyleven
Q&A: Blyleven on the Twins
The Majority Rules, Right?
It's All Dutch to Some
The Hall of Fame Case for Bert Blyleven
Q&A: Blyleven on Felix Hernandez
Clemens Rocketing Up Charts
Poz: An Interview With a KC Star
A HOF Chat with Tracy Ringolsby
Up Close and Personal
A Peek Into the Mind of a HOF Voter
Answering the Naysayers
It's That Time of the Year (Again)
"If Cooperstown is Calling..."
The Bert Alert
One Small Step for Blyleven...
Only the Lonely
Exclusive Interviews
Lee Sinins
Alex Belth
David Pinto
Will Carroll
Mike Carminati
Aaron Gleeman
Joe Sheehan
Jay Jaffe
Jeff Peek
Tracy Ringolsby
Joe Posnanski
Bill James Part I, II, III
Jon Lalonde
Chuck Tiffany
Dayn Perry
Fay Vincent
Nate Silver
Alex Belth
David Pinto
Will Carroll
Mike Carminati
Aaron Gleeman
Joe Sheehan
Jay Jaffe
Jeff Peek
Tracy Ringolsby
Joe Posnanski
Bill James Part I, II, III
Jon Lalonde
Chuck Tiffany
Dayn Perry
Fay Vincent
Nate Silver
Bullpen
Rich Lederer
The Odd Couple (with Alex Belth)
The MostUnder Over Underrated Player in Baseball (with Brian Gunn)
Three Wise Men (roundtable by Alex Belth)
Infrequently Asked Questions (interview with Matt Welch)
Interview (Orioles Think Tank)
Bernie and the Yanks (Bronx Banter)
Hope and Faith: How the LAA Win the World Series (Baseball Prospectus)
NL West (The Soul of Baseball)
Greatest Living Hitter? (Sports Illustrated)
Roundtable: 2008 HOF Ballot (Armchair GM)
The Most
Three Wise Men (roundtable by Alex Belth)
Infrequently Asked Questions (interview with Matt Welch)
Interview (Orioles Think Tank)
Bernie and the Yanks (Bronx Banter)
Hope and Faith: How the LAA Win the World Series (Baseball Prospectus)
NL West (The Soul of Baseball)
Greatest Living Hitter? (Sports Illustrated)
Roundtable: 2008 HOF Ballot (Armchair GM)
Patrick Sullivan
Designated Hitters
David Bromberg (Q&A: John Denny)
Mark Armour (H. Killebrew and Versatility)
Joe Lederer (Soundtrack of a Prospect)
David Bromberg (Clemente's Autograph)
David Bromberg (Woody Fryman)
D. Baumstein (WAR Against Age: Pitchers)
Doug Baumstein (The WAR Against Age)
Doug Baumstein (A Lifetime on the Road)
John Fraser (Pick Six)
Mark Armour (How to Score More Runs?)
Bill Parker (What Opening Day Tells Us)
Stan Opdyke (Pat Rispole)
Chris Jaffe (Evaluating Baseball's Mgrs)
Stan Opdyke (Baseball Radio in NYC, 1953)
A. Nathan (Performance of Baseball Bats)
Michael Weddell (Edgar Martinez/HOF)
Jon Weisman (100 Things Dodgers Fans...)
Stan Opdyke (Connie Mack and Vin Scully)
Eric Walker (Evaluating Run Production)
Brent Mayne (The Intangibles of Catching)
Chris Moore (Best Fastballs in Baseball)
Dave Baldwin (The Batter’s Brain)
Shawn Haviland (Ivy League to MLB)
Larry Granillo (Walking Off)
Rob Iracane (Solo HR Won't Break You)
Tommy Bennett (Charm of AM Radio)
Harry Pavlidis (Johan Santana's Fast Start)
John Walsh (WAR and Remembrance)
Eric Walker (Precisely Inaccurate)
Bob Timmermann (As They See 'Em)
Geoff Young (Unicycles and Delusions)
Baseball Analysis at Tufts (Groundballers)
Baseball Analysis at Tufts (GB Out Rates)
G. Rybarczyk ('09 Hit Tracker Projections)
Joe Lederer (Curt Schilling/HoF)
Conor Gallagher (Hall of Fallacies)
Chris Green (Jim Rice, HoF, the Numbers)
Shawn Hoffman (Baseball's Bear Mkt?)
Paul Anthony (Manny Syndrome)
Ross Roley (World Series Odds)
B. Timmermann (Catcher's Interference)
R.J. Anderson (Waiting the Hardest Part)
Maury Brown (Cubs, MLB, and Cuban...)
Myron Logan (Dee-Fense, Dee-Fense)
Craig Calcaterra (Frivolity, Part I, Part II)
Chad Finn (Ode to Baseball Cards)
David Cameron (Mariners Foibles)
Chris Dial (Chipper Jones)
Pat Lederer (Memory Lane)
David Appelman (Clutch Pitching)
Bob Rittner (DH)
Jonathan Mayo (Roger Clemens)
Lisa Winston (My Son-in-Law...)
Russ McQueen (The Yellow Hammer)
Bob Rittner (I'm OK, You're OK)
Mark Armour (In Defense of the HOF)
Pat Jordan (Friends)
Dan Levitt (Analysis of Terry Ryan)
Doug Baumstein (Trading Econ 101)
Ross Roley (Runner's Reluctance II)
Ross Roley (Runner's Reluctance I)
Mark Armour (No-Longer Lovable Sox)
Bruce Regal (Stealthy and Wise)
Brian Gunn (Roid Monster)
Current/McEvoy (Value of the SB)
John Rickert (Sinister Thefts)
Nate Silver (Sabermetrics)
David Vincent (Home Run Production)
Joe P. Sheehan (Enhanced Gameday II)
Mark Armour (An Ode to Sport)
David Gassko (All-Time Worm Burners)
Joe P. Sheehan (Enhanced Gameday)
John Walsh (When Titans Clash)
Fox/Williams (Quantifying Coaches II)
Fox/Williams (Quantifying Coaches I)
Jacob Luft (Bull Durham Rant)
Chad Finn (Strat-O-Matic)
Lisa Winston (Rotisserie Baseball)
Dave Studeman (Baseball Stats)
Steve Treder (Roger Craig)
Marc Normandin (Jeff Bagwell)
D. Appelman (Expanding Strike Zone)
Jeff Sackmann (Worst MiL Defenders)
Jeff Sackmann (Best MiL Defenders)
Maxwell Kates (Van Lingle Mungo)
David Appelman (Pitch Location)
Kent Bonham (Danny Ray Herrera)
Glenn Stout (Two Baseball Poems)
Bruce Regal (The Challenge Round)
Mark Lamster (Barry & Ty)
Geoff Young (NL West)
Tom Lederer (The Ryan Express)
Brian Erts (Great Leap Forward)
David Pinto (Parity and the N.L.)
Jacob Luft (Fathers and Daughters)
Jamey Newberg (Pete's Sake)
Jeff Albert (A. Jones Swing Analysis)
Jeff Albert (A-Rod Swing Analysis)
Keith Law (Death, Taxes, and Waivers)
Peter Abraham (Tales of Torre Tales)
Larry Borowsky (Let 'er Rip II)
Dan Levitt (Empirical Analysis of Bunting)
Jonah Keri (If I Met Warren Cromartie...)
Bob Klapisch (War Stories)
Bob Timmermann (John F. Kennedy HS)
Kent Bonham (Aluminum Adjustments)
Al Doyle (More Than Superstars)
Ross Roley (Instant Replay)
David Vincent (Barry Bonds Homers)
Chad Finn (Our Favorite Obscurities)
Bill Deane (1979 NL MVP)
Mark Armour (Rise/Fall of Artificial Turf)
Jeff Angus (Wally Moon Camp)
David Berri (Money and Baseball)
Larry Borowsky (Baseball w/o the #s)
Derek Zumsteg (The Irrational Market)
David Regan (Free Agent Contracts)
Peter Schmuck (Steroids and the HOF)
David Appelman (Pitchers, Pitch by Pitch)
Dan Fox (Swinging, Taking, Fouling, Etc)
Patrick Sullivan (Study of NYY CF/BOS LF)
Will Leitch (Baseball Journalism)
Jeff Sullivan (Pitcher Release Points)
Steve Treder ('69-'70 Giants)
Maury Brown (Charlie Finley)
John Brattain (Bob Johnson)
Bob Klapisch (The Case for Bert Blyleven)
Jeff Peek (Pride and Prejudice)
Dayn Perry (Bert and Warren)
Rob Neyer (If Don Sutton Was Great...)
Lisa Winston (Minor League Memories)
Alex Belth (Otis Redding Was Right)
David Cameron (Long Live the King)
Jeff Angus (Baserunning Study)
Bert Blyleven (Baseball Playoffs)
Boyd Nation (Not a Prospect List)
James Click (Batters-Baserunners Study)
Jeff Shaw (Why I Love Baseball)
David Gassko (BIP/BFP Fielding Study)
Jay Jaffe (Milwaukee Sausage Race)
Jamey Newberg (Remember When)
Bob Klapisch (Press Box to the Mound)
Dan Levitt (Predictive Value of BB)
David Vincent (Official Scorer)
Jon Weisman (Rick Monday)
Larry Borowsky (Let 'er Rip)
Will Carroll (Fictional Short Story)
Bob Timmermann (Japanese Baseball)
Cyril Morong (Best Pitching Seasons)
Sean Forman (Monte Carlo Win-Loss)
Brian Gunn (My Little Blue Book)
Joe Lederer (My Dad and Baseball)
Bill Deane (Bob Gibson, 1968)
Mark Armour (1977 Yankees)
Darren Viola (Retrosheet)
David Pinto (RFK)
Dayn Perry (Brave Heart)
Matt Welch (Dave Hansen)
Kevin Kernan (Jack McKeon)
Tom Lederer (Dodgers Road Trip)
Steve Lombardi (Slider)
Studes (Picturing Baseball)
Mike Carminati (Luck of the Drawl)
Eric Neel (Vin Scully)
J.C. Bradbury (Leo Mazzone)
John Sickels (Bill James)
Search Baseball Analysts
Archives
By Category:
Around the Majors Content Only
Around the Minors Content Only
Baseball Beat Content Only
Baseball Beat/Change-Up Content Only
Baseball Beat/WTNY Content Only
Behind the Scoreboard Content Only
Change-Up Content Only
Change-Up/Around the Majors Content Only
Command Post Content Only
Crunching the Numbers Content Only
Designated Hitter Content Only
F/X Visualizations Content Only
Past Times Content Only
Saber Talk Content Only
The Batter's Eye Content Only
Touching Bases Content Only
Weekend Blog Content Only
WTNY Content Only
By Month:
February 2012
January 2012
December 2011
October 2011
September 2011
August 2011
July 2011
June 2011
May 2011
April 2011
March 2011
February 2011
January 2011
December 2010
November 2010
October 2010
September 2010
August 2010
July 2010
June 2010
May 2010
April 2010
March 2010
February 2010
January 2010
December 2009
November 2009
October 2009
September 2009
August 2009
July 2009
June 2009
May 2009
April 2009
March 2009
February 2009
January 2009
December 2008
November 2008
October 2008
September 2008
August 2008
July 2008
June 2008
May 2008
April 2008
March 2008
February 2008
January 2008
December 2007
November 2007
October 2007
September 2007
August 2007
July 2007
June 2007
May 2007
April 2007
March 2007
February 2007
January 2007
December 2006
November 2006
October 2006
September 2006
August 2006
July 2006
June 2006
May 2006
April 2006
March 2006
February 2006
January 2006
December 2005
November 2005
October 2005
September 2005
August 2005
July 2005
June 2005
May 2005
April 2005
March 2005
February 2005
January 2005
December 2004
November 2004
October 2004
September 2004
August 2004
July 2004
June 2004
May 2004
April 2004
March 2004
February 2004
January 2004
December 2003
November 2003
October 2003
September 2003
August 2003
July 2003
June 2003
Reference
Organizational Stats
Arizona Diamondbacks Bat / Pitch
Atlanta Braves Bat / Pitch
Baltimore Orioles Bat / Pitch
Boston Red Sox Bat / Pitch
Chicago Cubs Bat / Pitch
Chicago White Sox Bat / Pitch
Cincinnati Reds Bat / Pitch
Cleveland Indians Bat / Pitch
Colorado Rockies Bat / Pitch
Detroit Tigers Bat / Pitch
Florida Marlins Bat / Pitch
Houston Astros Bat / Pitch
Kansas City Royals Bat / Pitch
Los Angeles Angels Bat / Pitch
Los Angeles Dodgers Bat / Pitch
Milwaukee Brewers Bat / Pitch
Minnesota Twins Bat / Pitch
New York Mets Bat / Pitch
New York Yankees Bat / Pitch
Oakland Athletics Bat / Pitch
Philadelphia Phillies Bat / Pitch
Pittsburgh Pirates Bat / Pitch
St. Louis Cardinals Bat / Pitch
San Diego Padres Bat / Pitch
San Francisco Giants Bat / Pitch
Seattle Mariners Bat / Pitch
Tampa Bay Devil Rays Bat / Pitch
Texas Rangers Bat / Pitch
Toronto Blue Jays Bat / Pitch
Washington Nationals Bat / Pitch
All-Star Links
Official Websites
News and Notes
Baseball News Blog
Baseball Newstand
ESPN Baseball
Fox Sports Baseball
Pro Sports Daily
Roto World
The Roto Times
USA Today Baseball
Baseball Newstand
ESPN Baseball
Fox Sports Baseball
Pro Sports Daily
Roto World
The Roto Times
USA Today Baseball
Reference and Analysis
Baseball Almanac
Baseball America
Baseball Archive
Baseball Contracts
Baseball Cube
Baseball Graphs
Baseball Library
Baseball Musings Player Database
Baseball Page
Baseball Primer
Baseball Prospectus
Baseball Reference
Baseball Statistics
Baseball Truth
Boxscore Central
Diamond Mind Baseball
Doug's Stats
FanGraphs
Fast Balls (pitchfx catalog)
Hardball Dollars
Hardball Times
Hit Tracker
Retrosheet
Rotobase/Rotoblog
Stat Corner
STATS
Tango on Baseball
Yahoo Sports MLB
Web Gems
Bill James Primer
Sabermetric Manifesto (Grabiner)
Pitching and Defense (McCracken)
Pitching and Defense (Tippett)
Transactions Primer (Neyer)
Baseball Stats (Batter's Box)
Prospect Report (Cameron)
Pitcher Workloads (Sheehan)
Goodbye to Old Baseball Ideas (Rickey)
Sabermetric Manifesto (Grabiner)
Pitching and Defense (McCracken)
Pitching and Defense (Tippett)
Transactions Primer (Neyer)
Baseball Stats (Batter's Box)
Prospect Report (Cameron)
Pitcher Workloads (Sheehan)
Goodbye to Old Baseball Ideas (Rickey)
Columnists
Baseball Blogs
Around the Majors
Athletics Nation
Baseball Crank
Baseball Musings
Baseball-Reference Blog
Batter's Box
Big League Stew
Bronx Banter
Catfish Stew
Cub Town
Dan Agonistes
Dodger Thoughts
DRays Bay
Ducksnorts
Futility Infielder
Halos Heaven
Inside the Rockies
It Might Be Dangerous
Knuckle Curve
LoHud Yankees Blog
Lookout Landing
Management by Baseball
Metaforian
Metsgeek
Mike's Baseball Rants
Only Baseball Matters
Redbird Nation
Red Reporter
Sabernomics (Braves)
Seth Speaks
ShysterBall
6-4-2 (Angels/Dodgers)
The Book
TheCubdom
The Cutting Edge
The House That Dewey Built
The View From The Bleachers
Tiger Blog
U.S.S. Mariner
Viva El Birdos
Where's Kernan
Minor Leagues
Arizona Fall League
BA Player Finder
Cal Leaguers
Jamey Newberg
JDM's Scoresheet Baseball
Minor League Baseball
Minor League Park Factors
Minor League Splits
No Pepper
Sickels' Minor League Ball
Warm October Nights
BA Player Finder
Cal Leaguers
Jamey Newberg
JDM's Scoresheet Baseball
Minor League Baseball
Minor League Park Factors
Minor League Splits
No Pepper
Sickels' Minor League Ball
Warm October Nights
Amateur
Boyd's World (College)
Cape Cod Baseball League
College Baseball Blog
College Baseball Insider
Collegiate Baseball Newspaper
College Splits
College Splits Blog
Dirtbags Baseball (Long Beach State)
NCAA Baseball
NCBWA
Team One Baseball (High School)
Texas A&M & Baseball
Cape Cod Baseball League
College Baseball Blog
College Baseball Insider
Collegiate Baseball Newspaper
College Splits
College Splits Blog
Dirtbags Baseball (Long Beach State)
NCAA Baseball
NCBWA
Team One Baseball (High School)
Texas A&M & Baseball
Historical
Cuban Baseball
House of David
Jim "Mudcat" Grant's Web Page
Negro League Baseball Players Assoc
Negro Leagues Baseball Museum
1919 Black Sox
Pacific Coast League
Philadelphia Athletics Historical Society
Shoeless Joe Jackson Society
SABR-L Archives
Walter O'Malley
House of David
Jim "Mudcat" Grant's Web Page
Negro League Baseball Players Assoc
Negro Leagues Baseball Museum
1919 Black Sox
Pacific Coast League
Philadelphia Athletics Historical Society
Shoeless Joe Jackson Society
SABR-L Archives
Walter O'Malley
Miscellaneous
Forums
Credits
Ticket Center
Tickets to Baseball -
Premium Red Sox Tickets - Tickets to Marlins Games - Cardinals Game Tickets - NY Yankee Tickets - Tickets Oakland Athletics - Dallas Cowboys Tickets - Arizona Cardinals Tickets - Tickets Seattle Seahawks - Buffalo Bills Tickets Online - Tickets to Dolphins Football
Buy Boston Red Sox tickets,
Philadelphia Phillies tix,
NY Yankees tickets,
NY Mets tickets, and
MLB All Star game tickets at ABC tickets
Not sure where to find the best online sportsbooks? Start your search with PlayersJet.
Get deals at SportsMemorabilia.com on baseball apparel, including Phillies jerseys and more for adults and children.
Shop the largest selection baseball equipment on sale at Sports Unlimited. Check out tons of baseball gloves, youth baseball gloves and catchers gear from Rawlings, Wilson, Nike & Under Armour.
2011 Draft Order
Courtesy of Baseball America
First-Round:
 1. Pirates (57-105)
 2. Mariners (61-101)
 3. Diamondbacks (65-97)
 4. Orioles (66-96)
 5. Royals (67-95)
 6. Nationals (69-93)
 7. Diamondbacks (for B. Loux)
 8. Indians (69-93)
 9. Cubs (75-87)
10. Padres (for Karsten Whitson)
11. Astros (76-86)
12. Brewers (77-85)
13. Mets (79-83)
14. Marlins (80-82)
15. Brewers (for Dylan Covey)
16. Dodgers (80-82)
17. Angels (80-82)
18. Athletics (81-81)
19. Red Sox (from DET for Martinez)
20. Rockies (83-79)
21. Blue Jays (85-77)
22. Cardinals (86-76)
23. Nationals (from CWS for Dunn)
24. Rays (from BOS for Crawford)
25. Padres (90-72)
26. Red Sox (from TEX for Beltre)
27. Reds (91-71)
28. Braves (91-71)
29. Giants (92-70)
30. Twins (94-68)
31. Rays (from NYY for Soriano)
32. Rays (96-66)
33. Rangers (from PHI for Lee)
Supplemental First Round:
34. Nationals (Dunn)
35. Blue Jays (Downs)
36. Red Sox (Martinez)
37. Rangers (Lee)
38. Rays (Crawford)
39. Phillies (Werth)
40. Red Sox (Beltre)
41. Rays (Soriano)
42. Rays (Balfour)
43. Diamondbacks (LaRoche)
44. Mets (Feliciano)
45. Rockies (Dotel)
46. Blue Jays (Buck)
47. White Sox (Putz)
48. Padres (Garland)
49. Giants (Uribe)
50. Twins (Hudson)
51. Yankees (Vazquez)
52. Rays (Benoit)
53. Blue Jays (Olivo)
54. Padres (Torrealba)
55. Twins (Crain)
56. Rays (Choate)
57. Blue Jays (Gregg)
58. Padres (Correia)
59. Rays (Hawpe)
| Command Post | November 30, 2007 |
Dirty Jobs
I've looked at pitcher's counts vs. hitter's count before, and prompted by this comment on The Book's blog, I decided to revisit the topic. When doing research of any kind, the hardest thing to do is to find an interesting question to topic to examine, and Tango's comment had a whole lot of interesting questions, so I'm going to tackle some of those, pseudo-blog style, throughout the day. Anyway, without any more introduction, lets see some results.
The reason certain counts are considered hitter's counts or pitcher's counts is partially due to the likelihood of a fastball being thrown on that pitch. For most pitchers, a fastball is their least effective strikeout pitch, as well as the pitch they have the most control over. In an extreme example, on 3&0, most of the time a pitcher will throw a fastball to get a strike, but in doing so, gives the batter a better a good pitch to hit. The chart below shows the percentage of fastballs thrown in each count, and gives a slightly different view of what makes up a hitter's count vs. a pitcher's count.
Count    FB%    Pitches
3&0      78%       2643
3&1      76%       5083
2&0      70%       8282
-----------------------------------
3&2      61%      10096
2&1      59%      12084
0&0      59%      58849
1&0      59%      23982
-----------------------------------
1&1      49%      22900
0&1      48%      27712
0&2      47%      12943
2&2      47%      16947
1&2      44%      19802
With an average FB% of 59% and the number of pitches thrown in each count, there are four counts that see an "average" number of fastballs, while the others could be grouped into hitter's counts and pitcher's counts. Most of these percents make sense, and the top of the list corresponds very well to the top of the pass-through table in terms of ranking the counts in terms of hitter friendliness. Not surprisingly, hitters see the most fastballs in 3&0 and also have the best results if they pass through that count during their at-bat. The ranking of pitcher's counts doesn't match up as well, with 0&2 surprisingly not seeing the lowest FB%. I'm not sure exactly why this is, but the important thing is that the differences between groups is much bigger than any differences within the groups.
The "ownership" of counts changes slightly using FB% as a guide. It makes intuitive sense that 1&1 should be a neutral count, the results of plate appearances that end in a 1&1 count make it a neutral count, the pass-through results say it's a neutral count, yet pitcher's throw fewer fastballs in that count than in other ones. Pitcher's don't seem to agree that 1&1 is actually a neutral count, and have responded by throwing almost as few fastballs as they do for 0&1 and 0&2 counts. 1&0, 2&1 and 3&2 change hands too. Prior to looking at this table, I would have bet any amount of money that there were a lot of fastballs thrown in these counts, making them hitter's counts. All of them have more balls than strikes and it just seems like they favor the hitter. Tango's pass through data labels them as hitter's counts, but pitchers treat them like 0&0 counts, throwing an "average" amount of fastballs. The two gray-area counts that Tango mentions (0&1, 2&2) are both pitcher's counts by this metric.
Count   High%   Low%    Mid%
3&0     29%     27%     44%
3&1     27%     27%     46%
2&0     27%     29%     44%
----------------------------
3&2     32%     26%     42%
2&1     28%     28%     44%
0&0     29%     28%     43%
1&0     27%     30%     43%
----------------------------
1&1     29%     28%     43%
0&1     31%     28%     42%
0&2     51%     18%     31%
2&2     35%     24%     41%
1&2     41%     21%     38%
Now that we know a little about what pitchers throw in different counts, let's look at where they throw it. The table above shows the vertical locations in the strike-zone for fastballs thrown in each count. In a 3&0 count, 27% of fastballs thrown are higher than 6 inches below the top of the strike-zone, 29% are lower than 6 inches above of the bottom of the strike-zone and 44% are thrown between that. This doesn't account for the horizontal position of the pitch and there really isn't anything interesting to see in most cases. 0&2 has the lowest percent of pitches in the middle, which is expected, and it seems that when a pitcher is going to throw a waste pitch on 0&2 and 1&2, it is usually thrown high.
| Designated Hitter | November 29, 2007 |
An Analysis of Terry Ryan's Talent Acquisition as General Manager of the Minnesota Twins
In modern baseball the general manager is ultimately responsible for the talent level in an organization, most importantly at the major league level. Given the relationship between winning teams and better players, general managers have historically been evaluated based on team success. While a pragmatic measure, it has two notable drawbacks. First, it ignores all the extenuating circumstances that go into a team's gain and loss of players: general managers operate under different financial constraints; they initially join clubs with far different levels of talent, and have different levels of autonomy to shape the scouting personnel, minor league operations, and the major league on-field staff. Second, simply using team success as a yardstick is a very coarse measure that limits our ability to understand the strengths and weaknesses of a general manager. What were his specific successes and failures that led to his club's record?
With the recent resignation of Terry Ryan as the Minnesota Twins general manager, I thought it might be interesting to take an objective look at some aspects of the position that can be measured. Using the Retrosheet transactions database maintained by Tom Ruane, I evaluated all the moves made by the Twins after Ryan's hiring in September, 1994 through the end of 2005. Obviously this type of analysis assigns the ultimate responsibility for all transactions--rightly or wrongly--to the general manager. For a number of reasons I did not include an analysis of the draft. For most types of transactions one can compare value received to value surrendered. To evaluate the productivity of the amateur draft and the farm system, however, one needs to calculate the productivity of other franchises to use as a baseline--this is a study for another time.
To evaluate the general manager this analysis reviews the value of players lost via free agency (Fg), release (R), the expansion draft (X), waivers (W) and trades (T), and players acquired via amateur free agency (Fa), free agency (F), waivers (W) and trades (T). Unfortunately this is not quite as straight forward as it might be: for example players who become free agents and are subsequently re-signed; in the database these players are shown as both lost via free agency and gained through free agency. The net effect is zero, but it increases the total volume of talent coming and going: for instance, Brad Radke's re-signing after the 2004 season. Another example is players who come and go before they become established major leaguers. As an illustration of this issue, Casey Blake was claimed on waivers, lost on waivers, reclaimed on waivers, and subsequently released before he achieved any significant major league playing time. While it makes sense to account for them this way--each transaction needs to be evaluated on its own merits--these multiple moves can make the talent velocity appear greater than it might otherwise be.
Of course one also needs some way to value the players involved in the transactions in order to assess them. Win Shares is a metric created by Bill James that works well for this purpose. Using a complex set of formulas, it allocates team wins to individual players. The method allocates three win shares for each win; for example, 300 win shares will be allocated to the players on a 100 win team. As a benchmark, a 30 win share season is typically MVP caliber, and 20 win shares is an all-star season. For each player involved in a transaction, I calculated the win shares he would earn over the balance of his career. For players still active, win shares are calculated through the 2006 season (obviously, some of these players will significantly increase their career totals).
So, what does Ryan's scorecard look like? The table below summarizes the cumulative win shares surrendered and gained in all the Twins transactions from the fall of 1994 through the end of 2005.
Win Shares from Twins Transactions, Fall 1994 - 2005
Type    Type Description            From Min   To Min
-----------------------------------------------------
Fg      Free Agency Granted              430        -
R       Released                         251        -
X       Expansion Draft                   93        -
Fa      Amateur Free Agent Signing         -      111
F       Free Agent Signing                 -      656
W       Waiver Pick                       60      154
T       Trade                            807      922
-----------------------------------------------------
        Total                           1641	   1842
Despite working under relatively tight financial constraints for most of his tenure, Ryan lost surprisingly little talent to free agency. No player with more than 50 win shares remaining left the major league roster as a free agent. Only Travis Lee, one of four amateur draftees declared free agents because they were not tendered a contract within the mandatory 15-day period, produced more than 50 win shares over the remainder of his career.
Surprisingly, Ryan's two most significant personnel blunders resulted from releasing two players with significant major league ability, and both came after the 2002 season. In October he released Casey Blake, who would go on to become a valuable contributor with the Indians. More significantly, in December Ryan compounded his error by releasing David Ortiz, who became a perennial MVP contender. Both could have played important roles on the Twins competitive teams from 2003 through 2006.
The Twins did not really lose any significant players through waivers (although technically they lost and then regained Blake over a three-week period). The loss of Damian Miller to the Diamondbacks in the expansion draft proved surprisingly costly. Miller went on to a number of seasons as a quality major league catcher.
Given his financial constraints, is not surprising that Ryan never really exploited the free agent market. Over his tenure he signed only one major league free agent, Kenny Rogers, with over 50 win shares remaining. Some of his most worthwhile signings included re-signing his own declining veterans on a short-term basis, such as Radke and Shannon Stewart, and finding useful role players at a reasonable price, such as Mike Redmond.
Minnesota has not kept up a sufficient Latin American presence. In the mid-1990s the Twins landed two players who would develop into useful major leaguers--Luis Rivas and Juan Rincon--but have signed none of consequence since. Ryan's staff did smartly pluck Bobby Kielty from the U.S. amateur ranks. The Twins have neither lost nor claimed any significant players on waivers except for Blake, as noted previously.
Ryan distinguished himself most clearly in his ability to make quality trades. His worst trade, in terms of value differential, was the swap of Todd Walker to Colorado for two players with less than two win shares remaining in their careers. In Ryan's defense, with this transaction the Twins also received cash. On the other hand, his regime can be credited with several outstanding deals. The swap of A.J. Pierzynski and cash for Francisco Liriano, Boof Bonser, and Joe Nathan has been widely hailed, but a number of others were also highly productive. He acquired Johan Santana for Jared Camp in a trade of Rule 5 draft picks. Ryan landed Eric Milton and Cristian Guzman for Chuck Knoblauch--although Knoblauch's unexpectedly quick falloff makes this trade appear more prescient than it probably was. Trading Dave Hollins for David Ortiz was also a great move, unfortunately later vitiated by the latter's release.
A general manager's job entails more than talent acquisition, and sometimes a team is in a position where the key decisions involve sorting out the talent (including possibly surrendering more talent than one receives) to alleviate an abundance at one position and a dearth at another. But the luxury of rearranging one's talent first requires building a solid talent base. Ryan consistently surrendered less talent than he received as he built the team that captured four division championships between 2002 and 2006.
Appendix
The table below summarizes all Minnesota Twin transactions of at least 10 win shares between the fall of 1994 when Terry Ryan became the GM and the end of 2005. The table should be moderately self-explanatory, but a couple of comments may be in order for trades. The "TransID" column ties the players to a particular transaction, so that all players identified with the same TransID were part of the same trade. A few transactions identified as a trade show only one player; in these instances the other players involved did not make the major leagues.
Min Twins Transactions (>10 WS), Fall 1994 - 2005
DateID TransID Type Player Team From Min To Min 19960619 22943 Fg Lee, Travis 72.8 19961004 33661 Fg Reboulet, Jeff 26.6 19981029 39348 Fg Steinbach, Terry 11.9 19981221 26718 Fg Meares, Pat 13.2 19991007 8367 Fg Cordova, Marty 23.1 19991015 12658 Fg Fiore, Tony 10.1 20011008 26077 Fg McCracken, Quinton 19.6 20011019 6461 Fg Carrasco, Hector 19.5 20011105 20603 Fg Jones, Todd 35.6 20031026 15777 Fg Guardado, Eddie 17.5 20031026 39476 Fg Stewart, Shannon 30.1 20031027 17104 Fg Hawkins, LaTroy 20.6 20031028 14799 Fg Gomez, Chris 16.2 20031029 35073 Fg Rogers, Kenny 46.9 20041028 3435 Fg Blanco, Henry 11.3 20041028 33228 Fg Radke, Brad 21.5 20041101 21947 Fg Koskie, Corey 16.5 20051028 20511 Fg Jones, Jacque 16.9 19950713 39482 R Stewart, Scott 15.3 19960401 13631 R Fultz, Aaron 18.9 19970516 30220 R Olson, Gregg 21.5 19981003 34439 R Ritchie, Todd 32.8 20001220 23436 R Lincoln, Mike 13.5 20021014 3412 R Blake, Casey 48.1 20021216 30458 R Ortiz, David 101.4 19971118 27370 X Miller, Damian ARI 92.5 19951009 34458 Fa Rivas, Luis 24.7 19961104 34373 Fa Rincon, Juan 35.6 19990216 21343 Fa Kielty, Bobby 50.3 19950613 39481 F Stewart, Scott 15.3 19951205 27848 F Molitor, Paul 40.7 19951208 28907 F Myers, Greg 24.0 19951211 302 F Aguilera, Rick 31.2 19960102 18388 F Hollins, Dave 23.8 19960129 21020 F Kelly, Roberto 24.6 19961205 39347 F Steinbach, Terry 28.6 19961212 40617 F Tewksbury, Bob 16.8 19961218 40139 F Swindell, Greg 29.0 19961220 30219 F Olson, Gregg 21.5 19970124 7751 F Colbrunn, Greg 27.8 19971216 28221 F Morgan, Mike 13.6 19971223 14199 F Gates, Brent 12.0 19980114 27003 F Merced, Orlando 18.3 19990104 39349 F Steinbach, Terry 11.9 19990127 43376 F Wells, Bob 24.3 19990603 12657 F Fiore, Tony 10.1 20000401 27793 F Mohr, Dustan 31.2 20001219 32882 F Prince, Tom 12.1 20010330 6460 F Carrasco, Hector 23.9 20010413 26076 F McCracken, Quinton 19.7 20010530 12661 F Fiore, Tony 10.1 20030109 14798 F Gomez, Chris 18.5 20030317 35072 F Rogers, Kenny 57.6 20031207 39477 F Stewart, Shannon 30.1 20031218 3434 F Blanco, Henry 16.7 20040108 13638 F Fultz, Aaron 14.9 20041123 6724 F Castro, Juan 13.1 20041124 33691 F Redmond, Mike 12.9 20041207 33229 F Radke, Brad 21.5 19941104 34714 W Robertson, Rich PIT 15.0 19980403 6456 W Carrasco, Hector ARI 31.7 20000523 3409 W Blake, Casey TOR 48.4 20010921 3410 W Blake, Casey BAL 48.2 20011012 3411 W Blake, Casey BAL 48.2 20031120 15803 W Guerrier, Matt PIT 10.7 20041014 13639 W Fultz, Aaron PHI 12.0 19950608 49355 T Courtright, John CIN 0.0 19950608 49355 T McCarty, David CIN 18.0 19950706 49364 T Rodriguez, Frank BOS 21.2 19950706 49364 T Aguilera, Rick BOS 31.2 19950707 49365 T Klingenbeck, Scott BAL 0.0 19950707 49365 T Erickson, Scott BAL 54.0 19950731 49386 T Coomer, Ron LAN 53.1 19950731 49386 T Hansell, Greg LAN 6.3 19950731 49386 T Parra, Jose LAN 5.3 19950731 49386 T Guthrie, Mark LAN 25.9 19950731 49386 T Tapani, Kevin LAN 49.4 19950919 49365 T Bartee, Kimera BAL 2.9 19951030 49386 T Latham, Chris LAN 3.8 19960826 49492 T Mahomes, Pat BOS 14.3 19960829 49496 T Hollins, Dave SEA 23.8 19960913 49496 T Ortiz, David SEA 137.7 19961211 49520 T Walbeck, Matt DET 18.9 19961217 49492 T Looney, Brian BOS 0.0 19970814 49587 T Colbrunn, Greg ATL 27.8 19970820 49591 T Kelly, Roberto SEA 15.4 19970905 49597 T Myers, Greg ATL 17.6 19971009 49591 T Mays, Joe SEA 44.7 19971212 49630 T Becker, Rich NYN 0.0 19971212 49630 T Ochoa, Alex NYN 30.3 19980206 49642 T Knoblauch, Chuck NYA 69.7 19980206 49642 T Buchanan, Brian NYA 9.8 19980206 49642 T Guzman, Cristian NYA 79.7 19980206 49642 T Milton, Eric NYA 68.4 19980206 49642 T Mota, Danny NYA 0.0 19980731 49693 T Barnes, John BOS 0.0 19980731 49693 T Kinney, Matt BOS 7.3 19980731 49693 T Merced, Orlando BOS 18.3 19980731 49693 T Swindell, Greg BOS 19.3 19980825 49709 T Morgan, Mike CHN 13.6 19981103 49709 T Downs, Scott CHN 11.6 19981214 49735 T Ochoa, Alex MIL 27.5 19990521 49771 T Lohse, Kyle CHN 41.5 19990521 49771 T Ryan, Jason CHN 1.9 19990521 49771 T Aguilera, Rick CHN 4.3 19990521 49771 T Downs, Scott CHN 11.6 19991213 49836 T Santana, Johan FLO 101.1 20000715 49891 T Sears, Todd COL 1.9 20000715 49891 T Huskey, Butch COL 0.0 20000715 49891 T Walker, Todd COL 74.5 20000909 49936 T Ford, Lew BOS 41.6 20000909 49936 T Carrasco, Hector BOS 23.9 20010328 49973 T Frias, Hanley ARI 0.0 20010328 49973 T Moeller, Chad ARI 16.4 20010728 50015 T Jones, Todd DET 35.6 20010728 50015 T Redman, Mark DET 40.6 20010730 50017 T Lawton, Matt NYN 48.9 20010730 50017 T Reed, Rick NYN 18.7 20020712 50111 T Buchanan, Brian SDN 8.8 20020712 50111 T Bartlett, Jason SDN 18.5 20021115 50142 T Kinney, Matt MIL 5.1 20021115 50142 T Valentin, Javier MIL 21.4 20030716 50199 T Kielty, Bobby TOR 27.3 20030716 50199 T Stewart, Shannon TOR 39.0 20031114 50237 T Pierzynski, A.J. SFN 38.6 20031114 50237 T Nathan, Joe SFN 47.1 20031114 50237 T Liriano, Francisco SFN 16.3 20031114 50237 T Bonser, Boof SFN 6.5 20031203 50245 T Milton, Eric PHI 13.5 20031203 50245 T Punto, Nick PHI 21.6 20031203 50245 T Silva, Carlos PHI 31.0 20031215 50254 T Mohr, Dustan SFN 14.2 20031215 50199 T Gassner, Dave TOR 0.1 20040731 50322 T Mientkiewicz, Doug BOS 13.3 20051202 50425 T Castillo, Luis FLO 17.2 20051202 50425 T Bowyer, Travis FLO 0.0
Dan Levitt's forthcoming biography of New York Yankee general manager Ed Barrow is scheduled for release in the spring of 2008 from the University of Nebraska Press. He co-authored (with Mark Armour) the award-winning book Paths to Glory: How Great Baseball Teams Got That Way. Dan has also published numerous baseball related articles and short biographies.
| Change-Up | November 28, 2007 |
Too Soon?
Playing in a division with the Boston Red Sox and New York Yankees can be a real challenge, one that J.P. Ricciardi has not always been up to. He has been known for moves ranging from the shrewd to the completely senseless (raise your hand, Royce Clayton). More than anything, Ricciardi has seemed like the man without a plan and year in and year out, the Blue Jays fall just about a full tier short of the the level on which Boston and New York perform (the Jays did finish in second ahead of Boston in 2006).
That may change in 2008. In 2007 they were an 87-win Pythag team and they were such thanks to surprise performances from a number of young players. Moreover, the team was hurt by critical injuries, surprise under-performance and the sort of utter ineptitude that one has to think cannot be replicated at a couple of positions. In other words, off of this 87-win base there seems to be considerable room for improvement.
Toronto's core will not be going anywhere. Frank Thomas, Vernon Wells and Alex Rios figure to once again anchor the offense. Roy Halladay, A.J. Burnett and B.J. Ryan are the key hurlers. What has become interesting when looking at the Jays and their prospects for 2008 is the emergence of a number of young pitchers. Rich did a comprehensive profile of Dustin McGowan a couple of weeks back. Fellow youngsters Jesse Litsch and Shaun Marcum were also very good in 2007. Here is the line the three combined for last season:
                 IP    SO   BB   H    WHIP  ER  ERA
TOR Youngsters  439.7  316  146  411  1.27  197 4.03
Over and above the three starters, the Jays had three relievers fill in admirably for the injured B.J. Ryan in 2007. Here is how Jeremy Accardo, Scott Downs and Casey Jannsen fared in 2007:
                 IP   SO   BB   H   WHIP  ER  ERA
TOR Relievers    198  153  68  165  1.18  49  2.23
Of these six pitchers (the three starters and three relievers), only Downs is over the age of 26. There are no guarantees that these pitchers will replicate their performance but given how young they are on average, forecasting similar performance does not seem unreasonable. The Blue Jays finished third in the American League with a 112 ERA+ and with improved health from B.J. Ryan and a full season from A.J. Burnett (unlikely, I know), this Jays staff may catapult to the head of the American League.
On the offensive side, two positions stand out as real areas for improvement. Adam Lind was a .316/.377/.505 career Minor League hitter and burst onto the Major League scene as a late-season call-up in 2006. Last year, in 311 plate appearances, Lind managed a terrible .238/.278/.400 line. I think he is a great candidate for improvement and even if he does not, the Jays have the steady Reed Johnson to cover him.
The other position is shortstop. J.P. really bungled this one with the signing of Clayton last season and to make matters worse, John McDonald offered no relief whatsoever. Jays shortstops hit .237/.276/.322 in 2007. I don't really have much to offer here in the way of analysis but really, how the hell can they not improve off of that? One has to really question Ricciardi's decision to extend McDonald (a career 58 OPS+ hitter) but so long as his playing time is limited, he should not be too much of a problem. Also in the "figures to improve" category is Lyle Overbay, who only appeared in 122 games and put up a rotten .240/.315/.391 line.
=======================
It's never too soon to start looking ahead to the following season. Overcoming the Red Sox and Yankees will be a tall order but when I scan the 2007 teams to try and pick out a potential surprise club, Toronto sure seems to fit the bill. I'll be interested to see what sort of moves Ricciardi makes to tinker on the margins with his already solid club.
| Baseball Beat | November 26, 2007 |
Comparing K/100 Pitches with K/9 IP
All of us like pitchers who can rack up strikeouts. There is no argument between statheads and the scouting community over the value of missing bats. In a nutshell, Ks are the out of choice. The more, the merrier.
We also know that pitch counts are important. The fewer, the better. As such, it seems logical that combining high strikeout and low pitch totals is a recipe for success. In February 2006, I stated, "The best way to measure such effectiveness is via K/100 pitches." The formula is (strikeouts divided by total pitches) x 100.
In addition, strikeouts per pitch has a stronger correlation to runs allowed than strikeouts per inning or strikeouts per batter faced. The technical aspects of these measurements were explained in Strikeout Proficiency (Part Two).
Let's take a look at the K/100P rankings as compared to K/9 IP. (For context, among those who qualified for the ERA title, the average starter threw approximately 100 pitches and completed 6 1/3 innings. The average number of K/100 pitches was 4.66.)
Top 10 K/100 Pitches
Name		IP	SO      Pitches	K/100P	K/9    K/9 Rk
Erik Bedard	182.0	221	2946	7.50	10.93	1
Johan Santana	219.0	235	3345	7.03	9.66	4
Jake Peavy	223.3	240	3610	6.65	9.67	3
A.J. Burnett	165.7	176	2649	6.64	9.56	5
Scott Kazmir	206.7	239	3609	6.62	10.41	2
John Smoltz	205.7	197	3062	6.43	8.62	12
Cole Hamels	183.3	177	2791	6.34	8.69	10
Josh Beckett	200.7	194	3100	6.26	8.70	9
Javier Vazquez	216.7	213	3465	6.15	8.85	6
Aaron Harang	231.6	218	3591	6.07	8.47	14
Erik Bedard was #1 in both K/100P and K/9. With respect to strikeouts, the lefthander had a fantastic season. He blew away the field, averaging about 0.50 higher than the closest pursuer in both measurements. Bedard, who missed the final month with a strained right oblique, was a leading candidate for the AL Cy Young Award as late as August. Signed through 2009, the 28-year-old is one of the most valuable pitching properties in baseball.
Scott Kazmir ranks second in K/9 but only fifth in K/100P. John Smoltz jumps from 12th in K/9 to sixth in K/100P. Smoltz proved his proficiency by ranking among the leaders in all strikeout measurements while also placing among the leaders in throwing the fewest pitches per plate appearance (3.60) and inning (14.9). Smoltzie, in fact, was the only pitcher who struck out at least eight batters per nine innings and ranked among the top half in fewest P/PA – and, get this, he was 10th in the latter category.
Cole Hamels, who threw the second fewest pitches per plate appearance among those with eight or more Ks per nine, goes from 10th in K/9 to seventh in K/100P. Aaron Harang, another strike thrower, also fares better in K/100P than K/9.
#11-20 K/100P
Name		IP	SO      Pitches	K/100P	K/9    K/9 Rk
Rich Hill		195.0	183	3070	5.96	8.45	15
C.C. Sabathia	241.0	209	3581	5.84	7.80	17
James Shields	215.0	184	3177	5.79	7.70	21
Chris Young	173.0	167	2884	5.79	8.69	11
Daisuke Matsuzaka	204.7	201	3480	5.78	8.84	8
Oliver Perez	177.0	174	3015	5.77	8.85	7
Ian Snell		208.0	177	3125	5.66	7.66	22
Brandon Webb	236.3	194	3437	5.64	7.39	26
John Maine	191.0	180	3270	5.50	8.48	13
Felix Hernandez	190.3	165	3005	5.49	7.80	18
James Shields leaps from 21st in K/9 to 13th in K/100P. The Tampa Bay righthander threw the sixth fewest pitches per inning (14.9), trailing only Brandon Webb, Fausto Carmona, Paul Byrd, Roy Halladay, and C.C. Sabathia. Shields looks like the real deal. He has good stuff (including one of the best changeups in the game) and possesses a lot of polish for a second-year pitcher. If Shields has a weakness, it's in the number of home runs he has allowed thus far.
Oliver Perez and Diasuke Matsuzaka fall from seventh and eighth in K/9 to 16th and 15th, respectively, in K/100P. High pitch counts and walks are the downfall in both cases. Ian Snell is the sleeper in this group. He may be one of those undersized righthanders, but the facts are that Snell throws hard and has pretty good command of his fastball and slider.
#21-30 K/100P
Name		IP	SO      Pitches	K/100P	K/9    K/9 Rk
Justin Verlander	201.7	183	3354	5.46	8.17	16
Ted Lilly		207.0	174	3240	5.37	7.57	24
Dustin McGowan	169.7	144	2702	5.33	7.64	23
Jeremy Bonderman	174.3	145	2725	5.32	7.49	25
Dan Haren		222.7	192	3635	5.28	7.76	20
John Lackey	224.0	179	3396	5.27	7.19	31
Kelvim Escobar	195.7	160	3041	5.26	7.36	28
Wandy Rodriguez	182.7	158	3036	5.20	7.78	19
Derek Lowe	199.3	147	3020	4.87	6.64	39
Matt Cain		200.0	163	3351	4.86	7.34	29
There are a number of good, young righthanders in the group above. Justin Verlander improved his strikeout rate markedly in 2007, lifting his K/100P from 4.17 to 5.46 and his K/9 from 6.00 to 8.17. With one of the best fastballs in baseball, Verlander has greatness written all over him. There's a lot to like about Dustin McGowan, Jeremy Bonderman, Dan Haren, John Lackey, Kelvim Escobar, and Matt Cain, too. The latter pitched in extreme tough luck last season (as his 7-16 record and 3.65 ERA would indicate), ranking second-to-last in run support with 3.51 RS/9.
Derek Lowe is an interesting example of a pitcher who looks much better when viewed through the prism of K/100P (29th in the majors) rather than K/9 (39th). His strikeout rate was actually the highest its been since he became a full-time starter in 2002. The 34-year-old veteran sinkerballer throws strikes and induces more groundballs than any other starting pitcher.
#31-40 K/100P
Name		IP	SO      Pitches	K/100P	K/9    K/9 Rk
Boof Bonser	173.0	136	2823	4.82	7.08	32
Carlos Zambrano	216.3	177	3692	4.79	7.36	27
Jeff Francis	215.3	165	3485	4.73	6.90	34
Chad Gaudin	199.3	154	3293	4.68	6.95	33
Roy Oswalt	212.0	154	3303	4.66	6.54	40
Daniel Cabrera	204.3	166	3565	4.66	7.31	30
Jeremy Guthrie	175.3	123	2677	4.59	6.31	46
Bronson Arroyo	210.7	156	3432	4.55	6.66	38
David Bush	186.3	134	2979	4.50	6.47	42
Matt Belisle	177.7	125	2793	4.48	6.33	45
Like many others who walk more than their fair share, Carlos Zambrano's K/100P ranking slips a bit as compared to his K/9. On the other hand, strike throwers Jeremy Guthrie and Matt Belisle moved up a number of spots.
#41-50 K/100P
Name		IP	SO      Pitches	K/100P	K/9    K/9 Rk
Fausto Carmona	215.0	137	3137	4.37	5.73	55
Gil Meche		216.0	156	3579	4.36	6.50	41
Scott Olsen	176.7	133	3060	4.35	6.78	35
Kip Wells		162.7	122	2812	4.34	6.75	36
Doug Davis	192.7	144	3356	4.29	6.73	37
Adam Wainwright	202.0	136	3175	4.28	6.06	48
Jamie Moyer	199.3	133	3148	4.22	6.01	51
Brad Penny	208.0	135	3227	4.18	5.84	54
Dontrelle Willis	205.3	146	3491	4.18	6.40	44
Roy Halladay	225.3	139	3330	4.17	5.55	57
The above pitchers rank in the bottom half of all qualified starters in K/100P. The best performers, like Fausto Carmona, Brad Penny, and Roy Halladay, throw strikes and/or induce an inordinate number of groundballs. Pitchers can succeed with K/100P over 4.00. However, it becomes much more problematic when the rate drops below this threshold.
#51-60 K/100P
Name		IP	SO      Pitches	K/100P	K/9    K/9 Rk
Tim Hudson	224.3	132	3165	4.17	5.30	62
Kevin Millwood	172.7	123	2953	4.17	6.41	43
Andy Pettitte	215.3	141	3395	4.15	5.89	53
Nate Robertson	177.7	119	2890	4.12	6.03	49
Miguel Batista	193.0	133	3259	4.08	6.20	47
Tom Gorzelanny	201.7	135	3312	4.08	6.02	50
Joe Blanton	230.0	140	3481	4.02	5.48	58
Kyle Lohse	192.7	122	3043	4.01	5.70	56
Paul Maholm	177.7	105	2644	3.97	5.32	60
Greg Maddux	198.0	104	2703	3.85	4.73	70
Tim Hudson lowered his walk rate from 2006 (3.26 BB/9) to 2007 (2.13 BB/9) by more than a third, and it did wonders to his ERA (plunging from 4.86 to 3.33). The 32-year-old righthander also increased his GB rate and decreased his HR rate to near career bests.
#61-70 K/100P
Name		IP	SO      Pitches	K/100P	K/9    K/9 Rk
Barry Zito	196.7	131	3411	3.84	5.99	52
Tim Wakefield	189.0	110	2881	3.82	5.24	63
Jose Contreras	189.0	113	3006	3.76	5.38	59
Mark Buehrle	201.0	115	3103	3.71	5.15	64
Chien-Ming Wang	199.3	104	2861	3.64	4.70	71
Jason Marquis	191.7	109	3029	3.60	5.12	65
Josh Fogg		165.7	94	2675	3.51	5.11	66
Jarrod Washburn	193.7	114	3271	3.49	5.30	61
Jeff Suppan	206.7	114	3328	3.43	4.96	68
Matt Morris	198.7	102	3037	3.36	4.62	72
An extreme groundballer like Chien-Ming Wang can operate effectively with such a low strikeout rate. He needs to throw strikes and keep the ball down in the zone. If he loses the ability to do one or the other, his value will drop accordingly.
#71-80 K/100P
Name		IP	SO      Pitches	K/100P	K/9    K/9 Rk
Matthew Chico	167.0	94	2829	3.32	5.07	67
Woody Williams	188.0	101	3148	3.21	4.84	69
Paul Byrd		192.3	88	2836	3.10	4.12	76
Braden Looper	175.0	87	2807	3.10	4.47	73
Jon Garland	208.3	98	3293	2.98	4.23	74
Brian Bannister	165.0	77	2603	2.96	4.20	75
Carlos Silva	202.0	89	3057	2.91	3.97	78
Livan Hernandez	204.3	90	3361	2.68	3.96	79
Tom Glavine	200.3	89	3341	2.66	4.00	77
Aaron Cook	166.0	61	2407	2.53	3.31	80
You can have any and all of these pitchers. In order to survive, much less thrive, without racking up strikeouts, pitchers need to limit the number of walks and keep the ball on the ground. Matt Chico ranks poorly in all three areas. The southpaw is young and could improve, but the odds are against him and his mid-80s fastball to succeed unless he exhibits pinpoint control in the future.
Good luck to the team that ends up signing Carlos Silva to at least a four-year contract for upwards of $12 million per season. You have been forewarned. Silva does a great job at limiting the number of bases on balls, but he is living on the edge. Livan Hernandez is another free agent who is likely to disappoint his new team. This guy is simply no good. He has outlived his usefulness as a MLB pitcher. To wit, Hernandez's K/9 not only dropped by 1.37 last year to the lowest level of his 11-year career but wound up below 4.0 for the first time ever. At the same time, his BB/9 (3.48) was the highest since 1998, resulting in the lowest K/BB ratio (1.14) of his career. By the latter measurement, he was the worst qualified starting pitcher in the majors last year. Did I mention that Livan also had the second-highest HR/9 (1.50)? Woody Williams was the only pitcher who allowed more long balls, and he just happened to rank in the bottom ten in K/100P as well.
Many of these pitchers, including the newly acquired Jon Garland of the Los Angeles Angels, will find themselves in the Southwest Quadrant (below-average K and GB rates) when I unveil this series during the off-season. Take a look at the pitchers who inhabited this quadrant in 2006. There's not a lot to get excited about other than Joe Blanton.
Strikeouts. Pitch totals. Putting strikeouts in the numerator and pitch totals in the denominator allows us to measure dominance and efficiency or what I have referred to it as "strikeout proficiency." As a standalone stat, I believe it tells us more than K/9 or K/BF.
| Command Post | November 23, 2007 |
Post-Thanksgiving Quickie
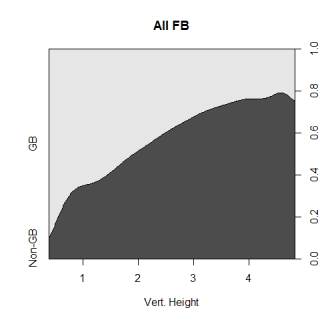
I didn't have much planned today, but I was playing around with these conditional probability plots this week, and thought I'd share them. Conditional probability charts show the probability of an event happening, given one condition. In this case, they show the chance of a ball in play being hit on the ground given the height it crossed home plate.
The graph below shows the probability of a fastball (that is put in play) either being hit in the air or the ground, given the vertical height where it crossed the plate. The dark gray region is the probability of the ball being hit in the air, while the lighter region is the corresponding chance of the ball being hit on the ground. The curve is smoothed slightly and the general pattern of low pitches producing more groundballs is what you would expect. This isn't surprising, but what’s cool is that you can see the continuous relationship between height and the chance of a groundball.
Moving on, the graph below on the left shows the same thing as the graph above (the chance of a random pitch to be hit in the air or on the ground), but only for fastballs with a pfx_z value of less than 5 inches. This means that the pitch ended up 5 inches higher than a non-spinning pitch would have, and while that value doesn’t mean anything by itself, that’s the cutoff point I used to define sinking fastballs. The graph below on the right is for all fastballs with a pfx_z value greater than or equal to 5 inches and just looking at the two graphs, you can tell that there is a big difference in the chance of a sinker being turned into a groundball compared to a regular fastball.
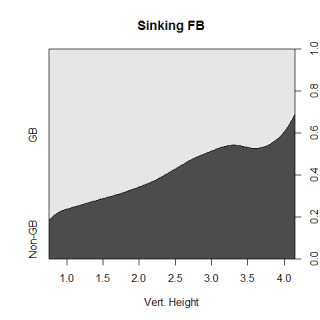
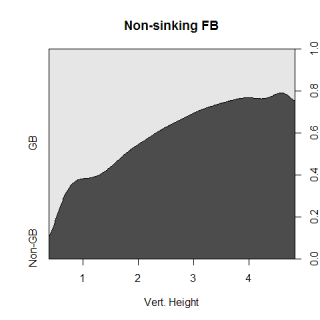
Very roughly, the strike zone goes from a height of 2 feet to 4 feet, so a sinker at the knees that is put in play has a 65% chance of being a groundball, while a non-sinking fastball at the same spot has a 45% chance to be a grounder if it is put in play. At the top of the strike zone, a sinker has a 40% chance of being a grounder, while a regular, non-sinking fastball has only a 25% chance, so a sinker up in the zone is almost as likely to get a grounder as a regular fastball at the knees. At almost every height, sinkers are 15-20% more likely to be hit on the ground than a regular fastball. There are a ton of other considerations to take into account if you were finding the true chance of a ball-in-play being a grounder, like the horizontal position of the ball and exactly how much a pitch "sinks" (or breaks or spins or whatever you call it), but this is just another illustration of why sinkers can be so valuable for a pitcher.
====================================================================
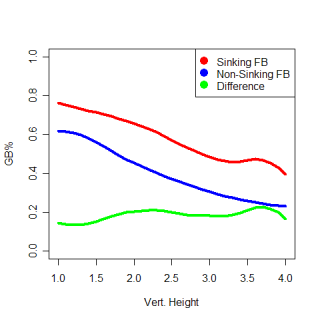
11/24 UPADATE: The 2nd and 3rd graphs I showed aren't very easy to understand, so here is a much more straightforward version of the information.
| Change-Up | November 21, 2007 |
Know Your Really, Really Available Players Under Contract: What are You Getting in Johan Santana?
The Minnesota Twins have made it well known that for the right price, their superstar left-hander Johan Santana can be had. Santana, in possession of a no-trade clause, has made it known that he will not be going anywhere without a handsome extension in place, probably in the range of five or six seasons at $25 million annually or so.
Whether Santana is a good investment or not at that price depends on the team and situation. How deep are your pockets? Are you willing to commit that much money for that many years to a pitcher? Do you want to part with top-flight prospects for the mere opportunity to negotiate one of the largest deals for any pitcher in history?
Don't get me wrong, if any pitcher is worth it, it is Santana. From 2004 through 2007, Santana boasted the 2nd, 6th, 10th and 39th best single-seasons (minimum 200 IP) over that four year stretch in terms of ERA+. He threw about 1,370 innings over that time. Since his high and low innings pitched totals during said time frame constitute a pretty narrow band (233.7 in 2006, 219.0 in 2007), you can average the seasons with a reasonable measure of accuracy and come out with a figure of 158 ERA+. Since 2004, Johan Santana has been a 158 ERA+ pitcher, all the while pitching an average of 228 innings per season.
The bulk of the work analyzing Santana's future prospects point to his uncharacteristic bout with gopheritis in 2007. While his other figures fall right in line with his previous numbers, he gave up 33 round trippers last season, nine more than he had in any other. This figure is bound to revert back to career norms, and Santana figures to become one of the very best again, and not a mere top-10 or 15 starter. But things happen as you start to try and project further out and when it comes to pitchers, sometimes really weird things happen.
Santana will be 29 for the 2008 season, his ninth in the Bigs. Over the last fifty years, here is what the list of players who averaged 200 innings per year and posted at least a 158 ERA+ over their 29-34 seasons looks like:
Since 1957, 29-34 Seasons, 1,200 Innings with a 158 or better ERA+
                          IP    ERA+
Greg Maddux ('95-'00)    1,407  169
Let's take it a step further. In 2007 Santana posted a career worst ERA+ of 130. Let's generate the same list of pitchers, only we will ratchet the ERA+ figure down from Santana's average of 158 over the last four seasons to his worst total of 130 in 2007. So here it is; 200 innings per season and a 130 ERA+ (Santana's worst as a starter) from 29 to 34.
Since 1957, 29-34 Seasons, 1,200 Innings with a 130 or better ERA+
                          IP    ERA+
Greg Maddux ('95-'00)    1,407  169
Roger Clemens ('92-'97)  1,255  150
Bob Gibson ('65-'70)     1,667  146
Kevin Brown ('94-'99)    1,322  145
Curt Schilling ('96-'01) 1,353  138
Tom Glavine ('95-'00)    1,378  137
Jim Palmer ('75-'80)     1,632  131
Gaylord Perry ('68-'73)  1,911  131
All of this is to say that a team that is prepared to part with top-tier prospects for the rights to guarantee Santana $150 miilion better know what they are getting. If Santana pitches over the life of the deal the way he did in 2007, his worst campaign yet, would that be acceptable? Because just to do that he would have to have one of the best 29-34 stretches of the last fifty years.
Expectation management is a good thing. Santana's new team will be getting a damn good pitcher, probably the very best one in fact. But they are also getting someone who is more or less guaranteed not to replicate the lofty standard he has set over the last four seasons.
| Baseball Beat | November 20, 2007 |
O'tis the Free Agent Season
Sittin' in the mornin' sun
I'll be sittin' when the evenin' come
Watching the ships roll in
And then I watch 'em roll away again, yeah
- Written by Otis Redding and Steve Cropper
News Item #1: Tom Glavine agreed to a one-year, $8 million contract with the Atlanta Braves on Monday. Last month, the southpaw with 303 career victories declined a $13M player option to return to the New York Mets.
Comment: This signing serves as a rare example of where a player uses his free agency to choose location over money. I applaud Glavine, who is married with four children, for passing up the extra dough and taking a hometown discount to return to his roots in Atlanta.
News Item #2: Mike Lowell and the Boston Red Sox agreed to a three-year, $37.5 million deal on Monday. The World Series MVP apparently turned down more years and money from the Philadelphia Phillies and the Los Angeles Dodgers to remain in Boston.
Comment: Kudos to both sides. They found a common ground. Had Boston and Lowell been unable to agree on the number of years, I was going to suggest that they agree on a contract that would be good through the 2011 All-Star Game.
News Item #3: Mariano Rivera reportedly told the New York Yankees last night that he has agreed to a three-year, $45 million contract offer. The average annual salary becomes the highest ever for a reliever.
Comment: The Rivera signing should keep the future Hall of Famer in pinstripes for the rest of his career. With 443 saves, Mo should pass Lee Smith (478) for second on the all-time list late next season or in the early part of the following campaign. Rivera also has an outside shot at leapfrogging Trevor Hoffman (524) before his contract expires.
Glavine joins fellow oldies but goodies Greg Maddux and Curt Schilling as potential free agents who have already signed for 2008. Roger Clemens is unlikely to return next season. Andy Pettitte has said that he will either play for the Yankees or retire. Kenny Rogers would like to pitch for the Detroit Tigers again. These signings and pending retirements mean that Carlos Silva and Kyle Lohse just may be the best starters among the remaining free agents. Similarly, the only relievers of note that are still available are Francisco Cordero and David Riske.
Everybody except Scott Boras knows that Alex Rodriguez has negotiated a new ten-year, $275 million pact with the Bronx Bombers. Jorge Posada has also re-upped with the Yankees, taking two of the best players off the market. Barry Bonds, who was indicted by a federal grand jury on charges of perjury last Thursday, is unlikely to garner much interest at this point.
So what's left? As Patrick Sullivan covered last week, the cream of this year's free agent crop are four center fielders (in alphabetical order): Mike Cameron, Torii Hunter, Andruw Jones, and Aaron Rowand. Hunter will probably sign the most lucrative contract of 'em all with Rowand also getting a longer-term deal for at least $12 million per annum. Rather than learning from the Juan Pierre and Gary Matthews signings last year, teams will close their eyes and pay up for guys like Rowand and hope they produce.
This year's free agent position players and pitchers leave a lot to be desired. If a team is looking to plug in a third outfielder (Jose Guillen or Geoff Jenkins) or settle for a decent second baseman (Kaz Matsui, Tadahito Iguchi, or perhaps David Eckstein) or a warm body at catcher (Michael Barrett or Yorvit Torrealba), there are a few options out there. But the list is cluttered with aging players who are better suited as inexpensive bench players and pinch hitters. In other words, there really aren't many free agents who are likely to be impact players, much less difference makers.
Based on the limited choices in the free agency arena, I would expect that trade discussions will heat up at the Winter Meetings in early December. Front and center will be players such as Johan Santana and Miguel Cabrera who will be entering their walk year in 2008 or 2009. Yesterday's deal between the Chicago White Sox and Los Angeles Angels may be the first of many swaps in the works.
Although Jason Bay is coming off the worst season of his career, he could be a viable option for a team in need of a big bat (I'm looking at you, Arte Moreno and Tony Reagins). He is a Tim Salmon-type player who would fit nicely into left field, forcing Garret Anderson into a full-time role as the club's designated hitter (which is where he belongs). Bay could be a much cheaper option than Cabrera, both in terms of players and salaries.
With four years of major-league service under his belt, the 2004 NL Rookie of the Year will be a free agent after the 2009 season. In the meantime, his remaining arbitration years have been bought out at $5.75M in 2008 and $7.5M in 2009. By comparison, Cabrera is in line to earn about twice those figures as an arb-eligible player this year and next. Mind you, I'm in no way suggesting that Bay is the equal of Cabrera. If money is no object, then, by all means, go get Miggy.
Bay, who turned 29 two months ago, was one of the best players in the NL in 2005 and 2006. In 2007, he hit like the Jason of old through June 1 (.314/.387/.536 with 15 2B and 9 HR), then like an old Jason the rest of the way (.205/.290/.344), including a 9-for-52 finish with only one HR since his last multi-hit game in late August.
Is Bay done? I highly doubt it. You don't go from being very good to bad in a matter of months. Sure, his .247 AVG, .327 OBP, .418 SLG, and 21 HR were all career lows. His walk rate was down and his strikeout rate was up. He experienced major slippage for sure. If Bay hadn't, he would probably be an untouchable. Instead, I think he can be had.
Neal Huntington, who was hired as the Pirates GM in September, is interested in rebuilding the club and one of his best bargaining chips is none other than Bay. If an acquiring team can convince itself that Bay's knees are in good order, his eyesight is 20-20 or better, and he has the fire in his belly to bounce back from a disappointing campaign, then I would suggest giving Mr. Huntington a call.
You see, PNC Park was the most difficult environment in all of baseball for a right-handed hitter to slug home runs last season, as well as from 2005-2007. PNC's HR index for RHB was a 66 in 2007, meaning it suppressed dingers by 34%. It was a 72 over the past three years, lower than RFK Stadium in Washington (76) and McAfee Coliseum in Oakland (82).
Let's take a look at Bay's HR splits the past three seasons:
        Home    Road
2005      9      23
2006     13      22
2007      7      14
If Bay had slugged as many homers at home as he did on the road, he would have gone deep 46, 44, and 28 times the past three years (rather than 32, 35, and 21). These additional 30 HR would have yielded an average of 10 more per season.
Bay's hit chart at PNC in 2007 shows that he tends to pull groundballs while lifting flyballs to straightaway center and to the opposite field in right.
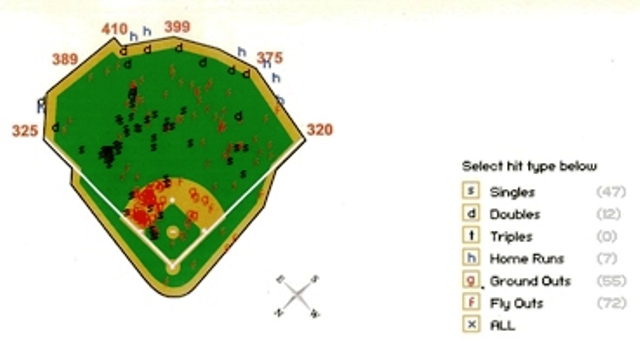
I'm unsure as to whether Bay has lost some bat speed or is simply frustrated by the dimensions of PNC. As Marc Normandin of Baseball Prospectus detailed in a Player Profile last July, Bay ripped the majority of his home runs over the LF wall in 2005 and to LCF and CF in 2006. His power has been gradually drifting from left toward right field over the past couple of years. It's possible that Bay could regain some or all of his lost power by playing in a different home ballpark, particularly one that favors RHB such as Philadelphia, Cincinnati, Colorado, Milwaukee, Houston, Chicago (AL), Toronto, or Baltimore. A more neutral site could even do the trick.
Bay isn't a slam dunk. But the reward may be more than commensurate with the risk.
Now, I'm just gonna sit at the dock of the bay
Watching the tide roll away
Oooo-wee, sittin' on the dock of the bay
Wastin' time
(whistle)
Note: (Sittin' on) The Dock of the Bay was recorded by Otis Redding almost exactly 40 years ago to the day and within 72 hours of the plane crash outside Madison, Wisconsin that took his life. The song was #1 for four weeks in 1968.
| Baseball Beat | November 19, 2007 |
Breaking News: CWS Trade Jon Garland to the LAA for Orlando Cabrera
As reported by ESPN, the White Sox traded right-hander Jon Garland to the Los Angeles Angels for shortstop Orlando Cabrera.
The 28-year-old Garland, an 18-game winner in 2005 and 2006, was 10-13 with a 4.23 ERA in 32 starts last season. He [was] 92-81 with a 4.41 ERA in 246 games, including 223 starts, over eight major league seasons, all with the White Sox.Garland was acquired by the White Sox from the Cubs on July 29, 1998, for pitcher Matt Karchner.
Cabrera, 33, batted .301 with 35 doubles, eight home runs, 86 RBIs and a career-high 101 runs with the Angels last year. He had a career-high 192 hits.
He won his second Gold Glove and led AL shortstops in fielding percentage (.983). Cabrera, who has also played with Montreal and Boston during his 11-year career, is a career .273 hitter. He was on the 2004 Red Sox team that won the World Series.
Chicago also receives cash as part of the trade.
The last sentence shocks me as much as the trade. Without knowing how much cash, it's hard to get overly bothered by this tidbit of information. But . . .
I don't understand this trade unless . . .
1. Arte Moreno caught OC in bed with his wife.
2. The Angels are on the verge of signing Alex Rodriguez and are planning on playing him at shortstop.
3. The Halos are about to deal Jered Weaver or Ervin Santana as part of a package to the Marlins for Miguel Cabrera.
4. The club is going to convert Brandon Wood back to shortstop or hand the position over to Erick Aybar, neither of whom showed last year that they are ready to assume the role on a full-time basis.
5. L.A. is planning to sign fan-favorite David Eckstein to a short-term contract, allowing minor leaguer Sean Rodriguez to develop further.
Thoughts?
| Weekend Blog | November 17, 2007 |
Know Your Free Agents: Is Milton Bradley Worth a Shot?
I know, I know. His volatile history makes any investment in his future a risky proposition. But is it at all possible that we are dealing with a new Milton Bradley? He has always been a nice, above average outfielder who would put up 110ish OPS+ seasons with OK outfield defense, some injuries and a suspension or two mixed in. All in all, he netted out to about an average player.
But he turned into something new altogether this season after Oakland shipped him down "The 5" to San Diego. In 169 plate appearances with the Padres, Bradley put up a .313/.414/.590 line, good for a 167 OPS+ at pitcher-friendly Petco Park. Although he did not come anywhere close to qualifying for any batting titles, his 167 OPS+ was better than any of the qualifiers in the National League.
I am not really sure what to make of Bradley. He will be 30 next April, and his career numbers suggest that his stint with San Diego was anomalous. He is also injury-prone. But given the numbers being tossed around for some of the other free agent centerfielders, an enterprising GM might be well-served to take a gamble on Bradley. Maybe something has clicked for him, maybe he is more mature now, maybe he can get healthy enough to play 140 games or so, and given the discount he is sure to come at vis-a-vis his free agent peers, maybe he is worth tossing $5-to-10 million at for one season.
-Patrick Sullivan, 11/17/08, 3:51 PM EST
| Command Post | November 16, 2007 |
Predicting Pitches
Last time I checked in, I looked at the percentages of fastballs thrown to different types of hitters based on the count. Toward the end of that article, I threatened to try to predict via regression when a pitcher would throw his fastball and this article is the preliminary result of that threat. What I wanted to do was find whether a pitcher threw a fastball or not, a binary variable, based on a particular list of factors, which was made up of both continuous and discrete variables. Regular linear regression can't handle binary dependent variables, but there is a special type of regression, logistic regression , that is designed for just this type of analysis. Given an dependent variable and one or more independent ones, a logistic regression will solve for the logarithm of the odds that a binary event is going to occur. Unlike linear regressions, where the relationship between the dependent variable and independent variables is somewhat obvious based on the generated coefficients, the coefficients created from logistic regressions are more confusing because they're really referring to the log of the odds of the event happening. The methods of a logistic regression are similar to a linear one, in that it models the relationship between several variables, it just does so in a less straightforward fashion.
While that's sinking in, I'm going to backtrack a little. Before getting into the messiness of regressions, I wanted to see if there were any easy correlations to spot. The conditional probability charts below give a good idea of the magnitudes for possible ranges for FB%.
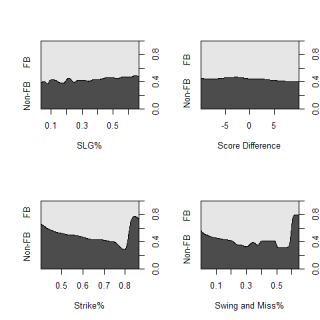
These charts graph the chance that a pitcher will throw a fastball on any pitch, based on one continuous variable. As slugging percent increases, the likelihood of seeing a fastball obviously decreases and there is an very (very) slight increase in the probability of throwing a fastball at the extreme ends of score differential. The two graphs on the bottom use two indicators of the quality of a pitcher's fastball. The graph on the left uses the percentage of a time the fastball is thrown for a strike while the one on the right uses the number of swings-and-misses generated as a percent of total swings taken at the fastball. Unfortunately, both graphs have several small sample outliers on the right that skew the graphs, but overall the trends are pretty strong and obvious. Good fastballs, both in terms of location and "nastiness" will be thrown frequently and these plots give an indication about what factors may be related to the likelihood of throwing a fastball.
Getting back to the regression, the first variable I tested was the 2006 slugging percent of the batter. Clearly there is a relationship between the amount of fastballs a hitter sees and his quality (I've beaten this point into the ground), but how strong is it? The coefficient for SLG was -.77, so for every .010 increase in SLG, the likelihood of seeing a fastball increases by .19 percent. This doesn't seem like that big of an impact, but is still a significant predictor of FB%. According to my regression, the factors that relate to the quality of a pitcher's fastball, the strike% and swing and miss% are also both significant factors if a pitcher threw a fastball.
Categorical variables, such as the count or the situation with base-runners are also important. This is again, a very obvious point, but as opposed to just looking at hitter's counts vs pitcher's counts, and saying certain types of batters see more fastballs in each type of count, with the regression, I can estimate what percentage of fastballs any type of hitter will see in any specific count. The chart below, which is a little confusing, attempts to do exactly that and also account for the quality of the fastball being thrown.
The green lines represent the estimated FB% in each count over a range of hitter abilities, for a fastball that gets a below average number of swings-and-misses. Looking just at the green lines, there are three relatively distinct bands. The top three lines (roughly starting around .8) are 3&0, 3&1 and 2&0, which are the three biggest hitter's counts. There are actually four separate counts in the next two distinct green lines (starting around .7), 3&2, 1&0, 0&0 and 2&1. The bottom cluster of lines has the remaining counts, 1&1, 0&1, 0&2, 2&2 and 1&2. These groupings end up matching pretty well with the groupings of counts found here.
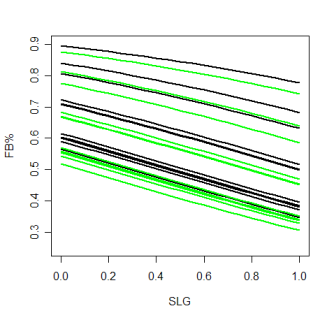
The black lines on the graph are estimates of the exact same thing (FB% in a given count over a range of SLG), but they are for pitches that have a higher than average swing-and-miss%. The ranges of different counts are the same so this just shows the range where most MLB pitchers would lie.
Before I wrap this up, I have a caveat to add. I only recently learned about logistic regression, so it's entirely possible that there is a problem with my methods. If anyone sees something I butchered with the regression, let me know and I'll fix it. I don't think this is the case or I wouldn't be publishing my results, but fair warning.
The differences I'm looking at right now are mostly marginal, especially at the ranges MLB players perform at. The three bands of counts are distinct in the FB% that pitcher's throw, but within each band, its very tough to see any differences. The next step with this type of analysis is to break down pitch selection based on potential swings in win expectancy. Win expectancy would account for score difference, base-runners, and outs, which are very important in determining how a pitcher pitches. The quality of the on-deck hitter is probably important as well.
On an individual pitcher level you could also potentially see more variation within a specific count. If Josh Beckett is throwing 70% fastballs in a 0&0 count while other Josh Beckett-types (pitchers with three pitches and a similar quality fastball) are throwing 60% fastballs in that count, that could be very valuable. Those numbers are for illustration, but a discrepancy like that would be important.
| Change-Up | November 15, 2007 |
Know Your Free Agents: Centerfielders are plentiful, value plays not so much
Teams are faced with some tough choices as they relate to centerfield this off-season. The name-brand players are there for the taking, but only at steep prices. Torii Hunter, Andruw Jones, Aaron Rowand and Mike Cameron are all free agents, and all have track records as solid (even in down years) contributors for contending teams.
Time ticks, however, and given the defensive demands of the position, one would have to think long and hard about just how prudent it would be to take on any one of these players. Each is on the wrong side of 30. They all figure to regress defensively. And even if they all continue to notch strong offensive seasons, a move out of centerfield to one of the corner outfield spots or, say, first base would sap a great deal of their value.
There is another option who is most definitely on the market, but the trade market and not the free agent one. Let's see how he stacks up. We will start with three-year splits, and incorporate three-year averages for Win Shares and WARP3. Then you will see presented 2007 figures.
         AGE  AVG   OBP   SLG  WS WARP3
Hunter   32  .279  .335  .487  18  6.3
Jones    31  .249  .341  .507  21  5.1
Rowand   30  .283  .344  .453  17  6.4
Cameron  35  .259  .342  .461  21  6.0
Non-FA   28  .279  .332  .415  16  6.7
          AVG   OBP   SLG OPS+ WS WARP1
Hunter   .287  .334  .505 122  24  5.5
Jones    .222  .311  .413 88   16  4.6
Rowand   .309  .374  .515 123  23  7.8
Cameron  .242  .328  .431 103  22  5.1
Non-FA   .268  .330  .382 83   16  6.0
The non-FA, as many of you might have guessed, is Coco Crisp. He had an off-the-charts defensive year and though he has been more or less anemic at the plate for two seasons running now, he came to the Red Sox after the 2005 season as a solid offensive option for a center fielder.
Teams in the center field market have some nice options to consider in the free agent market. Torii Hunter and Aaron Rowand figure to continue to be solid players for a few more years. I fully expect a couple of bounce-back years from Andruw Jones. Mike Cameron, at 35, looks like more of a risk. The problem is that all of these guys would like long-term deals, and every one of them figures to decline. Anyone remember the end of Bernie Williams's run in center field for the Yanks? Even if you hover around an .800 OPS, if you can't field you are not of much use.
All of this makes Crisp an attractive option. He is owed $4.75 million in 2008 and $5.75 million in 2009. With the emergence of Jacoby Ellsbury for Boston, Crisp is nothing if not expendable. For Boston's part, if the market is not as heated as they would like for Crisp's services, trading Ellsbury as part of a package for, say, Johan Santana or Miguel Cabrera should be considered an option. Crisp figures to be anywhere from useful to excellent for the two seasons he is under contract.
For teams capable of taking on the financial burden of a player they know will decline, this year's centerfield free agent crop offers a number of players who figure to offer nice return for the first couple of years of their contracts. For teams with shallower pockets, the trade market and more specifically, a good look at Boston's Coco Crisp and Jacoby Ellsbury will offer a better alternative.
| Designated Hitter | November 14, 2007 |
Baseball Trading Economics 101
As we enter the off-season with few marquee free agents on the market, the talk around baseball will start to revolve around potential trades. Fans, sportswriters and even real life GM's will start thinking about what they would be willing to offer other teams to get them to part with their stars. As George Costanza once mused, "I think I got it. How 'bout this? How 'bout this? We trade Jim Leyritz and Bernie Williams, for Barry Bonds, huh? Whadda ya think? That way you have Griffey and Bonds, in the same outfield! Now you got a team!" Unfortunately, a significant number of fans, sportswriters (and even the occasional GM) don't understand the basic rules that govern (or at least, should govern) trade value in baseball. So before the Mets go trading Jose Reyes and Mike Pelfrey for Johan Santana and Jason Bartlett, it is time to learn about the concept of lease equity.
Lease equity is, in a word (OK two), the easiest way to understand the trade market and assure that your team isn't selling its future for a short-term rental (yes, I am thinking of you, Houston Astros, for trading Jason Hirsh, Taylor Buchholz and Willy Taveras for Jason Jennings). The concept is simple, every player under contract has a certain value, in dollars, which is a function of the length they are under control and the amount of money they are owed. To figure out lease equity, you simply determine the difference between the relevant term of a player's contract and what that player would receive (or you, as the GM, would be willing to pay the player) as a free agent on the open market. So, if a player has a two-year contract for $10 million, but would likely get a two year contract for $15 million, that player has a lease equity value of $5 million. Significantly, lease equity value need not be positive. An albatross of a contract has negative value and, accordingly is only moveable as part of a salary dump. Indeed, a star can have negative lease equity value, as evidenced by the unwillingness of any team to pick up Manny Ramirez's contract a couple of years ago when he was left on waivers.
Under this scenario, it is clear that the most valuable commodity is a young star player locked up for multiple years. Indeed, a superstar at $15 million can have the same lease equity value as a replacement player at league minimum. Which brings me to an important concept, lease equity is not the same as quality. Having a team with lots of valuable commodities doesn't mean you will have success. Just ask the Florida Marlins, who have some great inexpensive players and not much success to show for it. Conversely, a team full of pricey veterans, think the Yankees, can be a powerhouse without a lot of contributions from its players with the most lease equity. A market priced Bobby Abreu or A-Rod added more to the Yankees success than guys like Joba, Hughes, Cabrera or Cano. What having a player with a positive lease equity value does is twofold: a GM can use that "saved" money elsewhere to improve his team within his budget or, alternatively, he can trade that value for other players who may have more value (as a player) or are a better fit for his team.
There are some other concepts that need to be understood, before we start figuring out how lease equity affects trade scenarios. The first concept is that control (i.e., the lease) is the key to value. Even if an arbitration eligible player does not have a contract for the next year, as long as his estimated value is higher than his probable salary (likely based on the arbitration rules), that player has positive lease equity value. The trick, of course, is estimating his salary and his likely free agent value.
The second issue to note is that lease equity value is market based. Unless a free agent takes a home town discount (which is rare because when a player signs an early extension, he is not really providing a discount but trading upside for security, just ask Chris Carpenter and the Cardinals), a free agent's lease equity is zero at the time he is signed. If the market determines that Gary Matthews or Juan Pierre is worth $50 million for 5 years, that is the market for a mediocre center fielder, irrespective if it is a "good" deal. The market is "right," because it constrains what a GM can do with his money or the lease equity value of the players he controls, the two primary assets that a GM has in building a team. Other signings also provide a good jumping off point for determining the values of players who are years from the market, like a Grady Sizemore (worth a lot more annually than Pierre or Matthews) or Lastings Milledge (probably fairly comparable).
The third issue to consider affects the way that "likely salary" is estimated. At this point, it's not unreasonable to assume that, if he hits the market a year from now, Johan Santana will command a six year $150 million contract. But $25 million a year is not the right number to plug in to determine his value in a trade right now. Santana is under contract for one year now at $13.25 million. If he went on the market and sought only a one year contract, he may well receive $30 million or higher. The reason for this is simple. As a one-year bet, the team takes a much smaller risk in terms of injury and future performance than with a long-term contract. Thus, a team would pay more, per year, for a shorter contract. After that, the player is still presumably available at market rate and the team can evaluate its needs then. Also, draft pick compensation if he leaves is also of some value. In other words, for evaluating trades, the shorter the remaining contract, the higher the assumption that needs to be made with respect to the per year annual salary.
The fourth issue to keep in mind is that, for prospects and young players, it may be hard to make a good estimate of future performance and reasonable minds may, and usually will, differ. That is how some players become busts and some trades for prospects go down as the worst in history. But just because it's hard, it doesn't mean it's impossible. The ability to project prospects is a cottage industry these days. Additionally, prospects are almost never likely to have negative lease equity value because if they fail, they will never cost much, and the option value of them being major league contributors can be estimated. Recognizing diamonds in the rough (think Terry Ryan getting Francisco Liriano as a throw-in for Pierzynski), is thus incredibly valuable to a team.
The fifth issue to note is that lease equity value in a contract may differ from team to team. When a player signs a free agent contract, the team that has the most need and willingness to meet that price makes the payment, thus establishing the value at the top. Based on market conditions, competitiveness and other factors, lease equity value in a trade can differ from one team to the next. The Mets might pay $35 million for one year of Santana, the Dodgers $30 million and the Royals $15 million. Those numbers factor into any offer that is made. Because lease value is subjective, each GM can determine it for his team separately.
The sixth issue to keep in mind is that lease equity value is a blunt instrument. Because we never know what a player will get on the open market (think of the collective reaction to Gil Meche's contract), the best we can do is estimate within a couple of million dollars. This may sound real rough, but when you factor in real numbers, you can see that it does not prevent appropriate consideration of trades. Also, because it is an art more than a science, there is no need to discount back the dollars in a salary or for determining equity value.
So What Is Santana Worth
Now comes the fun part, let's talk trade and value.
If the Twins decide they can't re-sign Santana this Winter, he will probably be the best player traded this Winter. As noted, he is set to make $13.25 million, at which point he will be a free agent and then may be acquired for "only" money at the market rate. For argument's sake, I am willing to say that if Santana was looking for only a one-year deal this offseason, he may fetch over $30 million. So let's assign a lease equity value to him, optimistically, at $20 million. Now, here in New York, no doubt based on his subpar September there are already beat writers and some fans talking about including Jose Reyes in a trade for Santana. Reyes is signed, including options, for the next four years (including an $11 million option in 2011) for $29.5 million. If Reyes were to be a free agent, for the four years covering his age 25-28 years, I think he likely would get $19-20 million per year, if not more, leaving him a lease equity value at around $45-50 million, far more valuable than a single year of Santana. (Note that I assume fairly high values for young players. This is because, unlike most free agents, if they were to sign today, a GM would be able to buy the peak years, whereas for most free agents, they are already at or past their peak.) It is also hard to see how the Yankees could give up the likes of Phil Hughes and Joba Chamberlain, or the Dodgers to part with Kershaw, Billingsley and Loney for one year of Santana. Of course, trades are made in a market, and if the Dodgers are offering multiple players with high lease values like Kershaw, Billingsley and Loney, then the Yankees better offer a more valuable group if they expect to complete the trade.
But Santana is not the most valuable pitcher likely to be the subject of off-season rumors. Dan Haren is under control for the next three years (including options) for $16.25 million. Considering Barry Zito's contract, three years of Haren is probably a safe bet to cost $60 million. That $45 million or so in value is, at minimum, a sign to any thinking GM that, before pulling the trigger on the winning bid for the Santana sweepstakes, he should see if Billy Beane will take that package for Haren. The other A's pitchers likely to be the subject of rumor, Harden (under control for 2 years at $11.5 million) or Joe Blanton (three years of ML service, so three years of control subject to arbitration eligibility) will be much better deals for the budget-minded trader. Indeed, Harden, with his injury history, probably wouldn't get much more than two years at $15 million total (although he could outperform that significantly), indicating that he is not nearly as valuable to most teams. If Beane gets offered Milledge or Clayton Kershaw for him, he should probably jump at it.
Concluding Thoughts
Long gone are the days when, because of the reserve clause, a GM would make a trade based on the pure baseball talent of the players at issue. Today, dollars are the primary mover of trades, whether it is in a salary dump or a trade of a bargain player that will soon become unaffordable as a free agent. Whether consciously or unconsciously, lease equity value appears to inform the thoughts of most GMs making trades. Even rich teams, like the Mets and Yankees, have recently refrained from doing whatever possible to bring in top talent, instead recognizing that young, under-control players are the coin of the realm in today's baseball market. Remarkably, most journalists and fans don't think this way, as is clear when they talk about what it will take to get Santana. But GMs know they have budgets and that they can't just give away young cheap talent in exchange for market rate stars and expect to succeed in the long run. As long as a GM is mindful of the value he controls and the market for players, he will be able to get the most out of his resources. And, next time you hear that it the Twins are "demanding" Grady Sizemore for Santana, calmly know that Mark Shapiro and the Indians, if they have any sense, are not going to bite.
Doug Baumstein is a New York City lawyer and Mets fan.
| Baseball Beat | November 13, 2007 |
Dustin McGowan: Better Than You Might Think
Quick, go trade for Dustin McGowan before anyone else in your league reads this. You can ask questions later.
OK, now that you have McGowan on your team, let's see if I can put a really big smile on your face by proving that you just stole him from one of your fellow league members, who most likely didn't even know how effective the 25-year-old righthander was last season.
Let's start out by comparing two pitchers. For now, we'll call them Pitcher A and Pitcher B. Hint: one of these two pitchers is Dustin Michael McGowan from Savannah, Georgia.
            GB%   FB%   LD%   K/9  BB/9  K/BB  HR/9
Pitcher A  53.0  31.0  16.0  7.64  3.24  2.36  0.74
Pitcher B  53.0  31.0  16.0  6.54  2.55  2.57  0.59
Which pitcher would you rather have? Pitchers A and B have identical GB, FB, and LD rates. Pitcher A has the superior K/9 rate, while Pitcher B has the better BB and HR rates. It's a tough call, don't you think?
Well, let's take the masks off Pitchers A and B and disclose their names. Pitcher A is none other than Dustin McGowan. Pitcher B is Roy Oswalt. Yes, the All-Star pitcher who has finished in the top five in the NL CYA in five of the past six years. The same guy who signed a five-year, $73 million contract extension in August 2006. That's an average of $14.6M per year according to my math. McGowan made no more than the MLB minimum of $380,000 (and pro rated at that) and will be under the control of the Blue Jays for the next five years.
Oswalt has the longer, more proven track record, but McGowan just might be his equal on a go-forward basis. You won't see him among the league's top ten in wins, ERA, or strikeouts. But, get this, he was 2nd in the AL in SLG (.347) and OPS (.644), 4th in BAA (.230), and 8th in OBP (.296). Only Erik Bedard had a lower opponent SLG and OPS than McGowan. Even if you include National Leaguers, McGowan was fifth in both categories (behind Bedard, Chris Young, Jake Peavy, and Brandon Webb). Oswalt didn't even place in the top ten in the NL in either stat.
McGowan was lights out against righthanded batters. The 6-foot-3, 220-pounder allowed only 59 hits (including just 2 HR) in 298 at-bats. He led the league in BAA (.198), OBP (.262), SLG (.252), and OPS (.514). That's right, Dustin dominated RHB even more than Josh Beckett, A.J. Burnett, Fausto Carmona, Kelvim Escobar, Roy Halladay, John Lackey, and Justin Verlander.
How did McGowan do it, you ask? The former first-round draft choice had the sixth-highest GB% and the sixth-lowest LD%. Only Burnett and Carmona had a better combination of GB and LD rates. Although A.J. had a higher strikeout rate, McGowan bested his teammate in walk and home run rates. The latter's relatively low LOB% (68.1%) could help explain why his 4.08 ERA was worse than his peripheral stats.
Nonetheless, from the middle of July through the end of the season, McGowan was 7-5 with a 3.29 ERA in 14 starts covering 93 innings. He held opponents to a line of .208/.277/.314 during this period, which included three starts vs. the Yankees. The youngster held Minnesota scoreless for 7 1/3 IP on 7/24; allowed only one run in eight innings of work vs. Texas (8/5) and Seattle (9/1); struck out 12 while giving up just 4 hits and 1 walk against Tampa Bay on 9/7; and tossed a 5-hit, no-walk, 9-strikeout, one-run, complete-game gem vs. Boston on 9/17. But McGowan's best start might have been back in June when he faced only 29 batters in throwing a 1-hit, complete-game shutout against the Colorado Rockies. Interestingly, that masterpiece followed his worst outing of the year when he gave up 8 hits and 6 runs in 1 2/3 innings in a 10-1 loss to the Dodgers, a team he had handled quite well just 11 days earlier.
Dubbed by Baseball America as Toronto's top prospect in 2003 and 2006, McGowan has never started a season on the 25-man roster. He was optioned to Syracuse (AAA) last March and was recalled in May after posting a 1.69 ERA with 29 SO in 22 innings. He immediately joined the rotation and never missed a scheduled start the rest of the season. Long on potential and short on results, McGowan had, by far, his best season.
YEAR   AGE    G  GS   IP      H    R   ER   HR   BB    SO    ERA   ERA+
2005    23   13   7   45.1   49   34   32    7   17    34   6.35    70
2006    24   16   3   27.1   35   27   22    2   25    22   7.24    63
2007    25   27  27  169.2  146   80   77   14   61   144   4.08   109
CAREER       56  37  242.1  230  141  131   23  103   200   4.87    92
McGowan throws four pitches, including a fastball that sits at 94-96 mph and touches the upper-90s, a high-80s slider, power curveball, and a changeup. His fastball has better-than-average life down in the zone, inducing an inordinate number of worm burners. According to The Bill James Handbook 2008, McGowan had the fourth-fastest heater (94.7) in the AL. He was also 10th in terms of using his slider (18.7%) and fifth in opponent OPS vs. sliders (.504).
Courtesy of Joe P. Sheehan, one of the gurus when it comes to tracking pitches, I present McGowan's and Oswalt's pitch types in graphical format. The former's data is based on 1,182 pitches, which covers most of the second half of the season (when he was on top of his game).
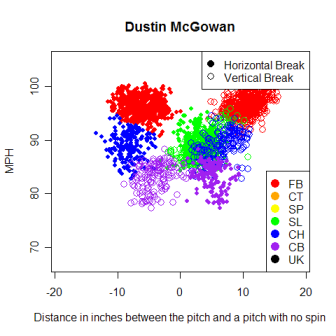
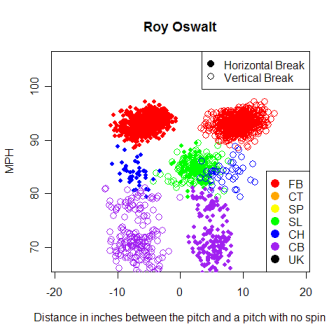
As you can see, McGowan actually throws a harder fastball (96.25 vs. 93.13) and slider (89.15 vs. 84.71). He also uses his changeup (16%) more often than Oswalt (4%), who prefers to go with his curveball (19%) as more of his off-speed offering.
McGowan by Pitch Type:
CB    LHB     91
CB    RHB     52
CH    LHB    146
CH    RHB     42
FB    LHB    326
FB    RHB    254
SL    LHB    115
SL    RHB    156
The results of these pitches are graphically displayed in the following links: FB vs. RHB, FB vs. LHB, SL vs. RHB, and SL vs. LHB. The latter two graphs give one a sense of how McGowan's slider moves across the strike zone.
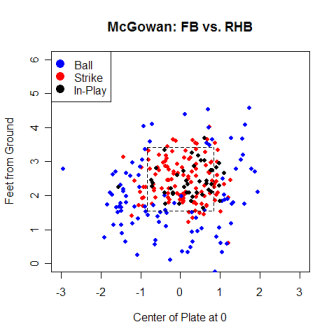
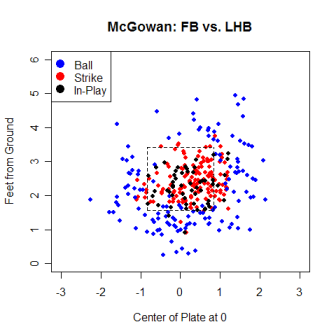
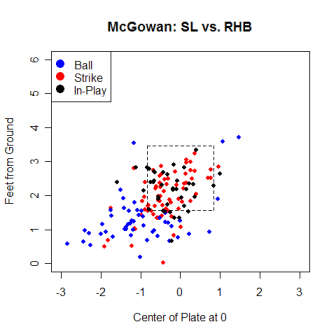
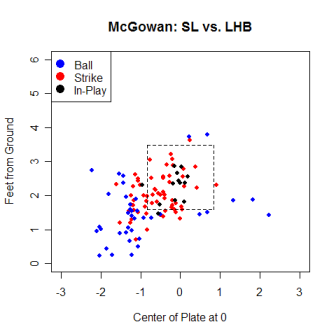
Drilling down deeper, here are McGowan's pitch types by count:
	FB	CH	SL	CB
0&0	167	38	69	25
0&1	57	24	38	21
0&2	11	 3	23	18
1&0	87	26	17	 2
1&1	45	28	28	14
1&2	22	13	30	40
2&0	31	11	 8	 1
2&1	46	 9	13	 3
2&2	41	14	36	16
3&0	 8	 7	 0	 0
3&1	18	 8	 1	 1
3&2	47	 7	 8        2
Tot      580      188      271      143
As shown, McGowan threw his fastball 49%, slider 23%, changeup 16%, and curve 12% of the time during the second half. Not surprisingly, he relied on his fastball to get ahead of hitters. Conversely, he used his secondary pitches when he had a pitcher's count and went to his curve as a strikeout pitch.
Where can McGowan improve? Well, his control is less than impeccable. He walked 61 in 169 2/3 innings and was third in the league in wild pitches with 13. However, it is important to point out that his walk rate improved as the season progressed. Dustin only allowed two or more bases on balls in two of his final seven starts when he gave up 13 BB in 47 1/3 IP (including 6 BB in only 4 1/3 IP vs. the NYY in his second-to-last outing of the year).
McGowan could stand to lower his HR rate vs. LHB (12 in 338 AB and 377 PA). That said, his rate stats (.257/.326/.432) were actually quite acceptable for a RHP and his strikeout rate (20.7%) was a tad better than his overall total (20.4%).
Lastly, McGowan can also learn how to hold runners on base better. He was third in the AL in stolen bases allowed last season. Runners stole 29 bases in 30 attempts while he was on the mound. They have been successful 39 times in 44 tries over the course of his MLB career. Catchers Gregg Zaun and Jason Phillips are partially to blame here as they only threw out 17 of 133 base stealers (13% vs. a league-wide average of 27%).
Rogers Centre played as a pitcher's park in 2007, suppressing hits and runs. The AstroTurf surface may be conducive to McGowan, who was 8-3 with a 3.27 ERA at home and 4-7 with a 4.91 ERA on the road. An infield consisting of John McDonald at SS, Aaron Hill at 2B, and Lyle Overbay at 1B is a decided plus for any groundball pitcher. Alex Rios in RF and Vernon Wells in CF are two of the better fielding outfielders in baseball as well. The Defensive Efficiency Ratio was .727 (which is basically the same thing as saying batters hit .273 on balls in play).
McGowan has future ace written all over him. Only 25-years-old with a high ceiling. First-round draft pick. Top prospect in the system on two separate occasions. Mid-90s fastball with a "plus" slider. With excellent groundball and strikeout rates, he lives in the tony Northeast Quadrant (which I will update and feature once again this off-season) with similar percentages as Chris Carpenter in 2006. My kind of pitcher indeed.
OK, any questions?
[Additional reader comments and retorts at the Baseball Think Factory/Baseball Primer Newsblog.]
| Baseball Beat | November 12, 2007 |
Open Chat: 2007 Awards
The 2007 award winners will begin to be announced starting today with the NL and AL Rookies of the Year. The schedule is as follows:
Mon., 11/12: NL and AL ROY
Tues., 11/13: AL CYA
Thur., 11/14: NL CYA
Mon., 11/19: AL MVP
Tues., 11/20: NL MVP
Who do you believe *should* win each of the above awards (as opposed to who you think *will* win)?
| The Batter's Eye | November 11, 2007 |
Solving the Brad Lidge Puzzle
In the case of Brad Lidge, there seem to be two questions: confidence and mechanics. For example, Phil Garner has alluded to bad "karma" and catcher, Brad Ausmus, has mentioned a change in mechanics that has affected Lidge's performance. Of course, the fans and others have their opinions as well.
Looking at the stats, Lidge's WHIP did make a downward turn in 2007, but his K/9 (although healthy at 11.82) and BB/9 have been going in the wrong direction. Before jumping off the deep end, however, we have to realize that Lidge is still pretty good. Keith Law, for instance, argues that Houston should have got more in return in their recent trade with Philadelphia. Lidge's stats are on the decline partly because his 2004-05 seasons were so totally dominant. When you're at the "top", there is usually only one way to go.
But what if Lidge could stay at the peak of his game? This brings us back to confidence and mechanics.
Confidence
Most of us remember this - Albert Pujols' 3-run game winner off Lidge in the 2005 NLCS:

Without getting into specifc speculation about Brad Lidge, I just want to present some objective information from the world of Sports Psychology. There is something called attentional focus that directly relates to each person's ability to concentrate. Subsequently, there are a number of internal distractors which can deter focus, and one of these distractors is attending to past events.
When a player gets pre-occupied with past performances (or mechanics, which we'll get to) it can cause performance to suffer. Here is a good illustration:

Ideal attentional focus is shown at the top. But if a player is thinking about too many things - like the crowd, past peformance, mechanics, etc. - then his focus is too broad (middle). Conversely, his focus may be too narrow (bottom) if he doesn't consider critcal information about his situation (ie. read the scouting report).
Mechanics
Here is a look at Lidge in 2005 and 2007:

Below is a 4 minute video comparison with my commentary on Lidge's mechanics from the 2005 and 2007 seasons. Click the "play" button:
| Launch in external player |
Opponents still aren't getting great looks off of Lidge, as evidenced by a .222 BAA in 2007, but since 2005, Lidge is walking about one more and striking out one less batter per nine innings. Perhaps most telling, though, is that Lidge is giving up double the HR/9 over the last two years. Judging by Ausmus' comments, it appears that the main issue is with the slider. Ausmus says other batters are getting a better look at his slider and the video seems to back this up. So if they are laying off a bit more and jumping on more mistakes, this makes some sense.
Also on the slider, I mentioned in the video that the 2005 Lidge should, in theory, create more arm speed. If this is true, it may serve to create more/tighter spin on the slider which would equate to a sharper break. Combine this with a bit more deception, and maybe Lidge is right back to his old position as a dominant closer.
If I was in the position of an organization such as Philadephia, these are exactly the types of players I would try to pick up - players that still have the ability, but whose "stock" might be slightly down. Especially when you can pick out elements of change and try to help them get back to things that they have already done in the past, rather than attempt to create new changes. From that standpoint, I have to say I like this move by Philly.
| Designated Hitter | November 09, 2007 |
Runner’s Reluctance - Part Two
In Part One of this two-part series we explored the reluctance of runners and coaches to take risks on the basepaths, discovering that 97% of those attempting to advance on centerfielders were successful in 2006 while the break-even point is significantly lower than the actual success rate for every conceivable situation. I concluded in that article that runners and coaches were incredibly risk averse. In this article I will attempt to quantify the lost opportunity associated with this conservative strategy.
The numbers from 2006 tell us that less than half (47%) of baserunners attempted to advance on balls hit to centerfield while 97% were successful. From that existing state, let’s imagine that 3rd base coaches start sending runners more frequently in an attempt to take more chances and score more runs. One can easily surmise that the success rate would steadily go down as more runners take the chance. In Economics, this is referred to as the Law of Diminishing Returns. Let’s assume that for each additional 1% of attempts (which rounds to 75 runners), the success rate drops by 1%. So the first 75 guys succeed at a 96% rate, the next 75 at 95% and so forth. The chart below graphically frames the problem under discussion. It shows what this notional curve would look like (in green) compared to a break-even level of 71% (red). Also included in the graph is a purple line showing what would happen if every additional runner were thrown out and another line in blue showing what would happen if the rest of the attempts were at the break-even rate of 71%.
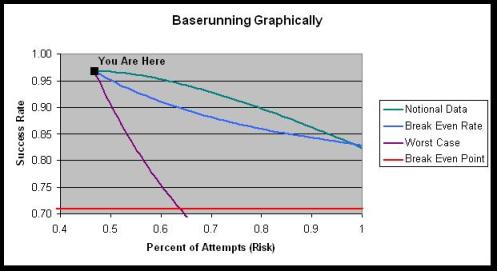
Notice how 17% more baserunners would have to take the risk and all of them get gunned out before the overall success rate equals the break-even point of 71% (where the purple and red lines intersect). Obviously it wouldn’t be advisable to send 17% more guys knowing they would all get thrown out. In fact, it wouldn’t be advisable to send any runners who had a 0% chance of success. Instead, a coach should theoretically send anyone whose chance of success is better than the break-even rate of 71%. So any curve above the blue line would result in a positive number of runs scored.
To estimate the number of additional runs that could be scored if runners and coaches were more aggressive, we examine the notional data more closely. Going back to the Expected Run table introduced last time, the weighted average of outcomes where a runner is successful in trying for the extra base comes out to .29 additional runs for the remainder of an inning (the reward), while failures cost .71 runs on average (the risk). Coincidentally, .71 and .29 add to 1.00 and the break-even rate happens to be the same as the risk, i.e. .71. Using these values for risk and reward, the table below calculates the net runs scored by each set of 75 attempted baserunners.
Notional Data – If Runners Were More Aggressive
Runners     Success    Number       Successes    Failures      Net Runs
            Rate       Thrown Out   (*.29)       (*-.71)
---------------------------------------------------------------------------
75          0.96        3           20.9         -2.1          18.8
75          0.95        4           20.6         -2.8          17.8
75          0.94        5           20.3         -3.6          16.7
75          0.93        5           20.3         -3.6          16.7
75          0.92        6           20.0         -4.3          15.7
75          0.91        7           19.7         -5.0          14.7
75          0.90        8           19.4         -5.7          13.7
75          0.89        8           19.4         -5.7          13.7
75          0.88        9           19.1         -6.4          12.7
75          0.87       10           18.9         -7.1          11.8
75          0.86       11           18.6         -7.8          10.8
75          0.85       11           18.6         -7.8          10.8
75          0.84       12           18.3         -8.5           9.8
75          0.83       13           18.0         -9.2           8.8
75          0.82       14           17.7         -9.9           7.8
75          0.81       14           17.7         -9.9           7.8
75          0.80       15           17.4        -10.7           6.7
75          0.79       16           17.1        -11.4           5.7
75          0.78       17           16.8        -12.1           4.7
75          0.77       17           16.8        -12.1           4.7
75          0.76       18           16.5        -12.8           3.7
75          0.75       19           16.2        -13.5           2.7
75          0.74       20           16.0        -14.2           1.8
75          0.73       20           16.0        -14.2           1.8
75          0.72       21           15.7        -14.9           0.8
Totals
1875        0.84       303         456.0       -215.3         240.7
Notice the Law of Diminishing Returns in action in the far right column, with fewer and fewer net runs scored as the success rate goes down. The table also reinforces my earlier statement that the optimal strategy is for a 3rd base coach to send anyone with a chance of success greater than .71. After that, the net runs scored is a negative value and the tactic becomes counter-productive.
The value in the lower right of 240.7 represents an estimate of the additional runs all 30 major league teams would’ve scored in 2006 (using the notional set of data) if they all used an optimal baserunning strategy for balls hit to centerfield with runners on base. This comes out to 8 runs per team, which is not a lot. However, including balls hit to left and rightfield, the estimate grows to 26 runs per team (14% more balls are hit to left and right than to center). If one makes the assumption that runners are equally reluctant to try for an extra base with no baserunners in front of them (i.e. stretching singles into doubles, etc.), the estimate grows to 50 runs per team since approximately 47% of baserunning opportunities occur with nobody on base.
I concede that it’s quite a stretch to assume runners are reluctant to stretch hits at the same rate as they are in advancing on hits. Unfortunately, Retrosheet data doesn’t lend itself to the kind of analysis required to test that assumption. Regardless, one can safely say that “runner’s reluctance” could easily cost the average team 30-40 runs a year. This is significant. Using Bill James’ Pythagorean Theorem for run differential, it equates to 3-4 extra wins per season. Any team would love to have 3 or 4 extra wins. All it apparently takes is more aggressive baserunning.
At this point, it’s important to dispel a myth. The optimal strategy is not one where the actual results are equal to the break-even rate. Nothing could be farther from the truth. Viewing the table of notional data above, the optimal strategy has a success rate of .84, not the break-even value of .71. Including the initial 2006 data (97% success rate on 3500 attempts), the total success rate for an optimal strategy is somewhere around 92%. So the optimal strategy occurs neither where the red and purple lines intersect in the graphical chart above, nor where the blue and green lines intersect. Rather, the optimal strategy occurs where the slope of the blue line becomes parallel with the slope of the green line, which occurs about when the blue line crosses the 92% success rate for our notional data.
One could argue that this estimated optimal success rate of 92% is not so far removed from the actual success rate of 97%, and maybe runners and coaches aren’t wasting so many opportunities after all. I considered this possibility and rejected it because of the likelihood of miscalculations by the coach/runner along with calculated decisions to be more risk averse or accept more risk depending on the game situation. Allow me to illustrate with an example.
Suppose a 3rd base coach is faced with a series of baserunning decisions where the runners have a chance of success listed in the table below. The optimal strategy would look like this if the break-even rate is 71%.
The Optimal Strategy
Player     Chance of Success   Decision
Player A   100%                Send
Player B   90%                 Send
Player C   80%                 Send
Player D   70%                 Hold
Player E   60%                 Hold
Player F   50%                 Hold
Player G   40%                 Hold
Player H   30%                 Hold
Player I   20%                 Hold
Player J   10%                 Hold
Player K   0%                  Hold
The expected success rate for the data above with optimal decisions would be 90% (the average of 80%, 90% and 100%). However, sometimes the coach sends a runner when he shouldn’t, or holds a runner that he should send just because humans make mistakes. Similarly, late in a game when trailing by multiple runs, teams will play station-to-station baseball and take no risks at all. Likewise, trailing by one run, a team might take additional risks to try and score that tying run. Considering these factors, the actual results may look like this.
Possible Results with Mistakes and Risk Adjustments
Player     Chance of Success   Decision
Player A   100%                Send
Player B   90%                 Hold – Risk
Player C   80%                 Hold – Mistake
Player D   70%                 Hold
Player E   60%                 Send – Mistake
Player F   50%                 Send – Risk
Player G   40%                 Hold
Player H   30%                 Hold
Player I   20%                 Hold
Player J   10%                 Hold
Player K   0%                  Hold
Notice how the expected success rate under these conditions becomes 70% (the average of 50%, 60% and 100%). So even though the optimal strategy has a 90% success rate, the actual success rate could be considerably lower because of miscalculations and risk adjustments. That’s why I still believe the actual MLB success rate of 97% is an indication of extreme “runner’s reluctance” given that the break-even rate is 71%.
So far, this notional analysis has looked at all centerfield running situations from 2006 in aggregate. In reality there is a theoretical curve similar to the one above for every situation – every baserunner, every batting order, every ballpark, every pitcher, every defense, every inning, every out, every score, every…well you get the picture. There are literally millions of ways to slice a finite set of data.
Astute readers will recognize that the notional data used in this analysis is merely, well notional. The truth is that nobody knows what the actual curve looks like. For all we know, the curve has a steep drop-off similar to the worst case curve. The notional data was based on the assumption that each additional 1% of baserunners experienced a 1% lower success rate. If the rate was doubled and each 1% of baserunners resulted in a 2% lower success rate, the estimate of lost opportunity would essentially be cut in half. If, however, the success rate dropped at a slower rate, say half as quickly as the notional data, the run estimate would be twice as large. Although the shape of the curve and the magnitude of the lost opportunity may be mere estimates, we can be reasonably sure that there are some additional runs to be squeezed out of baserunning considering the large difference between a 97% actual success rate and the 71% break-even rate.
Now it’s up to MLB teams to use this information to their benefit. I would like to see them start sending more runners in an intelligent way. Third base coaches should have the break-even rates in their back pocket and refer to them in between pitches in anticipation of possible baserunning decisions. Teams should spend some off-season time doing video analysis of their ballplayers to determine success probabilities for each player in various situations. Likewise, teams should thoroughly scout opposing outfielders’ arm strength and accuracy to estimate probability adjustments depending on who fields the ball and where it’s fielded.
For decades, baseball has analyzed and timed the stolen base attempt to the nth degree - from the pitcher’s time to the plate, the catcher’s time to release, to the length of lead by the runner and number of steps and time to 2nd base. I’m not aware of any similar effort for other baserunning situations. With MLB victories worth million of dollars, now is the time to start putting emphasis on this long-neglected area, and correct the problem known as “runner’s reluctance.”
Ross Roley is a lifelong baseball fan, a baseball analysis hobbyist, and former Professor of Mathematics at the U.S. Air Force Academy.
| Designated Hitter | November 08, 2007 |
Runner’s Reluctance - Part One
Sometimes I think most baseball strategy has been figured out thanks to sabermetricians like you and me. Then I discover that a major facet of the game is being mismanaged at a shocking rate.
Let me explain. I recently undertook a study to analyze the importance of outfield arms, starting with centerfielders. I used Andruw Jones as a case study to determine how many baserunners he’s able to prevent from advancing compared to the average centerfielder. What I learned was that Jones, generally regarded as having one of the best outfield arms in baseball, only prevented 9 runners from advancing in 247 chances last year compared to the average centerfielder. Why so low? Is it because Jones doesn’t have such a feared arm after all? Certainly not. Instead it appears baserunners are incredibly reluctant to advance on anybody; basically only taking the risk when it’s a sure thing. Here’s how I came to that conclusion.
Using Retrosheet data from 2006, the success rate of runners attempting to advance on a ball hit to centerfield with less than two outs is seen in the following table.
Less Than 2 Outs        Chances   Attempted    Out       Success
                                  Advance      Trying    Rate
----------------------------------------------------------------
1st to 3rd on single    1079      305          6         .98
2nd to home on single   1039      700          22        .97
1st to home on double   469       243          13        .95
1st to 2nd on flyball   1385      23           2         .91
2nd to 3rd on flyball   1008      360          11        .97
3rd to home on flyball  689       599          15        .97
Total                   5669      2230         69        .97
Notice how 61% of baserunners don’t even try for the extra base with less than 2 outs. Of those who challenge the outfielder, only 3% get thrown out, and only 1% of all baserunners facing the decision of whether or not to advance get gunned down. That’s what I meant when I said they take the risk only when it’s a sure thing.
Here’s the same chart with 2 outs.
Less Than 2 Outs        Chances   Attempted    Out       Success
                                  Advance      Trying    Rate
----------------------------------------------------------------
1st to 3rd on single    699       262          3        .99
2nd to home on single   813       784          33       .96
1st to home on double   304       225          8        .96
Total                   1816      1271         44       .97
So with two outs and the runners moving on contact, and in a situation where one would expect to see additional risks taken because of the greater possibility of stranding runners, the success rate is the same at 97%.
There are three possible explanations for the high overall success rate. One is the possibility that runners and coaches are extremely reluctant to try and advance for fear of getting thrown out and the shame that comes with it. Certainly, being thrown out can be a rally killer, but a 1% failure rate is almost like taking no risk at all.
Another explanation is the extreme difficulty in throwing a runner out from centerfield. Consider all the unlikely things that must happen for a runner to be thrown out. First the defender must field the ball cleanly, then hit the cutoff man with a strong throw, or throw a strike from the outfield to the base in question. If cutoff, the infielder then needs to turn and throw a strike, usually from the outfield grass, without first looking. If all these things go right, there’s still a chance the ball might hit the baserunner. If not, the fielder needs to catch it cleanly, often on a hop, position himself properly and apply the tag. A play at the plate brings additional challenges. A ball thrown from centerfield frequently hits the pitcher’s mound knocking it offline or slowing it down, while the catcher must try and block the plate and brace himself for a collision while still making the catch and applying the tag.
The final possibility is that centerfielders as a whole don’t possess exceptionally strong throwing arms. Rightfielders tend to have the strongest arms because of the need to make the long throw to third base. Also, the prototypical centerfielder is slender and swift, hardly the type of ballplayer known for a cannon arm (yes, I’m referring to you Juan Pierre and Coco Crisp). Ichiro is the exception that makes the rule although he was a rightfielder for his entire MLB career until late in 2006.
Of the three possible explanations for a 97% success rate, the second and third go hand in hand connoting a degree of difficulty that is undeniable. But, given the difficulty of the task, wouldn’t baserunners be more inclined to take the risk? Which brings us back to explanation #1 – there must be a decided reluctance among runners and coaches to try for the extra base.
How reluctant are they and what is the right amount to run? For that we turn to a methodology frequently used to analyze the value of the stolen base. It’s based on the Run Expectancy table here, i.e. the number of runs one can expect for the remainder of an inning given the number of runners on base and the number of outs. From the table, one can calculate the break-even point for various strategies. For instance, if staying put on a base is expected to yield 1.2 runs for the remainder of an inning, and going for the extra base increases the yield to 1.4 runs, but the result of getting thrown out would decrease the expectancy to 1.0 runs, then the risk is equal to the reward and the break-even point is a 50% success rate.
Using that methodology, the generally accepted break-even point for stealing second base is between 67% and 75% as described in this Baseball Analysts article earlier in the season. This type of analysis is common for stolen bases and bunts, but to my knowledge has never been published for runners trying to advance on batted balls - until now.
The graph below shows all the possible scenarios and break-even points for 0 outs and 1 out compared to the actual success rate for each situation.
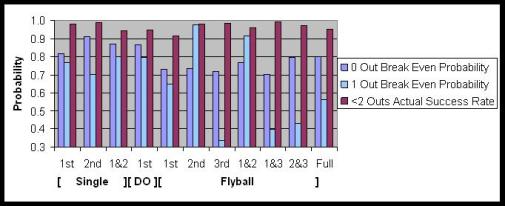
Notice how the break-even points are usually lower with one out than with no outs. This implies that runners should take more risks later in the inning, which makes sense because the more outs there are, the greater chance of a runner getting stranded on the bases. The exception appears to be when a runner is trying for 3rd on a flyball. In that situation, he should be more cautious with one out than with no outs.
Also, the break-even point can be wildly different depending on the number of outs. For instance, with a runner on 3rd and nobody out, the break-even point on a flyball to centerfield is .72 (the flyball being the first out), whereas with one out (two outs after the flyball is caught) the break-even point is a miniscule .34. The break-even analysis indicates that coaches should send guys from 3rd almost every time on a flyball to center with one out. Even if they’re thrown out 65% of the time, the net result will be positive. Basically the risk of sending a dead duck to the plate is worth it compared to relying on the next batter to knock the run in. And yet, the actual success rate in that situation is an incredible 98%! The chart visually depicts that in every situation the actual success rate far exceeds what one would expect using break-even analysis.
Clearly the run environment has a lot to do with break-even points. This includes the ballpark, the stinginess of the pitcher and defense, the score of the game, and the ability of the upcoming batters to drive runs in. Runners should be more cautious with big boppers hitting behind them, while they should be more aggressive toward the bottom of the batting order. Dan Levitt has a good discussion of run environments in his analysis of bunting here. For the sake of simplicity, this analysis ignores the run environment and looks at the situation as a whole, based on a season’s worth of data.
It’s somewhat ironic how the prototypical batting order has the speedy guys up front who would naturally be more aggressive baserunners, followed by the run producers who create a run environment where the speedy guys should be less risky on the bases. I guess I subscribe to the theory that those with the highest OBP should bat in the #1 and #2 spots regardless of how fast they are. But, that’s another topic for another day. Now back to the issue at hand.
With two outs, the chart is simpler because of the absence of runners advancing on flyballs, and looks like this:
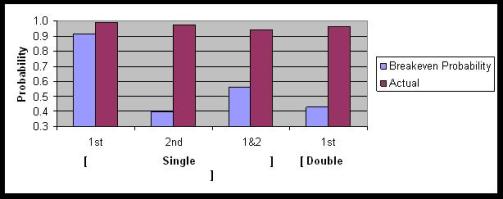
When trying to score with 2 outs, the break-even probability is between .40 and .55 depending on the situation, while the actual success rate is well north of .90! Once again, the chart indicates that the actual success rate is significantly higher than the break-even value for every situation. This data reinforces my previous verdict that runners/coaches are phenomenally risk averse when it comes to taking the extra base.
For as long as I can remember, baseball announcers were always warning fans that it’s a mortal sin for ballplayers to make the first or third out at 3rd base. The data above tests that claim and supports half of the general tenet. With two outs, the highest break-even mark is at 92% when a runner tries for 3rd on a single. Similarly, the first graph showed us that runners trying to advance to 3rd on a flyball caught for the second out have break-even rates of 97% with a runner on 2nd and 92% with runners on 1st and 2nd. So it’s clear that making the final out at 3rd with two outs is not recommended. However, with nobody out, the story is different. Runners trying to advance to 3rd have a break even rate of 81%, but runners trying to score have break-even rates of 91% or 87% depending on the situation. So it appears that the greater sin is getting thrown out at home with nobody out, not at 3rd.
Although my analysis was conducted using only balls hit to centerfield, the results appear to be similar for hits to left and rightfield. According to Dan Fox in his 3-part series on baserunning here, the total success rate from 2000-2004 is .94 for balls hit to leftfield and .96 for balls hit to right not counting runners advancing on flyball outs. It should also be noted that the break-even numbers are conservative estimates. The actual break-even value is lower than indicated because the analysis ignores the possibility of trailing runners advancing on a throw, or of a throwing error allowing a runner to take an extra base. Finally, the analysis doesn’t look at singles stretched into doubles, doubles into triples, or triples into inside-the-park homers because the Retrosheet information doesn’t lend itself to that level of detail. Assuming similar reluctance and success rates, one can extrapolate the information to conclude that the total impact of runner’s reluctance is significantly higher than any estimate based only on baserunners trying to advance.
In conclusion, this is what we know so far:
1. Runners and coaches are extremely reluctant to go for the extra base on centerfielders
2. This “runner’s reluctance” applies not only to balls hit to centerfield as studied here, but to left and rightfield as well
3. Break-even analysis indicates that actual success rates are universally higher than break-even rates
4. In general, runners should take more risks as the number of outs increase
5. Runners should be the most cautious when trying for 3rd with two outs, or when trying for home with zero outs (not 3rd as the old adage states)
6. With two outs, runners should try for home even if the failure rate is greater than 50%.
What we don’t know is the impact of runner’s reluctance relative to runs scored and wins. For that you’ll have come back tomorrow for Part Two of the analysis.
Ross Roley is a lifelong baseball fan, a baseball analysis hobbyist, and former Professor of Mathematics at the U.S. Air Force Academy.
| Change-Up | November 07, 2007 |
Know Your Free Agents - Wherein We Eagerly Await the Contract Ned Is about to Furnish Carlos Silva
Carlos Silva, the 28 year-old right-handed starting pitcher for the Minnesota Twins is about to hit the market. In any sort of rational world, where players make money commensurately with their ability, Silva would be happy to be entering free agency. In the world we currently inhabit, Silva is doing cartwheels straight out of the Metrodome and the chilly streets of Minneapolis as he is set to strike it rich. Here are Silva's numbers over the last four seasons, all with the Twins.
        IP     H    BB   SO   W-L   ERA  ERA+
2004   203.0  255   35   76  14-8  4.21   112
2005   188.3  212    9   71   9-8  3.44   129
2006   180.3  246   32   70  11-15 5.94    75
2007   202.0  229   36   89  13-14 4.19   103
He is a groundball pitcher, a good thing by most any account but his ability to induce groundballs is really the only element of his game that prevents him from being an all out disaster on the mound. See the following:
        G/F  HR  ERA+
2004   1.58  23  112
2005   1.55  25  129
2006   1.29  38  75
2007   1.57  20  103
His consistency in 2004, 2005 and 2007 inspire confidence but his disastrous 2006 shows that Silva walks a fine line on the mound. As you can see in 2006, when the sinker ain't sinkin' and the balls are flying out of the yard, Silva becomes a crummy pitcher pretty quickly. Any team willing to pony up the $30-$40 million guaranteed will have to be assured that Silva has become a surefire groundball machine because minus that skill, his effectiveness all but disappears.
Given his affinity for Derek Lowe and his pitching style, I see Ned Coletti and the Los Angeles Dodgers jumping into the mix for Silva's services. But while Silva is most definitely a groundball pitcher, Derek Lowe he is not. Lowe induces a greater number of groundballs and yields fewer hits. In fact, just about every pitcher in baseball yields fewer hits. In 2004, 2006 and 2007 Silva was among the top-10 in Major League Baseball as far as hits allowed go.
Silva may well be a good pitcher over the life of the contract he is about to sign. Unfortunately, given the (un)success rate of free agent pitchers in his class over the last few years and the blatant red flags detailed above, I would have to slap a big, fat "buyer beware" sign on him. The risks outweigh the potential rewards from my vantage point.
| Baseball Beat | November 06, 2007 |
The Bill James Handbook 2008 - Part Two
Peter Gammons calls The Bill James Handbook, "The prize of our winter hibernation." I would agree with that assessment. The Handbook is both informative and fun, and it can be referred to throughout the off-season, used in fantasy drafts, and in the early going next season when the sample sizes are still small.
After covering the Fielding Bible Awards, baserunning, and James' Young Talent Inventory yesterday, we dig into the numbers a bit more today in the second part of our two-day review.
In the 2007 Team Statistics, I learned that the Seattle Mariners and Arizona Diamondbacks were the only clubs with winning records that played under .500 in games decided by five or more runs. The Oakland A's, on the other hand, were the only team with a losing record that played over .500 in such games. The last-place San Francisco Giants went 17-17. Well, perhaps not surprisingly, SEA and ARI led their respective leagues in what Bill James calls "team efficiency," which compares team wins to the stats of individual players. OAK and SF finished in dead last. In a similar vein, I've always thought Pythagorean W-L records would be more accurate (and meaningful) if the margin of victory in a single game were capped at, say, five runs.
The Atlanta Braves intentionally walked 27 more batters than any other team in the majors last season. Although I picked up this tidbit in the team stats, it can also be found in the Manager's Record section. Bobby Cox led all managers in issuing IBB (89), 58 of which were deemed to be "good" (defined as "no runs scored in the inning after the intentional walk") and 31 "not good" ("one run scored in the inning after the intentional walk"). James also creates a subset of "not good," which he calls "bomb" and defines it as "more than one run scored in the inning after the intentional walk."
With respect to the Manager's Record, James is quick to point out that "we try to avoid, in compiling the manager's record, making judgments about the manager's decisions. We are not trying to say whether someone is a good manager or a bad manager. We are trying to describe how one manager is different from the next." James continues, "Our desire to avoid judgments doesn't mean that we don't count Wins and Losses. The desire to avoid making subjective judgments doesn't preclude us from noting successes and failures, if those successes and failures are clearly defined."
James informs us that Manny Acta led the majors in defensive substitutes, relievers used, and relievers used on consecutive days. "Since he was a first-year manager, it is difficult to reach any firm conclusions as to what extent this reflects his preferences, and to what extent it simply reflects the talent he had to work with."
Moving on to the Leader Boards, Magglio Ordonez and Ryan Braun led their respective leagues in AVG, OBP, and SLG vs. LHP. The Milwaukee rookie third baseman destroyed southpaws, topping the majors in all three: AVG (.450), OBP (.516), and SLG (.964). Chipper Jones pulled the rate stat trifecta vs. RHP in the NL.
Brian Roberts led the majors in steals of third with 19, equal to 38% of his stolen base total. The Dodgers had four of the top ten highest GB/FB ratios in the NL, including the leader Juan Pierre. Reggie Willits led the majors in lowest first swing % (4.6) and pitches per plate appearance (4.45). Whereas Willits swung at less than one in 20 first pitches, his teammate Vladimir Guerrero hacked at nearly half (48.0%) of such offerings, the second highest percentage in baseball (behind only Delmon Young, 51.4%). In the department of "there is more than one way to skin a cat," the lowest and highest first swing percentage leaders are both loaded with outstanding hitters. To wit, Guerrero, Ordonez, Matt Holliday, Miguel Cabrera, Alfonso Soriano, and Lance Berkman can all be found among the top ten in their league in highest first swing %, while Bobby Abreu, Curtis Granderson, Mike Lowell, Gary Sheffield, Albert Pujols, Chase Utley, and Jimmy Rollins placed in the top ten in lowest first swing %.
Roy Halladay had three games throwing 125 or more pitches and A.J. Burnett had two (including tying for the MLB high of 130). Toronto manager John Gibbons used more pinch hitters and runners than any other AL skipper but surprisingly did not lead the league in long outings (defined as more than 110 pitches).
Erik Bedard is the only starting pitcher in either league to finish in the top ten in K/H ratio. The Baltimore lefthander, who led the AL in K/9 (10.93) and H/9 (6.97), struck out 221 batters and allowed 141 hits for a K/H ratio of 1.57. Bedard had the league's best Component ERA (2.71), which estimates what a pitcher's ERA should have been based on his pitching performance. Jonathan Papelbon led all pitchers with 50 or more innings in K/H at an insane ratio of 2.80 (84 strikeouts and 30 hits in 58.1 IP).
I always enjoy the leader boards displaying the fastest and slowest average fastballs, as well as the highest percentage of fastballs, curveballs, sliders, and changeups thrown. Felix Hernandez (95.6) had the fastest heater in the majors last year among pitchers with 162 or more innings. A.J. Burnett (95.1) was the only other starter who averaged over 95 mph. Brad Penny (93.4) topped the NL. Tim Wakefield (74.2) had the slowest average fastball and, in fact, was the only pitcher who didn't crack 80 mph. The knuckleballer threw the fewest fastballs (13.4%) as a percentage of total pitches. Jamie Moyer (81.1 and 37.1%) brought up the rear in the NL in both categories. Joel Zumaya had the most pitches clocked at 100+ mph with 30. Justin Verlander (17) and Joba Chamberlain (11) were the only other hurlers who touched triple digits at least 10 times. Matt Lindstrom, who had the highest average fastball among all pitchers with 50 or more innings (96.6), led the NL with 9 pitches at or above 100 mph. Interestingly, Zack Greinke, who many thought didn't throw hard enough to succeed as a starter, topped AL relievers with 50 or more IP with a 95.4 average fastball.
Aaron Cook (78.4%) and Chien-Ming Wang (75.4%) threw the most fastballs, Bedard (33.9%) and Matt Morris (28.1%) broke off the most benders, Ian Snell (35.5%) and Jeremy Bonderman (34.5%) relied on sliders, while Tom Glavine (44.1%) and James Shields (29.7%) pulled the string more often than anyone else. Jake Peavy (.550 OPS) had the most effective fastball in the majors. Josh Beckett (.645) had the lowest opponent OPS vs. fastballs in the AL. Bedard (.429) and Wandy Rodriguez (.487) had the best curveballs, Manny Corpas (.422) and Rafael Perez (.479) had the most effective sliders, and Gil Meche (.481) and Derek Lowe (.569) had the best changeups.
There are literally dozens of other leader boards for hitters, pitchers, and fielders covering standard and hard-to-find categories (as well as sections on manufactured runs, park indices, hitter and pitcher projections, career targets, and Win Shares) that I promise readers will find interesting and illuminating. Do yourself a favor and pick up a copy of The Bill James Handbook 2008. You won't be disappointed.
* * * * *
Update (11/7/07): The award-winning columnist from the Kansas City Star, Joe Posnanski, who also maintains an entertaining blog, unearths more tidbits from The Bill James Handbook 2008 in Things I Learned (Today).
| Baseball Beat | November 05, 2007 |
The Bill James Handbook 2008 - Part One
A United States Postal Service Priority Mail envelope was sitting on my desk at home when I returned from a two-day trip to Arizona last Friday. I opened it up and was pleasantly surprised to find The Bill James Handbook 2008 inside. In the department of trick or treat, this one qualifies as a definite treat.
 Like everyone else, I turned back my clocks on Saturday night. Doing so not only pleased my wife but gave me an extra hour on Sunday to devour the always eagerly anticipated annual baseball reference guide. While the New England Patriots-Indianapolis Colts game lived up to its hype yesterday afternoon, the Handbook is certain to provide baseball fans a lot more than 3-1/2 hours of enjoyment this fall and winter.
The Handbook, which is produced by Baseball Info Solutions and published by ACTA Sports, offers readers more than 480 pages of facts, stats, and lists, as well as several short essays by Bill James. Features include career data for every 2007 major leaguer, pitcher and hitter projections, team statistics and efficiency summaries, park indices, plus season-by-season and career Win Shares, Fielding Bible Awards (along with plus/minus leaders at each position), improved Manufactured Runs and Baserunning Analysis, expanded Manager's Record, and the newly added Young Talent Inventory.
Introduced in 2006, the Fielding Bible Awards are included in the Handbook for the second year in a row. Albert Pujols was the only repeat winner. As John Dewan writes, "There are quite a few new award winners and we think that's great. Through our extensive fielding research over the past few years, we're finding that, just like hitters and pitchers, fielders have good seasons and bad seasons. We were somewhat worried the awards might turn into a mirror of the Gold Glove Awards, in which it seems once a player wins, he keeps winning until retirement, injury, trade or a position switch. With a second year now in the books, that is definitely not the case with the Fielding Bible Awards."
A panel of ten experts, including Dewan and James, once again selected this year's award winners. First place votes received 10 points, second place 9 points, third place 8 points, etc. A perfect score was 100. Unlike the Gold Gloves, only one honoree was named at each position (rather than separate winners for each league).
Here are the results of the 2007 Fielding Bible Awards (with commentary excerpted or paraphrased from the book):
1B: Albert Pujols, STL (91 pts.) - the only repeat winner; his excellent defense is becoming as well-known as his prodigious offense.
2B: Aaron Hill, TOR (82) - edged out the 2006 winner, Orlando Hudson, by two points; Hudson's injury late in the year may have come into play, but it's Hill who has led the majors in plus/minus at second base in each of the last two years (+22 each year).
3B: Pedro Feliz, SFG (89) - he is especially adept at handling bunts and rates an A+ in this area over the past three years.
SS: Troy Tulowitzki, COL (87) - with the biggest margin of victory of all nine winners, Tulo is the rare rookie to win a fielding award.
LF: Eric Byrnes, ARI (85) - barely beat out incumbent Carl Crawford; led all left fielders in plus/minus (+28) and was one of the leadeers in Good Fielding Plays (23), a new defensive category being tracked by Baseball Info Solutions.
CF: Andruw Jones, ATL (86) - reversed spots with Carlos Beltran, who won last year; both center fielders have great range, but it was probably Jones' intimidating throwing arm that swayed the voters; thought to be slipping a year ago, Jones could also be crowned with the "Comeback Fielder of the Year."
RF: Alex Rios, TOR (73) - last year's runner-up in right field fills the spot vacated by Ichiro Suzuki, who finished third in center field.
C: Yadier Molina, STL (83) - threw out 49% of would-be base stealers and upstaged last year's winner Pudge Rodriguez, who threw out only 26% (down from 46% in 2006).
P: Johan Santana, MIN (62) - dethroned last year's Fielding Bible Award winner (and 16 of the last 17 NL Gold Gloves); Greg Maddux finished a close second but probably lost out to Santana due to his inability to control the running game; 32 of 34 base stealers were successful against Maddux, whereas only 11 base runners attempted to steal against Santana and five of them were gunned down.
Dewan points out that Manny Ramirez had the worst plus/minus in all of MLB over the last three years (-109). "Does that make him baseball's worst defender? Maybe, but there is a question because of the wall in Fenway Park. Are his numbers hurt by the wall? The answer is clearly yes. Balls that hit the wall might be catchable in other parks. It's an adjustment we need to make but haven't gotten around to as of yet, mostly because unique park configurations like Fenway are not as common elsewhere. Ramirez was below average in road games as well, though nowhere near as poor as his overall numbers would suggest."
The author proceeds to ask if Derek Jeter (-90) is the worst defender? "Well, Jeter's poor numbers do not have a caveat like Manny's do. There are no significant park effects clouding his stats. The numbers suggest that Jeter has hurt his team defensively as much or more than any other player in baseball. Having said that, you can still make a good case for Jeter being the best shortstop in the game. Given all that he brings to the team – hitting, baserunning, leadership, overall baseball savvy (including as a defender) – nearly every baseball general manager would prefer Jeter over almost any other shortstop. But, defensively, he's not the best. Do I personally think he's the worst defensive shortstop in baseball? No, but he's far from deserving to be a guy who will probably win his fourth Gold Glove in as many years. He's a below-average defender who should never have received a Gold Glove in the first place."
As with fielding, baserunning tends to get a disproportionate amount of my time when reviewing the Handbook because so little quantifiable data is available to the public. James delves into the subject by stating, "It is universally recognized that there is a difference between being a good base stealer and being a good baserunner. One can be a good baserunner by reading the ball well off the bat, figuring out quickly whether the ball will be caught or will drop, making good decisions and, to an extent, running good routes. It is difficult to be a good base stealer by making good decisions. That requires speed. One can be a good baserunner without being a good base stealer; one can be a good base stealer without being a good baserunner, and somebody should have zapped me with a stun gun two or three sentences ago for belaboring the obvious."
James explains that "baserunning is a very complicated concept, and we're working on measuring it all, but we're not there yet." The system gives credit for stolen bases for the first time. "The title at the head of the page doesn't say 'Baserunning other than Base Stealing;' it just says 'Baserunning.' Base stealing isn't all of baserunning, but it is part of baserunning." Interestingly, the method chosen to measure stolen bases gained is the same one I have used in the past (SB minus two times CS).
Inputs on baserunning include runners going from first to third on a single, scoring from second on a single and from first on a double; moving up on a wild pitch, passed ball, balk, sac fly, or defensive indifference; runs scored as a percentage of times on base; and baserunning outs. Lo and behold, the top base stealer in the majors was also the best baserunner, independent of stolen bases. Jose Reyes led the majors in stolen bases (78), net stolen bases gained (36), and baserunning gained above the league average (34), which generated an overall rating of +70 by adding the latter two categories. The worst? Todd Helton (-35). He was 5-for-42 moving from first to third on a single and ran into six outs.
Mike Cameron was the best baserunner at going from first to third on a single in 2007 (15-for-23) and 2006 (15-for-22). Jason Varitek (0-for-18) was on the other end of the scale this year. Rob Mackowiak was 11-for-11 at scoring from second on a single. Bengie Molina was 0-for-9. Ronnie Belliard was 7-for-7 at scoring from first on a double. Helton was 0-for-10.
The 2008 Handbook also includes team baserunning. As James writes, "There will be a time in the future, probably not too long from now, when this baserunning data will be published for all teams and all players over the last 50 years. When that happens, we'll be in a better position to understand the role of baserunning (other than base stealing) in creating runs. This data is the first step along that road."
The top five teams were as follows:
1. New York Mets            111
2. Philadelphia Phillies    104
3. Tampa Bay Devil Rays      82
3. Arizona Diamondbacks      82
5. Los Angeles Angels        76
The bottom five:
26. Pittsburgh Pirates      -13
27. St. Louis Cardinals     -18
28. Toronto Blue Jays       -25
29. Chicago White Sox       -35
30. Houston Astros          -50
In a new section of the book, James evaluates the best young players in the majors under the age of 29 and ranks them based on their projected value through age 33. He excludes prospects or minor leaguers. "We're discussing proven major league players who are still young." His methodology combines youth and performance, employing runs created for position players and runs saved for pitchers as the basis for the latter.
"We are sitting in a historic bubble of young talent," James says. "Arguably there is more outstanding young talent around right now than at any other moment in baseball history." He believes the young talent in 2007 exceeds the previous peak in 1964 (which included Dick Allen, Lou Brock, Johnny Callison, Rico Carty, Dean Chance, Tony Conigliaro, Willie Davis, Bill Freehan, Jim Fregosi, Jim Kaat, Mickey Lolich, Sam McDowell, Dave McNally, Tony Oliva, Gaylord Perry, Vada Pinson, Boog Powell, Pete Rose, Ron Santo, Wilie Stargell, Luis Tiant, Joe Torre, and Carl Yastrzemski, among others).
The top 25 young players according to James are as follows (with ages as of 6/30/07):
 1. Prince Fielder, 1B, MIL, 23
 2. Hanley Ramirez, SS, FLA, 23
 3. Fausto Carmona, SP, CLE, 23
 4. David Wright, 3B, NYM, 24
 5. Felix Hernandez, SP, SEA, 21
 6. Scott Kazmir, SP, TB, 23
 7. Jose Reyes, SS, NYM, 24
 8. Matt Cain, SP, SFG, 22
 9. Grady Sizemore, CF, CLE, 24
10. Cole Hamels, SP, PHI, 23
11. Ryan Zimmerman, 3B, WAS, 22
12. Troy Tulowitzki, SS, COL, 22
13. Miguel Cabrera, 3B, FLA, 24
14. Ryan Braun, 3B, MIL, 23
15. Justin Verlander, SP, DET, 24
16. Nick Markakis, RF, BAL, 23
17. Jake Peavy, SP, SD, 26
18. Adrian Gonzalez, 1B, SDP, 25
19. Tom Gorzelanny, SP, PIT, 24
20. James Shields, SP, TB, 25
21. C.C. Sabathia, SP, CLE, 26
22. Curtis Granderson, CF, DET, 26
23. Brandon Webb, SP, ARI, 26
24. Chad Billingsley, SP, LAD, 22
25. Chris Young, CF, ARI, 23
Teams were also listed by James in order of overall young talent in the majors. Here are the top ten:
 1. Colorado Rockies
 2. Tampa Bay Devil Rays
 3. Arizona Diamondbacks
 4. Florida Marlins
 5. Cleveland Indians
 6. Milwaukee Brewers
 7. Pittsburgh Pirates
 8. Kansas City Royals
 9. Oakland A's
10. Toronto Blue Jays
. . . and the bottom ten:
21. Texas Rangers
22. Baltimore Orioles
23. Cincinnati Reds
24. Chicago White Sox
25. Seattle Mariners
26. St. Louis Cardinals
27. New York Yankees
28. Detroit Tigers
29. Chicago Cubs
30. Houston Astros
"Competitive teams don't have as much room to let young players thrash around," explains James, "and consequently most of the top teams don't show as having a lot of young talent. They may have the young talent; it just isn't in the lineup yet."
Part two will dig into the numbers, including the statistical leaderboards with a focus on many that receive little or no attention during or after the season.
I have been reviewing The Bill James Handbook since 2003. The previous reviews can be accessed at the following links:
2007 - Part One, Two, Three
2006 - Part One, Two, Three
2004 - The Handiest Reference Book of 'Em All
[Additional reader comments and retorts at the Baseball Think Factory/Baseball Primer Newsblog.]
| Weekend Blog | November 04, 2007 |
Know Your Free Agents - The Geoff Jenkins Edition
Geoff Jenkins has played his whole career - ten seasons - for the Milwaukee Brewers. When the Brew Crew decided on October 30th to decline his $9 million option for 2008, Jenkins became an unrestricted free agent. He is 33 years old, and has battled injuries over the years. He was born in Washington, grew up in California and had a great career at Southern California. He is a .277/.347/.496 career hitter.
He hits the market at a time when any number of teams could use a corner outfield bat. The question simply becomes whether or not Jenkins is worth the pursuit. Here are some key numbers that help offer clarity as to what sort of player a potential new team would be acquiring.
                    AVG   OBP   SLG   OPS+
2005               .292  .375  .513   130
2006               .271  .357  .434   101
2007               .255  .319  .471   101
Three-Year Splits  .274  .353  .474   NA
2007
             AVG   OBP   SLG
Vs. Right   .262  .326  .482
Vs. Left    .215  .282  .415
2006
             AVG   OBP   SLG
Vs. Right   .306  .381  .490
Vs. Left    .133  .265  .214
2005
             AVG   OBP   SLG
Vs. Right   .307  .384  .538
Vs. Left    .255  .354  .452
Advanced defensive metrics seem to suggest that Jenkins is a very good left fielder. Make me a General Manager and so long as I could use a left-handed stick with a steady corner outfield glove, I probably would not hesitate to offer Jenkins a two-year deal in the $12 million range or so.
Detroit Tigers left fielders posted a .673 OPS in 2007 while Cleveland left fielders were not much better at .718. I look for the Tigers to have Jenkins come in and hold down the fort until Cameron Maybin arrives in all his glory. I could also see Mark Shapiro and the Tribe inking Jenkins to become the player they would have liked to have had in Trot Nixon; a solid platoon corner outfielder who plays reliable defense and contributes solid production against right-handed hurlers.
- Patrick Sullivan, 11/4, 10:56 AM EST
| Command Post | November 02, 2007 |
Pitching to the Hitter
In my previous article, I looked at the decisions pitchers make about what pitches to throw. One thing I didn't look at, and was reminded of by a comment from MGL, was how this pertained to hitters. Do certain types of hitters see more fastballs than other types? I had some slight difficulties trying to determine if pitchers deviated from their normal pitching patterns in certain situations because I didn't have the ability to know what their "true" pitching patterns in different situations were. Since hitting is the reaction to the action of pitching, looking at hitters is much easier. I can look at how pitchers pitched in a given situation against certain hitters and then compare that to how the exact same pitchers pitched in the exact same situations, but against different hitters.
Including the post-season, I have 189 pitches in my database when David Ortiz was in a hitter's count. Those 189 pitches represent 17% of all the pitches Ortiz faced, which ranks him in the upper echelon of hitters as far as getting himself into a good count to hit in, but what happens once Ortiz is in a hitter's count? I've shown that certain pitchers exhibit an overreliance on their fastball in hitter's counts or pitcher's counts, but I haven't looked at how this impacts specific hitters.
When Ortiz is in a hitter's count, pitchers throw him 66% fastballs, which puts him right at the league average of 67% fastballs seen in those situations. However, Ortiz is far from a league average batter in terms of his power potential. How do pitchers approach other elite sluggers when they find themselves behind in the count? My definition of an elite slugger might be a little loose, but I took everyone with 300 ABs and a slugging average of .550 or higher this year and looked at how pitchers approached them in hitter's counts. Not surprisingly, pitchers gave these hitters fewer fastballs as a group in these situations. Instead of seeing 67% fastballs, elite sluggers only see 61% fastballs when in a hitter's count. Ortiz sees more fastballs than the other hitters in this group, but within a reasonable amount. Teammates Curtis Granderson and Magglio Ordonez are a different story. Granderson (73% fastballs) and Ordonez (72% fastballs) see the most fastballs out of the group. Perhaps pitchers didn't believe that Granderson was as good as he hit this season and kept challenging him with fastballs, even in hitter's counts. Using a hitter's career slugging average might fix that problem, but still wouldn't explain why Magglio saw so many fastballs. Maybe there is something with Comerica Park that is causing my labeling process screw up there and is impacting Granderson too.
At the other end of the spectrum lie Adam Dunn (50% fastballs) and Ryan Howard (45% fastballs). These two are very similar types of players according to their output and are both approached very cautiously by pitchers. Dunn and Howard see fewer fastballs than most of the group which is probably a result of their propensity to whiff and their power when they do connect. The chart below has all my top sluggers, the number of fastballs they saw in hitter's counts, the total number of pitches they saw in those situations, their overall slugging average and FB% in hitter's counts. There's a definite shift from the population mean to the group mean here that you can see from the table.
Name	           FBseen   TotPit.   SLG       FB%
Curtis Granderson   101      139       0.552     0.73*
Magglio Ordonez     78       109       0.595     0.72
Alfonso Soriano     38        54       0.560     0.70
Ryan Braun          73       108       0.634     0.68
Hanley Ramirez      31        46       0.562     0.67
David Ortiz         124      189       0.621     0.66
Prince Fielder      71       113       0.618     0.63
Alex Rodriguez      52        83       0.645     0.63
Carlos Pena         57        91       0.627     0.63
Chipper Jones       85       141       0.604     0.60
Albert Pujols       84       142       0.568     0.59^
Matt Holliday       62       105       0.607     0.59
Jim Thome           101      176       0.563     0.57^
Chase Utley         38        67       0.566     0.57
Barry Bonds         70       124       0.565     0.56^
Miguel Cabrera      29        54       0.565     0.54^
Adam Dunn           53       107       0.554     0.50^
Ryan Howard         53       118       0.584     0.45*^
*-significantly different from group mean (.61) at alpha=.01
^-significantly different from population mean (.68) at alpha=.05
Keep in mind, the FB% listed in the table are only for hitter's counts and while the chart isn't too revealing, I just think it's interesting to see the different ways each hitter was approached. I was surprised to see Soriano see so many fastballs, as he's a hacker, but maybe there's a good reason for it. Braun got a lot of fastballs, presumably even after started dominating offensively, so maybe there wasn't a good scouting report on him yet, although I'm not sure why there wouldn't be.
Getting back to how pitchers approached different types of hitters, I split up every batter (with a minimum of 300 ABs) based on their slugging average, and then found the FB% for that class of batters in hitter's counts. The table below shows the number of hitters in each group, the number of fastballs seen and total number of pitches seen in hitter's counts, the average slugging average for the group, and the percentage of fastballs the group saw.
Hitter Groups   #     FBseen   Totseen  SLG     FB%     PFB%
>=.550          18    1200     1966     0.591   0.61*   0.68
.549-.500       27    1761     2760     0.520   0.64*   0.67
.499-.450       68    4020     6142     0.471   0.65*   0.67
.449-.400       71    3871     5660     0.425   0.68    0.67
.399-.350       52    2626     3623     0.376   0.72*   0.67
<.350           20    975      1309     0.332   0.74*   0.67
*-significant difference from PFB% at alpha=.05
This table has a lot of things going on, but the most obvious one is that in hitter's counts, as the caliber of a batter increases (slugging goes up), FB% goes down. This isn't true for every batter individually, but the overall trend is really clear. I don't know exactly why pitchers are behaving this way, (maybe bad hitters as a group can't hit fastballs very well and there is less of a cost to the pitcher's stamina for throwing a fastball), but they do throw fewer fastballs to each progressive range of hitters. It makes sense that pitchers would avoid throwing fastballs to better hitters and try to fool them with junk, while getting after the weak hitters and not worrying about home runs and doubles. Even though all these batters are in hitter's counts, some got many more fastballs than others. Not every hitter's count is created equal.
The last column in the table, PFB%, is the other big thing to see. For every hitter, I found the different pitchers they faced in hitter's counts, and then found out what those pitchers had thrown in all other hitter's counts they were in during the season, regardless of hitter quality.
When any pitcher who faced one of my top hitters was facing any other batter, he threw 68% fastballs. These values are slightly more interesting on the individual hitter level (Willie Bloomquist saw 100% fastballs in hitter's counts, while those same pitchers threw 75% fastballs whenever the faced someone other than Bloomquist), but this value is my best guess about what these exact pitchers should throw in a hitter's count to a random batter. By comparing what they actually threw to that value, you find that the differences are not due to randomness but rather a decision on the part of the pitcher.
The next table uses the same hitter groupings, but looks at the pitches they saw in pitcher's counts. This chart tells a much different story than the first one. In hitter's counts, pitchers seem to be aware of the type of hitter at the plate and pitch accordingly. Ortiz gets fewer fastballs than Nick Punto. However, if both those types of hitters were in a pitcher's count, they could expect to see a virtually identical amount of fastballs. A pitcher doesn't seem to know or care who is at-bat when the count is in the pitcher's favor. Both good and bad hitters should expect close to the same proportion of fastballs in these counts.
Hitter Groups   #     FBseen   Totseen  SLG     FB%     PFB%
>=.550          18    2131     4522     0.591   0.47    0.47
.549-.500       27    3158     6559     0.520   0.48    0.48
.499-.450       68    7766     16210    0.471   0.48    0.48
.449-.400       71    7212     15606    0.425   0.46    0.46
.399-.350       52    4629     9856     0.376   0.47    0.47
<.350           20    1650     3414     0.332   0.48    0.48
*-significant at alpha=.05
MGL's comment that prompted this article, about whether Sabathia and Carmona throwing more fastballs to good hitters was a double mistake, proved to be spot on. Intuitively his premise made sense because good hitters usually see fewer fastballs than bad hitters in these cases and are able to hit the fastballs they do see, so it’s nice to see that the data back it up.
When looking at the relationship between slugging average and FB% for hitters, I thought about trying to predict the FB% of a pitcher, given any situation. For a pitcher with a given set of pitches, you could possibly figure out how often he should throw his fastball in a situation and then compare how often he actually threw it. I’m not sure exactly what factors I would use to predict this, but I think the quantity of pitches a pitcher throws, the nastiness of those pitches, the batter, and some measure of the pitcher’s control would play a big role. For a batter, I think the FB% that he should see would be primarily impacted by his quality as a hitter, in terms of batting eye, ability to make contact and ability to hit the ball hard, as well as any holes in his swing.
| Change-Up | November 01, 2007 |
The Longterm Health of the Red Sox - Part Three
When the Boston Red Sox hired Theo Epstein in November of 2002, he announced at his press conference that "We're going to turn the Red Sox into a scouting and player development machine." Five years and two World Series titles later, I think it is safe to say that Epstein has succeeded in this endeavor.
There have been rumblings that too much is being made of the Red Sox farm system, that it is their financial advantage that has made the difference. More brazen critics of Epstein have pointed to his checkered track record in the free agent market to assert that he might not be all he is cracked up to be. This thinking is fallacious in that it fails to acknowledge the synergies between all of a GM's responsibilities.
Think about it. Even with a fat payroll, without a good farm system and cheap Big League contributors, Theo cannot afford to take a risk on J.D. Drew or Julio Lugo. Take away the inexpensive talent and you need to sign a middling, more expensive option. Think Luis Castillo for about $5 million instead of Dustin Pedroia for near the league minimum. Such a swap would financially preclude even most of the wealthiest teams from pursuing top-tier free agents.
But what about the prudence of such free agent signings? Haven't many of them been just awful for the Red Sox? The Boston brass is well aware of the risks associated with such signings. They would not take on the risk of Julio Lugo picking up where he left off for the Dodgers or J.D. Drew's health failing him (or having a bizarre outlier season) if they did not know that cheap talent was on the diamond all around them. As they proved this year, the worst case scenario for the free agent signings is baked into their win-loss expectation bands.
If Drew and Lugo disappoint, we win 89. If Drew and Lugo disappoint but Beckett comes into his own and Pedroia is everything we think he can be, we win 100. But then if Manny drops off a bit and Coco still can't really hit, maybe we win 95.
What the "scouting and player development machine" allows Boston to do is leverage their revenue advantages so that they can comfortably project a best and worst case scenario. Outliers to the downside will not kill their chances, while surprises to the upside make them potentially dominant.
The rest of this piece will take a look at past Red Sox drafts in the Epstein Era in hopes of providing some clarity with respect to how the Red Sox arrived where they are as well as how the longer-term health of the organization is looking.
=========================
A quick look at this draft reveals disappointing results outside of Jonathan Papelbon. The Red Sox flipped David Murphy at the trade deadline (along with others) for uber-bust Eric Gagne while Matt Murton was involved in the Nomar Garciaparra deal that brought Orlando Cabrera to town the last time Boston won the World Series. Abe Alvarez has disappointed, as ultimately his command has not been able to make up for his lacking velocity.
Still, Papelbon alone makes this draft something of a success.
With no first round picks in 2004, the results ended up looking a lot like 2003. Boston netted a gem in Pedroia and the only other standout from this crop was traded away in just a horrible deal. Cla Meredith was sent along with Josh Bard to San Diego in the Doug Mirabelli deal of early 2006.
This was the mother load. Jacoby Ellsbury was a World Series MVP candidate. Craig Hansen has already pitched with the big club and despite some disappointing setbacks, seemed to pull things together in Pawtucket at the end of the 2007 season. We all know about Clay Buchholz, and Jed Lowrie and Michael Bowden figure to be contributing for either the Red Sox or one MLB team or another shortly.
Further down the draft we see Mark Wagner, a catcher who just may be heir apparent to Jason Varitek. At hitter's paradise Lancaster, the 23 year-old Southern Californian posted a .318/.406/.533 in 95 games as he battled injuries throughout the year.
While outside of Justin Masterson the top of this draft has disappointed some, down-draftees Ryan Kalish and Lars Anderson offer quite a bit of hope. Failing to come to terms with Matt LaPorta may end up being something of a regret down the road.
As far as 2007 goes, the jury obviously is still out. I can report first hand, however, that the Red Sox are awfully excited about what they came away with.
====================
All in all, the longer term outlook for the franchise remains strong. Some development from the top of the 2006 class will go a long way to ensuring that the Red Sox will be able to continue to plug some cheap talent on the big club year after year.
Said another way, the "machine" seems to be cranking just fine.