Rich Lederer • Baseball Beat
Patrick Sullivan • Change-Up
Jeremy Greenhouse • Touching Bases
Dave Allen • F/X Visualizations
Sky Andrecheck • Behind the Scoreboard
Marc Hulet • Around the Minors
Al Doyle • Past Times
Retired Uniforms:
Bryan Smith • WTNY
Joe Sheehan • Command Post
Jeff Albert • The Batter's Eye
RSS Feed
Home
*Examining the Past, Present, and Future*
Lineup Card
Recent Entries
» Putting Together a Reality Team
» Historical Hall of Fame Vote Comparisons: 2012
» An All-Christmas Team
» The New-Look Angels
» John Denny: The Forgotten Cy Young Award Winner
» Money Isn't Everything
» What Would It Take to Hit .400 in the 21st Century?
» Halos Heaven
» Brandon McCarthy's Breakout Season
» Link-o-Rama
» Historical Hall of Fame Vote Comparisons: 2012
» An All-Christmas Team
» The New-Look Angels
» John Denny: The Forgotten Cy Young Award Winner
» Money Isn't Everything
» What Would It Take to Hit .400 in the 21st Century?
» Halos Heaven
» Brandon McCarthy's Breakout Season
» Link-o-Rama
Best of Baseball Beat
Abstracts From the Abstracts
1977 Baseball Abstract
1978 Baseball Abstract
1979 Baseball Abstract
1980 Baseball Abstract
1981 Baseball Abstract
1982 Baseball Abstract
1983 Baseball Abstract
1984 Baseball Abstract
1985 Baseball Abstract
1986 Baseball Abstract
1987 Baseball Abstract
1988 Baseball Abstract
1978 Baseball Abstract
1979 Baseball Abstract
1980 Baseball Abstract
1981 Baseball Abstract
1982 Baseball Abstract
1983 Baseball Abstract
1984 Baseball Abstract
1985 Baseball Abstract
1986 Baseball Abstract
1987 Baseball Abstract
1988 Baseball Abstract
Bert Blyleven Series
Meeting Up and Hanging Out with Bert
The Results Are In And...
Aficionado Heavily Invested in Blyleven
Latest on Blyleven's Chances for the HOF
The Internet Zealot Responds
400 Down and 5 to Go...
Bert Be Home By Eleven?
Blyleven's Forgotten Season (1973)
HeyMan, Your Comments Don't Hold Water
The Waiting is the Hardest Part
Another Addition to the Blyleven Series
Search for the Truth
As Dominant as His HOF Contemporaries
Listen, Buster
A Larger Step for Blyleven
Answering the Naysayers (Part Two)
Another Small Step for Blyleven
Q&A: Blyleven on the Twins
The Majority Rules, Right?
It's All Dutch to Some
The Hall of Fame Case for Bert Blyleven
Q&A: Blyleven on Felix Hernandez
Clemens Rocketing Up Charts
Poz: An Interview With a KC Star
A HOF Chat with Tracy Ringolsby
Up Close and Personal
A Peek Into the Mind of a HOF Voter
Answering the Naysayers
It's That Time of the Year (Again)
"If Cooperstown is Calling..."
The Bert Alert
One Small Step for Blyleven...
Only the Lonely
Exclusive Interviews
Lee Sinins
Alex Belth
David Pinto
Will Carroll
Mike Carminati
Aaron Gleeman
Joe Sheehan
Jay Jaffe
Jeff Peek
Tracy Ringolsby
Joe Posnanski
Bill James Part I, II, III
Jon Lalonde
Chuck Tiffany
Dayn Perry
Fay Vincent
Nate Silver
Alex Belth
David Pinto
Will Carroll
Mike Carminati
Aaron Gleeman
Joe Sheehan
Jay Jaffe
Jeff Peek
Tracy Ringolsby
Joe Posnanski
Bill James Part I, II, III
Jon Lalonde
Chuck Tiffany
Dayn Perry
Fay Vincent
Nate Silver
Bullpen
Rich Lederer
The Odd Couple (with Alex Belth)
The MostUnder Over Underrated Player in Baseball (with Brian Gunn)
Three Wise Men (roundtable by Alex Belth)
Infrequently Asked Questions (interview with Matt Welch)
Interview (Orioles Think Tank)
Bernie and the Yanks (Bronx Banter)
Hope and Faith: How the LAA Win the World Series (Baseball Prospectus)
NL West (The Soul of Baseball)
Greatest Living Hitter? (Sports Illustrated)
Roundtable: 2008 HOF Ballot (Armchair GM)
The Most
Three Wise Men (roundtable by Alex Belth)
Infrequently Asked Questions (interview with Matt Welch)
Interview (Orioles Think Tank)
Bernie and the Yanks (Bronx Banter)
Hope and Faith: How the LAA Win the World Series (Baseball Prospectus)
NL West (The Soul of Baseball)
Greatest Living Hitter? (Sports Illustrated)
Roundtable: 2008 HOF Ballot (Armchair GM)
Patrick Sullivan
Designated Hitters
David Bromberg (Q&A: John Denny)
Mark Armour (H. Killebrew and Versatility)
Joe Lederer (Soundtrack of a Prospect)
David Bromberg (Clemente's Autograph)
David Bromberg (Woody Fryman)
D. Baumstein (WAR Against Age: Pitchers)
Doug Baumstein (The WAR Against Age)
Doug Baumstein (A Lifetime on the Road)
John Fraser (Pick Six)
Mark Armour (How to Score More Runs?)
Bill Parker (What Opening Day Tells Us)
Stan Opdyke (Pat Rispole)
Chris Jaffe (Evaluating Baseball's Mgrs)
Stan Opdyke (Baseball Radio in NYC, 1953)
A. Nathan (Performance of Baseball Bats)
Michael Weddell (Edgar Martinez/HOF)
Jon Weisman (100 Things Dodgers Fans...)
Stan Opdyke (Connie Mack and Vin Scully)
Eric Walker (Evaluating Run Production)
Brent Mayne (The Intangibles of Catching)
Chris Moore (Best Fastballs in Baseball)
Dave Baldwin (The Batter’s Brain)
Shawn Haviland (Ivy League to MLB)
Larry Granillo (Walking Off)
Rob Iracane (Solo HR Won't Break You)
Tommy Bennett (Charm of AM Radio)
Harry Pavlidis (Johan Santana's Fast Start)
John Walsh (WAR and Remembrance)
Eric Walker (Precisely Inaccurate)
Bob Timmermann (As They See 'Em)
Geoff Young (Unicycles and Delusions)
Baseball Analysis at Tufts (Groundballers)
Baseball Analysis at Tufts (GB Out Rates)
G. Rybarczyk ('09 Hit Tracker Projections)
Joe Lederer (Curt Schilling/HoF)
Conor Gallagher (Hall of Fallacies)
Chris Green (Jim Rice, HoF, the Numbers)
Shawn Hoffman (Baseball's Bear Mkt?)
Paul Anthony (Manny Syndrome)
Ross Roley (World Series Odds)
B. Timmermann (Catcher's Interference)
R.J. Anderson (Waiting the Hardest Part)
Maury Brown (Cubs, MLB, and Cuban...)
Myron Logan (Dee-Fense, Dee-Fense)
Craig Calcaterra (Frivolity, Part I, Part II)
Chad Finn (Ode to Baseball Cards)
David Cameron (Mariners Foibles)
Chris Dial (Chipper Jones)
Pat Lederer (Memory Lane)
David Appelman (Clutch Pitching)
Bob Rittner (DH)
Jonathan Mayo (Roger Clemens)
Lisa Winston (My Son-in-Law...)
Russ McQueen (The Yellow Hammer)
Bob Rittner (I'm OK, You're OK)
Mark Armour (In Defense of the HOF)
Pat Jordan (Friends)
Dan Levitt (Analysis of Terry Ryan)
Doug Baumstein (Trading Econ 101)
Ross Roley (Runner's Reluctance II)
Ross Roley (Runner's Reluctance I)
Mark Armour (No-Longer Lovable Sox)
Bruce Regal (Stealthy and Wise)
Brian Gunn (Roid Monster)
Current/McEvoy (Value of the SB)
John Rickert (Sinister Thefts)
Nate Silver (Sabermetrics)
David Vincent (Home Run Production)
Joe P. Sheehan (Enhanced Gameday II)
Mark Armour (An Ode to Sport)
David Gassko (All-Time Worm Burners)
Joe P. Sheehan (Enhanced Gameday)
John Walsh (When Titans Clash)
Fox/Williams (Quantifying Coaches II)
Fox/Williams (Quantifying Coaches I)
Jacob Luft (Bull Durham Rant)
Chad Finn (Strat-O-Matic)
Lisa Winston (Rotisserie Baseball)
Dave Studeman (Baseball Stats)
Steve Treder (Roger Craig)
Marc Normandin (Jeff Bagwell)
D. Appelman (Expanding Strike Zone)
Jeff Sackmann (Worst MiL Defenders)
Jeff Sackmann (Best MiL Defenders)
Maxwell Kates (Van Lingle Mungo)
David Appelman (Pitch Location)
Kent Bonham (Danny Ray Herrera)
Glenn Stout (Two Baseball Poems)
Bruce Regal (The Challenge Round)
Mark Lamster (Barry & Ty)
Geoff Young (NL West)
Tom Lederer (The Ryan Express)
Brian Erts (Great Leap Forward)
David Pinto (Parity and the N.L.)
Jacob Luft (Fathers and Daughters)
Jamey Newberg (Pete's Sake)
Jeff Albert (A. Jones Swing Analysis)
Jeff Albert (A-Rod Swing Analysis)
Keith Law (Death, Taxes, and Waivers)
Peter Abraham (Tales of Torre Tales)
Larry Borowsky (Let 'er Rip II)
Dan Levitt (Empirical Analysis of Bunting)
Jonah Keri (If I Met Warren Cromartie...)
Bob Klapisch (War Stories)
Bob Timmermann (John F. Kennedy HS)
Kent Bonham (Aluminum Adjustments)
Al Doyle (More Than Superstars)
Ross Roley (Instant Replay)
David Vincent (Barry Bonds Homers)
Chad Finn (Our Favorite Obscurities)
Bill Deane (1979 NL MVP)
Mark Armour (Rise/Fall of Artificial Turf)
Jeff Angus (Wally Moon Camp)
David Berri (Money and Baseball)
Larry Borowsky (Baseball w/o the #s)
Derek Zumsteg (The Irrational Market)
David Regan (Free Agent Contracts)
Peter Schmuck (Steroids and the HOF)
David Appelman (Pitchers, Pitch by Pitch)
Dan Fox (Swinging, Taking, Fouling, Etc)
Patrick Sullivan (Study of NYY CF/BOS LF)
Will Leitch (Baseball Journalism)
Jeff Sullivan (Pitcher Release Points)
Steve Treder ('69-'70 Giants)
Maury Brown (Charlie Finley)
John Brattain (Bob Johnson)
Bob Klapisch (The Case for Bert Blyleven)
Jeff Peek (Pride and Prejudice)
Dayn Perry (Bert and Warren)
Rob Neyer (If Don Sutton Was Great...)
Lisa Winston (Minor League Memories)
Alex Belth (Otis Redding Was Right)
David Cameron (Long Live the King)
Jeff Angus (Baserunning Study)
Bert Blyleven (Baseball Playoffs)
Boyd Nation (Not a Prospect List)
James Click (Batters-Baserunners Study)
Jeff Shaw (Why I Love Baseball)
David Gassko (BIP/BFP Fielding Study)
Jay Jaffe (Milwaukee Sausage Race)
Jamey Newberg (Remember When)
Bob Klapisch (Press Box to the Mound)
Dan Levitt (Predictive Value of BB)
David Vincent (Official Scorer)
Jon Weisman (Rick Monday)
Larry Borowsky (Let 'er Rip)
Will Carroll (Fictional Short Story)
Bob Timmermann (Japanese Baseball)
Cyril Morong (Best Pitching Seasons)
Sean Forman (Monte Carlo Win-Loss)
Brian Gunn (My Little Blue Book)
Joe Lederer (My Dad and Baseball)
Bill Deane (Bob Gibson, 1968)
Mark Armour (1977 Yankees)
Darren Viola (Retrosheet)
David Pinto (RFK)
Dayn Perry (Brave Heart)
Matt Welch (Dave Hansen)
Kevin Kernan (Jack McKeon)
Tom Lederer (Dodgers Road Trip)
Steve Lombardi (Slider)
Studes (Picturing Baseball)
Mike Carminati (Luck of the Drawl)
Eric Neel (Vin Scully)
J.C. Bradbury (Leo Mazzone)
John Sickels (Bill James)
Search Baseball Analysts
Archives
By Category:
Around the Majors Content Only
Around the Minors Content Only
Baseball Beat Content Only
Baseball Beat/Change-Up Content Only
Baseball Beat/WTNY Content Only
Behind the Scoreboard Content Only
Change-Up Content Only
Change-Up/Around the Majors Content Only
Command Post Content Only
Crunching the Numbers Content Only
Designated Hitter Content Only
F/X Visualizations Content Only
Past Times Content Only
Saber Talk Content Only
The Batter's Eye Content Only
Touching Bases Content Only
Weekend Blog Content Only
WTNY Content Only
By Month:
February 2012
January 2012
December 2011
October 2011
September 2011
August 2011
July 2011
June 2011
May 2011
April 2011
March 2011
February 2011
January 2011
December 2010
November 2010
October 2010
September 2010
August 2010
July 2010
June 2010
May 2010
April 2010
March 2010
February 2010
January 2010
December 2009
November 2009
October 2009
September 2009
August 2009
July 2009
June 2009
May 2009
April 2009
March 2009
February 2009
January 2009
December 2008
November 2008
October 2008
September 2008
August 2008
July 2008
June 2008
May 2008
April 2008
March 2008
February 2008
January 2008
December 2007
November 2007
October 2007
September 2007
August 2007
July 2007
June 2007
May 2007
April 2007
March 2007
February 2007
January 2007
December 2006
November 2006
October 2006
September 2006
August 2006
July 2006
June 2006
May 2006
April 2006
March 2006
February 2006
January 2006
December 2005
November 2005
October 2005
September 2005
August 2005
July 2005
June 2005
May 2005
April 2005
March 2005
February 2005
January 2005
December 2004
November 2004
October 2004
September 2004
August 2004
July 2004
June 2004
May 2004
April 2004
March 2004
February 2004
January 2004
December 2003
November 2003
October 2003
September 2003
August 2003
July 2003
June 2003
Reference
Organizational Stats
Arizona Diamondbacks Bat / Pitch
Atlanta Braves Bat / Pitch
Baltimore Orioles Bat / Pitch
Boston Red Sox Bat / Pitch
Chicago Cubs Bat / Pitch
Chicago White Sox Bat / Pitch
Cincinnati Reds Bat / Pitch
Cleveland Indians Bat / Pitch
Colorado Rockies Bat / Pitch
Detroit Tigers Bat / Pitch
Florida Marlins Bat / Pitch
Houston Astros Bat / Pitch
Kansas City Royals Bat / Pitch
Los Angeles Angels Bat / Pitch
Los Angeles Dodgers Bat / Pitch
Milwaukee Brewers Bat / Pitch
Minnesota Twins Bat / Pitch
New York Mets Bat / Pitch
New York Yankees Bat / Pitch
Oakland Athletics Bat / Pitch
Philadelphia Phillies Bat / Pitch
Pittsburgh Pirates Bat / Pitch
St. Louis Cardinals Bat / Pitch
San Diego Padres Bat / Pitch
San Francisco Giants Bat / Pitch
Seattle Mariners Bat / Pitch
Tampa Bay Devil Rays Bat / Pitch
Texas Rangers Bat / Pitch
Toronto Blue Jays Bat / Pitch
Washington Nationals Bat / Pitch
All-Star Links
Official Websites
News and Notes
Baseball News Blog
Baseball Newstand
ESPN Baseball
Fox Sports Baseball
Pro Sports Daily
Roto World
The Roto Times
USA Today Baseball
Baseball Newstand
ESPN Baseball
Fox Sports Baseball
Pro Sports Daily
Roto World
The Roto Times
USA Today Baseball
Reference and Analysis
Baseball Almanac
Baseball America
Baseball Archive
Baseball Contracts
Baseball Cube
Baseball Graphs
Baseball Library
Baseball Musings Player Database
Baseball Page
Baseball Primer
Baseball Prospectus
Baseball Reference
Baseball Statistics
Baseball Truth
Boxscore Central
Diamond Mind Baseball
Doug's Stats
FanGraphs
Fast Balls (pitchfx catalog)
Hardball Dollars
Hardball Times
Hit Tracker
Retrosheet
Rotobase/Rotoblog
Stat Corner
STATS
Tango on Baseball
Yahoo Sports MLB
Web Gems
Bill James Primer
Sabermetric Manifesto (Grabiner)
Pitching and Defense (McCracken)
Pitching and Defense (Tippett)
Transactions Primer (Neyer)
Baseball Stats (Batter's Box)
Prospect Report (Cameron)
Pitcher Workloads (Sheehan)
Goodbye to Old Baseball Ideas (Rickey)
Sabermetric Manifesto (Grabiner)
Pitching and Defense (McCracken)
Pitching and Defense (Tippett)
Transactions Primer (Neyer)
Baseball Stats (Batter's Box)
Prospect Report (Cameron)
Pitcher Workloads (Sheehan)
Goodbye to Old Baseball Ideas (Rickey)
Columnists
Baseball Blogs
Around the Majors
Athletics Nation
Baseball Crank
Baseball Musings
Baseball-Reference Blog
Batter's Box
Big League Stew
Bronx Banter
Catfish Stew
Cub Town
Dan Agonistes
Dodger Thoughts
DRays Bay
Ducksnorts
Futility Infielder
Halos Heaven
Inside the Rockies
It Might Be Dangerous
Knuckle Curve
LoHud Yankees Blog
Lookout Landing
Management by Baseball
Metaforian
Metsgeek
Mike's Baseball Rants
Only Baseball Matters
Redbird Nation
Red Reporter
Sabernomics (Braves)
Seth Speaks
ShysterBall
6-4-2 (Angels/Dodgers)
The Book
TheCubdom
The Cutting Edge
The House That Dewey Built
The View From The Bleachers
Tiger Blog
U.S.S. Mariner
Viva El Birdos
Where's Kernan
Minor Leagues
Arizona Fall League
BA Player Finder
Cal Leaguers
Jamey Newberg
JDM's Scoresheet Baseball
Minor League Baseball
Minor League Park Factors
Minor League Splits
No Pepper
Sickels' Minor League Ball
Warm October Nights
BA Player Finder
Cal Leaguers
Jamey Newberg
JDM's Scoresheet Baseball
Minor League Baseball
Minor League Park Factors
Minor League Splits
No Pepper
Sickels' Minor League Ball
Warm October Nights
Amateur
Boyd's World (College)
Cape Cod Baseball League
College Baseball Blog
College Baseball Insider
Collegiate Baseball Newspaper
College Splits
College Splits Blog
Dirtbags Baseball (Long Beach State)
NCAA Baseball
NCBWA
Team One Baseball (High School)
Texas A&M & Baseball
Cape Cod Baseball League
College Baseball Blog
College Baseball Insider
Collegiate Baseball Newspaper
College Splits
College Splits Blog
Dirtbags Baseball (Long Beach State)
NCAA Baseball
NCBWA
Team One Baseball (High School)
Texas A&M & Baseball
Historical
Cuban Baseball
House of David
Jim "Mudcat" Grant's Web Page
Negro League Baseball Players Assoc
Negro Leagues Baseball Museum
1919 Black Sox
Pacific Coast League
Philadelphia Athletics Historical Society
Shoeless Joe Jackson Society
SABR-L Archives
Walter O'Malley
House of David
Jim "Mudcat" Grant's Web Page
Negro League Baseball Players Assoc
Negro Leagues Baseball Museum
1919 Black Sox
Pacific Coast League
Philadelphia Athletics Historical Society
Shoeless Joe Jackson Society
SABR-L Archives
Walter O'Malley
Miscellaneous
Forums
Credits
Ticket Center
Tickets to Baseball -
Premium Red Sox Tickets - Tickets to Marlins Games - Cardinals Game Tickets - NY Yankee Tickets - Tickets Oakland Athletics - Dallas Cowboys Tickets - Arizona Cardinals Tickets - Tickets Seattle Seahawks - Buffalo Bills Tickets Online - Tickets to Dolphins Football
Buy Boston Red Sox tickets,
Philadelphia Phillies tix,
NY Yankees tickets,
NY Mets tickets, and
MLB All Star game tickets at ABC tickets
Not sure where to find the best online sportsbooks? Start your search with PlayersJet.
Get deals at SportsMemorabilia.com on baseball apparel, including Phillies jerseys and more for adults and children.
Shop the largest selection baseball equipment on sale at Sports Unlimited. Check out tons of baseball gloves, youth baseball gloves and catchers gear from Rawlings, Wilson, Nike & Under Armour.
2011 Draft Order
Courtesy of Baseball America
First-Round:
 1. Pirates (57-105)
 2. Mariners (61-101)
 3. Diamondbacks (65-97)
 4. Orioles (66-96)
 5. Royals (67-95)
 6. Nationals (69-93)
 7. Diamondbacks (for B. Loux)
 8. Indians (69-93)
 9. Cubs (75-87)
10. Padres (for Karsten Whitson)
11. Astros (76-86)
12. Brewers (77-85)
13. Mets (79-83)
14. Marlins (80-82)
15. Brewers (for Dylan Covey)
16. Dodgers (80-82)
17. Angels (80-82)
18. Athletics (81-81)
19. Red Sox (from DET for Martinez)
20. Rockies (83-79)
21. Blue Jays (85-77)
22. Cardinals (86-76)
23. Nationals (from CWS for Dunn)
24. Rays (from BOS for Crawford)
25. Padres (90-72)
26. Red Sox (from TEX for Beltre)
27. Reds (91-71)
28. Braves (91-71)
29. Giants (92-70)
30. Twins (94-68)
31. Rays (from NYY for Soriano)
32. Rays (96-66)
33. Rangers (from PHI for Lee)
Supplemental First Round:
34. Nationals (Dunn)
35. Blue Jays (Downs)
36. Red Sox (Martinez)
37. Rangers (Lee)
38. Rays (Crawford)
39. Phillies (Werth)
40. Red Sox (Beltre)
41. Rays (Soriano)
42. Rays (Balfour)
43. Diamondbacks (LaRoche)
44. Mets (Feliciano)
45. Rockies (Dotel)
46. Blue Jays (Buck)
47. White Sox (Putz)
48. Padres (Garland)
49. Giants (Uribe)
50. Twins (Hudson)
51. Yankees (Vazquez)
52. Rays (Benoit)
53. Blue Jays (Olivo)
54. Padres (Torrealba)
55. Twins (Crain)
56. Rays (Choate)
57. Blue Jays (Gregg)
58. Padres (Correia)
59. Rays (Hawpe)
| Baseball Beat | May 29, 2009 |
Q&A with Baseball America's Jim Callis
Strasburg, Boras, and Everything Else You Wanted to Know About the 2009 Draft
When it comes to the First-Year Player Draft, nobody is as wired to what's going on as Jim Callis, the Executive Editor of Baseball America. He talks to general managers, scouting directors, cross checkers, area scouts, college coaches, and agents, gathering valuable information for Baseball America's website and biweekly magazine. With his ear to the ground, Jim's final mock drafts are routinely the most accurate published. Two months before I met up with Jim on a trip to Chicago in the summer of 2005, he predicted the first 18 selections of the draft in the exact order that they were taken.
 Born and raised in Virginia, Callis graduated from the University of Georgia with a degree in journalism. He began his career with Baseball America in December 1988, left for STATS, Inc. in September 1997, and returned to BA in May 2000. In total, Jim has been covering baseball for more than two decades, including 18 years with Baseball America.
Callis, 41, lives in the Chicago area with his wife and four children. In his spare time, he coaches his oldest son's 7th/8th grade baseball team. Like all of us, Jim is a baseball fan and his favorite team is . . . the Boston Red Sox! You can catch up with Jim about the draft, the Red Sox, baseball in general, and even pop culture in his online chats at ESPN Sports Nation.
Grab a cup of coffee, pull up a chair, and enjoy our discussion about the MLB First-Year Player Draft that begins Tuesday, June 9.
Rich: Hi, Jim. Thanks for taking the time to preview the 2009 First-Year Player Draft with us. How is this draft shaping up in terms of overall talent vs. those of the past?
Jim: It's not a good draft for position players, and it comes right after a draft that was loaded with hitters, so there's kind of a negative vibe about it. But there's talent in any draft. This one has plenty of pitching, college and high school, lefty and righty, whatever flavor you like, starting with arguably the best draft prospect ever in Stephen Strasburg. The college position players fall off a cliff quickly after North Carolina first baseman Dustin Ackley, but Ackley is a very good one. The high school position players are fine, with a lot of catchers and center fielders. It's kind of reminiscent of 2006, which was thought not to be deep in comparison to a hitter-rich 2005 crop, yet had Evan Longoria, Tim Lincecum, Joba Chamberlain and a host of other very talented players. So that's a long way of saying that there's talent in this draft, there's just not much consensus. I actually wrote a column on this, so I'll plug it here, though you need a BA.com subscription to read it.
Rich: The Washington Nationals are the first team to own two of the top ten picks in the same draft. The No. 1 overall choice is the reward for having the worst record in baseball in 2008 while the No. 10 selection is compensation for not signing Aaron Crow with the ninth pick last year. Aside from issues involving health, is there any chance at all that Washington would take someone other than Strasburg with the first pick?
Jim: No chance. Strasburg will be the No. 1 overall pick, barring injury. The track record of pitchers taken No. 1 overall is less than scintillating, but he's still far and away the best talent this year, and that's who you have to take with the top pick. He'll cost a lot of money, but far less than he would if he were on the open market. He also should be able to crack Washington's big league rotation almost immediately, if not immediately. There's no excuse for not taking him No. 1.
Rich: Is the $50 million price tag for Strasburg that has been floated out there simply a strategic ploy on the part of Scott Boras to reset the bar for No. 1s or do you think he will hold to something close to that figure at the risk of not getting Strasburg signed by August 15?
Jim: I'm sure Scott Boras believes in his heart that Strasburg deserves $50 million. I also believe that if all 30 teams could bid on Strasburg, he'd get that money. But the leverage to get that money doesn't exist because Strasburg's only options are to 1) sign with whoever picks him or 2) re-enter the 2010 draft. There's no avenue to free agency. If Scott doesn't get his asking price, he gives the team every chance to up its offer right up until the deadline. So don't look for Strasburg to sign before 11:59 p.m. ET on Aug. 15.
Rich: Nationals president Stan Kasten has been quoted as saying, "We know what No. 1s get and we intend to sign that player...No one's situation is going to change the industry." Doesn't that comment suggest the Nationals are going to draft Strasburg with the intention of offering him an eight-figure contract but much closer to the $8.5M-$10.5M that the top three signees (Mark Prior, Mark Teixeira, and David Price) received than the $52M awarded to Daisuke Matsuzaka, the comp Boras has reportedly used?
Jim: I think that's exactly right. To sign Strasburg, the Nationals need simply to figure out what's the lowest amount they can offer that will be too risky for him to turn down in the end. The draft record for guaranteed money is $10.5 million by Prior, and I'm guessing Washington will come in somewhere between $15 million to $20 million. Matsuzaka's price tag was artificially inflated by the $51.1 million posting fee Boston paid, and his situation isn't analagous to Strasburg's.
Rich: According to Jim Bowden, Crow asked for $4.4M and turned down $3.5M. Do you think he will get that type of money this year?
Jim: I heard Crow wanted $4 million at the end. Those negotiations were botched by both sides, who should have met in the middle at the deadline. I do think he'll get similar money this year, though he doesn't have a ton of leverage. There's no way he can really go back into the 2010 draft at this point. He's pitching well in indy ball, and first-round pitchers who have gone that route have done very well in the draft. He could get one of those $5 million major league contracts. Most teams probably wouldn't give him that much, but there always seems to be one club that will. I think he could go as high as No. 3 to the Padres or No. 4 to the Pirates.
Rich: The other Independent League wild card in this year's draft is Tanner Scheppers. How would you compare and contrast Crow and Scheppers and where do you see the latter going?
Jim: Scheppers probably would have been a top-10 pick last year if he hadn't hurt his shoulder. He hadn't bounced back by the time of the signing deadline for the Pirates to give him big money as a second-round pick. Scheppers has more arm strength, while Crow has more polish and a better health history. Scheppers came out of the gates stronger this spring, but they're pretty even now. They both should factor in the top half of the first round, possibly in the first 5-10 picks.
Rich: Let's talk about what Washington is likely to do in terms of its compensation pick for not signing Crow last year. After you posted your Mock Draft, Version 1.0 two weeks ago, acting Washington general manager Mike Rizzo contacted Baseball America, and said, "We do not have to take a signability pick. We’re going to take the best guy. We’re going to have 10 names up there on the board, and we’ll take the one we like." It seems to me that the Nats have to be careful this time around because they won't get another compensation pick if they fail to sign this particular draft choice. Agree?
Jim: They do have to be careful, because teams don't get compensation for failing to sign a draft pick they got as compensation for failure to sign another. Reading between the lines of what Mike said, they very possibly could take a guy they like but the industry doesn't value as highly as the No. 10 pick, and in that case they could use their leverage to sign him to a below-slot deal. I don't think they'll use the price as their main focus of their pick, but I also don't think they're going to roll the dice on someone like Donavan Tate if he's still there.
Rich: There is an important distinction between ability vs. signability. Which teams are most likely to pay over slot to get the player they want?
Jim: Last year, the industry spent a record $188 million on the draft and 26 of the 30 teams exceeded MLB's bonus recommendations on at least one player. I think teams in general will be more thrifty this year. But the usual suspects, particularly the Yankees and Red Sox, I'm sure will be willing to spend if a talented player falls to them. The clubs generally don't announce this, though.
Rich: How many players that could go in the first couple of rounds are being advised by Boras this year?
Jim: Several. Scott has arguably the best prospect in draft history (Strasburg), the best hitter in this draft (North Carolina first baseman Dustin Ackley), the best high school position player (Cartersville, Ga., HS outfielder Donavan Tate), arguably the best high school pitcher (Westminster Christian Academy/St. Louis righthander Jacob Turner), the best middle infielder (Southern California shortstop Grant Green) and the best college lefthander (Oklahoma State's Andy Oliver). Other top-two-round Boras advisees include Gainesville (Fla.) HS outfielder LeVon Washington, Kentucky lefthander James Paxton, Tennessee outfielder Kentrail Davis and Rocky Mount (N.C.) HS outfielder Brian Goodwin.
Rich: Are there any teams that flat out won't deal with Boras? If so, which ones?
Jim: There are, though everyone at least kicks the tires on his guys and no one will admit to avoiding his players on the record.
Rich: Has MLB sent out guidelines for slot money this year?
Jim: We had early indications that the slot recommendations will be the same as last year, but Murray Chass has reported that Bud Selig wants to roll them back by 10 percent, just like MLB tried to do in 2007. We've since confirmed that. Suffice it to say that no one is happy. I've had agents tell me there's no reason for a first-rounder to sign before Aug. 15, and I had one front-office official describe it as "fucking bullshit." You may edit that quote as you like.
Rich: Those aren't my words, Jim, so I think I'll leave that quote as is. Forget slot recommendations for a minute. Given the economy and the state of baseball, do you expect signing bonuses will be negatively affected at any point in the draft?
Jim: I don't think bonuses will be slashed, but I do think there will be fewer teams who will aggressively sign players for well above the slot recommendations. The last time MLB tried to cut slots by 10 percent, bonuses went up anyway, so I don't think that will have as much of an effect as the economy will.
Rich: Which players stand to get "out of the box" type deals and why?
Jim: Strasburg, obviously, because of his immense talent. The top college pitchers usually get major league deals with a $3 million bonus and a $5 million total guarantee, so that's may be what Missouri's Kyle Gibson and North Carolina's Alex White are looking for. Then again, they haven't lit scouts up down the stretch, so they may be more apt to sign for slot. I bet Ackley will seek a big league contract as well. The three top talents who could fall the most in the first round because of asking price are Tate, who has the leverage of a football scholarship from North Carolina, Turner and Klein HS (Spring, Texas) lefthander Matthew Purke. The numbers we're hearing on those guys are $6 million for Tate, $7 million for Turner and $5 million for Purke. There also are starting to be rumblings that the other elite high school lefty, Tyler Matzek of Capistrano Valley HS (Mission Viejo, Calif.), may not be an easy sign either. There's no number on him yet but teams are thinking he may prove costly.
Rich: The price tag on Turner seems to be based on what Josh Beckett and Rick Porcello received. Is Turner in that same league?
Jim: He's very good, arguably the best high school pitcher in this draft, but I don't think he's in the same class as Beckett and Porcello. He's not far off, but he's not as highly regarded as they were in high school.
Rich: Given Tate's talent and and how the Braves have leaned toward Georgia-based prospects in the past, it wouldn't be unreasonable to assume that he could be atop their board, if available at No. 7. However, management hasn't been known to pay over slot and, as such, do you think Atlanta will forgo Tate for another player who may not be as risky or costly?
Jim: The Braves don't usually draft Scott Boras clients. Their last prominent one was Joshua Fields, and that didn't work out too well. I would be very surprised if Atlanta took Tate.
Rich: Purke has signed a letter of intent to attend TCU and would be a draft eligible sophomore in 2011, which means he could have as much leverage in two years as he does this year. Although I have likened the tall, lanky lefthander with the three quarters delivery to Andrew Miller (not sure if that's as high of a compliment today as it may have been a few years ago), I see him as a gamble for most teams (other than perhaps the Texas Rangers or Houston Astros) at that price tag. Could he slide all the way to the Boston Red Sox at No. 28 or to the New York Yankees at No. 29, a la Porcello in 2007 and Gerrit Cole in 2008? Porcello turned out to be a great selection for the Tigers but Cole rejected the Yankees and opted to go to UCLA instead.
Jim: He could slide that far, sure. I think the Rangers could be tempted by him if Brownwood (Texas) HS righthander Shelby Miller is gone, and I'm not sure the Astros would go that far over slot if Purke holds true to his price tag. My guess is the Yankees would be more likely than the Red Sox to take Purke.
Rich: Let's circle back for a minute. Strasburg is off the board and it's now time for the Seattle Mariners to make their first pick (No. 2 overall). Is Ackley the consensus choice here?
Jim: I think he is. For a long time, the story was this draft was Strasburg and no consensus No. 2. Now I think most teams in the top 10 picks would pop Ackley if they had their choice (assuming Strasburg is gone, of course). I would do the same thing. I think he's a can't-miss bat, should have at least average power and will be able to move to center field. He's the clear No. 2 prospect in the draft for me.
Rich: Some might say that the draft doesn't really begin until the San Diego Padres make their selection at No. 3. Do you think management will take USC shortstop Grant Green a second time (14th round in 2006)?
Jim: I projected the Padres to take Green in my first projected first round two weeks ago, but now I'm hearing that while they like him more than any team in the top 10, he's not in the mix at No. 3. I've heard Tate there, but he doesn't seem to fit their type of guy as a less-polished high school athlete with a huge price tag. I've also heard Crow and Vanderbilt lefthander Mike Minor there, too. Crow would make more sense to me, but may cost more as well.
Rich: If Green slips past the Padres, where do you see him going?
Jim: He's a real wild card. I can't see Boras advertising him as a guy who signs for slot no matter where he falls, and he hasn't lived up to what scouts expected this spring. Maybe he falls all the way to the Yankees, who spent their first-round pick on another USC player under similar circumstances (Ian Kennedy) a few years ago.
Rich: Which players have been climbing the draft boards the most since you put out your Mock Draft a couple of weeks ago?
Jim: Minor is going to go very high after pitching very well in his last two starts, likely in the first 10-15 picks. We have him rated as more of an early sandwich pick, and I think that's where his talent fits, but he'll go higher than that. Of the projected first-rounders from two weeks ago, I think most guys' stock is holding firm for now. Signability may have guys rise or fall but talent-wise, I don't think anyone else is really leaping up. Guys like Lipscomb lefty Rex Brothers and Indiana righty Eric Arnett continue to pitch well, but we had them as mid-first-rounders to begin with.
Rich: Aside from signability issues, whose stock has been dropping the most — and why?
Jim: White hasn't pitched well recently. He entered the year as the No. 2 pitcher behind Strasburg for some clubs, but now I think he probably won't go in the first 10 picks. A lot of teams are backing off of Green. Even if he'd sign for slot, he might last until the middle of the first round. Baylor righthander Kendal Volz had a chance to go in the top 10 but his stock has been dropping steadlily and he might be more of a third-rounder now.
Rich: Are there any debates as to where two-way players are best suited?
Jim: The biggest debate would be over Plant HS (Tampa) shortstop/righthander Mychal Givens. He's very raw but very talented at both positions, and I think it's a 50-50 split on which way he should go.
Rich: The Arizona Diamondbacks have back-to-back picks at 16 and 17. Do you see them taking one hitter and one pitcher or doubling up? Either way, will money get in the way of how the club approaches these selections?
Jim: I don't think they'll do anything beyond take the two best players, even if they're both hitters or both pitchers. They pick again at 35, 41 and 45, so if they double up they could always shoot for balance later. Ideally, I think they'd take a high school bat and a college pitcher. That is a lot of picks to pay, and it remains to be seen if they'll take some money-savers early in the draft.
Rich: After not having a first-round pick in three of the last four drafts, the Angels own the 24th and 25th spots this June, as well as three sandwich selections (40, 42, and 48). How do you see owner Arte Moreno, GM Tony Reagins, scouting director Eddie Bane & Co. handling this year's haul?
Jim: The Angels aren't afraid to spend and their farm system is flagging a bit, so I'd expect them to pay full freight for all five picks. They love athletes and projectable pitchers, and they love to focus on players in Southern California.
Rich: With the 2nd, 27th, and 33rd picks, Seattle is also in a good position this year. How do you see the new regime approaching these choices?
Jim: When he was running drafts in Milwaukee, Jack Zduriencik took the best player available, not caring if it was college vs. high school, pitcher vs. hitter, or what the general consensus on a guy was. The system isn't loaded with arms, so they might lean a little more toward some college pitching after grabbing Ackley at No. 2.
Rich: OK, let's finish with a big surprise. It could be anything. Let 'er rip.
Jim: Hmmm . . . I guess something that has jumped out at me recently is how a lot of the expected best college pitching duos (Baylor's Volz and Shawn Tolleson, Oklahoma State's Oliver and Tyler Lyons, Stanford's Jeff Inman and Drew Storen and Kent State's Brad Stillings and Kyle Smith) have mostly fizzled, with the exception of Storen. Now the two best come from unlikely sources: Kennesaw State's Chad Jenkins and Kyle Heckathorn, and Indiana's Arnett and Matt Bashore. Jenkins and Heckathorn could both go in the first round, as should Arnett (who would be the Hoosiers' first first-rounder since 1966), and Bashore may sneak into the sandwich round.
Rich: Excellent. Thank you, Jim, for taking the time out of your incredibly busy schedule to share your expertise on this year's draft with us.
Jim: No problem. Love your website, and always glad to help.
* * *
Update: Jim posted his Mock Draft, Version 2.0 earlier today.
| F/X Visualizations | May 28, 2009 |
PitchF/X Detective: Has Bradley's Strike Zone Been Widened
Last weekend Milton Bradley claimed that his strike zone had been expanded in retaliation for his early season run-in with umpire Larry Vanover.
This claim was brought to my attention in Craig Calcaterra's ShysterBall blog where he suggested that someone with "PITCHf/x-fu" could check this assertion. I am not 100% sure what "PITCHf/x-fu" is, but I like to think I have it. Either way I thought this was an exciting new application of the pitchf/x data, so I decided to take Craig up on it and see if Bradley's strike zone has been any different this year.Bradley believes his strike zone is being widened, forcing him to chase pitches he normally doesn't swing at or risk being called out on strikes.
Asked if there have been repercussions from Vanover's fellow umpires since the incident, Bradley didn't mince words.
"There always is," he replied. "No matter what, I'm the type of guy [where] I don't care what somebody does to a colleague of mine. I'm not going to treat him any differently. I do things straight up, because I'm a straight-up, honest individual.
"Unfortunately, I just think it's a lot of 'Oh, you did this to my colleague,' or 'We're going to get him any time we can. As soon as he gets two strikes, we're going to call whatever and see what he does. Let's try to ruin Milton Bradley.'
"It's just unfortunate. But I'm going to come out on top. I always do."
First off we need the smallest bit of background on the strike zone. It is called differently to right- and left-handed batters; the outside edge is extended out a couple inches to lefties. In addition, its size is count-dependent, expanding in hitter's counts and shrinking in pitcher's counts. These two facts make an assessment of Bradley's claims a little tricky. He is a switch hitter so we have to break up the analysis for him as a LHB and as a RHB. And any differences could be the result of differences in the fraction of time he is in hitter's versus pitcher's counts this year compared to the past.
The pitchf/x system was phased-in in 2007 and has been operational in every game since, so I am going to compare pitches Bradley took in the part of 2007 covered and all of 2008 to those he took in 2009 thus far (ignoring the count issue temporarily). Here are the pitches he took as a RHB. Remember, the images are from the catcher's, so negative values of x are inside to a RHB and positive inside to a LHB. The gray dots are balls and the black dots called strikes.
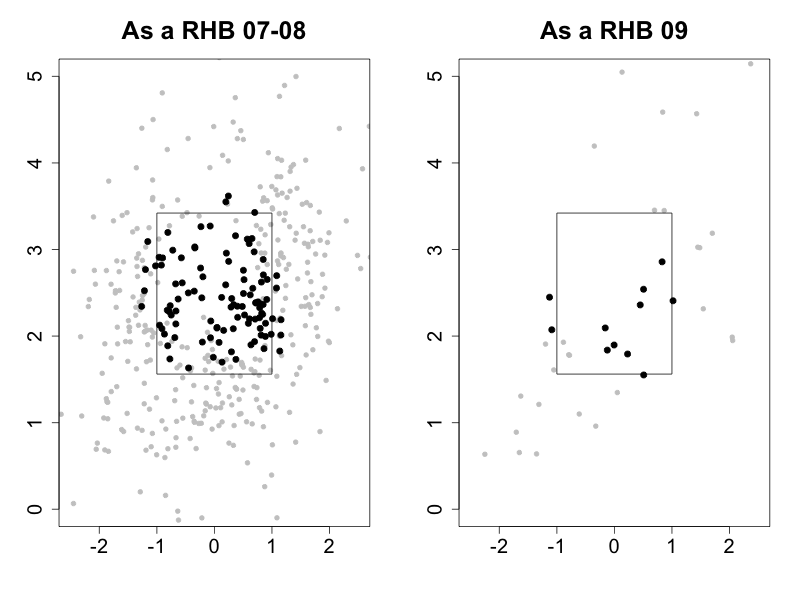
There are too few taken pitches in 2009 as a righty to make much of a firm conclusion, but it does not look terribly out of whack. There are two called strikes on the inside edge, but right below them are four balls also along the inside edge.
Here are pitches he took as a LHB.
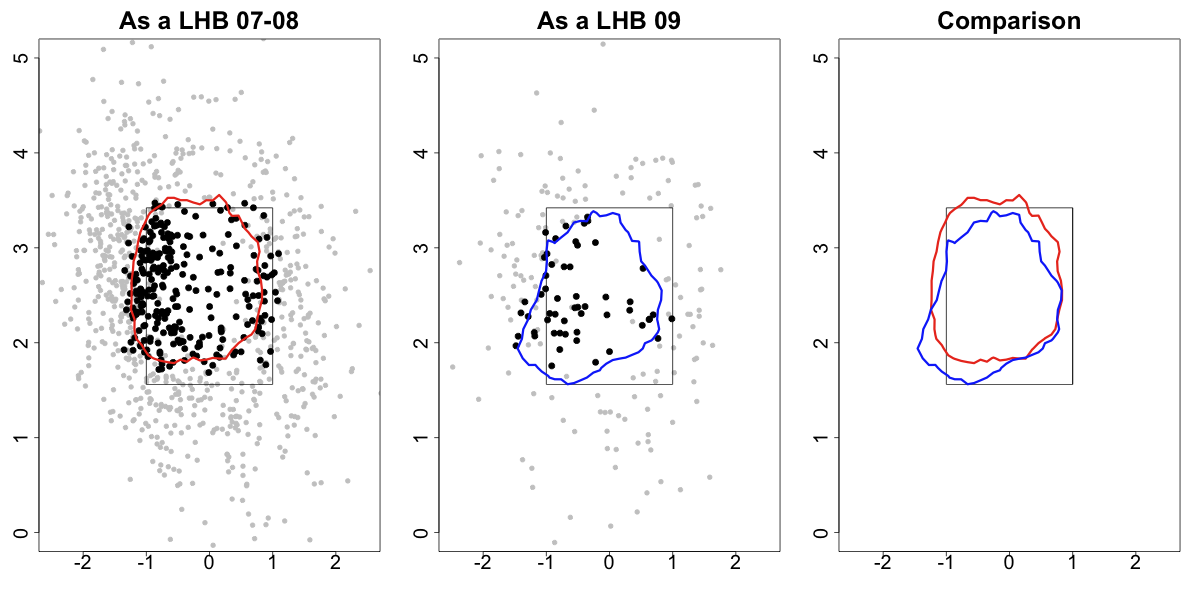
Bradley has way more at-bats as a lefty and thus there are more taken pitches. These addition pitches allowed me to make called strike contours. These contours are closed lines such that a pitch inside the line is a strike 50% of the time or more and a pitch outside the line is a ball 50% of the time or more. Here you can see how the outside edge of the strike zone is shifted farther outside to Bradley as a lefty, as is the case to all LHBs. The inside edge of the pre-2009 and 2009 zones are almost exactly the same. Up and outside the pre-2009 zone is larger, but down and outside the 2009 zone is larger. As a whole the two are almost exactly the same size.
To make this conclusion statistically explicit, and correct for the count, I ran a binomial logistic regression. This is a regression in which the dependent variable only takes two values, in this case 1 if a taken pitch is called a strike and 0 if it is called a ball. The dependent variable is regressed against any number of ordinal and/or categorical variables. In effect this binomial logistic model uses these regressors to calculate the probability a taken pitch is called a strike, and tells you which of the regressors are statistically significant in determining that probability. The technique is identical to that taken in my earlier strike zone post, but this time I restrict the analysis to just Bradley's data.
I regressed Bradley's strike/ball taken pitches against the horizontal distance between that pitch and the horizontal middle of zone (with a different middle for Bradley as a LHB and RHB), the vertical distance from that pitch and the vertical middle of zone, the interaction of these two distances, the number of balls and strikes (to control for the count) and a categorical factor of pre-2009 or 2009.
 Binomial Logistic Regression
+-----------------+----------+------------+---------+------------+
|                 | Estimate | Std. Error | z Value |    P(>|z|) |
+-----------------+----------+------------+---------+------------+
| (Intercept)     |    5.995 |      0.370 |   16.21 |  < 2e-16 * |
| x Dist.         |   -0.364 |      0.022 |  -16.37 |  < 2e-16 * |
| y Dist.         |   -0.526 |      0.031 |  -17.48 |  < 2e-16 * |
| x*y Interaction |    0.012 |      0.000 |   13.87 |  < 2e-16 * |
| Num. Strikes    |   -0.897 |      0.178 |   -5.03 |  4.8e-07 * |
| Num. Balls      |    0.251 |      0.085 |    2.96 |    0.003 * |
| 2009            |   -0.023 |      0.217 |   -0.10 |    0.914   |
+-----------------+----------+------------+---------+------------+
Regressors with a negative estimate decrease the likelihood of a pitch being called a strike. So as the x or y distance increases the probability of a strike decreases, as expected. As the number of strikes increases the probability of a strike decreases (the strike zone shrinks in pitcher's counts) and as the number of balls increases the probability of strike increases (the strike zone expands in hitter's counts). All of these effects are strongly significant and mirror the results for all hitters.
The difference between the pre-2009 and 2009 zone is very slight, and if anything the 2009 zone is slightly smaller. Taken pitches in 2009, correcting for distance and count, are slightly less likely to be strikes. But this effect is very non-significant. There is over a 90% chance the difference between pre-2009 and 2009 zones is just due to chance alone. There is no statistical difference between Bradley's zone this year and his zone in 2007 and 2008.
I can understand Bradley was frustrated on Sunday. The Cubs had just lost seven straight games, and in five of those games they scored either zero or one run. He is hitting a meager .196/.322/.373 this season, but he has his decreased BABIP and LD% and increased GB% to blame for it, not the umpires.
| Change-Up | May 27, 2009 |
Padres & Snakes
In looking into the San Diego Padres recent 10-game win streak, snapped last night in Arizona, I found wisdom where I would not ordinarily think to seek it. Save some insidery commentary about the sort of effect Petco has on visiting hitters that didn't seem to make a whole lot of sense, John Kruk was spot on in his analysis of San Diego's recent winning ways and what the implications are for the rest of the season:
People might want to make a big deal about the San Diego Padres winning 10 consecutive games, but I don't think it's that great a story yet. Their 9-7 win against the Arizona Diamondbacks on Monday snapped an 11-game road losing streak, and was only the fourth time this month they had scored six or more runs.The Padres are beset with offensive issues much like their NL West rivals, the San Francisco Giants. The Padres are anchored by an impressive 1-2 punch at the top of their rotation in Chris Young and Jake Peavy, while the back end is held down by closer Heath Bell. All they really have on offense is first baseman Adrian Gonzalez, who has quietly become one of baseball's best players.
That sounds about right. They cannot win on the road, they have one guy on the team who can hit and their starting pitching cannot muster any consistency. In Heath Bell, Luke Gregerson and Edward Mujica they seem to have found a core of reliable arms to build around in the bullpen but beyond their relief pitching, there are no discernible strengths on this club.
As good as he can be, Jake Peavy still has not regained his once dominant form. He has allowed 3 earned runs or more in 6 of his starts in 2009. Compare that to his Cy Young campaign of 2007 when he yielded 3 or more earned runs just 10 times all season long. His peripherals look sound and he has been excellent in May, however. He is still a bona fide, top of the rotation hurler but let's see how long he remains in San Diego.
As for the rest of the rotation, well, have a look for yourself.
              IP    H  BB   K   K/9  K/BB  ERA
SP ex Peavy  197.1 191 90  137  6.3  1.5   4.98
I don't need to tell readers here that a 4.98 ERA while pitching half of your games at Petco Park is not very good. And on the offensive side, it's a similar story. They are hitting .234/.314/.389 despite featuring the League's leading home run hitter. Were one to back out Gonzalez's contributions this season then you would be looking at a run producing attack on par with their banjo hitting neighbors up the coast, the San Francisco Giants.
Nonetheless the Padres find themselves just four games back in the Wild Card race. I don't think there's much reason for hope in San Diego, which is something the Arizona Diamondbacks and their fans had in spades coming into the 2009 season. 26 games into the season their ace is hurt, they have yielded 28 more runs than they have scored and they're 6 games under .500. Players in their prime the D-Backs need to produce continue fall short of expectations, and boy was the Eric Byrnes contract extension a mistake.
          AVG   OBP   SLG
Tracy    .189  .252  .342
Drew     .190  .280  .333
Young    .177  .219  .320
Byrnes   .208  .257  .384
Still, as bleak as things seem I think there may still be hope for the Snakes. 21 year-old Justin Upton, hitting .325/.400/.617, has broken out. Same goes for the electric Max Scherzer, who had his best outing of the season last night. His ERA is down to 3.38 and he is striking out over a batter an inning. With Dan Haren once again pitching lights out, Brandon Webb coming back at the end of June and Doug Davis and Jon Garland playing their typical innings-eater roles, this is a rotation that can work.
But the offense has to come around, and there is good reason to think that it can. At Fangraphs, Dan Szymborski has published his ZIPS projections for the rest of the season, and here is how the quartet listed above looks according to his numbers:
          AVG   OBP   SLG
Tracy    .257  .315  .414
Drew     .266  .323  .439
Young    .231  .304  .454
Byrnes   .254  .313  .425
They're not lighting the world on fire, but they look a heck of a lot better than how they have fared thus far in 2009. Along with the health of Webb, it is the play of these four position players that will determine the fate of the 2009 Diamondbacks.
As noted at the top, the Diamondbacks ended the Padres 10-game winning streak last night in Phoenix. Says here that it was the start of a trend for both clubs.
| Touching Bases | May 26, 2009 |
David Price's Debut
For Cleveland sports fans, I don’t know if any moment could top LeBron James’ game-winning three pointer from Friday night. Last night’s ninth-inning comeback by the Indians wasn't half bad.
For Tampa Bay fans, though, last night's game was of greater importance than its bullpen collapse. Last night, David Price made his first start of the year.
Pitching in five regular season and five postseason games last year, Price served as an instrumental part in the Rays’ playoff run. Nevertheless, Price retained his rookie eligibility, and the Rays, managing a surplus in pitching, opted to option the 23-year old southpaw down to AAA and keep youngsters Andy Sonnanstine and Jeff Niemann in the rotation as well as limit Price’s innings.
Following Price's phenomenal postseason performance, Josh Kalk penned everything you need to know about the man, who was named the second-best prospect in baseball (behind Matt Wieters) by Keith Law, Kevin Goldstein, and Baseball America.
In spring training, Price went 2-0 with a 1.08 ERA, but his six walks allowed in 8.1 innings of work were a bad sign. After Price’s second spring appearance, he admitted that he was experiencing difficulty.
"I've worked on my changeup so much, my slider's gone away," Price told mlb.com. "It's something I'm going to have to get back."
Considering the hype Price received, it's hard to believe that he still had areas where he needed to improve, but he's still just a kid with only a year of professional ball under his belt.
Price’s first six starts with AAA Durham were worrisome, as he posted a 1-4 record due to a disappointing 21:16 K:BB ratio. Price was drawing fewer swinging strikes and he was not inducing nearly as many ground balls in his 2009 stint with Durham as he had in 2008 across four levels. Yet Price seemed to have turned it around in the last couple of weeks leading up to his start yesterday. In what might be his final Minor League appearance of his career (knock on wood) Price went five innings of no-hit ball while striking out nine. Price entered the Rays' rotation when Scott Kazmir, to whom Kalk compared Price, hit the Disabled List. I set out to break down the second start of Price's Major League career.
Price came out firing. His first 14 pitches were four-seem fastballs clocking in between 94 to 98 miles per hour. Jamey Carroll drew for a leadoff walk, followed by Grady Sizemore hitting a pop up down the left field line, Carl Crawford made a futile attempt at a diving catch, which allowed runners to advance to second and third with no outs. Then Price really flashed his potential.
Price worked ahead of the count on Victor Martinez with fastballs, and with two strikes, Martinez had little chance. Price busted Martinez inside with sliders which Martinez could do little else but foul off. Price then blew Martinez away with a 98-MPH fastball on the outside part of the plate. Price worked ahead of Jhonny Peralta with inside fastballs and finished him off with a hard slider inside. Price finished the inning by testing Shin-Soo Choo with fastballs up in the zone, and on 2-2 Price threw a heater over the heart of the plate that Choo took for a called strike three.
Needless to say, that stretch was Price’s most impressive, which is fair since it doesn’t really get much better than that.
The Rays gave Price a fiive-run cushion heading into the bottom of the second. However, Price walked the leadoff batter on four pitches, which just makes you wonder. There’s no reason that any Major League pitcher with a five run lead should be walking the leadoff batter on four pitches. Price allowed five walks, which is the second time in his last four starts that he’s allowed that many. Walks have been a problem for Price. Since being promoted to AAA last year, Price has walked well over four batters per nine innings.
Let's take a look at Price's strikezone plot. This is from the catcher’s perspective, so pitches on the right are towards Price’s arm side, or inside to left-handed batters. Blue markers are pitches against righties, while red markers are pitches against lefties. Circles indicate fastballs while triangles indicate sliders.
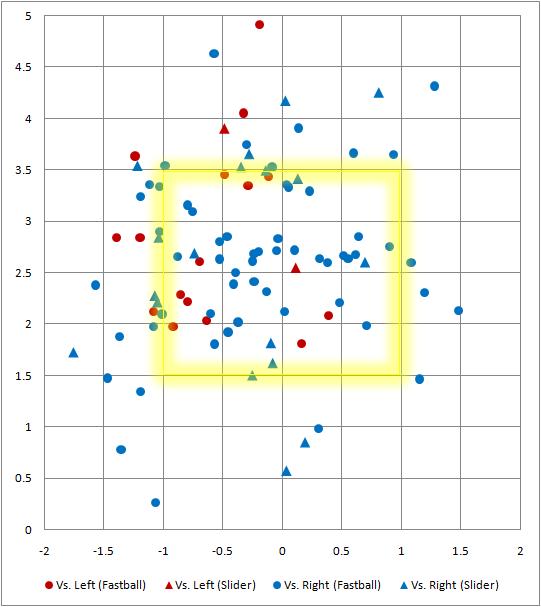
It looks to me like he tried to work away from lefties. His off-speed stuff was saved almost exclusively for righties, and he tried to keep his sliders in on them. Looking at his strikezone plot, I don't think Price was wild, but he didn't shy away from working himself into long at bats, which is unnecessary given that defense behind him and his ability to blow batters away.
Despite the leadoff walk in the second, Price retired the next three batters in order. With a full count on Ryan Garko, Price demonstrated the ability to keep the ball in the zone when necessary, as he forced Garko to foul off five pitches in the zone before popping out on a slider on the outside corner.
Price allowed two more baserunners in the third, but came out unscathed. The fourth inning was where it all started falling apart for Price and the Rays. The Rays had a 10-0 lead, yet Price was already at 77 pitches by the start of the inning, and his fastballs to the first two batters of the inning were down in velocity to 92-94 MPH. Mark DeRosa lined a single the other way and Garko pounded his third homer of the year on a knee-high fastball. Price picked the velocity back up against Matt LaPorta, working at 95-97 with his fastball to strike LaPorta out. Yet Price was up at 90 pitches, and he had apparently lost his command. Price walked the next two batters and was pulled by Joe Maddon, who had said in a pre-game interview that it was a goal for Price to go deep into the game. Neither of those baserunners came around to score, but Price was fortunate to forfeit only two runs after allowing nine baserunners in 3.1 innings.
Price, as usual, was 95% fastball/slider. He showed his spike curveball and changeup once or twice, but they were all wasted for balls.
I’d say he found his slider. Like last year, it averaged a velocity of 86-88 miles per hour. While Price doesn't generate significant horizontal movement, he actually got the ball to dive more in yesterday's start than he did on average last year. He releases his slider a couple inches farther from his body than he releases his fastball on average. There aren't many sliders thrown at 86-88, especially from the left side. Last year, Francisco Liriano and Randy Johnson threw the hardest sliders among left-handers. Both of them had little horizontal movement, like Price, and Liriano's and Johnson's sliders actually generated less vertical movement than Price's has. Nevertheless, all of these sliders have solid reputations and they have all accounted for above-average run values, which can now be found on Fangraphs. Swinging at Price's slider simply isn’t a good idea. Out of eight swings on his sliders, there were five fouls, two misses, and one pop out. However, when batters took the slider, only two called strikes were called out of twelve pitches. If he can locate the slider down in the zone, I believe it would be nearly untouchable.
His fastball averaged 96 MPH, which, for a starter, for a lefty, and for a human whose arm must follow the laws of biomechanics, is positively exceptional. The movement on it is nothing to write home about, though, in my opinion.
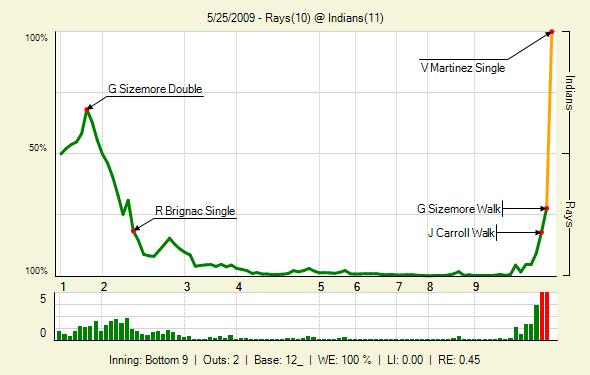
Price’s stuff is unbelievable. There’s no denying that. But walking that many batters is inexcusable, and it cost his team the game. Price has yet to have an outing of over six innings since he was called up to the Majors last year. Part of that is due to the Rays’ attempt to limit his innings. And part of that is Price’s propensity to throw too many pitches. The Rays were forced to go to their bullpen early, and they ended up not having enough arms to close out the game. Well, that’s not really fair. A bullpen should be able to close out a ninth-inning seven-run lead. Here’s the WPA chart from the biggest comeback of the year.
| Baseball Beat | May 26, 2009 |
June Madness Begins in May
Over the weekend, the NCAA Baseball Committee announced the field of 64 teams that will compete for the 2009 NCAA Division I Baseball Championship. As always, there were a handful of surprises.
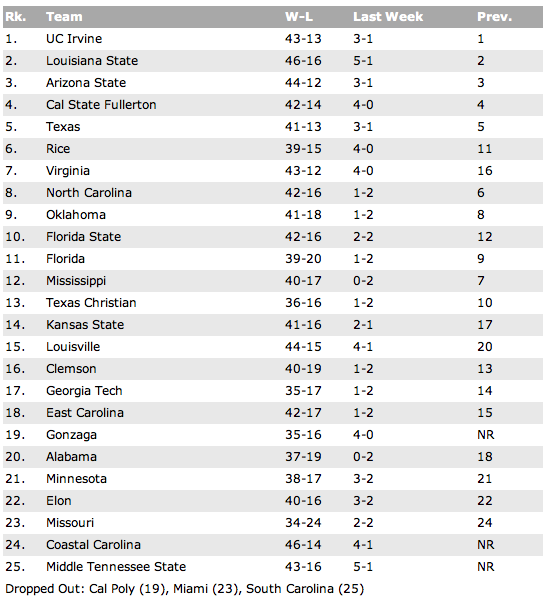
The Big 12 (Baylor, Kansas, Kansas State, Missouri, Oklahoma, Oklahoma State, Texas, Texas A&M) and Southeastern Conference (Alabama, Arkansas, Florida, Georgia, LSU, Mississippi, South Carolina, Vanderbilt) landed eight spots each while the Atlantic Coast Conference (Boston College, Clemson, Florida State, Georgia Tech, Miami (FL), North Carolina, Virginia) nabbed seven. Meanwhile, the Big West (Cal Poly, UC Irvine, Cal State Fullerton) and Pacific-10 (Arizona State, Oregon State, Washington State) garnered three each.
The Big 12, SEC, and ACC combined for 23 of the 64 available berths in the NCAA tournament. By comparison, the West (including the six schools named above plus Fresno State, Gonzaga, San Diego State, Utah) earned a whopping 10 spots or two more than the Big 12 or SEC. Mind you, the West sports the defending champ (Fresno State) and three of the top six national seeds (Cal State Fullerton, Arizona State, UC Irvine), yet is represented by less than 16 percent of the total field.
The top eight national seeds are as follows:
1. Texas (41-13-1)
2. Cal St. Fullerton (42-14)
3. LSU (46-16)
4. North Carolina (42-16)
5. Arizona St. (44-12)
6. UC Irvine (43-13)
7. Oklahoma (41-18)
8. Florida (39-20)
While Texas goes in as the favorite, it has been 10 years since the last No. 1 overall seed (Miami) won the College World Series. Along the same lines, no top-eight seed has emerged victorious since Rice in 2003.
Courtesy of Baseball America, the 64-team field is as follows (with Regional hosts listed No. 1 and national seeds indicated in parenthesis after the school name):
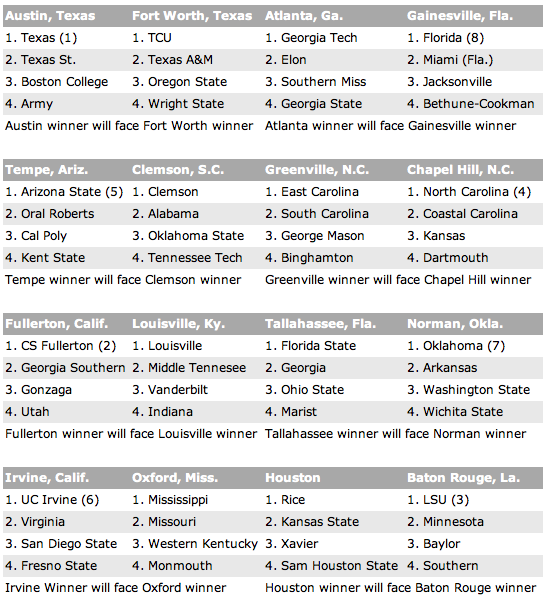
I'm all ears and eyes if anyone can explain to me how the Committee can justify placing UC Irvine (No. 1 ranked team in Baseball America's latest poll, the sixth overall seed, and the Big West champions), Virginia (No. 7 in Baseball America's poll and ACC tournament champions), Fresno State (defending NCAA champs and winner of the WAC tournament), and San Diego State (40-21 with a second-place finish in the Mountain West tourney) in the same Regional. The bracket is particularly unfair to UCI and Virginia, which gets the privilege of facing Stephen Strasburg, perhaps the greatest pitcher in the history of college baseball, in the opener on Friday night.
To be honest, it's hard to understand how Cal State Fullerton earned a higher national seed than UCI. The Titans finished five games behind the Anteaters in the Big West and lost the head-to-head series in early April. Granted, Fullerton (No. 1) has a higher RPI than Irvine (No. 18) but that should have little or no bearing when comparing two teams from the same conference that played an identical schedule in league and faced each other three times during the regular season. In any event, UCI gets Virginia, which could have conceivably been chosen as a Regional host, as its No. 2 seed and CSF gets Georgia Southern (unranked with the 35th highest RPI)? I'm sorry, but these pairings make no sense whatsoever.
Rice and Florida State can also make reasonably strong cases over Oklahoma and Florida for national seeds. As Baseball America's Aaron Fitt pointed out, "Rice was 21-9 against the top 100 teams in the RPI, and it finished strong by winning the CUSA tournament. And Florida State won the regular-season ACC title and reached the finals of the conference tournament."
Fitt also believes that "Oklahoma State is a horrendous, horrendous choice as an at-large bid." The Cowboys won just two of its nine conference series and finished ninth in a 10-team league, yet finds itself a No. 3 in the Clemson Regional. Baylor is another questionable call from the Big 12 (which is really the Big 10 when it comes to baseball).
The Regionals begin on Friday, May 29 and conclude on Sunday, May 31 (or Monday, June 1, if necessary). Selection of the eight Super Regional hosts will be announced on Monday, June 1 at approximately 11 p.m. ET. The Super Regionals will take place on June 5-7 and June 6-8. The best-of-three-games winners will advance to the College World Series at Rosenblatt Stadium in Omaha, Nebraska on June 13-23/24.
Additional notes (from the NCAA press release):
* * *
Update (5/27/09): Boyd's World has posted its Iterative Strength Ratings (ISR)-based probabilities to determine the odds of winning the Regionals, Super Regionals, and College World Series. Not surprisingly, the 16 Regional hosts are favored to win this weekend with Texas (66.9), Arizona State (78.2), Cal State Fullerton (83.4), and UC Irvine (54.8) the only schools with a better than 50 percent chance of making it to Omaha. Based on these ISR findings, Fullerton (32.6), ASU (19.2), and Texas (13.2) are the three favorites to win it all.
| Baseball Beat | May 25, 2009 |
High School, College, and Minor League Notes
The Major League Baseball Draft will be held two weeks from tomorrow. The first day (Tuesday, June 9), which will consist of the first three rounds plus two compensation rounds, will be televised live by the MLB Network at 6:00 p.m. (ET). The draft will resume on Wednesday (fourth through 30th rounds) and conclude on Thursday (31st-50th rounds).
Baseball Analysts will live blog the draft once again, posting player profiles and comments as picks are unveiled. We plan to kick off our pre-draft coverage on Thursday, holding a Q&A with Jim Callis, Baseball America's resident draft expert. As in the past, we will also bring you interviews with several top prospects, including Tanner Scheppers, who returns to the draft this year after failing to sign with the Pittsburgh Pirates last summer. In addition, we will provide post-draft analysis, including Marc Hulet's shadow draft.
* * *
Two years ago, I interviewed Josh Vitters, who was selected by the Chicago Cubs with the third overall pick in the 2007 draft. Due to a nagging hand injury, Vitters' pro career got off to a slow start, hitting a combined .118/.164/.118 in 55 plate appearances over two levels (Rookie and Short Season). He bounced back in 2008, putting up a .322/.357/.495 line, mostly at Boise in the Short Season Northwest League. The 6-3, 200-pound third baseman is taking it to a new level in 2009, raking at a .355/.381/.612 clip at Peoria in the Low-A Midwest League. He had five consecutive three-hit games from May 14-19 and has slugged seven HR in his past nine games.
While Vitters is drawing rave reviews (landing atop Baseball America's Prospect Hot Sheet for the past week), he has drawn only three walks in 160 plate appearances. Look for the aggressive-hitting Vitters to get promoted to Daytona of the High-A Florida State League soon but keep an eye on his BB/SO ratio as an indicator of his upside potential.
* * *
I interviewed Kyle Skipworth, who Baseball America called "the best prep prospect at that position since Joe Mauer was the first pick in the 2001 draft," as part of our pre-draft coverage last year. Skipworth was taken by the Florida Marlins with the sixth overall pick and signed within a couple of weeks for a $2.3 million bonus. The lefthanded-hitting catcher has had a difficult time adjusting to pro baseball. However, his struggles in the Rookie League last year (.208/.263/.340) weren't atypical for a kid who had just turned 18 the previous March. Unfortunately, Skipworth appears to have regressed this season, hitting .174/.222/.294 at Greensboro in the Low-A South Atlantic League. Worse yet, he has struck out 44 times (with only seven walks) in 118 plate appearances.
More than anything, it just goes to show that scouting young baseball players is an inexact science and that some players develop more quickly than others while others never pan out. Only time will tell if Skipworth will become part of the first or second camp.
* * *
Remember Bryce Harper? Well, it's time to revisit the 16-year-old sophomore from Las Vegas High School. The Wildcats completed their 2009 season about ten days ago and, according to Baseball America, Harper put up the following statistics:
| AB | R | H | 2B | 3B | HR | RBI | BB | SO | SB | CS | AVG | OBP | SLG | OPS |
|---|---|---|---|---|---|---|---|---|---|---|---|---|---|---|
| 115 | 76 | 72 | 22 | 9 | 14 | 55 | 39 | 5 | 36 | 3 | .626 | .723 | 1.339 | 2.062 |
The numbers look like they came right out of one of those video games where you can rig the system by creating the best possible player in the world. But these stats are the real deal. Harper hit eight of his 14 HR in the final seven games and ended the season on a 23-game hitting streak. One can only wonder why any team would even pitch to him at all.
Harper won't turn 17 until October 1. In the meantime, there's no rest for the young. He is expected to play in a full slate of wood bat summer league games. I'm hopeful of watching him perform in the Area Code Games in Long Beach once again and will keep readers apprised of the progress made by the slam dunk No. 1 pick in the 2011 draft.
* * *
Meanwhile, in the here and now draft, check out the stats for a college pitcher out of San Diego State that you may have heard a little bit about:
| W-L | G | GS | CG | SHO | IP | H | R | ER | BB | SO | HR | BAA | ERA |
|---|---|---|---|---|---|---|---|---|---|---|---|---|---|
| 13-0 | 14 | 14 | 2 | 2 | 102.0 | 57 | 15 | 14 | 19 | 180 | 3 | .164 | 1.24 |
The only question that remains is not whether Stephen Strasburg, who leads the nation in ERA and Ks, is taken first overall but how much he signs for ($10 million, $15 million, $20 million, $25 million, or the $50 million that the Scott Boras Corporation has reportedly floated out there)? Seeing that he is already on my fantasy baseball team, my hope is that he inks a contract well before the August 15 deadline and pitches for the Washington Nationals this year.
* * *
Patrick Schuster, the Mitchell HS (New Port Richey, FL) pitcher who jumped into the national spotlight when he threw four consecutive no-hitters this season, is projected by Baseball America to go in the fifth or sixth round of the June draft. Look for the lefthander with four pitches, including a fastball that ranges from 87-92 mph, to make good on his commitment to the University of Florida if he's not drafted higher than that. You can view highlights of his slingshot delivery and an interview on ESPN's First Take here.
* * *
The top two high school southpaws in this year's draft are Tyler Matzek (Capistrano Valley HS, Mission Viejo, CA) and Matthew Purke (Klein HS, Spring, TX). I was impressed with both when I watched them pitch back-to-back, 1-2-3 innings in the AFLAC All-American Classic on TV last August. They each struck out two batters. Matzek throws four pitches but relies on a fastball that hit 93 twice that afternoon and a sharp-breaking curveball while Purke's more electric fastball out of a three-quarters arm slot touched 95. The latter may be a tougher sign as he has agreed to attend Texas Christian and will be a draft-eligible sophomore in 2011.
* * *
Update: The links to organizational statistics in our sidebar on the left have been updated for the 2009 season. Thanks to Baseball-Reference.com, you can access any player's major or minor league stats with one click. Go to the section labeled Reference, choose a team, then click on either "Bat" or "Pitch" and you will be taken to that club's complete list of major and minor league hitters or pitchers.
Furthermore, we have also updated our sidebar for the 2009 Draft Order for the first round and supplemental round. This information is courtesy of Baseball America.
| Behind the Scoreboard | May 23, 2009 |
Measuring the Taint: Steroids and the Court of Public Opinion
After the Mitchell Report was released last year, baseball hoped to put its steroid past behind it. However, with this year's allegations of Alex Rodriguez and Manny Ramirez both juicing, steroids are once again back on baseball's front burner.
How A-Rod and Manny's legacies will be tainted by steroid accusations remains to be seen, but one of questions for fans, baseball media, and hall of fame voters is how to treat alleged steroid users in the steroid age. While no player has actually been tried for taking steroids, all players stand in front of the court of opinion, and this court, fair or not, will determine a player's legacy.
While the list of players somehow connected with steroids has grown to over 125 according to Baseball's Steroid Era, some alleged users seemed to have escaped the taint and shame that comes with steroid use, while others have felt the full wrath of public scorn crash upon them. Watching a nationally televised early season game this year between the Cubs and Cardinals, the announcers lauded the amazing feel-good story of Rick Ankiel, the wild pitcher turned slugger, while conveniently not mentioning that he completed the transformation with the help of Human Growth Hormone. Ankiel had a prescription from a doctor and was not banned by Major League Baseball, but he still took HGH - it seems that he has been given him a pass where other HGH users have been vilified - at least according to Miller and Morgan.
But while no polls of fans' perceptions have been taken, it got me thinking about how tainted certain ballplayers were due to steroids. While a poll might be ideal, another measure of steroid taint might be how many mentions of steroids linked with a player are in the media. Another might be how often fans refer to a player as a steroid user. Where's one place that the media and fans intersect to provide commentary on baseball? The internet of course.
One way of measuring the steroids stain is by using the all-powerful Google. To get a player's baseline number of mentions, I put a player's name in quotes and searched for all references within the past year. Then, to measure the stain of steroids, I searched for that player's name with the word "steroids" next to it and took note of how many hits were found in the last year for that search. Dividing the number of hits for a player and steroids, by the number of hits for the player overall, gives an estimate of the "percent tainted" for a particular player. I limited the searches to references within the last year to eliminate hits for that player before the steroids were found, as well as to give the controversy time to calm down - we're not as interested in how widely reported the story was at the time it broke, but in how a player is perceived after some time has passed.
Obviously this is an inexact science - the number of hits change over time, and is subject to the unknown inner workings of Google. And of course, if you've ever searched for something on the internet before, you'll know that sometimes you might get results that don't result in what you want - a hit from a search of Ankiel and steroids might talk about Ankiel in one place and mention steroids in a totally different context further down the page. Ideally, we'd like to filter those out, but this method should still give a decently accurate results.
Another potential problem, was that if there was recent news on the particular player and steroids, this tended to give some bizarre results - Tejada was recently pled guilty to lying to Congress, so for a few weeks this led there to be more hits for Tejada and steroids than Tejada alone. Now that inconsistency seems to have gone away. I'm not sure how this happens, but it's reason for caution when there has been recent news surrounding a player. For this reason, Manny Ramirez and A-Rod are not in the table below - the verdict is still out on how their usage will affect their legacy. The data I present here is about a week or so old - hopefully things haven't changed much.
For what it's worth, here is the table of the "Percent Tainted" for the alleged or proven steroid users. It's not a comprehensive list, but covers the highest profile players along with their usage and the source of their allegations.
Is there a pattern that can explain why some players seem to be more tainted than others? Not surprisingly, it's Bonds that tops the list. He's followed by Palmeiro, Clemens, and Caminiti, all high-profile steroids cases to be sure. A few guys, Knoblauch, Hill, Neagle, are high on the list, but are probably more an artifact of the method rather than real public perception. These were players who were out of baseball and out of the public eye when their names surfaced in the Mitchell Report, leading to a high percentage of recent hits linking them to steroids. On the other hand, this didn't seem to affect Fernando Vina or David Justice, who were also out of baseball when the report surfaced, but their percentages were fairly low.
Of the other Mitchell Report guys, some players got off relatively easily. You don't hear much about Eric Gagne's steroid use, and the Google data backs this up, at only 19% tainted. Gary Matthews Jr. and Brendan Donnelly also seemed to get a pass from the public. Why I'm not sure, but my perceptions seem to match the Google data - the guys at the bottom of the list aren't guys you generally associate with steroids, even though there's evidence that they did them. Meanwhile, the guys at the top are the players I tend to link with steroids more readily.
Players that were simply rumored to have juiced, or were implicated via hearsay, were less likely to be judged harshly by the public. A guy like Bret Boone, who's numbers surely would indicate steroid user, but was implicated only by Jose Canseco, came in fairly low at 21%. Ivan Rodriguez and Magglio Ordonez were even lower. Puzzling is Canseco himself, who was 30% tainted - high but not as high as some others - even though he seems to have made his entire existence revolve around steroids.
At the bottom of the list is our man Rick Ankiel, who was found to have taken HGH, but claimed he had a good reason for it. The ESPN announcers weren't the only ones giving Ankiel a pass; it seems that most others did as well.
In general, it seems that the players who took a low profile - no lawsuits, no interviews, no public outrage - seemed to fare the best. Guys like Clemens or Palmeiro, admittedly bigger stars to begin with, tried to refute the claims and ended up high on the list. It also seems best not be linked with one of those guys - Andy Pettitte probably handled his situation as best he could, but being linked with Clemens assured his own use would be brought up time and time again. Ditto with Benito Santiago and Bonds.
While it's interesting to see the perception of players who have already been busted, we can use the same method to try to track which players - past and present - are most perceived to have taken steroids, even if no actual evidence or credible allegations have been made. This isn't a witch hunt, but rather simply taking measure of who the public suspects of possibly taking steroids.
For this, we must take additional steps of manually filtering out results that actually suspect a player of steroids vs. results that say, have a player commenting on steroid use without any implication at all. A search of Derek Jeter and steroids may turn up a lot of results, but they will be talking about him in relation to A-Rod’s use, not suspecting Jeter of steroid use himself. To do this, I manually looked at the first 20 hits and saw which were relevant suspicions, and which were not, and proportionally scaled back the "taint percentage." To be fair I also went back and did this for the proven steroid users as well, so the table above also reflects this methodology. It's not foolproof to be sure, and it's somewhat subjective, but it's a way to combat the above problem.
Below is a table of players who have never been actually reported to have used steroids, and their taint percentages. The list consists of big power hitters and a few other all-star type players - the type of player who usually falls under suspicion, or at least attracts the attention of fans.
The most suspected, but never proven, player of all is not surprisingly Sammy Sosa. He's always been a face of the steroid era, despite never having actually been linked to using them, and his percent tainted is larger than most players who actually have been proven to take steroids. The other biggest suspicions seem to be based largely on statistics, which makes sense in light of the lack of actual evidence. Brady Anderson, Luis Gonzalez, Andruw Jones, and Adrian Beltre all had bizarre seasons of extremely high or extremely low production, presumably leading to their steroid suspicion.
Still, the lack of hard evidence leaves these players well below the average taint of players with actual allegations against them. Among active sluggers, David Ortiz and Albert Pujols, who many regard as the greatest clean slugger, are not above suspicion either. As luck would have it, I was playing around with these numbers the day before the Manny Ramirez steroids story broke - he was pulling around 5% - which would have made him one of the more suspected sluggers in the game today.
Of course, these numbers are not hard and fast - a couple of wackos making baseless allegations can significantly increase the % tainted in the table above so there's probably a fairly large variance to these numbers - but of course baseless allegations are exactly the type of thing we are trying to measure.
While I'd really like to see a public opinion poll of baseball fans asking how much they thought a variety of players were helped by steroids, this admittedly flawed method seems to be a decent approximation for the public's opinion on many players. My main concern is my lack of knowledge about Google’s inner workings, and how these percentages might fluctuate based on unknown reasons. Still it’s pretty interesting to see how players stack up. It will be interesting as time goes on, to see how the perception of players change. For some the scandal may fade away, while others may be permanently branded as cheaters. The lists above may give an indication of which players will be which.
| F/X Visualizations | May 22, 2009 |
Optimal Fastball-Changeup Speed Separation
A large part of the success of a changeup is assumed to be based on its deceptive nature. Hitters expect a fastball based on the changeup's delivery and movement, but the pitch is about 10% slower. This throws off the hitter's timing, hopefully causing him to whiff or make poor contact. If this is the case we should expect the success of the changeup to be at least partially based on the difference in velocity between it and the fastballs that precede it. In this post I am going to examine this assumption. Is the success of a changeup tied to this difference? What is the optimal difference is speed?
Josh Kalk examined this question in a slightly different manner, looking at the relationship between the success of a pitcher's changeup over the course of a season and the difference in speed between his average changeup and average fastball. He found a linear relationship with increasing success based on increasing difference. I wanted to take a more granular approach and look at the success of a changeup based on the difference in its speed from the last fastball thrown to the batter, all the fastballs thrown to the batter in that at-bat and all the fastballs thrown to the batter in that game.
Here is the run value of a changeup based on how much slower (release speed) it was than the most recent fastball thrown to the batter in the at-bat the changeup was thrown. Changeups thrown before any fastballs were thrown in an at-bat were excluded from this analysis.
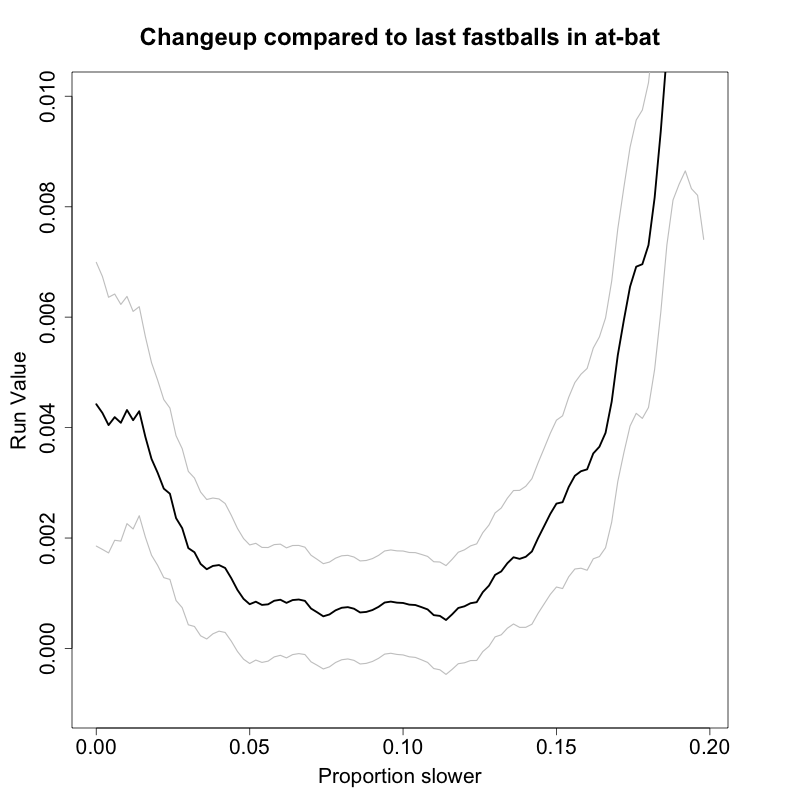
This suggests that the optimal changeup is between 5% and 12% slower than the previous fastball. The gray lines show the standard error. The results are similar if you compare the changeup to all previous fastballs thrown in the at-bat and all previous fastballs the hitter has seen in the game. The results are highly non-linear. There is little difference between throwing a changeup between 5% and 12% slower, but if it is less than 5% or greater than 12% slower the effectiveness rapidly drops off. This rapid drop off it not surprising; changeups that are too fast are effectively slow fastballs and changeups that are too slow don't look enough like fastballs. But, I am very surprised by how flat the graph is between 5% and 12%.
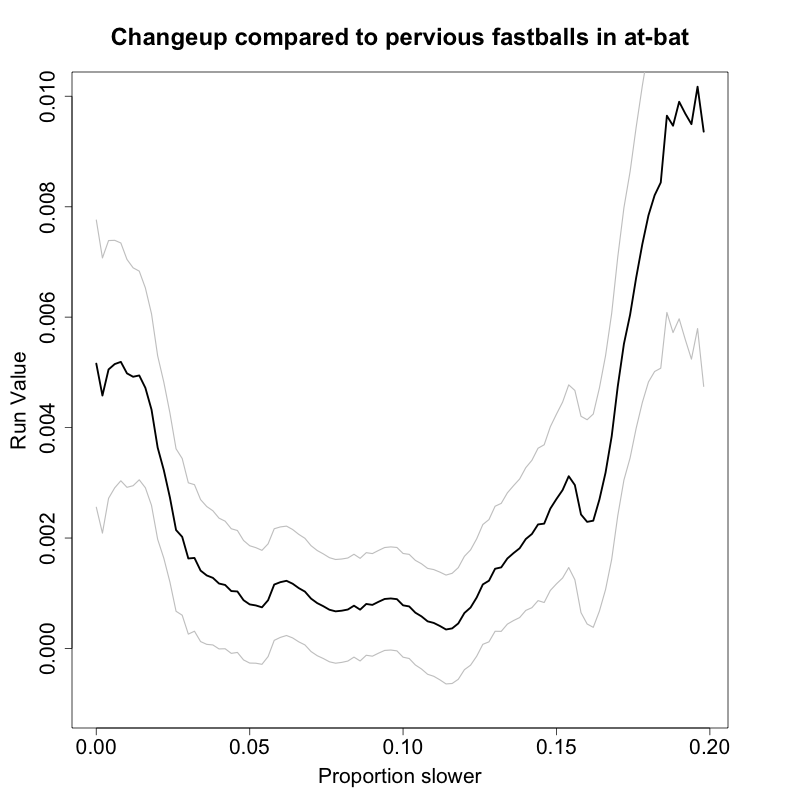
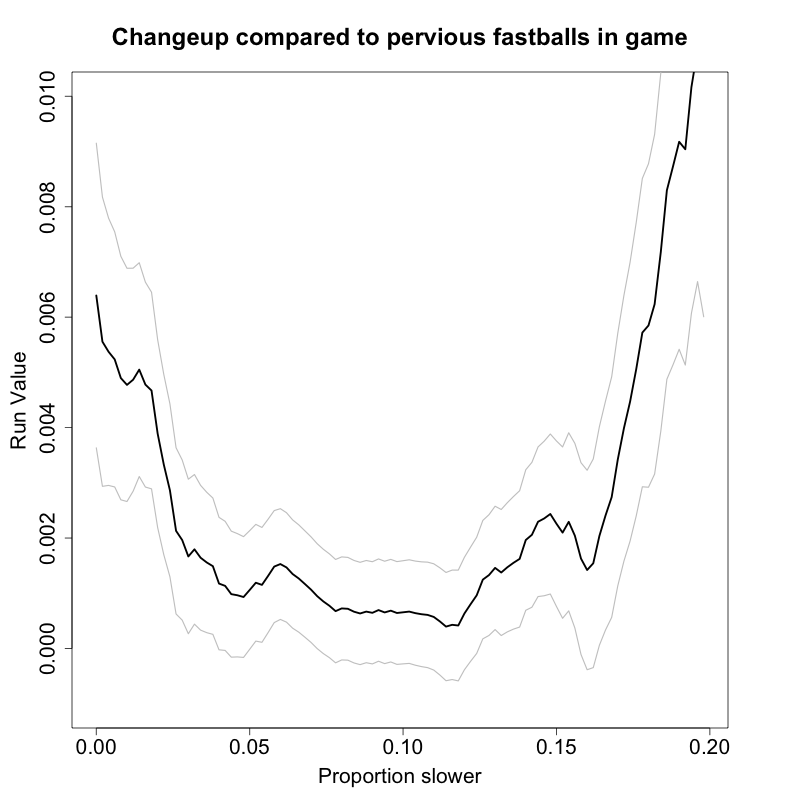
These results are seemingly at odds with Kalk's. He found that pitchers who average only 5 mph difference between their fastball and changeup over the course of a season have less successful changeups than those who average 10 or more mph difference. My results suggest that an individual changeup has about the same success if it is preceded by a fastball that is 5 mph or 10 mph faster. I am not sure how to reconcile these two different conclusions, but I am going to think about it more in the future and welcome any comments.
| Around the Minors | May 21, 2009 |
A Giant Future
We've heard a lot recently about the excellent young pitching that the Giants organization is developing, and rightfully so. The team nabbed two excellent prep arms in the first round of the 2007 draft and both those players - LHP Madison Bumgarner and RHP Tim Alderson - were recently promoted to double-A Connecticut, just two small steps from the Majors.
But that's not all. The Giants organization has a plethora of young, exciting talent, which should be sustainable over the next eight to 10 seasons if the club plays its cards right. It's actually hard to believe how many good prospects there are, given the reputation that the team (and its management) had for almost laughably favoring aging veterans.
This isn't Dusty's team anymore. Or Barry's. With its electrifying mix of young hitting and pitching talent, it just might be the most dominating team in the National League for the next decade... beginning in 2010. Let's take a look at how dominating the San Francisco Giants could be even if it only fielded players originally signed/drafted by the club.
The Ace: Tim Lincecum
Drafted: 2006 1st round (University of Washington)
Born: 6/84 (24)
Pro Experience: Four seasons
MLB Experience: Two years
Notes: The club has about four seasons remaining before Lincecum will be eligible for free agency. Barring some terrible injury, there is no season to expect that the Giants won't lock up this talent long term. Lincecum is durable (227 IP in 2008), he's a proven winner (18 wins last year) and he's dominant (10.19 K/9, 7.5 H/9 MLB career).
The No. 2: Madison Bumgarner
Drafted: 2007 1st round (North Carolina high school)
Born: 8/89 (19)
Pro Experience: 1.2 seasons
MLB Experience: None
Notes: The kid skipped over short-season ball after being drafted and went right to A-ball. He then all but skipped over high A-ball en route to double-A at the age of 19. As an 18 year old, he led the South Atlantic League in wins, ERA, strikeouts and WHIP. The left-hander can touch 97 mph with his plus fastball and the secondary pitches are still improving, which is a scary thought.
The No. 3: Tim Alderson
Drafted: 2007 1st round (Arizona high school)
Born: 11/88 (20)
Pro Experience: 1.4 seasons
MLB Experience: None
Notes: Alderson has a funky delivery that worries some people, but he's always been durable and he has above-average control, as well as plus command of his fastball. He skipped right over low-A ball in his first full season and was one of the best pitchers in high-A ball. Alderson threw 6.2 innings of no-hit ball in his double-A debut recently, but he was pulled because he threw too many pitches while striking out 10 batters.
The No. 4: Matt Cain
Drafted: 2002 1st round (Alabama high school)
Born: 10/84 (24)
Pro Experience: Eight seasons
MLB Experience: 3.4 seasons
Notes: A 24-year-old pitcher that has thrown 200 innings twice and struck out 186 batters in 2008 would probably be a No. 2 or 3 starter for most teams. In San Francisco, though, he projects to be the No. 3 or 4 guy in terms of overall talent and potential. Cain walks too many batters (4.50 BB/9) but he's a durable innings eater. He's signed through 2010, but the Giants organization has an option for 2011, which will take him up until his first free agency year.
The Hopefuls:
Young pitchers Scott Barnes (9/87), a 2008 draftee exceeding expectations, and Clayton Tanner (12/87), a raw Australian hurler, are amongst the names vying for the one available rotation spot.
The Closer: Brian Wilson
Drafted: 2003 24th round (Louisiana State University)
Born: 3/82 (27)
Pro Experience: 4.2 seasons
MLB Experience: 2.1 years
Notes: Considering he was drafted in the 24th round, Wilson has come a long way and he's still developing as a closer despite saving 41 games last season. He's shaved almost 1 BB/9 off his walk rate and he's relying more heavily on a cutter to complement his 96 mph fastball and slider.
The Set-up Man: Henry Sosa
Signed: 2004 Dominican Republic
Born: 7/85 (24)
Pro Experience: 4.7 seasons
MLB Experience: None
Notes: Sosa has shown flashes of dominance in the minors, although he's also struggled with injuries. The right-hander is pretty much a one-pitch pitcher with a dominating mid-90s fastball. If he can improve his curve or change, he could be a closer candidate down the road. In his career, he's holding batters to a .190 average with runners in scoring position.
The Others:
Sergio Romo (3/83) doesn't have top-shelf stuff, but he knows how to use what he's got and he's quite adept at changing speeds. Waldis Joaquin (12/86) is a power pitcher with two potential plus pitches: a mid-90s fastball and a slider. Lefty Joe Paterson (5/86) is the epitome of a LOOGY; he's held left-handed batters to a .126 average and hasn't given up a home run while facing 168 batters (and striking out 67, or 13.11 K/9).
The Catcher: Buster Posey
Drafted: 2008 1st round (Florida State University)
Born: 3/87 (22)
Pro Experience: 0.3 seasons
MLB Experience: None
Notes: Posey went from being drafted 1,496th overall out of high school by the Angels to being taken fifth overall three years later after a solid college career. His time in pro ball has not been too shabby either, as the athletic catcher has a .300 career average. Posey has been creaming lefties to the tune of a .400 average in 40 at-bats. Not many teams can boast that they have a catcher who can hit .300 with 20 homers.
The First Baseman: Angel Villalona
Signed: 2007 Dominican Republic
Born: 8/90 (18)
Pro Experience: 1.7 seasons
MLB Experience: None
Notes: Villalona has moved across the diamond from third base to first base, but his power potential is more than enough for his new position. He's also hitting .314 in high-A ball, although the right-handed hitter is struggling against southpaws with a .225 average. Villalona also struggled against lefties in 2007, so it's something to keep an eye on. If he can learn to hold his own against southpaws, he could hit 30 homers in the Majors. Think David Ortiz in his prime, if everything clicks.
The Second Baseman: Emmanuel Burriss
Drafted: 2006 supplemental 1st round (Kent State University)
Born: 1/85 (24)
Pro Experience: 2.7 seasons
MLB Experience: 1.0 years
Notes: Burriss seized the bull by the horns with an unexpected opportunity last year and he's not looking back, although he did struggle early this season and hit only .182 in April. He's batting more than .400 in May, though. The switch hitter's base-running abilities are a valuable asset to this lineup. Burriss could even slide over to shortstop, his natural position, to make room for Nick Noonan.
The Third Baseman: Pablo Sandoval
Signed: 2002 Venezuela
Born: 8/86 (22)
Pro Experience: 6.2 seasons
MLB Experience: 0.5 years
Notes: With Bengie Molina blocking him behind the plate in San Francisco, Sandoval moved to the hot corner, where he's adequate defensively. Sandoval does not appear to be moving back behind the dish any time soon with Buster Posey on the way. The Venezuelan does not have the traditional power that one expects from a third baseman, but he hits for average and is a smart player. His best position is probably first base, but he cannot compete with Angel Villalona's total package.
The Shortstop: Brandon Crawford
Drafted: 2008 4th round (UCLA)
Born: 1/87 (22)
Pro Experience: 0.3 seasons
MLB Experience: None
Notes: Perhaps the biggest surprise of the 2008 draftees, Crawford was recently promoted to double-A along with 2007 draftees Madison Bumgarner and Tim Alderson. After two good college seasons, he slumped in his draft year when he was unable to get comfortable at the plate and had trouble repeating his swing. San Francisco has smoothed that out for him and his bat is now playing up (.353 career average in 150 at-bats), along with his defense, which includes a plus arm.
Left-Fielder: Roger Kieschnick
Drafted: 2008 3rd round (Texas Tech University)
Born: 1/87 (22)
Pro Experience: 0.2 seasons
MLB Experience: None
Notes: Another good-looking 2008 draftee, Kieschnick is the cousin of former two-way MLB player Brooks Kieschnick (Cubs, Brewers). The younger cousin has good power and has actually hit better than expected in pro ball, including an average above .300 at high-A ball in 2009. Kieschnick just needs to play with more control at the plate and stay back on breaking balls to keep the strikeouts down to a respectable level for a slugger.
Center-Fielder: Fred Lewis
Drafted: 2002 2nd round (Southern University)
Born: 12/80 (28)
Pro Experience: 7.5 seasons
MLB Experience: 1.8 years
Notes: The oldest of the position players on this roster, Lewis was a raw college draft pick that did not earn a full-time MLB gig until he was 27. The premium athlete has the skills needed to produce 20 homers and 30-40 steals, both of which could come with time. Originally a center-fielder, he could return to the position to make room for corner outfielders with more sock in their bats.
Right-Fielder: Nate Schierholtz
Drafted: 2003 2nd round (Chabot College)
Born: 2/84 (25)
Pro Experience: 5.6 seasons
MLB Experience: 0.5 years
Notes: The outfield projects to be the weakest area on the Giants team going forward, but there is some talent nonetheless and Schierholtz can flat out hit. He is a career .300 hitter with good, raw power that does not always show up in-game - but that can come with experience. Schierholtz has a very strong arm in right field.
Jackson Williams (5/86) may never hit more than .220-.240 at the Major League level, but his defense is more than good enough to warrant his inclusion on the roster of the future. Infielder Kevin Frandsen (5/82) was actually putting together a pretty nice career with the Giants before he missed almost all of 2008 after blowing out his Achilles tendon. Nick Noonan (5/89) was a supplemental first round pick in 2007 and is in line as the Giants' second baseman of the future. He'll have to wait his turn, though, with Burriss already holding down the fort. Outfielder Eddy Martinez-Esteve (7/83) was considered a top prospect at one time, but injuries and defensive inefficiencies have all but extinguished that talk. He still possesses a solid bat, though, and could be an excellent pinch hitter.
| Change-Up | May 20, 2009 |
Depth for Depth's Sake or a DH?
Last night the Boston Red Sox defeated the Toronto Blue Jays 2-1 to pull within 2.5 games of the division leaders from north of the border. The story of the game was the return to the lineup of one David Ortiz, who had sat out the entire Red Sox series in Seattle over the weekend. The Boston faithful stood and cheered wildly in support of Big Papi each time he came to the dish. Chants of "Papi" and standing ovations, however, couldn't seem to pull the big slugger out of his slump (sleepwalk? death march?).
He was 0-3 with two strikeouts and two men left on base. Ortiz is now batting .203/.317/.293. His wOBA of .279 trails all but Ty Wigginton among American League Designated Hitters. While it would be nice to chalk Papi's problems to a mere slump, something that will work itself out - it's only May 20 after all - it's becoming difficult to imagine a return to form for Ortiz. We saw chinks in the armor last post-season when Ortiz, one of the most celebrated clutch performers in baseball history, managed to hit just .186. His bat has been slower, his approach clueless for some time now.
Despite this, Boston finds itself just four games out of the best record in all of Major League Baseball. All the while, Daisuke Matsuzaka, Kevin Youkilis and Dustin Pedroia have battled injuries, Jed Lowrie has been out for almost the entire season and Josh Beckett and Jon Lester have posted ERA+ figures of 85 and 77, respectively. Brad Penny has been worse than both of them. Boston's starting pitching ERA is 5.76, tied with Baltimore for very worst in the American League.
Fortunately for the Red Sox, there is reason to believe things will get better on the pitching front. If you're to believe Fielding Independent statistics, Lester and Beckett have been among the unluckiest pitchers in baseball. Both hurlers' peripherals look solid. Moreover, Youkilis returns to the Boston lineup tonight and Matsuzaka makes his first start since April 15th on Friday night. All around their Designated Hitter, things are looking up for Boston.
Working in their favor, it's not like the Red Sox have no recourse for dealing with their little Papi problem. Their pitching depth is the envy of Major League Baseball. That so many quality pitchers sit in the organization, many without prominent or even Big League roles, borders on absurdity. This is particularly so in the presence of a gaping hole at DH. Let's run through Boston's pitching depth.
How would this starting rotation look?
                  IP    H   BB  SO  ERA
Masterson        41.1  45   14  35  4.57
Penny            36.1  45   16  20  6.69
Buchholz (AAA)   39.1  23   12  42  1.60
Bowden (AAA)     42.0  19   16  28  0.86
Tazawa (AA)      43.1  38   13  42  3.12
It might not light the world on fire, but it would probably stand up favorably to how Boston's starting pitching unit has fared to date (remember the 5.76 ERA), a unit good enough to stake the Red Sox to a 23-16 record. This rotation, the one that might improve upon the 23-16 team's pitching to date, would leave Beckett, Lester, Matsuzaka, Tim Wakefield and John Smoltz out of the mix. Assuming Smoltz's rehab goes as planned (his rehab clock will be set to expire June 19), Boston would have ten quite legitimate Major League starters.
The depth is even more ridiculous in the bullpen. Prior to the season, in Fort Myers, Bill James told me that the Red Sox had the best bullpen on paper that he had ever seen. He was also quick to caveat that the best bullpen on paper means next to nothing given the unpredictability that comes with forecasting 50-80 innings worth of pitching. Still, James's commentary has proven prescient. Even with Masterson sliding into the rotation, Boston's 3.00 bullpen ERA trails only Kansas City's in the American League.
Jonathan Papelbon, Ramon Ramirez, Hideki Okajima, Manny Delcarmen, Takashi Saito and Daniel Bard are all worthy of pitching high leverage situations right now. And remember, with Clay Buchholz dealing in Pawtucket, Dice-K coming back and Smoltz beginning his rehab, that means there will be another relief arm or two whom Terry Francona can feel comfortable using in a big spot. At the very least, you can add Justin Masterson to that mix. Assuming good health, here is what the Boston pitching staff will probably look like one month from now:
Starters
Beckett
Lester
Matsuzaka
Wakefield
Smoltz
Relievers
Papelbon
Okajima
Ramirez
Masterson
Delcarmen
Saito
Bard
This leaves out Buchholz, Michael Bowden and Penny. Junichi Tazawa, too, if you want to accept the premise that it is likely that he is ready for Major League action. Still, look at that list. While depth is desirable given the unpredictable nature of pitcher health and effectiveness, you simply do not need your bottom three relievers to be as effective as Boston's will be - particularly with three or four pitchers left off the roster who would be of great use to other Big League clubs.
***********
All of this brings me back to Ortiz. Smoltz's rehab expiration of a month or so from now offers the Red Sox a nice timetable to evaluate their options. If Smoltz looks strong, they have lots of options. If Brad Penny improves, they have even more. If Smoltz has a setback, Penny continues to struggle and say, Beckett and/or Dice-K have a DL stint, that pitching depth may need to be tapped. And finally, maybe there is some way Ortiz regains his stroke. Then there is less urgency to look to do a deal.
But let's assume that things go reasonably smoothly for Smoltz and that he joins the rotation. Let's also assume that Buchholz and Bowden continue to pitch like MLB contributors and that the bullpen effectiveness keeps up from top to bottom. And finally, we'll assume that Ortiz is, as so many of us suspect he may be, finis. Then it's time for the Red Sox to look around. What follows are some of their potential options.
Sports Radio Caller Pipe Dreams?
Would the Mets consider a deal of Mike Lowell, Buchholz, Masterson and Delcarmen for Wright? Maybe not, but the third baseman seems to be under-appreciated in the Big Apple at times and New York could use some young arms to help in the bullpen and back of the rotation.
I understand that you might have to empty your farm system for either of these two players. But both guys just might be worth it. I can't imagine a package Florida or Minnesota could ask that I would not listen to if you put me in charge of the Red Sox. The only problem is that neither team may listen long enough to even entertain a deal.
Proven Producers on Teams Going Nowhere
After a slow start, he has been excellent in May and Oakland appears to be headed for another disappointing season. He is a free agent at year's end, so Billy Beane's ask might be manageable.
Berkman is signed through 2010 (with a '11 club option and a $2M club buyout) but given that Houston is in last place and sports what is arguably the league's worst farm system, Drayton McLane and Ed Wade would be wise to consider a fire sale sooner rather than later. Did I mention Russ Ortiz takes a regular turn in their rotation.
A Good Ol' Value for Value Baseball Deal
Mike Scioscia sure doesn't seem to value him the way the Red Sox might. I wonder what the Angels would want in return for him? Seems to me the Red Sox have the arms to get something done.
Colorado still seems to want Yorvit Torrealba getting innings, which makes me think that the right package could net Boston the young slugging catcher. Boston could DH Iannetta for a year, maybe two depending on what happens with Jason Varitek, and then slide him behind the dish longer term.
Less Pricey, Stop Gap Solutions
The White Sox seem down and out but Dye and Thome continue to produce. Both would come with favorable contract situations, too.
He has struggled in May and of all people, Andruw Jones is coming on strong and seems to be taking playing time away from him in Texas. Moreover, we all know how much Nolan Ryan would like to beef up his pitching arsenal.
Oakland may not wish to part with the cost-controlled, steady producer but for the right package, how long can you hold the line for a one-tool player like Cust?
Don't laugh, the Nationals first baseman that could never stay healthy has already played 38 games this year, as many as he played all of last season. His .438 on-base would look great in the Boston line-up and getting him off the field and into the DH role would only increase his chances of staying healthy. He's in the final year of a regrettable Nationals contract and Washington is going nowhere. He has to be there for the taking.
**********
Boston doesn't have to do a deal, of course. Dozens of players within the organization would represent an upgrade over Ortiz's production if slotted into the DH role and as I have mentioned numerous times, the Red Sox are obviously still a good team despite their gaping hole in the middle of the batting order. I also respect the political considerations that factor into such a deal. But given their pitching surplus and obvious upgrade opportunity, why not go for it? Their financial advantages and proven drafting acumen should allow Boston to undergo whatever restocking efforts a bigtime deal would necessitate, anyway.
| Touching Bases | May 19, 2009 |
HitTracker F/X
What happens when you combine Hit Tracker data with Pitch f/x data? You get a whole lot of data.
First, I looked at batter age in relation to standard home run distance. Standard home run distance is the distance a home run would travel in neutral conditions if it were to land at field level. My sample contains data on home runs from 2007 and 2008, totaling nearly 10,000 data points.
It appears to me that the age 25-29 peak holds true. I had data on 16 homers hit by players before their 21st birthday and the average distance was 420 feet. This is because Justin Upton is an absolute monster. The oldest grouping of players is likely biased since players who maintain the ability to hit home runs at that age are almost entirely power-happy first basemen and designated hitters. That group will be lighter on lighter-hitting middle infielders than the younger groups.
There are about 500-1000 home runs per grouping, which leaves it prone to skewness. Albert Pujols and Adam Dunn were born two months apart and their tremendous power probably contributed to the large break between ages 28-29 and 29-30.
Next up I graphed standard distance against a batter's weight. It’s a standard assumption that heavier players have more raw power. And even though listed player weights are some of the more unreliable baseball data available, the relationship is still undeniable.
Less obvious is the relationship between home run distance and batter height. Yet the trend is just as distinct.
When it comes to raw power, short players are at a greater disadvantage than light players while heavy players are at a greater advantage than tall players.
All of our assumptions about quantifiable measures that contribute to a batter’s power seem to hold true. Age, height, and weight are important in determining power. With pitch f/x data, we can also see what effects pitchers have on home run distance. This is getting into Defensive Independent Pitching Statistics theory. Max Marchi wrote a couple of great articles combining hit location and pitch f/x data. A good chunk of gameday data from 2007 did not have pitch f/x data, so I am working with closer to 7,000 home runs.
One would think that pitch velocity plays a part in determining how hard a ball is hit. To compare apples to apples, I used Hit Tracker’s speed off bat measure instead of standard distance.
It looks to me like pitch velocity is insignificant. Perhaps on the slowest of pitches, the ball doesn’t receive the same force off the bat, but every group faster than 80 miles per hour generates a speed off bat within half a mile per hour of each other. That’s nothing.
I wanted to see if there were any balls that left the pitcher’s hand with a greater velocity than that which they flew off the bat. There were about a dozen cases, with the biggest disparity in velocity coming on a 345-foot, 96 mile per hour Carlos Pena homer off a 99 mile per hour A.J. Burnett fastball.
Now, if I were Dave Allen I would come up with some awesome heat charts to demonstrate the relationship between pitch location and standard distance. I am not. But I do have bar charts. Here is pitch height plotted against standard distance.
I’m 6’2” and the top of my knee is exactly two feet high. Meanwhile, the top of my belt would be 3.5 feet high, but there just aren’t that many homers hit in the top layer of the strike zone. It would appear that home runs are hit the farthest on pitches at or around the knees. I’m not a physicist, or a physician for that matter, but I believe there are two factors a batter can control in how far he hits the ball: force and trajectory. I decided to break these down by pitch height.
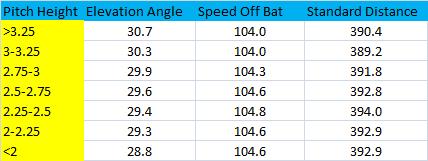
Batters hit the ball hardest on pitches down in the zone. But the elevation angle—which is defined by Hit Tracker as the angle above horizontal at which the ball left the bat, in degrees—might actually determine why balls fly farther when batters go down to get them. The increase In elevation angle is uniform, and in general the lower the elevation angle, the higher the home run distance. The correlation coefficient between the terms is -.25. Furthermore, there is a correlation coefficient of -.5 between elevation angle and speed off bat, which affirms that batters want to get on top of the ball, so to speak. Of course, the reason for the negative correlation between home run distance and pitch height could actually be the horizontal launch angle. Maybe low pitches are easier to turn on than higher pitches.
I broke down horizontal pitch location by batter handedness.
This is from the batter’s perspective, so pitches 2-6 inches from the center of the plate (on the right) are outside to right-handed batters.
I’m extremely surprised to see that batters hit pitches outside farther than they hit pitches inside.
I incorporated pitcher handedness as well as home run field location to find the differences in platoon splits.
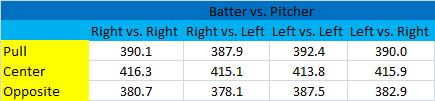
Lefties not only hit longer homers on outside pitches than righties, but they also hit longer opposite-field home runs. These two points are probably intertwined. Other than that, I don’t see anything notable in platoon splits.
Finally, I looked at the count’s effect on home run distance. I might have saved the best for last, as there is quite a clear relationship, which strongly signifies a change in hitter approach.
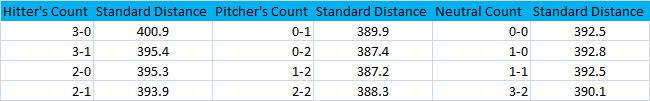
On 3-0, hitters get better pitches to hit and might even swing harder when they choose to let it fly, and with two strikes hitters get worse pitches to hit and might shorten their swing to protect the plate. Again, this is selective sampling. Batters will only hit home runs on decent pitches. And pitchers are even more likely to throw fastballs over the heart of the plate when behind in the count than they are when ahead.
Thanks to Greg Rybarczyk and MLB for making all this wonderful data freely available.
| Baseball Beat | May 18, 2009 |
Process vs. Results
Our 16-team fantasy baseball league held its first replacement draft on Sunday night. Each team is allowed to drop and add two players. With five solid starters (Josh Johnson, Kevin Slowey, Ricky Nolasco [patience, patience], Scott Baker [patience, patience...or so I tell myself], and Paul Maholm) and perhaps the two best pitching prospects (Tommy Hanson and David Price) waiting in the wings, I really wasn't in need of a starter. However, I wanted to do my due diligence anyway and decided to check out a handful of available pitchers.
The "hottest" — if not best — free agent starter was probably Matt Harrison, who had recently tossed 22 consecutive scoreless innings and two straight complete game victories. Having never seen him pitch before, I checked out his last two starts on MLB.TV. Unlike MLB Extra Innings, you can go back and watch archived games on MLB.TV. As such, MLB.TV is a great source for scouting players.
Going in, I knew that Harrison was drafted by the Atlanta Braves and was the organization's top pitching prospect before he was traded, along with catcher Jarrod Saltalamacchia, pitchers Neftali Feliz and Beau Jones, and shortstop Elvis Andrus, to the Texas Rangers for Mark Teixeira and Ron Mahay in July 2007. (How is that trade working out for the Braves now? According to Baseball America, Salty, Andrus, and Harrison were the Braves' top three-ranked prospects in 2007. All three have contributed to the Rangers currently being in first place. Feliz (ranked 18th at that time) may have the highest ceiling of them all, if he can learn to command his outstanding stuff. Meanwhile, Atlanta basically has Casey Kotchman, acquired from the Angels for Teixeira a year later, to show for this lopsided deal.)
Here is what Baseball America had to say about Harrison two years ago:
The Braves cited Harrison as their breakthrough pitcher of 2005, and he maintained his momentum in 2006. He led Atlanta farmhands in ERA, reached Double-A before he turned 21 and now ranks as the system's top mound prospect. It seems like every quality lefthanded pitching prospect must be likened to Tom Glavine, but that comparison seems more legitimate when applied to Harrison. He's adept at using both sides of the plate and altering the batter's eye level. He delivers a heavy fastball between 89-92 mph and does an excellent job keeping it down in the zone. His above-average curveball breaks at times like a slider. Harrison also has a plus changeup that he uses at any time in the count. Harrison admits he gave Double-A hitters too much credit and wasn't aggressive enough following his midseason promotion. He needs to continue to learn how to mix his pitches in order to keep batters off balance. Harrison, who has No. 3 starter potential, could open 2007 in Triple-A, where he'd be knocking on the door to the big leagues.
Based upon my observations from Harrison's starts vs. the White Sox on May 8 and the Mariners on May 14, the above comments generally still hold true. His fastball, which he throws about two-thirds of the time, sat at 89-91 and touched 92 (with the two-seamer in the high-80s and the four-seamer in the low-90s). It appeared to me that Harrison was also throwing more of a cutter than what Fangraphs classifies as a slider, but it could be as much semantics as anything else. The pitch in question had a late, short break to it and was typically hitting 85-86. He also throws a changeup, which was mostly 78-79 according to the reports on the TV but has averaged 81.6 according to Fangraphs.
Harrison reminded me of Joe Saunders, a pitcher I've seen in person several times and on TV in dozens of games over the past few years. First of all, both pitchers are lefthanders. Secondly, they have somewhat similar builds (Harrison is slightly taller and stockier but they are within an inch and 10-15 pounds of each other). Thirdly, they have a similar repertoire (fastball, slider/cutter, and changeup). Fourthly, Harrison and Saunders throw their pitches at similar speeds. Lastly, they both have induced groundballs at an almost identical rate (Harrison 46.4%, Saunders 46.7%).
All of the above got me to thinking that the scouting reports — which, thanks to resources like pitch f/x, can now be quantified more accurately than ever — are perhaps a better predictor of performance than the pure stats. In other words, we may be coming full circle. The difference is that we might not have to rely mainly on the opinions of men sitting behind home plate wearing straw hats, holding radar guns, and reducing their findings to notes on index cards — at least in cases where ballparks have the necessary equipment installed. Instead, all of us can scout pitchers based on objective data (pitch types, speeds, locations, vertical and horizontal breaks, and arm angles) with more precision than ever.
For me, I would rather focus on the process than the results in almost any walk of life. In the case of identifying comparable pitchers, give me a same handedness hurler with a similar body type, pitch arsenal, speeds, and breaks, and I would value this information more highly than even the pitcher-independent stats (meaning K, BB, and HR rates), which have become all the rage among performance analysts this past decade.
In my opinion, the fact that lefthanded and righthanded pitchers with dissimilar builds, pitch types, speeds, etc. have similar stats has little or no meaning when it comes to predicting performance. Look for those projection systems that incorporate these micro details in the future to gain more traction than those that stick to the results only.
Oh, I almost forgot. I didn't take Harrison. Instead, I drafted Ian Stewart and Alberto Callaspo. These picks came down to needs for a team that lost Alex Gordon to a major injury less than two weeks into the season and now is facing the possibility of being without Rickie Weeks for an extended period. I have Brandon Wood on my team, but Mike Scioscia apparently prefers Erick Aybar, Chone Figgins, and Maicer Izturis over the 24-year-old über prospect hitting .347/.434/.806 with NINE home runs in 19 games at Triple-A.
| Behind the Scoreboard | May 16, 2009 |
Do Hitters Change Their Approach During a Hitting Streak?
As I am sure everybody has heard, Ryan Zimmerman recently completed a 30-game hitting streak, putting him alongside 52 other players in the history of baseball who have hit in 30 consecutive games or more. The streak was a nice bright spot in another otherwise dismal season for the Nationals, but unfortunately, as so often happens, the streak ended right as he began to gain national recognition for hitting in 30 straight games.
Thirty games is a kind of marker of when a streak really becomes serious. The national media start paying attention, the fans begin to invest in it, and the pressure really starts to build for the player. Nobody takes notice of a 10-game streak and few recognize a 20-gamer, but when player he approaches and reaches 30 games, it becomes serious. My question is how having a serious streak changes a player's performance. This will be the last in a three-post “streak” of posts about streaks.
As I said earlier, there have been 53 such streaks in the history of baseball. First, let's take a look at how they break down.
As you can see, a lot of the streaks were broken up after either the 30th or the 31st consecutive game. Is this some evidence that players buckle under the pressure of a high profile streak? Let's try to fit a theoretical model to the data and see if theory fits reality, or if something else may be going on. One would think the data would take shape of the following: y = 53 * (a ^ (x-30)), where x is the length of the streak, y is the number of players completing an x length streak, and a is some coefficient to be fit by the model, basically representing the probability of continuing the streak an additional game. When the model is fit, we find a=.755, meaning that all things being equal, the probability of continuing a 30+ game streak an additional day is about 75.5 percent. Let's look at the graph to see how well it fits.
As you can see, the model slightly over estimates the chances of extending the streak to 32 games, but underestimates the chances of extending the streak to around 40 games. It also predicts an exceedingly low probability of a 30-game streak reaching 56 games (1 in 1500), when in fact one did occur. Is this just an artifact of chance, or is there something going on? Largely due to DiMaggio, a chi-square test strongly rejects the theoretical model. However, if we put DiMaggio in a "46 games and over" category, we still find that the model fits only marginally well, with a p-value of .12.
The difference between the real data and the model is basically that instead of having the same probability of continuing the streak in each subsequent game, the real data seems to suggest that probability of continuing the streak gets higher as the streak goes on. However, this is largely due to the fact that a player who has hit in 40 consecutive games is likely to be better than one who has hit in 30 consecutive games. Indeed, the three-season average of hits/plate appearance was .287 for those who had streaks between 30-34 games, but the H/PA was .301 for those who had streaks of 35 games and higher. So while an unknown player with a 40-game hit streak is more likely to extend his streak than an unknown player with a 30-game hit streak, it's unclear whether the chances differ for a specific player.
Perhaps more interesting is to compare players' overall statistics to their performance while they have a 30+ hit streak brewing. Do players change their approach to try to extend the streak? If so, we might expect to see less walks and less homers during the pressure filled portion of the streak. Also, what happens to their overall batting average? Obviously, these players are "hot," but they are also under a lot of pressure and pitchers may especially bear down to try to get them out. The comparison in BAV, HR/PA, unintentional BB/PA, and IBB/PA are listed below (the expected values are based on three-season averages weighted for the number of games over 30 that each player had his streak going).
As you'd expect, players with streaks have a good batting average at .303. They also don't homer much, clocking in at .022 HR/PA, which is good for 13 HR's over the course of a 600 PA season. As you'd expect, they also don't walk much, as they're OBP is only .358 - not great considering a .303 BAV. Below, we can take a look at the comparison of total stats vs. the stats during games in which a player had a 30+ game streak (including the game where the streak was broken).
Perhaps the most surprising thing is the fact that the batting average during games where a player has a streak going is 20 points lower than his usual batting average. This statistic has a high standard error (.026), so due to small sample size, it's hard to prove anything with statistical significance, but it's still interesting. It certainly blows a hole in the "hot hand theory" (which of course has been done many, many times before), but does give some credibility to the theory that pitchers are bearing down and/or pitching carefully to hitters with a streak.
The batters, for their part, seem to be taking 25% less walks with a streak on the line (again, not enough power to prove statistical significance however), which is good for the streak, but bad for the team. However, if it comes down to the late innings and the player is without a hit, it makes sense that he would hack away when a walk would likely end the streak.
While it might be sporting to avoid intentionally walking a player with a long hit streak, pitchers don't seem to care, and actually intentionally walked hitters more than expected (where we expected 2 IBB, there were actually 6). So, while Nats fans may have been angry when Zito intentionally walked Zimmerman in the 7th inning with the streak on the line, it wasn't unprecedented. The increase in intentional passes is probably due to a perception that the player with the streak is "hot" and more dangerous than usual, even though a look at these statistics will show that pitchers have no reason to worry.
While more data (and thus more streaks) are needed to draw hard conclusions, preliminary evidence shows that players may have a tough time getting hits with the streak on the line, and while their power remains the same, they do tend to walk less. So while it may be exciting to watch your favorite player with a long hit-streak, there is some evidence that the effect may not be as positive for your favorite team.
| F/X Visualizations | May 15, 2009 |
What Does a Fastball Hitter Look Like?
So far most of the pitchf/x analysis has focused on the pitcher, but each at-bat says just as much about a hitter as it does a pitcher. Thus, the pitchf/x data offers a wealth of information about batters that is currently underutilized. There have been some exceptions: Max Marchi's look at how the location in the zone of a hit pitch correlates with the location in the field of the resulting ball in play and Josh Kalk's look at how different hitters respond to first pitch fastballs. There have also been some great pitchf/x analyses of individual hitters: Jeremy's look at Micah Owings as a hitter, Trip Somers' look at Nelson Cruz's plate discipline and Mike Fast's examination of Jack Cust's performance against fastballs. In this post I want to continue this application of pitchf/x data to hitter analysis.
You often hear certain hitters referred to as 'fastball hitters.' I wanted to see if this is justified. Is there a certain subset of batters who do particularly well against fastballs? The stereotype is that fastball hitters are high strikeout, HR hitters. Is this the case? More generally, what can we say about the offensive performance of good fastball hitters versus good non-fastball hitters.
For every hitter in the pitchf/x database I found the average run value for all fastballs and all non-fastballs thrown to him during part of 2007 and all of 2008 (the pitchf/x system was added incrementally to different ballparks during the 2007 season). Here are the leaders and laggards:
+-------------------+--------+------------+-------------------+--------+------------+
| Name              | num FA | FA run val | Name              |num nFA |nFA run val |
+-------------------+--------+------------+-------------------+--------+------------+
| Albert Pujols     |   1973 |     0.0348 | Jody Gerut        |    412 |     0.0332 |
| Shin-Soo Choo     |    813 |     0.0313 | Lance Berkman     |   1284 |     0.0329 |
| Mark Teixeira     |   2657 |     0.0260 | Manny Ramirez     |   1351 |     0.0311 |
| Chipper Jones     |   2068 |     0.0251 | Magglio Ordonez   |   1121 |     0.0309 |
| Jack Cust         |   2337 |     0.0229 | Chris Davis       |    480 |     0.0298 |
| Alfonso Soriano   |   1545 |     0.0223 | Vladimir Guerrero |   1525 |     0.0290 |
| David Ortiz       |   1938 |     0.0217 | Milton Bradley    |    891 |     0.0272 |
| Josh Hamilton     |   1687 |     0.0217 | Nomar Garciaparra |    708 |     0.0261 |
| Carlos Quentin    |   1242 |     0.0215 | Alex Rodriguez    |   1147 |     0.0258 |
| Ryan Howard       |   2030 |     0.0210 | Matt Holliday     |   1178 |     0.0213 |
+-------------------+--------+------------+-------------------+--------+------------+
| Omar Vizquel      |   1227 |    -0.0178 | Craig Monroe      |    564 |    -0.0162 |
| Nomar Garciaparra |    936 |    -0.0180 | John McDonald     |    495 |    -0.0167 |
| Jose Molina       |    894 |    -0.0199 | Brad Ausmus       |    427 |    -0.0171 |
| Carlos Gonzalez   |    625 |    -0.0204 | Adam Kennedy      |    534 |    -0.0176 |
| Chris Burke       |    892 |    -0.0205 | Brandon Inge      |   1062 |    -0.0179 |
| Tony Pena         |    894 |    -0.0218 | Jacque Jones      |    605 |    -0.0180 |
| John McDonald     |   1026 |    -0.0236 | Yorvit Torrealba  |    715 |    -0.0204 |
| Omar Quintanilla  |    638 |    -0.0260 | Endy Chavez       |    429 |    -0.0230 |
| Andy LaRoche      |    686 |    -0.0261 | Corey Patterson   |    653 |    -0.0267 |
| Wily Mo Pena      |    549 |    -0.0290 | Tony Pena         |    504 |    -0.0348 |
+-------------------+--------+------------+-------------------+--------+------------+
Of course the leaders of both lists are going to be amazing hitters, this is almost by definition since we searched for the best fastball and non-fastball hitters. But there are some interesting names among the leaders, with Shin-Soo Choo surprisingly the second best fastball hitter in the pitchf/x era. Amazingly Jody Gerut was the best non-fastball hitter. Nomar Garciaparra was a great non-fastball hitter and a horrid fastball hitter. The laggards are mostly no-hit middle infielders and catchers. Tony Pena and John McDonald, mercilessly, end up on both laggard lists.
About 60% of pitches thrown are fastballs so the overall performance (against all pitches) of the best fastball hitters should be better than the overall performance of the best non-fastball hitters. That is the case: they have a higher walk rate (13% versus 11%), a higher HR per fly rate (21% versus 17%) and a higher OPS (.942 versus .920). The non-fastball hitters strike out less (16% versus 18%) and have a higher batting average of balls in play (.337 versus .322). This begins to bear out the stereotype that fastball hitters tend to be high K, high HR hitters. But I don't consider Albert Pujols a fastball hitter, he is an all around amazing hitter. I think a better metric of "fastball hitterness" is the difference between the average run value of fastballs and a non-fastballs thrown to a given hitter. Here are the leaders (perform better versus fastballs) and laggards (perform better against non-fastballs) for this metric.
+-------------------+--------+------------+------------+------------+
| Name              |    num | run val FA |run val nFA |        dif |
+-------------------+--------+------------+------------+------------+
| Shin-Soo Choo     |   1369 |     0.0313 |     0.0004 |     0.0309 |
| Jack Cust         |   4224 |     0.0229 |    -0.0027 |     0.0256 |
| Gary Matthews     |   3209 |     0.0099 |    -0.0144 |     0.0242 |
| Brandon Moss      |   1067 |     0.0069 |    -0.0149 |     0.0218 |
| Travis Hafner     |   2060 |     0.0089 |    -0.0128 |     0.0217 |
| Brian Schnieder   |   1662 |     0.0059 |    -0.0153 |     0.0212 |
| Reed Johnson      |   2101 |     0.0089 |    -0.0123 |     0.0211 |
| Michael Young     |   4299 |     0.0097 |    -0.0113 |     0.0211 |
| Chris Young       |   3910 |     0.0107 |    -0.0093 |     0.0200 |
| Jason Bay         |   3378 |     0.0164 |    -0.0031 |     0.0196 |
+-------------------+--------+------------+------------+------------+
| Mike Jacobs       |   2296 |    -0.0045 |     0.0198 |    -0.0243 |
| Austin Kearns     |   1859 |    -0.0126 |     0.0121 |    -0.0247 |
| Willie Bloomquist |   1295 |    -0.0128 |     0.0133 |    -0.0261 |
| Clint Barmes      |   1505 |    -0.0100 |     0.0171 |    -0.0271 |
| Kenji Johjima     |   2718 |    -0.0174 |     0.0103 |    -0.0277 |
| Omar Infante      |   1441 |    -0.0139 |     0.0156 |    -0.0295 |
| Chirs Davis       |   1143 |     0.0001 |     0.0298 |    -0.0297 |
| Omar Quintanilla  |   1012 |    -0.0260 |     0.0039 |    -0.0300 |
| Jody Gerut        |   1249 |    -0.0005 |     0.0332 |    -0.0337 |
| Nomar Garciaparra |   1644 |    -0.0180 |     0.0261 |    -0.0442 |
+-------------------+--------+------------+------------+------------+
A casual glance confirms our picture of fastball hitters as high strikeout, high power guys (Chris Davis seems really out of place among the non-fastball hitters). But it is hard to make any conclusions about what fastball hitters are like generally because fastball hitters are on average better hitters (since most pitches are fastballs). The measure of fastball hitterness (average fastball run value minus average non-fastball run value) is positively correlated with almost any offensive measure: HR per fly, BB rate, OBP, SLG, wOBA, BABIP, LD%. What I need to do is compare fastball hitters against non-fastball hitters who are just as good, and see in what respects they differ.
In order to make this comparison I am going to look at the relationship between a hitter's fastball run value minus non-fastball run value and a number of offensive metrics (K rate, HR per fly, BABIP, BB rate, GB%, LD%) relative to the hitter's overall offensive level. I use wOBA as my measure of a hitter's offensive level (wOBA, another TangoTiger creation, is one of the best metrics of a player's offensive value). The first thing to do is find the linear relationship between wOBA and all these measures (it is positively correlated with just about any meaningful offensive metric). Then for each batter I look at the difference between his value for a given measure and that expected based on his wOBA. This gives the hitter's performance for that measure relative to his overall offensive level.
An example would be helpful. The graph below displays the relationship between wOBA and walk rate. Generally the more a player walks the higher his wOBA, as you can see by the trend line I drew in. For each hitter I calculate the residual, which is how much more or less that player walks compared to his wOBA peers. The red line is the residual for Jermaine Dye. He walked 3.4% less than expected based on his wOBA, so his residual is -0.034. The blue line is Gregor Blanco who walked much more than his wOBA would suggest, so his residual is 0.059. The green dot is Carlos Quentin. His residual is just below zero.
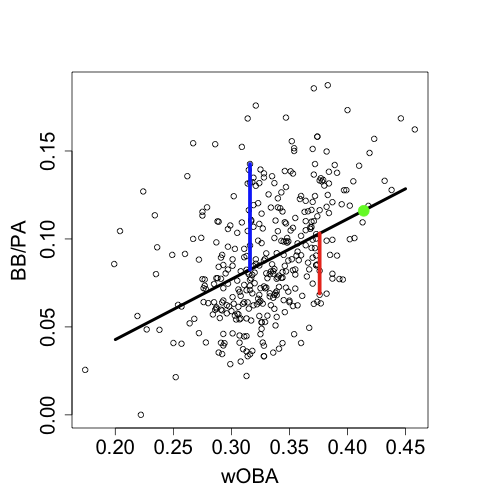
These residuals tell me if a player gets a greater than average amount of his offensive value from walks (like Blanco), or on the other hand if he gets less value from walks and gets his excess value elsewhere (like Dye does with his power). I calculated these residuals for all the offenses measure mentioned above. Now I am ready to see if fastball hitters get their value from walks, home runs, avoiding strikeouts (contact skills), having a high BABIP, or anything else by seeing the how my "fastball hitterness" correlates with each of these residuals.
The results confirm our initial assumptions. There is a strong positive correlation between fastball run value minus non-fastball run value and the HR per fly, BB% and K% residuals. So hitters who perform better against fastballs than non-fastballs hit more HRs, take more walks and strikeout more than the average hitter of the same offensive level. Fastball hitters tend to be power hitters. This would suggest that pitchers should throw fewer fastballs to power hitters, which is exactly what they do. It seems MLB pitchers knew all of this already, but I am happy to confirm for them.
| Designated Hitter | May 14, 2009 |
Johan Santana's Fast Start in PITCHf/x
Johan Santana - have you heard of him? He's pretty good. The man is the ace of the Mets, was the ace of the Twins, and is one of the best left-handers in the game. He does it with a consistent, metronomic delivery that pumps out four difficult pitches.
| cfx | # | lhh | rhh | mph | pfx_x | pfx_z | deg |
| Change-up (CU) | 1427 | 152 | 1275 | 81.2 | 7.0 | 6.8 | 134.6 |
| Two-seam fastball (F2) | 1022 | 166 | 856 | 92.0 | 7.6 | 7.8 | 135.7 |
| Four-seam fastball (F4) | 1992 | 645 | 1347 | 92.2 | 5.4 | 10.2 | 152.1 |
| Slider (SL) | 582 | 322 | 260 | 84.5 | 0.5 | 3.6 | 171.3 |
Notes: PITCHf/x data from Gameday, classifications by the author ("cfx"); data covers 2007 (partial), 2008 and 2009; mph is the average speed at 55 ft. from the back of home plate; pfx_x and pfx_z are the lateral and vertical deviation from the path of a spin-less ball (inches); deg is the angle of the spin axis
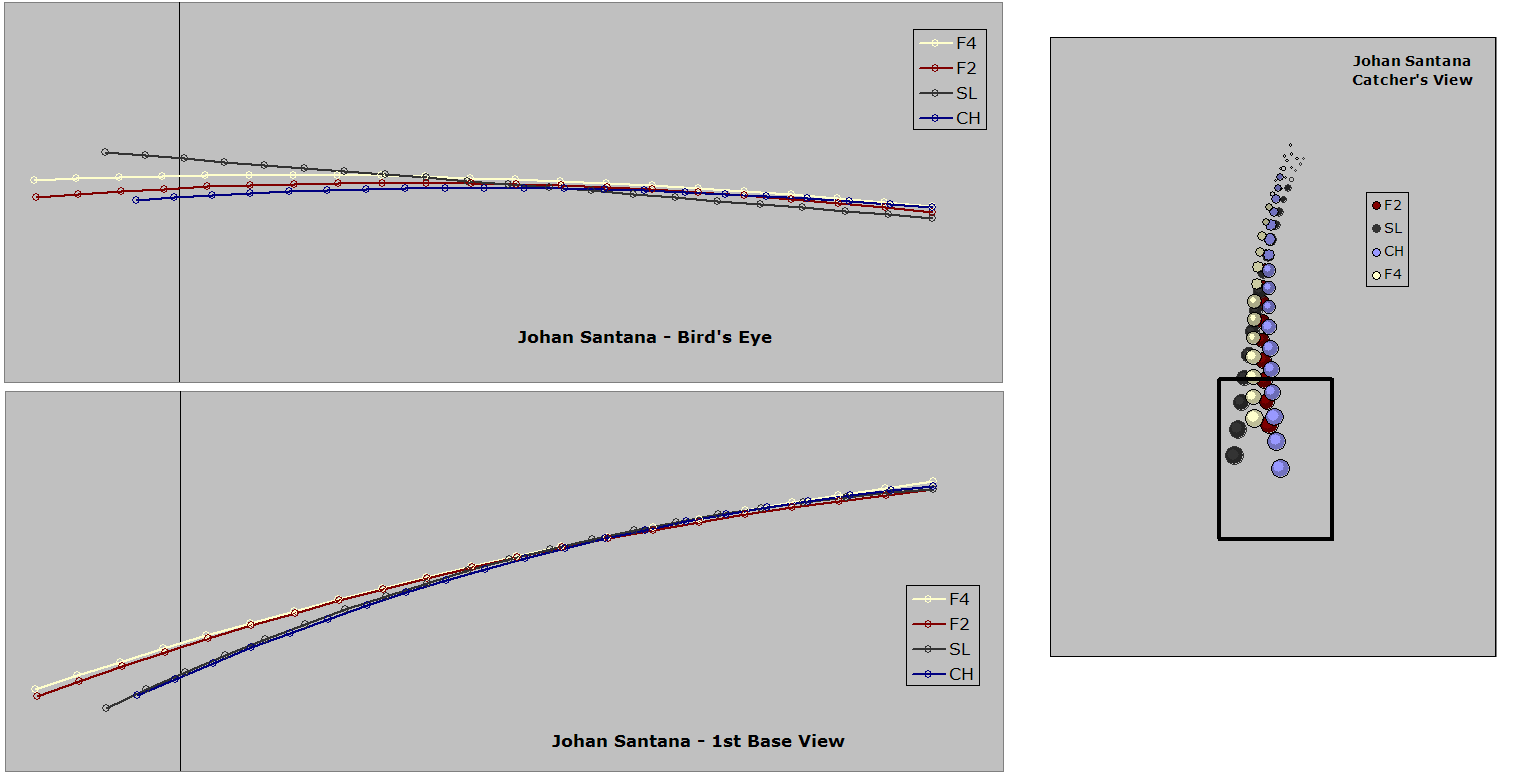
Santana's slider is one of the best in baseball, which is a fine indication of the consistency of his delivery. But that's all old news. What brings me here is to explore Johan 2009. He's off to a great start, even better than years past, which begs a simple question. What's he doing differently? If anything, that is.
It's early, and I'm only looking at games through May 6, so this doesn't include Johan's most recent start. Some trends have emerged that merit watching. That's about all you can do with most early season returns. Keep that in mind.
The biggest change is in pitch selection. Johan is throwing far more four-seam fastballs (or simply "fastballs") and far fewer two-seam fastballs ("sinkers"). Santana also appears to be throwing fewer sliders, a pitch he mostly uses against lefties. His change-up is primarily a gift to right-handed hitters everywhere (the gift of zilch, that is) but got a little extra use against lefties in 2008.
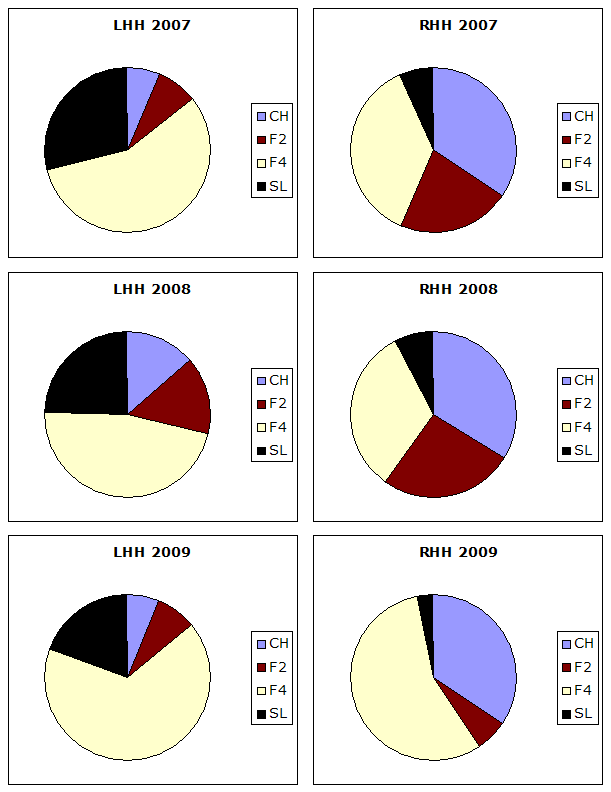
That's a siginficant increase in heaters. Another look is from a four-start moving average of pitch mix.
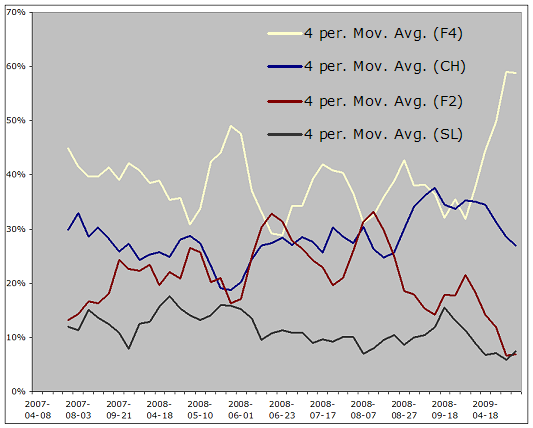
I made sure to include this chart, because, when you squint, you can see a giraffe. But why is he doing this? Santana's four pitches are all above average. The change is one of the best, and both of his fastballs and the slider are solid pitches.
    rv100
CH  -3.7
F2  -1.7
F4  -2.0
SL  -1.5
If you're going to cut back on two pitches, they'd be the sinker and slider. I'm not sure why you would, neither pitch is hurting anyone but Santana's opponents. Breaking it down by season and, for good measure, batter hand, you do start to get the idea that the sinker and slider aren't what they used to be, while the change and fastball may be even better.
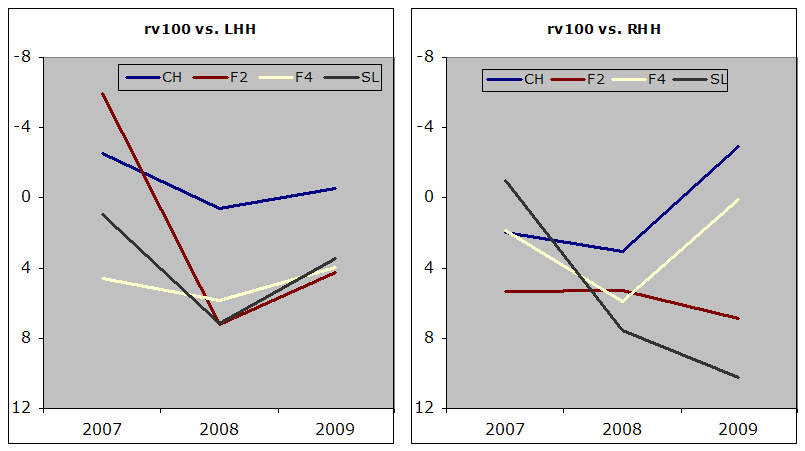
It's early, Santana is one of the greats and can beat you a few ways, so I'm not reading too much into this. I'm working with a short season and a partial data set (2007 didn't have full PITCHf/x coverage), too. But he's pitching well, he is throwing more heaters and fewer sinkers, and Santana's change-up is still a world beater.
Harry Pavlidis writes for Beyond the Box Score, The Hardball Times and Out of the Ivy. His own blog, Cubs f/x, feels neglected once in a while.
| F/X Visualizations | May 13, 2009 |
Platoon Splits for Three Types of Fastballs
On Friday I looked at the run value of four-seam, two-seam and cutter fastballs based on pitch movement. In that post I noted, that it looked like two-seam fastballs had very extreme and cutters almost no platoon split. This comment was offhand, and I did not demonstrate that was the case. In this short post I will do that.
A month ago I looked at the platoon splits of fastballs, changeups, sliders and curves. My results reconfirmed what John Walsh showed in the 2008 Hardball Times Annual: fastballs have an intermediate platoon split, sliders a very extreme one, and changeups and curves none. In that post I grouped all fastballs together. Based on those results and the results of last week's post I was very curious to see the platoon splits for the different fastball types.

These results are consisitent with the remarks I made on Friday:
- Two-seam fastballs have an extremely large platoon split, as big as the slider platoon split.
- The platoon split for cutters is not statistically significant.
- Four-seam fastballs have a small yet significant split.
Interestingly, there is no trend for pitchers to throw the pitches in different proportions to lefties and righties. Approximately 48% of all pitches are four-seam fastballs, 8% are two-seam fastballs and 4% are cutters with almost no difference in same- and opposite-handed at-bats for either RHPs or LHPs. This is very strange it would seem pitchers would do well to throw two-seams fastballs much more in same-handed at-bats, as they do with sliders, and cutters in opposite-handed at-bats, as they do with changeups.
One pitcher who does this, and I would guess this is a big reason for his success, is Jon Lester. Lester, a lefty, throws all three of these fastballs. Here are the proportion of pitches to RHBs and LHBs that are each of the three fastball types.
+------------------+---------+---------+
| Fastabll Type    |     RHB |     LHB |
+------------------+---------+---------+
| Four-Seam        |   0.317 |   0.322 |
| Two-Seam         |   0.155 |   0.290 |
| Cutter           |   0.133 |   0.077 |
+------------------+---------+---------+
This is the type of breakdown I think pitchers should use, way more cutters to opposite-handed batters and more sinkers/two seamers to same-handed batters. I am surprised that is the not the case generally. It would be interesting to see if successful pitchers, like Lester, are more likely to show this breakdown than the average pitcher.
| Touching Bases | May 12, 2009 |
Micah Owings the Hitter
Maybe Dusty Baker knows what he’s doing.
On Sunday night the Cincinnati Reds trailed the St. Louis Cardinals by a run with two outs in the bottom of the ninth inning with the bases empty. Baker pinch hit pitcher Micah Owings for the fifth time this season. Clearly, Owings is not your average pitcher. He pitches respectably, but carries a big stick. Owings had been 2-4 on the year as a pinch hitter which was better than his 2-3 Win-Loss record as a starter.
From MLB.com's gameday, here's a summary of Owings' at bat.
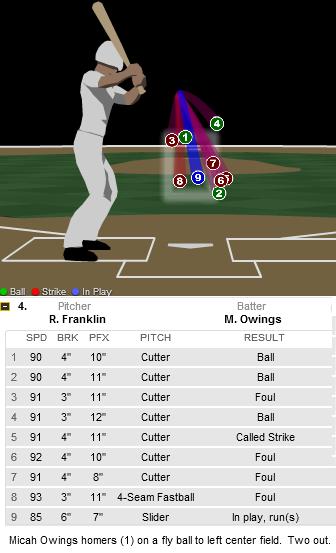
Owings took the first two offerings for balls, though they appear to be borderline strikes by the blurred edges of the strike zone shown in the graphic. Owings then fouled one off before taking another ball. Up 3-1 in the count, Owings took a pitch that might have been an inch or two off the corner—which is to say that it wasn’t a clear-cut call. Well, Owings thought it was. He tossed his bat to the dugout and decided to take his base before it was granted. The ump called him back. Owings wasn’t going to take another pitch after that. He fouled three straight off when Ryan Franklin, who, I should mention, had not yet blown a save on the season, resorted to his first off-speed pitch of the at-bat. Not a good idea. Franklin left a slider right over the heart of the plate that Owings crushed 384 feet to left-center field to tie the game at 7-7. The shot gave the Reds a 49% shift in win expectancy which, in one swing, made Owings the most valuable player of the game by WPA. The Reds went on to drop the contest 8-7, but Owings as usual received his fair share of accolades for his performance.*
*An aside, and my first Pozterisk on this site.
Pitchers like Owings, Carlos Zambrano, Dontrelle Willis, and Mike Hampton who have had nice runs with the bat tend to have their value overstated a bit since we in the media tend to focus on oddities. But it is my belief that the relative value of a pitcher's hitting ability is understated on the whole, considering most people don't give a second thought to how skilled a pitcher is with the stick.
Last year, Nate Silver took a look at several notable hitting pitchers in the game. He found that the difference in true talent between the best and worst hitting pitchers is worth about ten runs per year. Since pitchers are rarely allowed to bat in high-leverage situations, Tom Tango approximated that a pitcher's hitting ability could be equivalent to roughly -.125 to +.25 points in earned run average, or some 10%-20% of a pitcher's value. Last year, there were 120 pitchers who had at least 10 plate appearances and 120 pitchers who tossed at least 120 innings. The standard deviation in their pitching WAR was 1.74 wins compared to a standard deviation of .36 hitting WAR.
David Gassko penned a comprehensive history of hitting pitchers and the decline in such skill over the years. Silver had hypothesized that the lost art was a cause of the specialization of position players and pitchers. The best hitting pitchers tend to be those those who spent the least amount of time in the minors since hitting is a skill that takes constant practice and the minors are the only place where pitchers can forget how to hit. Gassko concluded that even the half win that some pitchers provide with the bat can be worth half a million dollars. Should teams work with pitchers more on hitting?
This year, Ubaldo Jimenez had led the league in batting runs among pitchers before Owings went deep on Sunday. Jimenez had the highest average fastball velocity in the league last year and has been a productive pitcher each of the last two years thanks to above-average strikeout and home run rates from a Coors field product. At 4.4 WAR, he would have been a solidly above average pitcher last year—if not for a league worst -1.5 WAR on offense. This year, though, he has yet to allow a homer and is posting a positive batting WAR which has made for a solid season.
Wandy Rodriguez is having a nice year too but is due for some regression as his BABIP is down 60 points from last year to .263 and he, like Jimenez, has yet to allow a home run despite allowing 64 balls in the air. Still, his curve ball is one of the best in the league, year after year , and he has thrown it more often than all pitchers but A.J. Burnett thus far.Yet while he is ninth in the league for pitchers with 13.5 runs above replacement, he has given away a pitcher-worst -3.9 runs with the bat.
Owings is hitting .346/.414/.692 in 29 career plate appearances as a pinch hitter, a step up from his .315/.336/.556 line in 115 plate appearances as a pitcher.
Owings owns Georgia's high school home run record. A transfer at Tulane, Owings hit .355/.470/.719 before being drafted by the Arizona Diamondbacks as a 22-year old. While rarely seeing time with the bat in the minor leagues, he more than held his own with a .359/.373/.500 line in 64 at bats.
Owings has taken a step back on the hill this year, but right now we’re concerned about his performance in the box. He’s managed an incredible .435 career BABIP thanks to an impressive 24.4 line drive percentage. In 2007 when he won the silver slugger award, Owings hit four homers, all 400+-foot blasts including two shots off Buddy Carlyle on August 18 that traveled further than 440 feet each. Now, I'm not saying Owings owns Carlyle, but Owings did hit doubles off him the other two times they met, so I wouldn't be surprised if Owings at least paid rent on Buddy. Owings has shown a strong reverse-platoon split, as demonstrated by this graph.
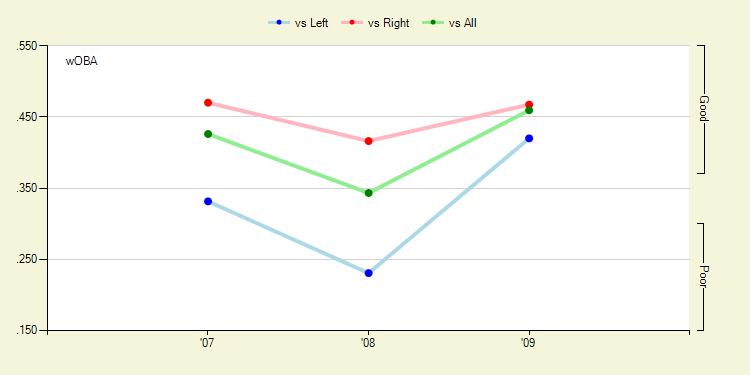
On balls in play, Owings follows a profile similar to most hitters. He pulls four times as many ground balls as he hits the other way and has a rather even distribution of fly balls while demonstrating most of his power on balls he pulls. Owings swings at well over half the pitches he sees and is not too sharp at making contact. But for some reason pitchers are willing to give him offerings inside the strike zone more often than not. And when he does make contact, he inflicts serious damage to the tune of a .261 ISO and 21.4% HR/FB. He has average speed and is an average baserunner too.
We always see pitch f/x breakdowns when hitters pitch, and Chone Smith just gave a neat overview of recent velocity for hitters on the mound, but how about breaking down how a pitcher hits with pitch f/x data?
Using all gameday data available for Owings plate appearances since 2007, his rookie year, I’ll try to break down Owings' performance by pitch location. Here's my first shot at these types of graphs.
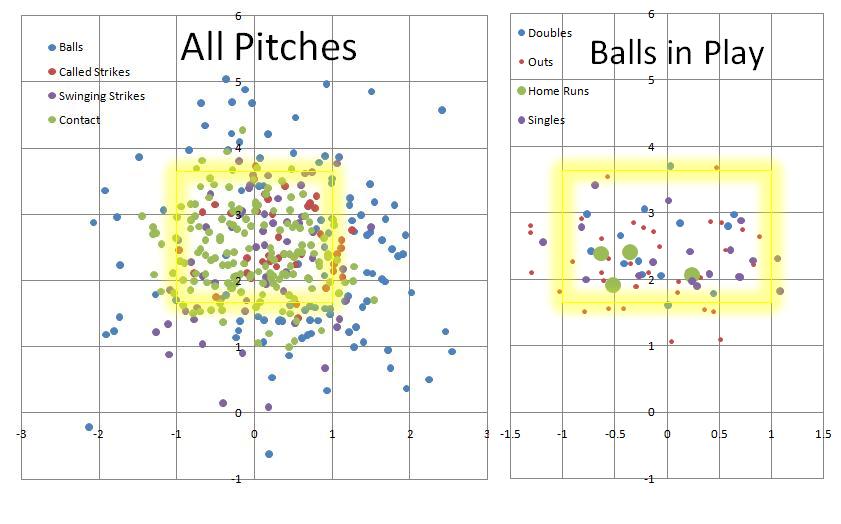
He’s 6’5”, so his strike zone is a couple inches higher than average. It looks to me like he’s willing to chase pitches low out of the zone. The four home runs for which gameday has data for appear to be standard locations for right-handed hitters, as Dave Allen showed. I'd call him a low-ball hitter. But there are too many data points in here for my liking, so I’ll break it down Harry Pavlidis style. I made each zone about a foot in diameter, which appears to have been a mistake, but here it is...
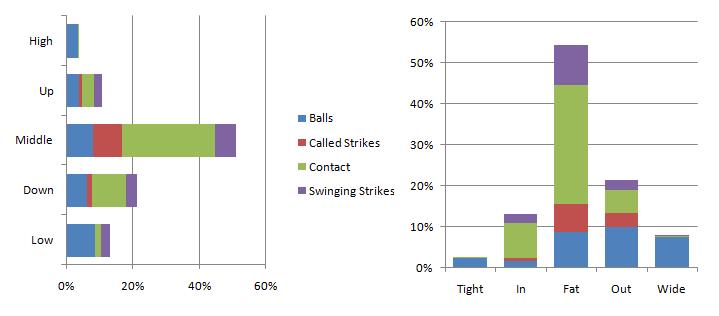
Owings will swing at anything over the plate or inside.He likes the ball down and in, but pitchers can get him to chase balls that are low and he's not too strong at making contact on pitches up in the zone.
So the real question is what should be done with Owings. What do you do with a slightly below-average pitcher with some potential who adds value with the bat? I’ve had the idea of batting him third in away games and then subbing in the starter in the bottom of the first, but that idea is admittedly radical. I don’t at all advocate trying to turn him into Rick Ankiel, since Owings still has value as a pitcher. Maybe he could be turned into a reliever who comes into games as a pinch hitter. Well, what I hope is that Dusty Baker carves out a unique role for him or keeps giving him at bats as a pinch hitter. Players like Owings make the game more fun.
| Behind the Scoreboard | May 09, 2009 |
The Greatest Scoreless Innings Streak Ever
On Tuesday, I posted about Zack Greinke's 38-inning scoreless streak and showed how it was the equal of the famous Don Drysdale streak in 1968. Due to the context of the times and the quality of the opponents, Greinke's 38-inning streak was actually just as difficult as Drysdale's 58-inning streak. But of course Drysdale and Greinke are not the only pitchers to ever compile long streaks. This article follows up on the last one, and tries to determine the most impressive scoreless inning streak of all-time.
The record holder of course, is Orel Hershiser, who pitched in 59 consecutive scoreless innings, dramatically pitching 10 innings in the final game of the season to overtake Drysdale. Other contenders for the title of toughest scoreless inning streak are Walter Johnson, in the American League, who pitched 55 2/3 scoreless innings in 1913 for Washington, and Sal Maglie's 45-inning streak in a tough pitchers' environment in 1950 for the New York Giants. There are other notable streaks, such as Bob Gibson's 47-inning streak in 1968 and Jack Coombs' 53-inning streak in 1910, but because they were accomplished in even stronger pitchers' environments than Hershiser's, we can see right away that they won't be tougher than his record-holding streak.
Looking back at all three of the streaks, we can determine about how likely it was that a quality pitcher could complete each streak. The streak with the lowest probability of course was the toughest.
Using the same methodology from Tuesday's article, I calculated the expected runs allowed for each game of the streak, based on the opponent, the park, and whether the pitcher was playing at home. I then made a small adjustment for defense to account for poor defenses having a higher probability of giving up unearned runs (which would end the streak).
Let's first take a look at Hershiser's streak. Performed in 1988, it was a pitchers' environment. Dodger Stadium was significantly less pitcher friendly than during Drysdale's streak, but was still a pitchers' park. However, only 18 of his innings were at home, making the streak even more impressive. The following chart shows the seven games that composed his streak.
Based on opponent, park, and home field, the average expected runs per 9 IP during the streak was 3.74. Cutting this number down by 25% to get the expected number of runs given up by a good pitcher, not simply an average one, we get 2.99 expected runs per 9 IP. This translates roughly into a probability of throwing a scoreless inning at .801, which he accomplished 59 straight times - very impressive. The probability of completing the streak was .801 ^ 59 = 1 in 485,000. With those odds, the Bulldog certainly pulled off an incredible feat. This was about 5 times tougher than Greinke or Drysdale's feat, but was it the best ever?
Next let's look at the dark horse of the group, Sal Maglie. Being a younger fan, I had not heard of Maglie's scoreless inning streak until recently, and it certainly doesn't have the cache of Drysdale's or Hershiser's. But was it as good or better? Maglie started his streak on August 16th against Brooklyn and ended it September 13th against Pittsburgh, throwing four shutouts in between. 1950 was certainly a hitters year, which made the streak all the more impressive. Below is a chart of the opponents and the expected runs given up by an average pitcher in each of the games.
Maglie's opponents varied between the tough Brooklyn Dodgers and the lowly Pirates, but on average, the average pitcher would be expected to give up 4.81 runs per 9 IP during the streak. For a "good" pitcher, we reduce this to 3.85. Translating this to the probability of throwing a scoreless inning, we get approximately .750. Therefore, the probability of completing the streak was approximately .750 ^ 45 = 1 in 419,000. The Barber's feat was nearly as good as Hershiser's! While he wasn't quite as good the numbers are extremely close, especially considering that there is some estimation error. Still, it's surprising that the unknown Maglie streak is nearly the equal of Hershiser's celebrated feat. The context means that much. But could anyone best both Maglie and Hershiser?
Now let's turn our eyes to Walter Johnson's feat. In 1913 he broke Jack Coombs' record in a tougher pitching environment by throwing 55 2/3 scoreless innings. He started the streak after giving up a run in the first inning of opening day, and didn't allow another one until May 14! Pitching in a combination of starts and relief, he was dominant in his first nine outings. I was able to cobble together the games of his streak (partly due to this nice blog on the Senators and Twins) except for one two inning April relief appearance against whom I could not determine. Below is a chart showing his opponents and the average expected runs per 9 IP.
The average runs per 9 IP was 3.91 for an average pitcher and for a good pitcher this number is reduced to 3.13. Converting this to a probability of a scoreless inning we get about .792. Therefore, over 55.2 innings pitched, the probabilty of a good pitcher completing his streak was .792 ^ 55.67 = 1 in 435,000. This makes Johnson's streak not quite as impressive as Hershiser's, but very close. Due to potential errors in the conversion of runs per nine innings to probability, I think a case could be made for either Maglie, Hershiser, or Johnson to have had the toughest streak, as all three are very close. The difference between them is only one or two innings on a level playing field, so had any of them continued their streak for just a little longer, they would have had clearly the toughest streak of the three.
Can the trio's "record" for most impressive streak be broken? In today's environment, a pitcher (such as Greinke, who now has another 13-inning streak going), would need to reach about 44 innings to match Maglie, and 45 innings to surpass all three streaks. Of course, the fanfare won't start until he reaches 60, but he'll have beaten the toughest streak ever long before that.
| F/X Visualizations | May 08, 2009 |
Fastball and Changeup Run Value by Movement
Two weeks ago I looked at the run value of curveballs, sliders and knuckleballs based on their movement. Today I am going to do the same for changeups and three kinds of fastballs: four-seam fastballs, two-seam fastballs and cutters. This work was motivated by Sky Kalkman's Understanding Pitch f/x Graphs piece in which commenters suggested they have a hard time putting pitch movement in perspective.
Here is how the pitchf/x system measures movement from my post two weeks ago.
The movement of a pitch is the difference between where you would expect the pitch to end up as it crosses the plate based solely on its velocity, trajectory and gravity and where it actually ends up as it crosses the plate. This difference is broken up into its horizontal and vertical components. Then you can plot the horizontal and vertical movements of a number of pitches together in a scatter plot to see the movement of a particular pitch type or from a particular pitcher.
As in the previous post I used all the pitches in the pitchf/x database to do the analysis. This presented a problem; in 2007 and 2008 the pitchf/x system classified almost all fastballs as generic fastballs making no distinction between four- or two-seam fastballs, sinkers, or cutters. Starting this year the system made these finer fastball classifications. So the first thing I had to do was go back and reclassify each pre-2009 fastball as a four-seam, a two-seam/sinker or a cutter. Although sinkers and two-seam fastballs are different pitches I had a hard time differentiating them using the pitchf/x data so I lumped them here.
I used a k-means clustering algorithm that assigned a pitch to a cluster based on its vertical and horizontal acceleration and its speed. I am fairly confident in my classifications. The average horizontal and vertical movement and speed of each of the three types of fastballs I classified are quite close to the values Josh Kalk found when he classified the pitches. One slight discrepancy is that my RHP's cutters do not have as much positive horizontal movement as Kalk's (and my LHP's cutters do not have as much negative horizontal movement as Kalk's). I think that Kalk reclassified some sliders as cutters and I am missing those since I am just reclassifying fastballs not all pitches.
Four-Seam Fastballs
For each pitch type I first show the range of movement for all RHPs throwing that pitch in gray, and then some specific examples in green, blue and red.
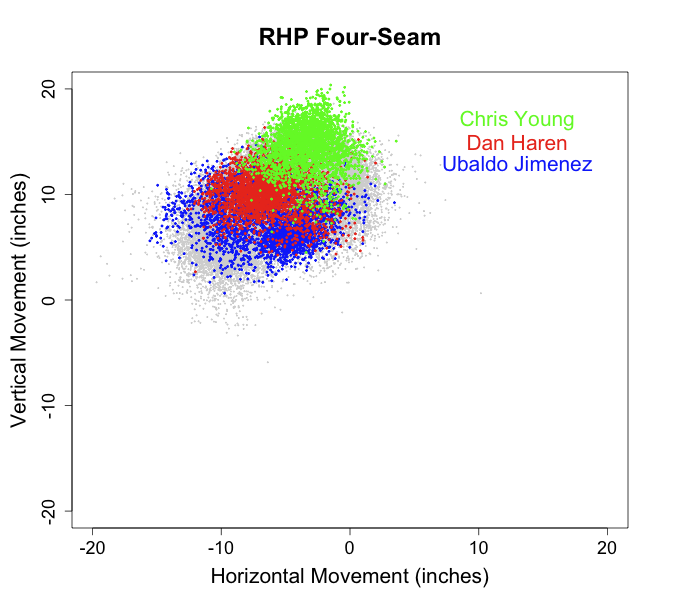
Four-seam fast are, on average, the fastest pitches (about 1.5 mph faster than two-seam fastballs and 3.5 mph faster than cutters), they 'rise' (drop less than expected from gravity) more than any other pitch and tail in to same-handed batters (away to opposite-handed batters) by about 5 inches. These fastballs include what are thought of as 'high-heat' fastballs. Chris Young has a very effective four-seam fastball that 'rises' more than a foot on average. Dan Haren as of last week had the best four-seam fastball of all starters. Four-seam fastballs have a large variation in horizontal movement both between different pitchers and between pitches thrown by the same pitcher, for example some of Ubaldo Jimenez's four-seam fastballs tail over 10 inches in to RHBs and others have almost no horizontal movement what-so-ever.
The run value images were created in the same way as described in the first post in this series. I just give the RHP ones to keep the post from data overload.
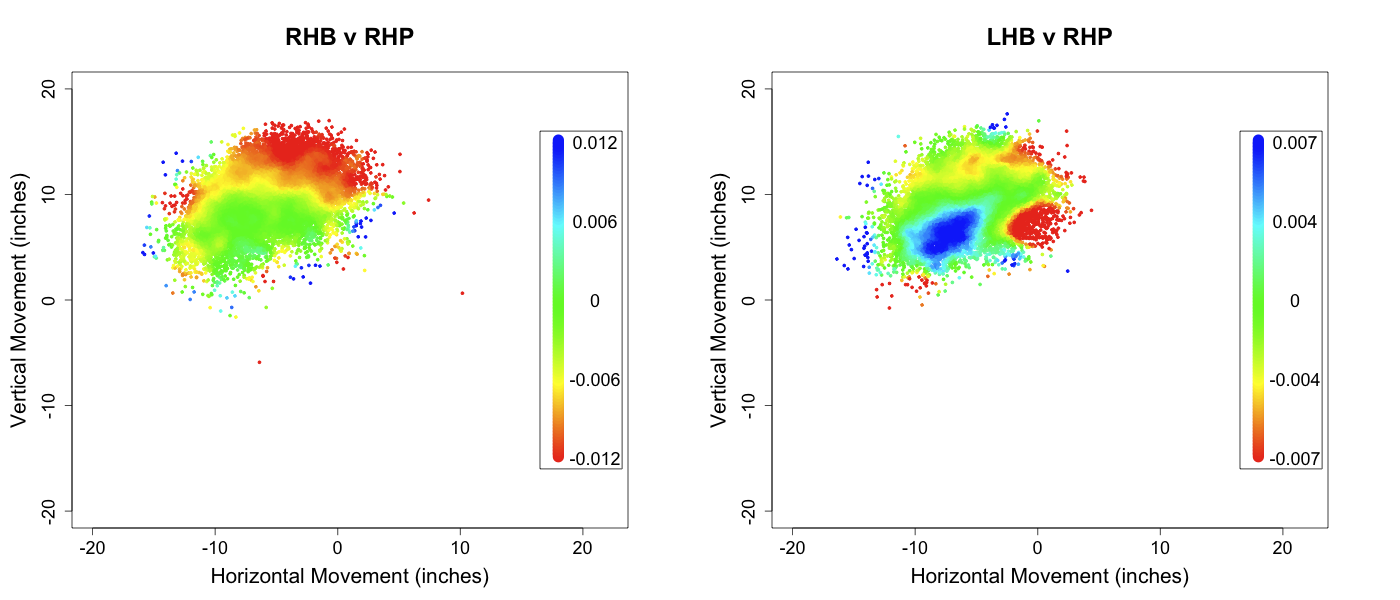
In same-handed at-bats the more vertical 'rising' movement the better. This trend is not unexpected, but strikingly consistent. For these same-handed at-bats horizontal movement has very little effect. In opposite handed at-bats a large central region of pitches has a very high run value. These fastballs have 'average' movement, and left handed batters have no trouble with them.
Two-Seam Fastballs

Two-seam fastballs are a little slower, tail in more to same-handed batters, and have much less, sometimes even negative, vertical movement than four-seam fastballs. As I said before this group of pitches includes both two-seam fastballs and sinkers. These fastballs, when they are effective, induce lots of groundballs. As of last week Derek Lowe had the best two-seam fastball. It has nice 'sink' and a wide range of horizontal movement. Brandon Webb's sinker is the one of the best in the game, it has even more 'sink' than Lowe's. Justin Masterson pitches from a three quarters arm slot and is able to get negative vertical movement on his sinker (it drops more than expected from gravity).
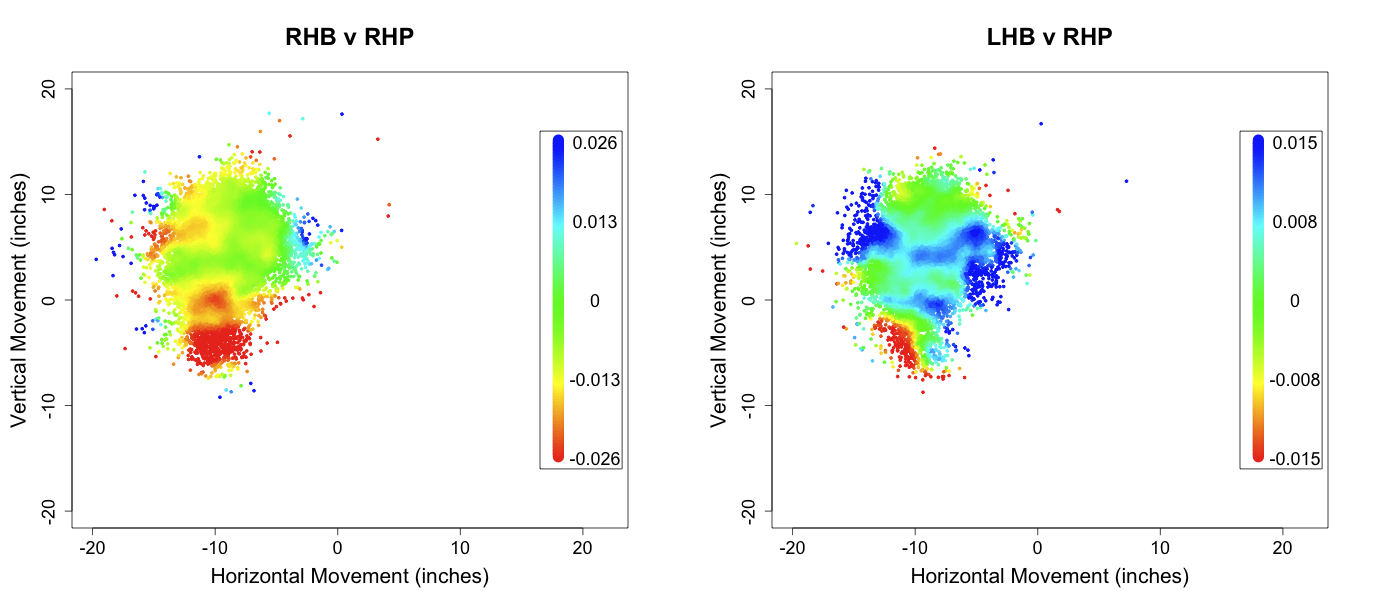
Two-seam fastballs have an incredible platoon split. Against same-handed batter they tend to be very good pitches improving slightly with more horizontal movement towards the hitter and greatly with more downward movement or 'sink'. Against opposite handed batters two-seam fastballs are not very effective, and those with intermediate levels of vertical movement get crushed.
Cutter
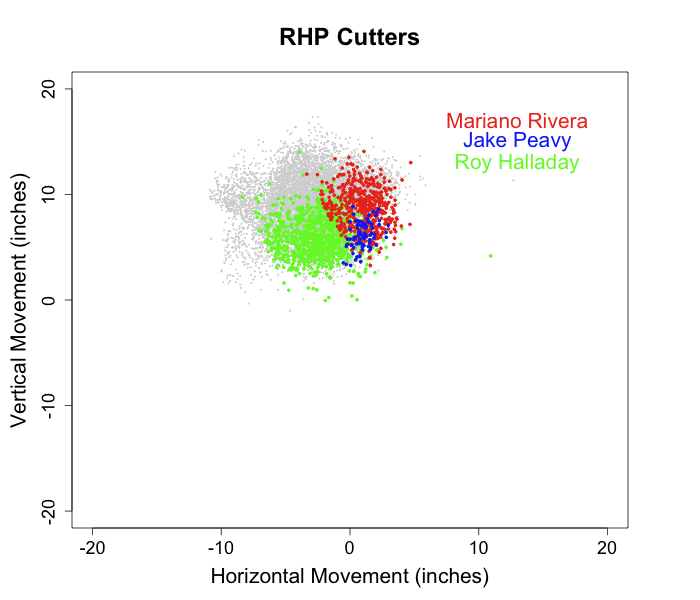
Cutters are, on average, slower than four- and two-seam fastballs by about 3.5 and 2 mph respectively. Their movement is intermediate to a four-seam fastball and a slider. You can't talk about cutters without mentioning Mariano Rivera's. It is amazingly successful, almost the only pitch he throws and one of the most unique pitches in the game. It has a wide range of vertical break and breaks away from RHBs. Roy Halladay has a very successful cutter with lots of 'sink'. Jake Peavy doesn't throw as many cutters as Halladay or Rivera, but his have very interesting movement too.
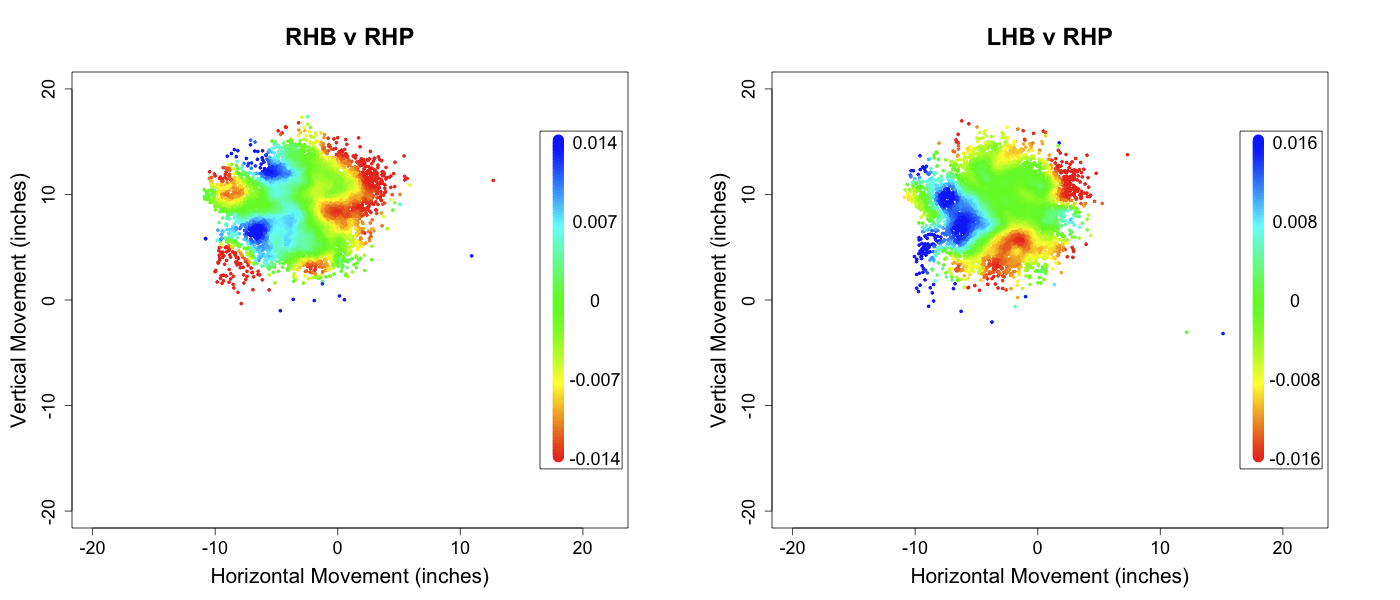
Cutters seem to have almost no platoon split. In fact the patterns look the same and are not mirror images of each other as is usually the case. So cutters from RHPs that break to the catcher's left do poorly against RHBs and LHBs, while those that break to the catcher's right do well against RHBs and LHBs. This is quite strange, and helps explain how Rivera can be so successful with just the one pitch.
Changeups
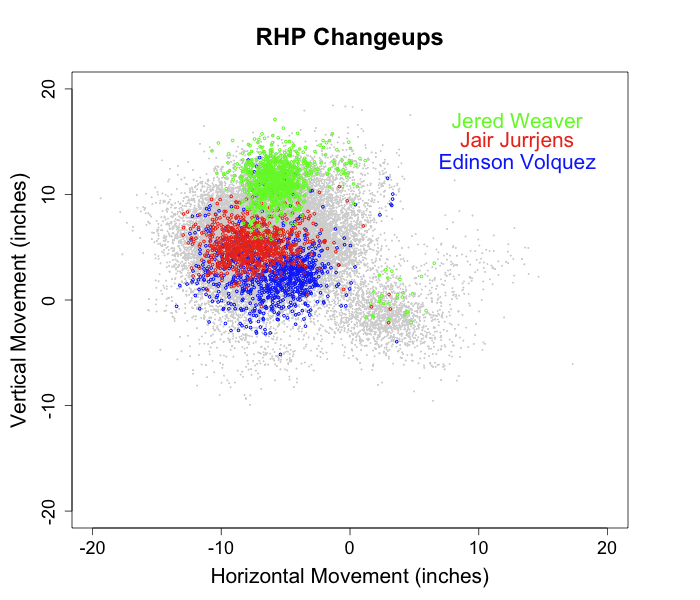
In 2008 no pitcher threw more changeups than Edinson Volquez. His changeups have very extreme down and in movement. Jair Jurrjens was also in the top five of changeups thrown percentage, his has intermediate movement. Jered Weaver's change has more 'rise' than any other.
Changeups are predominately throw in opposite-handed at-bats so I just present those images below.
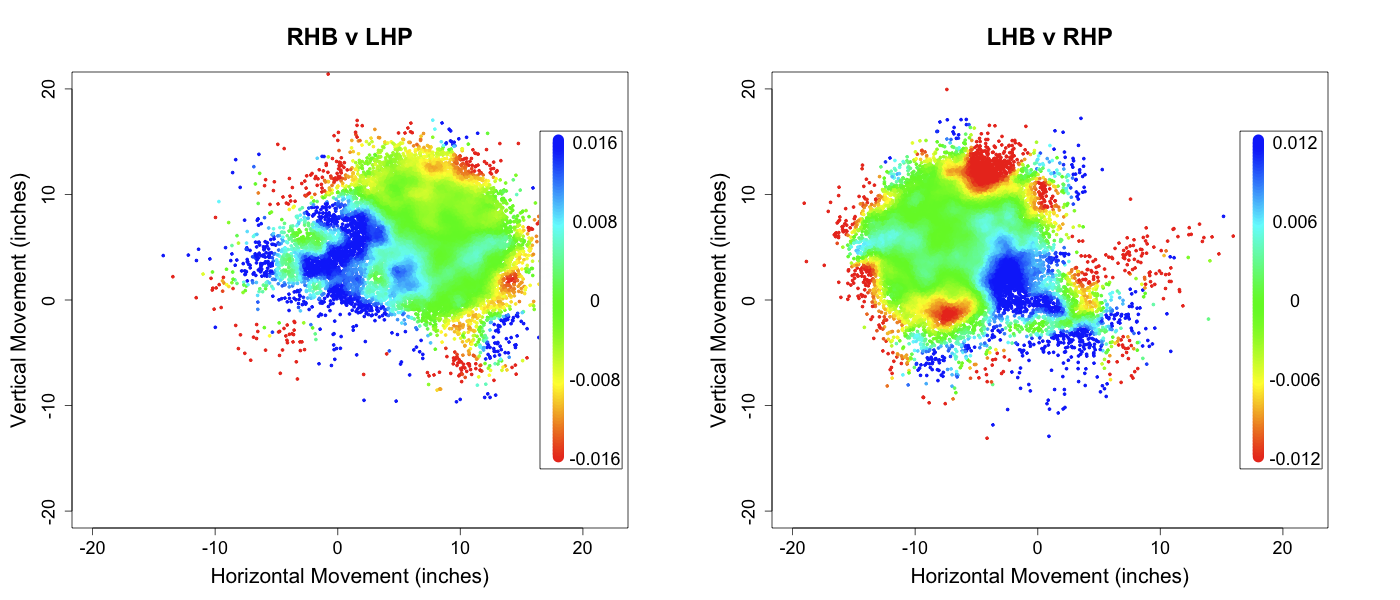
Changeups that have very little movement (close to 0,0) get crushed. Those with extreme vertical movement, either lots of rise or lots of sink, are very successful. Since changeups are thrown in opposite handed at-bats even those with neutral run values are good pitches.
Speed
The elephant in the room here is pitch speed. The success of a fastball or a changeup is very much tied to its speed, which this analysis ignores. In addition, pitch movement and speed are not independent. John Walsh showed fastball speed positively correlates with its vertical movement. So the success of four-seam fastballs with lots of rise might be since these tend to be faster pitches. In a future post I hope to examine this relationship between speed and movement, and see how they jointly affect a pitch's outcome.
| Touching Bases | May 07, 2009 |
Findings from the Free Agent Market
Curt Flood really started something with this whole free agency thing, huh? Using ESPN’s Free Agent Tracker, I collected data for all free agents since 2006 and used regression analysis to pick up on some trends.
WAR to Wages
This offseason, Fangraphs unveiled its Wins Above Replacement measure in the Value section of its stats pages. WAR is a statistic that combines offensive, defensive and positional value and sets it against a replacement-level baseline to find the marginal wins a player contributes to his team. There has been debate over how to convert these marginal wins into a marginal value in terms of dollars. One of the first things I looked at was whether the relationship between WAR and salary was linear or nonlinear. I plotted the WAR from each free agent's contract year—excluding those who were injured all year or who came over from Japan—against the average annual value of the contract they signed.
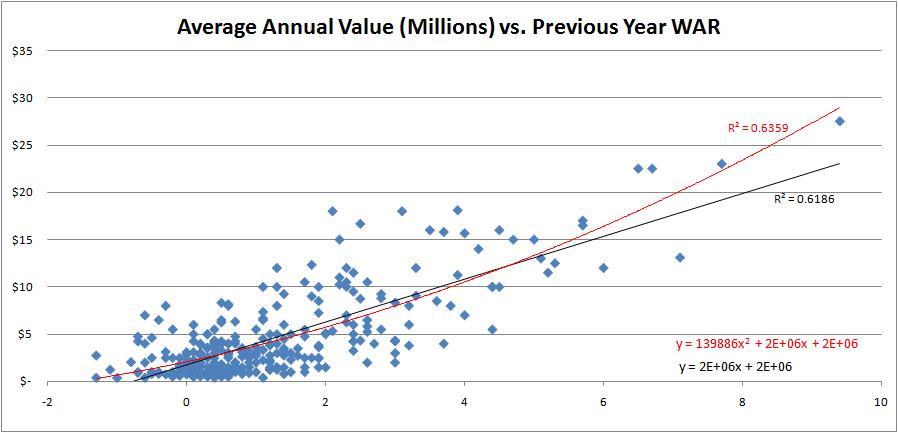
I admit that before having seen any data, I had a bias toward the nonlinear relationship, since it just makes intuitive sense to me.
The regression lines look rather similar. It would appear that the nonlinear regression has an advantage at the extremes, since it won’t predict negative salaries for very negative WAR and it better captures the exponential value of superstar players. However, there is little difference between the regression lines for the vast majority of players, those between 0 WAR and 5 WAR. The R2 values, which measure the percentage of variance of Average Annual Value that is explained by WAR,, are similar at an impressive .62-.64 range. This affirms that a single year of WAR captures a lot of a player’s value. Keep in mind when looking at these R2 values that the R2 will always increase in a polynomial equation due to the nature of adding a new term, so we definitely cannot make any conclusions about either method from this graph alone.
Time 100’s own Nate Silver, in deriving Marginal Value Over Replacement Player, used a nonlinear form of WARP . I have duplicated his graph here which projects WARP for 2005's free agent class by using three years of WARP from 2002-2004 instead of the one previous year of WAR I used for 2006-2008 free agents. I have superimposed a rough line of best fit to portray the difference between a linear and nonlinear model.
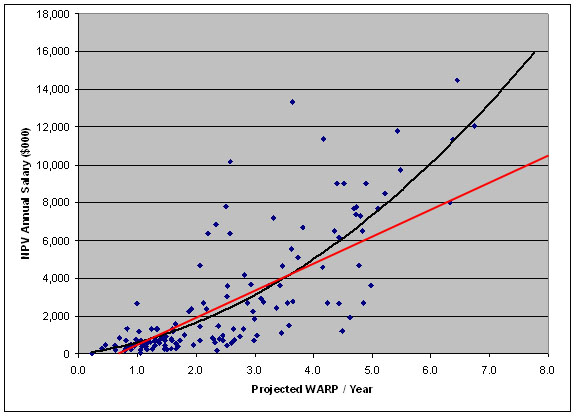
The thinking behind a nonlinear model is that there is an abnormal distribution of talent in baseball, which makes top talent disproportionately more valuable than average talent.
Phil Birnbaum shows that individual skills in the major leagues may be normally distributed. Anecdotally, this is reaffirmed by the 20-80 scouting scale, which is based on a normal distribution with a mean of 50 and standard distribution of 10. Furthermore, Tom Tango shows that “when you consider the number of opportunities each player gets (in the Major Leagues), the total effective talent distribution is rather typical.”
However, when observing only the Major Leagues, we neglect the fact that most subpar baseball talent resides at another level. There is an abundance of freely available talent that could provide marginal upgrades to current Major Leaguers. What this means in terms of player value is that below-average players will be disproportionately underpaid compared to above-average players due to the difference in the supply within each pool.
Bill James once wrote “talent in baseball is not normally distributed. It is a pyramid. For every player who is 10 percent above the average player, there are probably twenty players who are 10 percent below average.” I believe this theory holds if by baseball he means the total baseball universe and by average he means the Major League average. So, Tango may be right that, at the Major League level, talent follows a normal distribution, but when we add talent from all player pools, the curve does begin to look like the right tail of a normal distribution.
Think of it this way: would you rather have the right side of the Cardinals’ infield or the Reds’ infield? The combinations of Albert Pujols/Skip Schumaker and Joey Votto/Brandon Phillips will both produce 8 WAR, give or take. Through the currently dominant model for fair-market evaluation, both sets of players are worth some $35 million if you simply multiply their WAR by $4-5 million. But my intuition tells me that I'd rather have the pair on the Cardinals. The key is that Pujols takes up only one roster spot and provides the same value of a pair of players who take up two. I might be able to upgrade over Schumaker on the cheap eventually. We also must account for the fact that freely available talent is, well, free, while the superstars who bring in 5+ WAR will need to be acquired through trading or bidding.
Furthermore, I found statistically significant evidence that the Type A tag for free agents is correlated with increased pay. In a practical sense, the Type A label decreases a player's value in a free market since it costs prospective teams a first-round pick to acquire the player or the label costs the player in leverage if he tries to re-sign with his former team. However, Type A free agents tend to be the best players in my sample, so it is evident that teams ignore the Type A tag and are willing to spend what it takes to reel in superior players.
Separating position players and pitchers, I find that is much easier to predict position players' salaries in general, and the nonlinear regression fits better for position players than it does for pitchers. In separating the two pools of players, I decided to test for some skills that do not translate into a hitter’s or pitcher’s WAR, but still might directly relate to his salary.
General Managers dig the fastball
Fangraphs keeps track of pitch usage and velocity for all pitchers since 2002, and all the data can be easily exported to a spreadsheet. This is a good thing for baseball analysts. Dave Allen and Dan Turkenopf both used pitch f/x data to show how velocity relates to production. In these regressions, I account for a player’s WAR, and therefore can try to isolate the effect of a pitcher’s fastball velocity on his salary. Here is the regression output.
      Source |       SS       df       MS              Number of obs =     149
-------------+------------------------------           F(  4,   144) =   62.82
       Model |  1.7252e+15     4  4.3131e+14           Prob > F      =  0.0000
    Residual |  9.8863e+14   144  6.8655e+12           R-squared     =  0.6357
-------------+------------------------------           Adj R-squared =  0.6256
       Total |  2.7139e+15   148  1.8337e+13           Root MSE      =  2.6e+06
------------------------------------------------------------------------------
         aav |      Coef.   Std. Err.      t    P>|t|     [95% Conf. Interval]
-------------+----------------------------------------------------------------
         WAR |    2399138   153233.6    15.66   0.000      2096260     2702016
         fbv |   164514.8   72588.22     2.27   0.025     21038.76    307990.9
          o7 |  -423055.5   545027.9    -0.78   0.439     -1500344    654233.1
          o8 |   -1365307   508682.7    -2.68   0.008     -2370757   -359857.4
       _cons |  -1.19e+07    6496299    -1.83   0.069    -2.47e+07    954444.2
------------------------------------------------------------------------------
This means that there is statistically significant evidence that fastball velocity (fbv) contributes to a pitcher’s salary. Every additional mile per hour harder a pitcher throws, he is paid about $165,000. Fastball velocities typically range from 85 MPH to 95 MPH, so if two players were to put up the same WAR, but one was a soft tosser and the other a flame thrower, in an auction teams may bid up to a couple million dollars more for the harder thrower, based on that skill alone.
I created two player pools, separating those with above-average fastball velocities and those with below-average fastball velocities. The average fastball in my sample of 149 pitchers travels 89.7 miles per hour. The WAR of both player pools is nearly identical, as the harder throwers average .97 WAR compared to .96 WAR for the softer throwers. Yet the harder throwers earned $4.9 million per year in free agency compared to $4.2 million for the latter group. Perhaps fastball velocity predicts future performance, or perhaps there is an allure to signing a player who can light up the radar gun, or maybe fans come out to see fast pitchers. No matter the case, throwing hard gets you paid.
I also included time-fixed effects in this regression, setting dummy variables to represent the year during which the pitcher became a free agent. We find statistically significant evidence of deflation in 2008. While 2006 and 2007 appear stable in terms of free agent salaries, pitchers with similar production in 2008 were liable to lose on average a million dollars per year on their contract because they hit the market at the wrong time.
General Managers dig the longball
By longball, I don’t mean home runs. I mean actual distance. From Hit Tracker, I included the average true distance in feet of home runs for all players in my dataset..I also included weight of a player in pounds, which might measure raw power or might measure nothing, but was significant in the regression. Unfortunately, weight is also probably the least accurate data point I could use since there are no reliable sources for it.
      Source |       SS       df       MS              Number of obs =     169
-------------+------------------------------           F(  3,   165) =  123.05
       Model |  2.5996e+15     3  8.6653e+14           Prob > F      =  0.0000
    Residual |  1.1620e+15   165  7.0421e+12           R-squared     =  0.6911
-------------+------------------------------           Adj R-squared =  0.6855
       Total |  3.7616e+15   168  2.2390e+13           Root MSE      =  2.7e+06
------------------------------------------------------------------------------
         aav |      Coef.   Std. Err.      t    P>|t|     [95% Conf. Interval]
-------------+----------------------------------------------------------------
         WAR |    2256088   125521.3    17.97   0.000      2008253     2503923
        true |   28062.52   13259.32     2.12   0.036     1882.712    54242.32
      weight |    24497.9   10709.87     2.29   0.023     3351.842    45643.95
       _cons |  -1.49e+07    4881150    -3.05   0.003    -2.45e+07    -5253468
------------------------------------------------------------------------------
These measures are essentially independent of WAR but do affect salary. I believe home run distance and weight are actually capturing the phenomenon that has shown that there is a stronger correlation between slugging percentage and salary than between salary and most any other basic statistic. Weight and True Distance correlate very well with slugging percentage. We can say with confidence that there is a bias toward heavier players who hit for power, all else being equal. For every ten pounds of weight or ten feet in home run distance, a hitter can expect a positive return averaging around 250 grand.
This is not to say whether paying these players more for the ability to throw fast or hit long home runs is efficient or not. I did this analysis to observe trends in the market over the last few years, and I am not trying to comment on any sort of inefficiencies that may exist.
Thanks to all the data sources I used in this study including ESPN, Fangraphs, Hit Tracker, Forbes, and Fantasypitchfx
Edit: At Jake's request, I have separated the data series by year and added separate trendlines for each year.
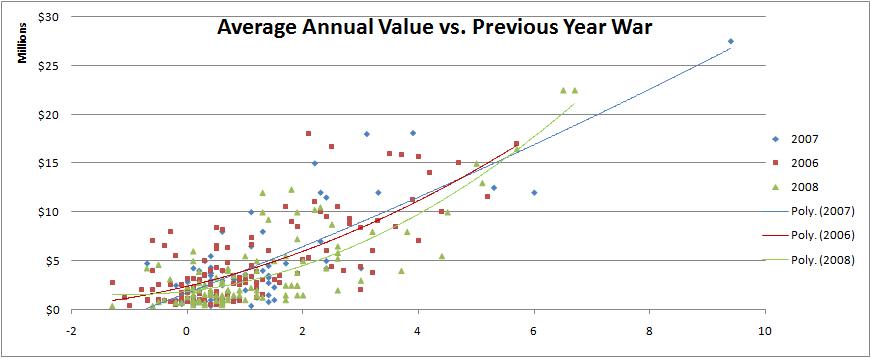
| Around the Minors | May 06, 2009 |
The MLB Draft: College or Prep... The Debate Continues
For those of you who have been reading this site for a while, you probably know that one of my favorite things to write about is Major League Baseball's amateur draft. The 2009 draft is about a month away (June 9-10) so I though it might be a good time to take a look at one of the more popular debates around baseball, as well as the Internet.
There is a belief amongst some people that it is "safer" to pick a college player in the first round of the MLB amateur draft than it is to select a prep player. This belief was spawned - or at least made popular - by the Moneyball era. But is there really any such thing as a "safe" draft pick in baseball, given the nature of the beast? Baseball, unlike most other pro sports, generally requires top-ranked amateurs to spend many years honing their skills in the minor leagues before they are ready to play amongst the best athletes in the world in their chosen sport. The skill-level gap between Major League Baseball and amateur baseball is much larger than with football or basketball. And we haven't even mentioned the risk of injuries.
So let's take a look at the first rounds of the draft from 2001-2003 and see if the above belief has held true or not. We'll also break it down by position to see if college shortstops are more likely than, say, college catchers to meet expectations (We'll make the assumption that clubs are expecting a first-round pick to be at least a league-average regular at their position). There is a certain amount of subjectivity to deciding if a player has met expectations so you may disagree slightly with my opinions. As well, this type of study is difficult because players' stocks can fluctuate from year-to-year, but let's see how things play out. Players will be assigned either a (Pass) or (Fail) for meeting expectations. There are a couple (Undecided) as well.
* I was going to include 2004 and 2005 as well, but there were just too many players that had futures that were still too much up in the air.
College Hitters
Mark Teixeira, 1B (Pass)
Chris Burke, SS (Fail)
Jake Gautreau, 3B (Fail)
Gabe Gross, OF (Fail)
Mike Fontenot, 2B (Pass)
John-Ford Griffin, OF (Fail)
Bobby Crosby, SS (Pass)
High School Hitters:
Joe Mauer, C (Pass)
Casey Kotchman, 1B (Pass)
Josh Burres, SS (Fail)
College Success Rate: 3/7 (43%)
High School Success Rate: 2/3 (67%)
College Pitchers
Mark Prior, RHP (Pass)
Dewon Brazelton, RHP (Fail)
Josh Karp, RHP (Fail)
Chris Smith, LHP (Fail)
John VanBenschoten, RHP (Fail)
Kenny Baugh, RHP (Fail)
Aaron Heilman, RHP (Pass)
Brad Hennessey, RHP (Fail)
Jason Bulger, RHP (Fail)
Justin Pope, RHP (Fail)
Noah Lowry, LHP (Undecided)
High School Pitchers
Jeremy Sowers, LHP (Did Not Sign)
Gavin Floyd, RHP (Pass)
Colt Griffin, RHP (Fail)
Mike Jones, RHP (Fail)
Kris Honel, RHP (Fail)
Dan Denham, RHP (Fail)
Macay McBride, LHP (Fail)
Jeremy Bonderman, RHP (Pass)
Alan Horne, RHP (Did Not Sign)
College Success Rate: 2/10 (20%)
High School Success Rate: 2/7 (29%)
College Hitters:
Khalil Greene, SS (Pass)
Drew Meyer, SS (Fail)
Russ Adams, SS (Fail)
Nick Swisher, OF (Pass)
Josh McCurdy, SS (Fail)
High School Hitters:
B.J. Upton, SS (Pass)
Prince Fielder, 1B (Pass)
Scott Moore, SS (Fail)
Jeremy Hermida, OF (Pass)
James Loney, 1B (Pass)
Denard Span, OF (Pass)
Jeff Francoeur, OF (Pass)
Sergio Santos, SS (Fail)
John Mayberry, 1B (Did Not Sign)
College Success Rate: 2/5 (40%)
High School Success Rate: 6/8 (75%)
College Pitchers:
Bryan Bullington, RHP (Fail)
Jeff Francis, LHP (Pass)
Joe Saunders, LHP (Pass)
Royce Ring, LHP (Fail)
Bobby Brownlie, RHP (Fail)
Jeremy Guthrie, RHP (Pass)
Joe Blanton, RHP (Pass)
Ben Fritz, RHP (Fail)
High School Pitchers:
Matt Cain, RHP (Pass)
Cole Hamels, LHP (Pass)
Chris Gruler, RHP (Fail)
Adam Loewen, LHP (Fail)
Clint Evert, RHP (Fail)
Zack Greinke, RHP (Pass)
Scott Kazmir, LHP (Pass)
College Success Rate: 4/8 (50%)
High School Success Rate: 4/7 (57%)
Notes: Derick Grigsby, RHP, who was drafted out of community college, was not considered.
College Hitters:
Rickie Weeks, 2B (Pass)
Michael Aubrey, 1B (Fail)
Aaron Hill, SS (Pass)
Brian Anderson, OF (Fail)
David Murphy, OF (Pass)
Brad Snyder, OF (Fail)
Conor Jackson, 3B (Pass)
Brian Snyder, 3B (Fail)
Carlos Quentin, OF (Pass)
Mitch Maier, C (Fail)
High School Hitters:
Delmon Young, OF (Pass)
Chris Lubanski, OF (Fail)
Ryan Harvey, OF (Fail)
Ian Stewart, 3B (Pass)
Lastings Milledge, OF (Undecided)
Matt Moses, 3B (Fail)
Brandon Wood, SS (Undecided)
Eric Duncan, 3B (Fail)
Daric Barton, C (Undecided)
College Success Rate: 5/10 (50%)
High School Success Rate: 2/6 (33%)
College Pitchers:
Kyle Sleeth, RHP (Fail)
Tim Stauffer, RHP (Fail)
Paul Maholm, LHP (Pass)
Ryan Wagner, RHP (Fail)
Chad Cordero, RHP (Pass)
David Aardsma, RHP (Fail)
Brad Sullivan, RHP (Fail)
High School Pitchers:
Chad Billingsley, RHP (Pass)
Jeff Allison, RHP (Fail)
John Danks, LHP (Pass)
College Success Rate: 2/7 (29%)
High School Success Rate: 2/3 (67%)
Notes: Nick Markakis, OF, who was drafted out of junior college, was not considered.
College Hitters Success Rate: 10/22 (45%)
High School Hitters Success Rate: 10/17 (59% - three undecided)
College Pitchers Success Rate: 8/25 (32% - one undecided)
High School Pitchers Success Rate: 8/17 (47%)
Conclusions: Maybe clubs like Toronto need to re-think their reluctance to draft prep pitchers due to their "unpredictability." Drafting pitching in the first round was not a safe bet (less than 50%) regardless of picking a college or prep pitcher between 2001-03, but the college success rate was dismal. It would be interesting to see if this trend would hold true if we were to research the draft back another 10 years. Surprisingly, prep hitters also performed better than their college counterparts.
College Success Rates by:
Catcher: 0/1 (0%)
First Base: 1/2 (50%)
Second Base: 2/2 (100%)
Third Base: 1/3 (33%)
Shortstop: 3/7 (43%)
Outfield: 3/7 (43%)
Right-Handed Pitcher: 5/19 (26%)
Left-Handed Pitcher: 3/5 (60%)
Notes: Wow. College right-handers were really not the best choice, although they were by far the most popular. Yikes.
High School Success Rates by:
Catcher: 1/1 (100%)
First Base: 3/3 (100%)
Second Base: ---
Third Base: 1/3 (33%)
Shortstop: 1/4 (25%)
Outfield: 4/6 (67%)
Right-Handed Pitcher: 5/12 (42%)
Left-Handed Pitcher: 3/5 (60%)
Notes: Obviously high school second basemen are not a hot commodity, which is not overly surprising, considering a large number of MLB keystone players probably started out as shortstops in the minors. The prep first basemen that were chosen have performed pretty well.
So, is there any such thing as a safe pick? Not really. But interestingly enough, prep hitters were the more successful choice between 2001 and 2003, followed by... prep pitchers. Teams that chose prep prospects, in general, had a 53% success rate. Teams that chose a college prospect had a success rate of just 39%. Collectively, the three years studied is a pretty small sample size in the grand scheme of things, so we cannot really read too much into the numbers above, but what it does is provide some food for thought. It could also serve as a great starting point (or hypothesis) for a much larger study on the successes and failures of the Major League Baseball amateur draft.
| Behind the Scoreboard | May 04, 2009 |
Was Greinke's Streak Better Than Drysdale's?
Last week, Zack Greinke wrapped up a 38 consecutive scoreless inning streak, garnering him a Sports Illustrated cover, and the most attention a Kansas City player has received in quite some time. Greinke, the 25-year old righty who's been flying under the radar the past several years, made headlines by challenging the pitchers' version of Joe DiMaggio's 56 consecutive game streak.
But while Greinke's streak was impressive, surely it was not the quality of Don Drysdale's 1968 feat of 58 innings, which broke Walter Johnson's 55 year-old record and stood for 20 years on its own. Right? Perhaps... To test this, we'll try to calculate the probability of a typical "good" pitcher accomplishing both streaks.
Let's take a look at the two streaks:
Drysdale's streak of 58 innings started with a May 14th shutout of the Cubs at Dodger Stadium and he pitched 5 additional shutouts before letting up a run in the 5th inning against Philadelphia on May 31st. Greinke's streak of 38 innings started at the end of 2008 and continued through this year until he gave up an unearned run last week in the 5th against Detroit (he finally gave up his first earned run in the first inning of the following game).
On the face of it, it would appear that the Drysdale's streak was vastly superior to Greinke's, but let's look at the hitting prowess of each of the opponents they faced.
Opponents
Drysdale made his run during 1968, The Year of the Pitcher. Greinke on the other hand made his during a relatively good hitting era (the stats in the above chart are the 2008 runs/game for Greinke's opponents). The average number of runs per game of Greinke's opponents was nearly a full run and a half higher than Drysdale's!
Greinke's opponents did however, play in slightly more favorable hitters parks than Drysdale's. When adjusting the teams' runs per game by their 3-year park factor, the weighted average of Drysdale's opponents scored 3.48 runs per game and Greinke's opponents scored 4.93 runs per game. This means that an average pitcher facing Drysdale's opponents would give up about 3.48 R/G, but that same pitcher facing Greinke's opponents would give up 4.93.
Home Field
This however, still ignores where the games during the streak actually took place. Here Drysdale clearly had an easier go of it. Forty of his 58 innings were thrown at home, which increases his performance by about 5%, and only 18 innings came on the road, where the average player's performance decreases 5%. On top of that, his home games were played in the spacious Dodger Stadium. In the early years of Dodger Stadium, the park depressed runs by 16%, making things much easier for a hurler. On top of that, his road games were played in Houston and St. Louis, also both pitchers parks - depressing scoring by 4%. When you factor all of that in, the expected runs per 9 IP of a pitcher throwing those same innings drops from 3.48 to 3.00.
Greinke on the other hand didn't enjoy those advantages. Only 16 of his 38 innings came at home, making it tougher for him to complete his streak, while the park factors generally cancelled each other out. Overall, the expected runs per 9 IP went up from 4.93 to 5.03.
Defense
Since the streak includes earned runs and unearned runs, the proficiency of the defense also makes a difference (of course, defense is a factor no matter what, but I don't have the UZR for the 1968 Dodgers). In 1968, the average number of unearned runs allowed per team was about 14% of the number of earned runs. The Dodgers were slightly worse, giving letting in additional runs to the tune of 18%. When this is factored in, the expected R/G for Drysdale's innings increases from 3.00 to 3.08. The Royals defense was also slightly worse than average, increasing the expected R/G for his innings from 5.03 to 5.06.
The following chart gives the expected number of runs allowed per 9 IP for each game of both streaks, after taking into account the opponent, park, home field advantage, and defense.
Of course, these numbers are for the average pitcher. We want to calculate the probability that a good pitcher, like Drysdale or Greinke, would be able to complete the streak. Of course, a good pitcher would be expected to give up far fewer runs. The ERA+ numbers for both pitchers were around 125 (128 for Drysdale and 123 for Greinke in 2008) so it makes sense to use that as a benchmark. Dividing by the 125 ERA+ number, we would expect a good pitcher to give up 2.47 runs per 9 IP during Drysdale's streak and 4.05 runs per 9 IP during Greinke's streak.
Which Streak Was Better?
Using these numbers, and the number of innings in each successful streak, we can determine the likelihood that the same "good" pitcher could complete each pitcher's streak. First we have to translate those run per game averages into probabilities of scoring. I'm sure there's been work done to do this theoretically, but instead I used empirical data from Retrosheet courtesy of John Jarvis to estimate that the probability of pitching a shutout inning during Drysdale's streak was about .825 and the probability of pitching a shutout inning during Greinke's streak was about .745.
Using these numbers we can compute the probability of our typical "good" pitcher completing each streak. For Drysdale, the chances were (.825) ^ 58 = 1 in 70,000. For Greinke, the chances were (.745) ^ 38 = 1 in 72,000. So in fact, due to the far tougher environment, Greinke's streak was actually tougher to accomplish than Drysdale's!
Actually, the numbers are so close that you would have to conclude that both streaks were equally as difficult - the potential error in making our above estimates and assumptions are far greater than this tiny difference. Even so, to the average fan it probably comes as a shock that the two streaks are even in the same company - Drysdale's streak is a celebrated piece of history, while in 40 years Zack's streak is unlikely to be remembered by anyone other than Mrs. Greinke and a few die-hard Royals fans.
In any case, it illustrates the importance of considering the time and place of a player's performance. If the two players were competing in equal environments, there's no question that Drysdale's streak would be a far greater accomplishment (when both have a shutout inning probability of .80, the chances are 1 in 5,000 for a 38 game streak, 1 in 400,000 for a 58 game streak). But they weren't and as a result, Greinke's streak is actually every bit as impressive as the Hall of Famer's. So while he won't get the acclaim, here's one writer who wants to say congrats to Greinke for matching Drysdale's timeless accomplishment.
| Baseball Beat | May 04, 2009 |
What's in a Name?
I have republished a few of my Dad's articles over the years in a series I dubbed the best of George Lederer. As longtime readers of this site know, he covered the Los Angeles Dodgers for the Long Beach Independent, Press-Telegram from 1958-1968 prior to serving as Director of Public Relations and Promotions for the California Angels from 1969-1978.
The following article, which was actually written about Dad rather than by him, appeared on the front page of the I, P-T sports section on August 11, 1971. Penned by Don Merry, the Angels' beat writer at that time (who later covered the Los Angeles Rams), the story wrapped around to the second page and was next to "Marichal tosses 2-hitter" and "Dust off mugs, Harmon finally rips 500th HR."
I was reminded of this article when Larry Diel, a family friend, gave it to my brother Tom last month. Larry, who was the first player ever selected in the amateur draft by the Montreal Expos, had cut it out of the newspaper 38 years ago and kept it in his possession for nearly four decades. Larry (in the middle), Tom (on the right), and I (on the left) met up for an Angels game against the Oakland A's in April and we reminisced about the article in question.
As a wordsmith with a sense of humor, Dad created a number of All-Star teams "based solely on names" as the article states. I can remember him putting together these lists at home on his typewriter using Western Union "yellowish" colored paper. Rereading the original newspaper article brought back lots of memories that I wanted to share. Enjoy!
What's in a name? Try these for sizeAngels' PR chief finds anecdote for losing
NEW YORK — This has been a season of frowns and grimaces around Anaheim Stadium.Laughter has been conspicuous by its absence. Somehow, there's nothing funny about being eight games under .500 and on a treadmill to nowhere in particular.
With this in mind, George Lederer decided it was time to inject a little humor into what has been a summer of sorrow. It is also assumed that Lederer, the former I, P-T staffer who is now Director of Promotions for the Angels, was attempting to divert attention from the field of play when he went about the task of devising several All-Star teams, based solely on names.
Without so much as an apology to Arch Ward, the late Chicago scribe who was responsible for the first midsummer classic in 1933, Lederer delved into the nearest baseball encyclopedia and emerged with the following, which, by the way, you'll not find among the archives at Cooperstown.
Leading off, naturally, is the Drinking Team, a subject close to the hearts of all press box inhabitants.
The catcher is Norm Sherry with an infield of Hal Chase, Eddie Joost, Bobby Wine and Harmon Killebrew. The outfield includes George Case, Goose Goslin and Johnny Hopp with Jim Bottomley and Jim Hickman in reserve.
The pitching staff of imbibers is awe-inspiring and features Bob Gibson, Jim Brewer and Pedro Borbon of modern vintage and such fully-aged names from the past as Chief Bender, Babe Birrer, John Boozer and Hollis Thurston.
Branch Rickey would be the general manager, Jigger Statz the field manager and the announcer, without peer, would be Milwaukee's Tom Collins. Hic.
Fortified by this success, Lederer plunged ahead and concocted what he calls his Cut-Up Team. Andy Seminick is the catcher with an infield of Rip Collins, George Cutshaw, Stan Hack and John Goryl and an outfield of Ray Blades, Bob Skinner and Jimmy Piersall.
For pitchers, there's Larry Staab, Steve Barber and Johnny Klippstein. The announcer? Who else but Harry Caray.
Having been a sportswriter for many years, Lederer naturally met his share of animals — or athletes as they are sometimes known in politer circles. Therefore, his All-Animal team. To wit:
Catchers, Joe Pignatano, Paul Ratliff and Don Leppert. Infielders, George Crowe, Nellie Fox, John (Spider) Jorgensen and Larry Bowa. Outfielders, Billy Cowan, Ducky Medwick and Estel Crabtree. Pitchers, Bob Moose, Bob Veale, Ray Lamb, Jim Kaat, Ted Lyons, Wally Wolf and, stretching a point, Dave La Roche.
For an announcer, who can top Jerry Doggett?
A God-fearing individual, Lederer also produced a Religious Team featuring Dixie Parsons, Jim Gentile, Johnny Temple, Charlie Neal, Max Bishop, Bob Christian, Dave Pope, Jose Cardenal, Bubba Church and Johnny Podres.
His Weather Team is composed of Merritt Ranew, Bob Hale, Joe Kuhl, Frankie Gustine, Gene Freese, Sonny Jackson, Curt Flood, Gordie Windhorn, Ron Weatherly, Denny Galehouse, Dick Drott, Don Drysdale and Bob Clear.
Listed on Lederer's Musical Team were the catching combination of Tookie Gilbert and Haywood Sullivan while others included Marty Keough, Rogers Hornsby, Sal Bando, Lou Stringer, Tommy Harper, Gus Bell, Ron Woods, Bill Singer, Bill Voiselle and Fred Toney. Cal Drummond heads the umpiring crew.
Showing his diversification, Lederer dreamed up a Lovers Team with Paul Casanova, John Romano, Dee Fondy, Jerry Priddy, Bobby Valentine, Rico Petrocelli, Sandy Amoros, Chuck Diering, Howie Bedell and George Brunet.
For a Trainer's Team or Hospital Team our man with the fertile mind came up with Elvin Tappe, Dave Ricketts, Cotton Nash, Jimmy Bloodworth, Eddie Pellagrini, Sibby Sisti, Earl Rapp, Johnny Groth, Johnny Callison, Jack Aker, Vic Raschi, Ray Scarborough, Phil Paine and Duane Pilette. The umpire is Hank Soar and Charlie Gassaway is the trainer.
"Eddie Pellagrini is my favorite," Lederer said. "Pella-GREENIE, get it?"
Finally, after working night and day for three weeks without much food or drink and, naturally, sleep, the hungry Lederer capped things with his Gourmet Team:
Del Rice, Danny Cater, Cookie Rojas, Pie Traynor, Gene Baker, Wally Berger, Zack Wheat, Billy Hamilton, Norm Bass, Woody Fryman, Gordon Maltzberger, Johnny Kucks and Chico Salmon. Beans Reardon is the arbiter.
"With this out of the way," Lederer explained, "all I need to worry about is if I still have a job with the Angels."
That and potential libel suits.
— Don Merry
Just as Eddie Pellagrini ("Pella-GREENIE, get it?") was Dad's favorite on his All-Star teams, the inclusion of the light-hitting infielder from the late-1940s and early-1950s brings a big smile to my face to this day. Pellagrini's name on the Trainer's Team says a lot about yesteryear and should serve as a reminder that baseball has never been as pure as today's critics of the steroids era would like to think.
On a separate note, which active players or even those from the 1980s and 1990s would qualify for these teams? Feel free to add players or create your own teams in the comments section below.
| Behind the Scoreboard | May 02, 2009 |
How Not to Price Your Tickets - A Look at New Yankee Stadium
This week brought the news that the Yankees - yes those Yankees - were lowering ticket prices on their most expensive premium seats due to sagging demand and embarrassing empty seats.
The problem, of course, was the outrageously expensive cost of sitting in the premium seats, compared to the relatively modest cost of sitting elsewhere. Sure, there will be a few people who will pay top dollar to sit in the best seats in the house, but how many people are willing to pay $2,500 when you can get in the park for just 14 bucks?
Steinbrenner has admitted that he's overpriced the tickets, but just how badly did the Yankees botch their ticket prices? For this I compared the Yankees prices from their ticketing website to the median ticket price for all other stadiums built in this same neo-classic era for a variety of approximate seat locations. I then compared this to the prices you could get for the same seats on StubHub, the ticket re-seller which has thousands of tickets sold by fans for each game. Since markets tend to get closer to their true value as the event nears, I took two upcoming games - this Sunday's game against the LA Angels (for which the weather is supposed to be terrible) and for Tuesday's game against the Red Sox (the weather still won't be great, but it's the Red Sox) for comparison. The following chart shows the difference between the prices in a variety of sections.
As you can see, the true value of the tickets according to StubHub are closer to the MLB median ticket prices than the exorbitant face value of the seats in a lot of cases. Anyone planning to go to the games this week ought to think twice before buying tickets at the box office because clearly deals can be had. It's also readily apparent that the Yankees did indeed overprice their high-priced tickets compared to their nosebleeds and bleachers.
For the Angels game, the only tickets going for more than face value were the bleacher seats. Meanwhile, the $100-plus seats were going for about a third or a quarter of their face value. For Tuesday's Red Sox game, the tickets were going for about double the price of the LA game across the board. This means that while bleacher seats are going for double their face value, the fancy seats are still going for well under face, meaning that a lot of them are presumably unsold, leading to a lot of pictures such as this one.
So what did the Yankees do wrong? The average team was selling their excellent (but not “premium” seats) for about $70, while their decent seats (poor lower level seats or good upper level seats) were going for about half of that. The cheap seats in the outfield or down the lines in the upper deck were going for about a quarter of that amount. But the Yankees didn’t follow that pricing structure at all. Instead, they priced the good seats at $375, about four times more than the decent seats, and about eight times more than the nosebleeds and bleachers. This leads to a huge chasm in pricing sections and the empty seats in the good sections that we keep hearing so much about. As the StubHub data shows (which is similar to most teams’ pricing structure of half-price for decent seats, one quarter of the price for nosebleeds), it’s simply not worth that much extra to get that much closer at a ballgame.
However, the Yankees were just the latest team to push the envelope in what has become an increasing trend. Baseball ticket prices have undergone a revolution in the last 10 to 15 years, with teams figuring that people are willing to pay a lot more based on seat location. It used to be that when you walked up to the ticket counter, you'd ask for the best available seat. Usually the really good seats were already sold, or taken by season ticket holders, but if you could get your hands on a good ticket, you'd take it, knowing that you could do so without breaking the bank. It was usually worth the extra few bucks to sit up front.
A look at National League ticket prices based on the 1993 National League Greenbook (ticket price information is that annoying type of data that's ubiquitously available at the time, but surprisingly difficult to find even a short while later) shows a few surprising things. You can see the approximate pricing difference here, though with less detailed seat locations than the previous charts:
First off, the prices in general were a lot lower. Even after adjusting for inflation, the median highest priced ticket among the 12 teams was $20. Those prices today are unfathomable in any ballpark, not just in New York. The median ticket price has tripled over the past 16 years from $14 to $40 (again this assumes the same number of seats in each section, so it's not perfectly accurate - it's probably on the high side).
Second, there were far fewer price levels. A cruise around the MLB ticket websites will reveal a dizzying array of price levels and seating options. You can't really tell from this chart, but in 1993 each team had just three to five price levels, with the typical arrangement being a box seat, terrace seating, reserved seating, and general admission or bleacher seating
Today of course, teams have realized that seat location matters a great deal, and four or five price sections won't do. Their theory is that more price points make for a fairer pricing system, with each patron getting the seat they paid for. In the old days however, there wasn't that much difference in price between the good and bad seats anyhow, which brings me to my next point.
Not only have ticket prices been raised dramatically since 1993, but it's primarily the good seats that have gone up the most. While ticket prices have tripled, the spread of the ticket prices has also increased. No longer can you pay an extra $10 and get the best seat in the house. While the top seats used to be $20, now the best seats in the house have increased tenfold at over $200 a pop. Even among the non-premium seats, this trend is true. Nosebleed seats have doubled from about $7 to $14, but the field boxes, the mezzanine seating and the best outfield seats have increased three or four fold. The standard deviation of the 1993 ticket prices (and again this is very crude because it assumes there are the same number of seats in each section I outlined) was just $4.80, but in 2009 this standard deviation was a whopping $55.80 - a remarkable increase in spread. Even when excluding the "premium" seats the standard deviation was over $20.
Another interesting difference is that in 1993, all teams priced their tickets around the same. The following chart shows the standard deviation between teams for each type of ticket.
As you can see, there was fairly little difference in pricing between teams in 1993 - the ticket prices for each team are the same give or take a couple bucks. Now however, the differences in ticket prices are dramatic, particularly for good seats. The only real consensus is in the back of the upper deck where teams think they should be priced at $12, give or take $4. If you walk into a random ballpark and ask for a decent lower level seat, you'll get a vastly different answer depending on the ballpark - the median price is $52, but the standard deviation of that price is $63! You can get one for as little as $27 in Pittsburgh or as much as $375 at New Yankee Stadium.
A final observation about the 1993 ticket prices is that teams didn't have differing prices based on opponent, time of the year, etc, like they do today. The Chicago Cubs were the only team which practiced any type of this, and they did so by raising their prices by $1 for weekend and night games. Now, almost every team varies their prices based on a myriad of factors, and charges "premium" prices for certain games.
So, where does that leave us as fans? Certainly the tickets are never going back to the way they were when we were kids. Teams have realized that certain games and certain seats demand higher prices and they are charging those higher prices. But this latest Yankees debacle may be the beginning of a reversing trend. The Yankees and Mets both have been burned by their gouging and the Nationals also were burned by this pricing structure last year in their new ballpark. For many games, the attendance would be fairly low, but all of the decently priced seats would unavailable, locking out the average fan and creating quite an odd pattern of seating at the ballpark. The long term effects of this pricing is unknown and teams may be wise to that fact that this could be detrimental. For instance, one of the incentives of getting season tickets used to be that over time you could move up into really good seats - but now, the really good seats are unaffordable to a lot of people - so where's the incentive?
How baseball teams go forward with their pricing is unknown, but taking a look back sure makes you long for 1993 again.
| Baseball Beat | May 01, 2009 |
Foto Friday #10: Swing and a Miss
Reader Gilbert Chan submitted the following photo and suggested I use it for a Foto Friday. The batter is plainly obvious. Can you name the catcher, the invisible pitcher, outcome of the at-bat and game, opposition, location, and date?
As always, good luck and have fun.
Here are the links to our previous nine Foto Fridays:
Foto Friday #1: August 18, 2006 (Hank Aaron and Jim Gilliam at McKechnie Field, March or April 1958.)
Foto Friday #2: September 8, 2006 (The Dodgers celebrate clinching the N.L. pennant in 1963.)
Foto Friday #3: November 3, 2006 (Bobby Valentine and Earl Weaver meet with umpires at home plate prior to a game on July 9, 1974.)
Foto Friday #4: February 9, 2007 (Don Drysdale blanks Giants, September 6, 1960.)
Foto Friday #5: April 13, 2007 (Ted Williams at-bat and Roy Campanella behind the plate in a spring training game, circa March 1952-1957.)
Foto Friday #6: July 6, 2007 (The Dodgers and Danny Kaye in the locker room after beating the Phillies in the first game of a doubleheader, the club's 12th consecutive victory, on June 1, 1962.)
Foto Friday #7: August 3, 2007 (Head and shoulder photos of obscure Angels.)
Foto Friday #8: August 22, 2008 (Hank Bauer, Norm Siebern, and Yogi Berra in the visitor's clubhouse in Cleveland Municipal Stadium. Bauer, Siebern, and Berra all hit home runs to lead the Yankees to a 9-4 victory over the Indians on June 17, 1956.)
Foto Friday #9: January 2, 2009 (Bobby Bonds sliding into second base as Jerry Remy applies the tag at Anaheim Stadium on August 10, 1975.)
| F/X Visualizations | May 01, 2009 |
Pena and Quentin: Home Runs from Down and Away
Before the season I looked at home run rate (per pitch) by pitch location. In that post I found that the highest home run rate was slightly up and in within the strike zone, a finding which has since been confirmed and expanded by Jonathan Hale. That post also presented some hitters who hit lots of home runs outside of that up and in region. Two examples I gave were Carlos Pena and Carlos Quentin. Here are the images I presented, with the average HR rate of all LHBs for Pena and RHBs for Quentin in gray and their 2007 and 2008 home runs plotted over that in red. Remember these images are from the catcher's perspective so Pena, a LHB, stands to the right of the strike zone and Quentin to the left of the zone.

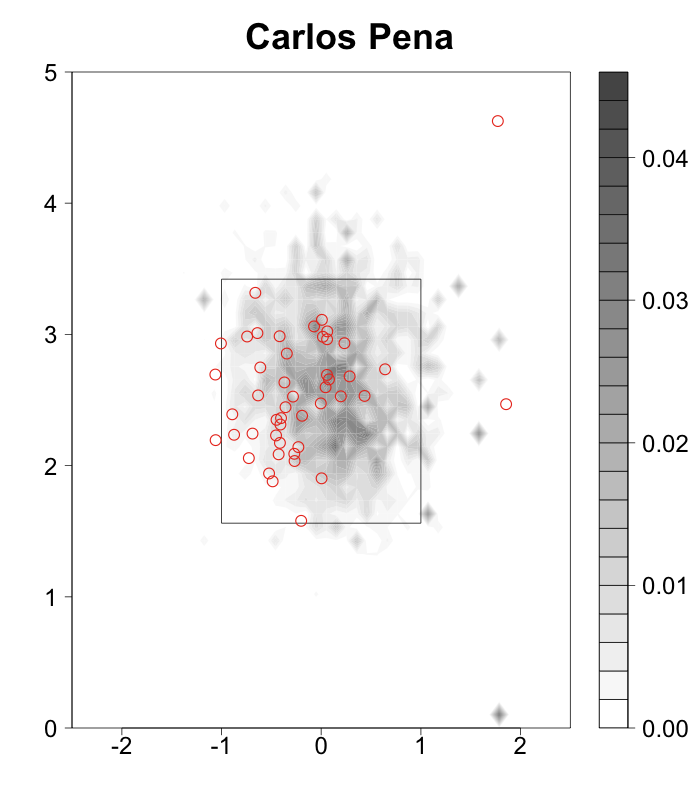
Both hit most of their home runs down and away, and very few in the traditional power region up and in. They also happen to be at the top of this year's early HR leader board, Pena tied for the lead with nine and Quentin just one behind with eight. It was interesting for me to see the two of them at the top of the list after profiling their abnormal home run hitting patterns before the season, so I wanted to check the pitch locations of their home runs so far this year. I used the images from above, shrunk the 2007 and 2008 home run indicators a little and plotted the 2009 home runs with larger circles.
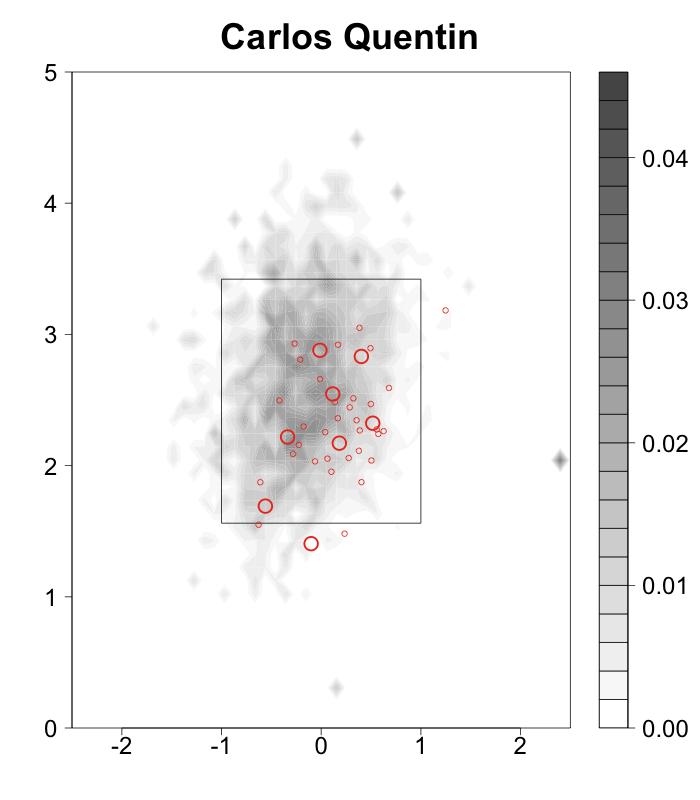
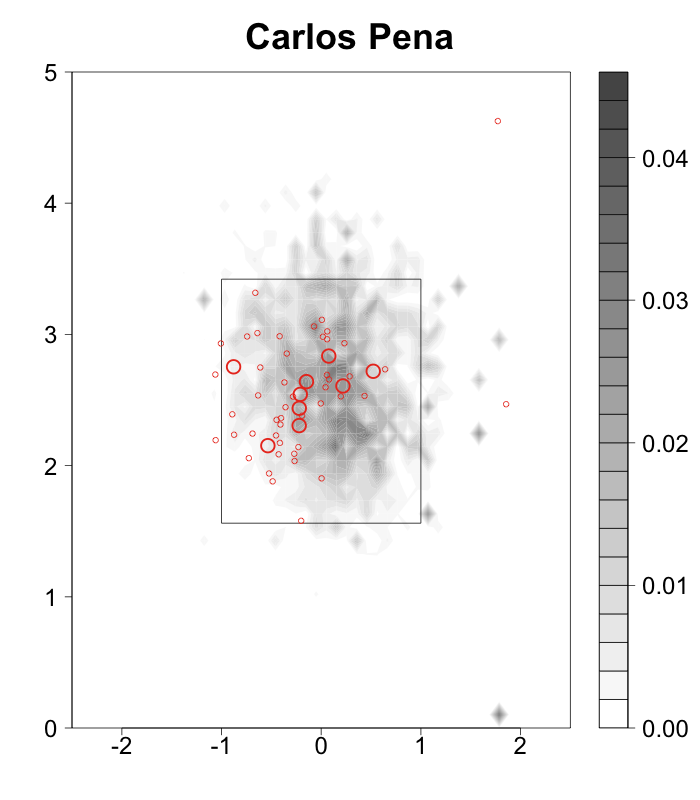
The home run locations are still fairly different from the average hitter and pretty close to the 2007 and 2008 locations. The centroid of Pena's 2007 and 2008 home runs was (-0.10,2.39) and of his 2009 home runs (-0.16,2.56). So his home runs so far have been even more outside than the last two years and slightly higher. Quentin's '07/'08 home run centroid was (0.18,2.33), and his '09 home run centroid is (0.03,2.26). So his home runs have moved in, but are even lower in the zone than the last two years. Both are still hitting more home runs in the outside half than in the inside half of the zone, which is very different than the average hitter. It is interesting that these two top home run hitters generate so much power in a location where most hitters have a near zero home run rate.
EDIT:In the comments Rich asked a great question about what type of pitches Quentin and Pena are hitting for home runs. Here is the breakdown of home run rate per pitch by pitch type for each of them and the over all league average.
+-------------------+-------------+-------------+-------------+
| HR rate per pitch |     Quentin |        Pena | Leag. Aver. |
+-------------------+-------------+-------------+-------------+
| Fastballs         |      0.0174 |      0.0163 |      0.0071 |
| Changeups         |      0.0132 |      0.0068 |      0.0075 |
| Sliders           |      0.0104 |      0.0180 |      0.0056 |
| Curveballs        |      0.0275 |      0.0089 |      0.0049 |
+-------------------+-------------+-------------+-------------+
Pena's per pitch rates are lower than Quentin's but his over all number of home runs is higher because he sees more pitches per plate appearance (4.0 versus 3.6). For almost every pitch type they hit more than league average, but the difference is very high for Pena with sliders and for Quentin with curves. So I graphed their home runs by pitch type.
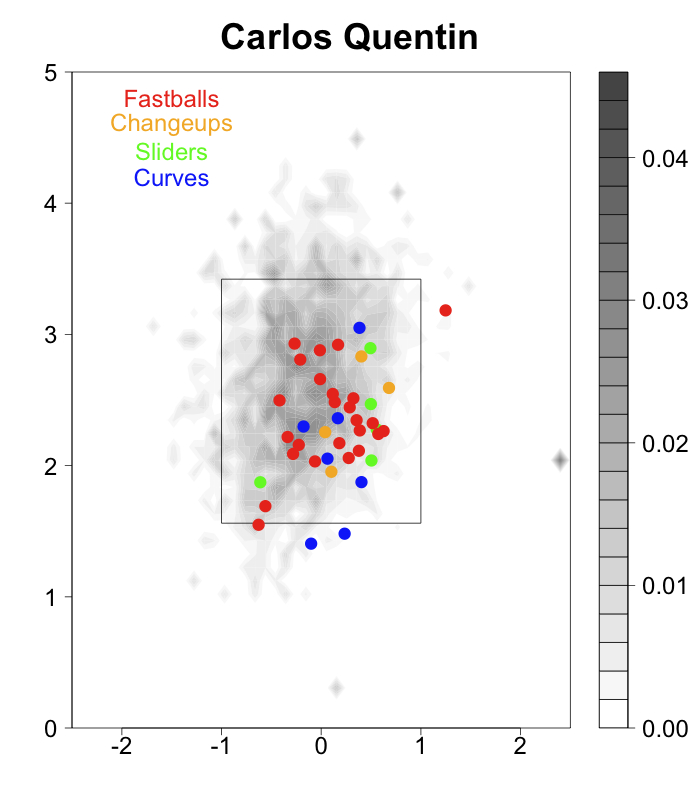
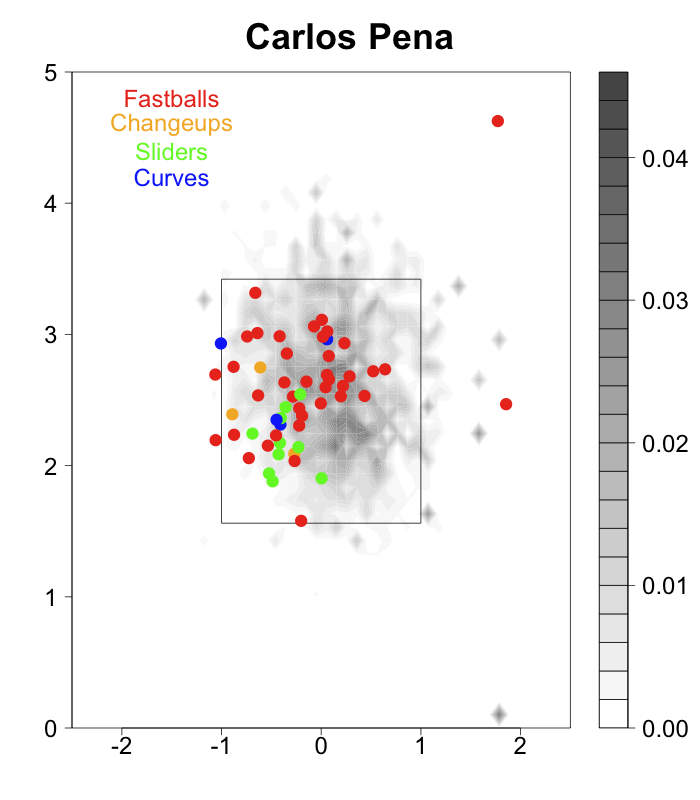
It looks like sliders for Pena and curves for Quentin are really pulling their average location down and away. Their fastballs are a little bit more away and down than the average hitter, but I think what makes their home run locations particularly distinctive is the large amount of breaking pitches they hit for home runs which are down and away. From Hale's article it does not look like most hitters sliders and curves for home runs in these locations. Great question Rich.
EDIT 2: Rich made another great suggestion of looking at the locations of where all these home runs ended up. First Quentin:
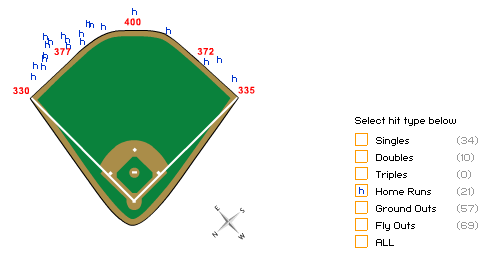
Rich's take, which I agree with:
I was surprised how many home runs he's pulling given your findings. I think it shows how strong he is as the average hitter wouldn't be able to turn on those breaking balls on the outer half of the plate like Carlos.
Now Pena:
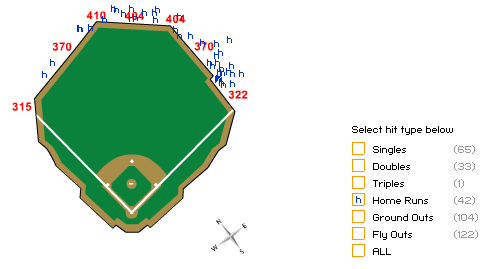
Pena is hitting lots to dead center. It would be interesting to combine the two data sets, and see how the location of the pitch corresponds to the location of the home run, like Max Marchi did here. Or look at how the location of home run corresponds to the pitch type.