Rich Lederer • Baseball Beat
Patrick Sullivan • Change-Up
Jeremy Greenhouse • Touching Bases
Dave Allen • F/X Visualizations
Sky Andrecheck • Behind the Scoreboard
Marc Hulet • Around the Minors
Al Doyle • Past Times
Retired Uniforms:
Bryan Smith • WTNY
Joe Sheehan • Command Post
Jeff Albert • The Batter's Eye
RSS Feed
Home
*Examining the Past, Present, and Future*
Lineup Card
Recent Entries
» Putting Together a Reality Team
» Historical Hall of Fame Vote Comparisons: 2012
» An All-Christmas Team
» The New-Look Angels
» John Denny: The Forgotten Cy Young Award Winner
» Money Isn't Everything
» What Would It Take to Hit .400 in the 21st Century?
» Halos Heaven
» Brandon McCarthy's Breakout Season
» Link-o-Rama
» Historical Hall of Fame Vote Comparisons: 2012
» An All-Christmas Team
» The New-Look Angels
» John Denny: The Forgotten Cy Young Award Winner
» Money Isn't Everything
» What Would It Take to Hit .400 in the 21st Century?
» Halos Heaven
» Brandon McCarthy's Breakout Season
» Link-o-Rama
Best of Baseball Beat
Abstracts From the Abstracts
1977 Baseball Abstract
1978 Baseball Abstract
1979 Baseball Abstract
1980 Baseball Abstract
1981 Baseball Abstract
1982 Baseball Abstract
1983 Baseball Abstract
1984 Baseball Abstract
1985 Baseball Abstract
1986 Baseball Abstract
1987 Baseball Abstract
1988 Baseball Abstract
1978 Baseball Abstract
1979 Baseball Abstract
1980 Baseball Abstract
1981 Baseball Abstract
1982 Baseball Abstract
1983 Baseball Abstract
1984 Baseball Abstract
1985 Baseball Abstract
1986 Baseball Abstract
1987 Baseball Abstract
1988 Baseball Abstract
Bert Blyleven Series
Meeting Up and Hanging Out with Bert
The Results Are In And...
Aficionado Heavily Invested in Blyleven
Latest on Blyleven's Chances for the HOF
The Internet Zealot Responds
400 Down and 5 to Go...
Bert Be Home By Eleven?
Blyleven's Forgotten Season (1973)
HeyMan, Your Comments Don't Hold Water
The Waiting is the Hardest Part
Another Addition to the Blyleven Series
Search for the Truth
As Dominant as His HOF Contemporaries
Listen, Buster
A Larger Step for Blyleven
Answering the Naysayers (Part Two)
Another Small Step for Blyleven
Q&A: Blyleven on the Twins
The Majority Rules, Right?
It's All Dutch to Some
The Hall of Fame Case for Bert Blyleven
Q&A: Blyleven on Felix Hernandez
Clemens Rocketing Up Charts
Poz: An Interview With a KC Star
A HOF Chat with Tracy Ringolsby
Up Close and Personal
A Peek Into the Mind of a HOF Voter
Answering the Naysayers
It's That Time of the Year (Again)
"If Cooperstown is Calling..."
The Bert Alert
One Small Step for Blyleven...
Only the Lonely
Exclusive Interviews
Lee Sinins
Alex Belth
David Pinto
Will Carroll
Mike Carminati
Aaron Gleeman
Joe Sheehan
Jay Jaffe
Jeff Peek
Tracy Ringolsby
Joe Posnanski
Bill James Part I, II, III
Jon Lalonde
Chuck Tiffany
Dayn Perry
Fay Vincent
Nate Silver
Alex Belth
David Pinto
Will Carroll
Mike Carminati
Aaron Gleeman
Joe Sheehan
Jay Jaffe
Jeff Peek
Tracy Ringolsby
Joe Posnanski
Bill James Part I, II, III
Jon Lalonde
Chuck Tiffany
Dayn Perry
Fay Vincent
Nate Silver
Bullpen
Rich Lederer
The Odd Couple (with Alex Belth)
The MostUnder Over Underrated Player in Baseball (with Brian Gunn)
Three Wise Men (roundtable by Alex Belth)
Infrequently Asked Questions (interview with Matt Welch)
Interview (Orioles Think Tank)
Bernie and the Yanks (Bronx Banter)
Hope and Faith: How the LAA Win the World Series (Baseball Prospectus)
NL West (The Soul of Baseball)
Greatest Living Hitter? (Sports Illustrated)
Roundtable: 2008 HOF Ballot (Armchair GM)
The Most
Three Wise Men (roundtable by Alex Belth)
Infrequently Asked Questions (interview with Matt Welch)
Interview (Orioles Think Tank)
Bernie and the Yanks (Bronx Banter)
Hope and Faith: How the LAA Win the World Series (Baseball Prospectus)
NL West (The Soul of Baseball)
Greatest Living Hitter? (Sports Illustrated)
Roundtable: 2008 HOF Ballot (Armchair GM)
Patrick Sullivan
Designated Hitters
David Bromberg (Q&A: John Denny)
Mark Armour (H. Killebrew and Versatility)
Joe Lederer (Soundtrack of a Prospect)
David Bromberg (Clemente's Autograph)
David Bromberg (Woody Fryman)
D. Baumstein (WAR Against Age: Pitchers)
Doug Baumstein (The WAR Against Age)
Doug Baumstein (A Lifetime on the Road)
John Fraser (Pick Six)
Mark Armour (How to Score More Runs?)
Bill Parker (What Opening Day Tells Us)
Stan Opdyke (Pat Rispole)
Chris Jaffe (Evaluating Baseball's Mgrs)
Stan Opdyke (Baseball Radio in NYC, 1953)
A. Nathan (Performance of Baseball Bats)
Michael Weddell (Edgar Martinez/HOF)
Jon Weisman (100 Things Dodgers Fans...)
Stan Opdyke (Connie Mack and Vin Scully)
Eric Walker (Evaluating Run Production)
Brent Mayne (The Intangibles of Catching)
Chris Moore (Best Fastballs in Baseball)
Dave Baldwin (The Batter’s Brain)
Shawn Haviland (Ivy League to MLB)
Larry Granillo (Walking Off)
Rob Iracane (Solo HR Won't Break You)
Tommy Bennett (Charm of AM Radio)
Harry Pavlidis (Johan Santana's Fast Start)
John Walsh (WAR and Remembrance)
Eric Walker (Precisely Inaccurate)
Bob Timmermann (As They See 'Em)
Geoff Young (Unicycles and Delusions)
Baseball Analysis at Tufts (Groundballers)
Baseball Analysis at Tufts (GB Out Rates)
G. Rybarczyk ('09 Hit Tracker Projections)
Joe Lederer (Curt Schilling/HoF)
Conor Gallagher (Hall of Fallacies)
Chris Green (Jim Rice, HoF, the Numbers)
Shawn Hoffman (Baseball's Bear Mkt?)
Paul Anthony (Manny Syndrome)
Ross Roley (World Series Odds)
B. Timmermann (Catcher's Interference)
R.J. Anderson (Waiting the Hardest Part)
Maury Brown (Cubs, MLB, and Cuban...)
Myron Logan (Dee-Fense, Dee-Fense)
Craig Calcaterra (Frivolity, Part I, Part II)
Chad Finn (Ode to Baseball Cards)
David Cameron (Mariners Foibles)
Chris Dial (Chipper Jones)
Pat Lederer (Memory Lane)
David Appelman (Clutch Pitching)
Bob Rittner (DH)
Jonathan Mayo (Roger Clemens)
Lisa Winston (My Son-in-Law...)
Russ McQueen (The Yellow Hammer)
Bob Rittner (I'm OK, You're OK)
Mark Armour (In Defense of the HOF)
Pat Jordan (Friends)
Dan Levitt (Analysis of Terry Ryan)
Doug Baumstein (Trading Econ 101)
Ross Roley (Runner's Reluctance II)
Ross Roley (Runner's Reluctance I)
Mark Armour (No-Longer Lovable Sox)
Bruce Regal (Stealthy and Wise)
Brian Gunn (Roid Monster)
Current/McEvoy (Value of the SB)
John Rickert (Sinister Thefts)
Nate Silver (Sabermetrics)
David Vincent (Home Run Production)
Joe P. Sheehan (Enhanced Gameday II)
Mark Armour (An Ode to Sport)
David Gassko (All-Time Worm Burners)
Joe P. Sheehan (Enhanced Gameday)
John Walsh (When Titans Clash)
Fox/Williams (Quantifying Coaches II)
Fox/Williams (Quantifying Coaches I)
Jacob Luft (Bull Durham Rant)
Chad Finn (Strat-O-Matic)
Lisa Winston (Rotisserie Baseball)
Dave Studeman (Baseball Stats)
Steve Treder (Roger Craig)
Marc Normandin (Jeff Bagwell)
D. Appelman (Expanding Strike Zone)
Jeff Sackmann (Worst MiL Defenders)
Jeff Sackmann (Best MiL Defenders)
Maxwell Kates (Van Lingle Mungo)
David Appelman (Pitch Location)
Kent Bonham (Danny Ray Herrera)
Glenn Stout (Two Baseball Poems)
Bruce Regal (The Challenge Round)
Mark Lamster (Barry & Ty)
Geoff Young (NL West)
Tom Lederer (The Ryan Express)
Brian Erts (Great Leap Forward)
David Pinto (Parity and the N.L.)
Jacob Luft (Fathers and Daughters)
Jamey Newberg (Pete's Sake)
Jeff Albert (A. Jones Swing Analysis)
Jeff Albert (A-Rod Swing Analysis)
Keith Law (Death, Taxes, and Waivers)
Peter Abraham (Tales of Torre Tales)
Larry Borowsky (Let 'er Rip II)
Dan Levitt (Empirical Analysis of Bunting)
Jonah Keri (If I Met Warren Cromartie...)
Bob Klapisch (War Stories)
Bob Timmermann (John F. Kennedy HS)
Kent Bonham (Aluminum Adjustments)
Al Doyle (More Than Superstars)
Ross Roley (Instant Replay)
David Vincent (Barry Bonds Homers)
Chad Finn (Our Favorite Obscurities)
Bill Deane (1979 NL MVP)
Mark Armour (Rise/Fall of Artificial Turf)
Jeff Angus (Wally Moon Camp)
David Berri (Money and Baseball)
Larry Borowsky (Baseball w/o the #s)
Derek Zumsteg (The Irrational Market)
David Regan (Free Agent Contracts)
Peter Schmuck (Steroids and the HOF)
David Appelman (Pitchers, Pitch by Pitch)
Dan Fox (Swinging, Taking, Fouling, Etc)
Patrick Sullivan (Study of NYY CF/BOS LF)
Will Leitch (Baseball Journalism)
Jeff Sullivan (Pitcher Release Points)
Steve Treder ('69-'70 Giants)
Maury Brown (Charlie Finley)
John Brattain (Bob Johnson)
Bob Klapisch (The Case for Bert Blyleven)
Jeff Peek (Pride and Prejudice)
Dayn Perry (Bert and Warren)
Rob Neyer (If Don Sutton Was Great...)
Lisa Winston (Minor League Memories)
Alex Belth (Otis Redding Was Right)
David Cameron (Long Live the King)
Jeff Angus (Baserunning Study)
Bert Blyleven (Baseball Playoffs)
Boyd Nation (Not a Prospect List)
James Click (Batters-Baserunners Study)
Jeff Shaw (Why I Love Baseball)
David Gassko (BIP/BFP Fielding Study)
Jay Jaffe (Milwaukee Sausage Race)
Jamey Newberg (Remember When)
Bob Klapisch (Press Box to the Mound)
Dan Levitt (Predictive Value of BB)
David Vincent (Official Scorer)
Jon Weisman (Rick Monday)
Larry Borowsky (Let 'er Rip)
Will Carroll (Fictional Short Story)
Bob Timmermann (Japanese Baseball)
Cyril Morong (Best Pitching Seasons)
Sean Forman (Monte Carlo Win-Loss)
Brian Gunn (My Little Blue Book)
Joe Lederer (My Dad and Baseball)
Bill Deane (Bob Gibson, 1968)
Mark Armour (1977 Yankees)
Darren Viola (Retrosheet)
David Pinto (RFK)
Dayn Perry (Brave Heart)
Matt Welch (Dave Hansen)
Kevin Kernan (Jack McKeon)
Tom Lederer (Dodgers Road Trip)
Steve Lombardi (Slider)
Studes (Picturing Baseball)
Mike Carminati (Luck of the Drawl)
Eric Neel (Vin Scully)
J.C. Bradbury (Leo Mazzone)
John Sickels (Bill James)
Search Baseball Analysts
Archives
By Category:
Around the Majors Content Only
Around the Minors Content Only
Baseball Beat Content Only
Baseball Beat/Change-Up Content Only
Baseball Beat/WTNY Content Only
Behind the Scoreboard Content Only
Change-Up Content Only
Change-Up/Around the Majors Content Only
Command Post Content Only
Crunching the Numbers Content Only
Designated Hitter Content Only
F/X Visualizations Content Only
Past Times Content Only
Saber Talk Content Only
The Batter's Eye Content Only
Touching Bases Content Only
Weekend Blog Content Only
WTNY Content Only
By Month:
February 2012
January 2012
December 2011
October 2011
September 2011
August 2011
July 2011
June 2011
May 2011
April 2011
March 2011
February 2011
January 2011
December 2010
November 2010
October 2010
September 2010
August 2010
July 2010
June 2010
May 2010
April 2010
March 2010
February 2010
January 2010
December 2009
November 2009
October 2009
September 2009
August 2009
July 2009
June 2009
May 2009
April 2009
March 2009
February 2009
January 2009
December 2008
November 2008
October 2008
September 2008
August 2008
July 2008
June 2008
May 2008
April 2008
March 2008
February 2008
January 2008
December 2007
November 2007
October 2007
September 2007
August 2007
July 2007
June 2007
May 2007
April 2007
March 2007
February 2007
January 2007
December 2006
November 2006
October 2006
September 2006
August 2006
July 2006
June 2006
May 2006
April 2006
March 2006
February 2006
January 2006
December 2005
November 2005
October 2005
September 2005
August 2005
July 2005
June 2005
May 2005
April 2005
March 2005
February 2005
January 2005
December 2004
November 2004
October 2004
September 2004
August 2004
July 2004
June 2004
May 2004
April 2004
March 2004
February 2004
January 2004
December 2003
November 2003
October 2003
September 2003
August 2003
July 2003
June 2003
Reference
Organizational Stats
Arizona Diamondbacks Bat / Pitch
Atlanta Braves Bat / Pitch
Baltimore Orioles Bat / Pitch
Boston Red Sox Bat / Pitch
Chicago Cubs Bat / Pitch
Chicago White Sox Bat / Pitch
Cincinnati Reds Bat / Pitch
Cleveland Indians Bat / Pitch
Colorado Rockies Bat / Pitch
Detroit Tigers Bat / Pitch
Florida Marlins Bat / Pitch
Houston Astros Bat / Pitch
Kansas City Royals Bat / Pitch
Los Angeles Angels Bat / Pitch
Los Angeles Dodgers Bat / Pitch
Milwaukee Brewers Bat / Pitch
Minnesota Twins Bat / Pitch
New York Mets Bat / Pitch
New York Yankees Bat / Pitch
Oakland Athletics Bat / Pitch
Philadelphia Phillies Bat / Pitch
Pittsburgh Pirates Bat / Pitch
St. Louis Cardinals Bat / Pitch
San Diego Padres Bat / Pitch
San Francisco Giants Bat / Pitch
Seattle Mariners Bat / Pitch
Tampa Bay Devil Rays Bat / Pitch
Texas Rangers Bat / Pitch
Toronto Blue Jays Bat / Pitch
Washington Nationals Bat / Pitch
All-Star Links
Official Websites
News and Notes
Baseball News Blog
Baseball Newstand
ESPN Baseball
Fox Sports Baseball
Pro Sports Daily
Roto World
The Roto Times
USA Today Baseball
Baseball Newstand
ESPN Baseball
Fox Sports Baseball
Pro Sports Daily
Roto World
The Roto Times
USA Today Baseball
Reference and Analysis
Baseball Almanac
Baseball America
Baseball Archive
Baseball Contracts
Baseball Cube
Baseball Graphs
Baseball Library
Baseball Musings Player Database
Baseball Page
Baseball Primer
Baseball Prospectus
Baseball Reference
Baseball Statistics
Baseball Truth
Boxscore Central
Diamond Mind Baseball
Doug's Stats
FanGraphs
Fast Balls (pitchfx catalog)
Hardball Dollars
Hardball Times
Hit Tracker
Retrosheet
Rotobase/Rotoblog
Stat Corner
STATS
Tango on Baseball
Yahoo Sports MLB
Web Gems
Bill James Primer
Sabermetric Manifesto (Grabiner)
Pitching and Defense (McCracken)
Pitching and Defense (Tippett)
Transactions Primer (Neyer)
Baseball Stats (Batter's Box)
Prospect Report (Cameron)
Pitcher Workloads (Sheehan)
Goodbye to Old Baseball Ideas (Rickey)
Sabermetric Manifesto (Grabiner)
Pitching and Defense (McCracken)
Pitching and Defense (Tippett)
Transactions Primer (Neyer)
Baseball Stats (Batter's Box)
Prospect Report (Cameron)
Pitcher Workloads (Sheehan)
Goodbye to Old Baseball Ideas (Rickey)
Columnists
Baseball Blogs
Around the Majors
Athletics Nation
Baseball Crank
Baseball Musings
Baseball-Reference Blog
Batter's Box
Big League Stew
Bronx Banter
Catfish Stew
Cub Town
Dan Agonistes
Dodger Thoughts
DRays Bay
Ducksnorts
Futility Infielder
Halos Heaven
Inside the Rockies
It Might Be Dangerous
Knuckle Curve
LoHud Yankees Blog
Lookout Landing
Management by Baseball
Metaforian
Metsgeek
Mike's Baseball Rants
Only Baseball Matters
Redbird Nation
Red Reporter
Sabernomics (Braves)
Seth Speaks
ShysterBall
6-4-2 (Angels/Dodgers)
The Book
TheCubdom
The Cutting Edge
The House That Dewey Built
The View From The Bleachers
Tiger Blog
U.S.S. Mariner
Viva El Birdos
Where's Kernan
Minor Leagues
Arizona Fall League
BA Player Finder
Cal Leaguers
Jamey Newberg
JDM's Scoresheet Baseball
Minor League Baseball
Minor League Park Factors
Minor League Splits
No Pepper
Sickels' Minor League Ball
Warm October Nights
BA Player Finder
Cal Leaguers
Jamey Newberg
JDM's Scoresheet Baseball
Minor League Baseball
Minor League Park Factors
Minor League Splits
No Pepper
Sickels' Minor League Ball
Warm October Nights
Amateur
Boyd's World (College)
Cape Cod Baseball League
College Baseball Blog
College Baseball Insider
Collegiate Baseball Newspaper
College Splits
College Splits Blog
Dirtbags Baseball (Long Beach State)
NCAA Baseball
NCBWA
Team One Baseball (High School)
Texas A&M & Baseball
Cape Cod Baseball League
College Baseball Blog
College Baseball Insider
Collegiate Baseball Newspaper
College Splits
College Splits Blog
Dirtbags Baseball (Long Beach State)
NCAA Baseball
NCBWA
Team One Baseball (High School)
Texas A&M & Baseball
Historical
Cuban Baseball
House of David
Jim "Mudcat" Grant's Web Page
Negro League Baseball Players Assoc
Negro Leagues Baseball Museum
1919 Black Sox
Pacific Coast League
Philadelphia Athletics Historical Society
Shoeless Joe Jackson Society
SABR-L Archives
Walter O'Malley
House of David
Jim "Mudcat" Grant's Web Page
Negro League Baseball Players Assoc
Negro Leagues Baseball Museum
1919 Black Sox
Pacific Coast League
Philadelphia Athletics Historical Society
Shoeless Joe Jackson Society
SABR-L Archives
Walter O'Malley
Miscellaneous
Forums
Credits
Ticket Center
Tickets to Baseball -
Premium Red Sox Tickets - Tickets to Marlins Games - Cardinals Game Tickets - NY Yankee Tickets - Tickets Oakland Athletics - Dallas Cowboys Tickets - Arizona Cardinals Tickets - Tickets Seattle Seahawks - Buffalo Bills Tickets Online - Tickets to Dolphins Football
Buy Boston Red Sox tickets,
Philadelphia Phillies tix,
NY Yankees tickets,
NY Mets tickets, and
MLB All Star game tickets at ABC tickets
Not sure where to find the best online sportsbooks? Start your search with PlayersJet.
Get deals at SportsMemorabilia.com on baseball apparel, including Phillies jerseys and more for adults and children.
Shop the largest selection baseball equipment on sale at Sports Unlimited. Check out tons of baseball gloves, youth baseball gloves and catchers gear from Rawlings, Wilson, Nike & Under Armour.
2011 Draft Order
Courtesy of Baseball America
First-Round:
 1. Pirates (57-105)
 2. Mariners (61-101)
 3. Diamondbacks (65-97)
 4. Orioles (66-96)
 5. Royals (67-95)
 6. Nationals (69-93)
 7. Diamondbacks (for B. Loux)
 8. Indians (69-93)
 9. Cubs (75-87)
10. Padres (for Karsten Whitson)
11. Astros (76-86)
12. Brewers (77-85)
13. Mets (79-83)
14. Marlins (80-82)
15. Brewers (for Dylan Covey)
16. Dodgers (80-82)
17. Angels (80-82)
18. Athletics (81-81)
19. Red Sox (from DET for Martinez)
20. Rockies (83-79)
21. Blue Jays (85-77)
22. Cardinals (86-76)
23. Nationals (from CWS for Dunn)
24. Rays (from BOS for Crawford)
25. Padres (90-72)
26. Red Sox (from TEX for Beltre)
27. Reds (91-71)
28. Braves (91-71)
29. Giants (92-70)
30. Twins (94-68)
31. Rays (from NYY for Soriano)
32. Rays (96-66)
33. Rangers (from PHI for Lee)
Supplemental First Round:
34. Nationals (Dunn)
35. Blue Jays (Downs)
36. Red Sox (Martinez)
37. Rangers (Lee)
38. Rays (Crawford)
39. Phillies (Werth)
40. Red Sox (Beltre)
41. Rays (Soriano)
42. Rays (Balfour)
43. Diamondbacks (LaRoche)
44. Mets (Feliciano)
45. Rockies (Dotel)
46. Blue Jays (Buck)
47. White Sox (Putz)
48. Padres (Garland)
49. Giants (Uribe)
50. Twins (Hudson)
51. Yankees (Vazquez)
52. Rays (Benoit)
53. Blue Jays (Olivo)
54. Padres (Torrealba)
55. Twins (Crain)
56. Rays (Choate)
57. Blue Jays (Gregg)
58. Padres (Correia)
59. Rays (Hawpe)
| Designated Hitter | May 29, 2010 |
Pick Six
The near perfect website called Baseball Reference rents out the heading sections of its player-pages to help support its unequalled statistical product. Unique to this kind of sponsorship is that the Reference auctions off access to the headings, creating a kind of fan marketplace, with better players yielding higher prices than lesser players. This means the player pages of legends like Ted Williams and Willie Mays are nabbed by blogs or memorabilia companies eager to piggy-back on more visible pages. Yet the lesser, and more importantly cheaper, player-pages typically have far more clever text; usually some blend of sarcasm and nostalgia created by someone very bored and devoid of real commitments, someone like myself.
One of my favorites of this type headlines Giants great Johnnie LeMaster’s page. Submitted by David Rubio, it reads “Underachievers have always had a place in my heart. Johnnie was a favorite of mine.” The LeMaster line led me searching for more. I thought another Giants shortstop would be a natural target for someone with the right love of the esoteric and immature, Jose Uribe. Unfortunately no one had bothered to sponsor poor Jose. But the drifting got me thinking about a question: who is the greatest shortstop to ever play for the San Francisco Giants? My instinct was to dismiss recent players outright, I had watched every shortstop since the mid-80s and not one of them had found a place in my heart. I also knew little about the 6-hole guys who played for the early teams so my curiosity and presumptions led me to the beginning, 1958.
The mid-fifties were not kind to the New York Giants. Although a young Willie Mays had transfixed the city since stepping on the field in 1951, the Giants lingered in the shadows of the two outer-borough clubs for much of decade. The idea of the team moving was also not a novel concept in 1957. The Giants had bounced around Manhattan since the inception of the club in 1883, so news of a potential move rarely startled a fan-base who was so comfortable with moving that they brought the name of their home, the Polo Grounds, to each new stop. Throughout the '50s there was often talk that the team would go west, although most thought Minneapolis-St. Paul the likely place because the Giants AAA affiliate played there and an aggressive group of locals enticed Giants’ owner Horace Stoneham with promises of a world class stadium that fans could actually drive their cars to. And, unlike the Dodgers, who played in the middle of Flatbush just off Prospect Park, the Giants, partly due to their very urban roots, attracted fans from the white collar commuter-class from lower Up-state, Connecticut, New Jersey, and city dwellers that, although not quite indifferent, were typically less rowdy and tribal than their neighbors from the working-class enclaves on Long Island. These different demographics, along with routine discussions about the team moving, wrought different reactions when both teams decided to move west for the 1958 season. Although Giants fans were disappointed, there was nothing like the shock and pain that Brooklyn-ites displayed when the Dodgers announced the news. In fact, there is a line that Giants fans were the kinds of people who had been leaving the east coast for California since the end of the war anyways and that Dodgers fans would never leave Brooklyn. Although this was of course hyperbole, it captured some sense of the two divergent moods as the two clubs headed to California.
In the San Francisco of 1958, like much of the country, the post-war boom was not over but stalling. Democratic politicians, like the little known junior senator from Massachusetts, were talking about a stagnant America, tying the aging and ever-golfing President Eisenhower to the slowing of the American economy and the waning of US influence abroad. But still for many, San Francisco represented everything vibrant and open about the American experiment: possessing all of its virtue absent its Puritan baggage. Landing a Major League Baseball seemed to finally ratify worldly greatness on a city that was always looked upon as the loose and brash cousin of the established cities of the eastern seaborne. San Francisco had always possessed wealth and art and physical beauty, but now it had Mays. And owner Horace Stoneham had his ballpark that people could drive to, although not quite yet. The club started out in the Mission, at Seals Stadium before a raucous crowd basking in major league validation. At shortstop was a 29 year-old Manhattan hold-over named Daryl Spencer. “Big Dee” was a tall, lean man and not very good at hitting or playing the field. He had a little pop, especially for the era, but he peaked his rookie year, 1953, on a bad team that felt the loss of Mays’s stint in the service. Spencer continued to be a decent home run hitter through the decade but never topped his inaugural season and fizzled out for the Giants after the first year in San Francisco.
Next year Spencer moved over to second base to make room for defensive specialist Eddie Bressoud. The LA product was a classic pre-Ripken era shortstop; slight, quick-feet, and a really bad hitter. Although still sharing the load with Spencer for some of the time, Bressoud played most of the games in ’59 and 60’. He hit around .230, got on base very little, and kept a lot of runs from being scored by the other team. The Giants were as mediocre as Bressoud both years, finishing 3rd and 5th respectively. Bressoud’s departure cleared the way for the Puerto Rican youngster, Jose Pagan, one of the slough of young Latino infielders that invaded the league in the late 1950s. But like Bressoud, Pagan struggled at the plate. His first year with the reins he hit .253, stole 8 bases, and played above average shortstop. Next year he remarkably finished 11th in the MVP voting, and looking at the numbers, I can’t see any rational reason why. The Giants were good of course, making it to the World Series for the first time in the new digs in ’62, but Pagan stole very little, hit very little, got on base very little, and played mundane, although beautiful, shortstop. It reminds how much of baseball evaluation was, and is, fueled by eyeballs. Baseball people still think they can see a good baseball player when actually you can only count how good a baseball player is.
Pagan hung around, achieving what most clubs expected out of shortstops of the time, then ripened and fell in 1965 for Jayson Werth’s grandpa, Dick “Ducky” Schofield. Ducky had a long career, starting in St. Louis in 1953 and wrapping up with a bad Brewers team in 1971. Schofield was not much more than a space-holder for the Giants in ’65. They traded Pagan outright for the veteran early in the season and got the raw end of the deal. Schofield was like a bad clone of Pagan: wiry, slick, and unable to hit pitches. He barely hit .200 and the Giants cut their losses after the season and waived the plucky Ducky.
Known primarily as a well-loved Giants second baseman, the man who filled shortstop for most of the ’66 season was Tito Fuentes. Cuban born, Fuentes is an interesting historical footnote because he was one of the last Cuban players signed before the American embargo against Cuba, which in unwitting Orwellian Doublespeak Congress dubbed the Cuban Democracy Act. Fuentes played sparingly in ’65, spelling Schofield and playing some second and third. In ’66 he won the job and, in the light of hindsight, played no better than average. But context being truth, average play, especially when done with Latin flourish, looked a lot better than it actually was. Tito finished 3rd in the Rookie of Year that year and won over Bay Area hearts with his smile and glove. Tito moved over to second full-time the following year where he became a baby-boomer favorite, playing slick D and hitting half-way decent on several unmemorable teams in the '70s.
Tito’s move to second allowed former Astros manager Hal Lanier to step in. The prospect apparently fit the mold better than Fuentes, being both average with the glove and a bad hitter. I suspect Hal was the typical manger type; very good at explaining how much he knew about the game, how good his instincts were, but not very good at actually playing baseball. Hal never hit above .231 as the Giants starting shortstop and never slugged above .300. It’s remarkable, going through the research for this piece, how stubbornly ignorant the baseball world was for so long. Tracking shortstops, there was a numbing faith in perceived characteristics that often had very little to do with play on the field. Perhaps no other position in the sport has been shaped by “type” more than shortstop.
Lanier lingered through the late '60s until he was uprooted by Chris Speier. Speier was a scout’s dream, and also a case study in how scouts often get it wrong. Michael Lewis goes into this in Moneyball: The Art of Winning an Unfair Game, how some scouts can develop an odd visual attraction to a player. Billy Beane became convinced that he was touted so highly not just because he could run fast and hit baseballs a long way on occasion, but because he looked like an all-American kid. It has instilled in him, as an evaluator, a penchant for the overlooked chubby guy or the undersized pitcher—so long as they can play. Chris Speier looked like an all-American kid when the Giants drafted him with the second pick overall in 1970. He was a golden boy; local legend (just across the bay in Alameda), sandy haired, and fresh from UC Santa Barbara where he was second team all-conference, but hadn’t exactly lit the place on fire. If scouts had bothered to investigate they would have likely found that Speier was a good all-around athlete with a good attitude and lots of holes in his swing. Speier breezed through the minors though, posting a pretty solid year in AA Amarillo with 6 pops and a .285 clip.
The lone season in Amarillo sold the organization who gave Speier the starting job in 1971. Yet they kept Lanier around, likely to teach the kid the game and Hal must have taught him everything he knew because Speier turned into a prototypical Giants shortstop. His rookie campaign with the big club did not go well but he followed it up with an impressive sophomore season that landed him in the All-Star game. Looking at the 1971 All-Star game is interesting because it suggests that the Giants were not the only club infatuated with the idea of type. Starting that game for the National League was Cub favorite Don Kessinger. Kessinger defined the shortstop type: 6’1”, 170, scrappy, smooth, and very bland in the batter’s box. Unfortunately for the Cubs, and the league really, Kessinger was the best of the type, playing in six all-star games over a seven year period spanning the late '60s and early '70s (the one year he missed his numbers were virtually identical to the award seasons). So it is easy to see how the Giants might be coaxed in to believing their young all-star would be very good indeed. And if Speier had simply replicated what he had accomplished his sophomore season he likely would have become the obvious answer to the question I pose here—but that did not happen. In '73, another all-star campaign it should be noted, Speier regressed in every phase of the game. He dipped in all the relevant offensive categories and had one of his worst seasons defensively, using the Reference’s version of UZR figures. The following year he was awarded another presence in the All-Star based on very Kessinger-like play. After '73 Speier did not have another productive season but remained the Giants starting shortstop for another three years. As testament to how powerful this concept of the shortstop type remained in baseball into the '80s, even after Ripken showed what was possible, Speier managed to play another 16 seasons in the big leagues.
By now, even if you never saw LeMaster play or are not familiar with his numbers, you can probably guess which type of shortstop he was. But before we get to 1978 Tim Foli deserves a word. Drafted first overall by the Mets in 1969, Foli was, you guessed it, 6’0”, 179, smooth, scrappy, and apparently a great teammate, convincing one that being a great teammate is synonymous with being a bad hitter. Ever heard someone say Ted Williams was a great teammate? The Giants, in a deal similar to the Lanier/Pagan trade, acquired Foli when they sent Speier to the Expos the first month of the season, 1977. He was Speier’s age and his double at the plate, yet Foli was not just average in the field the way his predecessor had been—he was better than average and at times he was excellent. Although his error totals crept into the teens most years, he covered a great deal of ground and had the knack of making outs on balls that most shortstops could just simply not get too. His UZR number of 16 in 1974 with the Expos is Vizquel-like and his steady 7s and 9s through most of his career put him in nice company. The Giants would have been far better off holding on to Foli but they couldn’t resist young Johnnie LeMaster—who true to type was of course an awful hitter, but was also dreadful in the field. The Giants were burdened with LeMaster as their everyday shortstop for seven seasons and it’s not coincidence that some of the worst Giants teams to date were helmed by Johnnie LeMaster at shortstop. I’m sure he was a great teammate but he was a very bad baseball player.
Jose Uribe brought the Giants a level of consistency at shortstop that they simply had not found since moving west. Uribe’s offensive numbers are no better than his predecessors—although his ability to steal bases separates him from the pack—but defensively he was good. His second full year in the big leagues, after a shaky rookie campaign, he had an excellent defensive season, racking up a 15 UZR. When the Giants needed him most, during the ’87 playoff year, he scored a 9 in the field and had his best offensive year with a huge spike in OPS and batting average. Following Uribe was what the Giants thought would be their first real break from type. Not necessarily in build, because Royce Clayton was similar in stature to the others, but the Giants thought they found a shortstop who could actually be a force offensively. He ended up showing that he could, becoming a good hitter and base-stealing threat, but only after the Giants had passed on him.
Although his first two years were productive and in 2007 he pulled off the best UZR clip of his career, 23, Omar Vizquel’s years with the Giants were not his best. He was a solid player however, and gave the Giants a chance to compete in the final years of the Bonds era. Ignoring Renteria because of his brief time in San Francisco, we’re left with the surprising answer to my question, Rich Aurilia—and it’s not even close. During Aurilia’s prime he was a critical part of the Giants success and in 2001 had a capstone, MVP-type season with 37 homers, 97 RBIs, a .324 batting average, and led the league with 206 hits. He hit over 10 homers eight times in his career, drove in over 60 six times, and played serviceable shortstop with above-water UZR ratings for most of his prime. But I think this all might have been a waste of time because if you go to Aurilia’s Baseball Reference player page, the sponsor heading reads simply, “The best shortstop in San Francisco Giants history.” They got it right.
John Fraser is a historian with the California State Parks and a longstanding member of a fantasy baseball league. For added excitement in his spare time, John reads the sponsorship entries on Baseball-Reference.
| Touching Bases | May 27, 2010 |
A PITCHf/x Look at Drew Storen
Drew Storen is, for a variety of reasons, one of my favorite baseball players. I interviewed Storen this time last year, after which (because of which?) he was drafted with the tenth pick by the Washington Nationals due to his ability to throw 92 with movement.
Storen is one of the few players I've seen comment on the PITCHf/x sytem, telling Baseball Prospecus' interview laureate David Laurila,
"It’s awesome because you’re able to see how much movement you get on the ball, although it almost feels like you need a college degree to check out and understand some of the graphs they have on that Brooks site. But it’s interesting to see how much movement you get on your fastball, because you don’t really realize it. When you’re on the mound it’s kind of tough to see the movement that you have and a lot of times you have to rely on the catcher. "How was that?" or "What do you think?" It’s good to be able to see what the difference in movement is that you get on each pitch."
Storen fast-tracked his way to the big leagues, posting a gaudy 64-11 strikeout-to-walk ratio (his stated metric of choice) in the minors, and has made five appearances in middle relief for the Nats in the month of May, throwing nearly 100 pitches.
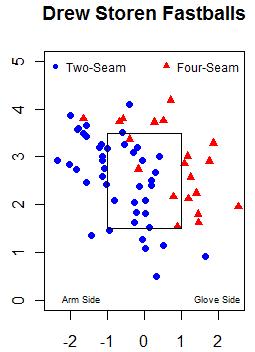
Storen has thrown four pitch types thus far: two types of fastballs and two types of breaking pitches.
Starting off with his fastball, Storen throws a four-seamer between 94 and 96 miles per hour and his two-seamer a tick slower. His four-seamer flies a little too true for my liking, averaging ten inches in vertical movement, which is a danger zone for a pitch of that velocity. Coming into last night, Storen had used his four-seamer 13 times, twelve to right-handed hitters, throwing only two of them in the strike zone. Last night, however, he threw the pitch eight times, inducing four swinging strikes. His two-seamer is a quality pitch, similar in velocity and movement to an A.J. Burnett two-seam offering. He throws both types of fastballs to any hitter, regardless of batter handedness. His choice of fastball depends on whether he wants to locate the pitch on his arm side or his glove side.
As for his off-speed pitches, he throws a true slider you often see from power righties coming in from the bullpen, and he also has mixed in a slurve a handful of times. Only two miles per hour slower than his slider, Storen's slurve achieves seven inches greater movement. Few pitchers (Burnett, Felix, Jepsen, Anderson, Lindstrom) can make a breaking ball drop seven inches at the type of velocity Storen throws his slurve, so I hope he mixes it in even more than he has.
Coming up as Stanford's closer, Storen supposedly threw about 92, getting by thanks to excellent command. He's continued to throw strikes as a pro, but from what he's shown in the Majors, his velocity was either being under-reported, or he's kicked it up a notch, and his breaking pitches also have shown good bite. I look forward to watching him close games for the Nationals in the near future.
| Change-Up | May 26, 2010 |
Kevin Youkilis: Better Than You Think
When the 2007 season wrapped, the Boston Red Sox were World Series Champions and their starting first baseman two seasons running was Kevin Youkilis. He was a championsip caliber player, which is to say that he was good enough to play everyday for a team that could win a championship. To heap more praise than the "championship caliber" label implies would have been to overstate his contributions.
To get an understanding of how Youkilis stacked up heading into 2008, you can check out our AL East preview from March of that year. Youkilis is referred to as "average at best" with the bat and is more or less an afterthought as we discuss the Red Sox. There was little in Youkilis's performance record that would have suggested he was poised to become one of the very best players in all of baseball. In 2006 and 2007, he hit .284/.385/.440, productive but not elite as first basemen go. Since the beginning of 2008, Youkilis has hit .311/.409/.567. He's a superstar.
I decided I wanted to write on this topic, on how good a player Youkilis had become, a few months back and was hoping Youkilis would get off to a good start so that I could. This past off-season, many in the Boston media criticized Theo Epstein's approach to assembling the 2010 team, doing so on the basis that without Jason Bay the Red Sox would lack an "impact" bat. The prevailing wisdom of December 2009 is summed up nicely in this Dan Shaughnessy quote:
The Sox still need a couple of bats. They still need one or two guys like Jason Bay, Matt Holliday, Adrian Gonzalez, or Miguel Cabrera.
Well let's have a look at some of the guys Dan mentions and see how they stack up against Youkilis since the start of the 2008 campaign:
               AVG   OBP   SLG  OPS+
J. Bay        .281  .381  .522   133
M. Holliday   .314  .396  .518   136
A. Gonzalez   .279  .386  .526   152
M. Cabrera    .311  .378  .549   139
K. Youkilis   .311  .409  .567   149
The only player of the bunch even comparable to Youkilis as an offensive player is Gonzalez. The Red Sox had their superstar slugger all along.
==========
Somehow, Baseball Reference got better recently. Using Sean Smith's Wins Above Replacement data, they have compiled WAR totals for all players and are even keeping running tallies in season. In their Play Index feature, you can now sort players by WAR. This represents a major enhancement because now Play Index data (1) incorporates fielding and (2) has a better offensive measure than, say, OPS+ thanks to proper weighting of things like on-base percentage and base running.
Ok, back to Youkilis now. If you asked smart baseball minds who the best four players in baseball have been over the last 2+ seasons, the responses would be more or less unanimous. Nobody questions the great Joe Mauer's place in the game, and the same goes for Albert Pujols. Two middle infielders whose numbers are just shockingly awesome, Chase Utley and Hanley Ramirez, round out the list. From there, however, if you ask folks who the 5th best position player in baseball is, or has been over the last 2+ seasons, that's when the answers start to range.
Certainly Adrian Gonzalez is in the mix, and so too is Yankees first baseman Mark Teixeira. It's hard to ignore Evan Longoria, Justin Morneau has really emerged, Ichiro Suzuki plays such a great right field and is a consistent offensive performer. Has David Wright fallen off too much? What about Youkilis's teammate, Dustin Pedroia? These would all be viable guesses, but I wonder how many would say Youkilis?
Well here it is, the top-10 players by WAR since 2008.
| Rk | Player | WAR/pos | PA | BA | OBP | SLG |
|---|---|---|---|---|---|---|
| 1 | Albert Pujols | 20.2 | 1537 | .337 | .447 | .639 |
| 2 | Joe Mauer | 18.5 | 1391 | .346 | .427 | .516 |
| 3 | Chase Utley | 16.9 | 1578 | .289 | .393 | .529 |
| 4 | Hanley Ramirez | 15.8 | 1535 | .318 | .402 | .533 |
| 5 | Kevin Youkilis | 14.8 | 1408 | .311 | .409 | .567 |
| 6 | Mark Teixeira | 13.4 | 1594 | .289 | .388 | .536 |
| 7 | Evan Longoria | 12.6 | 1372 | .283 | .359 | .534 |
| 8 | Adrian Gonzalez | 11.9 | 1570 | .279 | .386 | .526 |
| 9 | Justin Morneau | 11.9 | 1491 | .300 | .385 | .530 |
| 10 | Dustin Pedroia | 11.9 | 1653 | .306 | .370 | .472 |
I don't have much more to add, other than to point out what's now obvious: that Kevin Youkilis is a true superstar. Given that he is having his best season at the age of 31, in just his 5th year of full-time duty, it's hard not to wonder what might have been had he been given a Big League job earlier in his career. Nonetheless we should all appreciate what Youkilis has become, one of the best players in all of baseball and the caliber of player any championship-aspirant club would do well to build around.
| Touching Bases | May 25, 2010 |
90>95?
Power vs. finesse. It's the classic debate. Spanning over 60 feet 6 inches, the difference between a 90 mile-per-hour fastball and a 95-MPH heater makes up a couple hundredths of a second. More importantly, those 5 MPH represent the difference between fringe stuff and an above-average Major League fastball. So how do pitchers compensate for shortcomings in velocity?
Throwing left handed is the simplest solution. The demand for southpaws is so great and the supply so scarce that the price for a lefty far surpasses that of an equally talented righty. Put another way, left-handed pitchers can accomplish more with less. So left-handed pitchers were excluded from my sample.
My sample consisted of of over 100,000 pitches from the past two calendar years. I grouped pitches by batter handedness as well as by velocity--depending on whether the velocity rounded off to 90 MPH or 95.
First, I looked at pitch location. The color scales that portray run value are the same for both images, so you can compare them directly.
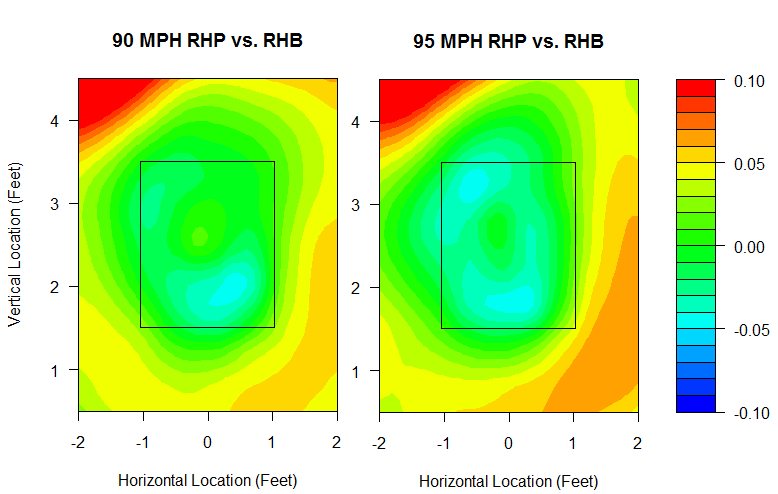
Soft tossers can't survive by living up in the zone. A 90-MPH pitch can be thrown in the perfect spot in on the hands, and it still won't have the same success on average as a 95-MPH pitch that misses by half a foot. However, pitchers who throw 90 experience just as much success throwing down and away to same-handed batters as pitchers who throw 95. In this regard, pitch location can be a true equalizer. Joakim Soria locates his 90-MPH fastball so well that it's in the upper echelon of all fastballs, while Daniel Cabrera has located his 95 MPH fastballs so poorly that he's out of the league.
I also looked at pitch movement. The magnitude of the effect of pitch movement is much smaller than that of pitch location. Below, run value is plotted against horizontal movement in the solid-line portion of the graph, while a histogram for horizontal movement can be found at the bottom.
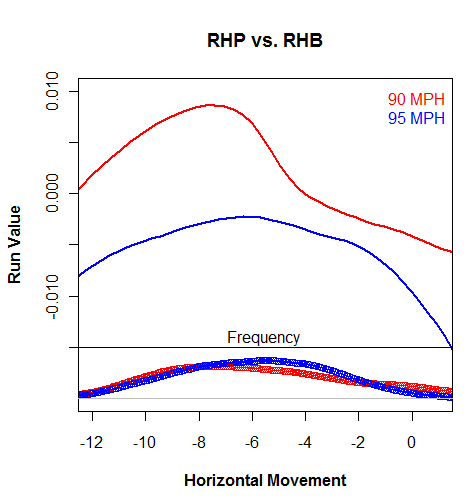
A 90-MPH pitch with average movement is a disaster. Even a 90-MPH pitch with great tail can't match an average 95-MPH pitch unless the 90-MPH pitch also has sink on it. But if a pitcher can really cut the ball so that it acts as a cutter, or even a slider for some, it can match an average 95-MPH fastball.
And vertical movement:
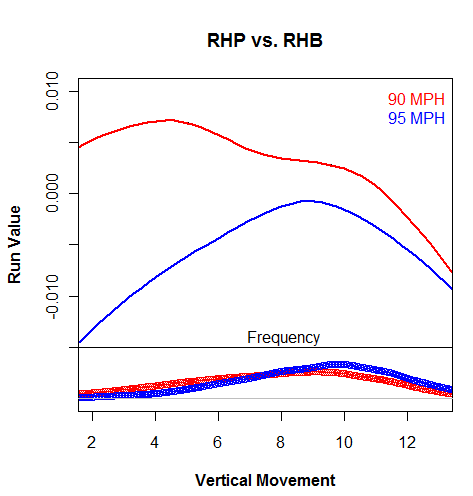
I find this to be an interesting trend. The 90-MPH pitchers are better off throwing rising fastballs, while 95-MPH pitchers are just as well off throwing sinkers or risers, so long as they stay out of that ten-inch danger zone to which the batter is accustomed.
In combining both horizontal and vertical movement, it's evident that Peter Moylan generates enough movement on his fastball to throw it at elite levels, while Cabrera, again, has a mediocre-to-awful fastball in spite of his velo. Remember, I'm only including 95 MPH pitches, so imagine how bad his fastball must have been in 2009 at 91 MPH. Cabrera is the poster boy for pitchers who can throw gas but have no command or movement, rendering their fastball ineffective. Kevin Jepsen, Jonathan Broxton, and Brian Wilson are examples of pitchers whose 90-MPH pitches are better than most pitchers' 95s, since those guys are throwing off speed at 90. Also of note: Jenrry Mejia's fastball has excellent movement.
Mixing location and movement into a regression, here are the best 90-MPH fastballs with at least 100 thrown:
Jared Burton
David Robertson
Peter Moylan
Ryan Franklin
Brian Sanches
Joakim Soria
Zack Greinke
Cory Wade
Roy Halladay
Mariano Rivera
David Robertson continues to be the man. No pitcher's 90-MPH fastball penetrates the top tenth of my sample, but all of these pitchers are squarely above average. They show that 90 MPH can beat 95, especially when the 95 is coming from the likes of:
Manny Acosta
Jason Bulger
Mitchell Boggs
Craig Hansen
Daniel Cabrera
Cabrera's 95 MPH fastball was the third worst fastball in my sample, and no other 95-MPH fastball fell in the bottom 40. The 90-MPH version of Cabrera's fastball was arguably better than his previous iteration.
| F/X Visualizations | May 21, 2010 |
Soriano's Fly Balls
Alfonso Soriano is having a resurgent year after his forgettable 2009. On the strength of his seven HRs (and a total of 23 extra-base hits) and a 0.386 OBP, Soriano has an amazing 0.432 wOBA, putting him in the top ten in the league.
Soriano is blasting everything skyward, as his GB% is second lowest in the league at 25%. He has always has always been a fly-ball hitter, but this ground-ball rate is well below his career average of 32%. Ground-ball rate is tied to pitch height, so l looked at Soriano's swing rate by pitch height to see whether there was anything going on.
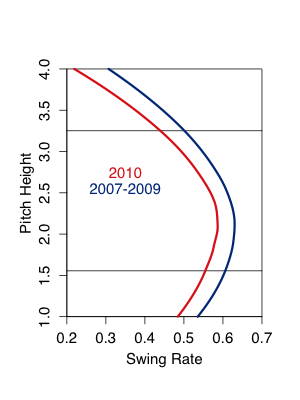
Nope, it looks like Soriano is swinging at about the same height of pitches, though he is swinging at fewer pitches this year compared to the others in the pitchf/x era. Instead it looks like no matter the pitch height Soriano has, so far this year, hit a lower rate of balls in play on the ground compared to previously. It looks like this is particularly true for pitches up in the zone.
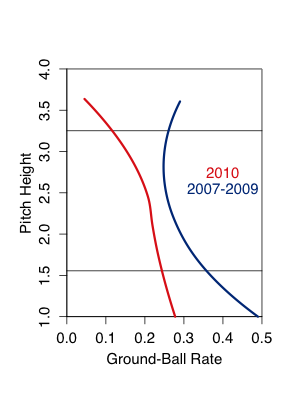
What is making Soriano so successful this year is not that those fly balls are leaving the park at a rate higher than his career average (actually his HR/FB this year is a tad lower than his career average), rather they are dropping in for hits more often. Since 2002 Soriano has a 0.146 BABIP on fly balls (as classified by BIS and courtesy of FanGraphs), but so far this year his BABIP on fly balls has been has been 0.341.
Soriano has 44 non-HR fly balls in 2010 and 15 non-HR fly-ball hits. Had he gotten fly-ball hits at his career rate he would have just six or seven non-HR fly-ball hits. If we take away eight of his singles he ends up with a OBP of 0.331 and a wOBA of 0.389. If we took those eight hits away as five singles and three doubles his wOBA would drop to 0.383. Both still very good, but no longer in the top ten in the league.
Obviously what is done is done and those 15 fly-ball hits are money in the bank for Soriano and the Cubs. But unless you think Soriano can continue to get a hit on a third of his non-HR flyballs, don't think he is going to keep up this torrid pace (and probably not one though he would to begin with). Just another reminder of the fickleness of BABIP. After being on the short-end of the BABIP-luck stick last year Soriano has seen his fortunes flip this year.
| Touching Bases | May 20, 2010 |
Lidge's Pitches
Brad Lidge is a two-pitch pitcher. His arsenal consists of mid-90s fastball and a high-80s slider. From 2008-2009, Lidge faced a few hundred 0-2 and 1-2 counts in which he had to choose a putaway pitch. While Lidge generally splits his pitch selection right down the middle, in situations when he's well ahead of the batter, he goes to his slider over 60% of the time. And he gets results.
| Fastball | Slider | |
|---|---|---|
| Strikeout | 9% | 26% |
| Ball | 57% | 43% |
PITCHf/x analysts like to use a metric called run value to assess the value of a pitch. Basically, you control for the count and measure the change in run expectancy for a given pitch. So for Lidge, his fastball has been worth a negative 1.5 runs per 100 pitches, while his slider has been worth a positive 1.5 runs per 100. In these 0-2 and 1-2 situations, the trend is similar. So why does he throw fastballs at all if the slider is his bread-and-butter?
Well, we don't really care about the result of the pitch as much as we do the outcome of the at bat. So how did Lidge ultimately fare at the end of each plate appearance?
| Fastball | Slider | |
|---|---|---|
| Out Made | 81% | 74% |
Turns out, Lidge's fastball wasn't ineffective. In a way, it was more effective than his slider. That 57% ball rate might be intentional. Perhaps his advantage in the count allows him to use his fastball as a setup pitch.
Against righties, Lidge threw 50 fastballs that resulted in a prolonged plate appearance. He proceeded to strike out over half of these batters and allowed only six to reach base. Of course, any pitcher's numbers will seem otherworldly when the context is restricted to two-strike counts, but as Dave Allen has shown, a fastball generally makes for a better setup pitch than a slider.
How Lidge's slider works off his fastball.
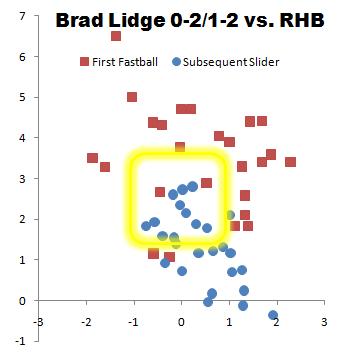
Whether or not Lidge tries to raise the eye level of the batter with his mid-90s fastball, when his heater goes for a ball, it's the perfect setup for his slider.
While some pitchers' off-speed pitches exhibit superior run values, the fastball's grunt work may be the driving force behind such off-speed success.
| Baseball Beat | May 18, 2010 |
The Most Under Appreciated Batted Ball Type
Call them pop-ups, pop flies, or infield flies. While these batted balls are one and the same, they are not outfield fly balls despite getting lumped together by many baseball sites and analysts. Like Rodney Dangerfield, they get no respect.
Infield fly balls are converted into outs about 99% of the time. In other words, only 1% of all pop-ups become hits. By comparison, roughly 75% of all line drives, 25% of ground balls, and 20% of fly balls result in hits (including home runs). Line drives also have the highest run value, followed by fly balls and ground balls.
If pop-ups are routinely turned into outs with no advancement by base runners, then they should be treated more like strikeouts for the purpose of performance analysis than anything else. Unlike line drives, fly balls and ground balls, pop-ups and strikeouts have no (or negative) run value.
When it comes to breaking out batted balls, I favor Baseball Prospectus over Fangraphs. My preference is not due to the source (BP uses Gameday/MLB Advanced Media and FG uses Baseball Info Solutions) but rather that the former categorizes pop-ups as a separate batted ball event (POP) whereas the latter includes infield fly balls (IFFB) as a subset of fly balls (FB). (You can read Colin Wyers' article, David Appelman's rebuttal, and a thorough discussion at The Book if you are interested in how this data is collected.)
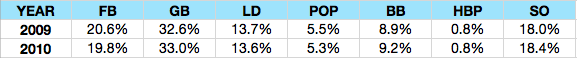
Using BP's custom statistic reports, let's take a look at the four different batted ball types as a percentage of all batted balls for 2009 and 2010.
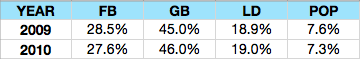
As shown, pop-ups account for approximately 7%-8% of all batted balls. While this rate is a fraction of the other batted ball events, it is worth knowing because pop flies are almost always converted into outs.
Batted balls represent about 72% of all plate appearances with walks (9%), hit by pitches (1%), and strikeouts (18%) accounting for the balance.
While there is a lot of interesting information in the table above, I would like to focus on POP and SO rates as it seems to me that these "automatic outs" could be combined when analyzing pitchers (and hitters, for that matter). Importantly, inducing infield flies appears to be a repeatable skill, much like strikeouts and ground balls, although perhaps not to the same extent.
As shown, SO and POP total about 23.5% of all plate appearances. All else equal, I believe that pitchers with higher POP rates — particularly as a percentage of non-SO and GB — should be preferred over those with lower rates. If nothing else, it is my hope that such pitchers may gain greater respect from those who overlook them now.
While I want to like SIERA for many of its innovations, I'm not convinced that "pop-ups represent a potential problem for the pitcher in the future."
Pop-up rate was allowed to negatively affect SIERA because it is a symptom of the pitcher throwing the ball that generates an upward trajectory, which could lead to an increase in home runs. A pitcher’s skills are throwing strikes, making hitters miss, and throwing with angles and spins such that the trajectory of the ball is downward when it hits the bat. A popup almost always represents an out, but it also represents a potential problem for the pitcher in the future.
Moving forward, here are the 2009 rankings of all pitchers with 100 or more innings with an above-average SO + POP rates (SO plus POP divided by PA).
| Num | NAME | PA | BB | HBP | SO | FB | GB | LD | POP | SO+POP |
|---|---|---|---|---|---|---|---|---|---|---|
| 1 | Rich Harden | 609 | 67 | 6 | 171 | 107 | 152 | 67 | 42 | 34.98% |
| 2 | Clayton Kershaw | 701 | 91 | 1 | 185 | 117 | 177 | 78 | 55 | 34.24% |
| 3 | Justin Verlander | 982 | 63 | 6 | 269 | 193 | 241 | 151 | 58 | 33.30% |
| 4 | Tim Lincecum | 905 | 68 | 6 | 261 | 145 | 283 | 109 | 35 | 32.71% |
| 5 | Jake Peavy | 410 | 34 | 1 | 110 | 74 | 120 | 48 | 23 | 32.44% |
| 6 | Zack Greinke | 915 | 51 | 4 | 242 | 195 | 255 | 116 | 53 | 32.24% |
| 7 | Javier Vazquez | 874 | 44 | 4 | 238 | 176 | 255 | 126 | 34 | 31.12% |
| 8 | Johan Santana | 701 | 46 | 3 | 146 | 144 | 193 | 99 | 71 | 30.96% |
| 9 | Jered Weaver | 882 | 66 | 4 | 174 | 220 | 202 | 118 | 99 | 30.95% |
| 10 | Scott Baker | 828 | 48 | 4 | 162 | 209 | 214 | 100 | 91 | 30.56% |
| 11 | Jon Lester | 843 | 64 | 3 | 225 | 142 | 269 | 108 | 32 | 30.49% |
| 12 | Jonathan Sanchez | 710 | 88 | 6 | 177 | 149 | 187 | 68 | 36 | 30.00% |
| 13 | Yovani Gallardo | 793 | 94 | 5 | 204 | 146 | 231 | 84 | 30 | 29.51% |
| 14 | Tommy Hanson | 522 | 46 | 5 | 116 | 105 | 146 | 68 | 37 | 29.31% |
| 15 | Ricky Nolasco | 785 | 44 | 2 | 195 | 176 | 218 | 116 | 35 | 29.30% |
| 16 | Dan Haren | 909 | 38 | 4 | 223 | 192 | 285 | 128 | 40 | 28.93% |
| 17 | Ted Lilly | 706 | 36 | 2 | 151 | 197 | 182 | 87 | 51 | 28.61% |
| 18 | Jorge De La Rosa | 799 | 83 | 9 | 193 | 137 | 239 | 103 | 35 | 28.54% |
| 19 | Cole Hamels | 814 | 43 | 5 | 168 | 157 | 261 | 117 | 63 | 28.38% |
| 20 | Matt Garza | 861 | 79 | 11 | 189 | 173 | 233 | 126 | 51 | 27.87% |
| 21 | Max Scherzer | 741 | 63 | 10 | 174 | 158 | 215 | 90 | 32 | 27.80% |
| 22 | Wandy Rodriguez | 849 | 63 | 5 | 193 | 176 | 276 | 96 | 41 | 27.56% |
| 23 | CC Sabathia | 938 | 67 | 9 | 197 | 178 | 296 | 132 | 59 | 27.29% |
| 24 | Josh Johnson | 855 | 58 | 6 | 191 | 126 | 307 | 125 | 42 | 27.25% |
| 25 | Chad Billingsley | 823 | 86 | 7 | 179 | 143 | 262 | 101 | 45 | 27.22% |
| 26 | Aaron Harang | 703 | 43 | 4 | 142 | 156 | 191 | 121 | 47 | 26.88% |
| 27 | Carlos Zambrano | 733 | 78 | 9 | 152 | 136 | 229 | 87 | 43 | 26.60% |
| 28 | Adam Wainwright | 970 | 66 | 3 | 212 | 150 | 360 | 136 | 45 | 26.49% |
| 29 | Roy Halladay | 963 | 35 | 5 | 208 | 163 | 366 | 141 | 45 | 26.27% |
| 30 | Joe Blanton | 837 | 59 | 8 | 163 | 181 | 257 | 116 | 56 | 26.16% |
| 31 | Josh Beckett | 883 | 55 | 7 | 199 | 165 | 299 | 126 | 32 | 26.16% |
| 32 | Felix Hernandez | 977 | 71 | 8 | 217 | 164 | 367 | 113 | 38 | 26.10% |
| 33 | Ubaldo Jimenez | 914 | 85 | 10 | 198 | 125 | 344 | 112 | 40 | 26.04% |
| 34 | Barry Zito | 818 | 81 | 8 | 154 | 163 | 235 | 120 | 59 | 26.04% |
| 35 | Francisco Liriano | 609 | 65 | 6 | 122 | 123 | 178 | 80 | 36 | 25.94% |
| 36 | Randy Wolf | 862 | 58 | 6 | 160 | 211 | 263 | 103 | 61 | 25.64% |
| 37 | Chad Gaudin | 664 | 76 | 8 | 139 | 132 | 199 | 79 | 31 | 25.60% |
| 38 | Edwin Jackson | 890 | 70 | 5 | 161 | 194 | 267 | 128 | 66 | 25.51% |
| 39 | A.J. Burnett | 896 | 97 | 10 | 195 | 184 | 259 | 117 | 33 | 25.45% |
| 40 | Scott Richmond | 610 | 59 | 117 | 144 | 151 | 101 | 38 | 25.41% | |
| 41 | Matt Cain | 886 | 73 | 3 | 171 | 211 | 263 | 112 | 53 | 25.28% |
| 42 | John Danks | 839 | 73 | 5 | 149 | 170 | 282 | 98 | 62 | 25.15% |
| 43 | Brett Anderson | 734 | 44 | 3 | 150 | 132 | 280 | 91 | 34 | 25.07% |
| 44 | Ryan Dempster | 842 | 65 | 6 | 172 | 171 | 296 | 95 | 39 | 25.06% |
| 45 | Scott Kazmir | 647 | 60 | 6 | 117 | 160 | 160 | 99 | 45 | 25.04% |
| 46 | Roy Oswalt | 757 | 42 | 8 | 138 | 149 | 265 | 104 | 51 | 24.97% |
| 47 | David Hernandez | 462 | 46 | 1 | 68 | 130 | 109 | 62 | 46 | 24.68% |
| 48 | J.A. Happ | 685 | 56 | 5 | 119 | 166 | 204 | 86 | 50 | 24.67% |
| 49 | Justin Masterson | 568 | 60 | 8 | 119 | 96 | 213 | 51 | 21 | 24.65% |
| 50 | Chris Carpenter | 750 | 38 | 7 | 144 | 110 | 319 | 93 | 39 | 24.40% |
| 51 | Gavin Floyd | 797 | 59 | 2 | 163 | 154 | 263 | 125 | 31 | 24.34% |
| 52 | Cliff Lee | 969 | 43 | 5 | 181 | 203 | 325 | 159 | 53 | 24.15% |
| 53 | Joba Chamberlain | 709 | 76 | 12 | 133 | 135 | 222 | 93 | 38 | 24.12% |
| 54 | Ervin Santana | 614 | 47 | 10 | 107 | 155 | 178 | 77 | 39 | 23.78% |
| 55 | Johnny Cueto | 740 | 61 | 14 | 132 | 158 | 230 | 103 | 43 | 23.65% |
Of these pitchers, Jered Weaver (15.5%), Scott Baker (14.8%), Tim Wakefield (14.1%), Johan Santana (14.0%), David Hernandez (13.3%), Clayton Kershaw (12.9%), Micah Owings (11.6%), Rich Harden (11.4%), David Huff (11.1%), and Todd Wellemeyer (11.1%) induced the greatest number of pop-ups as a percentage of batted balls. Weaver (11.2%), Baker (11.0%), Wakefield (10.8%), Santana (10.1%), Hernandez (10.0%), Huff (9.1%), Owings (8.7%), Wellemeyer (8.4%), Jamie Moyer (8.3%), and Jeremy Guthrie (8.0%) produced the most infield flies as a percentage of plate appearances.
Importantly, the rankings of pitchers by SO + POP and POP rates are not meant to identify the most valuable pitchers as neither takes into consideration BB, HBP, or HR rates. However, I wonder if Fielding Independent Pitching (FIP) couldn't be improved by combining SO and POP in its formula, which is typically defined as (HR*13+(BB+HBP-IBB)*3-K*2)/IP plus a league-specific factor (usually around 3.2) to create an equivalent ERA number.
The formula for FIP would need to be tinkered to account for the effect of POP as simply adding POP to SO wouldn't work. The multipliers or the league-specific factor would need to be changed to equate the newly constructed FIP with ERA.
Here are the top ten leaders for 2010 (among pitchers with 40 or more IP):
| Num | NAME | PA | BB | HBP | SO | FB | GB | LD | POP | SO+POP |
|---|---|---|---|---|---|---|---|---|---|---|
| 1 | Tim Lincecum | 218 | 15 | 69 | 28 | 70 | 26 | 10 | 36.24% | |
| 2 | Clayton Kershaw | 197 | 29 | 3 | 52 | 29 | 51 | 14 | 19 | 36.04% |
| 3 | Jered Weaver | 205 | 12 | 59 | 47 | 56 | 18 | 13 | 35.12% | |
| 4 | Colby Lewis | 212 | 21 | 3 | 54 | 43 | 50 | 22 | 20 | 34.91% |
| 5 | Tommy Hanson | 204 | 13 | 3 | 56 | 50 | 52 | 18 | 12 | 33.33% |
| 6 | Phil Hughes | 170 | 15 | 42 | 35 | 42 | 23 | 13 | 32.35% | |
| 7 | Brandon Morrow | 187 | 27 | 3 | 54 | 33 | 39 | 25 | 6 | 32.09% |
| 8 | Yovani Gallardo | 228 | 29 | 61 | 27 | 66 | 37 | 9 | 30.70% | |
| 9 | Justin Verlander | 203 | 20 | 1 | 46 | 33 | 60 | 28 | 16 | 30.54% |
| 10 | Jonathan Sanchez | 178 | 20 | 2 | 45 | 38 | 45 | 19 | 9 | 30.34% |
Tim Lincecum, Kershaw, Jered Weaver, and Justin Verlander are the only pitchers who ranked in the top ten in 2009 and 2010. Tommy Hanson (14th in 2009 and 5th in 2010), Yovani Gallardo (13th and 8th), and Jonathan Sanchez (12th and 10th) rank in the top 15 both years.
The greatest influence on SO + POP is clearly due to the former, yet the latter exerts value on the margin. The ability to induce pop-ups should not be dismissed when evaluating pitchers. Furthermore, it is my belief that certain pitchers have a knack for allowing fewer home runs as a percentage of outfield fly balls than the league average. Saying a pitcher is "lucky" because he has a lower HR/FB rate than the league average is simplistic, as is resorting to xFIP as a standalone measure (especially when a pitcher has a sufficiently large sample size to evaluate). By the same token, labeling a pitcher with a below-average BABIP "lucky" may not be totally accurate either.
The analytical community has come a long way on batted ball info. Paying more attention to pop-ups would be instructive in my opinion. Digging deeper into pitcher-batter results as they relate to pitch types, pitch sequencing, ball-strike counts, and bases occupied could lead us to solve some of the mysteries previously ascribed to luck and randomness. For example, pitchers with "plus" changeups may induce more than their fair share of pop-ups and lazy fly balls.
More than anything, I hope this article leads to additional discussion and research with respect to analyzing pitchers.
* * *
Update: Tom Tango sent me an email with a link to Tango's Lab: Batted Ball FIP. He pointed me to posts #8 and #9. Leave it to Tangotiger to have developed a formula for batted ball FIP (bbFIP). The formula is as follows:
ERA = 11*[(BB+LD)-(SO+iFB)]/PA + 3*(oFB-GB)/PA + 4.2
Note: the league-specific factor may differ depending on the data source
A line drive is like a walk, an infield fly is like a strikeout, and the gap between an outfly and a groundball is about one-fourth the gap between BB and SO.
In post #16, Tangotiger lists the results by root mean square error (RMSE) of bbFIP (1.05), SIERA (1.05), and FIP (1.11) and concludes "I’d say that bbFIP is a worthy addition here. Not to mention that it’s in the same spirit as FIP (linear and simple coefficients)."
If you have the time and interest, go ahead and read the entire discussion. Brian Cartwright goes into even more detail with numerous tables listing the predictive value of run estimators. As Brian notes, it is important to distinguish between "describing the past vs. predicting the future." I agree. Some skills are more repeatable than others. Guy cautions, "The farther forward you look, the more the skills change/deteriorate." He also warns against "survivor bias" in these studies. Excellent points all.
| F/X Visualizations | May 14, 2010 |
The Network Structure of Baseball Blogs: Part 2
Two weeks ago I posted about the network structure of baseball blogs. In the framework of a network (or graph) each blog is a node and two blogs are connected together by an edge if one links another. The edges are directed, each link goes from one blog to another, and weighted, I looked over the course of 100 posts and counted the number of links so if there were more than one that edge was given a greater weight.
In the quick look in my last post I first showed the structure of the overall network, with Baseball Analysts and a number of other sabermeteric blogs clustering out together at the center of the larger network of baseball blogs. Around the periphery were sub-clusters of team specific blogs, which tended to be heavily connected with blogs covering the same team.
In that post to keep the network fairly simple I only connected two blogs if they were linked three or more times. This dropped many connections and blogs out of the network. That was a good solution to look at the smaller set of central blogs, but it lost most of the structure. I was also interested in how different sub-clusters of team focused blogs arranged in the network.
To look at this I plotted out all the 150 or so team-specific of the top 200 blogs. Here I included all links but weighted them by how many there were. The nodes are labeled by my code for the blog name, which are color-coded for each team. The colors are not perfect, but with the code from the name they should be clear. Click on the image for a larger version.
There is a lot going on with this diagram and I couldn't begin to write about all of it, but I will note some of the things I find interesting. At the bottom of the network are the Yankees and Mets blogs, which are well connected (we saw this last week too). To the upper-right of the Mets is most of the NL East: the big constellation of Nats blogs, a couple Florida blogs off that, and then, more centrally located, four Phillies blogs. To the left of the Yankees is a fairly large group of Red Sox blogs and not too far from that, but also more centrally located, the four Rays blogs. Both the Rays and Phillies have most of their blogs close to the center of the web. My guess is this because of their recent history of in the World Series. Outside of the AL and NL East the structure is not as clear. The NL Central clusters out fairly well in the upper right of the graph, but the other divisions are not as clear.
This is a fairly qualitative analysis, it would be interesting to make it more quantitative looking at the percentage of potential links filled within versus without divisions, based on the geographical location of the teams.
| Touching Bases | May 13, 2010 |
Pitching to the Ump
A couple of days ago, Ben Walker of the Associated Press reported that teams are scouting umpires. I decided to check on the data to see whether pitchers have been changing their approach based on the umpire.
Umpires' zones vary from game to game, yet some umpires develop reputations around the league for perhaps calling the high strike or maybe sleeping next to an ice bucket. For most umpires, the PITCHf/x system has recorded enough data for an analyst to create a strikezone probability distribution. I'm not going to name any specific umpires, since that might come off like I was trying to evaluate them, which I'm really not, but I did make these probability distributions for the league on average as well as for each umpire, controlling solely for batter handedness. I hypothesized that the difference in a pitcher's expected called strike percentage without controlling for the umpire vs. the same pitcher's expected called strike percentage while controlling for the umpire could be attributed to the pitcher's knowledge of the umpire.
I found that, given the internal consistency in the data, there is certainly some skill to this effect, but the magnitude of the effect was small I think. , Livan Hernandez, who you may recall was on the same page as Eric Gregg back in 1997, actually has, by the numbers, done the worst job of adjusting for the umpire, as his pitches were 4% less likely to be called strikes given his distribution of umpires than given an average umpire. While the reliability tests I ran showed that Livan was consistently below average at "pitching to the umpire," I dug deeper, and I can't shake the feeling that luck plays a huge part of it. Sorting through umpires, I couldn't find any difference in Liva's approach. But maybe that's the problem. His approach is consistent, and it's the umpires who change. Here, I present a pair of charts displaying data on Livan Hernandez pitching to an umpire who has called a couple of his games.
I've taken the difference between the average strike zones and a given umpire's strike zone. Blue areas represent spaces where this umpire calls fewer strikes than average, and red areas represent spaces where an umpire is more generous. I made a density estimation to model the distribution of Livan Hernandez's pitches against batters of each handedness, and then plotted a contour line that displays where he's generally pitched over the last few years. I finally plotted the locations of the individual pitches that Livan has thrown with this specific umpire calling the game.
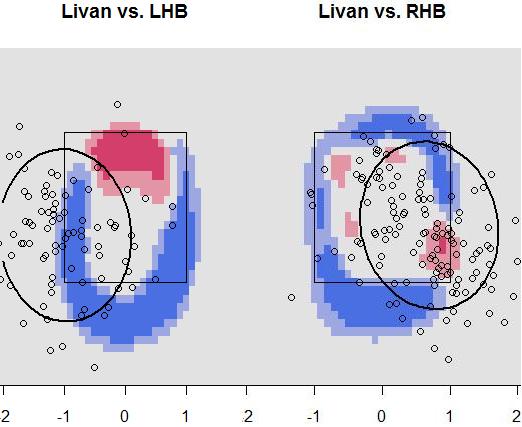
It turns out that against righties, this has been Livan's favorite umpire. The ump does a great job calling pitches below the knees, and he gives pitchers the down-and-away strike, which is right in the center of where Livan generally pitches. So Livan, who has been 7% more likely to have a pitch called a strike with this umpire behind the plate than an average ump, hasn't actually done anything different. This ump just suits his style.
Meanwhile, against lefties, Livan pitches exclusively away, and he hasn't changed up his approach, even though this umpire does not tend to give pitchers that call. So in this way, Livan, without doing anything differently, is failing to "pitch to the ump."
This type of information could also be of value to a manager in deciding whether to throw a sinkerballer who pitches down in the zone or a power pitcher who goes up the ladder. I don't think that pitchers should, or do, change their approach much based on the umpire behind the plate. However, every inch counts, so the information can't hurt.
| Change-Up | May 12, 2010 |
Jamie Moyer & The Hall of Fame
On his Twitter feed last night, Tyler Kepner mentioned that Dallas Braden considered Jamie Moyer to be one of his heroes. Said Braden, "I don't know how old he is. He played catch with Jesus." I won't necessarily deify Moyer in this piece, but I do want to address the notion that Moyer gaining baseball's version of immortality - Hall of Fame enshrinement - is somehow preposterous.
I turned my attention to Moyer's Hall candidacy after I noticed a tweet in Peter Abraham's feed, expressing incredulity at the mere mention of Moyer for the Hall. And I agree with Abraham on one level. Moyer WON'T get any real consideration for the Hall of Fame, so Pete's right in that sense. But it's more interesting to talk about whether or not he deserves the honor, and that conversation means we need to compare him to some other Hall-eligibles.
Joe Posnanski, and you'll be shocked to hear this, wrote a phenomenal blog entry a number of weeks back. It compared Rick Reuschel to Jack Morris and the case Joe made was well-researched, meticulous, and entirely responsive to the core points upon which the pro-Morris crowd tends to base its case. In it, Poz was also careful to note that he didn't want to pick on Morris and that he thought Jack was a very good pitcher.
To even be considered seriously for the Hall of Fame is a great honor, and you have to be a tremendous player to reach such great heights. Jack Morris won 254 games in his career, and he had memorable postseason performances, including one of the greatest ever in Game 7 of the 1991 World Series. He threw 240-plus innings 10 times — only 14 pitchers in baseball history did it more. Whenever I write one of these Morris pieces, it feels like I’m bashing his career, when that is not what I mean to do. He was a terrific pitcher.
I want to offer the very same caveat myself. This is not meant to pick on Morris, but rather it's meant to bring to light the body of work that Jamie Moyer has managed to craft over the course of his Major League Baseball career. Comparing Moyer to Morris, a fringe candidate with some ardent and influential supporters, just seems to make sense. So we'll start high-level, and kick the analysis off with a look at their career numbers.
         W    L    IP    BB/9   K/9   K/BB   ERA+
Moyer   262  197  3,948   2.6   5.4   2.11   105
Morris  254  186  3,824   3.3   5.8   1.78   105
Without knowing anything else about the two players, right off the bat, you can see that a comparison of the two is very much in play. They look identical, and again, without knowing more, you would give Moyer the edge. But we do know more.
For instance, we know that Morris made five All-Star Games and Moyer made just one. We know that Moyer managed a 4th, 5th and 6th place finish in Cy Young voting but never managed another showing in the top-10. Meanwhile, we know that Morris placed in the top-10 seven times, and even appeared on the MVP ballot five times. So maybe Moyer has just racked up a bunch of innings and some solid numbers, but Morris was a star. Right? Let's look at their respective peaks by comparing each of their five best seasons according to Sean Smith's Wins Above Replacement calculation.
          Moyer
 Yr   IP  K/BB  ERA+  WAR
'99  228  2.85   130  5.7
'02  231  2.94   128  5.3
'01  234  3.76   131  5.2
'03  215  1.95   132  3.9
'97  189  2.63   116  3.7
         Morris
 Yr   IP  K/BB  ERA+  WAR
'79  198  1.92  133   5.1
'87  266  2.24  126   4.9
'85  257  1.74  122   4.8
'86  267  2.72  127   4.7
'91  247  1.77  125   4.1
Well now, that's interesting. If you tally their respective five best seasons, Moyer totals out at 23.8 and Morris at 23.6, It's easy to forget, or at least it is for me, that Moyer was a total mainstay, a rock, for some of the better baseball teams in recent memory: the turn of the century Seattle Mariners. And I urge you to dig a little deeper, to have a look for yourself. They both have eight 3+ WAR seasons, both have ten 2+ WAR seasons. It's remarkable, but their careers look very similar. Moyer nets out with a more productive overall career thanks to a handful of seasons where he was worth a win or so throughout his 24 seasons.
But still, we know Morris was better, right? Because we know how excellent he was in the 1984 World Series for the Detroit Tigers, when he notched two complete game victories. And we DEFINITELY know about one of the finest baseball games ever pitched, Morris's complete game 10-inning masterpiece to lead the Minnesota Twins over the Atlanta Braves in the 1991 World Series. We tend to block out things like how Morris almost lost the 1992 World Series all by himself for the Toronto Blue Jays. That tends not to factor into his reputation as a clutch post-season pitcher. Instead, as far as 1992 is concerned, Morris was a 21-Game Winner For a World Series Winning Club. All the same, it's fair to say that thanks to his extraordinarily memorable performances in '84 and '91, his reputation is well-earned.
The point is to say that a number of voters look beyond Morris's numbers, they look beyond some of those shoddy post-season outings, and deem him Hall worthy thanks to three games he pitched: two in the '84 Series, one in '91. Rightly or wrongly, he gets extra credit for doing extraordinary things that stick in voters' memories. And that's fair enough. But is there anything in Jamie Moyer's career that might merit him the same sort of consideration over and above his performance record? Well, how about this?
HE'S TAKING A ROTATION TURN FOR THE TEAM THAT'S BEEN BEST IN THE NATIONAL LEAGUE THREE YEARS RUNNING AT THE AGE OF 47!
Moyer has posted a 32-19 record as a slightly above average pitcher since 2008, when he was 45 years-old. And with the way these Phillies pound the ball, above average, dependably taking the ball every fifth day, puts Moyer's team in a great position to win when he starts. He has been a critical contributor during the best Philadelphia Phillies stretch of baseball in history, all while pushing 50-years old. For heaven's sake, the man pitched a complete game shutout last week! If we're doling out extra credit for memorable performances, quirks, things that make a player stand alone, then what Jamie Moyer is doing these days qualifies as far as I'm concerned. To put it in perspective, here's your list of players who have pitched at least 200 innings in their 45-year old season and beyond:
| Rk | Player | ERA+ | IP | From | To | Age | G | GS | CG | SHO | H | BB | SO | ERA | Tm |
|---|---|---|---|---|---|---|---|---|---|---|---|---|---|---|---|
| 1 | Hoyt Wilhelm | 139 | 299.0 | 1968 | 1972 | 45-49 | 205 | 0 | 0 | 0 | 224 | 108 | 232 | 2.62 | CHW-TOT-LAD |
| 2 | Satchel Paige | 125 | 258.1 | 1952 | 1965 | 45-58 | 104 | 11 | 3 | 2 | 231 | 96 | 143 | 3.24 | SLB-KCA |
| 3 | Jack Quinn | 112 | 418.0 | 1929 | 1933 | 45-49 | 165 | 25 | 7 | 0 | 478 | 114 | 125 | 3.72 | PHA-BRO-CIN |
| 4 | Jamie Moyer | 101 | 397.1 | 2008 | 2010 | 45-47 | 69 | 64 | 1 | 1 | 413 | 110 | 237 | 4.28 | PHI |
| 5 | Nolan Ryan | 97 | 223.2 | 1992 | 1993 | 45-46 | 40 | 40 | 2 | 0 | 192 | 109 | 203 | 4.06 | TEX |
| 6 | Phil Niekro | 96 | 784.2 | 1984 | 1987 | 45-48 | 125 | 122 | 19 | 2 | 826 | 357 | 430 | 4.27 | NYY-CLE-TOT |
| 7 | Charlie Hough | 94 | 318.0 | 1993 | 1994 | 45-46 | 55 | 55 | 1 | 1 | 320 | 123 | 191 | 4.58 | FLA |
| 8 | Tommy John | 82 | 240.0 | 1988 | 1989 | 45-46 | 45 | 42 | 0 | 0 | 308 | 68 | 99 | 4.84 | NYY |
Look at that list! Moyer is handing Nolan Ryan his 45-and-older lunch!
Finally, it's worth noting that Moyer has a good post-season record of his own. Save a disastrous outing against the Milwaukee Brewers in the 2008 ALDS, he's been excellent. In 2001 Moyer went 3-0, including a most impressive outing at Yankee Stadium in Game 3 of the ALCS.
I don't think Jamie Moyer is a Hall of Fame caliber pitcher. I think he's exactly the kind of player who will be, and should be, remembered fondly by baseball fans who had the chance to enjoy watching him pitch. Maybe I will one day tell my grandchildren how Moyer had a devastating change up, pinpoint control, and was an effective pitcher for one of baseball's very best teams well into his late-40's. We might never see another pitcher like Moyer. That's awesome, but he's just not a Hall of Famer.
To me, that's Jack Morris too. He threw a million innings per season during a time when the trend to protect pitchers more and more was beginning to take hold. Wherever he went, his teams won. And my goodness, the 1984 and 1991 World Series! What a career he had.
Sometimes, it's ok just to leave it at that.
==========
Update: I see that Howard Megdal & Jon Daly have tackled the very same topic at The Perpetual Post this morning.
| Behind the Scoreboard | May 11, 2010 |
Final Pitch
It's with a great deal of excitement that I'm announcing today that I've taken a job as a Baseball Analyst in the front office of the Cleveland Indians. I'm thrilled that I'll be joining the great Keith Woolner and Jason Pare in the Indians front office, and I'm excited to contribute to the club. As you can imagine, the Indians will be wanting to keep all of my ideas to themselves, so it's with some sadness that I say that this will be my final post here at Baseball Analysts.
There aren't a whole lot of jobs out there that are like this one, and I feel lucky to have landed one them. Upon getting the job, I thought back to Malcom Gladwell's book Outliers, the crux of which can be summed up in a statistical concept that sabermetricians know well: people with outcomes on the tail end of the distribution are likely to have been both very good and lucky. While a player who led the league in batting was probably a very good hitter, he also likely caught some breaks as well. The same concept applies to pretty much anything in life, be it career, money, etc. Looking back on my own experience I was very lucky to have had a number of helpful people in my sabermetric career.
Most of all, I'm indebted to Rich Lederer, the leader of this great site. After studying sabermetrics on my own for years, back in March of 2009 I started my own blog on sports and statistics. Getting about five readers per day, I emailed Rich an article I had written in hopes of drumming up a little more publicity. Instead of just linking to the article, he offered me a weekly column at the site. I jumped at the chance and never looked back. It was also my good fortune to come on to the site right as Dave Allen and Jeremy Greenhouse also joined Sully and Rich at Baseball Analysts. Their great writing and analysis helped make Baseball Analysts a go-to place for sabermetric research during the 2009 and 2010 seasons and I'm grateful to have been a part of that.
I also have to thank Dave Studenmund, who not only tapped me for an article in the Hardball Times 2010 Annual, but also introduced me to the good folks over at SI.com, where I had been writing since November. Through some hard work and more helpful people, I was able to parlay that into a full-blown weekly column which was a terrific experience. After starting at SI, I was then fortunate enough to be contacted by another MLB club (not the Indians) to do some consulting for them, giving me invaluable experience working with an MLB front office and setting me on a path for further success. To all who have helped me on my journey, I thank you.
My Two Cents
Perhaps like some people reading this, working as a statistician in an MLB front office was a dream of mine growing up. Now that I've achieved that goal, I'm excited to start the next chapter in my career and take my ideas inside the game. As I've told people about my new job, a common reaction I got was "How can I get that job?" And, during my time at Baseball Analysts, I've gotten emails from at least one young fan asking for advice on getting into baseball. For what it's worth, here's mine:
A) Start blogging: the surest way to a career in baseball is by consistently putting good stuff out there. Don't wait until you get that one earth-shattering finding. Consistency will prove you know what you're talking about and over time you'll build a solid reputation which will lead to other opportunities.
B) Get a degree: As sabermetrics becomes more advanced, there's going to be more need for people with technical skills. I personally have an MS in Statistics, and I think it's helped tremendously. Not only will the knowledge from your degree help in your analysis, but jobs in and around sabermetrics will likely start requiring one.
C) Don't worry about the competition: There was a time when I wondered if most of the sabermetric gold had already been mined. However, as I discovered, that's not even close to true. While many topics have already been looked at, it doesn't mean that other studies have all the answers. If you have an idea for an investigation, go for it - chances are you'll have a twist on it that makes your analysis a little different from what has come before. Sabermetric studies can always benefit from a second opinion.
D) Work hard: I challenged myself to write one in-depth study per week here at Baseball Analysts. It wasn't always easy, but pushing yourself to perform your best work pays off. By the end I was not only writing here, but writing weekly for SI, as well as consulting, meaning I was spending more time on baseball than at my actual job. Like anything, serious payoff requires serious hard work.
Thanks for Everything!
I've truly enjoyed writing for this site and being part of the sabermetric community at-large. All of your comments and readership have been wonderful and it will be tough to leave that behind. However, I'm really looking forward to going inside baseball and bringing my best work to the Cleveland Indians. From Baseball Analysts to Baseball Analyst, thanks for everything!
| Baseball Beat | May 10, 2010 |
Which Pitcher is King?
OK, class. While finals are still a week or two away for many colleges, we're going to hit you up with a pop quiz.
The stat lines for two active starting pitchers are presented below. Which pitcher would you take? Hint: One pitcher is an "innings eater" and the other is a "franchise player."

While there is no right or wrong answer, the stat lines are virtually indistinguishable in my view. Without more information, I would have a tough time choosing between the two. Feel free to dismiss the W-L records if you'd like. With the foregoing in mind, the main difference is that Pitcher A has thrown over 200 additional innings. Pitcher A also has superior strikeout and home run rates while Pitcher B has lower walk and hit rates.
After you pass your answers to the end of the row, we will reveal the names of the two pitchers. [pause] Thank you for your participation.
Pitcher A is none other than Felix Hernandez. Pitcher B is Jered Weaver.
Are you surprised? Well, you're not the Lone Ranger. I was surprised, too. But perhaps no one is — or should be — as befuddled as Dave Cameron, the co-founder of the U.S.S. Mariner and managing editor of Fangraphs who has labeled Hernandez as a "franchise player" and Weaver as an "innings eater." I like Dave personally and respect his work greatly, but he and I have seen Weaver differently for years.
In fairness to Dave, he actually labeled Weaver "more innings eater than ace" in a Two on Two AL West preview two years ago. He expanded upon his comments in a Baseball Think Factory comments thread last summer (emphasis is mine).
In case anyone is wondering, this misquote comes from an article at Baseball Analysts last year, where I stated Weaver was "more of an innings eater than an ace", which is entirely true. Really, if we're going to talk about the Jered Weaver debate, I think it's pretty obvious that my stance on his abilities is closer to reality than Rich's. He's the exact same guy he's always been, just with varying degrees of luck - he's never been a frontline starter, and he never will be. That doesn't mean he sucks - I even put him in my list of the 50 most valuable trade chips in baseball. He's a solid mid-rotation starter. He's just not more than that, and the only people who thought he was were ones who put way too much stock into the value of BABIP-driven ERA.
Cameron then downgraded Weaver to a "mid-rotation starter" and "innings eater" in a discussion with Patrick Sullivan in our Stakeholders series three months ago.
Look, the purpose of this article is not to make Dave look bad as much as it is to bring clarity to the subject. Either Weaver is not an "innings eater" or Hernandez is not a "franchise player." Or either Weaver and Hernandez are both more innings eaters than aces, both more aces than innings eaters, or perhaps both are more franchise players than not. (Note: I have never called Weaver an innings eater, an ace, or a franchise player. Instead, I started writing about him when he was a junior at Long Beach State and compared his collegiate record to Mark Prior's.)
Cameron is far from the only baseball analyst who has underestimated Weaver. Four years ago, Kevin Goldstein cautioned Baseball Prospectus readers "Don’t Believe The Hype." The hype was directed at me. Goldstein concluded:
In the end, if he hits his ceiling, he's basically his brother.
Did Goldstein mean "ceiling" or "floor?" To wit, older brother Jeff has a career ERA+ of 94 (with a seasonal high and low of 134 and 71, respectively) while younger brother Jered has a career ERA+ of 123 (with a seasonal high and low of 179 and 103).
Importantly, the above table is designed to compare actual performance. One can look at other variables (such as age, velocity, and batted ball info) to make projections.
As it relates to Hernandez and Weaver, Felix (24) is younger than Jered (27). While most would give the edge to Felix, even Cameron believes young starting pitchers "defy conventional growth curves" and notes that the normal career trajectory "heads downward" as opposed to an "arc-shaped career path" for hitters. Let's call the age factor a push.
Hernandez (94-95 mph) throws harder than Weaver (89-90), although the latter can dial it up to the mid-90s on occasion in the early innings. Edge to Felix. Mike Fast has studied the correlation between fastball velocity and run average and concluded that "starting pitchers improve by about one run allowed per nine innings for every gain of 4 mph" (or 0.25 R/9 per 1 mph).
With respect to batted ball types, Hernandez induces more groundballs than Weaver. Over the course of their careers, Felix has generated a GB rate of 57% vs. 33% for Jered. As I and others have noted, "pitchers with above-average GB rates outperform those with below-average GB rates" due to the fact that they tend to give up fewer home runs than their counterparts.
Based on age, velocity, and batted ball info, maybe Hernandez projects as a better pitcher than Weaver. But the reality is that Felix has not outpitched Jered to this point. Or, if he has, the difference between the two has been miniscule.
Interestingly, Hernandez and Weaver squared off last Friday night. While one game does not a season or career make, Felix was knocked out of the game in the fourth inning having allowed five hits, four walks, and eight runs while Jered tossed a no-hitter for 6 2/3 innings and combined with Scot Shields for a shutout.
Rotowire added the following comment on Saturday:
Weaver continued his impressive 2010, allowing just two hits over 7.1 scoreless innings Friday against the Mariners.Spin: Weaver now sits at 4-1 with a 2.66 ERA. A 47:10 K:BB in 44 innings is also quite good. Weaver is nearing elite starter status.
After Weaver's last outing, ESPN posted the following rankings on his player card:
• Ranks 2nd in AL in W (4)
• Ranks 7th in AL in W% (.800)
• Ranks 6th in AL in IP (44.0)
• Ranks 1st in AL in SO (47)
• Ranks 7th in AL in WHIP (1.05)
The 2010 season is less than a quarter completed. Weaver may regress toward his career stats (and rankings) before the year is out. In the meantime, he is the ace of the Angels' staff and has been one of the best 30 starting pitchers as measured by ERA and FIP over the past two and three calendar years.
No matter how you slice it, Weaver is much more than an innings eater, a mid-rotation starter, or his brother Jeff. Heck, he just may be King Jered.
| Change-Up | May 09, 2010 |
A Passage to Remember
In today's Boston Sunday Globe, Dan Shaughnessy wrote a paragraph that reveals just about all you need to know about his character, his intellect and his baseball acumen. Concerning that last point, his baseball acumen, you'll recall he believes Jack Morris to have been a better pitcher than Curt Schilling.
I don't have any further comment.
It looks like those sun-deprived stat geeks eating pudding in their basement (the same nitwits who insist that homers and RBIs are overrated) outsmarted themselves in assessing this unit. Marco Scutaro is not better than Alex Gonzalez (not to rub it in, but Gonzo has 10 homers already for the Blue Jays). The Cameron-Ellsbury combo hasn’t gotten out of the trainer’s room, and Beltre is emerging as an Edgar Renteria or Rasheed Wallace, take your pick.
| Change-Up | May 08, 2010 |
Another Red Sox Update
A couple of weeks ago, I tried to detail what was wrong with the Boston Red Sox as best I could. It was pretty straightforward. The Red Sox could not pitch, they could not field, they could not hit. Since April 21st, the Red Sox are 10-6 but with the Yankees and Rays still playing terrific baseball, Boston does not have much to show for their improved play.
The fact remains, however, that the Red Sox have been settling in. Another Yankees blowout last night when the Red Sox seemingly had the starting pitching advantage hurts. So did last weekend's sweep at the hands of the Baltimore Orioles, who had just four wins coming into the set. With their stiff competition and regular lackluster efforts, this 10-6 stretch hasn't felt quite as good as it otherwise might. The doubters sure haven't seemed to quiet down at all.
Coming into the season, those who questioned Boston's chances did so on the grounds that letting Jason Bay walk without replacing his formidable bat with a comparable hitter amounted to an exceedingly large step backwards for the offense. It would be too much to fill with pitching and defense, no matter how highly one might think of Mike Cameron, Adrian Beltre and John Lackey. But let's just take a quick look at how that rationale plays out.
Last year, according to Fangraphs' WAR, Mike Lowell, Bay and David Ortiz contributed a combined 7.0 Wins Above Replacement. Lowell, slowed by mounting injuries, could no longer field his position at 3rd and David Ortiz hit like Neifi Perez for half the year. This season, they would need to replace Bay, find a legitimate everyday 3rd Baseman and, one way or another, get more from the DH position. The rest of the lineup would remain stable, with the one exception that Victor Martinez would be the everyday catcher for a full season.
If you average their 2008 and 2009 seasons, Beltre and Cameron combined for 7.5 wins per year between them. The plan to replace Bay and Lowell with Beltre and Cameron, while giving Ortiz, Lowell, and maybe Jeremy Hermida a chance to offer more production from the Designated Hitter position, was to amount to a better collection of position players.
And guess what? It has! Boston's 114 OPS+ is 2nd in Major League Baseball and 9 points better than the 105 figure they posted in 2009 when Bay was in the mix. Their .355 wOBA would be their best total as a team since the 2004 team managed a .358 total. Just like 2009, they're 3rd in the American League in runs scored. By any measure, this offense has been phenomenal.
Defensively, they've just been middle of the road but that's attributable more to injuries than anything. As any Red Sox fan can attest, whether he is at left field, center field or heavens, shortstop, Bill Hall does not belong on a Major League Baseball field. The 168 combined innings Hall, Jonathan Van Every and Darnell McDonald "contributed" in center field to date have been a complete joke. With either Jacoby Ellsbury or Cameron playing everyday, those 168 innings would never have come to pass. I still believe this is a top-notch defensive team.
That brings me to the starting pitching. You want to have a look at the difference between this year's team and last year's? See below:
         K/9   BB/9   K/BB   ERA  xFIP
2009    7.43   3.00   2.48  4.63  4.17
2010    6.95   3.65   1.90  5.10  4.39
Those numbers are just for Boston's starters, but keep in mind what we are really looking at there. This season, Daisuke Matsuzaka's delayed return notwithstanding, Boston's ducks were in a row. Josh Beckett, Jon Lester, Lackey, and Clay Buchholz were healthy and ready to go, and Tim Wakefield would tend to Dice-K's spot until he returned. Last year, that top line that looks so much better than the 2010 numbers, well that's filled with Brad Penny and John Smoltz and Junichi Tazawa and Michael Bowden and Paul Byrd. The 2009 unit that so badly outperformed Boston's starting pitching to date in 2010 was not exactly the 1995 Atlanta Braves (well, except for Smoltz).
The consistent excellence of Lester and Beckett anchored the Red Sox rotation in 2009. Respectively, they ranked 5th and 7th in the AL in WAR among starters. This season, Boston's top two starters have been Lester and Buchholz, who rank 18th and 20th in the AL thus far. Beckett has been one of the very worst pitchers in baseball to date, sporting a 59 ERA+.
Beckett's awful start has been mystifying. Digging into his Pitch Type data on Fangraphs, he is throwing fewer fastballs and curve balls than ever, and replacing them with more cutters and change ups. The result has been a big drop in strikeouts, a big hike in walks and much harder contact according to his Line Drive percentage allowed.
There is some hope. Beckett's 56.9% LOB rate is absurdly low. That will improve. Likewise, his .365 BABIP allowed is bound to normalize as well. Better luck will make Beckett a decent option for the Red Sox, but they obviously are counting on him for much, much more. John Farrell is a highly regarded pitching coach in Major League circles, and what he can do to get Beckett right will go a long way in determining whether or not the Red Sox can climb back into this race.
On May 8th, the Red Sox sit in fourth place, at .500, and six games out of a playoff spot. I hope that I have managed to demonstrate that their poor play to date has been attributable to terrible starting pitching and little more. So, if you're a pundit who thought the Red Sox might struggle because their rotation would not cut it, take a bow. You've nailed it thus far. Otherwise, Red Sox doubters, quiet down please.
| Baseball Beat | May 06, 2010 |
Wiffleball '79
To bridge the gap between our stat-based articles, I present to you Wiffleball '79, an entertaining and nostalgic short film directed by Perry Jenkins and Travis Kurtz. The five-minute movie made its YouTube debut yesterday. Travis notified me via email this morning. It's a good one for any baseball fan, especially those who have played wiffleball. You can be one of the first 100 people to watch it. Enjoy.
| Baseball Beat | May 04, 2010 |
Alex Gone-zalez
Has Alex Gonzalez really hit 10 2B and 8 HR thus far? It looks like the Toronto Blue Jays shortstop is on his way to putting up a season like he did in 1999, 2003, and 2004 with the Marlins or 2007 with the Reds when the native of Venezuela hit at least 27 doubles and 14 home runs. While Gonzalez's OBP stands at a below-average .319, his .617 SLG ranks seventh in the American League. Put it together and Alex has produced an OPS of .935, good for tenth-best in the league. Amazingly, Gonzalez's OPS+ is at 151, despite never producing an OPS+ of 100 in 11 seasons.
How is Gonzalez doing it? He's hitting more flyballs than ever and his HR/FB rate (18.6%) is more than 10 percentage points above his 2002-2010 average. Meanwhile, his LD% (19.0%) is virtually identical to his "career" mark (18.9%).
Gonzalez is seeing far fewer fastballs (46.4%) than at any other point in the pitch type data era (2002 to present). In fact, he has seen fewer fastballs and more sliders than any other hitter in the AL. In the past, Gonzalez has been fed 60% fastballs with the yearly rates ranging from 59-63%.
Why the change? Well, let's take a look at the Fangraphs Pitch Type Values table for a possible answer.
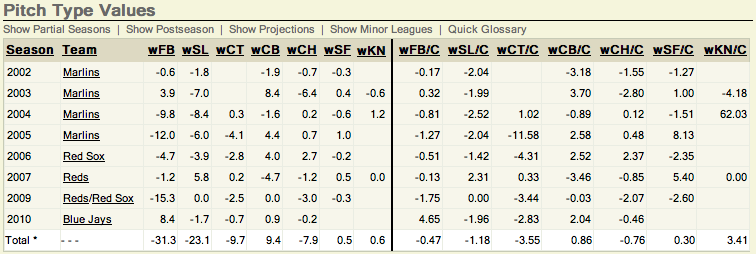
Gonzalez, who is jacking fastballs like never before, ranks third in the league in wFB (runs above average) and second in wFB/C (runs above average per 100 fastballs) while ranking in the bottom 10 in wSL and bottom 30 in wSL/C.
Of note, Gonzalez's plate discipline — as bad as it has been in the past — is worse than ever. His O-Swing% (percentage of pitches a batter swings at outside the strike zone) of 47.1% ranks second in the AL, behind only Vladimir Guerrero (47.8%). With 5 BB (4.4%) and 28 SO (24.8%) in 113 plate appearances, Gonzalez's BB/SO rate of 0.18 is the fifth-worst in the AL. Alexei Ramirez (0.07), Jack Wilson (0.08), Yuniesky Betancourt (0.09), and Adam Jones (0.12) are the only "hitters" in the junior circuit with an inferior BB/SO rate. Importantly, their OPS's range from .587 to .664.
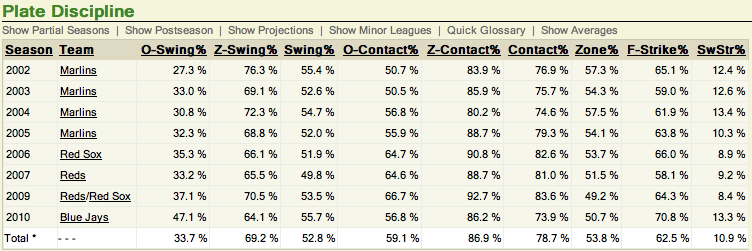
Interestingly, Gonzalez's F-Strike% (first pitch strike percentage) not only ranks higher than ever before but tops in the league, which suggests pitchers are challenging him from the moment he steps into the batter's box. While I'll defer to the advance scouts to determine whether Gonzalez should be thrown more or fewer fastballs in the future, I believe teams would be better served to make him chase as many pitches as possible.
The bottom line is that Gonzalez has hit like never before in the early going but his ability to control the plate remains as deficient as ever. There is little question that he can — and should — be had.