Rich Lederer • Baseball Beat
Patrick Sullivan • Change-Up
Jeremy Greenhouse • Touching Bases
Dave Allen • F/X Visualizations
Sky Andrecheck • Behind the Scoreboard
Marc Hulet • Around the Minors
Al Doyle • Past Times
Retired Uniforms:
Bryan Smith • WTNY
Joe Sheehan • Command Post
Jeff Albert • The Batter's Eye
RSS Feed
Home
*Examining the Past, Present, and Future*
Lineup Card
Recent Entries
» Putting Together a Reality Team
» Historical Hall of Fame Vote Comparisons: 2012
» An All-Christmas Team
» The New-Look Angels
» John Denny: The Forgotten Cy Young Award Winner
» Money Isn't Everything
» What Would It Take to Hit .400 in the 21st Century?
» Halos Heaven
» Brandon McCarthy's Breakout Season
» Link-o-Rama
» Historical Hall of Fame Vote Comparisons: 2012
» An All-Christmas Team
» The New-Look Angels
» John Denny: The Forgotten Cy Young Award Winner
» Money Isn't Everything
» What Would It Take to Hit .400 in the 21st Century?
» Halos Heaven
» Brandon McCarthy's Breakout Season
» Link-o-Rama
Best of Baseball Beat
Abstracts From the Abstracts
1977 Baseball Abstract
1978 Baseball Abstract
1979 Baseball Abstract
1980 Baseball Abstract
1981 Baseball Abstract
1982 Baseball Abstract
1983 Baseball Abstract
1984 Baseball Abstract
1985 Baseball Abstract
1986 Baseball Abstract
1987 Baseball Abstract
1988 Baseball Abstract
1978 Baseball Abstract
1979 Baseball Abstract
1980 Baseball Abstract
1981 Baseball Abstract
1982 Baseball Abstract
1983 Baseball Abstract
1984 Baseball Abstract
1985 Baseball Abstract
1986 Baseball Abstract
1987 Baseball Abstract
1988 Baseball Abstract
Bert Blyleven Series
Meeting Up and Hanging Out with Bert
The Results Are In And...
Aficionado Heavily Invested in Blyleven
Latest on Blyleven's Chances for the HOF
The Internet Zealot Responds
400 Down and 5 to Go...
Bert Be Home By Eleven?
Blyleven's Forgotten Season (1973)
HeyMan, Your Comments Don't Hold Water
The Waiting is the Hardest Part
Another Addition to the Blyleven Series
Search for the Truth
As Dominant as His HOF Contemporaries
Listen, Buster
A Larger Step for Blyleven
Answering the Naysayers (Part Two)
Another Small Step for Blyleven
Q&A: Blyleven on the Twins
The Majority Rules, Right?
It's All Dutch to Some
The Hall of Fame Case for Bert Blyleven
Q&A: Blyleven on Felix Hernandez
Clemens Rocketing Up Charts
Poz: An Interview With a KC Star
A HOF Chat with Tracy Ringolsby
Up Close and Personal
A Peek Into the Mind of a HOF Voter
Answering the Naysayers
It's That Time of the Year (Again)
"If Cooperstown is Calling..."
The Bert Alert
One Small Step for Blyleven...
Only the Lonely
Exclusive Interviews
Lee Sinins
Alex Belth
David Pinto
Will Carroll
Mike Carminati
Aaron Gleeman
Joe Sheehan
Jay Jaffe
Jeff Peek
Tracy Ringolsby
Joe Posnanski
Bill James Part I, II, III
Jon Lalonde
Chuck Tiffany
Dayn Perry
Fay Vincent
Nate Silver
Alex Belth
David Pinto
Will Carroll
Mike Carminati
Aaron Gleeman
Joe Sheehan
Jay Jaffe
Jeff Peek
Tracy Ringolsby
Joe Posnanski
Bill James Part I, II, III
Jon Lalonde
Chuck Tiffany
Dayn Perry
Fay Vincent
Nate Silver
Bullpen
Rich Lederer
The Odd Couple (with Alex Belth)
The MostUnder Over Underrated Player in Baseball (with Brian Gunn)
Three Wise Men (roundtable by Alex Belth)
Infrequently Asked Questions (interview with Matt Welch)
Interview (Orioles Think Tank)
Bernie and the Yanks (Bronx Banter)
Hope and Faith: How the LAA Win the World Series (Baseball Prospectus)
NL West (The Soul of Baseball)
Greatest Living Hitter? (Sports Illustrated)
Roundtable: 2008 HOF Ballot (Armchair GM)
The Most
Three Wise Men (roundtable by Alex Belth)
Infrequently Asked Questions (interview with Matt Welch)
Interview (Orioles Think Tank)
Bernie and the Yanks (Bronx Banter)
Hope and Faith: How the LAA Win the World Series (Baseball Prospectus)
NL West (The Soul of Baseball)
Greatest Living Hitter? (Sports Illustrated)
Roundtable: 2008 HOF Ballot (Armchair GM)
Patrick Sullivan
Designated Hitters
David Bromberg (Q&A: John Denny)
Mark Armour (H. Killebrew and Versatility)
Joe Lederer (Soundtrack of a Prospect)
David Bromberg (Clemente's Autograph)
David Bromberg (Woody Fryman)
D. Baumstein (WAR Against Age: Pitchers)
Doug Baumstein (The WAR Against Age)
Doug Baumstein (A Lifetime on the Road)
John Fraser (Pick Six)
Mark Armour (How to Score More Runs?)
Bill Parker (What Opening Day Tells Us)
Stan Opdyke (Pat Rispole)
Chris Jaffe (Evaluating Baseball's Mgrs)
Stan Opdyke (Baseball Radio in NYC, 1953)
A. Nathan (Performance of Baseball Bats)
Michael Weddell (Edgar Martinez/HOF)
Jon Weisman (100 Things Dodgers Fans...)
Stan Opdyke (Connie Mack and Vin Scully)
Eric Walker (Evaluating Run Production)
Brent Mayne (The Intangibles of Catching)
Chris Moore (Best Fastballs in Baseball)
Dave Baldwin (The Batter’s Brain)
Shawn Haviland (Ivy League to MLB)
Larry Granillo (Walking Off)
Rob Iracane (Solo HR Won't Break You)
Tommy Bennett (Charm of AM Radio)
Harry Pavlidis (Johan Santana's Fast Start)
John Walsh (WAR and Remembrance)
Eric Walker (Precisely Inaccurate)
Bob Timmermann (As They See 'Em)
Geoff Young (Unicycles and Delusions)
Baseball Analysis at Tufts (Groundballers)
Baseball Analysis at Tufts (GB Out Rates)
G. Rybarczyk ('09 Hit Tracker Projections)
Joe Lederer (Curt Schilling/HoF)
Conor Gallagher (Hall of Fallacies)
Chris Green (Jim Rice, HoF, the Numbers)
Shawn Hoffman (Baseball's Bear Mkt?)
Paul Anthony (Manny Syndrome)
Ross Roley (World Series Odds)
B. Timmermann (Catcher's Interference)
R.J. Anderson (Waiting the Hardest Part)
Maury Brown (Cubs, MLB, and Cuban...)
Myron Logan (Dee-Fense, Dee-Fense)
Craig Calcaterra (Frivolity, Part I, Part II)
Chad Finn (Ode to Baseball Cards)
David Cameron (Mariners Foibles)
Chris Dial (Chipper Jones)
Pat Lederer (Memory Lane)
David Appelman (Clutch Pitching)
Bob Rittner (DH)
Jonathan Mayo (Roger Clemens)
Lisa Winston (My Son-in-Law...)
Russ McQueen (The Yellow Hammer)
Bob Rittner (I'm OK, You're OK)
Mark Armour (In Defense of the HOF)
Pat Jordan (Friends)
Dan Levitt (Analysis of Terry Ryan)
Doug Baumstein (Trading Econ 101)
Ross Roley (Runner's Reluctance II)
Ross Roley (Runner's Reluctance I)
Mark Armour (No-Longer Lovable Sox)
Bruce Regal (Stealthy and Wise)
Brian Gunn (Roid Monster)
Current/McEvoy (Value of the SB)
John Rickert (Sinister Thefts)
Nate Silver (Sabermetrics)
David Vincent (Home Run Production)
Joe P. Sheehan (Enhanced Gameday II)
Mark Armour (An Ode to Sport)
David Gassko (All-Time Worm Burners)
Joe P. Sheehan (Enhanced Gameday)
John Walsh (When Titans Clash)
Fox/Williams (Quantifying Coaches II)
Fox/Williams (Quantifying Coaches I)
Jacob Luft (Bull Durham Rant)
Chad Finn (Strat-O-Matic)
Lisa Winston (Rotisserie Baseball)
Dave Studeman (Baseball Stats)
Steve Treder (Roger Craig)
Marc Normandin (Jeff Bagwell)
D. Appelman (Expanding Strike Zone)
Jeff Sackmann (Worst MiL Defenders)
Jeff Sackmann (Best MiL Defenders)
Maxwell Kates (Van Lingle Mungo)
David Appelman (Pitch Location)
Kent Bonham (Danny Ray Herrera)
Glenn Stout (Two Baseball Poems)
Bruce Regal (The Challenge Round)
Mark Lamster (Barry & Ty)
Geoff Young (NL West)
Tom Lederer (The Ryan Express)
Brian Erts (Great Leap Forward)
David Pinto (Parity and the N.L.)
Jacob Luft (Fathers and Daughters)
Jamey Newberg (Pete's Sake)
Jeff Albert (A. Jones Swing Analysis)
Jeff Albert (A-Rod Swing Analysis)
Keith Law (Death, Taxes, and Waivers)
Peter Abraham (Tales of Torre Tales)
Larry Borowsky (Let 'er Rip II)
Dan Levitt (Empirical Analysis of Bunting)
Jonah Keri (If I Met Warren Cromartie...)
Bob Klapisch (War Stories)
Bob Timmermann (John F. Kennedy HS)
Kent Bonham (Aluminum Adjustments)
Al Doyle (More Than Superstars)
Ross Roley (Instant Replay)
David Vincent (Barry Bonds Homers)
Chad Finn (Our Favorite Obscurities)
Bill Deane (1979 NL MVP)
Mark Armour (Rise/Fall of Artificial Turf)
Jeff Angus (Wally Moon Camp)
David Berri (Money and Baseball)
Larry Borowsky (Baseball w/o the #s)
Derek Zumsteg (The Irrational Market)
David Regan (Free Agent Contracts)
Peter Schmuck (Steroids and the HOF)
David Appelman (Pitchers, Pitch by Pitch)
Dan Fox (Swinging, Taking, Fouling, Etc)
Patrick Sullivan (Study of NYY CF/BOS LF)
Will Leitch (Baseball Journalism)
Jeff Sullivan (Pitcher Release Points)
Steve Treder ('69-'70 Giants)
Maury Brown (Charlie Finley)
John Brattain (Bob Johnson)
Bob Klapisch (The Case for Bert Blyleven)
Jeff Peek (Pride and Prejudice)
Dayn Perry (Bert and Warren)
Rob Neyer (If Don Sutton Was Great...)
Lisa Winston (Minor League Memories)
Alex Belth (Otis Redding Was Right)
David Cameron (Long Live the King)
Jeff Angus (Baserunning Study)
Bert Blyleven (Baseball Playoffs)
Boyd Nation (Not a Prospect List)
James Click (Batters-Baserunners Study)
Jeff Shaw (Why I Love Baseball)
David Gassko (BIP/BFP Fielding Study)
Jay Jaffe (Milwaukee Sausage Race)
Jamey Newberg (Remember When)
Bob Klapisch (Press Box to the Mound)
Dan Levitt (Predictive Value of BB)
David Vincent (Official Scorer)
Jon Weisman (Rick Monday)
Larry Borowsky (Let 'er Rip)
Will Carroll (Fictional Short Story)
Bob Timmermann (Japanese Baseball)
Cyril Morong (Best Pitching Seasons)
Sean Forman (Monte Carlo Win-Loss)
Brian Gunn (My Little Blue Book)
Joe Lederer (My Dad and Baseball)
Bill Deane (Bob Gibson, 1968)
Mark Armour (1977 Yankees)
Darren Viola (Retrosheet)
David Pinto (RFK)
Dayn Perry (Brave Heart)
Matt Welch (Dave Hansen)
Kevin Kernan (Jack McKeon)
Tom Lederer (Dodgers Road Trip)
Steve Lombardi (Slider)
Studes (Picturing Baseball)
Mike Carminati (Luck of the Drawl)
Eric Neel (Vin Scully)
J.C. Bradbury (Leo Mazzone)
John Sickels (Bill James)
Search Baseball Analysts
Archives
By Category:
Around the Majors Content Only
Around the Minors Content Only
Baseball Beat Content Only
Baseball Beat/Change-Up Content Only
Baseball Beat/WTNY Content Only
Behind the Scoreboard Content Only
Change-Up Content Only
Change-Up/Around the Majors Content Only
Command Post Content Only
Crunching the Numbers Content Only
Designated Hitter Content Only
F/X Visualizations Content Only
Past Times Content Only
Saber Talk Content Only
The Batter's Eye Content Only
Touching Bases Content Only
Weekend Blog Content Only
WTNY Content Only
By Month:
February 2012
January 2012
December 2011
October 2011
September 2011
August 2011
July 2011
June 2011
May 2011
April 2011
March 2011
February 2011
January 2011
December 2010
November 2010
October 2010
September 2010
August 2010
July 2010
June 2010
May 2010
April 2010
March 2010
February 2010
January 2010
December 2009
November 2009
October 2009
September 2009
August 2009
July 2009
June 2009
May 2009
April 2009
March 2009
February 2009
January 2009
December 2008
November 2008
October 2008
September 2008
August 2008
July 2008
June 2008
May 2008
April 2008
March 2008
February 2008
January 2008
December 2007
November 2007
October 2007
September 2007
August 2007
July 2007
June 2007
May 2007
April 2007
March 2007
February 2007
January 2007
December 2006
November 2006
October 2006
September 2006
August 2006
July 2006
June 2006
May 2006
April 2006
March 2006
February 2006
January 2006
December 2005
November 2005
October 2005
September 2005
August 2005
July 2005
June 2005
May 2005
April 2005
March 2005
February 2005
January 2005
December 2004
November 2004
October 2004
September 2004
August 2004
July 2004
June 2004
May 2004
April 2004
March 2004
February 2004
January 2004
December 2003
November 2003
October 2003
September 2003
August 2003
July 2003
June 2003
Reference
Organizational Stats
Arizona Diamondbacks Bat / Pitch
Atlanta Braves Bat / Pitch
Baltimore Orioles Bat / Pitch
Boston Red Sox Bat / Pitch
Chicago Cubs Bat / Pitch
Chicago White Sox Bat / Pitch
Cincinnati Reds Bat / Pitch
Cleveland Indians Bat / Pitch
Colorado Rockies Bat / Pitch
Detroit Tigers Bat / Pitch
Florida Marlins Bat / Pitch
Houston Astros Bat / Pitch
Kansas City Royals Bat / Pitch
Los Angeles Angels Bat / Pitch
Los Angeles Dodgers Bat / Pitch
Milwaukee Brewers Bat / Pitch
Minnesota Twins Bat / Pitch
New York Mets Bat / Pitch
New York Yankees Bat / Pitch
Oakland Athletics Bat / Pitch
Philadelphia Phillies Bat / Pitch
Pittsburgh Pirates Bat / Pitch
St. Louis Cardinals Bat / Pitch
San Diego Padres Bat / Pitch
San Francisco Giants Bat / Pitch
Seattle Mariners Bat / Pitch
Tampa Bay Devil Rays Bat / Pitch
Texas Rangers Bat / Pitch
Toronto Blue Jays Bat / Pitch
Washington Nationals Bat / Pitch
All-Star Links
Official Websites
News and Notes
Baseball News Blog
Baseball Newstand
ESPN Baseball
Fox Sports Baseball
Pro Sports Daily
Roto World
The Roto Times
USA Today Baseball
Baseball Newstand
ESPN Baseball
Fox Sports Baseball
Pro Sports Daily
Roto World
The Roto Times
USA Today Baseball
Reference and Analysis
Baseball Almanac
Baseball America
Baseball Archive
Baseball Contracts
Baseball Cube
Baseball Graphs
Baseball Library
Baseball Musings Player Database
Baseball Page
Baseball Primer
Baseball Prospectus
Baseball Reference
Baseball Statistics
Baseball Truth
Boxscore Central
Diamond Mind Baseball
Doug's Stats
FanGraphs
Fast Balls (pitchfx catalog)
Hardball Dollars
Hardball Times
Hit Tracker
Retrosheet
Rotobase/Rotoblog
Stat Corner
STATS
Tango on Baseball
Yahoo Sports MLB
Web Gems
Bill James Primer
Sabermetric Manifesto (Grabiner)
Pitching and Defense (McCracken)
Pitching and Defense (Tippett)
Transactions Primer (Neyer)
Baseball Stats (Batter's Box)
Prospect Report (Cameron)
Pitcher Workloads (Sheehan)
Goodbye to Old Baseball Ideas (Rickey)
Sabermetric Manifesto (Grabiner)
Pitching and Defense (McCracken)
Pitching and Defense (Tippett)
Transactions Primer (Neyer)
Baseball Stats (Batter's Box)
Prospect Report (Cameron)
Pitcher Workloads (Sheehan)
Goodbye to Old Baseball Ideas (Rickey)
Columnists
Baseball Blogs
Around the Majors
Athletics Nation
Baseball Crank
Baseball Musings
Baseball-Reference Blog
Batter's Box
Big League Stew
Bronx Banter
Catfish Stew
Cub Town
Dan Agonistes
Dodger Thoughts
DRays Bay
Ducksnorts
Futility Infielder
Halos Heaven
Inside the Rockies
It Might Be Dangerous
Knuckle Curve
LoHud Yankees Blog
Lookout Landing
Management by Baseball
Metaforian
Metsgeek
Mike's Baseball Rants
Only Baseball Matters
Redbird Nation
Red Reporter
Sabernomics (Braves)
Seth Speaks
ShysterBall
6-4-2 (Angels/Dodgers)
The Book
TheCubdom
The Cutting Edge
The House That Dewey Built
The View From The Bleachers
Tiger Blog
U.S.S. Mariner
Viva El Birdos
Where's Kernan
Minor Leagues
Arizona Fall League
BA Player Finder
Cal Leaguers
Jamey Newberg
JDM's Scoresheet Baseball
Minor League Baseball
Minor League Park Factors
Minor League Splits
No Pepper
Sickels' Minor League Ball
Warm October Nights
BA Player Finder
Cal Leaguers
Jamey Newberg
JDM's Scoresheet Baseball
Minor League Baseball
Minor League Park Factors
Minor League Splits
No Pepper
Sickels' Minor League Ball
Warm October Nights
Amateur
Boyd's World (College)
Cape Cod Baseball League
College Baseball Blog
College Baseball Insider
Collegiate Baseball Newspaper
College Splits
College Splits Blog
Dirtbags Baseball (Long Beach State)
NCAA Baseball
NCBWA
Team One Baseball (High School)
Texas A&M & Baseball
Cape Cod Baseball League
College Baseball Blog
College Baseball Insider
Collegiate Baseball Newspaper
College Splits
College Splits Blog
Dirtbags Baseball (Long Beach State)
NCAA Baseball
NCBWA
Team One Baseball (High School)
Texas A&M & Baseball
Historical
Cuban Baseball
House of David
Jim "Mudcat" Grant's Web Page
Negro League Baseball Players Assoc
Negro Leagues Baseball Museum
1919 Black Sox
Pacific Coast League
Philadelphia Athletics Historical Society
Shoeless Joe Jackson Society
SABR-L Archives
Walter O'Malley
House of David
Jim "Mudcat" Grant's Web Page
Negro League Baseball Players Assoc
Negro Leagues Baseball Museum
1919 Black Sox
Pacific Coast League
Philadelphia Athletics Historical Society
Shoeless Joe Jackson Society
SABR-L Archives
Walter O'Malley
Miscellaneous
Forums
Credits
Ticket Center
Tickets to Baseball -
Premium Red Sox Tickets - Tickets to Marlins Games - Cardinals Game Tickets - NY Yankee Tickets - Tickets Oakland Athletics - Dallas Cowboys Tickets - Arizona Cardinals Tickets - Tickets Seattle Seahawks - Buffalo Bills Tickets Online - Tickets to Dolphins Football
Buy Boston Red Sox tickets,
Philadelphia Phillies tix,
NY Yankees tickets,
NY Mets tickets, and
MLB All Star game tickets at ABC tickets
Not sure where to find the best online sportsbooks? Start your search with PlayersJet.
Get deals at SportsMemorabilia.com on baseball apparel, including Phillies jerseys and more for adults and children.
Shop the largest selection baseball equipment on sale at Sports Unlimited. Check out tons of baseball gloves, youth baseball gloves and catchers gear from Rawlings, Wilson, Nike & Under Armour.
2011 Draft Order
Courtesy of Baseball America
First-Round:
 1. Pirates (57-105)
 2. Mariners (61-101)
 3. Diamondbacks (65-97)
 4. Orioles (66-96)
 5. Royals (67-95)
 6. Nationals (69-93)
 7. Diamondbacks (for B. Loux)
 8. Indians (69-93)
 9. Cubs (75-87)
10. Padres (for Karsten Whitson)
11. Astros (76-86)
12. Brewers (77-85)
13. Mets (79-83)
14. Marlins (80-82)
15. Brewers (for Dylan Covey)
16. Dodgers (80-82)
17. Angels (80-82)
18. Athletics (81-81)
19. Red Sox (from DET for Martinez)
20. Rockies (83-79)
21. Blue Jays (85-77)
22. Cardinals (86-76)
23. Nationals (from CWS for Dunn)
24. Rays (from BOS for Crawford)
25. Padres (90-72)
26. Red Sox (from TEX for Beltre)
27. Reds (91-71)
28. Braves (91-71)
29. Giants (92-70)
30. Twins (94-68)
31. Rays (from NYY for Soriano)
32. Rays (96-66)
33. Rangers (from PHI for Lee)
Supplemental First Round:
34. Nationals (Dunn)
35. Blue Jays (Downs)
36. Red Sox (Martinez)
37. Rangers (Lee)
38. Rays (Crawford)
39. Phillies (Werth)
40. Red Sox (Beltre)
41. Rays (Soriano)
42. Rays (Balfour)
43. Diamondbacks (LaRoche)
44. Mets (Feliciano)
45. Rockies (Dotel)
46. Blue Jays (Buck)
47. White Sox (Putz)
48. Padres (Garland)
49. Giants (Uribe)
50. Twins (Hudson)
51. Yankees (Vazquez)
52. Rays (Benoit)
53. Blue Jays (Olivo)
54. Padres (Torrealba)
55. Twins (Crain)
56. Rays (Choate)
57. Blue Jays (Gregg)
58. Padres (Correia)
59. Rays (Hawpe)
| Touching Bases | February 24, 2009 |
Batted Ball Location Leaderboards
With apologies to Dave Studeman, whose batted ball leaderboards on The Hardball Times are always must reads, I decided to try a similar data presentation, breaking up batted ball stats by fields of play instead of by type. Using linear weight run values, I developed lists showing who the most productive players were in 2008 when pulling the ball, taking the ball back up the middle, or going to the opposite field.
Value of Pulled Batted Balls
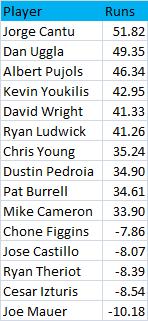
Every one of the top ten players when it came to pulling the ball happened to bat right-handed, which can be explained by their relative advantage when hitting ground balls. Righties who pull grounders force longer throws than lefties who pull grounders. These players are mainly fly ball hitters. In the case of switch-hitters like Chone Figgins, I combined their pulled/center/opposite field stats from each side of the plate, so right-handed balls to left are added to left-handed balls to right to come up with pulled batted balls.
Jorge Cantu and Dan Uggla—who would’ve thunk? Uggla is a former Rule 5 pick and Cantu spent time last year in two different minor league systems before both found their rightful spots on the Marlins. I’d have to attribute their appearance on the leaderboard to coincidence. Dustin Pedroia and Kevin Youkilis, on the other hand, are given a bit of an extra push, as both are clearly aided by the green monster. Pedroia might be the perfectly suited player for Fenway. Just check out his home run chart. He has yet to hit a 400-foot homerun in his career. You have to wonder whether he’d be the MVP outside of that park, as it would certainly be a challenge to find a voter who checks park-adjusted stats.
I don’t think I ever expected to see the universally beloved Joe Mauer on the bottom of any list, but he gets murdered by pulled groundballs. Only three of his nine long balls went to right field in 2008, as he unfortunately never developed the 20 homerun power people were hoping for. Chone Figgins, Ryan Theriot, and Cesar Izturis all had one homerun apiece last year, while Castillo tallied six, so it appears that a minimal amount of power is necessary to be successful pulling the ball.
Value of Center Field Batted Balls
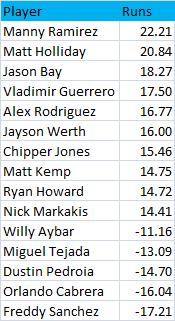
It’s interesting that the top six players on this list bat right-handed. But the bottom four players do too, so that would suggest that the trend of righties is random. It’s tough to choose between the hitters best at pulling the ball and best at going up the middle, but I’m siding with the latter set of players. I’d classify the first set of hitters more as homerun hitters and the second set as line drive types. Pedroia appears at the bottom of this list, likely because in Fenway he doesn’t derive the same benefit from his fly balls to center as he does to the left-field wall. He picked up just three hits on 73 center-field flies.
Value of Opposite Field Batted Balls
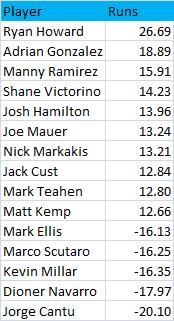
What Mauer lacks in pulled balls he makes up for with his approach going the other way, as he is the only catcher to appear on a leaderboard. Nick Markakis, Matt Kemp, and Manny Ramirez all show up as top center and opposite field hitters. These guys are at times described as "pure" hitters, and there's why. I'd presume each one is quite talented at going with the pitch.
Without trying to sound hyperbolic, I have to ask: is Ryan Howard the greatest opposite-field power-hitter ever? His 2006 and 2008 seasons in which he crushed 25 and 20 opposite-field blasts, respectively, are the only years in the last four in which any player has hit more than even 15 homers to their weak side. Howard does have his opposite-field numbers skewed by his groundball run value, which is likely only positive due to the vacated side of the infield.
Analyzing Howard’s trends piqued my interest in a specific batted ball type and location: pulled groundballs. There were seven players who cost their team 20 runs on pulled grounders: Mark Teahen, Prince Fielder, Adrian Gonzalez, Ryan Howard, Jimmy Rollins, Casey Kotchman, and Carlos Delgado. Several of these players do indeed receive the defensive shift, but I immediately noticed one of these names is not like the other. Jimmy Rollins sticks out like a sore thumb. He’s a switch-hitter, and as such is the only non-lefty to appear on the list. He is far and away the fastest player in the group and an absolutely awesome baserunner, but he apparently wasn’t able to make the most of his speed last year when he put the ball in play, compiling a well below league average 19% hit rate on grounders and legging out a single bunt hit in seven attempts.
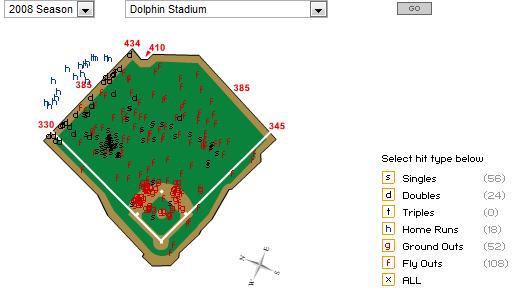
Adrian Gonzalez might actually have power that approaches Howard’s but we’ll never know until he gets out of Petco. At the other end, one thing’s for certain: pitchers need to find ways to prevent Cantu from pulling the ball. Here's what the spray chart for Cantu—perhaps the best pull hitter and worst opposite field hitter in the game—looks like.
Comments
Awesome stuff, Jeremy. And apology accepted.
Posted by: studes at February 24, 2009 4:26 AM
Thanks, Studes.
Posted by: Jeremy at February 24, 2009 12:39 PM
Excellent job here, love seeing interesting things like where Mauer is (not very surprising, either).
I also had the same initial conclusion as you regarding the two pulling Red Sox players...before I even read your analysis, I said "Fenway must be a help, haha". However, upon further review, I think you may have been premature in your conclusion. Let's break it down by player:
Youkilis- When you split his stats, the thing that jumps out at me is his VASTLY better BB/K ratio at home...not exactly the kind of thing Fenway creates. Perhaps he sees the ball better, perhaps he's just more mentally confortable at home, perhaps his hot streaks just coincided with his home stands, but I don't think the wall was everything there.
Pedroia- More home runs on the road puts a dent in the conclusion, right?
Both- I think this is more the results of the fact that both hitters are very much pull hitters, and when they pull they often get hard liners that are tough to turn into outs (one of the reasons Pedroia had that tough start to his career is because EVERYTHING went to a fielder). Not sure if this applies to most hitters, but it struck me that both guys had very, very few pulled fly ball outs, and far more opposite field outs. I think the bottom line is that Pedroia is a pure pull hitter, and that his opposite field balls are more accidents or bad reads/swings, so much of his production comes on the pull...and that while Youkilis will go the opposite field, his fly balls there all lack pop and tend to be easy outs.
Never be too quite to call for "ballpark adjustments". I have also long been against using ballpark adjustments in an individual award arguement, because that assumes that all hitters are affected the same by ballparks, and I disagree with that. For example, I believe that Todd Helton benefitted far more than the average hitter from Coors, and that his adjustments still overestimated his value. On the other hand, Nomar Garciaparra of the 1990s would have his numbers reduced after adjustment by Fenway, but I think the ballpark actually hurt his numbers (many home-run bound smashed liners of his would end up simply denting the monster for a lousy single or double). Not to say that we shouldn't try, but when we're really trying to break down the value of a hitter, I think we owe it to the player to look very closely and avoid lump assumptions, or else make no attempt to adjust at all.
Posted by: Peter at February 24, 2009 2:00 PM
Peter, thanks for the comment.
I agree Youk and Pedroia aren't products of their park, but right-handed fly ball hitters on the Sox can't help but derive an advantage from the green monster.
For reference, players hit about .250 points higher and slug some 1.000 points higher on pulled fly balls than opposite field fly balls. So yeah, Youk and Pedroia fit the norm in terms of their fly ball profiles, though they're obviously better hitters than most.
Parks certainly need to be adjusted differently for individual players and individual components. I believe park factors work better on a team-by-team basis rather than player-by-player basis. Youkilis would hit a whole lot better to center field outside of Fenway. And good catch on Pedroia. I wonder at what other parks he was able to hit the rest of his cheapie homers. I kid.
As for saying that Fenway hurts line drive hitter's production, I strongly believe that's a myth, as the evidence simply doesn't back it up.
This is a great article by Greg Rybarczyk, the man who runs the great hittracker web site: http://www.hardballtimes.com/main/article/home-run-park-factor-a-new-approach/. And here's another good link that shows that Red Sox righties are slightly aided by the wall: http://docs.google.com/Doc?id=dfvdvsgn_26f49mrgk6.
I feel confident in saying that Fenway has aided Youk and Pedroia when they pull the ball in the air.
Posted by: Jeremy at February 24, 2009 2:47 PM
Well, Peter, Fenway is a Questec park. I'd be curious as to what Youkilis's BB/K ratio is in the other Questec parks.
I'm pretty sure I remember Sox TV analyst Jerry Remy commenting, at one point last season during the first game of a homestand, something to the effect that the Sox were glad to be back where they think what's a strike and what's not will be consistent.
Guys like Youkilis build their games around consistent strike zones from umps.
Posted by: James T at February 24, 2009 4:38 PM
Interesting point, James. Most players do play better at home simply because they're at home, but I never considered umpires differing park to park. There probably is something there. All stadiums do have the pitch f/x system in place, so I'd imagine they use the same data for Questec, but I'm not positive. I'd love to know what's behind Youk's change in approach with regards to the strike zone, as since 2005, his swing percentage on pitches out of the zone has risen from 11.5% to 15.1% to 17.4% to 22.3%
Posted by: Jeremy at February 24, 2009 5:01 PM
Wow -- what a great chart. It is one thing to say he pulls the ball.. another to show that he didn't put a single ball out to deep right.
Posted by: Jeff at February 25, 2009 11:32 AM
Good stuff. Makes my through the roof respect for Joe Mauer as a baseball player reach up to the sky.
Posted by: Joe at February 25, 2009 1:46 PM
Thanks Jeff. Cantu didn't even come close. Though that is only his hitting chart at home, Over the course of the year, he had only two opposite field hits on opposite field fly balls.
Joe, Mauer's great. I'm still holding out hope he can hit for some more power. He averaged 400 feet per homer last year, so probably has the raw power to do it, but he hits so many line drives he doesn't get enough loft on most hits. Plus, the baggy in right might hurt his output.
Posted by: Jeremy Greenhouse at February 25, 2009 4:59 PM
I wonder how much park factors play a part in this. Petco for example has a history of heavily supressing homeruns for left handed batters but is slightly advantageous for right handed batters, therefore that might lead to Adrian Gonzalez' opposite field prowess.
vr, Xei
Posted by: Xeifrank at February 27, 2009 12:20 PM
Xei,
I didn't adjust for park factors, and they certainly do play a huge role, as I noted with Pedroia and Youkilis. I didn't know Petco was at all beneficial to balls to left, but the numbers bare that out, so thanks for making note of it. My hunch would be Colorado has the biggest effect on batted balls, except that Holliday is the only Rockie I see on a leaderboard, and that's on balls to center where there's a crater in Coors. Also, I read somewhere that LA was a really hitter-friendly park to Manny.
Posted by: Jeremy Greenhouse at February 27, 2009 3:46 PM
Somewhere? :-)
You read it right here in a guest column by Hit Tracker's Greg Rybarczyk.
http://baseballanalysts.com/archives/2009/02/2009_projection.php
I hope Manny Ramirez re-signs with the Los Angeles Dodgers for 2009, because Dodger Stadium is an absolutely perfect place for him to hit ... Manny’s swing, particularly his phenomenal power to center and right-center field, is ideally suited for the dimensions and environmental conditions of Dodger Stadium. I described the unique layout of Dodger Stadium (deep corners, shallow alleys and center field) in detail in my article, "Hit Tracker 2008," which was published in the 2009 Hardball Times Annual earlier this off-season.
Here is what Greg sees for 2009 should Manny sign with the Dodgers:
.430 OBP, .641 SLG, 1.071 OPS and 36 home runs (including 21 at Dodger Stadium).
Posted by: Rich Lederer at February 27, 2009 4:54 PM
Thanks Rich. That really was a great article. Maybe Manny should just take the one-year deal with the player option and if he puts up those numbers, he'd be right in line for a similar 2 year deal.
And to Peter, Manny's a great example of a right-handed hitter actually hurt by Fenway, due to his propensity to go the other way and to center.
Posted by: Jeremy Greenhouse at February 27, 2009 6:27 PM
Is there a resource for average BABIP per hit type (GB, LD, FB)?
Posted by: Jared at February 27, 2009 8:21 PM
Jared,
Baseball reference has those splits, which are of course from retrosheet. But I use the Bill James Online numbers. Also, go here to get a spreadsheet that Dan Fox compiled for all players from 2003-2007. http://www.baseballprospectus.com/article.php?articleid=6958
Posted by: Jeremy Greenhouse at February 28, 2009 12:07 AM
Hello webmaster
I would like to share with you a link to your site
write me here preonrelt@mail.ru
Posted by: Alexwebmaster at March 4, 2009 6:08 AM